Cover Crop Effectiveness Varies in Cover Crop-Based Rotational Tillage Organic Soybean Systems Depending on Species and Environment


Abstract
:1. Introduction
2. Materials and Methods
2.1. Site Description
2.2. Experimental Design and Crop Management
2.3. Data Collection
2.4. Statistical Analysis
3. Results
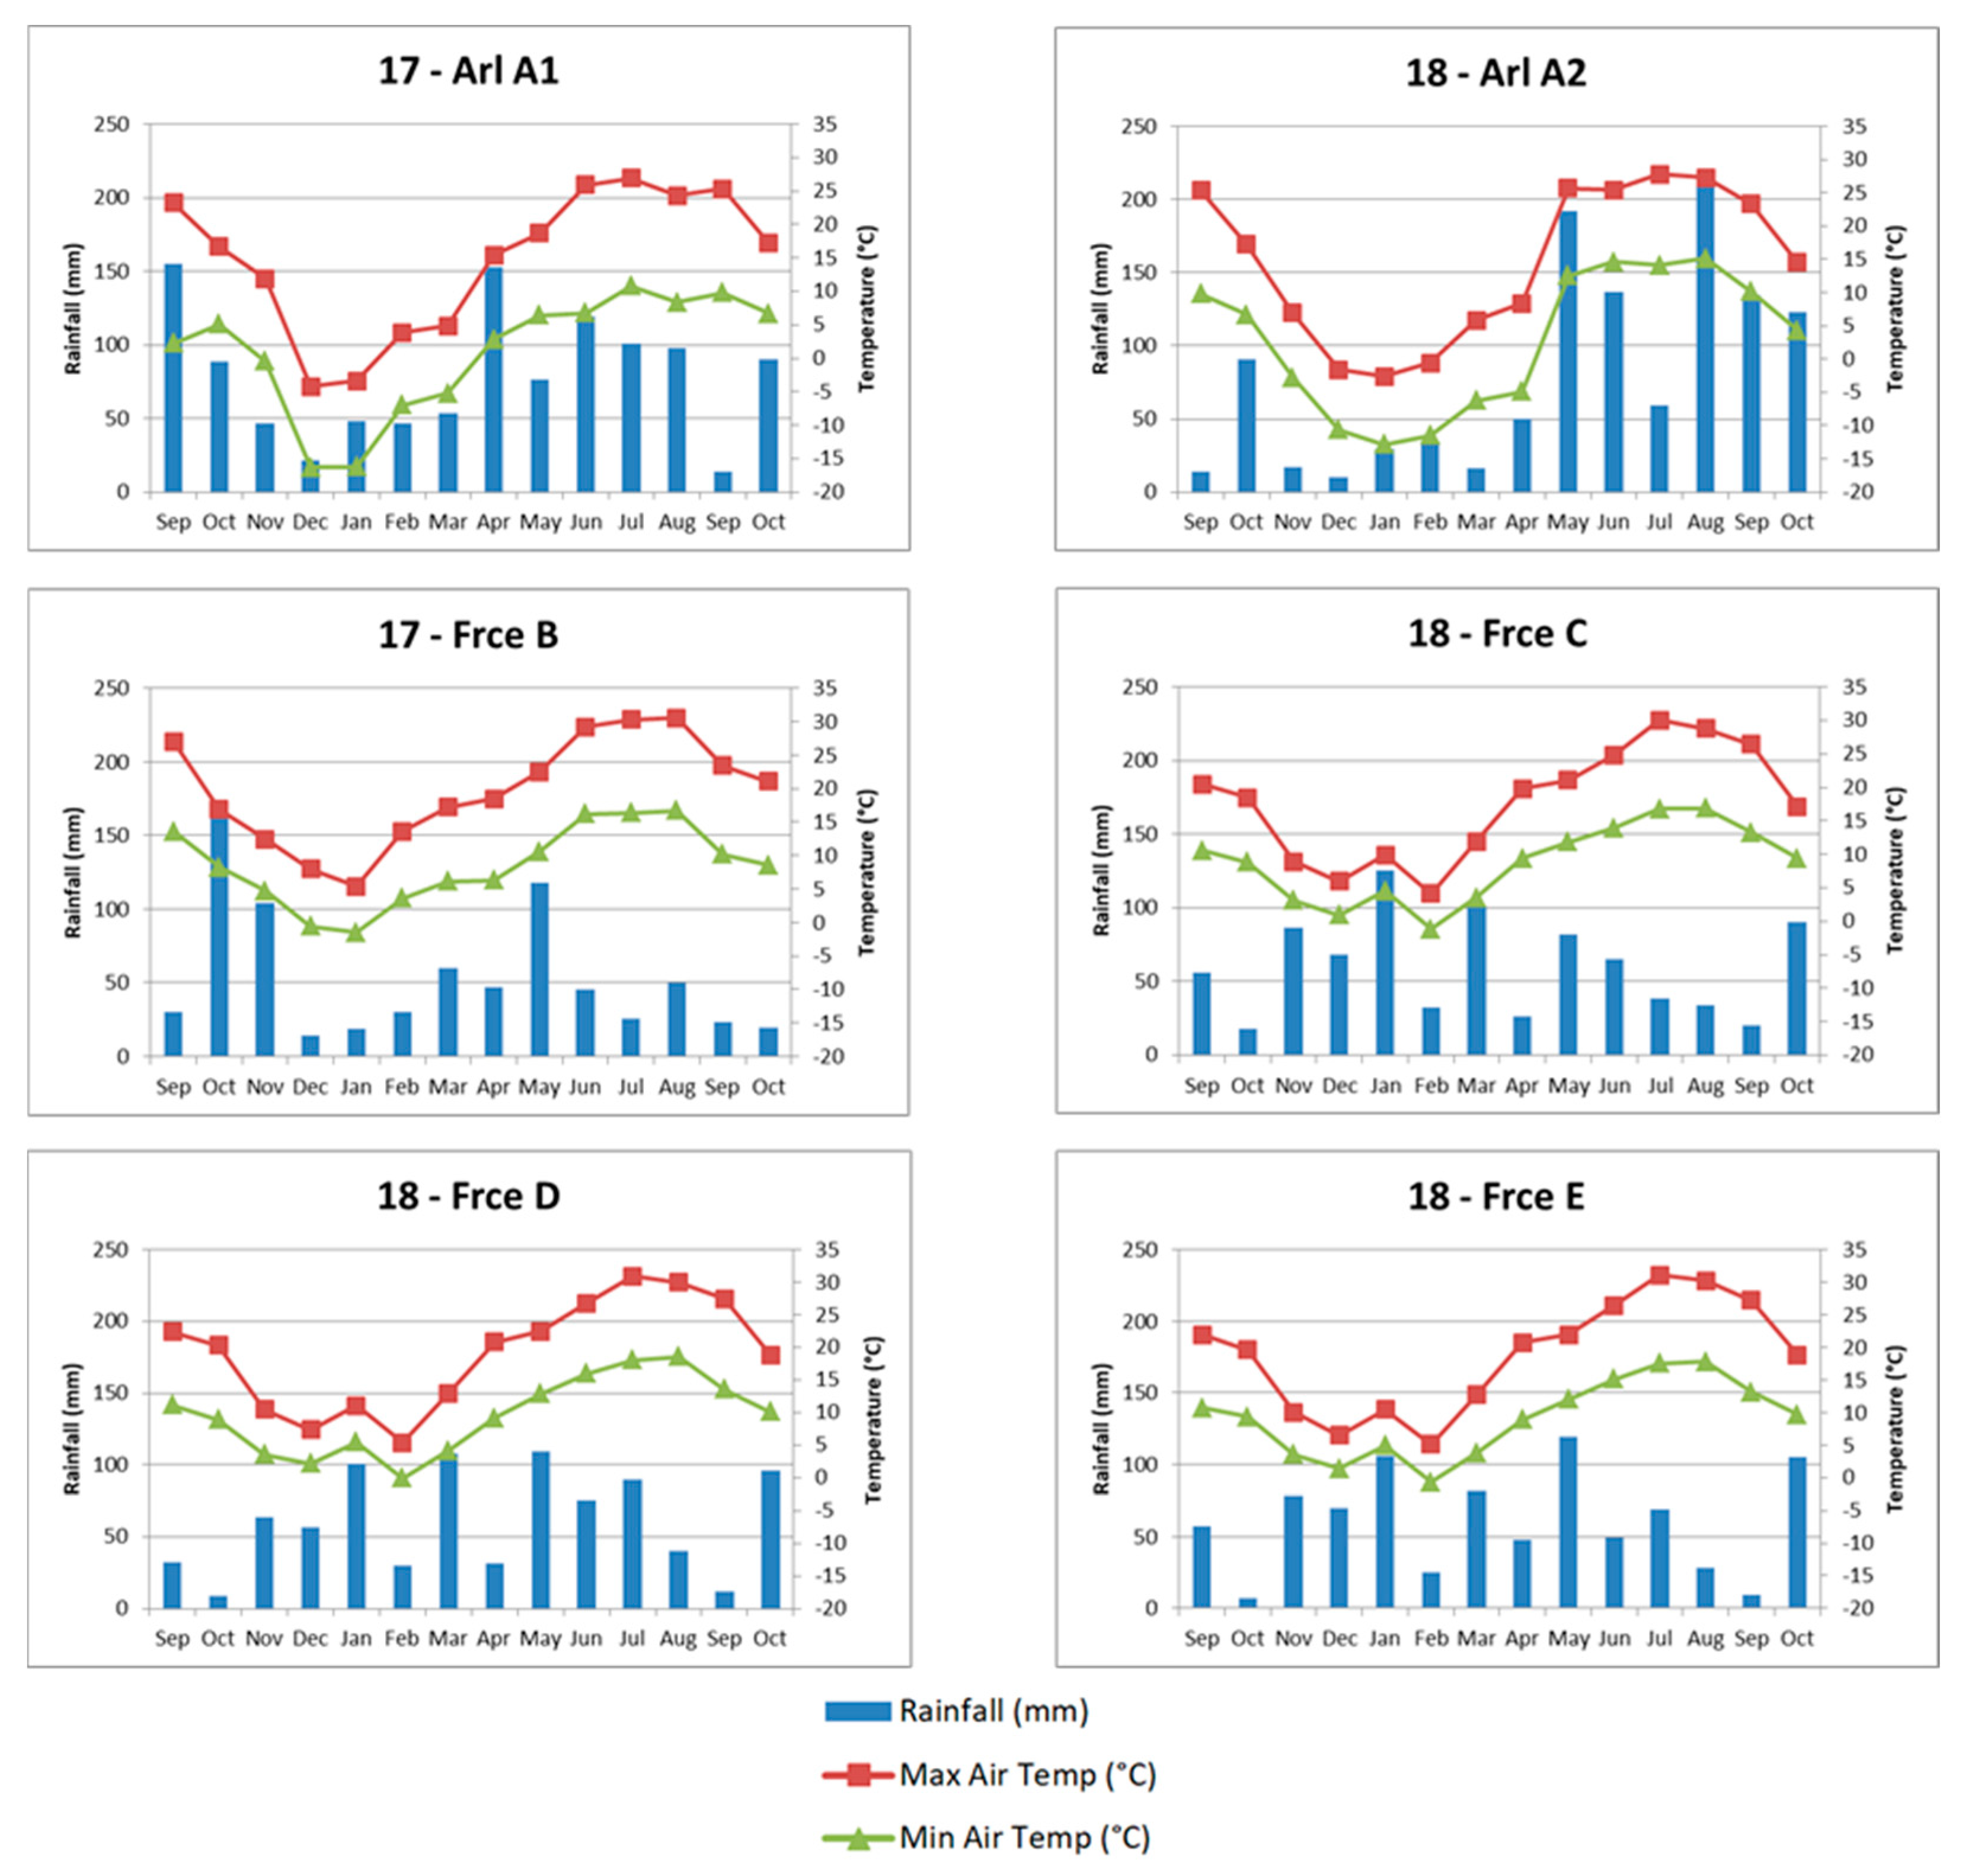
3.1. Climate
3.2. Cover Crop Performance
3.3. Weed Biomass
3.4. Soybean Performance
4. Discussion
4.1. Cover Crop Biomass Production
4.2. Weed Biomass
4.3. Soybean Yield
5. Conclusions
Author Contributions
Funding
Acknowledgments
Conflicts of Interest
References
- Willer, H.; Lernoud, J. The World of Organic Agriculture—Statistics and Emerging Trends; FiBL and IFOAM: Frick, Switzerland, 2019; p. 353. [Google Scholar]
- USDA Economics, Statistics and Market Information System. Available online: https://usda.library.cornell.edu/ (accessed on 27 May 2019).
- U.S. Department of Agriculture, Economic Research Service. Organic Market Overview. Available online: https://www.ars.usda.gov/research/publications/publication/?seqNo115=178152 (accessed on 25 February 2018).
- Agence Bio La Bio dans l’Union Européenne. Available online: https://www.agencebio.org/wp-content/uploads/2018/10/Carnet_UE_2017.pdf (accessed on 27 May 2019).
- Delate, K.; DeWitt, J. Building a farmer-centered land grant university organic agriculture program: A Midwestern partnership. Renew. Agric. Food Syst. 2004, 19, 80–91. [Google Scholar] [CrossRef]
- Riemens, M.M.; Groeneveld, R.M.W.; Lotz, L.A.P.; Kropff, M.J. Effects of three management strategies on the seedbank, emergence and the need for hand weeding in an organic arable cropping system. Weed Res. 2007, 47, 442–451. [Google Scholar] [CrossRef]
- Watson, C.A.; Atkinson, D.; Gosling, P.; Jackson, L.R.; Rayns, F.W. Managing soil fertility in organic farming systems. Soil Use Manag. 2002, 18, 239–247. [Google Scholar] [CrossRef] [Green Version]
- Baker, B.P.; Benbrook, C.M.; Groth, E.; Lutz Benbrook, K. Pesticide residues in conventional, integrated pest management (IPM)-grown and organic foods: Insights from three US data sets. Food Addit. Contam. 2002, 19, 427–446. [Google Scholar] [CrossRef] [PubMed]
- Hole, D.G.; Perkins, A.J.; Wilson, J.D.; Alexander, I.H.; Grice, P.V.; Evans, A.D. Does organic farming benefit biodiversity? Biol. Conserv. 2005, 122, 113–130. [Google Scholar] [CrossRef]
- Anderson, R.L. A Multi-Tactic Approach to Manage Weed Population Dynamics in Crop Rotations. Agron. J. 2005, 97, 1579–1583. [Google Scholar] [CrossRef]
- Bàrberi, P. Weed management in organic agriculture: Are we addressing the right issues? Weed Res. 2002, 42, 177–193. [Google Scholar] [CrossRef]
- Maeder, P.; Fliessbach, A.; Dubois, D.; Gunst, L.; Fried, P.; Niggli, U. Soil Fertility and Biodiversity in Organic Farming. Science 2002, 296, 1694–1697. [Google Scholar] [CrossRef] [PubMed] [Green Version]
- FAO Economie de l’agriculture de Conservation. Available online: http://www.fao.org/docrep/005/y2781f/y2781f03.htm (accessed on 8 March 2015).
- Holland, J.M. The environmental consequences of adopting conservation tillage in Europe: Reviewing the evidence. Agric. Ecosyst. Environ. 2004, 103, 1–25. [Google Scholar] [CrossRef]
- Berner, A.; Hildermann, I.; Fließbach, A.; Pfiffner, L.; Niggli, U.; Mäder, P. Crop yield and soil fertility response to reduced tillage under organic management. Soil Tillage Res. 2008, 101, 89–96. [Google Scholar] [CrossRef]
- Moyer, J. Organic No-Till Farming. Advancing No-Till Agriculture. Crops, Soil, Equipment; Acres U.S.A.: Austin, TX, USA, 2011; ISBN 978−1-60173-017-6. [Google Scholar]
- Mirsky, S.B.; Ryan, M.R.; Curran, W.S.; Teasdale, J.R.; Maul, J.; Spargo, J.T.; Moyer, J.; Grantham, A.M.; Weber, D.; Way, T.R.; et al. Conservation tillage issues: Cover crop-based organic rotational no-till grain production in the mid-Atlantic region, USA. Renew. Agric. Food Syst. 2012, 27, 31–40. [Google Scholar] [CrossRef] [Green Version]
- Delate, K.; Cwach, D.; Fiscus, M. Evaluation of an Organic No-Till System for Organic Corn and Soybean Production–Agronomy Farm Trial, 2011. In Organic Ag Program Webpage; Iowa State University: Ames, IA, USA, 2012. [Google Scholar]
- Silva, E.; Delate, K. A Decade of Progress in Organic Cover Crop-Based Reduced Tillage Practices in the Upper Midwestern USA. Agriculture 2017, 7, 44. [Google Scholar] [CrossRef]
- Teasdale, J.R.; Coffman, C.B.; Mangum, R.W. Potential long-term benefits of no-tillage and organic cropping systems for grain production and soil improvement. Agron. J. 2007, 99, 1297–1305. [Google Scholar] [CrossRef]
- Wallace, J.; Williams, A.; Liebert, J.; Ackroyd, V.; Vann, R.; Curran, W.; Keene, C.; VanGessel, M.; Ryan, M.; Mirsky, S. Cover Crop-Based, Organic Rotational No-Till Corn and Soybean Production Systems in the Mid-Atlantic United States. Agriculture 2017, 7, 34. [Google Scholar] [CrossRef]
- Blanchart, E.; Bernoux, M.; Sarda, X.; Siqueira Neto, M.; Cerri, C.C.; Piccolo, M.; Douzet, J.-M.; Scopel, E.; Feller, C. Effect of direct seeding mulch-based systems on soil carbon storage and macrofauna in Central Brazil. Agric. Conspec. Sci. ACS 2007, 72, 81–87. [Google Scholar]
- Wayman, S.; Cogger, C.; Benedict, C.; Burke, I.; Collins, D.; Bary, A. The influence of cover crop variety, termination timing and termination method on mulch, weed cover and soil nitrate in reduced-tillage organic systems. Renew. Agric. Food Syst. 2015, 30, 450–460. [Google Scholar] [CrossRef]
- Kunz, C.; Sturm, D.J.; Varnholt, D.; Walker, F.; Gerhards, R. Allelopathic effects and weed suppressive ability of cover crops. Plant Soil Environ. 2016, 62, 60–66. [Google Scholar] [Green Version]
- Dhima, K.V.; Vasilakoglou, I.B.; Eleftherohorinos, I.G.; Lithourgidis, A.S. Allelopathic Potential of Winter Cereals and Their Cover Crop Mulch Effect on Grass Weed Suppression and Corn Development. Crop Sci. 2006, 46, 345–352. [Google Scholar] [CrossRef]
- Jabran, K.; Mahajan, G.; Sardana, V.; Chauhan, B.S. Allelopathy for weed control in agricultural systems. Crop Prot. 2015, 72, 57–65. [Google Scholar] [CrossRef]
- Mäder, P.; Berner, A. Development of reduced tillage systems in organic farming in Europe. Renew. Agric. Food Syst. 2012, 27, 7–11. [Google Scholar] [CrossRef]
- Vincent-Caboud, L.; Peigné, J.; Casagrande, M.; Silva, E.M. Overview of Organic Cover Crop-Based No-Tillage Technique in Europe: Farmers’ Practices and Research Challenges. Agriculture 2017, 7, 42. [Google Scholar] [CrossRef]
- Zikeli, S.; Gruber, S. Reduced Tillage and No-Till in Organic Farming Systems, Germany—Status Quo, Potentials and Challenges. Agriculture 2017, 7, 35. [Google Scholar] [CrossRef]
- Lee, J.A.; Gill, T.E. Multiple causes of wind erosion in the Dust Bowl. Aeolian Res. 2015, 19, 15–36. [Google Scholar] [CrossRef]
- Friedrich, T.; Kassam, A.; Corsi, S.; Jat, R.A.; Sahrawat, K.L.; Kassam, A.H. Conservation agriculture in Europe. In Conservation Agriculture: Global Prospects and Challenges; CABI: Oxfordshire, UK; Boston, MA, USA, 2014; pp. 127–170. [Google Scholar]
- Casagrande, M.; Peigné, J.; Payet, V.; Mäder, P.; Sans, F.X.; Blanco-Moreno, J.M.; Antichi, D.; Bàrberi, P.; Beeckman, A.; Bigongiali, F.; et al. Organic farmers’ motivations and challenges for adopting conservation agriculture in Europe. Org. Agric. 2015, 6, 281–295. [Google Scholar] [CrossRef]
- Mirsky, S.B.; Ryan, M.R.; Teasdale, J.R.; Curran, W.S.; Reberg-Horton, C.S.; Spargo, J.T.; Wells, M.S.; Keene, C.L.; Moyer, J.W. Overcoming Weed Management Challenges in Cover Crop–Based Organic Rotational No-Till Soybean Production in the Eastern United States. Weed Technol. 2013, 27, 193–203. [Google Scholar] [CrossRef]
- Kornecki, T.S.; Price, A.J. Effects of different roller/crimper designs and rolling speed on rye cover crop termination and seed cotton yield in a no-till system. J. Cotton Sci. 2010, 14, 212–220. [Google Scholar]
- Reberg-Horton, S.C.; Grossman, J.M.; Kornecki, T.S.; Meijer, A.D.; Price, A.J.; Place, G.T.; Webster, T.M. Utilizing cover crop mulches to reduce tillage in organic systems in the southeastern USA. Renew. Agric. Food Syst. 2012, 27, 41–48. [Google Scholar] [CrossRef]
- Keene, C.L.; Curran, W.S.; Wallace, J.M.; Ryan, M.R.; Mirsky, S.B.; VanGessel, M.J.; Barbercheck, M.E. Cover Crop Termination Timing is Critical in Organic Rotational No-Till Systems. Agron. J. 2017, 109, 272–282. [Google Scholar] [CrossRef]
- Smith, A.N.; Reberg-Horton, S.C.; Place, G.T.; Meijer, A.D.; Arellano, C.; Mueller, J.P. Rolled Rye Mulch for Weed Suppression in Organic No-Tillage Soybeans. Weed Sci. 2011, 59, 224–231. [Google Scholar] [CrossRef]
- Clark, K.M.; Boardman, D.L.; Staples, J.S.; Easterby, S.; Reinbott, T.M.; Kremer, R.J.; Kitchen, N.R.; Veum, K.S. Crop Yield and Soil Organic Carbon in Conventional and No-till Organic Systems on a Claypan Soil. Agron. J. 2017, 109, 588–599. [Google Scholar] [CrossRef]
- Liebert, J.A.; DiTommaso, A.; Ryan, M.R. Rolled Mixtures of Barley and Cereal Rye for Weed Suppression in Cover Crop–based Organic No-Till Planted Soybean. Weed Sci. 2017, 65, 426–439. [Google Scholar] [CrossRef]
- Wells, M.S.; Brinton, C.M.; Reberg-Horton, S.C. Weed suppression and soybean yield in a no-till cover-crop mulched system as influenced by six rye cultivars. Renew. Agric. Food Syst. 2015, 31, 429–440. [Google Scholar] [CrossRef] [Green Version]
- Tabaglio, V.; Gavazzi, C.; Schulz, M.; Marocco, A. Alternative weed control using the allelopathic effect of natural benzoxazinoids from rye mulch. Agron. Sustain. Dev. 2008, 28, 397–401. [Google Scholar] [CrossRef]
- Schulz, M.; Marocco, A.; Tabaglio, V.; Macias, F.A.; Molinillo, J.M.G. Benzoxazinoids in Rye Allelopathy—From Discovery to Application in Sustainable Weed Control and Organic Farming. J. Chem. Ecol. 2013, 39, 154–174. [Google Scholar] [CrossRef]
- Bernstein, E.R.; Posner, J.L.; Stoltenberg, D.E.; Hedtcke, J.L. Organically Managed No-Tillage Rye–Soybean Systems: Agronomic, Economic, and Environmental Assessment. Agron. J. 2011, 103, 1169. [Google Scholar] [CrossRef]
- De Bruin, J.L.; Porter, P.M.; Jordan, N.R. Use of a Rye Cover Crop following Corn in Rotation with Soybean in the Upper Midwest. Agron. J. 2005, 97, 587–598. [Google Scholar] [CrossRef]
- Silva, E.M. Screening Five Fall-Sown Cover Crops for Use in Organic No-Till Crop Production in the Upper Midwest. Agroecol. Sustain. Food Syst. 2014, 38, 748–763. [Google Scholar] [CrossRef]
- Peigné, J.; Lefevre, V.; Vian, J.F.; Fleury, P. Conservation Agriculture in Organic Farming: Experiences, Challenges and Opportunities in Europe; Springer International Publishing: Cham, Switzerland, 2015; ISBN 978-3-319−11619-8. [Google Scholar]
- Bates, D.; Mächler, M.; Bolker, B.; Walker, S. Fitting Linear Mixed-Effects Models using lme4. arXiv 2014, arXiv:1406.5823. [Google Scholar]
- Ashford, D.L.; Reeves, D.W. Use of a mechanical roller-crimper as an alternative kill method for cover crops. Am. J. Altern. Agric. 2003, 18, 37–45. [Google Scholar] [CrossRef]
- Crowley, K.A.; Van Es, H.M.; Gómez, M.I.; Ryan, M.R. Trade-Offs in Cereal Rye Management Strategies Prior to Organically Managed Soybean. Agron. J. 2018, 110, 1492–1504. [Google Scholar] [CrossRef]
- Mischler, R.A.; Curran, W.S.; Duiker, S.W.; Hyde, J.A. Use of a Rolled-rye Cover Crop for Weed Suppression in No-Till Soybeans. Weed Technol. 2010, 24, 253–261. [Google Scholar] [CrossRef]
- Mirsky, S.B.; Curran, W.S.; Mortenseny, D.M.; Ryan, M.R.; Shumway, D.L. Timing of Cover-Crop Management Effects on Weed Suppression in No-Till Planted Soybean using a Roller-Crimper. Weed Sci. 2011, 59, 380–389. [Google Scholar] [CrossRef]
- Neu, K.; Nair, A. Effect of Planting Date and Cultivar on Cereal Rye Development and Termination for Organic No-Till Production Systems; Iowa State University, Digital Repository: Ames, IA, USA, 2017. [Google Scholar]
- Halde, C.; Gagné, S.; Charles, A.; Lawley, Y. Organic No-Till Systems in Eastern Canada: A Review. Agriculture 2017, 7, 36. [Google Scholar] [CrossRef]
- La France, D.; Comeau, A.; Duval, J. Développement d’un Seigle Adapté au rôle de Couvre-sol Pour le Semis Direct Sans Herbicide; Final Report; CETAB+: Quebec City, QC, Canada, 2016; p. 36. [Google Scholar]
- Liebert, J.A.; Ryan, M.R. High planting rates improve weed suppression, yield, and profitability in organically-managed no-till planted soybean. Weed Technol. 2017, 31, 536–549. [Google Scholar] [CrossRef]
- Ryan, M.R.; Curran, W.S.; Grantham, A.M.; Hunsberger, L.K.; Mirsky, S.B.; Mortensen, D.A.; Nord, E.A.; Wilson, D.O. Effects of Seeding Rate and Poultry Litter on Weed Suppression from a Rolled Cereal Rye Cover Crop. Weed Sci. 2011, 59, 438–444. [Google Scholar] [CrossRef]
- Carr, P.; Gramig, G.; Liebig, M. Impacts of Organic Zero Tillage Systems on Crops, Weeds, and Soil Quality. Sustainability 2013, 5, 3172–3201. [Google Scholar] [CrossRef] [Green Version]
- Bernstein, E.R.; Stoltenberg, D.E.; Posner, J.L.; Hedtcke, J.L. Weed Community Dynamics and Suppression in Tilled and No-Tillage Transitional Organic Winter Rye–Soybean Systems. Weed Sci. 2014, 62, 125–137. [Google Scholar] [CrossRef]
- Parr, M.; Grossman, J.M.; Reberg-Horton, S.C.; Brinton, C.; Crozier, C. Nitrogen Delivery from Legume Cover Crops in No-Till Organic Corn Production. Agron. J. 2011, 103, 1578. [Google Scholar] [CrossRef]
- Moore, M.J.; Gillespie, T.J.; Swanton, C.J. Effect of Cover Crop Mulches on Weed Emergence, Weed Biomass, and Soybean (Glycine max) Development. Weed Technol. 1994, 8, 512–518. [Google Scholar] [CrossRef]
- Weston, L.A. Utilization of Allelopathy for Weed Management in Agroecosystems. Agron. J. 1996, 88, 860–866. [Google Scholar] [CrossRef]
- Reberg-Horton, S.C.; Burton, J.D.; Danehower, D.A.; Ma, G.; Monks, D.W.; Murphy, J.P.; Ranells, N.N.; Williamson, J.D.; Creamer, N.G. changes over time in the allelochemical content of ten cultivars of rye (Secale cereale L.). J. Chem. Ecol. 2005, 31, 179–193. [Google Scholar] [CrossRef] [PubMed]
- Altieri, M.A.; Lana, M.A.; Bittencourt, H.V.; Kieling, A.S.; Comin, J.J.; Lovato, P.E. Enhancing Crop Productivity via Weed Suppression in Organic No-Till Cropping Systems in Santa Catarina, Brazil. J. Sustain. Agric. 2011, 35, 855–869. [Google Scholar] [CrossRef]
- Teasdale, J.R.; Mohler, C.L. The quantitative relationship between weed emergence and the physical properties of mulches. Weed Sci. 2000, 48, 385–393. [Google Scholar] [CrossRef]
- Halde, C.; Entz, M.H. Plant species and mulch application rate affected decomposition of cover crop mulches used in organic rotational no-till systems. Can. J. Plant Sci. 2016, 96, 59–71. [Google Scholar] [CrossRef] [Green Version]
- Weber, J.; Kunz, C.; Peteinatos, G.; Zikeli, S.; Gerhards, R. Weed Control Using Conventional Tillage, Reduced Tillage, No-Tillage, and Cover Crops in Organic Soybean. Agriculture 2017, 7, 43. [Google Scholar] [CrossRef]


| Site | Year | Previous Crop | Soil Type | Organic Matter (%) | pH | Climate (Location) | Irrigation System (Yes/No) |
|---|---|---|---|---|---|---|---|
| 17-Arl. A1 18-Arl. A2 | 2017 2018 | Alfalfa Corn | Plano silt loam | 3.7 | 7.3 | Humid continental climate, 889 mm, 9.45 °C (UWAARS, 43°18’N, 89°21" E, 315 masl) | No |
| 17-Frce B | 2017 | Winter wheat | Loamy sand | 2.6 | 7.8 | Mediterranean climate, 835 mm, 12.1 °C (45°00’40.2"N 4°59’07.1"E) | Yes |
| 18-Frce C | 2018 | Winter wheat | Fine loam clay | 4.9 | 8.4 | Oceanic and temperate climate, 877 mm, 11.3 °C (45°40’51.3"N 5°32’13.9"E) | No |
| 18-Frce D | 2018 | Alfalfa | Loamy sand | 2.7 | 8.5 | Semi-continental climate with Mediterranean influence, 785 mm, 11.5 °C (45°49’10.9"N 5°02’05.6"E) | yes |
| 18-Frce E | 2018 | Winter wheat | Fine loam | 1.6 | 7.5 | Warm temperate climate, 797 mm, 11.5 °C (45°35’09.9"N 4°55’29.3"E) | No |
| Sites | Primary Tillage | CC 1 Planting | CC Seeding Rate (kg ha−1) | CC Row Spacing (cm) | CC Rolling & Soybean Planting | Number of CC Growth Days | Soybean Seeding Rate (Seed ha−1) | Soybean Cultivar | Soybean Row Spacing (cm) |
|---|---|---|---|---|---|---|---|---|---|
| 17-Arl. A1 | 16 August, 22 August, 2 September, 19 September, 2016 | 19 September (triticale), 26 September (rye) 2, 2016 | 201.75 | 19 | 26 May and 30 May (Rye)/8 June (Triticale), 2017 | 273 (rye)/62 (triticale) | 555,986 | Viking 0.1706 | 76.2 |
| 18-Arl. A2 | 29 September, 2 October, 2017 | 2 October, 2017 | 201.75 | 19 | 6 June (rye)/ 11 June (triticale), 2018 | 247 (rye)/252 (triticale) | 555,986 | Viking 0.1706 | 76.2 |
| 17-Frce B | 9 July, 15 August, 15 September, 2016 | 23 September, 2016 | 200 | 16.5 | 16 May, 2017 | 235 | 605,000 | ES Mentor | 50 |
| 18-Frce C | 15 July, 8 August, 21 August, 2017 | 22 August, 2017 | 200 | 12.5 | 29 May, 2018 | 280 | 535,000 | Klaxon | 50 |
| 18-Frce D | 25 July, 10 August, 21 August, 24 August, 2017 | 25 August, 2017 | 200 | 12.5 | 18 May, 2018 | 266 | 600,000 | ES Mentor | 50 |
| 18-Frce E | 18 July, 14 August, 25 August, 2017 | 29 August, 2017 | 200 | 16.5 | 25 May, 2018 | 269 | 535,000 | ES Mentor | 33 |
| Sites | Weed Biomass (kg ha−1) Date 1 1 | Weed Biomass (kg ha−1) Date 2 2 | Weed Biomass Change (kg ha−1) Date 2–Date 1 | |||
|---|---|---|---|---|---|---|
| Cereal Rye | Triticale | Cereal Rye | Triticale | Cereal Rye | Triticale | |
| 17-Arl. A1 | 83 | 148 | 287 | 274 | 204 | 127 |
| 18-Arl. A2 | 123 | 1214 | 55 | 869 | −68 | −345 |
| 17-Frce B | 402 | 1119 | 319 | 857 | −83 | −262 |
| 18-Frce C | 327 | 177 | 1245 | 1270 | 919 | 1093 |
| 18-Frce D | 317 | 639 | 3479 | 4445 | 3163 | 3806 |
| 18-Frce E | 134 | 163 | 1683 | 1554 | 1549 | 1391 |
| Mean 3 | 231 a | 577 b | 1178 a | 1545 b | 947 a | 968 a |
| p-value β | <0.001 | <0.001 | 0.09 | |||
| Significative Effect | *** | *** | . | |||
| Sites | Soybean Yield (t ha−1) | Soybean Yield Losses on Triticale Cover Crop (t ha−1) | |
|---|---|---|---|
| Cereal Rye | Triticale | Cereal Rye-Triticale | |
| 17-Arl. A1 | 2.7 a | 0.2 b | 2.5 |
| 18-Arl. A2 | 3.5 a | 2.2 b | 1.3 |
| 17-Frce B | 2.8 a | 2.2 b | 0.6 |
| 18-Frce C | 2.7 a | 2.6 a | 0.1 |
| 18-Frce D | 1.8 a | 1.1 a | 0.7 |
| 18-Frce E | 2.6 a | 2.3 b | 0.3 |
| Mean 1 | 2.7 a | 2.2 b | 0.5 |
| p-value (mean data) β | <0.001 | - | |
| Significative Effect | *** | - | |
© 2019 by the authors. Licensee MDPI, Basel, Switzerland. This article is an open access article distributed under the terms and conditions of the Creative Commons Attribution (CC BY) license (http://creativecommons.org/licenses/by/4.0/).
Share and Cite
Vincent-Caboud, L.; Vereecke, L.; Silva, E.; Peigné, J. Cover Crop Effectiveness Varies in Cover Crop-Based Rotational Tillage Organic Soybean Systems Depending on Species and Environment. Agronomy 2019, 9, 319. https://doi.org/10.3390/agronomy9060319
Vincent-Caboud L, Vereecke L, Silva E, Peigné J. Cover Crop Effectiveness Varies in Cover Crop-Based Rotational Tillage Organic Soybean Systems Depending on Species and Environment. Agronomy. 2019; 9(6):319. https://doi.org/10.3390/agronomy9060319
Chicago/Turabian StyleVincent-Caboud, Laura, Léa Vereecke, Erin Silva, and Joséphine Peigné. 2019. "Cover Crop Effectiveness Varies in Cover Crop-Based Rotational Tillage Organic Soybean Systems Depending on Species and Environment" Agronomy 9, no. 6: 319. https://doi.org/10.3390/agronomy9060319