Article

Metabolite-Targeted Analysis and Physiological Traits of Zea mays L. in Response to Application of a Leonardite-Humate and Lignosulfonate-Based Products for Their Evaluation as Potential Biostimulants

1
Department of Agronomy, Food, Natural resources, Animals and Environment (DAFNAE), University of Padua, 35100 Padua, Italy
2
Department of Agricultural and Food Sciences, Alma Mater Studiorum-University of Bologna, Viale Fanin 40, 40127 Bologna, Italy
3
Department of Biomedical and Neuromotor Sciences, Alma Mater Studiorum-University of Bologna, Via Belmeloro 8/2, 40126 Bologna, Italy
*
Author to whom correspondence should be addressed.
Agronomy 2019, 9(8), 445; https://doi.org/10.3390/agronomy9080445
Submission received: 24 June 2019 / Revised: 31 July 2019 / Accepted: 9 August 2019 / Published: 12 August 2019

Abstract

:
The main aim of this study is to identify and investigate specific humates (Hs) as potential biostimulants. Five specialty lignosulfonates (LS1-5), one commercial leonardite-humate (PH), and one commercial lignosulfonate (LH), were analyzed for their carbon, nitrogen, and sulfur contents, and the distribution of functional groups using Fourier transform infrared (FTIR) and Raman spectroscopies. Hs were further supplied for two days to Zea mays L. in hydroponics to test their capacity to trigger changes in physiological target-responses. LS1, LS2, LS3, and LS5 determined the most pronounced effects on plant growth and accumulation of proteins and phenolics, perhaps because of their chemical and spectroscopic features. Root growth was more increased (+51–140%) than leaf growth (+5–35%). This effect was ascribed to higher stimulation of N metabolism in roots according to the increased activity of N-assimilation enzymes (GS and GOGAT) and high consumption of sugars for energy-dependent processes. Increased values of RuBisCO, SPAD (Soil Plant Analysis Development values), and leaf sugar accumulation refer to enhanced photosynthesis attributed to Hs. We conclude that Hs tested in this study functioned as biostimulants, but the specialty lignosulfonates were more efficient in this role, possibly because of the type of starting material and process used for their production, which may have influenced their chemical properties.

1. Introduction

Increasing food production for a developing world population and the protection of environmental resources represents a great challenge in the field of agricultural sciences. Traditional agronomical practices especially have negatively impacted a number of environmental aspects and have been in part responsible for soil and water pollution [1]. In addition, the quality of most agricultural soils has long been injured by the thorough application of mineral fertilizers in order to achieve high crop yield requirements [2].
The decline of soil chemical and physical properties is generally accompanied by the decrease of soil fertility, a reduced content of soil organic carbon, and the impoverishment of microbial communities’ biodiversity [3]. Therefore, new advances in support of environmentally friendly crop productions are required. Among them, one potential strategy could be the application of biostimulant products during crop cultivation [4]. Biostimulants are “formulated products of biological origin, either with or without plant growth promoting microorganisms (PGPMs), able to stimulate plant productivity at very low dosages by virtue of synergic effects of the different bioactive constituents” [5]. Biostimulants promote plant nutrition and tolerance to environmental stresses [6,7] and, based on their origin and the starting source for their manufacturing, they are divided in different groups, as follows: Humic substances (HS), seaweed extracts, protein hydrolysates, and microbial inoculants, such as mycorrhizal fungi and rhizobacteria, and beneficial elements [8]
Humic substances or humates are regarded as a major category of biostimulants, with a big market share [9]. They represent the most stable and recalcitrant component of soil organic matter and derive from the chemical and microbial degradation of vegetal and animal residues [10,11]. They are useful for improving the quality of soils, as well as the plant metabolism and root morphological traits, via their interaction with a plurality of biochemical mechanisms and physiological processes occurring at the plant-soil interface [10,11]. Specifically, humic substances stimulate plant growth via hormone-like effects and increased photosynthesis efficiency, enhance the respiration rate, and improve root nutrient uptake through an effect, either direct or indirect, on the expression of genes encoding H+-ATPase isoforms and membrane transporters [7,10,11,12].
Over the last decades, commercial humic products designed lignohumates have found various applications in environmental technologies and agriculture [13,14] and are commonly used for several industrial purposes [14]. They share similar properties with humic substances in terms of chelation, buffering, and cation exchange capacity because of the great number of carboxylic and phenol groups bonded to the aromatic ring [10,15]. Lignohumates are water soluble anionic polymers containing high and low molecular weight molecules, as well as a large number of charged groups, and are by-products generated from the sulphite process of wood, in which fibers of cellulose are separated from lignin by the action of bisulphite [16,17]. The lignin fraction in wood is sulfonated, degraded and solubilized in water during this procedure [18]. In this way, the production of humates from materials that do not primarily contain them becomes a very fast process, which otherwise would naturally take many years. Researches have only clarified the primary structure of these polymers in part, so far, and only a few studies have investigated their effects on plant growth and metabolism [19,20,21].
The production of humates derived from different salts of humic acids, such as ammonium humates and potassium (K) humates is increasingly growing. Potassium humates, in particular, are used as biostimulants to ameliorate soil chemical, physical, and biological properties, such as the content of organic matter, water retention capacity, structure, deactivation of toxic metals, and microbiome. In addition, they can increase the efficiency of inorganic fertilizers by prompting plant growth, yield and quality, enhancing nutrient uptake and assimilation, and promoting plant resistance to stress conditions [22,23,24,25,26,27].
Interestingly, the chemistry and physiological functioning of humates can vary depending on the starting material (e.g., leonardite, wood) from which they originate, extraction processes (KOH extraction for leonardite, wood bisulphite extraction for lignosulfonates) and modification technologies used to obtain the products. Indeed, humates derived from the same source and obtained by the same company can widely differ in composition [28]. On this account and in view of the plant diversity from which humates can be produced, it appears relevant to characterize the marketed products to test their effectivity in agriculture as biostimulants.
In light of such considerations, seven humates were investigated in this study to evaluate their biostimulant potential. The humates included a commercial lignosulfonate-based product (LH, LignoHumate®, produced using a patented oxidation process) consisting of a highly concentrated plant and soil amendment, a commercial humate extracted from leonardite (PH), produced and marketed by Borregaard. The remaining humates (LS1, LS2, LS3, LS4, LS5) were specialty lignosulfonates developed by Borregaard and applying proprietary technology (different from the one used to obtain LH) to modify the starting material. We first assayed differences in their content of main elements (C, N, and S), and in the occurrence and distribution of principal functional groups using two complementary spectroscopic techniques (FT-IR and FT-Raman). Then, we applied these products to Zea mays L. plants in order to evaluate differences in their capacity to trigger positive changes in physiological and biochemical traits associated with plant productivity. We chose to test the products on Zea mays L. because it is a relevant staple crop for many populations worldwide. One of the novelties of the study is that most of products tested in this study were specialty lignosulfonates developed by Borregaard’s company using proprietary technology and, thus, they were supposed to be very different in chemical features from standard lignosulfonates.

2. Results

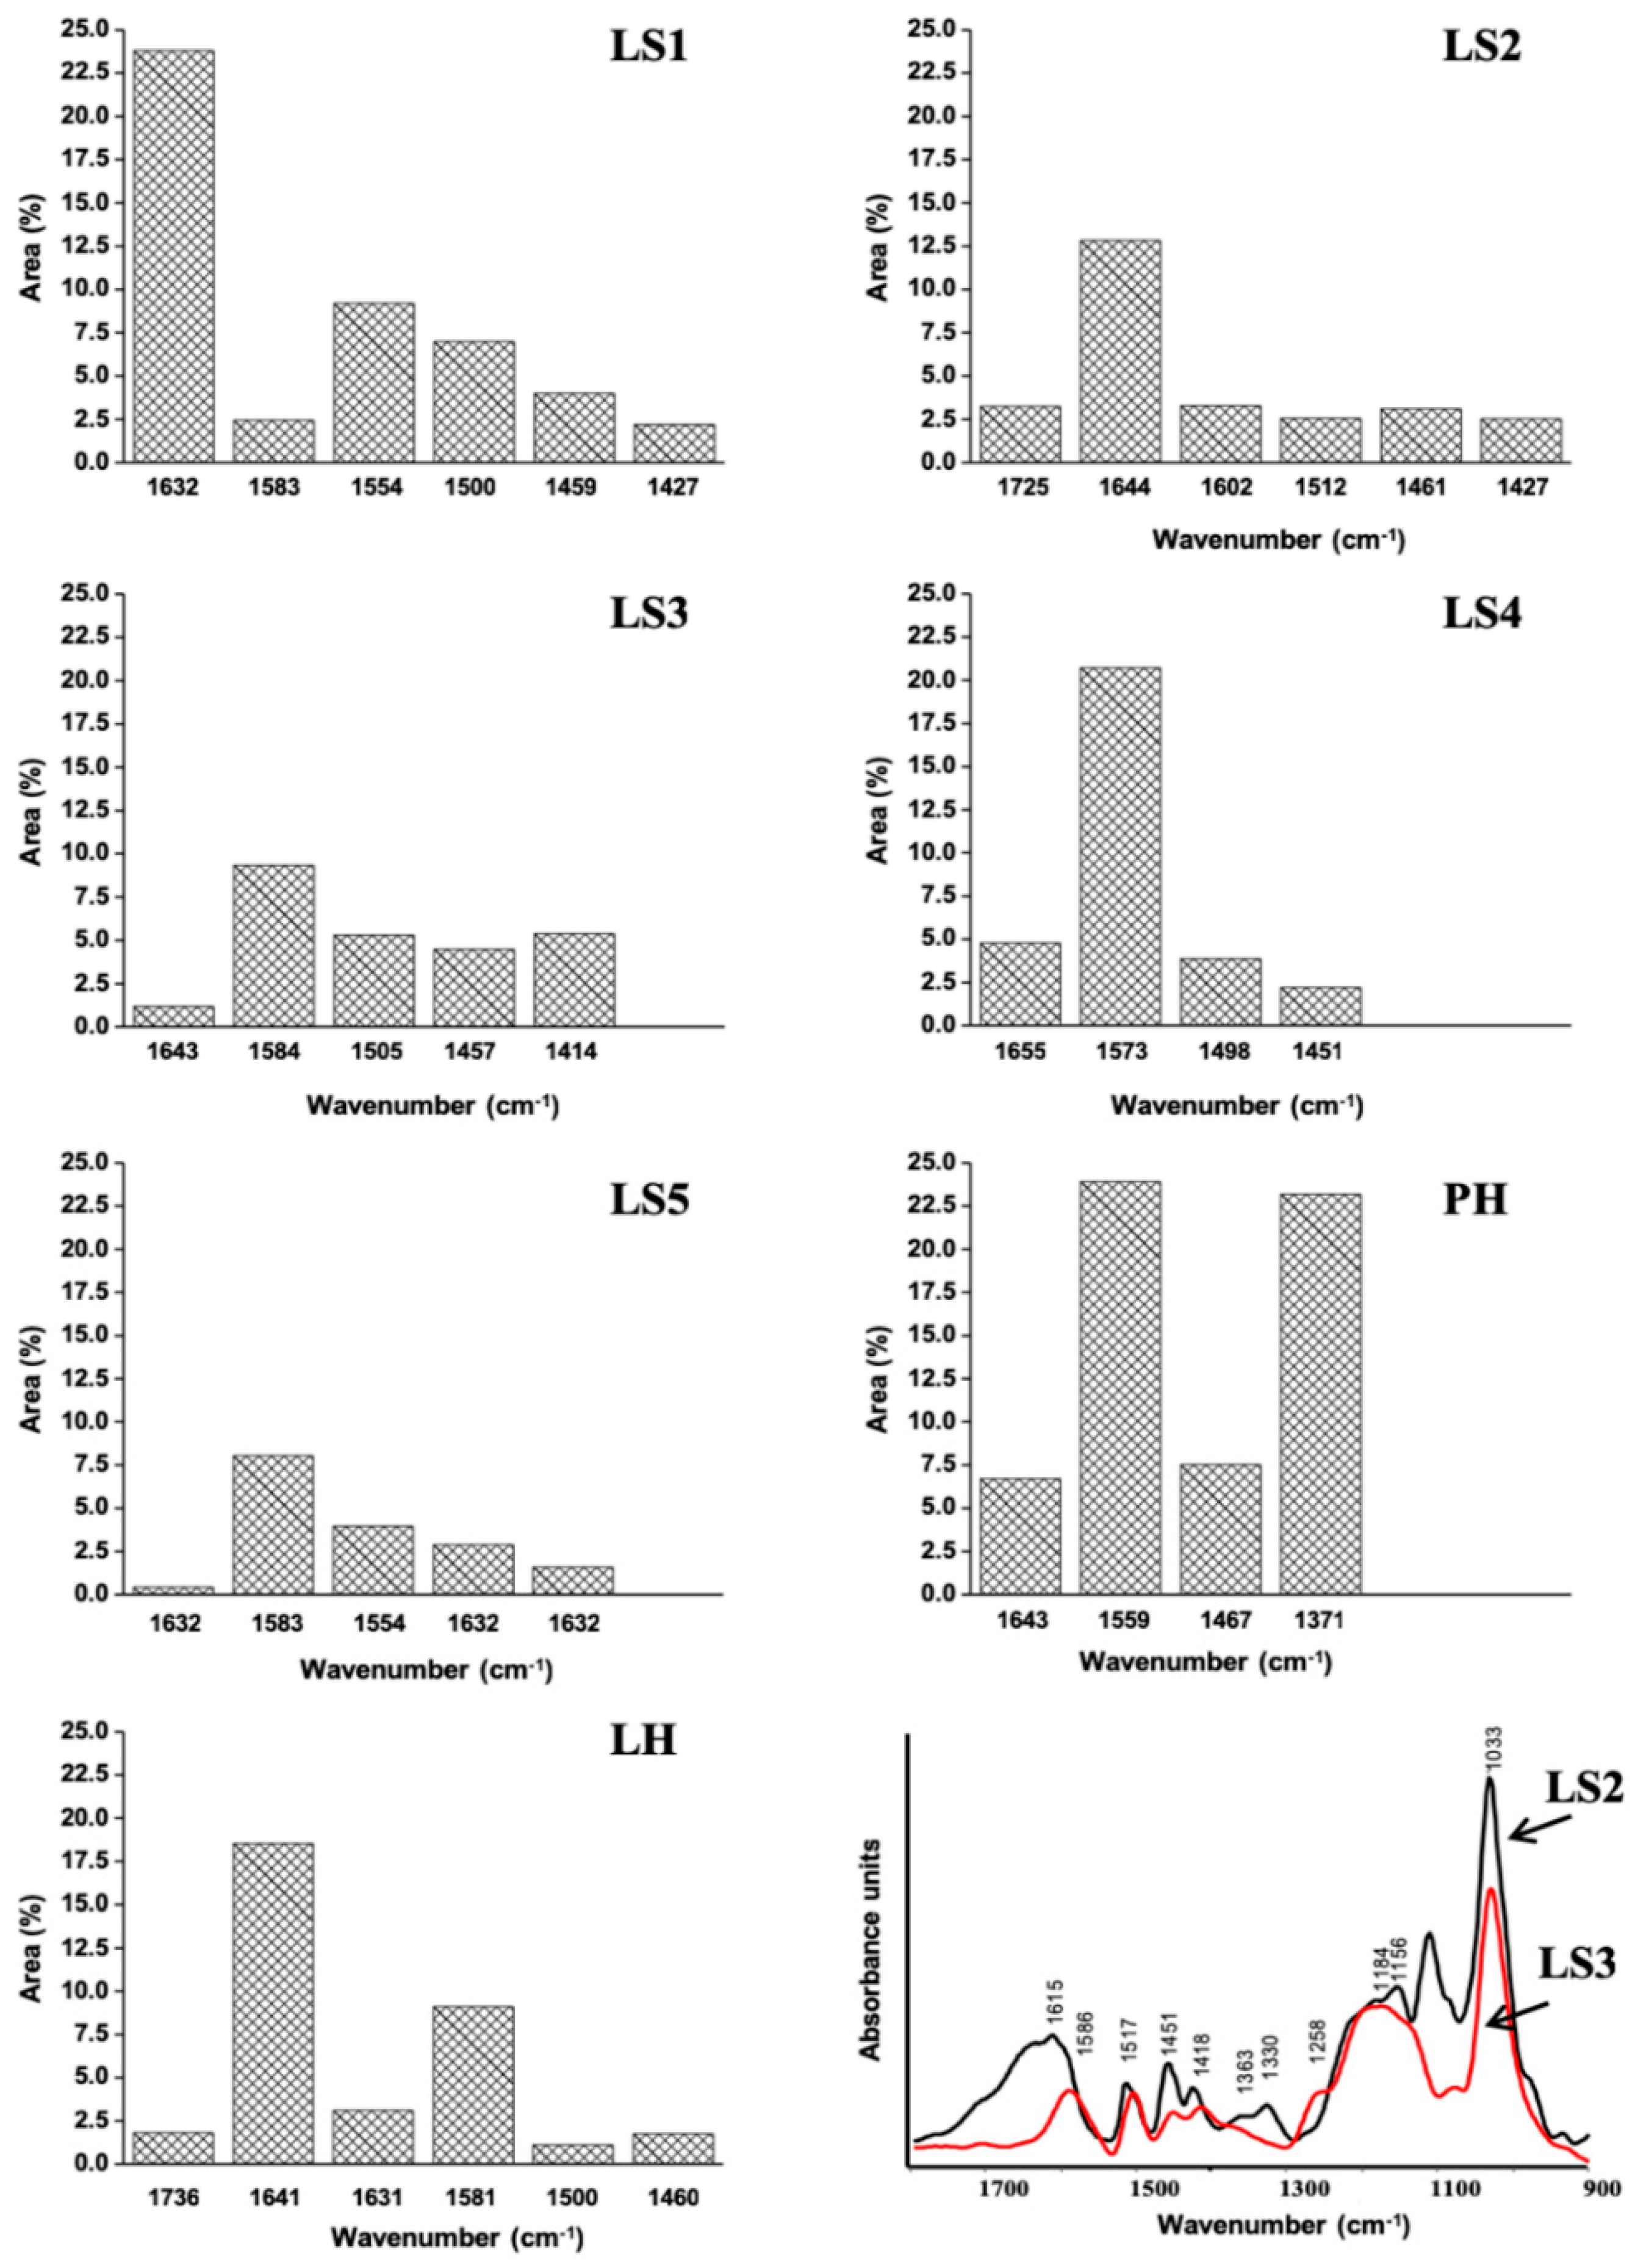
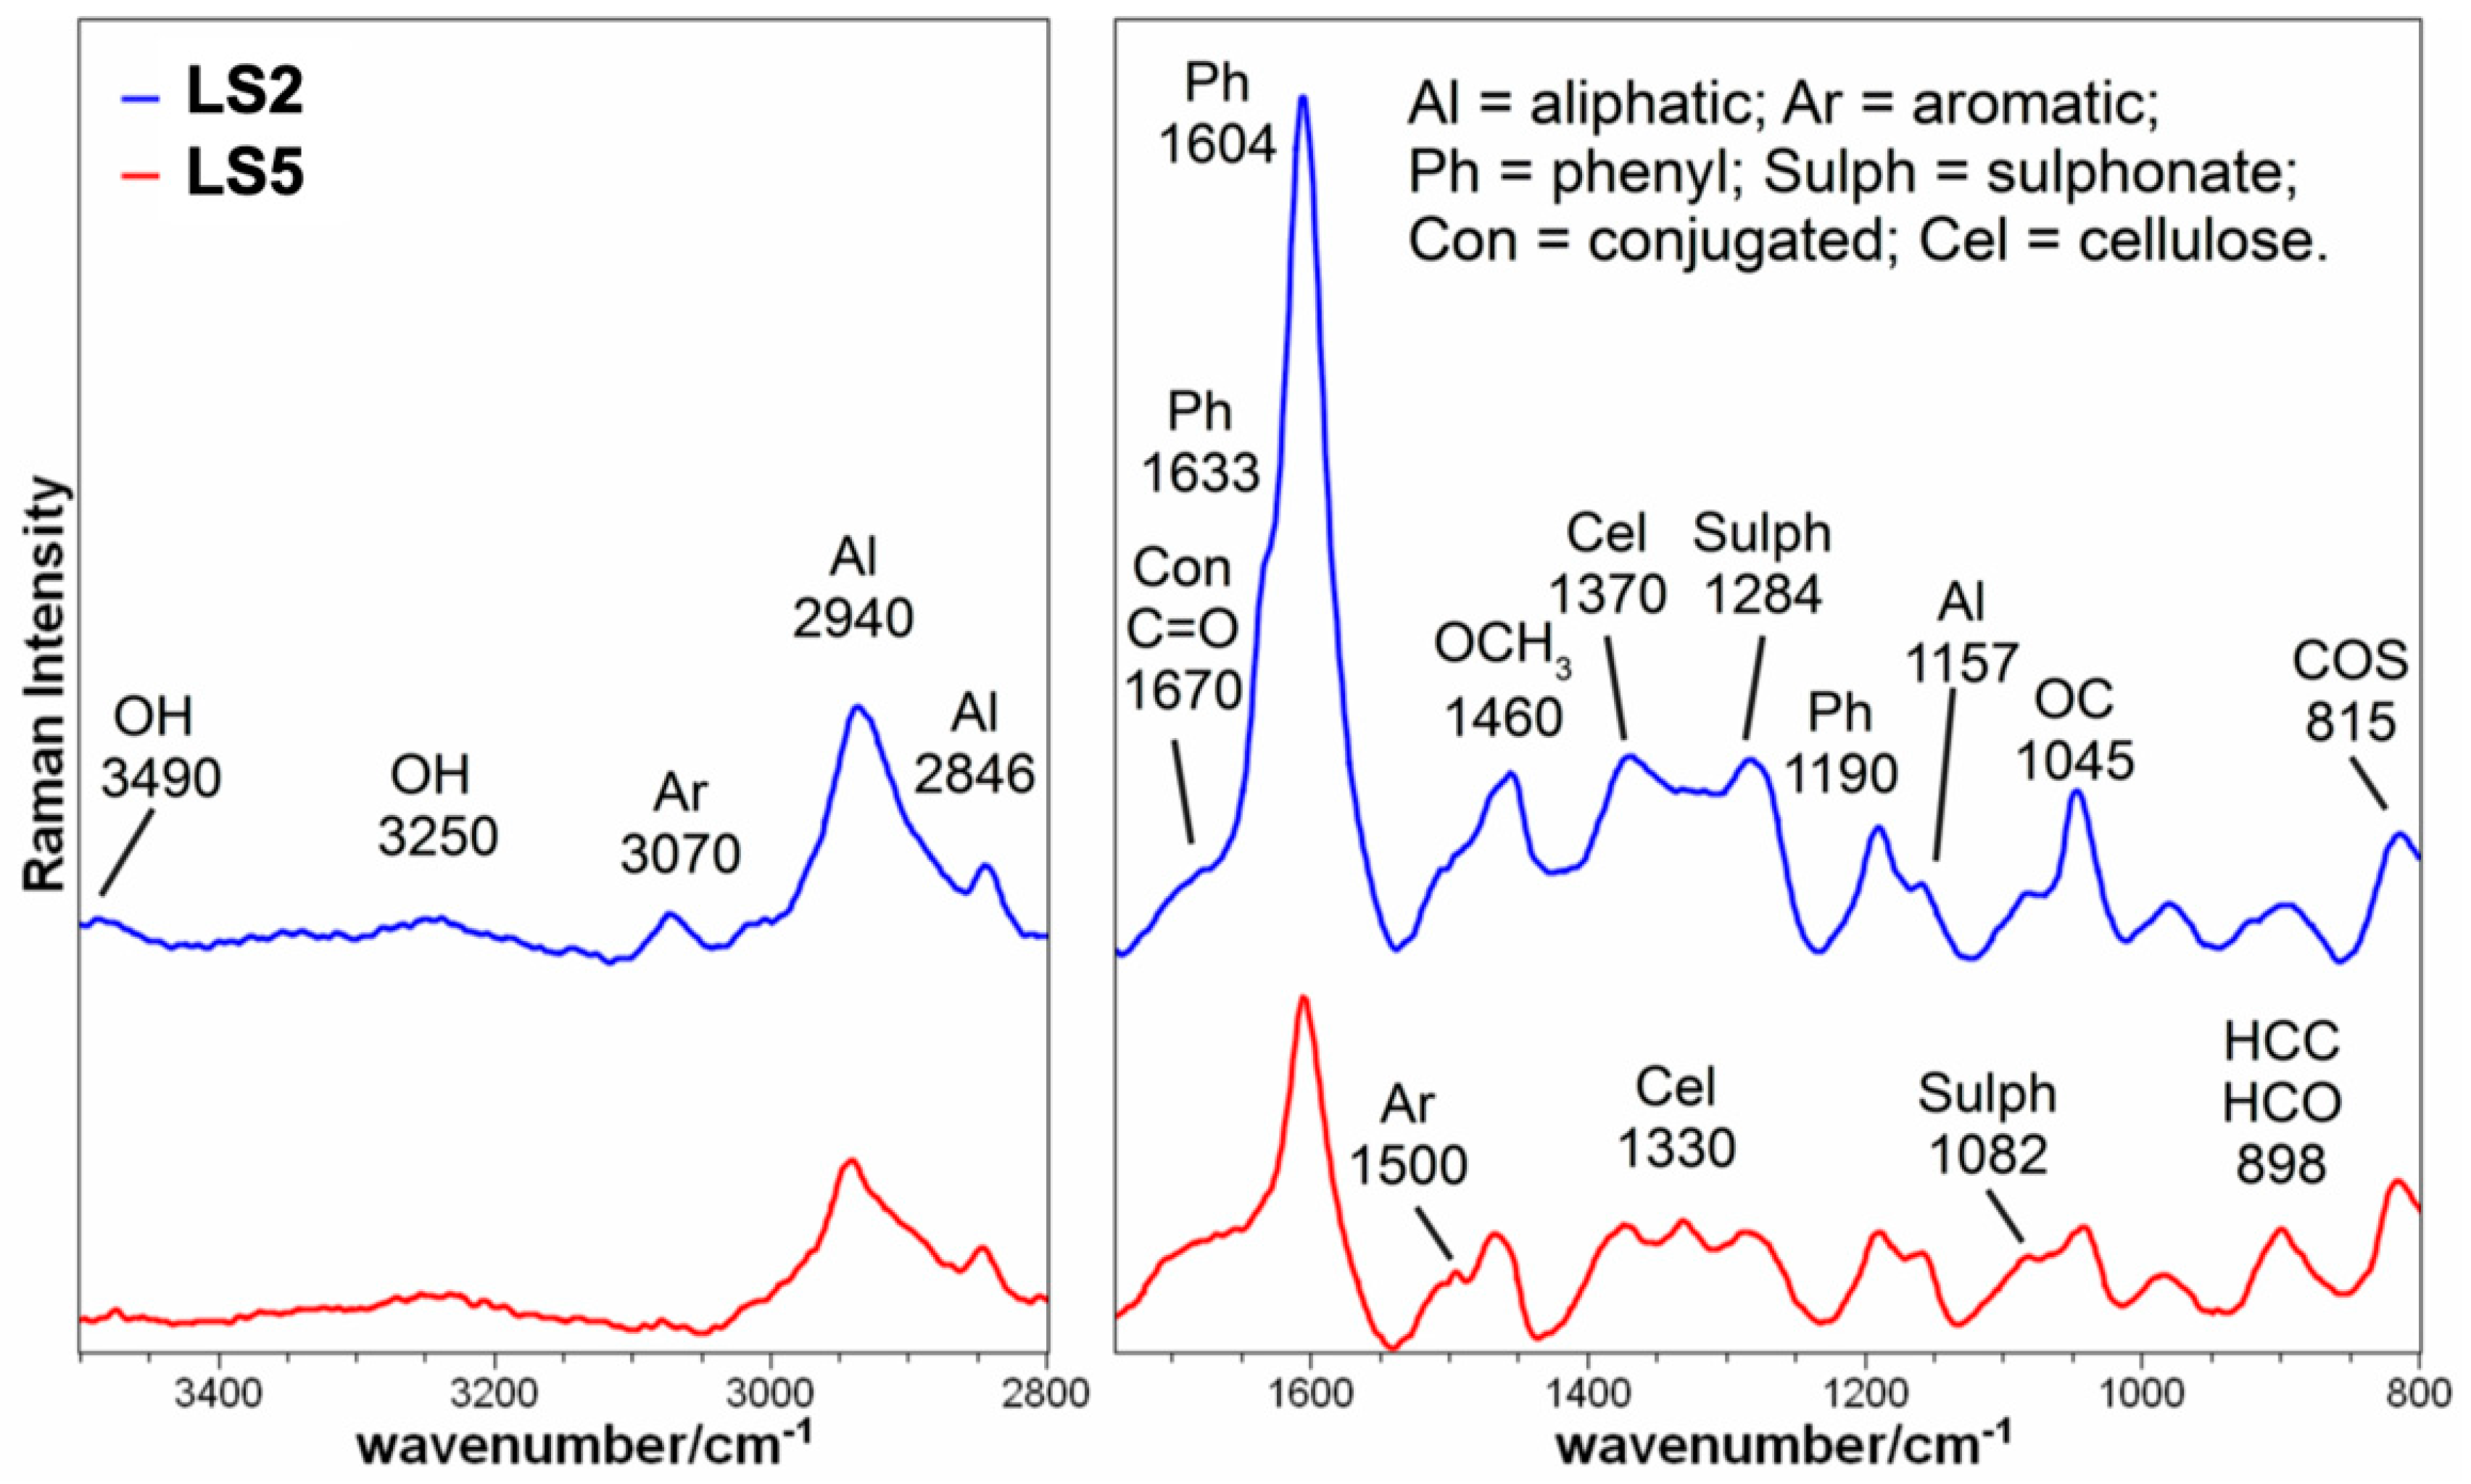
2.1. Chemical and Spectroscopic Features of Hs

The elemental composition in percent content (w/w) of Hs is reported in Table 1. Carbon (C) content was strongly correlated (R2 = 0.83) with nitrogen (N) content for all Hs and varied from 33.04% (w/w) in LH to 54.56% (w/w) in LS1. Nitrogen content was also maximum in LS1 (2.18% w/w), but minimum in LS4 (1.58% w/w). Sulfur (S) content was low only in PH (1.30%), while it was higher in lignosulfonates, varying from 5.13% (w/w) in LS5 to 7.83% (w/w) in LS4.
FTIR and Raman analyses were performed to evaluate the main chemical attributes of Hs. The attributions of the main peaks for different functional groups identified in the FTIR and Raman spectra were mainly obtained by references [29]. With respect to FTIR spectra, we decided to display only the peak fitting results obtained in the region from 1800 to 1370 cm−1, because the main differences in variation were observed in this region. The region between 1200 cm−1 and 1000 cm−1 was heavily dominated by strong bands, probably originated by the SO3H group vibrations (Figure 1) [30].
In LS2 and LH, due to C=O bonds of acetyl ester from residual hemicelluloses, a band between 1735 and 1725 cm−1 was evident. A very weak band at 1705 cm−1 was observed only in LS5. This band, associated with those at 1258 and 1418 cm−1, may be attributed to the C=O stretching of COOH groups, while the other two bands may be due to C (=O)\O stretching vibration and OH in-plane deformation vibrations, respectively (spectra not shown). The appearance of carboxyl acid groups could be related to the removal of hemicellulose in this sample [31]. The bands at 1644 in LS2, LS3, LH, and PH, and at 1632 cm−1 in LS1 and LH, were likely associated with H2O and C=O stretching in conjugated p-substituted aryl ketones [32]. In addition, the peak at 1655 cm−1 recorded in LS4 could be assigned to C=O in alkyl groups of the lignin side chains, conjugated with the aromatic rings [33]. These bands were completely absent in LS5. Other bands identified between 1600 and 1573 cm−1 corresponded to vibration of aromatic rings. The intensity of these bands depends on the number of C-O bonds to the aromatic ring [34]. Intermolecular aromatic C=C bonds may also have contributed to the intensity of these bands. The peaks from 1512 to 1498 cm−1 are typical of the skeletal and stretching vibration of aromatic moieties in lignin. Such peaks were present in all products. The bands at around 1460 and 1414 cm−1 were attributed to the bending vibration of the methoxyl on benzene rings and methylene groups, respectively. The peak at 1370 cm−1, observed only in PH, may be due to aromatic CH generated by cleavage of ether bonds within the lignin (spectra not shown).
The relative area percentage gave an estimation of the functional group distribution in the Hs (Figure 1). The band at around 1640 cm−1 showed a variable distribution among products. For instance, it was dominant in LS1 (24%), LH (18%), LS2 (13%), and totally absent in LS5. The aromatic structure was diversified into different bands at around 1580, 1559, and 1500 cm−1. The first band was dominant in LS4 (21%), LS3 (9.4%), and LH (9.0%), and absent in PH. In the other products, this band ranged from 8% to 2.4%. The second band at 1559 cm−1 accounted for 24% in PH and 9% in LS1. The last band at around 1500 cm−1 was prevalent in PH (7.5%), LS1 (7%), and LS3 (5%). In other lignosulfonates, it varied from 4% in LS4 and LS5, 2.5% in LS2, and 1% in LH. Finally, the band at 1371 cm−1 accounted for 23% in the commercial humate PH.
The Raman spectra of LS2 and LS5 are reported in Figure 2, while the complete attributions of the two lignosulfonates are shown in Table 2. Both spectra display bands at 3490 and 3250 cm−1, attributable to OH stretching free or H-bonded, respectively, and both aliphatic (at 2940 and 2846 cm−1) and aromatic (at 3070 cm−1) CH stretching in the higher wavenumber region. Moreover, the shoulder at about 1670 cm−1 could be ascribed to conjugated C=O stretching [35], the bands at 1630, 1604, and about 1500 cm−1, together with that one at 1190 cm−1, were all attributable to phenolic rings, the last one specifically to lignin [35,36]. The peaks at 1460, 1370, and 1330 cm−1 corresponded to bending vibrations of O-CH3, CH, and aliphatic OH in lignin and cellulose, respectively [35]. The peaks at 1284 and 1082 cm−1, together with that recorded at 815 cm−1 indicated the presence of sulfated groups [37,38]. Other bands observed in the Raman spectra were less indicative to identify the functional groups present in LS2 and LS5. The relative intensity of the over reported bands is different in the two examined spectra. In particular, for LS5 the bands attributable to aromatic groups (at 3070, 1633, 1604, and 1190 cm−1) displayed a higher intensity compared to LS2, indicating that the aromatic component was higher in LS5. On the contrary, the bands at 1330 and 898 cm−1, both attributable to cellulose, were more intense in LS2, indicating a higher content of this component in LS2 compared to LS5.

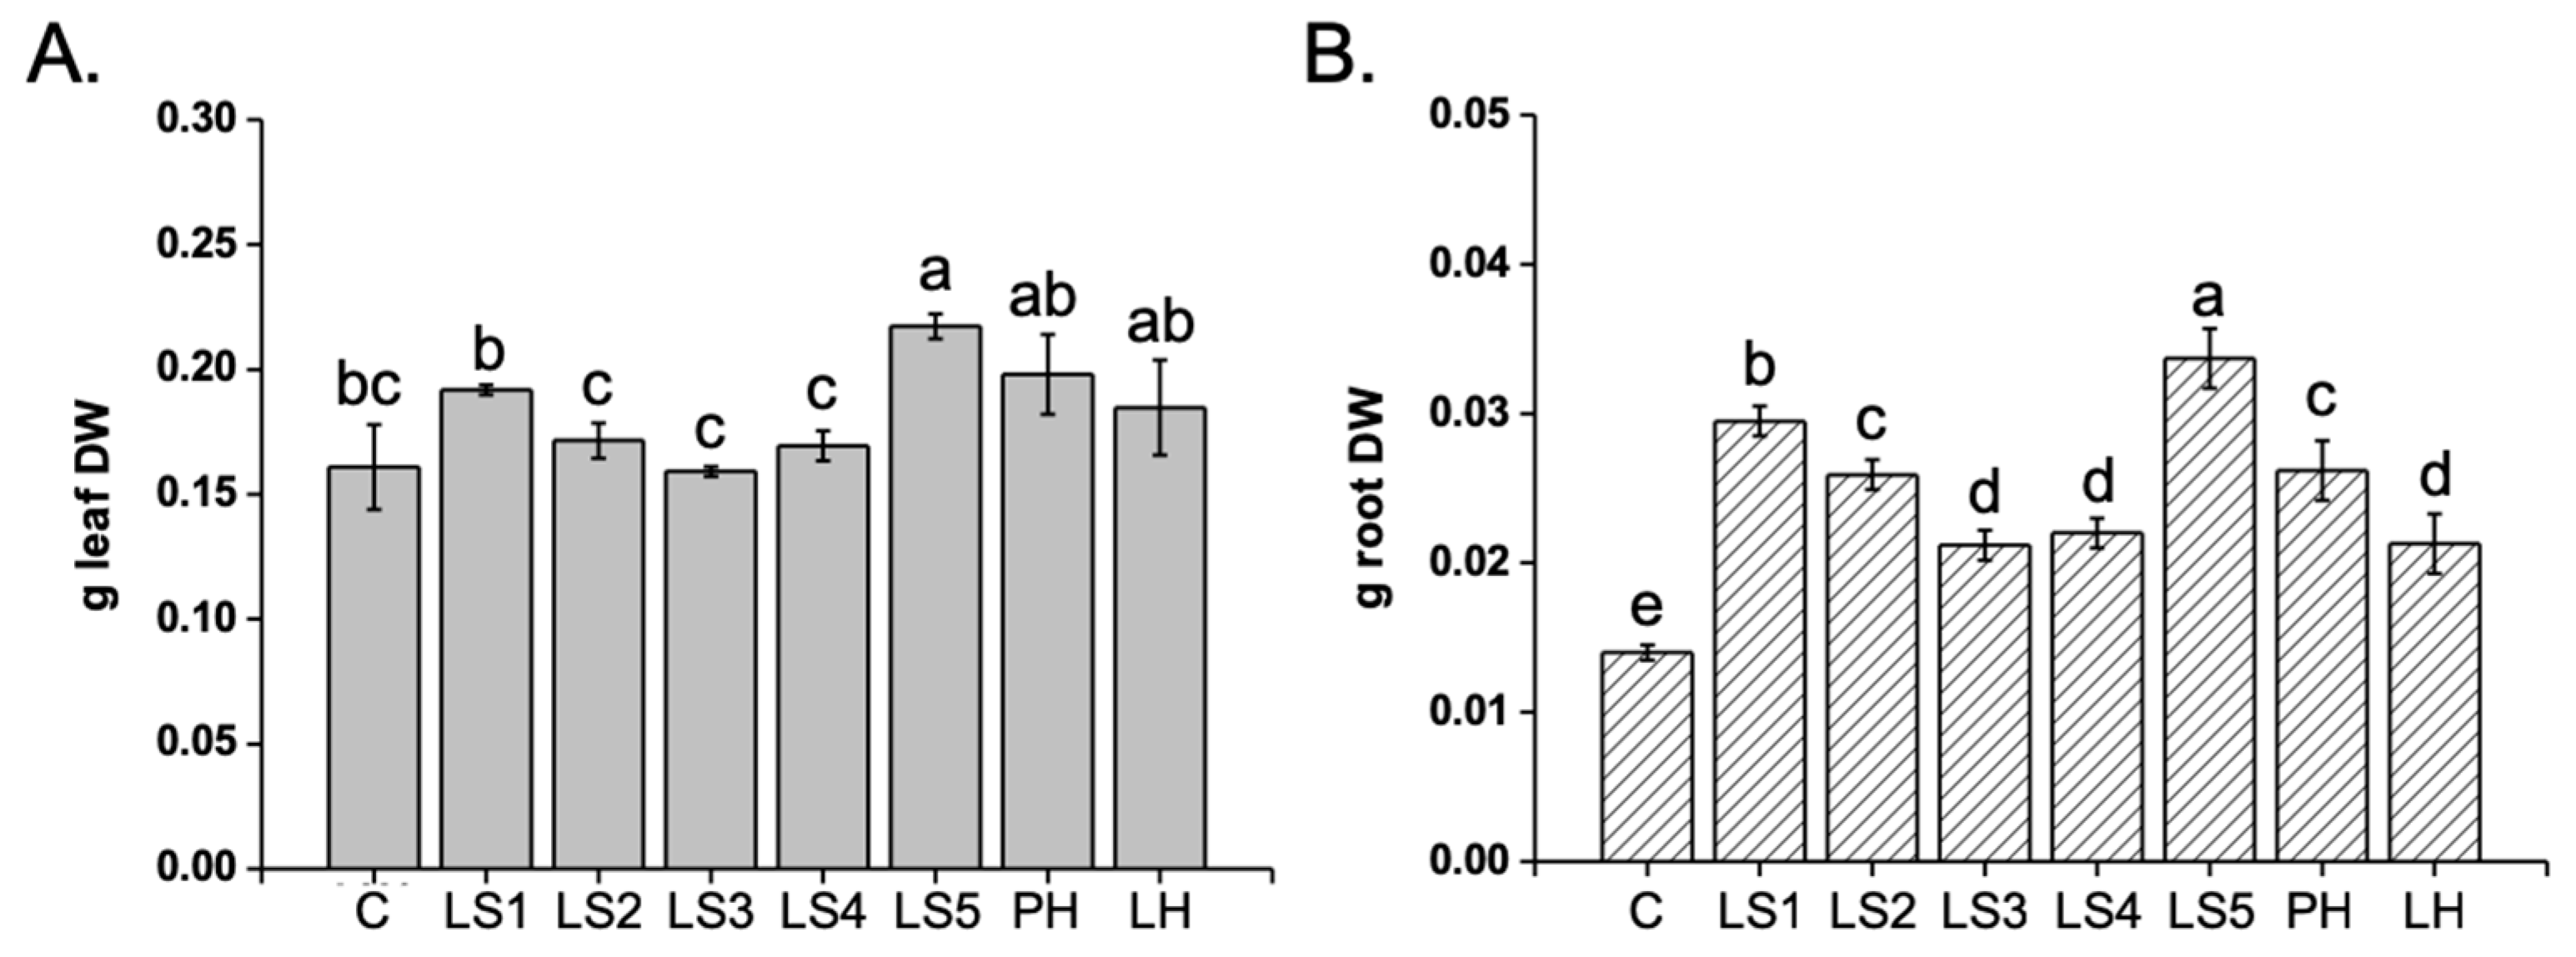
2.2. Effect of Hs on Maize Plant Growth

The effect of Hs application on maize plant growth is reported in Figure 3. Results indicated that LS5 was the most effective in promoting the leaf (Figure 3A) and root (Figure 3B) dry weight (+140% and +35%, respectively), compared to the untreated plants. The remaining Hs did not substantially improve the leaf biomass produced by plants. However, they all stimulated the root growth appreciably. Specifically, LS3, LS4, and LH increased the root biomass of plants by 51%, 57% and 52%, respectively, while LS2 and PH were by about 85%, and LS1 was by 111%.

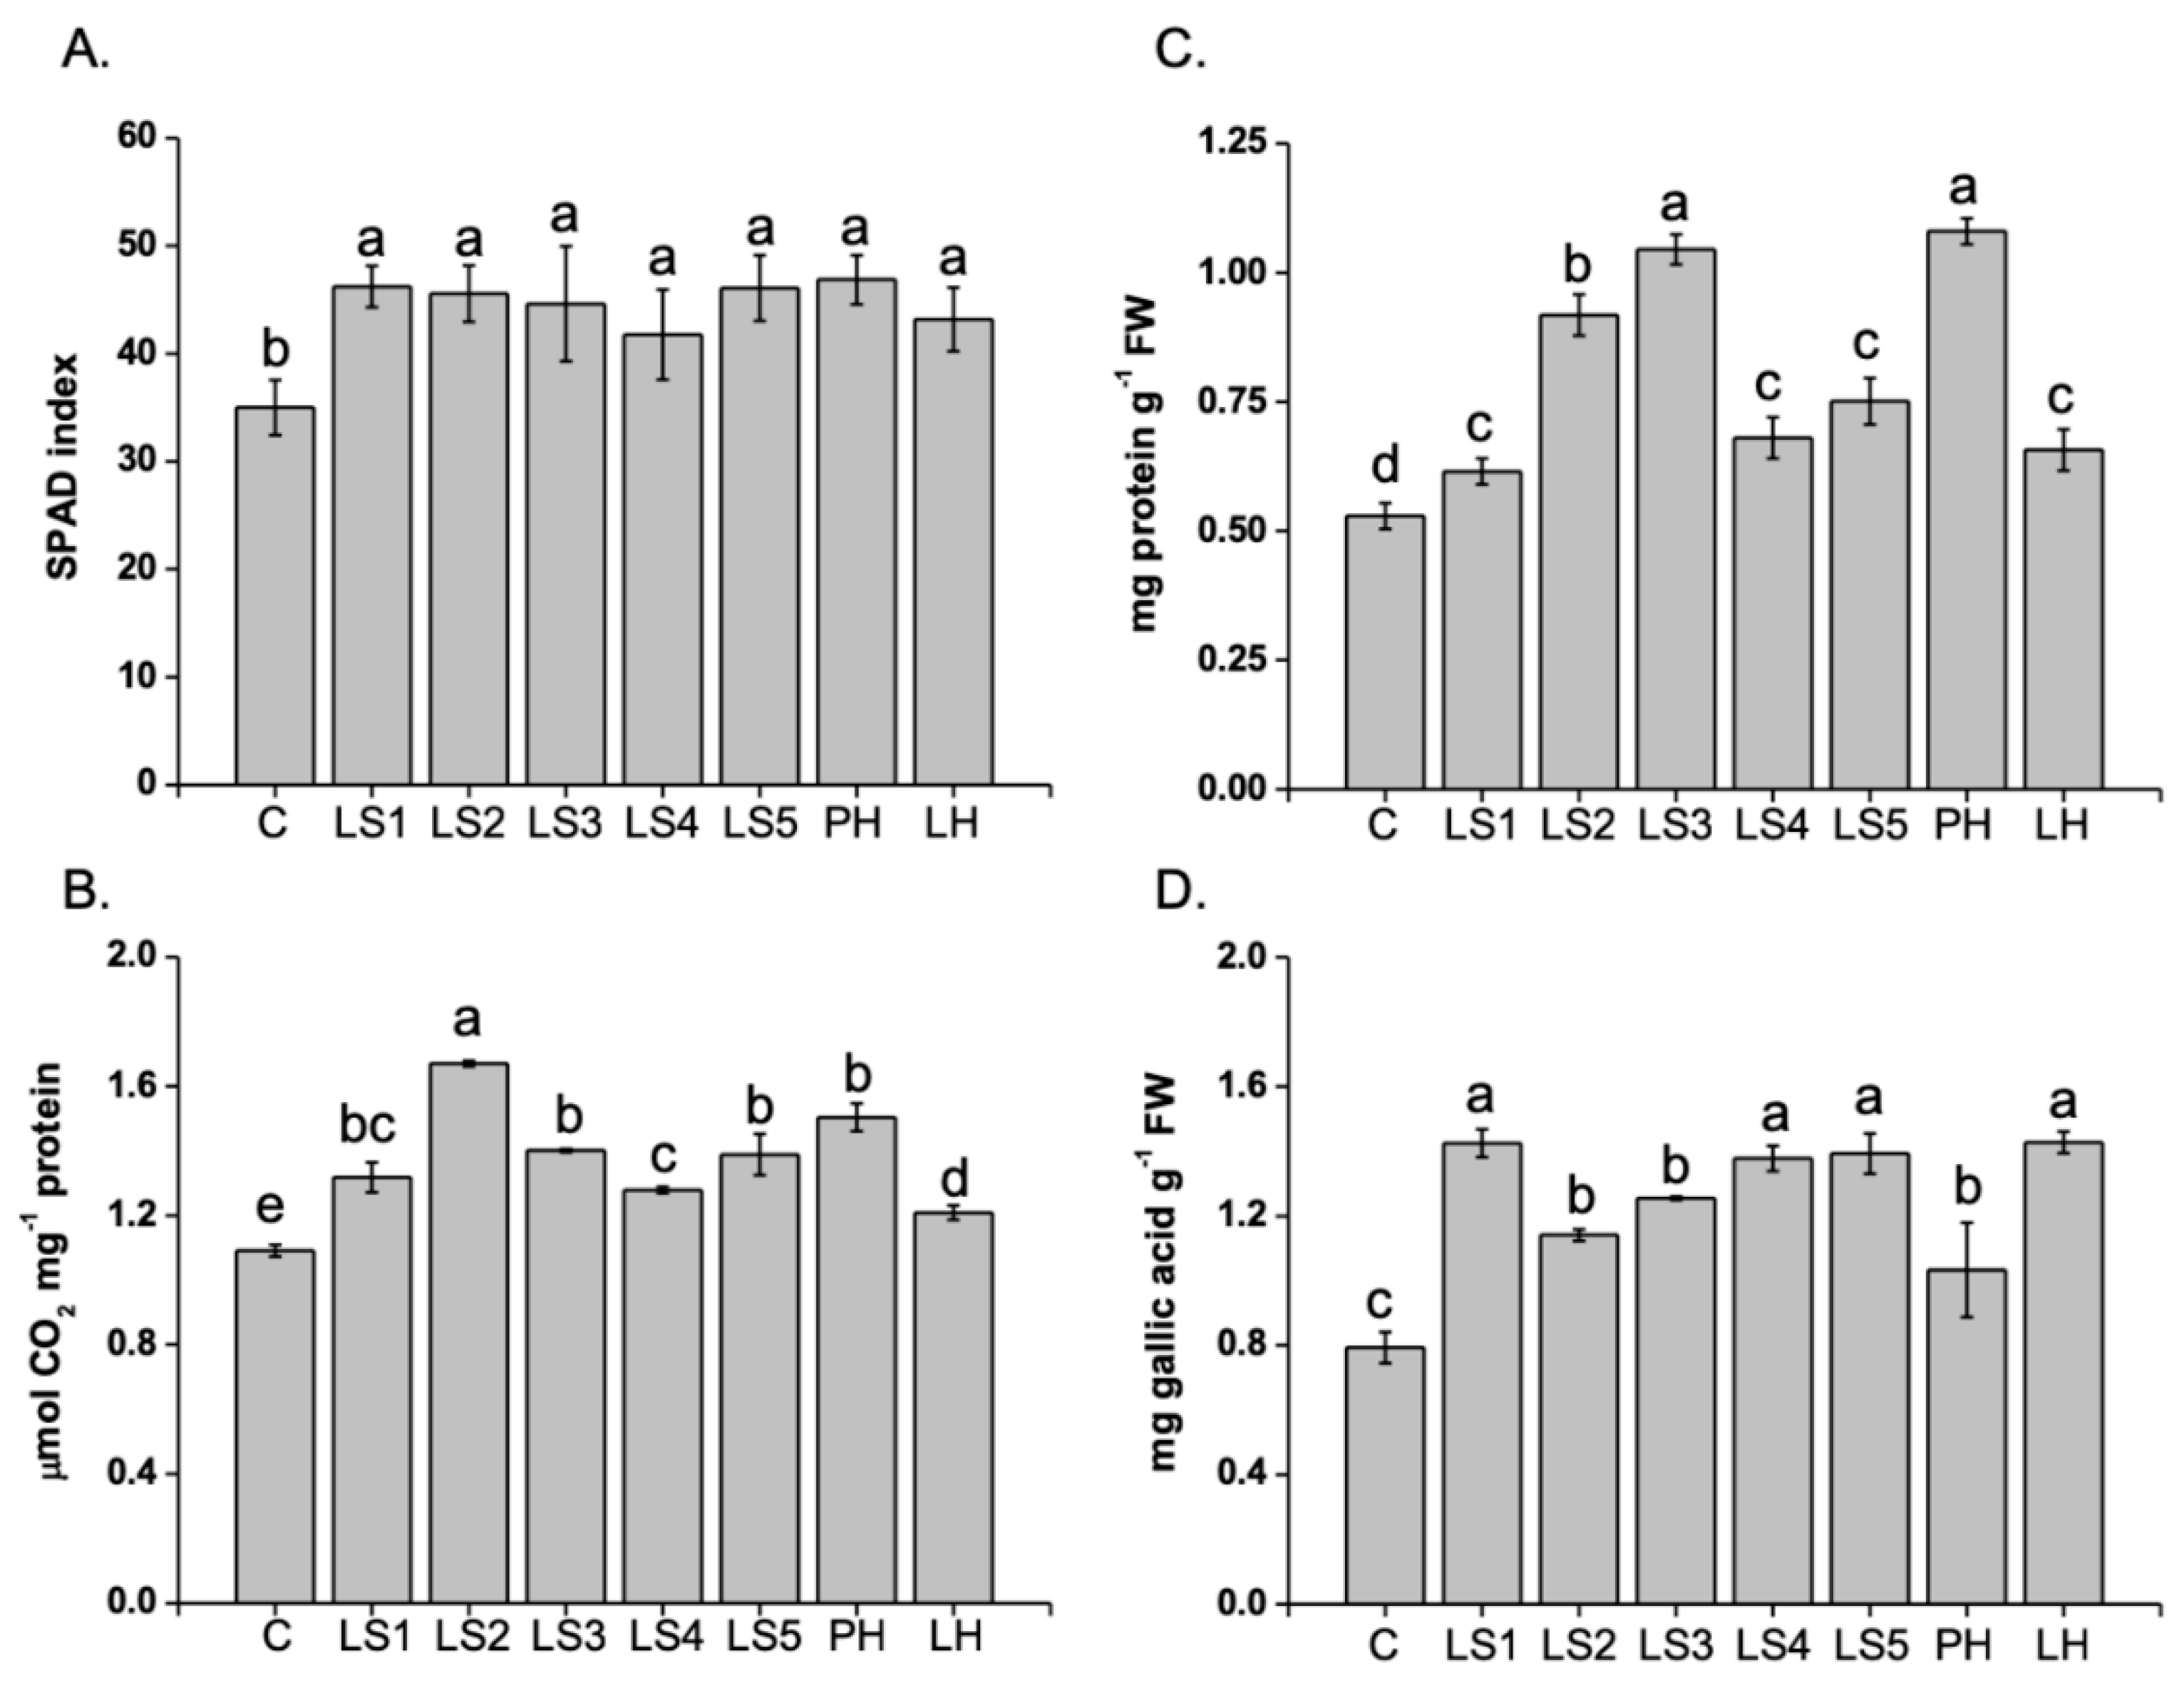
2.3. Effects of Hs on SPAD, RuBisCO activity, and N-compounds (Proteins and Phenolics)

The effect of Hs on maize plants was additionally evaluated in terms of photosynthetic efficiency by measuring the SPAD index (Figure 4A) and the activity of the RuBisCO enzyme (Figure 4B). In general, Hs prompted the increase of the SPAD index values of plants to a similar extent (Figure 4A). Analogously, RuBisCO activity was increased by all Hs, but differences in the percent stimulation caused by individual Hs were observed in this case (Figure 4B). LS2, in particular, was the most effective in enhancing the activity of this enzyme (by about 70%), followed by LS1, LS3, LS5, and PH (+30–50%). The other Hs stimulated the RuBisCO activity to a lower extent.
As the SPAD index is associated to the amount of N compounds in plants, the quantification of proteins, total phenols, and individual phenolic acids was performed. It is noteworthy that the content of total N was also measured in the plants (data not shown), but no significant differences were recorded, likely because of the limited duration of the experiment. Protein accumulation was enhanced in leaves of maize plants supplied with Hs (Figure 4C). LS2, LS3, and PH, in particular, induced the most pronounced increases (+74%, +98%, and +104%, respectively). The synthesis of phenol compounds (Figure 4D) was stimulated in leaves of maize plants treated with Hs as well. In this case, however, LS1, LH, LS4, and LS5 were responsible for the greatest increments (by about 80%).
Differential accumulation of individual phenolic acids was also observed between maize plants supplied with Hs and the controls, as well as among plants treated with distinct Hs (Table 3). There were three derivatives of cinnamic acids (caffeic, p-coumaric, and ferulic acids), one ester of caffeic acid and (−)-quinic acid (chlorogenic acid), and one derivative of benzoic acid (p-hydroxybenzoic acid). In most cases, Hs induced significantly higher accumulation of chlorogenic, caffeic, p-coumaric, ferulic, and p-hydroxybenzoic acids in leaves of maize plants compared to the controls. LS1, LS2, LS3, LS4, and LS5 especially, accounted for the most appreciable effects in this respect. Specifically, very high values of leaf phenolic acid accumulation were measured for chlorogenic and caffeic acids in plants treated with LS2 (+168% and 184%, respectively) and LS4 (+651% and 262%, respectively), for ferulic acid in plants provided with LS1 (+472%), LS2 (328%), LS3 (+222%), and LS4 (+413%), and for p-hydroxybenzoic acid in plants given with LS1 (+193%), LS2 (+187%), and LS4 (+202%).
In roots, only chlorogenic and ferulic acids were more accumulated in plants treated with Hs than the controls. The highest values of chlorogenic acid content were observed in roots after plant treatment with LS2 (+71%), LS4 (+60%), LS5 (+115%), PH (+113%). With respect to ferulic acid, maximum accumulation was measured in roots of plants supplied with LS1 (+436%), LS2 (+396%), and PH (+361%).

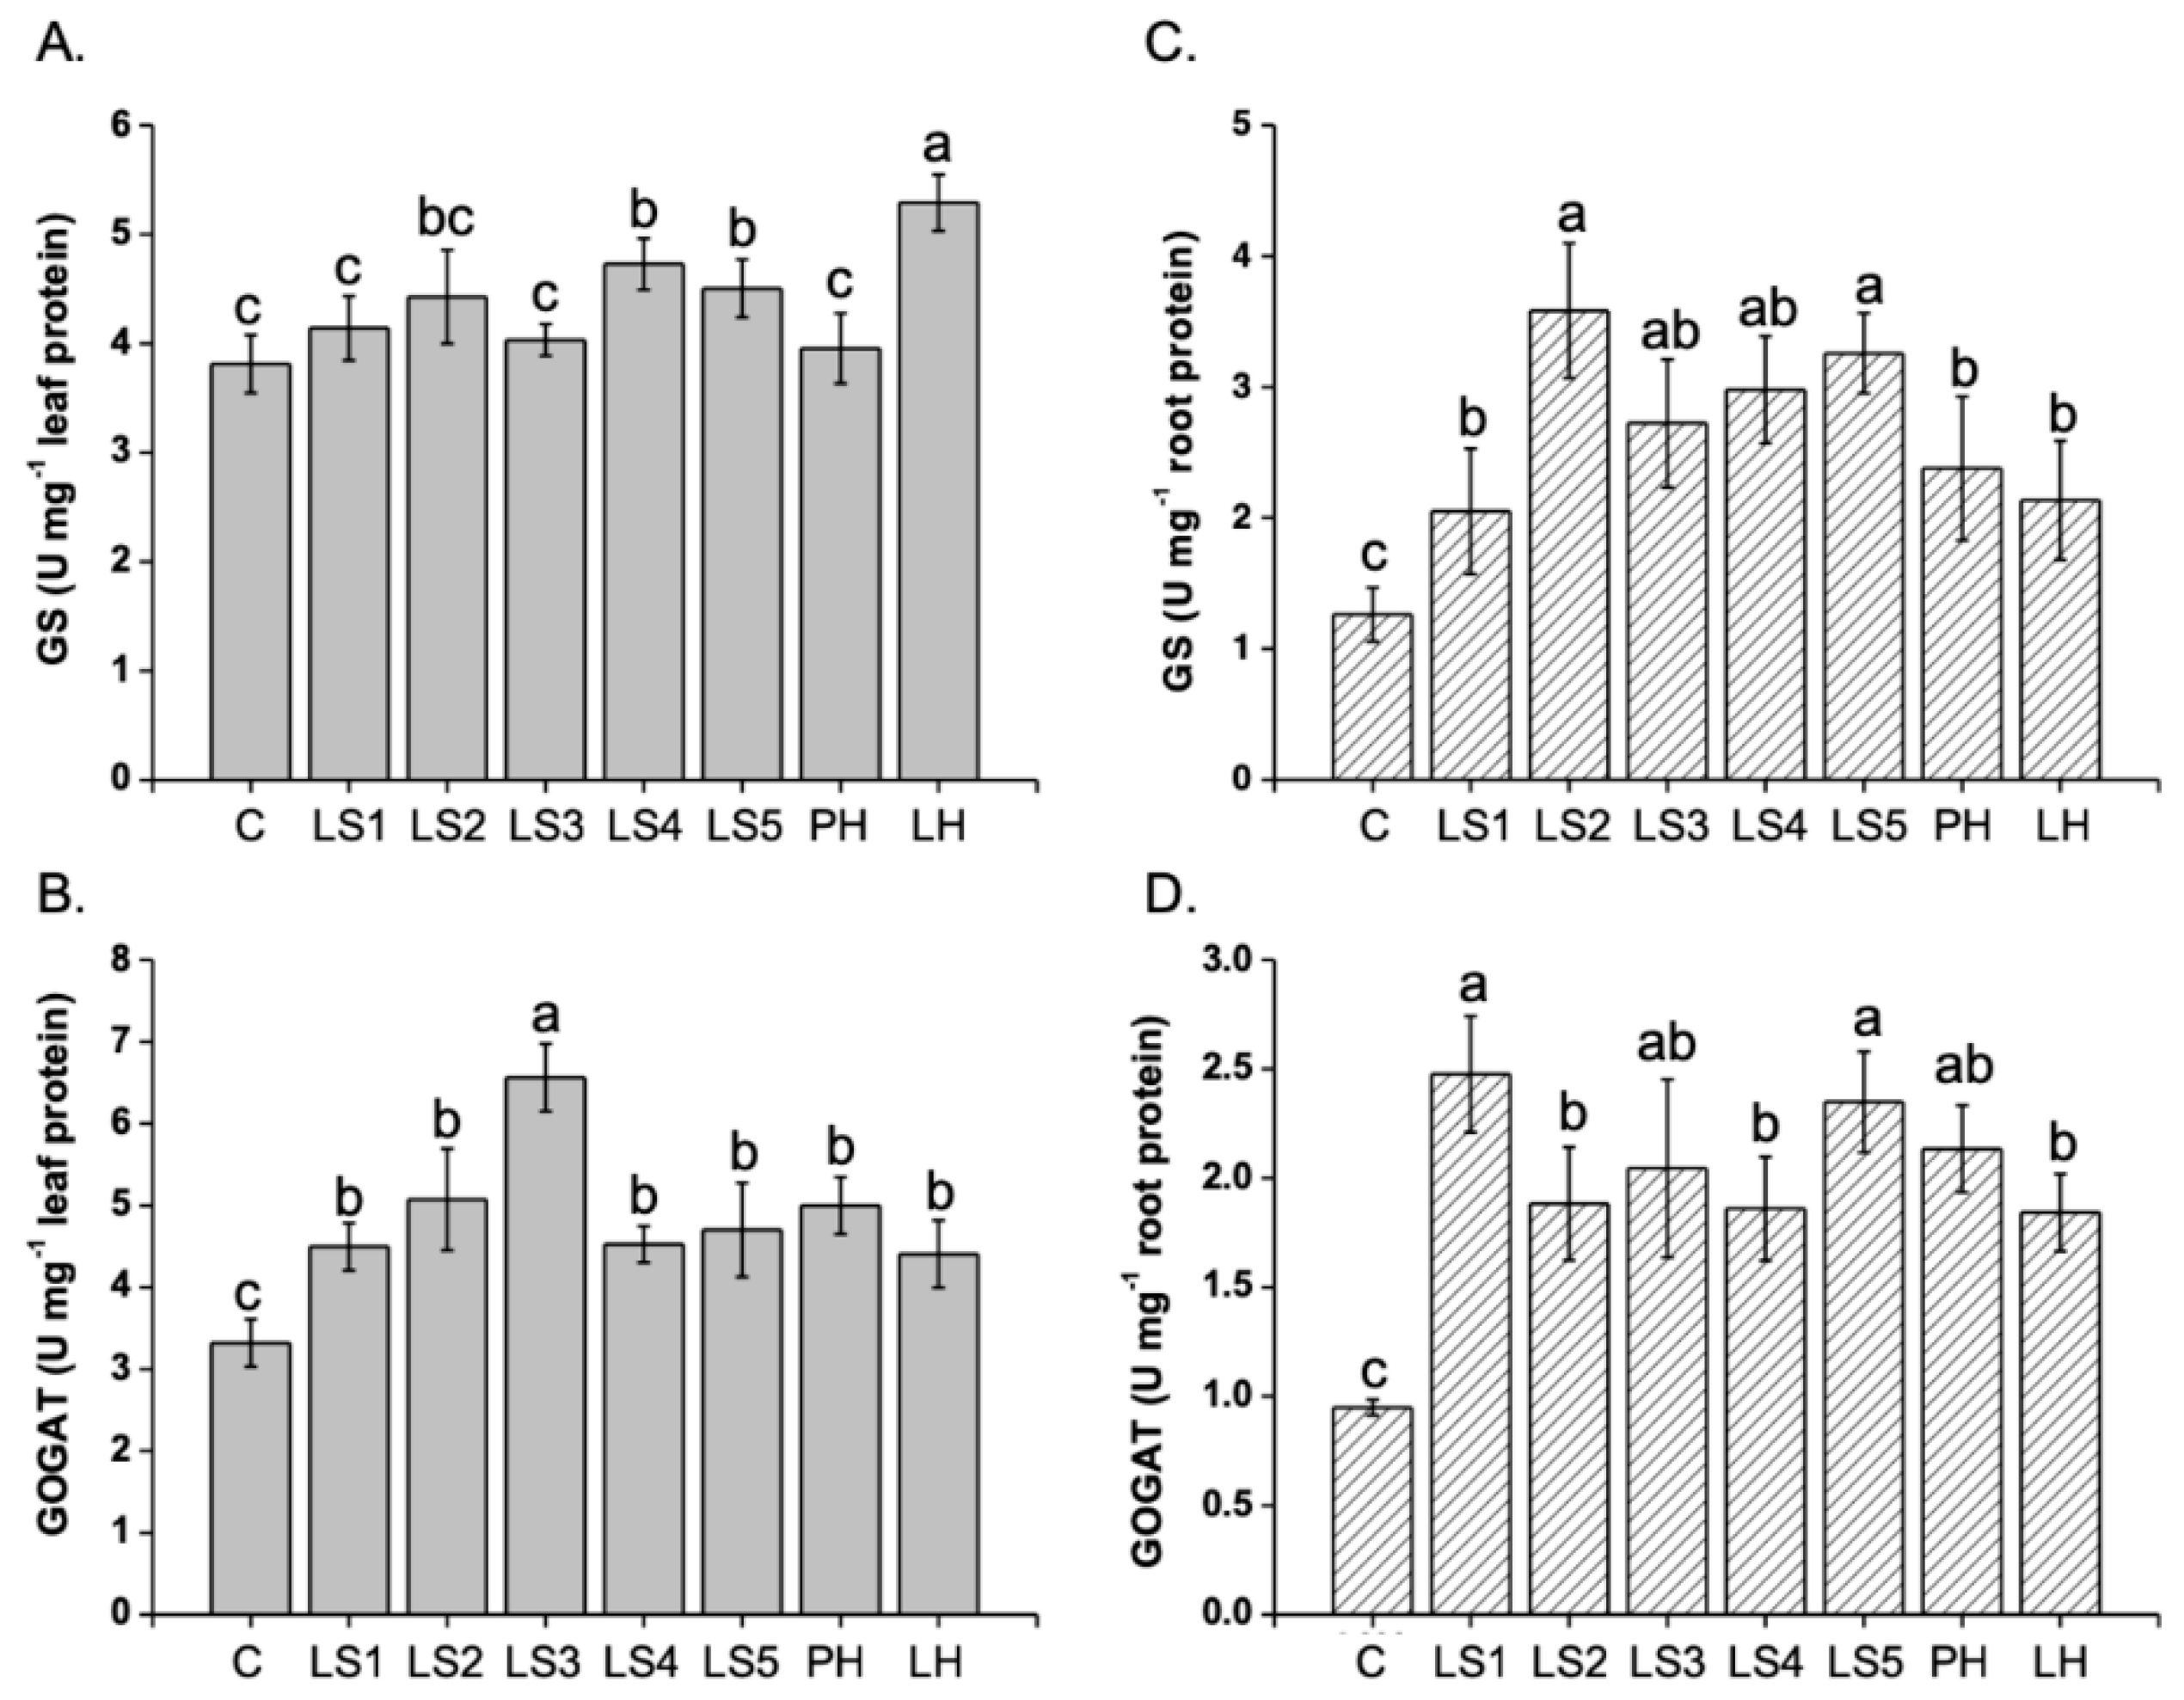
2.4. Effects of Hs on GS and GOGAT Activities

Further effects of Hs on maize plant metabolism were investigated by measuring the activities of two enzymes (GS and GOGAT) that catalyze key steps in N assimilation (Figure 5). Overall, a greater activity of such enzymes was determined in plants supplied with Hs. The activity of GS in leaves in particular, was increased by LH (+44%), LS4 (+24%), and LS5 (+18%) (Figure 5A), while the activity of GOGAT was stimulated by all Hs applied to plants (Figure 5B). LS3 accounted for the maximum leaf activity of GOGAT (+98%). In roots, the activity of both GS and GOGAT enzymes was enhanced by all Hs (Figure 5C,D). In the case of GS, the highest activity was detected in roots of plants treated with LS2 (Figure 5C), while maximum GOGAT activity was measured in plants supplied with LS1 and LS5 (Figure 5D).

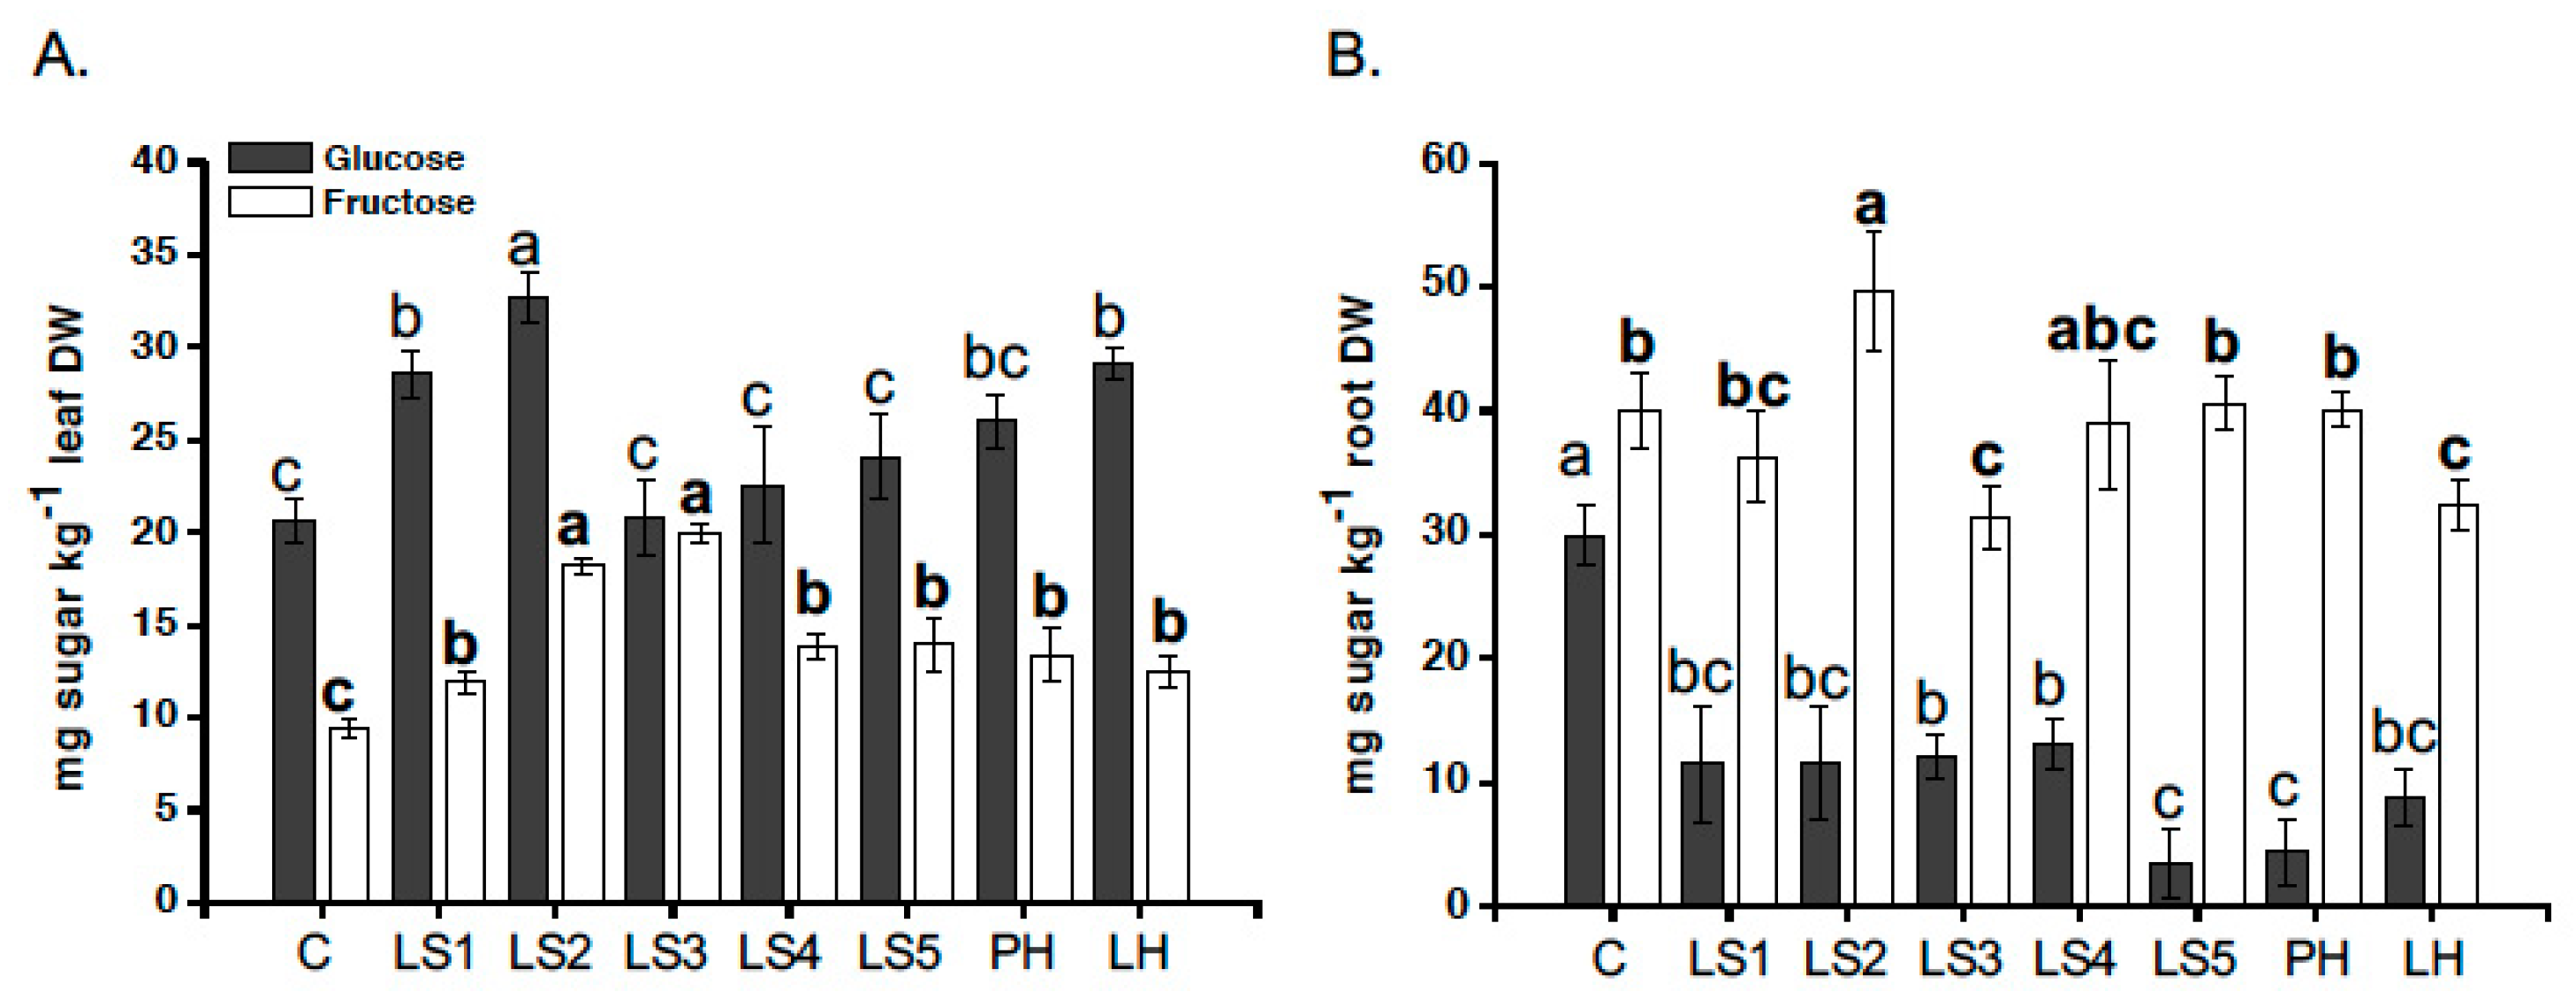
2.5. Effects of Hs on Reducing Sugar Accumulation

The content of soluble reducing sugars (glucose and fructose) was increased in leaves of plants treated with Hs (Figure 6). Precisely, improved glucose accumulation was observed in leaves of maize plants after treatment with LS1, LS2, and LH (+39%, +58%, +41%, respectively, Figure 6A). With respect to fructose, all Hs stimulate its accumulation, with maximum values determined by LS2 and LS3 (+92% and +111%, respectively, Figure 6A). In roots, an opposite trend was evident, as the content of both sugars decreased when plants were treated with Hs, with few exceptions (Figure 6B).

2.6. Statistical Analysis of Data

The correlation analysis evidenced significant relationships between the parameters analyzed in maize plants subjected to treatment with Hs (Table S1). The root dry weight, which was more stimulated than the leaf dry weight by Hs, positively correlated with SPAD, total phenols, GS and GOGAT root activity, and RubisCO activity, whereas it negatively correlated with the content of glucose in roots. SPAD index values displayed a positive correlation with the content of N metabolites (proteins and phenols), the activity of GOGAT, GS (only in roots), RubisCO, and the leaf fructose content. However, SPAD negatively correlated with the root glucose content. Total phenols showed positive correlation with GS activity in leaves and roots and GOGAT activity in roots. The activity of GS in leaves did not show any correlation with the other parameters analyzed, but GS activity in roots positively correlated with the activity of GOGAT in leaves and roots. The activity of both N enzymes also positively correlated with RubisCO activity. The activity of all three enzymes, GS (in roots), GOGAT, and RubisCO, negatively correlated with glucose content in roots. RuBisCO positively correlated with the leaf glucose content and fructose content in both leaves and roots, whereas it negatively correlated with the root glucose.
With respect to PCA analysis, three factors accounted for 91% of the total variance. Factor 1 explained 53.6% of the variance and positively correlated with GS and GOGAT activity in roots, SPAD, total phenols, while it negatively correlated with glucose content in roots. Factor 2 explained 22.7% of the variance and was positively correlated with GOGAT activity in leaves, protein content, and leaf fructose amount. Factor 3 explained the remaining 14.8% of the variance and was correlated with the content of fructose in roots and GS activity in leaves. Plotting data reported in Table S2 according to PC1 and PC2 allowed three clusters to be identified (Figure S1A,C); a main group constituted by plants 1, 2, 3, 4, 5, 6, and 7, corresponding to LS1, LS2, LS4, LS5, PH, and LH, and the other two by control (untreated, 8) and LS3 (3). In particular, LS1, LS2, LS4, LS5, PH, and LH were characterized by high values of GS and GOGAT activity in roots, SPAD, and total phenols, whilst LS3 had high values of GOGAT activity in roots and protein. The control plants had higher values of glucose content in roots. Plotting PC1 and PC2 also revealed that, among plants treated with humates LS1, LS2, LS4, LS5, PH and LH, those treated with LH tended to be at the bottom of the cloud, and PH was at the top, along the axis 2. It should be also noted that plotting PC1 and PC3, LH (7) differed from the other treatments for high GOGAT activity in leaves.

3. Discussion

Humates can differ in composition depending on the source material and process type employed for their production. Therefore, they can show significant variation in biostimulant properties. In this study, we assayed seven humates (a commercial lignosulfonate-based product, a commercial humate extracted from leonardite, and five specialty lignosulfonates provided by Borregaard’s company) by determining their elemental content and dissecting the major functional groups occurring in their formulation. Then, in order to determine the plant-growth promoting potential of Hs, we evaluated differences in their capacity to promote plant biomass production, N assimilation into organic compounds (chlorophylls, proteins and phenols), and photosynthesis.
We found that all products were able to stimulate plant growth and the metabolic responses typically triggered by biostimulants. Therefore, untreated plants were different from plants treated with tested Hs in terms of performance, as revealed by PCA analysis. However, LS1, LS2, LS3, and LS5 appeared to be the most effective in this respect, being able to induce the greatest increments (up to 184%) of most physiological parameters (dry weight, root GS activity, GOGAT activity, RuBisCO activity) and targeted-biochemical markers (SPAD, proteins, phenols, fructose content) in maize, compared to the untreated plants. A general overview of such increments is depicted in the heat map of plant-associated parameters influenced by individual humates, reported in Figure S2. LS2 and LS3 contained a similar percent content of total C and N, as well as LS1 and LS5. The spectroscopic characteristic of all samples and especially LS2 and LS5 revealed the presence of cellulose residues and aromatic groups. LS4 and PH contained the highest percentage in aromatic groups according to the deconvolution process of FT-IR spectra, while for LS1 the functional group distribution appeared to be a mixture of the same groups observed in LS4 and PH, but with a considerable hydrophilic feature (see the band at 1632 cm−1). Therefore, the C and N composition and profile in functional groups of specialty products LS1, LS2, LS3, and LS5 could explain their better efficiency as biostimulants compared to the lignosulfonate LH.
Overall, root growth was more stimulated (+51–140%) than leaf growth by all Hs (+5–35%), with more pronounced effects observed in plants treated with LS1 and LS5. These results are in line with the current literature that reports early root growth as a typical response of plants treated with humic substances, while the stimulation of leaf growth is generally recognized as a delayed response [10,17,39]. One possible explanation of this effect is that humic substances can act on root development by influencing the hormonal balance within the plants and nitric oxide distribution, either directly or indirectly, and by modifying the nutrient uptake by plants and the activity of root membrane H+-ATPase [8,39,40]. Early root development could also be ascribed to the biological properties of humic substances, whose hormone-like activity has been previously described [41,42], and that Hs tested in this study might possess as well. Ertani et al. [17], in particular, reported the auxin-like and gibberellin-like activity of two lignosulfonates, and the gibberellin-like activity of a leonardite humic acid. The hormone-like activity of humic substances and commercial humates are likely due to their content in auxin-like substances, as well as to the presence of phenol-C groups with biological activity [43,44].
Hs were also effective in promoting N metabolism. In particular, LS1, LS2, and LS5 determined the highest increases in the activity of N assimilation enzymes, i.e., glutamine synthetase (GS) and glutamate synthase (GOGAT), in roots. This finding could explain why plants treated with these products developed their roots more. In this respect, the root dry weight of maize plants positively correlated with GS and GOGAT root activity. In general, all Hs enhanced the activity of GS and GOGAT more in roots than in leaves, which may suggest that early root growth stimulation in maize by Hs was also a result of a more pronounced N metabolism enhancement and decreased N storage. Similar findings and hypothesis have been previously reported by Jannin et al. [45]. Higher activity of N enzymes in roots might be due to metabolic changes related to differences in the root/shoot nitrate balance occurring under LH treatment [39]. In leaves, GOGAT activity was significantly stimulated by all Hs, while GS activity was stimulated by only four of them. Such differences could be ascribed to distinct mechanisms of regulation of N enzymes induced by several factors, including N metabolites (e.g., ammonium, glutamine, and glutamate) that are known to exert feedback effects [46,47,48]. In this respect, those Hs determining the highest increases in leaf protein accumulation were responsible for the least increases in GS leaf activity. Interestingly, they also stimulated the accumulation of phenolic compounds as the other Hs, but to a less extent. This observation seems to suggest that when plants are treated with Hs, two preferential metabolic pathways can be mainly stimulated, i.e., the N primary metabolism that produces proteins and the secondary metabolism involved in the synthesis of phenolics. These two metabolic pathways have been previously identified as principal targets of humic substances and other biostimulants, including lignosulfonate-humates, in maize and other plant species [17,49]. With respect to phenolic compounds, the increase in content of a number of them, especially in leaves, to levels that were not injurious to plants, can be deemed as an important result because these phytochemicals have recognized health beneficial properties, are implied in the plant defense responses against stress conditions, and mediate plant relationships with ecological partners [50,51,52,53].
The positive effects of all Hs on plant metabolism was also confirmed by the increased activity of RuBisCO, i.e., the enzyme responsible for CO2 fixation in the Calvin cycle. Indeed, measuring the RuBisCO activity allowed for knowing whether Hs stimulated the photosynthetic efficiency of plants, because higher activity generally corresponds to higher photosynthetic rates and productivity. The increased activity of RuBisCO in plants under treatment by humic substances could be due to increased number of chloroplasts per cell, as proposed by Jannin et al. [45]. RuBisCO activity positively correlated with the SPAD index values and the leaf content of reducing sugars. Similar results were previously reported by Ertani et al. [17].
In our study, we observed a reduction in glucose and fructose accumulation in roots of maize plants. Glucose is mainly produced in the cytosol from triose-phosphate precursors produced during the Calvin cycle and its accumulation in cells is influenced by different factors, like the photosynthetic rate, the need of glucose for energy-dependent processes, and the metabolic fate of the precursor glutaraldehyde 3-P (including the synthesis of starch). In roots, the level of carbohydrates depends on the source of N they receive (NO3, NH4, or amino acids), the rate of transport of photosynthates and the quantity of reserves that are stored in the root tissues. The different distribution of glucose between leaves and roots also depends on the need of the plant to use glucose in a specific organ for a metabolic requirement. The decrease of glucose in the roots, for instance, may be indicative of a high demand for ATP-dependent nutrient transport and other energy-requiring processes in the root cells, including growth processes, and could be associated with the increased need of C-skeleton for the synthesis of N compounds. A similar reasoning can be made for fructose.

4. Materials and Methods

4.1. Elemental Composition and Spectroscopic Analysis of Hs

Seven humates (Hs) were tested in this study for their biostimulant properties. All these products completely dissolved in H2O without leaving insoluble clumps. The carbon (C), nitrogen (N), and sulfur (S) contents of Hs were determined via dry combustion conducted in the element analyzer vario MACRO CNS (Hanau, Germany).
The Fourier transform infrared (FTIR) spectra of these products were recorded using an ALPHA FTIR spectrometer (Bruker Optics, Ettlingen, Germany) equipped with an ATR (attenuated total reflectance) sampling device containing diamond crystals. The absorbance spectra were recorded between 4000 cm−1 and 400 cm−1, at a spectral resolution of 4 cm−1, with 64 scans co-added and averaged. A background spectrum of air was recorded under the same procedure conditions before each series of measurements. Spectra were processed with the Grams/386 spectroscopic software (version 6.00, Galactic Industries Corporation, Salem, NH). Overlapping peaks were resolved using a peak fitting analysis in the spectral region from 1800 to 1000 cm−1 by using the Grams/386 spectroscopic software (version 6.00, Galactic Industries Corporation, Salem, NH). The overlapping bands were resolved with a Gaussian function. The best fitting parameters were determined by minimization of the reduced Chi square (χ2). Good agreement between experimental and calculated profiles was obtained, with coefficients of determination, R2, ranging from 0.999 to 0.988 and the standard error, SE, from 0.001 to 0.003. All data are expressed as percentage area.
FT-Raman spectra of Hs were recorded in solid state with a Multiram FT-Raman spectrometer (Bruker Optics, Ettlingen, Germany) equipped with a cooled Ge-diode detector. The excitation source was a Nd-YAG laser (1.064 nm, about 30 mW laser power on the sample) in the backscattering (180°) configuration. The low laser power was due to the brown color of the samples, which burned out using a higher laser power. As a consequence of burning, it was possible to record only the spectra of LS2 and LS5.

4.2. Plant Material and Experimental Design

Seeds of Zea mays L. (P1921, Pioneer HI-BRED, Italia Sementi S.r.l.) were soaked in distilled water overnight and then surface-sterilized in 5% (v/v) sodium hypochlorite for 10 min while shaking. Seeds were germinated on filter paper wetted with distilled water for 60 h in the dark at 25 °C. Seedlings were then transferred into 3 L pots in the presence of a thoroughly aerated Hoagland solution, with a density of 24 plants per pot. The nutrient solution was renewed every 48 h and contained the following salts (μM): KH2PO4 (40), Ca(NO3)2 (200), KNO3 (200), MgSO4 (200), FeNaEDTA (10), H3BO3 (4.6), CuCl2∙2H2O (0.036), MnCl2∙4H2O (0.9), ZnCl2 (0.09), and NaMoO∙2H2O (0.01). Plants were grown inside a chamber with 14 h of light per day, in air temperatures of 21 °C (night) and 27 °C (day), at a relative humidity of 70/85%, and with a photon flux density of 280 mol m−2s−1. After twelve days of growth in hydroponics, each Hs was added in a unique application to the nutrient solution at 1 mg C L−1 (for each treatment with single Hs, 3 pots were prepared). After 48 h from the addition of Hs, plants were harvested. The choice of this short incubation time was dictated by results obtained in several previous studies, where a period of 24–48 h was found to induce early molecular responses and morpho-physiological changes in both roots and leaves. Plants that were not added with Hs served as controls (3 pots, 24 plants per pot).
At the end of the treatment, plants were randomly harvested and then carefully washed and dried with blotting paper. A sub-sample of the plant material was immediately frozen with liquid nitrogen and kept at −80 °C, to be used for biochemical analyses. For dry weight measurement, 10 plants randomly harvested were used (ten per treatment from each pot). The samples were placed in a drying oven for 2 d at 70 °C and allowed to cool for 2 h inside a closed bell jar. The dry weight of individual roots and leaves was measured for each plant.

4.3. Determination of the SPAD Index

The relative chlorophyll content was determined using a non-destructive method that employed light transmission across a leaf, at two wavelengths, to quantify the greenness and thickness of leaves. The ratio of the transmission of the two wavelengths provides a chlorophyll content index that is also named the SPAD index. The analyses were performed using a SPAD (Soil Plant Analysis Development) chlorophyll meter (SPAD-502 model, Minolta Camera Co, Ltd., Osaka, Japan) and the SPAD index was measured on the last expanded leaf of maize plants. The determination was carried out on 5 measurements per leaf from 10 plants per each treatment.

4.4. Analysis of Soluble Proteins and Reducing Sugars

For protein extraction, frozen foliar tissues (100 mg) of five plants per pot were ground in liquid nitrogen and vortexed in the presence of 5 mL buffer (100 mM Tris-HCl pH 7.5, 1 mM Na2EDTA, 5 mM DTT) and centrifuged at 14,000 g. The supernatants were mixed with 10% (w/v) trichloroacetic acid and then centrifuged. The pellets were finally re-suspended in 0.1 N NaOH. The protein concentration was determined using the Bradford method through a UV/VIS spectrophotometer (Lambda 1, Perkin-Elmer, Monza, Italy) at λ = 595 nm. Protein concentration was expressed as mg of protein g−1 fresh weight (FW).
For reducing sugar analysis, foliar tissues (100 mg) of five plants per pot were dried for 48 h at 80 °C, ground to obtain a fine powder, and then extracted with 2.5 mL 0.1 N H2SO4. Samples were incubated in a heating block for 40 min at 60 °C and then centrifuged at 6000 g for 10 min at 4 °C. Supernatants were filtrated (0.2 μm, Membra-Fil® Whatman Brand, Whatman, Milan, Italy) and further analyzed via HPLC (Perkin Elmer 410). Soluble sugars were separated using a Biorad Aminex 87 C column (300 × 7.8 mm) with H2O as eluent at a flow rate of 0.6 mL min−1. Sugar concentration was expressed as mg g−1 dry weight (DW).

4.5. Analysis of Total and Individual Phenolic Compounds

The content of total phenols in plant samples was quantified using the Folin–Ciocalteu method. For individual phenol detection, extraction from frozen plant material of five plants (1 plant = 1 biological replicate) was performed using water/methanol (1:1 v/v), filtered at 0.45 μm. Phenols were separated via an HPLC 2700 (Thermo Finnigan, San Jose, CA, USA) coupled with an 1806 UV/Vis (Thermo Finnigan, San Jose, CA, USA) detector. The column was a TM-LC 18 (Supelcosil) equipped with pre-column TM-LC 18 (Pelliguard, Supelco). Elution was conducted at a flow rate of 1.2 mL min−1 using a mixture of water/ n-butanol/ acetic acid (80.5:18:1.5 v/v) as the mobile phase. The injection volume of each sample was 20 μL. Detection was performed at λ = 275 nm and the identification of compounds was obtained by comparison of their retention time values with those of corresponding standards. The calibration curve and quantification were performed considering the relationship between peak areas vs. standard concentrations at four concentrations (n = 4). A linear fitting with an R squared value of (R2) = 0.99 was obtained.

4.6. Determination of GS, GOGAT and RuBisCO Activity

For the assay of glutamine synthetase (GS) and glutamate synthase (GOGAT) enzyme activity, fresh root and leaf tissues (1 g) were ground in a mortar with 10 mL of 100 mM Hepes-NaOH solution at pH 7.5, 5 mM MgCl2 solution, and 1 mM dithiothreitol. For the RuBisCO enzyme, the extraction protocol was the same as for GS and GOGAT, but the enzyme activity in this case was measured in leaves only and the ratio of plant material to buffer was 1:3 (w/v). The extracts were filtered through two layers of muslin and centrifuged at 20,000 g for 15 min at 4 °C. The supernatants were used for enzymatic assays.
For the glutamine synthetase (GS EC 6.3.1.2) assay, each mixture contained 90 mM imidazole-HCl (pH 7.0), 60 mM hydroxylamine (neutralized), 20 mM KAsO4, 3 mM MnCl2, 0.4 mM ADP, 120 mM glutamine, and enzyme extract. The assay was performed in a final volume of 750 μL. The enzymatic reaction was developed for 15 min at 37 °C. The α-glutamyl hydroxamate was colorimetrically determined by addition of 250 μL of a mixture (1:1:1) of 10% (w/v) FeCl3∙6H2O in 0.2 M HCl, 24% (w/v) trichloroacetic acid and 50% (w/v) HCl. The optical density was measured at λ = 540 nm. Enzyme activity was expressed in µmol−1 g−1 FW, representing the amount of enzyme catalyzing the formation of 1 nmole γ-glutamyl-hydroxamate min−1.
The glutamate synthase (GOGAT EC 1.4.7.1) assay contained 25 mM Hepes-NaOH (pH 7.5), 2 mM L glutamine, 1 mM α-ketoglutaric acid, 0.1 mM NADH, 1 mM Na2EDTA, and 100 μL of enzyme extract. GOGAT activity was measured spectrophotometrically by monitoring NADH oxidation at λ = 340 nm. The enzyme activity was expressed in µmol−1 g−1 FW, representing the amount of enzyme catalyzing the oxidation of 1 nmole NADH min−1.
The activity of RuBisCO (EC 4.1.1.39) was determined spectrophotometrically in a coupled assay by measuring the production of 3-phosphoglycerate following a 5 min period of incubation with 2 mL of 10 mM MgCl2 and 20 mM NaHCO3 [54].
For each enzyme activity assay, analyses were conducted in three biological replicates (1 plant = 1 biological replicate) per treatment and the absorbance in the samples was measured using a JASCO V-530 UV/VIS spectrophotometer.

4.7. Statistical Analysis

For all determinations, the analysis of variance (ANOVA) was performed using the SPSS software version 19.0 (SPSS Inc. 1999), which was followed by pair-wise post hoc analyses (Student–Newman–Keuls test) to determine which means differed significantly at p < 0.05 (±SD). The number of biological replicates varied depending on the analysis performed and is indicated in the figure and table legends. Correlations between variables were determined using Pearson’s coefficient. To identify the structure of the interdependences between the main parameters, a joint principal component analysis (PCA) was performed on the following variables, considering both untreated plants (control) and plants treated with the different humates: Root dry weight, leaf dry weight, SPAD, proteins, total phenols, leaf GS, root GS, leaf GOGAT, root GOGAT, RuBisCO, leaf glucose, leaf fructose, root glucose, and root glucose. The standardized variables were subjected to PCA. Rotated orthogonal components (varimax method of rotation) were extracted and the relative scores were determined. Only PCs with an eigenvalue > 1 were considered for the discussion. Statistics were performed using SPSS software version 25.0 (SPSS, Chicago, IL).

5. Conclusions

In conclusion, the current study provides clear evidence that all tested products acted as biostimulants. Additionally, the specialty lignosulfonates provided by Borregaard’s company were apparently the most effective in this role, likely because of the novel process employed for their production and the products’ chemical features (e.g., different C content values and presence of functional groups). These results support the importance of setting up new technologies and advanced industrial processes for the production of novel commercial humates and lignosulfonates with better formulation performance, which can be used as efficient biostimulants during crop cultivation in the framework of sustainable agriculture. Future studies could be performed in field trials and using other crop species, including horticultural crops, to definitely confirm the positive characteristics of these products under varying and/or stress conditions.

Supplementary Materials

The following are available online at https://www.mdpi.com/2073-4395/9/8/445/s1, Table S1: Correlations between variables determined using Pearson’s coefficient. Asterisks indicate significant correlation at p < 0.05 (*) or p < 0.01 (**). r = root, l = leaf, dw = dry weight, TP = total phenols, GS = glutamine synthetase, GOGAT = glutamate synthase, FRU = fructose, GLU = glucose, PROT = proteins, Table S2: Loadings values of the plant variables on the axes identified by principal components (PC) analysis for the different types of treatment and control. r = root, l = leaf, dw = dry weight, TP = total phenols, GS = glutamine synthetase, GOGAT = glutamate synthase, FRU = fructose, GLU = glucose, PROT = proteins. Figure S1: Position of the treated and untreated plants (1 = LS1, 2 = LS2, 3 = LS3, 4 = LS4, 5 = LS5, 6 = PH, 7 = LH, and 8 = control) in the reduced space of the first two principal components (PC1 and PC2) (A) and on PC1 and PC3 (B); variables projected in the plane determined by PC1 and PC2 (D) and PC1 and PC3 (C). r = root, l = leaf, dw = dry weight, TP = total phenols, GS = glutamine synthetase, GOGAT = glutamate synthase, FRU = fructose, GLU = glucose, PROT = proteins, Figure S2: Heat map of plant-associated parameters influenced by individual humates. Different colors indicate different levels of induction/repression (more red more repression, more blue more induction). r = root, l = leaf, dw = dry weight, TP = total phenols, GS = glutamine synthetase, GOGAT = glutamate synthase, FRU = fructose, GLU = glucose, PROT = protein.

Author Contributions

O.F. and A.T. performed the spectroscopic analysis and wrote the relative part in the ms; A.E. performed the physiological analyses, bioassays and chemical analyses of the products and wrote the ms; M.S. wrote the ms; D.P. critically read the ms and performed the statistical analyses of data; S.N. designed the study. All the authors critically reviewed the ms.

Funding

This study was funded by Borregaard (Hjalmar Wessels vei, Sarpsborg, Norway).

Acknowledgments

We would like to thank Federica Zanellato for the precious help in conducting the physiological analyses.

Conflicts of Interest

The authors declare no conflict of interest.

References

  1. Karamesouti, M.; Detsis, V.; Kounalaki, A.; Vasiliou, P.; Salvati, L.; Kosmas, C. Land-use and land degradation processes affecting soil resources: Evidence from a traditional Mediterranean cropland. Catena 2015, 132, 45–55. [Google Scholar] [CrossRef]
  2. Shaviv, A.; Mikkelsen, R.L. Controlled-release fertilizers to increase efficiency of nutrient use and minimize environmental degradation-A review. Fertil. Res. 1993, 35, 1–12. [Google Scholar] [CrossRef]
  3. Trivedi, P.; Delgado-Baquerizo, M.; Anderson, I.C.; Singh, B.K. Response of soil properties and microbial communities to agriculture: Implications for primary productivity and soil health indicators. Front. Plant Sci. 2016, 7, 990. [Google Scholar] [CrossRef] [PubMed]
  4. Canellas, L.P.; Olivares, F.L.; Aguiar, N.O.; Jones, D.; Nebbioso, A.; Mazzei, P.; Piccolo, A. Humic and fulvic acids as biostimulants in horticulture. Sci. Hortic. 2015, 196, 15–27. [Google Scholar] [CrossRef]
  5. Yakhin, O.I.; Lubyanov, A.A.; Yakhin, I.A.; Brown, P.H. Biostimulants in Plant Science: A Global Perspective. Front. Plant Sci. 2017, 7, 2049. [Google Scholar] [CrossRef] [PubMed] [Green Version]
  6. Colla, G.; Nardi, S.; Cardarelli, M.; Ertani, A.; Lucini, L.; Canaguier, R.; Rouphael, Y. Protein hydrolysates as biostimulants in horticulture. Sci. Hortic. 2015, 196, 28–38. [Google Scholar] [CrossRef]
  7. Nardi, S.; Pizzeghello, D.; Schiavon, M.; Ertani, A. Plant biostimulants: Physiological responses induced by protein hydrolyzed-based products and humic substances in plant metabolism. Sci. Agric. 2016, 73, 18–23. [Google Scholar] [CrossRef]
  8. Du Jardin, P. Plant biostimulants: Definition, concept, main categories and regulation. Sci. Hortic. 2015, 196, 3–14. [Google Scholar] [CrossRef] [Green Version]
  9. Calvo, P.; Nelson, L.; Kloepper, J.W. Agricultural uses of plant biostimulants. Plant Soil 2014, 383, 3–41. [Google Scholar] [CrossRef] [Green Version]
  10. Nardi, S.; Carletti, P.; Pizzeghello, D.; Muscolo, A. Biological activities of humic substances. In Biophysico-Chemical Processes Involving Natural Nonliving Organic Matter in Environmental Systems; Part, I. Fundamentals and Impact of Mineral-Organic-Biota Interactions on the Formation, Transformation, Turnover, and Storage of Natural Nonliving Organic Matter (NOM); Senesi, N., Xing, B., Huang, P.M., Eds.; John Wiley & Sons: Hoboken, NJ, USA, 2009; Volume 2, pp. 305–339. [Google Scholar]
  11. Nardi, S.; Ertani, A.; Francioso, O. Soil–root cross-talking: The role of humic substances. J. Plant Nutr. Soil Sci. 2017, 180, 5–13. [Google Scholar] [CrossRef]
  12. Zandonadi, D.B.; Santos, M.P.; Dobbss, L.B.; Olivares, F.L.; Canellas, L.P.; Binzel, M.L.; Okorokova, A.L.; Façanha, A.R. Nitric oxide mediates humic acids-induced root development and plasma membrane H+-ATPase activation. Planta 2010, 231, 1025. [Google Scholar] [CrossRef]
  13. Montoneri, E.; Adani, F.; Genevini, P.L.; Ricca, G.; Cherubini, S.; Spitaleri, C. Polyalkylphenyl-sulphonic acids with acid groups of variable strength from animal-vegetable wastes. Waste Manag. 2004, 24, 513–522. [Google Scholar] [CrossRef]
  14. Gargulak, J.D.; Lebo, S.E. Commercial use of lignin-based materials. In Lignin: Historical, Biological and Haterials Perspectives; Glass, W.G., Northey, R.A., Schultz, T.P., Eds.; ACS Symposium Series 742; American Chemical Society: Washington, DC, USA, 2000; Volume 15, pp. 2–559. [Google Scholar]
  15. Lutnaes, B.F.; Myrvold, B.O.; Lauten, R.A.; Endeshaw, M.M. 1H and 13C NMR data of benzylsulfonic acids model compounds for lignosulfonate. Magn. Reson. Chem. 2008, 46, 299–305. [Google Scholar] [CrossRef]
  16. McGovern, J.N. Pulp and Paper: Chemistry and Chemical Technology, 3rd ed.; Casey, J.P., Ed.; Wiley: New York, NY, USA, 1980; Volume 4. [Google Scholar]
  17. Ertani, A.; Francioso, O.; Tugnoli, V.; Righi, V.; Nardi, S. Effect of commercial lignosulfonate-humate on Zea mays L. metabolism. J. Agric. Food Chem. 2011, 59, 11940–11948. [Google Scholar] [CrossRef]
  18. Matsushita, Y. Conversion of technical lignins to functional materials with retained polymeric properties. J. Wood Sci. 2015, 61, 230–250. [Google Scholar] [CrossRef] [Green Version]
  19. Cieschi, M.T.; Lucena, J.J. Iron and Humic Acid Accumulation on Soybean Roots Fertilized with Leonardite Iron Humates under Calcareous Conditions. J. Agric. Food Chem. 2018, 66, 13386–13396. [Google Scholar] [CrossRef]
  20. Kovács, K.; Czech, V.; Fodor, F.; Solti, A.; Lucena, J.J.; Santos-Rosell, S.; Hernández-Apaolaza, L. Characterization of Fe-Leonardite complexes as novel natural iron fertilizers. J. Agric. Food Chem. 2013, 61, 12200–12210. [Google Scholar] [CrossRef]
  21. Aguirre, E.; Leménager, D.; Bacaicoa, E.; Fuentes, M.; Baigiorri, R.; Zamarreño, A.M.; García-Mina, J.M. The root application of a purified leonardite humic acid modifies the transcriptional regulation of the main physiological root responses to Fe deficiency in Fe-sufficient cucumber plants. Plant Physiol. Biochem. 2009, 47, 215–223. [Google Scholar] [CrossRef]
  22. Kulikova, N.A.; Stepanova, E.V.; Koroleva, O.V. Mitigating activity of humic substances: Direct influence on biota. In Use of Humic Substances to Remediate Polluted Environments: From Theory to Practice; Springer: Dordrecht, The Netherlands, 2005; pp. 285–309. [Google Scholar]
  23. Billingham, K. Humic products potential or presumption for agriculture? Can humic products improve my soil? In Proceedings of the 27th Annual Conference of the Grassland Society of NSW Inc., Orange, NSW, Australia, 24–26 July 2012; Harris, C., Lodge, G., Waters, C., Eds.; Grassland Society of NSW Inc.: Wagga, Australia, 2012; pp. 43–50. [Google Scholar]
  24. Mikkelsen, R.L. Humic materials for agriculture. Better Crop 2005, 89, 6–10. [Google Scholar]
  25. Lobartini, J.C.; Tan, K.H.; Rema, J.A.; Gingle, A.R.; Pape, C.; Himmelsbach, D.S. The geochemical nature and agricultural importance of commercial humic matter. Sci. Total Environ. 1992, 113, 1–15. [Google Scholar] [CrossRef]
  26. Gaur, A.C.; Bhardwaj, K.K.R. Influence of sodium humate on the crop plants inoculated with bacteria of agricultural importance. Plant Soil 1971, 35, 613–621. [Google Scholar] [CrossRef]
  27. Mora, V.; Bacaicoa, E.; Baigorri, R.; Zamarreno, A.M.; Garcia-Mina, J.M. NO and IAA key regulators in the shoot growth promoting action of humic acid in Cucumis sativus L. J. Plant Growth Regul. 2014, 33, 430–439. [Google Scholar] [CrossRef]
  28. Iakimenko, O.S. Commercial humates from coal and their influence on soil properties and initial plant development. In Use of Humic Substances to Remediate Polluted Environments: From Theory to Practice; Springer: Dordrecht, The Netherlands, 2005; pp. 365–378. [Google Scholar]
  29. Schulz, H.; Baranska, M. Identification and quantification of valuable plant substances by IR and Raman spectroscopy. Vib. Spectrosc. 2007, 43, 13–25. [Google Scholar] [CrossRef]
  30. Suganuma, S.; Nakajima, K.; Kitano, M.; Yamaguchi, D.; Kato, H.; Hayashiet, S. Hydrolysis of cellulose by amorphous carbon bearing SO3H, COOH, and OH groups. J. Am. Chem. Soc. 2008, 130, 12787–12793. [Google Scholar] [CrossRef]
  31. Semwal, S.; Gaur, R.; Mukherjee, S.; Chopra, A.; Gupta, R.P.; Kumar, R.; Tuli, D.K. Structural features of dilute acid pretreated Acacia mangium and impact of sodium sulfite supplementation on enzymatic hydrolysis. Sustain. Chem. Eng. 2016, 4, 4635–4644. [Google Scholar] [CrossRef]
  32. Nadji, H.; Diouf, P.N.; Benaboura, A.; Bedard, Y.; Riedl, B.; Stevanovic, T. Comparative study of lignins isolated from Alfa grass (Stipa tenacissima L.). Bioresour. Technol. 2009, 100, 3585–3592. [Google Scholar] [CrossRef]
  33. Hsu, T.C.; Guo, G.L.; Chen, W.H.; Hwang, W.S. Effect of dilute acid pretreatment of rice straw on structural properties and enzymatic hydrolysis. Bioresour. Technol. 2010, 101, 4907–4913. [Google Scholar] [CrossRef]
  34. Hergert, H.L. Infrared spectra, In Lignins: Occurrence, Formation, Structure and Reactions; Sarkanen, K.V., Ludwig, C.H., Eds.; John Wiley & Sons, Inc.: New York, NY, USA, 1971; pp. 267–296. [Google Scholar]
  35. Ozgenc, O.; Durmaz, S.; Hakki Boyaci, I.; Eksi-Kocak, H. Determination of chemical changes in heat-treated wood using ATR-FTIR and FT Raman spectrometry. Spectrochim. Acta Part A Mol. Biomol. Spectrosc. 2017, 171, 395–400. [Google Scholar] [CrossRef]
  36. Séné, C.; McCann, M.C.; Wilson, R.H.; Crinter, R. Fourier-Transform Raman and Fourier-Transform lnfrared Spectroscopy. Plant Physiol. 1994, 106, 1623–1631. [Google Scholar]
  37. Synytsya, A.; Bleha, R.; Synytsya, A.; Pohl, R.; Hayashi, K.; Yoshinaga, K.; Nakano, T.; Hayashi, T. Mekabu fucoidan: Structural complexity and defensive effects against avian influenza A viruses. Carbohydr. Polym. 2014, 111, 633–644. [Google Scholar] [CrossRef]
  38. Marinval, N.; Saboural, P.; Haddad, O.; Maire, M.; Bassand, K.; Geinguenaud, F.; Djaker, N.; Ben Akrout, K.; Lamy de la Chapelle, M.; Robert, R.; et al. Identification of a pro-angiogenic potential and cellular uptake mechanism of a LMW highly sulfated fraction of fucoidan from Ascophyllum nodosum. Mar. Drugs 2016, 14, 185. [Google Scholar] [CrossRef]
  39. Mora, V.; Baigorri, R.; Bacaicoa, E.; Zamarrenõ, A.M.; García-Mina, J.M. The humic acid induced changes in the root concentration of nitric oxide, IAA and ethylene do not explain the changes in root architecture caused by humic acid in cucumber. Environ. Exp. Bot. 2012, 76, 24–32. [Google Scholar] [CrossRef]
  40. Mora, V.; Bacaicoa, E.; Zamarrenõ, A.M.; Aguirre, E.; Garnica, M.; Fuentes, M.; García-Mina, J.M. Action of humic acid on promotion of cucumber shoot growth involves nitrate-related changes associated with the root-to-shoot distribution of cytokinins, polyamines and mineral nutrients. J. Plant Physiol. 2010, 167, 633–642. [Google Scholar] [CrossRef]
  41. Pizzeghello, D.; Nicolini, G.; Nardi, S. Hormone-like activity of humic substances in Fagus sylvaticae L. forests. New Phytol. 2001, 151, 647–657. [Google Scholar] [CrossRef]
  42. Muscolo, A.; Sidari, M.; Francioso, O.; Tugnoli, V.; Nardi, S. The auxin-like activity of humic substances is related to membrane interactions in carrot cell cultures. J. Chem. Ecol. 2007, 33, 115–129. [Google Scholar] [CrossRef]
  43. Pizzeghello, D.; Zanella, A.; Carletti, P.; Nardi, S. Chemical and biochemical characterization of dissolved organic matter from Silver fir and beech forest soils. Chemosphere 2006, 65, 190–200. [Google Scholar] [CrossRef]
  44. Muscolo, A.; Sidari, M.; Attinà, E.; Francioso, O.; Tugnoli, V.; Nardi, S. Biological activity of humic substances is related to their chemical structure. Soil Sci. Soc. Am. J. 2007, 71, 75–85. [Google Scholar] [CrossRef]
  45. Jannin, L.; Arkoun, M.; Ourry, A.; Laîné, P.; Goux, D.; Garnica, M.; Fuentes, M.; San Francisco, S.; Baigorri, R.; Cruz, F.; et al. Microarray analysis of humic acid effects on Brassica napus growth: Involvement of N, C and S metabolisms. Plant Soil 2012, 359, 297–319. [Google Scholar] [CrossRef]
  46. Vance, C.P.; Gantt, J.S. Control of nitrogen and carbon metabolism in root nodules. Physiol. Plant. 1992, 85, 266–274. [Google Scholar] [CrossRef]
  47. Forde, B.G. Nitrate transporters in plants: Structure, function and regulation. BBA-Biomembr. 2000, 1465, 219–235. [Google Scholar] [CrossRef]
  48. Wang, M.; Shen, Q.; Xu, G.; Guo, S. New insight into the strategy for nitrogen metabolism in plant cells. Int. Rev. Cell Mol. Biol. 2014, 310, 1–37. [Google Scholar]
  49. Ertani, A.; Schiavon, M.; Nardi, S. Transcriptome-wide identification of differentially expressed genes in Solanum lycopersicon L. in response to an alfalfa-protein hydrolysate using microarrays. Front. Plant Sci. 2017, 8, 1159. [Google Scholar] [CrossRef]
  50. Lattanzio, V.; Lattanzio, V.M.T.; Cardinali, A. Role of phenolics in the resistance mechanisms of plants against fungal pathogens and insects. In Phytochemistry Advances in Research; Imperato, F., Ed.; Research Signpost: Kerala, India, 2006; pp. 23–67. [Google Scholar]
  51. Vermerris, W.; Nicholson, R. Phenolic compound biochemistry. In The Role of Phenols in Plant Defense; Springer: Dordrecht, The Netherlands, 2006; pp. 211–234. [Google Scholar]
  52. Chen, F.; Tholl, D.; Bohlmann, J.; Pichersky, E. The family of terpene synthases in plants: A mid-size family of genes for specialized metabolism that is highly diversified throughout the kingdom. Plant J. 2011, 66, 212–229. [Google Scholar] [CrossRef]
  53. Zhang, F.P.; Yang, Q.Y.; Zhang, S.B. Dual effect of phenolic nectar on three floral visitors of Elsholtzia rugulosa (Lamiaceae) in SW China. PLoS ONE 2016, 11, e0154381. [Google Scholar] [CrossRef]
  54. Di Marco, G.; D’Ambrosio, N.; Giardi, M.T.; Massacci, A.; Tricoli, D. Photosynthetic properties of leaves of a yellow green mutant of wheat compared to its wild type. Photosynth. Res. 1989, 21, 117–122. [Google Scholar]
Figure 1. FTIR histograms of humates (Hs) peak areas processes by using curve fitting (from 1800 to 1370 cm−1).
Agronomy 09 00445 g001
Figure 2. FT-RAMAN spectra of lignosulfonates LS2 and LS5.
Agronomy 09 00445 g002
Figure 3. Effect of individual humates (Hs) on leaf (A) and root (B) dry weight of Z. mays L. plants. Twelve-day-old plants were supplied for two days with Hs at 1 mg C L−1. Different letters above bars indicate significant differences at p < 0.05, according to the Student–Newman–Keuls test. Data represent the means of three measurements with ten plants in each (±SD). C = control; LH = commercial lignosulfonate-based product; PH = commercial humate extracted from leonardite; LS1 − LS5 = specialty lignosulfonates.
Agronomy 09 00445 g003
Figure 4. Effect of humates (Hs) on SPAD index (A), RuBisCO activity (B), protein content (C), and total phenolic compounds (D) in leaves of Z. mays L. plants. Twelve-day-old plants were supplied with Hs at 1 mg C L−1 for two days. Different letters above bars indicate significant differences at p < 0.05, according to Student–Newman–Keuls test. Data represent the means of three measurements with three plants in each (±SD). C = control; LH = commercial lignosulfonate-based product; PH = commercial humate extracted from leonardite; LS1-LS5= specialty lignosulfonates.
Agronomy 09 00445 g004
Figure 5. Effect of humates (Hs) on glutamine synthetase (GS) and glutamate synthase (GOGAT) activity in leaves (A, B, respectively) and roots (C, D, respectively) of Z. mays L. plants. Twelve-day-old plants were supplied with Hs at 1 mg C L−1 for two days. Different letters above bars indicate significant differences at p < 0.05, according to the Student–Newman–Keuls test. Data represent the means of three measurements with three plants in each (±SD). C = control; LH = commercial lignosulfonate-based product; PH = commercial humate extracted from leonardite; LS1 − LS5 = specialty lignosulfonates.
Agronomy 09 00445 g005
Figure 6. Effect of individual humates (Hs) on glucose and fructose accumulation in leaves (A) and roots (B) of Z. mays L. plants. Twelve-day-old plants were supplied with Hs at 1 mg C L−1 for two days. Different letters above bars (un-bolded for glucose and bolded for fructose) indicate significant differences at p < 0.05, according to the Student–Newman–Keuls test. Data represent the means of three measurements with three plants in each (±SD). C = control; LH = commercial lignosulfonate-based product; PH = commercial humate extracted from leonardite; LS1 − LS5 = specialty lignosulfonates.
Agronomy 09 00445 g006
Table 1. Elemental analysis of carbon (C), nitrogen (N), and sulfur (S) in the different humates.
ProductCNS
% (w/w)
LS154.56 ± 1.022.18 ± 0.135.56 ± 0.34
LS241.08 ± 1.101.70 ± 0.156.12 ± 0.40
LS341.28 ± 1.321.95 ± 0.215.49 ± 0.12
LS437.11 ± 1.151.58 ± 0.177.83 ± 0.21
LS548.15 ± 1.502.12 ± 0.135.13 ± 0.34
PH38.05 ± 1.011.67 ± 0.201.30 ± 0.23
LH33.04 ± 1.141.64 ± 0.225.33 ± 0.31
Table 2. Main bands observed in the Raman spectra of humates LS2 and LS5. S = strong; m = medium; w = weak; v = very; sh = shoulder.
AttributionsLS2LS5
OH stretching 3490 w3490 vw
OH stretching 3250 w3250 w
Aromatic CH stretching 3070 w3070 vw
Aliphatic CH stretching 2940 m2940 w
Aliphatic CH stretching 2846 m–w2846 m–w
1670 conjugated C=O 1670 w. sh1670 w. sh
Phenolic peak 1633 s. sh
Aryl ring stretch, symmetric (lignin); Phenolic peak1604 vs1604 s
Car-H in plane bend, CO(H) str.About 1500 vw. shAbout 1500 w. sh
CH3 bending in OCH3 (lignin and carbohydrates)1460m–w1460 vw
C-H bend in R3C-H (cellulose)1370 m1370 m
Aliphatic O-H bend (cellulose) 1330 m
Sulfate group, asymmetric stretching1284 m1284 m
Phenol (lignin)1190 m–w1190 m–w
C-C skeletal mode OCH3 loop rocking1157 w. sh1157 w. sh
Sulfate group, symmetric stretching 1082 w. sh1082 m–w. sh
OC(H3) stretching and rocking 1045 m1045 m
H-C-C and H-C-O bending at C6 (cellulose)898 w898 m
bending of primary C6-O-S 815 m815 m
Table 3. Profile of phenolic compounds in leaves and roots of Z. mays L. Plants were grown for 12 days in a nutrient solution and supplied with individual humates at 1 mg C L−1 for two days. n. d. = not detectable. Values along the same column following by different letters are statistically different at p < 0.05 (n = 3, ± SD) according to Student–Newman–Keuls test. C= control; LH = commercial lignosulfonate-based product; PH = commercial humate extracted from leonardite; LS1−LS5= specialty lignosulfonates.
ChlorogenicCaffeicp-CumaricFerulicp-Hydroxybenzoic
Leaves (mg k1 FW)
C30.29± 4.11e0.52± 0.02d1.28± 0.05d0.58± 0.02c16.32± 0.13e
LS167.65± 8.54b1.41± 0.02c3.02± 0.05a3.32± 0.03a47.88± 3.45a
LS281.13± 12.37a3.90± 0.02a1.33± 0.03c2.48± 0.06a46.88± 5.33a
LS351.24± 6.32c1.34± 0.05c2.61± 0.06b1.87± 0.07b30.04± 7.34c
LS485.98± 7.10a1.88± 0.05b2.41± 0.07b4.13± 0.05a49.24± 6.13a
LS557.10± 10.22c1.47± 0.01c2.35± 0.05b1.24± 0.05b39.94± 5.28b
PH34.09± 5.13d0.72± 0.02d3.09± 0.07a1.22± 0.05b40.69± 6.13b
LH37.48± 5.08d0.92± 0.03d2.03± 0.03c0.72± 0.03c24.78± 5.13d
Roots (mg kg1 FW)
C3.54± 0.12cn.d.5.71± 0.30b0.58± 0.01c29.97± 4.14a
LS13.56± 0.11cn.d.1.04± 0.62c3.09± 0.03a3.65± 0.84d
LS26.05± 0.13an.d.3.16± 0.61b2.86± 0.05a11.57± 3.12c
LS33.44± 0.12cn.d.6.29± 0.82a0.85± 0.03c21.07± 2.34b
LS45.67± 0.23bn.d.5.10± 0.72b1.12± 0.03b19.46± 4.13b
LS57.61± 0.14an.d.4.89± 0.53b1.69± 0.05b24.39± 6.81b
PH7.54± 0.17an.d.6.46± 0.52a2.65± 0.05a31.12± 5.68a
LH3.48± 0.18cn.d.6.15± 0.51a0.75± 0.01c20.29± 3.12b

