Communication

Greater Nitrogen Availability, Nitrous Oxide Emissions, and Vegetable Yields with Fall-Applied Chicken Relative to Horse Manure

1
Soil and Water Sciences Department, University of Florida, Gainesville, FL 32611, USA
2
Faculty of Land and Food Systems, University of British Columbia, Vancouver, BC V6T 1Z4, Canada
*
Author to whom correspondence should be addressed.
Agronomy 2019, 9(8), 444; https://doi.org/10.3390/agronomy9080444
Submission received: 21 June 2019 / Revised: 2 August 2019 / Accepted: 9 August 2019 / Published: 12 August 2019
(This article belongs to the Section Soil and Plant Nutrition)

Abstract

:
Optimal manure management can maximize agronomic benefits and minimize environmental impacts. Field experiments were conducted in the Pacific Northwest (Vancouver, Canada) to determine how chicken and horse manures that were fall-applied to meet nitrogen crop demand affect soil ammonium (NH4+) and nitrate (NO3), apparent net mineralization (ANM) and nitrification (ANN), crop biomass and nutrient concentration, and fluxes of nitrous oxide (N2O), carbon dioxide (CO2), and methane (CH4). Relative to horse manure, chicken manure increased soil NH4+ by 60-fold, ANM by 2-fold, and ANN by 4-fold. Emissions of N2O (+600%) and CO2 (+45%) were greater and growing season CO2 emissions (−40%) were lower after application of chicken than horse manure. Productivity of cover crop (+30%), legume cover crop (−25%), and squash cash crop (+20%) were affected by chicken relative to horse manure. Overall, fall-applied chicken manure increased yields, N availability, and environmental impacts relative to horse manure.

1. Introduction

Proper management of manures in agricultural systems recycles nutrients, maintains crop productivity, and increases soil organic matter (SOM), which improves water holding capacity and reduces soil erosion [1]. Manure applications can also lead to excessive nitrogen (N) inputs that increase N leaching and/or runoff [2], greenhouse gas (GHG) emissions [3], and potentially soil salinity [4]. Thus, manures must be managed optimally to maximize agronomic benefits and minimize environmental impacts.
The fraction of manure N that is plant-available N (PAN) is key to manure management because most N in solid manures consists of organic forms that must be converted to ammonium (NH4+) or nitrate (NO3) prior to crop uptake [5]. This can be estimated with the carbon to nitrogen (C:N) ratio [6], although other variables (e.g., the chemical species for carbon (C) and N in manures) can be better predictors of the magnitude and timing of N mineralization [5]. However, as N release from organic sources is often decoupled from plant N demand [7], total N inputs typically exceed crop N requirement to maintain yields, which increases the potential for N losses [2]. Applying manures to match crop N demand can also lead to P overfertilization [8] and soil P loss [1] because manures are enriched in P relative to crop N needs [9].
Applying N-rich manures to soils typically increases nitrous oxide (N2O) emissions, with nitrification and denitrification as the main N2O sources in coarse- and fine-textured soils, respectively [10]. The N2O emission factor (EF) is typically lower in manures vs. fertilizers and in solid vs. liquid manures [11]. Manure mineralization increases organic N release [12] and carbon dioxide (CO2) emissions [13], although only a fraction of organic C inputs from manure is mineralized in the short-term, resulting in a net accumulation of SOM [4]. Solid manures have a negligible impact on soil methane (CH4) fluxes [3], likely because most agricultural soils are well aerated.
Spring manure application can maximize nutrient uptake by summer cash crops, but it requires adequate winter storage infrastructure and early applications to ensure sufficient mineralization and pathogen reduction. In climates with a mild winter (e.g., the Pacific Northwest), fall manure application could help reduce storage requirements, address the challenges of application timing, reduce N2O emissions via lower soil temperatures, and enable farmers earlier planting opportunities in the spring by allowing for the regulatory 120-day period between manure application and harvest of crops whose edible portion is in direct contact with soils. However, it may increase nutrient losses via leaching when precipitation in fall and winter is high [14]. Matching manure N inputs with the expected uptake from a winter cover crop may reduce environmental impacts (especially with non-legume cover crops) and improve N availability for the summer cash crop [14,15,16]. High C:N ratio (>25:1) manures may limit N losses via N immobilization that would reduce soil residual N, but spring mineralization of this immobilized N must be synchronized with subsequent crop uptake for this to be an effective soil N management practice [7,17,18]. Low soil N resulting from immobilization may also promote N-fixation from legume cover crops [19], although the latter may increase N leaching compared to non-legumes [15].
The objective of this study was to quantify the effects of a fall application of chicken (N-rich) and horse (C-rich) manures on crop productivity, soil N availability, and GHG emissions in organic vegetable production of the lower Fraser Valley (British Columbia, Canada). This area has the highest density of livestock in Canada, 80% of chicken production in the province of British Columbia, and a high density of horse stables. Thus, it is critical to identify optimal manure management in this area with substantial nutrient surpluses due to animal production, limited cropland area for manure application, and aquifers that are vulnerable to nitrate contamination.
We hypothesized that N-rich chicken manure would increase cereal dominance in cover crops, N availability and N cycling rates, and GHG emissions. In contrast, horse manure was expected to reduce fall N losses and GHG emissions, increase legume dominance in cover crops, and immobilize N. Cash crop yields were expected to be similar with both manures via greater spring N mineralization with horse manure.

2. Materials and Methods

2.1. Experimental Setup

A field experiment was established at the University of British Columbia (UBC) farm (Vancouver, Canada), a mature certified organic farm where sandy soils (Typic Haplorthod) are high in SOM (>9%). The climate is typical of the Pacific Northwest (Figure 1). Mean daily temperature was 11.3 °C during the experiment (2 October 2015 to 5 October 2016) with a range from −2 °C (2 January 2016) to 21.3 °C (19 August 2016) and five consecutive freezing days from 30 December 2015 until 3 Jan. 2016. Total rainfall was 1255 mm: 997 mm during the cover-cropping season (roughly seven months from 2 October 2015 until 26 April 2016) and 258 mm for the growing season (roughly five months from 27 April 2016 until 7 October 2016).
The experiment was designed to provide the total N demand (200 kg N/ha) of spaghetti squash (Cucurbita pepo L.) with two amendment applications based on estimated PAN values: 100 kg PAN/ha supplied by fall-applied chicken or horse manures and 100 kg PAN/ha with spring-applied municipal compost. Due to space constraints, there were no control check plots, which reflects common practices among small-scale organic vegetable farmers in the area that always add organic amendments. Spring municipal compost applications are also representative of farmer practices although the interpretation of the effects due to each type of manure is complicated by this additional input.
Manure application rates were based on the University of Minnesota Extension [20] and Colorado State Extension [21], with PAN estimated as the sum of NO3-N, NH4-N and the fraction of organic N that mineralizes during the growing season. For horse manure, values of 0.7% N (wet weight) and 20% mineralization of organic N were used, and 2.8% N (wet weight) and 40% mineralization of organic N for poultry manure. These “book values” for spring-applied manure may not apply directly to a fall application at the UBC farm, as cooler conditions may decrease the mineralization rate and ultimately the amount of N released. However, they are representative of the information and data that was easily available to small-scale organic vegetable farmers in the area, and our goal was to be as representative as possible of their practices. Since we conducted this experiment, the BC government has established its own online nutrient management calculator that will be better suited for BC agriculture.
Eight 22.5 m2 plots (5 m × 4.5 m) were set up with four 1.12 m rows in four randomized blocks. Individual plots were amended on 2 October 2015 with chicken (12.5 Mg/ha based on wet weight) or horse (98.5 Mg/ha) manures, which were distributed uniformly with a rake (Table 1). Manure subsamples were analyzed by an external laboratory (A&L Canada—London, ON, Canada): total C and N by combustion, P by nitric-hydrochloric acid digestion and quantification via ICP, and NH4+ by distilled water extraction and colorimetry. The nutrient concentrations measured in the laboratory differed from the “book values” used to make manure applications, thus the actual PAN application rates differed from our original calculations. As a result, PAN inputs were higher for chicken manure (106 kg PAN/ha; 23% as NH4+) and lower for horse manure (80 kg PAN/ha; 4% as NH4+; Table 2) than our original 100 kg PAN/ha target. While this difference in application rate is a limitation, PAN targets are always approximate given the variability in nutrient content of individual manures, the mineralization factor used for each manure, and edaphic and climatic conditions at a given site in a given year. Despite these limitations, studies such as this one are critical to inform local manure management that must be done in terms of nutrient rather than mass inputs to optimize nutrient management, despite greater variability in computing application rates.
Fall PAN supply was comparable to the 96 kg N ha−1 recovery in the aboveground biomass (AGB) of a cereal rye (Secale cereale L.) and crimson clover (Trifolium incarnatum L.) cover crop reported for the area [22], although total N inputs for both manures exceeded this. Cover crop seeds were broadcast on 5 October 2015 (clover: 43 kg/ha; rye: 195 kg/ha), incorporated with manures using a rotary tiller (depth: 15 cm) on 6 October 2015, and mowed and incorporated with a moldboard plough (depth: 20 cm) at flowering (29 April 2016). There was no additional fertilization, irrigation, or pest/weed management conducted during the cover crop season, although differences in nutrient inputs between the two manures could affect cover crop growth and further complicate the analysis of the effects of each type of manure on soil properties.
Municipal compost (Net Zero Waste Inc.—Abbotsford, BC, Canada) was added to provide an estimated 100 kg PAN/ha, using nutrient analyses obtained from the supplier. The specific compost batch used was analyzed by an external laboratory (Soil Control Lab—Watsonville, CA, USA) for total C and N by combustion, P by Aqua Regia digestion and ICP, and NH4+ and NO3 with distilled water extraction and colorimetry. This laboratory estimated PAN by summing NH4+-N, NO3-N, and organic N mineralization (10–40% depending on biologically available carbon). This PAN estimate was used because it was specific to this compost and because extension documents [20,21] did not have data on municipal compost. Measured N concentrations (23,300 mg organic N kg−1; 1770 mg N-NH4+ kg−1; <1 mg N-NO3 kg−1) differed from those provided by the supplier, thus PAN inputs were estimated at 150 kg PAN/ha, i.e., 50% greater than expected. Higher than expected PAN inputs are also partially due to the relatively high ammonium content of this specific compost relative to other composts. Combined P inputs from manures and compost were high (Table 2).
On 25 May 2016, municipal compost was applied as a 1.12 m wide band centered on the row where squash would later be planted, and incorporated with a rotary tiller (15-cm depth) on 27 May 2016. Squash was transplanted on 28 May 2016 with 2.2 m between-row spacing, within the range recommended for squash in the area [23]. A drip irrigation system was used to irrigate as needed (two to three times a week, depending on weather) and was carefully managed to avoid excess watering that could lead to N losses. Squash was harvested on 27 August 2016, and plots were tilled (rotary tiller, 15-cm depth) on 15 September and 29 September 2016.

2.2. Soil Sampling and Analyses

Soils were sampled for initial conditions on 25 September 2015, after manure application, and every 2–3 weeks (April to June 2016) or 6–8 weeks (November 2015 to April 2016; June to September 2016). Four cores (0–20 cm) were collected per plot using the whole plot area (excluding a 1 m edge per plot), focusing on the area banded with compost after 24 May 2016. Soil cores were mixed into a composite sample for each plot, stored in a refrigerator (at 4 °C) until N analyses, and then air-dried and sieved (2 mm) for P analyses. While focusing on the banded area will increase nutrient concentrations relative to a homogeneous sample taken from the whole plot, it better represents the conditions experienced by squash roots that are directly related to squash N uptake and yield. Manure-compost interactions would also take place in the banded area, and combining soils from the banded area with those that did not receive compost would likely reduce our capacity to identify these interactions.
Within 48 h of collection, NH4+ and NO3 concentrations were measured by extracting 5 g of field-moist soils with 25 mL of 2 M potassium chloride (KCl) for 30 min on a reciprocal shaker. Samples were centrifuged (5000 rpm for 5 min), filtered (Fisherbrand Q2 filters), and analyzed for NH4+ [24] and NO3 [25] by colorimetry.
Apparent net mineralization (ANM) and net nitrification (ANN) were measured by incubating 8 g of soil in specimen cups at in situ soil temperatures for 21 d. Samples had their moisture content adjusted (60% of water holding capacity) to standardize incubation conditions among sampling points, sample cups were loosely capped to allow for oxygen exchange, and samples were incubated in a plastic container buried at a shallow depth near the squash field. Soil N was measured with 2 M KCl, and ANM and ANN rates were computed based on Robertson et al. [26]. For ANM, the sum of NH4+ and NO3 at the beginning of the incubation was subtracted from the sum of NH4+ and NO3 at the end of the incubation, and this difference was divided by the number of incubation days. For ANN, only NO3 was used. Rates of ANM and ANN were reported in different figures on the date of sampling, not the date of termination of the incubation. Cumulative rates were computed using linear interpolation between measurements [27].
Resin P was measured on four sampling dates (initially, after manures and compost inputs, and at the end of the experiment) using 2.5 g of air-dried soil extracted with 25 mL of distilled water and one anion-exchange resin (charged with 0.5 M NaHCO3) for 16 h on a reciprocal shaker. Resins were eluted with 25 mL of 0.5 M hydrochloric acid (HCl) for 1 h, and P concentrations were determined by colorimetry [28]. Resin-extractable P was used because it measures soil P that is freely exchangeable [28] and represents a smaller background P pool than other methods used in the area (e.g., Mehlich 3).
All nutrient analyses are expressed as concentrations per unit of dry weight, unless specified otherwise. Moisture content was measured on samples dried at 105 °C for 48 h.

2.3. Plant Sampling and Analyses

Cover crop biomass was sampled just before incorporation (26 April 2016) with a 0.36 m2 quadrat per plot, separated as rye, clover, or “others” (all other plants), and dried at 65 °C until constant weight. Dried biomass was ground with a Wiley mill, followed by ball-milling. Ball-milled samples were analyzed for total P, using a sulfuric acid and hydrogen peroxide digest [29]. Cover crop samples were analyzed for total C and N using Fourier-transform infrared (FTIR) spectroscopy on a TENSOR 37 instrument (Bruker Instruments—Ettlingen, Germany) with a subset of samples analyzed by combustion on a Vario EL Cube Elemental Analyzer (Elementar—Langenselbold, Germany) for calibration. The calibration models selected for FTIR analyses (Opus v. 7.2) had high validation R2 (0.99 for N, 0.98 for C) and low validation RMSE (0.03 for N, 0.10 for C) (Supplementary Materials, Figure S1).
Marketable squash biomass was harvested on 27 August 2016, using all fruits located in a 3 m length of row located in the center of every plot (i.e., excluding a 1 m edge at each end of each plot). Fresh weight was recorded for individual fruits, and no additional analysis was performed.

2.4. Greenhouse Gas Sampling and Analyses

Individual plots were sampled for N2O, CO2 and CH4 fluxes weekly (October to December 2015 and April to October 2016) or biweekly (January to April 2016), using a PVC collar (inner diameter: 20 cm) inserted to 5–10 cm depth. This resulted in a headspace varying between 2 and 3 L among plots, although headspace volume did not vary through time among measurements of a given plot. Collars were inserted at the center of each plot (cover-cropping season) or in a planted row (growing season), amended with the same manure and compost application rates as the rest of the plot or row on which they were installed, and weeded weekly to ensure that fluxes measured were due solely to soil processes.
Gases were measured by cavity ring-down spectroscopy using a Picarro G2508 analyzer (Picarro Inc.—Santa Clara, CA, USA) and non-steady-state chambers. Headspace gas accumulation was measured during a 5-min enclosure, which is optimal in this system [30]. Air was recirculated at a rate of 2 L/min using a vacuum pump during measurements, and the system was flushed with outside air (10 L/min for 2 min) between measurements.
GHG fluxes were computed with MATLAB v. R2014a [31] and the following formula.
F = (ρ * S * V)/(A)
where F is the flux (µmol/m2/s), ρ is the molar density (mole/m3) of dry air (i.e., corrected for the average mixing ratio of water measured during measurements), S is the slope of headspace GHG accumulation computed by linear regression (µmol/mol/s), V is the enclosure volume (m3), and A is the collar area (m2). Cumulative fluxes were computed using linear interpolation between measurements [27]. Individual flux measurements were not included in computations due to occasional issues (e.g., incomplete soil-collar seal after thawing), and two complete sampling dates (17 and 24 June 2016) due to a malfunctioning vacuum pump that led to underestimated fluxes.

2.5. Statistical Analyses

Repeated measures ANOVAs were used with manure type as the between subject factor and time as the within-subject factor, followed by a post hoc comparison of means using the Tukey HSD test when more than two treatments were compared. Results were considered statistically significant at p < 0.05 and marginally significant at p < 0.1. Individual sampling dates were used as the time factor for soil analyses, and cumulative fluxes over a given time period (cover-cropping season, growing season or whole-study) for GHG to reduce the number of comparisons for GHG (2 time points vs. 45 individual sampling dates). Whenever the manure x time interaction term was significant, individual one-way ANOVAs were computed to determine the effect of manure on individual sampling dates. Conditions of normality of residuals and homogeneity of variances were verified, and appropriate data transformations were applied when necessary. All statistical analyses were conducted in SPSS v. 24 [32].

3. Results

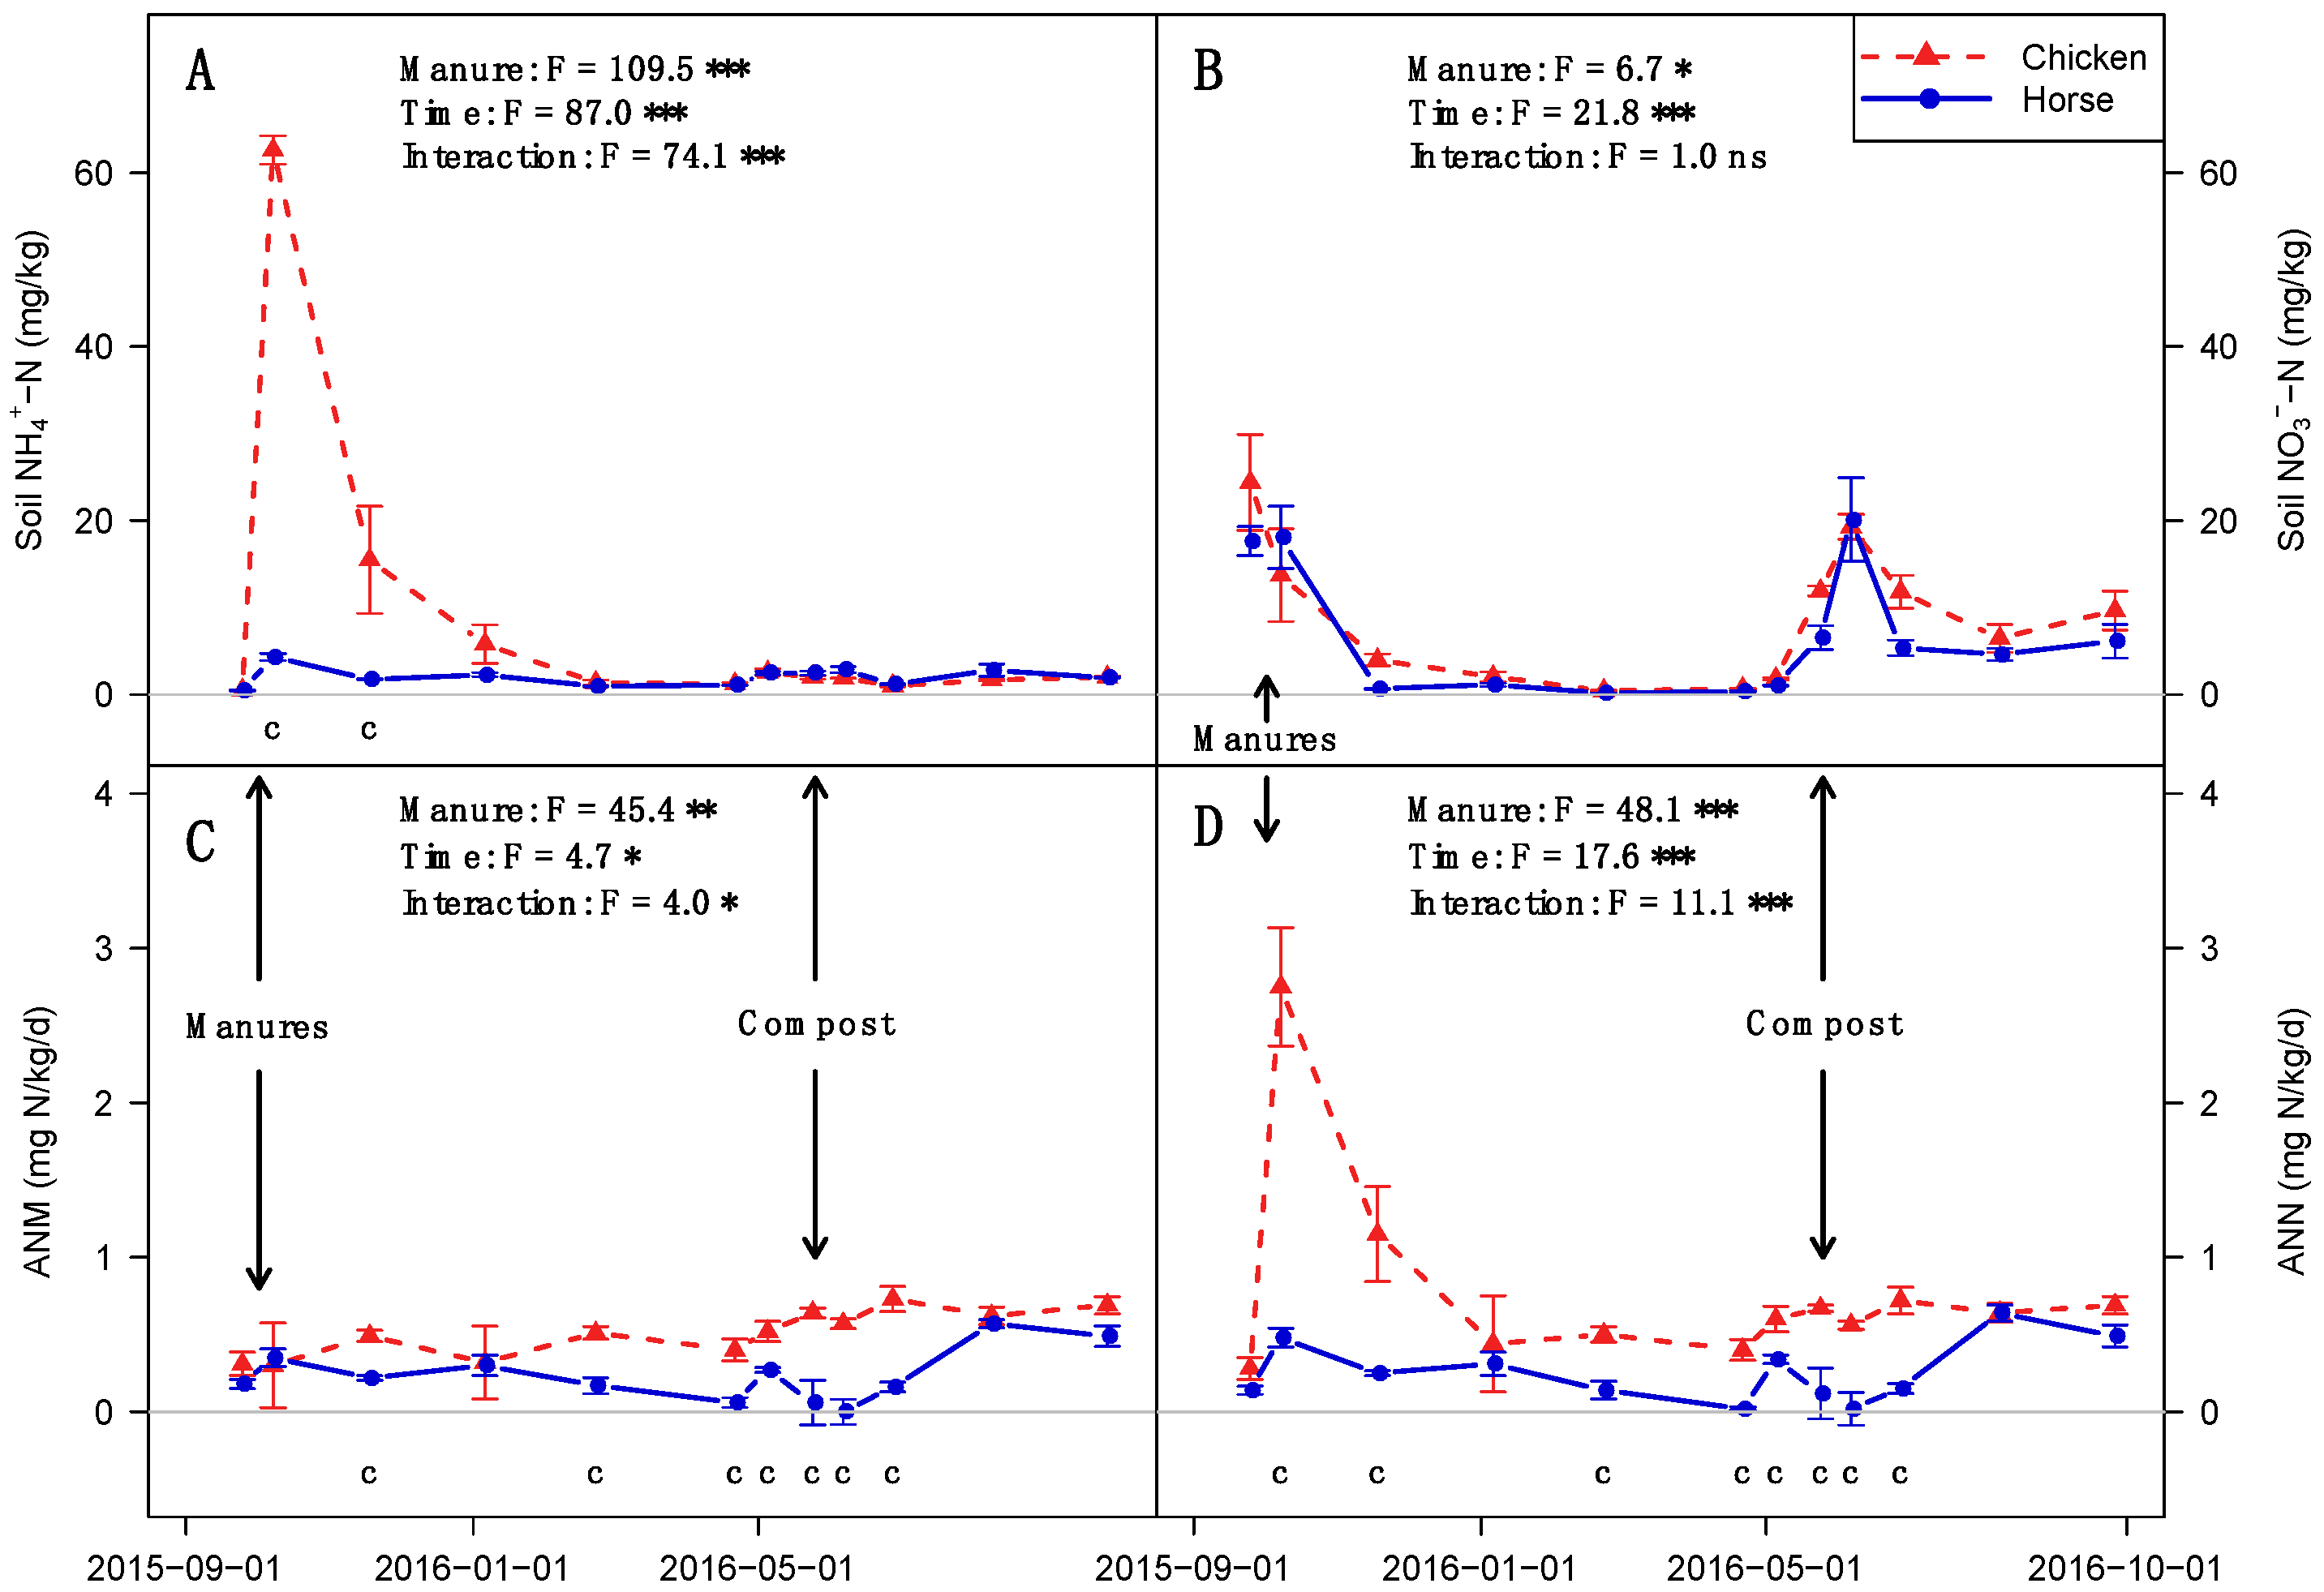
3.1. Soil Nutrient Cycling

Soil NH4+ peaked immediately after the application of chicken manure (63 mg N/kg), decreased gradually until 22 February 2016, and remained below 3 mg N/kg for the remainder of the experiment (Figure 2A). Soil NH4+ was always below 5 mg N/kg with horse manure, peaking immediately after application. Soil NH4+ concentrations were significantly smaller with horse than with chicken manure on 8 October and 18 November 2015.
Soil NO3 did not increase immediately after manure application, dropped from 20 mg N/kg to less than 5 mg N/kg on 18 November 2015, and remained low until 5 May 2016 (Figure 2B). Soil NO3 increased to 20 mg N/kg after the incorporation of cover crops and municipal compost, and varied between 6 and 12 (chicken) or 4 and 6 (horse) mg N/kg for the remainder of the experiment. Overall, soil NO3 was greater with chicken than with horse manure (time x manure interaction not significant).
Soil ANM varied between 0.3 and 0.8 mg N/kg/d with chicken manure, peaking on 27 June 2016, whereas it varied between 0 and 0.6 mg N/kg/d with horse manure, peaking on 8 August 2016 (Figure 2C). Soil ANM was significantly greater with chicken than horse manure on 18 November 2015 and from 22 February to 27 June 2016. Cumulative ANM (data not shown) at the end of the experiment was twice as high with chicken relative to horse manure (193 vs. 92 mg N/kg; F = 63.3, p < 0.001).
Soil ANN peaked at 2.8 mg N/kg/d immediately after chicken manure incorporation, then decreased to values between 0.4 and 0.7 mg N/kg/d from 6 January 2016 (Figure 2D). Soil ANN varied between 0 and 0.6 mg N/kg/d in plots amended with horse manure, peaking on 8 August 2016. Soil ANN was significantly smaller with horse relative to chicken manure on 8 October and 18 November 2015, and from 22 February to 27 June 2016. Cumulative ANN (data not shown) at the end of the experiment was three-fold greater with chicken relative to horse manure (291 vs. 99 mg N/kg; F = 89.1, p < 0.001).
Soil available P increased after manure application and was greater with chicken than horse manure for the duration of the experiment, although that difference was not statistically different (Supplementary Material, Figure S2).

3.2. Crop Response

Cover crop biomass and the relative abundance of rye were greater and clover biomass and relative abundance were smaller with chicken compared to horse manure, but only the latter was statistically significant (Table 3). Clover %N was greater and C:N was smaller than rye, with no effect of manure type. Cover crop P concentrations were greater and C:P was smaller with chicken relative to horse manure, with no effect of cover crop species; both differences were statistically significant. The amount of C, N, and P recovered in cover crop aboveground biomass (AGB) was greater with chicken relative to horse manure (not significant for N). Recovery in cover crop AGB was equivalent to 85% (chicken) or 95% (horse) of manure inputs for PAN, 20% (chicken) or 13% (horse) of manure inputs for P, and 130% (chicken) and 17% (horse) of manure inputs for C.
Squash yields were 20% greater with chicken relative to horse manure (58 vs. 45 Mg/ha), a marginally significant difference (F = 7.4, p = 0.073). Fruit size (1.16 vs. 1.05 kg/fruit; F = 5.8, p = 0.053) was also greater with chicken relative to horse manure, but not fruit number (51 000 vs. 45 000 fruits/ha; F = 4.7, p = 0.118).

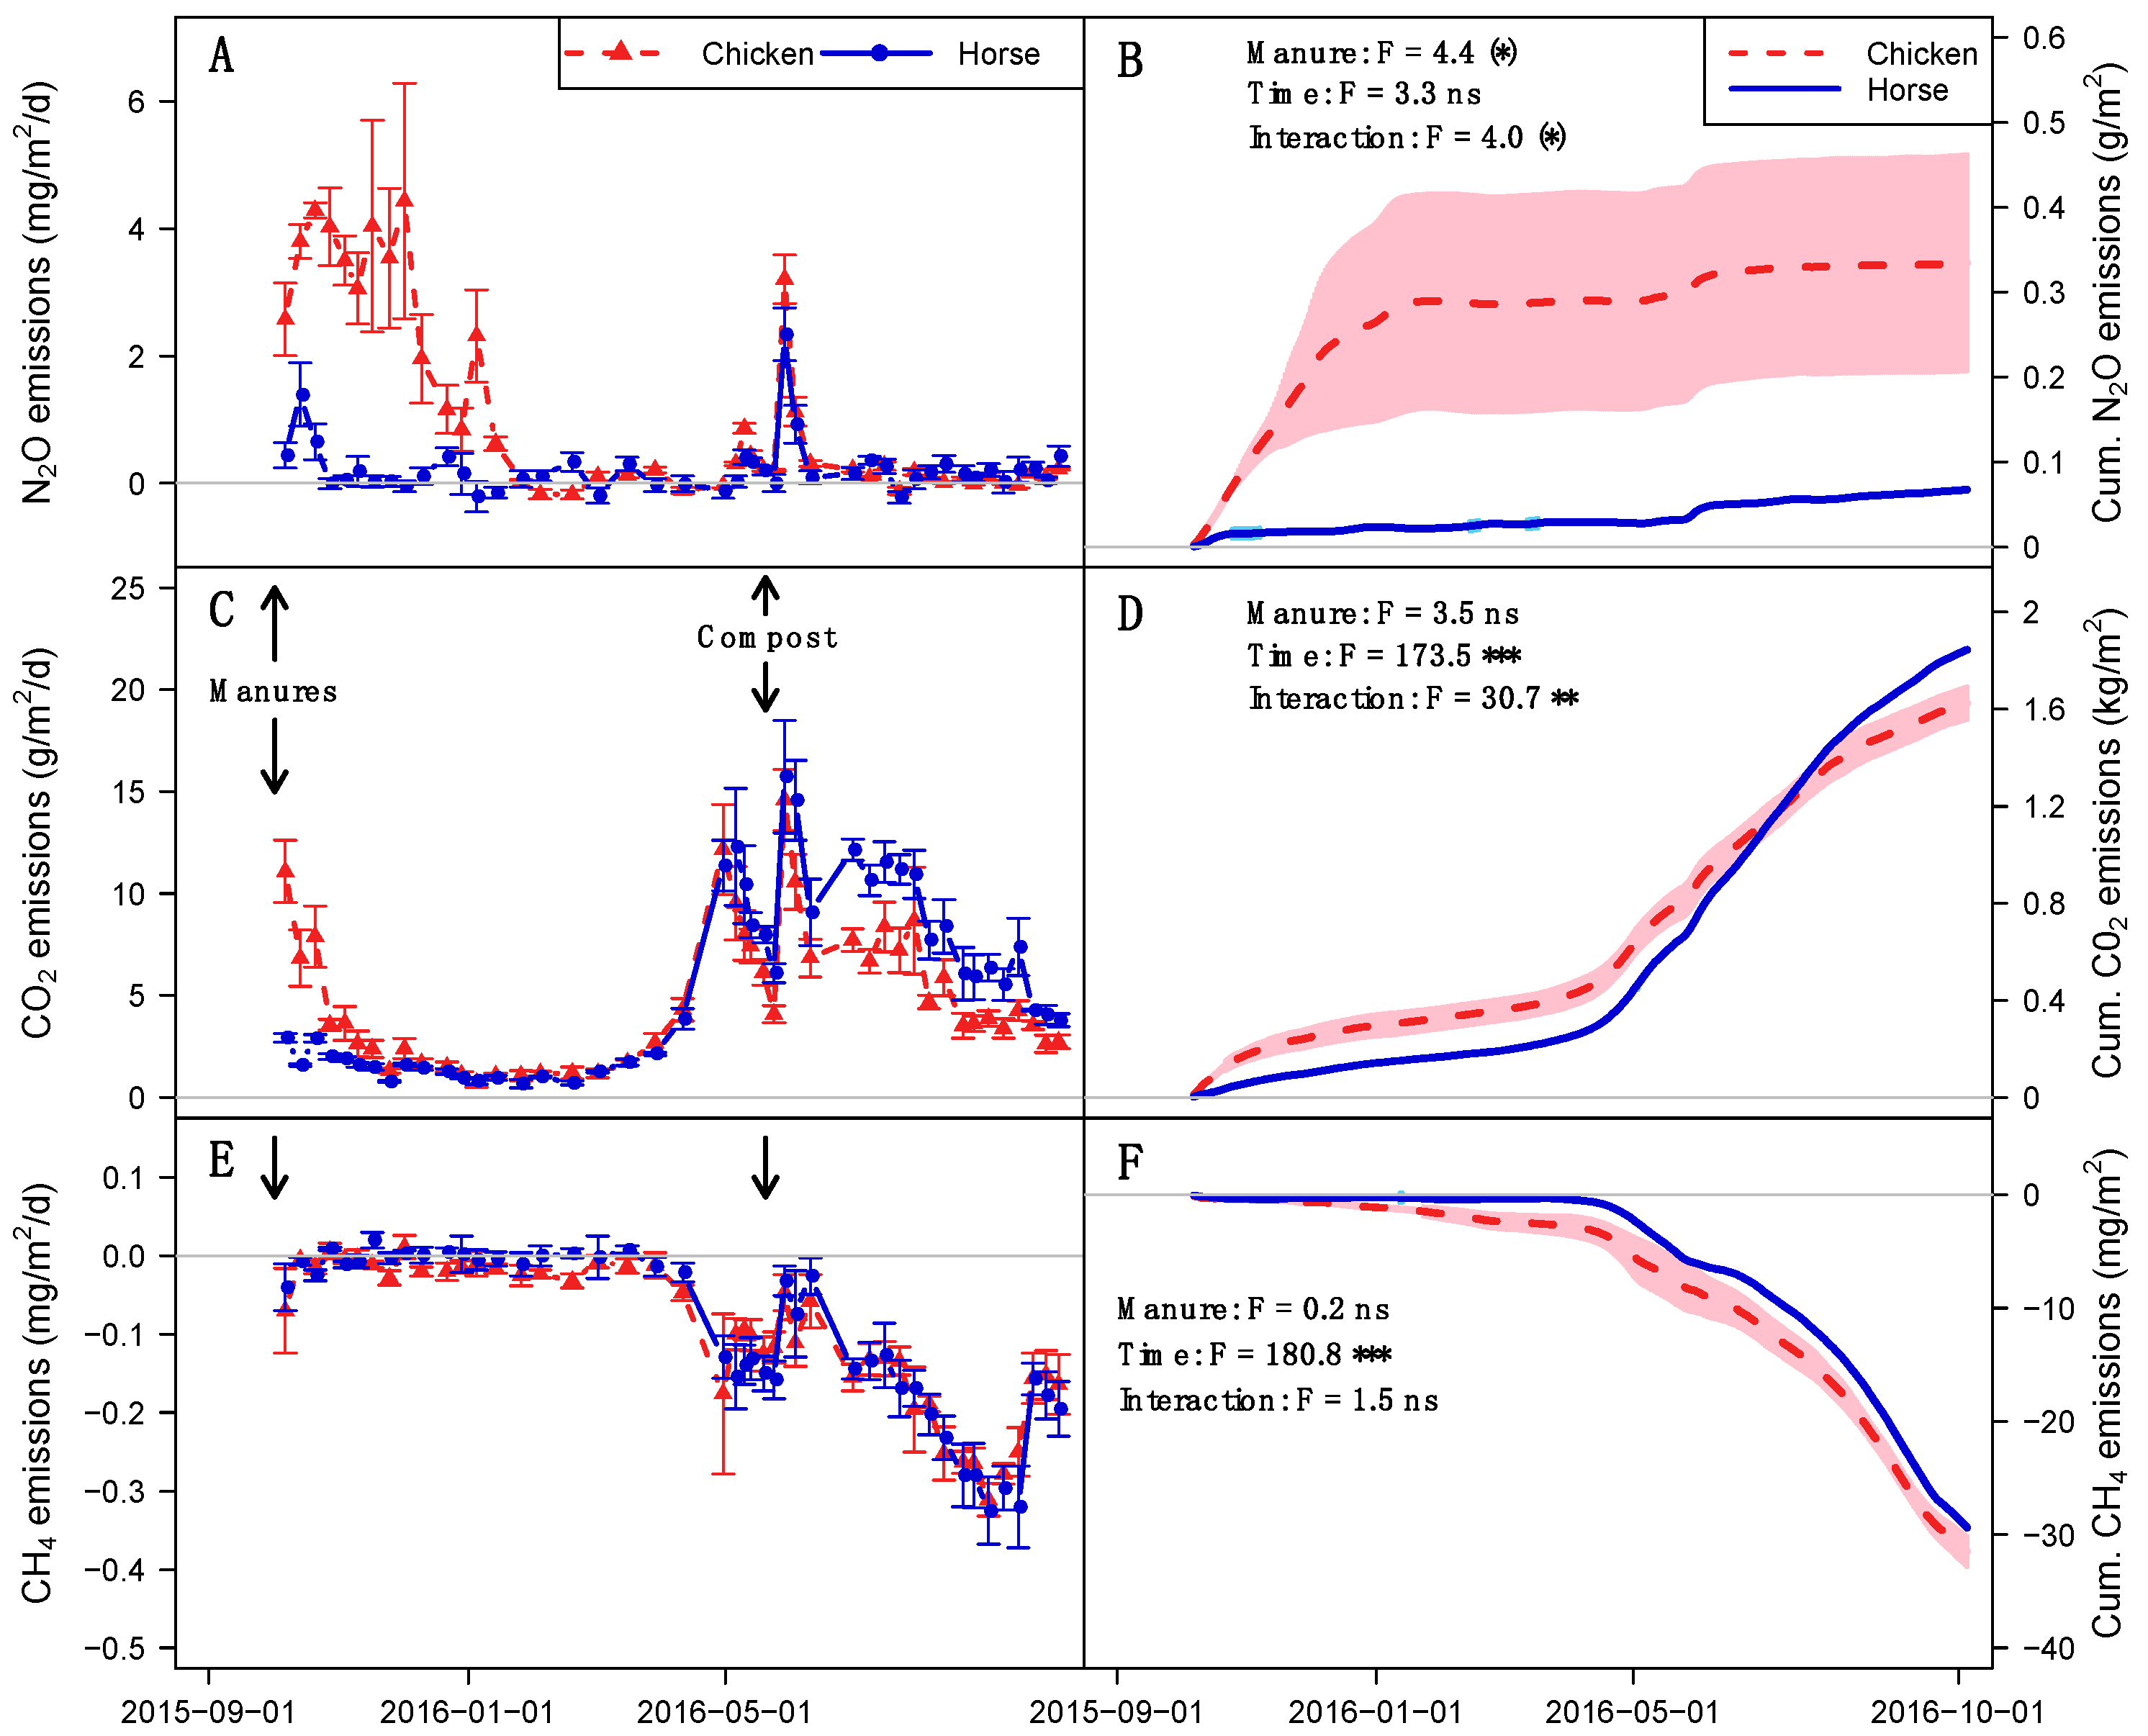
3.3. Greenhouse GAS emissions

Nitrous oxide emissions peaked after manure application and were seemingly greater with chicken relative to horse manure until 14 January 2016, after which there were no differences between manures (Figure 3A). Cumulative N2O fluxes were greater with chicken relative to horse manure for the cover-cropping season (289 vs. 28 mg N2O/m2) and the full experiment (335 vs. 68 mg N2O/m2), whereas cumulative fluxes for the growing season were similar between manures (46 vs. 39 mg N2O/m2; Figure 3B). The fraction of N inputs emitted as N2O was five times greater with chicken relative to horse manure (0.26% vs. 0.05%).
Peaks of CO2 emissions were measured immediately after applications of manure and municipal compost and after ploughing, with sharp declines in emissions following these events (Figure 3C). Cover-cropping season cumulative fluxes were greater with chicken relative to horse manure (608 vs. 420 g CO2/m2), whereas cumulative fluxes during the growing season (1018 vs. 1425 g CO2/m2) and the full experiment (1625 vs. 1844 g CO2/m2) were smaller with chicken relative to horse manure (Figure 3D). The proportion of C inputs (manure + municipal compost) emitted as CO2 was greater with chicken than horse manure (44% vs. 26%).
Methane fluxes were comparable after the application of chicken or horse manure, and consistent CH4 consumption was observed starting in April (Figure 3E). Cumulative CH4 consumption for the whole experiment was similar with horse (29.4 mg CH4/m2) and chicken (31.5 mg CH4/m2) manure (Figure 3F), and CH4 fluxes accounted for an insignificant fraction of C inputs with both manures (<0.003%).

4. Discussion

4.1. Effects of Manures During the Cover-Cropping Season

Soil NH4+ was higher after chicken than horse manure application, which was expected given the 60-fold greater NH4+ concentration measured and 8-fold greater NH4+ inputs with the former (24 kg NH4+-N ha−1 vs. 2.8 kg NH4+-N ha−1). Larger PAN inputs with chicken relative to horse manure may have also contributed to this difference. Cumulative ANN was four-fold greater and N2O emissions were six-fold greater with chicken relative to horse manure. These results are consistent with high soil NH4+ [33] and N2O emission [13] reported after chicken manure application. In addition, the coupling between greater ANN rates and N2O emissions with chicken manure suggests that nitrification may dominate N2O emissions in this study, consistent with results from Rochette et al. [10] after manures were applied to coarse-textured soils. However, the current study did not collect direct evidence (e.g., stable isotopes) that would indicate which of nitrification or denitrification was the main N2O source.
Soil NO3 was expected to increase after manure application, but NO3 remained low in the plough layer (0–20 cm). It is unlikely that cover crop N uptake prevented NO3 accumulation because fall growth was minimal, although fall N uptake was not measured. Leaching below the rooting depth is more likely in these coarse-textured soils experiencing high rainfall in the fall (Figure 1), but direct measurements of N leaching (e.g., lysimeters) are lacking in the current study. If confirmed, these hypothetical N losses could deplete N in the rooting zone, reduce growing season N availability, and affect water quality [14], although earlier cover crop seeding and establishment could potentially mitigate these losses.
The cumulative amount of N mineralized was twice as large with chicken than horse manure, which had lower percentages of estimated PAN and manure PAN found as NH4+, a higher C:N, and lower estimated PAN inputs than chicken manure. Given the strong correlation between manure mineralization and CO2 emissions [12], the 45% greater CO2 emissions measured with chicken relative to horse manure, despite six-fold smaller C inputs, could be used as a proxy to estimate the doubling in cumulative ANM measured with the former. The smaller ANM rates measured with horse relative to chicken manure are similar to the lower N mineralization rates reported by Chae and Tabatabai [34] and Gagnon and Simard [35]. Despite a high C:N ratio (>25:1), soils amended with horse manure did not seem to immobilize N in the current study however, which could be due to slower microbial activity via lower temperatures (although temperatures were relatively high) or most likely C and N speciation that was unfavorable to decomposition [5].
Clover biomass was more abundant with horse than chicken manure, and lower soil inorganic N might have stimulated a greater proportion of N derived from N-fixation, as measured by Büchi et al. [19]. Cover crop N concentrations were comparable to values reported for late April in the area [22], resulting in a similar cover crop N recovery (76–90 kg N/ha) between manures. However, cover crop N recovery was smaller than total N inputs and the 110 kg N/ha threshold proposed by Tonitto et al. [16] for cover crop N inputs to result in comparable yields relative to synthetic fertilizers. Although ANM increased after cover crop incorporation (especially with horse manure), soil N was relatively unaffected, suggesting that ANM rates measured in specimen cups incubated in situ were not directly transferable to field conditions, similar to observations from Sistani et al. [33].
Carbon inputs from cover crop AGB accounted for less than 20% of C inputs from horse manure as opposed to C inputs of similar magnitude compared to chicken manure. Cover crop C inputs should contribute less to SOM accumulation than manures [4] because of faster mineralization. However, the contribution of cover crop AGB to SOM may still be important in farming systems with smaller SOM concentrations than those found in the current study.
Despite a greater P uptake with chicken manure via greater N availability, cover crop P recovery was low for both manures (<20% of manure P inputs), suggesting a limited impact in these high P soils, similar to Kuo et al. [36] and Maltais-Landry et al. [8].

4.2. Effects of Manures During the Growing Season

Rates of ANM were lower with horse relative to chicken manure after municipal compost application, consistent with lower N mineralization with horse manure [34,35]. This limited N availability to squash early in the growing season suggests that N was not released at the optimal time, despite our sampling focusing only on the area banded with compost that should have experienced increased N availability vs. unfertilized, unplanted rows. The lack of fall N immobilization also suggests a limited potential to reduce fall N losses. Thus, this horse manure did not seem to be as effective as a soil N management tool compared to other amendments with a high C:N (e.g., used cooking oil [18]). However, fall application of horse manure might still be more advantageous than spring application, and this should be investigated in future studies.
Squash yields were 20% greater with chicken relative to horse manure, consistent with the greater fertilization value of the former [6,34]. This could also be due to the greater (+11%) estimated total PAN inputs with chicken relative to horse manure, although estimated PAN inputs were excessive relative to local recommendations of 200 kg PAN/ha with both manures. High PAN inputs and SOM concentration in these soils may have masked potential losses with chicken manure however, which could have led to N deficiency under more N-limiting conditions. Unamended control plots would have allowed to test this hypothesis, but we did not include control plots due to space constraints and to be consistent with practices that represent those of local farmers as closely as possible (i.e., cover crops and organic amendments used in all fields). Ultimately, excessive PAN and total N inputs likely resulted in N surpluses relative to crop demand, although the extent of those surpluses were not quantified in this study.
Growing season CO2 emissions were 40% greater with horse relative to chicken manure but total CO2 emissions were similar between manures despite larger C inputs with the former, suggesting that C was more recalcitrant and decomposition rate was slower with horse manure. Total N2O emissions were greater with chicken relative to horse manure (growing season N2O emissions unaffected), but this could be affected by larger NH4+ content and PAN inputs with the former, indicating a higher environmental footprint for NH4+-enriched manures applied in the fall. There was a small peak in N2O emissions after municipal compost application, consistent with low EF for composts [11]. Manure type did not affect CH4 emissions, similar to what Chadwick et al. [3] and Sistani et al. [13] reported.

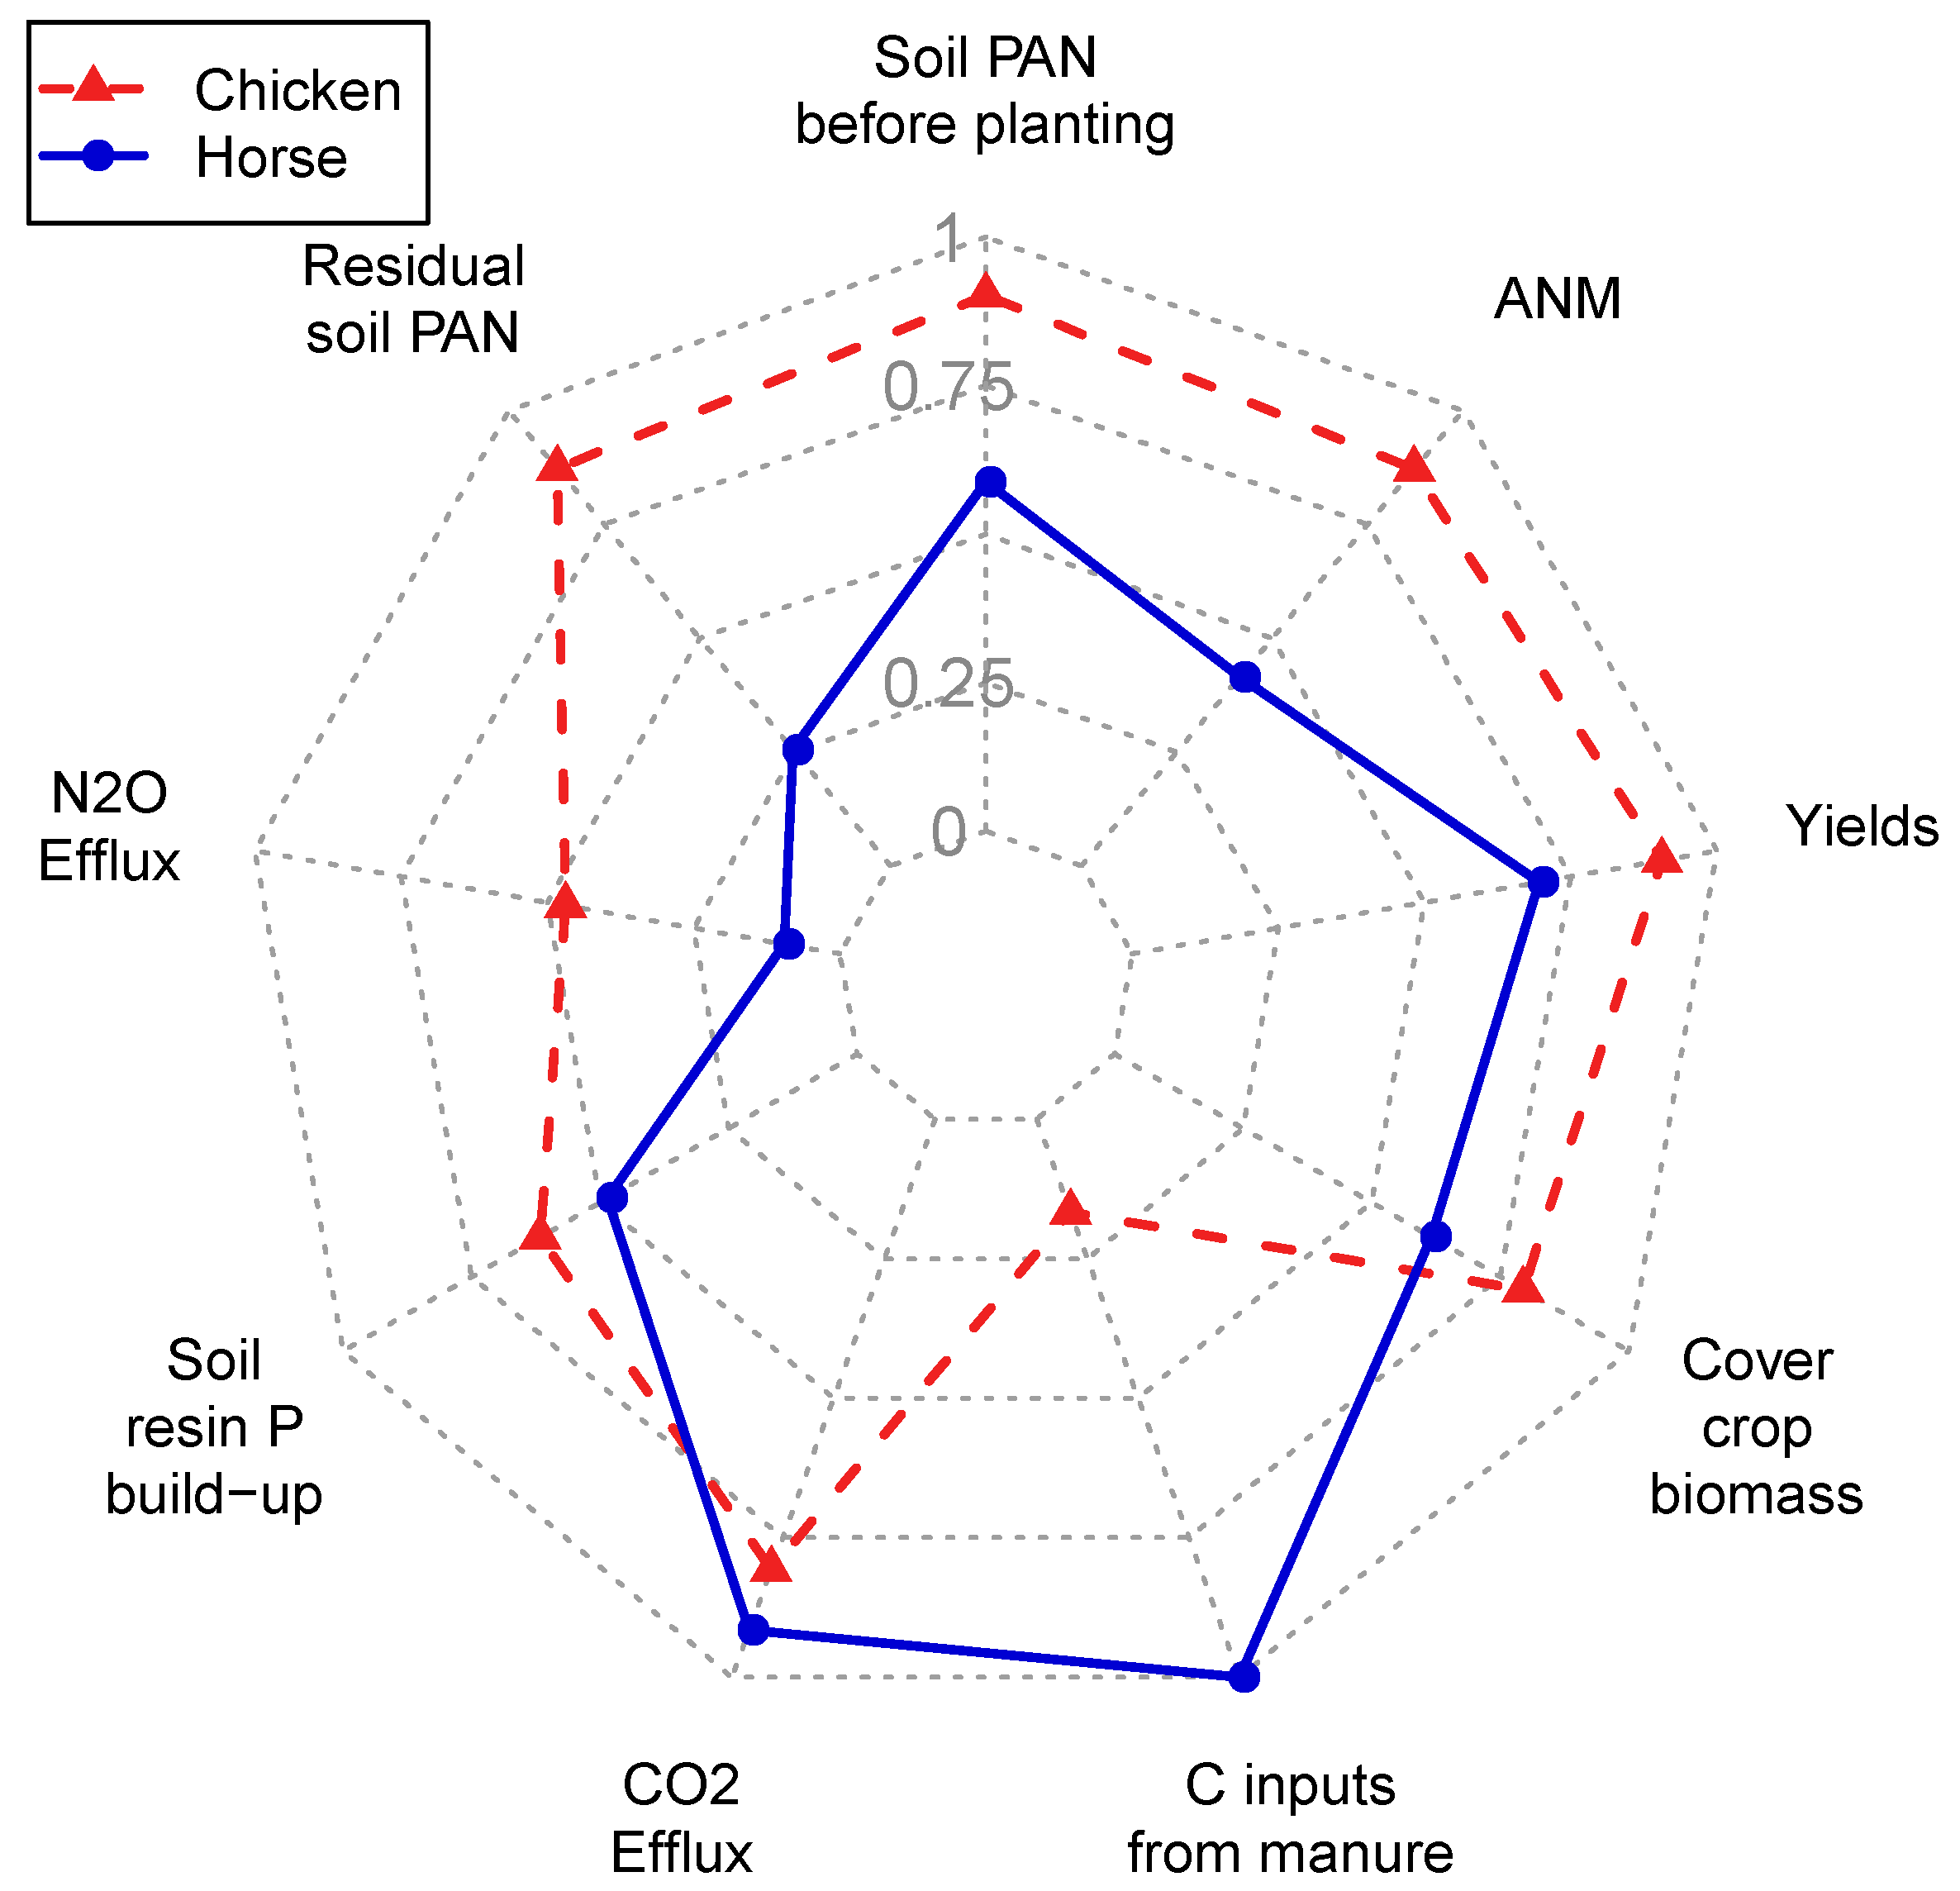
4.3. Trade-Offs of Chicken and Horse Manure Use

Greater N availability and PAN inputs with chicken relative to horse manure (total PAN inputs 11% larger with chicken manure) benefitted crop productivity and soil fertility but resulted in greater environmental impacts (Figure 4). For example, chicken manure had greater cumulative N2O fluxes (3-fold) and fraction of N inputs emitted as N2O (5-fold) relative to horse manure, consistent with the greater EF reported by Charles et al. [11] for amendments that mineralize quickly. Greater N2O emissions with chicken relative to horse manure were largely driven by a 2.5 month peak in the fall, lasting longer than the 40 days or less reported previously for N2O emissions peaks in warmer conditions [10,37]. The environmental impacts of chicken relative to horse manure could be even more important, as large NH3 losses with chicken manure [37] could exacerbate N gaseous losses and impacts on air quality. Overall, this indicates the need to better estimate PAN inputs from chicken manure, through cheaper characterization methods (e.g., FTIR as used for cover crop in Figure S1) and locally-adapted nutrient calculators (e.g., the new BC nutrient calculator), as this would have reduced chicken manure inputs and associated risks of environmental N losses.
Horse manure had smaller crop productivity relative to chicken manure, likely because of lower PAN inputs and poorly synchronized N mineralization. However, yields per unit of N2O emitted were more favorable for horse (0.79 ± 0.182 Mg yield/mg N2O emitted) than chicken manure (0.24 ± 0.059 Mg yield/mg N2O emitted), which may also be partially driven by lower PAN input rates for the former. Horse manure may provide more benefits in systems with less SOM or after several years of application, as compared to the current study that focused on the effects of a single horse manure addition on a high SOM soil. Greater legume cover crop abundance with fall-applied horse relative to chicken manure could also increase N-fixation benefits if the N fixed by cover crops is transferred efficiently to subsequent cash crops [7,15,17]. However, smaller squash yields with horse relative to chicken manure suggest that N-fixation benefits were insufficient to compensate for the smaller estimated PAN inputs made with horse manure in the current study.
Horse manure released 40% less of its C inputs as CO2 relative to chicken manure, consistent with smaller CO2 emissions when manure C and N is more recalcitrant [5,12]. Smaller yields with horse relative to chicken manure would require higher application rates and/or additions of synthetic fertilizers to increase yields however, where higher horse manure inputs to meet PAN requirements would ultimately increase environmental impacts (e.g., GHG emissions, N surpluses, and soil P build-up). These results suggest a greater potential for horse manure to help build SOM rather than increase crop productivity, which may be especially useful in degraded soils.
Phosphorus inputs (>200 kg P/ha/yr) were excessive with both manures relative to typical vegetable crop P removal of less than 20 kg P/ha/yr [9]. Soil resin P increased only with chicken manure however, consistent with the increase in plant-available P reported with chicken but not horse manure in the incubation study of Gagnon and Simard [35]. Long-term P overfertilization will result in higher soil P ultimately, similar to other farming systems targeting crop N demand with manures [8].

5. Conclusions

Overall, a single fall application of horse manure provided benefits compared to chicken manure in terms of C inputs and legume cover crops while having a small effect on residual soil N and GHG. The lack of unamended control plots and larger PAN inputs with chicken relative to horse manure in this study prevents us from quantifying the net effect of each type of manure accurately, which is further complicated by the use of cover crops and spring municipal compost inputs in both treatments. Nevertheless, our results highlight that the use of horse manure must be optimized to maximize fall N scavenging and limit excessive P overfertilization, and that higher fertilizer N inputs will likely be required to increase yields, despite excessive total N inputs. For N-rich chicken manure, application immediately before the growing season may be more appropriate given its high estimated PAN and NH4+ concentrations, which could reduce N leaching risks by better timing manure PAN supply with crop demand. However, given the significant P overfertilization and excessive total N inputs observed with both manures, application rates will need to decrease to minimize P loss risks, requiring N inputs from fertilizers and/or significant N-fixation in cover crops.

Supplementary Materials

The following are available online at https://www.mdpi.com/2073-4395/9/8/444/s1. Figure S1: Calibration between cover crop N (A) and C (B) measured by combustion with an Elemental Analyzer (EA) or by Fourier-Transform Infrared Spectroscopy (FTIR); Figure S2: Soil phosphorus during the study (mean ± standard error).

Author Contributions

Conceptualization, G.M.-L. and S.M.S.; methodology, G.M.-L., Z.N., N.G., and S.M.S.; validation, G.M.-L., Z.N., N.G., and S.M.S.; formal analysis, G.M.-L., Z.N., and N.G.; investigation, G.M.-L. and B.T.; resources, G.M.-L., Z.N., and S.M.S.; data curation, G.M.-L.; writing—original draft preparation, G.M.-L.; writing—review and editing, all authors.

Funding

This research was funded by a postdoctoral fellowship to G. Maltais-Landry from the Natural Sciences and Engineering Research Council of Canada (NSERC).

Acknowledgments

We thank the UBC farm staff for logistical support while establishing the experiment; Spencer Bailey, Alice Chang, Winnie Cheung, Li-Yun Hsu, Alfred Ke and Katarina Neufeld for assistance in the field and in the lab.

Conflicts of Interest

The authors declare no conflicts of interest.

References

  1. Jarvie, H.P.; Sharpley, A.N.; Flaten, D.; Kleinman, P.J.A.; Jenkins, A.; Simmons, T. The Pivotal Role of Phosphorus in a Resilient Water-Energy-Food Security Nexus. J. Environ. Qual. 2015, 44, 1049–1062. [Google Scholar] [CrossRef] [PubMed]
  2. Bergstrom, L.; Kirchmann, H.; Aronsson, H.; Torstensson, G.; Mattsson, L. Use Efficiency and Leaching of Nutrients in Organic and Conventional Cropping Systems in Sweden. In Organic Crop Production—Ambitions and Limitations; Kirchmann, H., Bergström, L., Eds.; Springer: Amsterdam, The Netherlands, 2008; pp. 143–159. ISBN 978-1-4020-9316-6. [Google Scholar] [Green Version]
  3. Chadwick, D.; Sommer, S.G.; Thorman, R.; Fangueiro, D.; Cardenas, L.; Amon, B.; Misselbrook, T. Manure management: Implications for greenhouse gas emissions. Anim. Feed Sci. Technol. 2011, 166–167, 514–531. [Google Scholar] [CrossRef]
  4. Haynes, R.J.; Naidu, R. Influence of lime, fertilizer and manure applications on soil organic matter content and soil physical conditions: A review. Nutr. Cycl. Agroecosyst. 1998, 51, 123–137. [Google Scholar] [CrossRef]
  5. Eghball, B.; Wienhold, B.J.; Gilley, J.E.; Eigenberg, R.A. Mineralization of manure nutrients. J. Soil Water Conserv. 2002, 57, 470–473. [Google Scholar]
  6. Gale, E.S.; Sullivan, D.M.; Cogger, C.G.; Bary, A.I.; Hemphill, D.D.; Myhre, E.A. Estimating plant-available nitrogen release from manures, composts, and specialty products. J. Environ. Qual. 2006, 35, 2321–2332. [Google Scholar] [CrossRef] [PubMed]
  7. Crews, T.E.; Peoples, M.B. Can the synchrony of nitrogen supply and crop demand be improved in legume and fertilizer-based agroecosystems? A review. Nutr. Cycl. Agroecosyst. 2005, 72, 101–120. [Google Scholar] [CrossRef]
  8. Maltais-Landry, G.; Scow, K.; Brennan, E.; Vitousek, P. Long-term effects of compost and cover crops on soil phosphorus in two California agroecosystems. Soil Sci. Soc. Am. J. 2015, 79, 688–697. [Google Scholar] [CrossRef]
  9. Nelson, N.O.; Janke, R.R. Phosphorus sources and management in organic production systems. Horttechnology 2007, 17, 442–454. [Google Scholar] [CrossRef]
  10. Rochette, P.; Angers, D.A.; Chantigny, M.H.; Gagnon, B.; Bertrand, N. N2O fluxes in soils of contrasting textures fertilized with liquid and solid dairy cattle manures. Can. J. Soil Sci. 2008, 88, 175–187. [Google Scholar] [CrossRef]
  11. Charles, A.; Rochette, P.; Whalen, J.K.; Angers, D.A.; Chantigny, M.H.; Bertrand, N. Global nitrous oxide emission factors from agricultural soils after addition of organic amendments: A meta-analysis. Agric. Ecosyst. Environ. 2017, 236, 88–98. [Google Scholar] [CrossRef]
  12. Castellanos, J.Z.; Pratt, P.F. Mineralization of Manure Nitrogen - Correlation with Laboratory Indexes. Soil Sci. Soc. Am. J. 1981, 45, 354–357. [Google Scholar] [CrossRef]
  13. Sistani, K.R.; Jn-Baptiste, M.; Lovanh, N.; Cook, K.L. Atmospheric Emissions of Nitrous Oxide, Methane, and Carbon Dioxide from Different Nitrogen Fertilizers. J. Environ. Qual. 2011, 40, 1797–1805. [Google Scholar] [CrossRef] [Green Version]
  14. Di, H.J.; Cameron, K.C. Nitrate leaching in temperate agroecosystems: Sources, factors and mitigating strategies. Nutr. Cycl. Agroecosyst. 2002, 64, 237–256. [Google Scholar] [CrossRef]
  15. Goulding, K. Nitrate leaching from arable and horticultural land. Soil Use Manag. 2000, 16, 145–151. [Google Scholar] [CrossRef]
  16. Tonitto, C.; David, M.B.; Drinkwater, L.E. Replacing bare fallows with cover crops in fertilizer-intensive cropping systems: A meta-analysis of crop yield and N dynamics. Agric. Ecosyst. Environ. 2006, 112, 58–72. [Google Scholar] [CrossRef]
  17. Li, X.; Sorensen, P.; Li, F.; Petersen, S.O.; Olesen, J.E. Quantifying biological nitrogen fixation of different catch crops, and residual effects of roots and tops on nitrogen uptake in barley using in-situ N-15 labelling. Plant Soil 2015, 395, 273–287. [Google Scholar] [CrossRef]
  18. Congreves, K.A.; Van Eerd, L.L. Nitrogen cycling and management in intensive horticultural systems. Nutr. Cycl. Agroecosyst. 2015, 102, 299–318. [Google Scholar] [CrossRef]
  19. Büchi, L.; Gebhard, C.-A.; Liebisch, F.; Sinaj, S.; Ramseier, H.; Charles, R. Accumulation of biologically fixed nitrogen by legumes cultivated as cover crops in Switzerland. Plant Soil 2015, 393, 163–175. [Google Scholar] [CrossRef]
  20. Rosen, C.J.; Bierman, P.M. Using Manure and Compost as Nutrient Sources for Fruit and Vegetable Crops. Available online: http://www.extension.umn.edu/garden/fruit-vegetable/using-manure-and-compost/ (accessed on 17 September 2015).
  21. Whiting, D.; Card, A.; Wilson, C.; Reeder, J. Using Manure in the Home Garden. Available online: http://cmg.colostate.edu/Gardennotes/242.pdf (accessed on 17 September 2015).
  22. Odhiambo, J.J.O.; Bomke, A.A. Grass and legume cover crop effects on dry matter and nitrogen accumulation. Agron. J. 2001, 93, 299–307. [Google Scholar] [CrossRef]
  23. BC Ministry of Agriculture Vegetable Production Guide. Available online: http://productionguide.agrifoodbc.ca/guides/17 (accessed on 15 May 2015).
  24. Weatherburn, M.W. Phenol-Hypochlorite Reaction for Determination of Ammonia. Anal. Chem. 1967, 39, 971–974. [Google Scholar] [CrossRef]
  25. Doane, T.A.; Horwath, W.R. Spectrophotometric determination of nitrate with a single reagent. Anal. Lett. 2003, 36, 2713–2722. [Google Scholar] [CrossRef]
  26. Robertson, G.P.; Wedin, D.; Groffman, P.M.; Blair, J.M.; Holland, E.A.; Nadelhoffer, K.J.; Harris, D.H. Soil Carbon and Nitrogen Availability—Nitrogen Mineralization, Nitrification, and Soil Respiration Potentials. In Standard Soil Methods for Long-Term Ecological Research; Robertson, G.P., Coleman, D.C., Bledsoe, C.S., Sollins, P., Eds.; Oxford University Press: New York, NY, USA, 1999; pp. 258–271. [Google Scholar]
  27. Gana, C.; Nouvellon, Y.; Marron, N.; Stape, J.L.; Epron, D. Sampling and interpolation strategies derived from the analysis of continuous soil CO2 flux. J. Plant Nutr. Soil Sci. 2016, 12–20. [Google Scholar] [CrossRef]
  28. Tiessen, H.; Moir, J.O. Characterization of Available P by Sequential Extraction. In Soil Sampling and Methods of Analysis; Carter, M.R., Gregorich, E.G., Eds.; CRC Press: Boca Raton, FL, USA, 2007; pp. 293–306. [Google Scholar]
  29. Thomas, R.L.; Sheard, R.W.; Moyer, J.R. Comparison of Conventional and Automated Procedures for Nitrogen, Phosphorus, and Potassium Analysis of Plant Material Using a Single Digestion. Agron. J. 1967, 59, 240–243. [Google Scholar] [CrossRef]
  30. Christiansen, J.R.; Outhwaite, J.; Smukler, S.M. Comparison of CO2, CH4 and N2O soil-atmosphere exchange measured in static chambers with cavity ring-down spectroscopy and gas chromatography. Agric. For. Meteorol. 2015, 211–212, 48–57. [Google Scholar] [CrossRef]
  31. MathWorks Inc. MATLAB, Version R2014a; MathWorks Inc.: Natcik, MA, USA, 2014. [Google Scholar]
  32. IBM Corp. IBM SPSS Statistics for Windows, Version 24; IBM Corp.: Armonk, NY, USA, 2016. [Google Scholar]
  33. Sistani, K.R.; Adeli, A.; McGowen, S.L.; Tewolde, H.; Brink, G.E. Laboratory and field evaluation of broiler litter nitrogen mineralization. Bioresour. Technol. 2008, 99, 2603–2611. [Google Scholar] [CrossRef]
  34. Chae, Y.M.; Tabatabai, M.A. Mineralization Of Nitrogen In Soils Amended With Organic Wastes. J. Environ. Qual. 1986, 15, 193–198. [Google Scholar] [CrossRef]
  35. Gagnon, B.; Simard, R.R. Nitrogen and phosphorus release from on-farm and industrial composts. Can. J. Soil Sci. 1999, 79, 481–489. [Google Scholar] [CrossRef]
  36. Kuo, S.; Huang, B.; Bembenek, R. Effects of long-term phosphorus fertilization and winter cover cropping on soil phosphorus transformations in less weathered soil. Biol. Fertil. Soils 2005, 41, 116–123. [Google Scholar] [CrossRef]
  37. Akiyama, H.; McTaggart, I.P.; Ball, B.C.; Scott, A. N2O, NO, and NH3 emissions from soil after the application of organic fertilizers, urea and water. Water. Air. Soil Pollut. 2004, 156, 113–129. [Google Scholar] [CrossRef]
Figure 1. Mean daily temperature and daily precipitation during the study period.
Agronomy 09 00444 g001
Figure 2. Soil ammonium (A; NH4+-N), nitrate (B; NO3-N), apparent net mineralization (C; ANM), and apparent net nitrification (D; ANN) during the study (mean ± standard error). Arrows indicate the date of manure (2 Oct. 2015) and municipal compost (25 May 2016) application. Results from ANOVA factors refer to the full model with repeated measures, where *** = p < 0.001, ** = p < 0.01, * = p < 0.05, ns = p > 0.05. Letters along the x-axis indicate that chicken (“c”) was significantly greater (p < 0.05) than the other manure type in one-way ANOVAs computed on individual dates when the manure x time interaction was significant.
Agronomy 09 00444 g002
Figure 3. Temporal and cumulative fluxes (mean ± standard error) of nitrous oxide (A,B; N2O), carbon dioxide (C,D; CO2), and methane (E,F; CH4). Arrows indicate the date of manure (2 Oct 2015) and municipal compost (25 May 2016) application. Results from ANOVA factors refer to the full model with repeated measures, where *** = p < 0.001, ** = p < 0.01, (*) = p < 0.1, ns = p > 0.1. Chicken manure had higher N2O emissions than horse manure during the cover-cropping season and the whole study, and it had higher and lower CO2 emissions than horse manure during the cover-cropping season and the whole study, respectively.
Agronomy 09 00444 g003
Figure 4. Radar plot displaying average values for each treatment scaled to the maximum values observed for each variable. All differences were statistically significant (p < 0.05; except for yields that were significant at p < 0.1 and resin P build-up that was not significant), although the difference in C inputs was not testable. Shaded variables represent negative environmental impacts (i.e., smaller values indicate a more desirable outcome). C = carbon; N = nitrogen; PAN = estimated plant-available N; P = phosphorus; N2O = nitrous oxide; CO2 = carbon dioxide; ANM = apparent net mineralization.
Agronomy 09 00444 g004
Table 1. Nutrient content (expressed as dry weight) of amendments used in the current study, where PAN = estimated plant-available nitrogen.
AmendmentMoistureCarbonNitrogenNH4+-NPAN aPhosphorusC:NN:P
________________ g/kg ______________mg/kg__________ g/kg __________
Chicken manure640404505400231982.6
Horse manure69035813932.63.0284.2
Municipal compost2503392518006.35.9143.8
a For manures, this is computed as NH4+-N + (Organic N x mineralization rate), where mineralization rate equals 0.4 (chicken) or 0.2 (horse). For compost, PAN was estimated by the external laboratory that performed the measurements on compost.
Table 2. Mass and nutrient inputs (expressed as dry weight) for the two treatments used in the current study, where PAN = estimated plant-available nitrogen.
TreatmentAmendmentMassCarbonNitrogenPANPhosphorus
_____ Mg/ha ____________________ kg/ha _______________
ChickenManure4.51.822710686
Compost a 24.28.2603151143
Total28.710.0831257229
HorseManure30.510.93908092
Compost a 24.28.2603151143
Total54.719.1993232235
a For municipal compost, input rates apply to the banded area.
Table 3. Cover crop biomass, concentration, and recovery in aboveground biomass of carbon (C), nitrogen (N), and phosphorus (P), and nutrient ratios (mean ± standard error). Different letters denote significant differences (p < 0.05) among cover crops in chicken manure only (a, b, c), horse manure only (f, g, h), or in both manures when the interaction term is not significant (x, y, z). Hash signs (#) denote a significant difference between chicken and horse manures for a given cover crop, whereas plus signs (+) denote a significant difference between chicken and horse manure that is identical among all cover crops (i.e., the interaction term is not significant).
ManureCropsBiomassCarbonNitrogenPhosphorusC:NC:P
Mg ha−1% totalMg C ha−1g kg−1kg N ha−1g kg−1kg P ha−1
ChickenClover1.6 ± 0.29 b28 ± 3.1 b0.7 ± 0.13 b23 ± 1.0 x38 ± 6.5 x3.2 ± 0.20 +5 ± 0.8 b19 ± 0.6 y136 ± 16.7
Rye3.9 ± 0.39 a #67 ± 2.9 a1.7 ± 0.17 a #14 ± 1.5 y52 ± 4.0 x #3.0 ± 0.20 +11 ± 0.8 a #33 ± 3.6 x150 ± 19.0
Weeds0.3 ± 0.06 c5 ± 0.5 c
Total5.8 ± 0.67 # 2.4 ± 0.27 # 90 ± 9.3 17 ± 1.4 #
HorseClover2.2 ± 0.51 f46 ± 6.5 f0.9 ± 0.22 f22 ± 1.0 x47 ± 9.5 x2.9 ± 0.316 ± 1.0 f19 ± 0.8 y154 ± 32.7 +
Rye2.2 ± 0.15 f51 ± 6.6 f1.0 ± 0.07 f13 ± 0.5 y29 ± 2.9 x2.7 ± 0.156 ± 0.4 f34 ± 1.4 x164 ± 16.7 +
Weeds0.1 ± 0.02 g2 ± 0.4 g
Total4.5 ± 0.55 1.9 ± 0.23 76 ± 8.9 12 ± 0.8
F, pF, pF, pF, pF, pF, pF, pF, pF, p
Manure 4.7, 0.0470.0, 0.9942.6, 0.1421.1, 0.3171.6, 0.2437.0, 0.0264.0, 0.0760.4, 0.5616.7, 0.030
Species 70.0, <0.00189.9, < 0.00118.0, 0.002125.8, <0.0010.2, 0.6843.7, 0.08510.9, 0.00977.5, <0.0013.8, 0.084
Interaction 10.2, 0.0028.3, 0.00312.2, 0.0070.0, 1.0008.6, 0.0170.0, 0.8908.2, 0.0190.0, 0.8970.1, 0.801
Total 15.0, 0.031n.s.15.8, 0.028n.s.3.2, 0.173n.s.10.4, 0.048n.s.n.s.

