Article

The Synergistic Effect of Biochar and Microorganisms Greatly Improves Vegetation and Microbial Structure of Degraded Alpine Grassland on Qinghai–Tibet Plateau

1
School of Resources and Environment, Anhui Agricultural University, Hefei 230036, China
2
College of Grassland Science and Technology, China Agricultural University, Beijing 100193, China
3
Department of Water and soil Science, China Agricultural University, Beijing 100193, China
4
Key Laboratory of Restoration Ecology of Cold Area in Qinghai Province, Northwest Institute of Plateau Biology, Chinese Academy of Sciences, Xining 810008, China
*
Authors to whom correspondence should be addressed.
Agronomy 2023, 13(9), 2203; https://doi.org/10.3390/agronomy13092203
Submission received: 27 July 2023 / Revised: 18 August 2023 / Accepted: 21 August 2023 / Published: 23 August 2023
(This article belongs to the Special Issue Grassland and Pasture Ecological Management and Utilization)

Abstract

:
The attenuation of soil organic carbon and the destruction of soil microbial structure are common manifestations of grassland degradation. The addition of exogenous organic carbon and microorganisms may be an effective way to quickly restore degraded grassland, but corresponding evaluations are still rare. We investigated the effects of effective microorganisms (EM) and biochar addition on vegetation biomass, microorganisms and soil properties in degraded alpine grassland. The treatments included a control (no biochar or EM addition, CK), EM addition (250 mL m−2 EM, M), biochar addition (4.00 kg m−2 biochar, C) and a mixture of biochar and EM (4.00 kg m−2 biochar and 250 mL m−2 EM, C+M). C, M and C+M rapidly increased vegetation biomass, soil organic carbon (TOC), total nitrogen (TN), available nitrogen (NH4+-N, NO3-N), available phosphorus (AP), total microbial biomass (MB), bacteria and fungus biomass in the soil, and also altered the microbial community structure. The content of soil nutrients in the C treatment was the highest, followed by C+M. The vegetation biomass and microbial biomass were the greatest in the C+M treatment, and increased by 101.04~198.52% and 22.14~45.41%, respectively. C+M can also enhance the presence of saprotrophic fungi, thereby facilitating the augmentation of both plant and soil nutrients. Overall, the biochar combined with EM addition had a synergistic effect on the restoration of degraded alpine grasslands.

1. Introduction

As one of the important terrestrial ecosystems, the world’s widespread grassland ecosystems have unique ecosystem services and functions. Grasslands distributed on the Qinghai–Tibet Plateau are one of the four basic pastoral areas in China, and play a pivotal role in providing the material basis for local animal husbandry production [1]. Additionally, Alpine grasslands have the crucial ecological functions of climate regulation, carbon sequestration, nutrient cycling, water conservation and the maintenance of biodiversity [2,3,4]. Due to its unique natural environment, the ecosystem of alpine grassland is relatively fragile [5]. In recent years, the combined effects of unreasonable human disturbance, climate change and low ecological resilience have caused serious degradation in many alpine grasslands [5,6]. In response to grassland degradation, scientists have used numerous methods to restore damaged vegetation and improve degraded soil, such as grazing prohibition, reseeding, fertilization, etc. [7,8].
Many studies reveal that biochar enhances microbial biomass but has conflicting impacts on microbial diversity [9,10]. The deterioration of the structure and function of soil microbial communities and the attenuation of soil organic carbon are the most obvious characteristics of soil degradation [11,12]. The loss and destruction of soil microorganisms can not only interfere with the normal cycle of soil nutrient elements (C, N, P), but also limit plant growth by hindering plant nutrient uptake and photosynthesis [13,14,15]. Generally, the effects of biochar on microbial biomass are dependent on biochar properties, while those on microbial diversity are dependent on soil properties [16,17,18]. In agricultural production, the addition of microbial inoculum, especially effective microorganisms (EM), has been verified as an effective way to resolve the issue of the reduction in or inactivation of beneficial bacteria after soil degradation [19,20,21]. Compared with single-strain microbial inoculum, EM contains a variety of microbial communities (e.g., photosynthetic bacteria, lactic acid bacteria, saccharomyces), so it has a complex composition, a stable structure, and a wide range of functions [22,23]. Some studies have shown that EM addition can inhibit soil diseases, stimulate the reproduction of soil beneficial microorganisms, promote the decomposition of soil organic matter to increase soil nutrients, and improve the plant’s absorption of nutrients [22,24,25]. However, most EM studies and utilization currently focus on arable lands, and there are few studies on degraded grasslands, especially degraded alpine grasslands.
The loss of organic carbon in soil seriously affects the healthy operation and maintenance of different terrestrial ecosystems, and even leads to ecosystem degradation [7,26]. Biochar has been widely used as a soil amendment in agricultural production to compensate for the massive loss of soil organic carbon due to soil degradation [27]. Biochar typically contains 50–80% carbon and is produced through the pyrolysis of animal and plant residues under complete or partial anoxic conditions [28]. Biochar enhances soil not only through the addition of nutrients and organic carbon [29], but also by leveraging the inherent structural properties that biochar possesses [30]. Biochar has a special microporous structure and strong adsorption ability, and can adsorb and immobilize mineral elements for plant growth and effectively regulate nutrient cycling in soil [31,32]. The organic molecules adsorbed on the surface of biochar can form organic matter through complex physical, chemical and biological reactions [33,34]. Based on its unique traits, biochar directly or indirectly improves soil physicochemical properties and nutrient availability, and regulates soil microbial biomass and soil microbial community structure [35,36]. For example, biochar can improve soil permeability and water retention capacity through its large specific surface area and porous structure, thereby providing a better living environment for soil microorganisms [36].
Currently, the application of biochar or EM mostly focuses on monoculture cropland, and is mixed fully with soil through plowing [37,38,39]. And the increases in total microbial diversity with biochar addition vary in acidic and sandy soils with low soil organic carbon content [40,41]. Compared to cropland, the complexity of grassland vegetation species and underground root systems is much higher. Furthermore, for the remediation of natural grassland soil in China, it is forbidden to use completely destructive methods on cropland such as plowing and mixing exogenous additives. So, the effects of biochar and EM on soil properties and microbial activities in grasslands may be different from those described in previous studies on farmland ecosystems. However, few studies have reported on the restoration of degraded alpine grasslands using a combination of biochar and EM, and a combined experiment on fragile degraded grasslands would provide a unique opportunity to explore the restoration effects on the vegetation biomass, soil physicochemical properties and microorganisms of degraded alpine grassland. Therefore, we investigated the improvement effect of the addition of biochar or EM separately or their mixture on degraded alpine grassland, and tested the following hypotheses: (1) Although degraded alpine grassland is different from cropland, adding biochar or EM could significantly increase the vegetation biomass and microorganisms and improve the soil physicochemical properties of degraded grassland. (2) In comparison to biochar or EM addition alone, a synergistic effect of the combined addition of biochar and EM might exist.

2. Materials and Methods

2.1. Study Site and Experimental Materials

This experiment was conducted in a moderately–severely degraded alpine grassland, defined according to the national standard (GB19377-2003) [42], in Senduo Town (36°35′ N, 101°42′ E) in the northeast part of the Qinghai–Tibetan Plateau. The site before the experiment was grazing land. The elevation of the experimental site is 3220 m a.s.l (above sea level). The climate of the study region belongs to a typical plateau continental climate, with mean annual precipitation of 403.80 mm and a mean annual temperature of 2.3 °C. Meanwhile, the annual evaporation is 1378.5 mm, and the annual sunshine hours are 2738 h [43]. The soil type is chernozem. The dominant plants across the whole experimental grassland include Cleistogenes squarrosa, Poa crymophila, Carex tristachya, Elymus nutans. Griseb, Ligularia Cass, Stipa krylovii Roshev. Oxytropis DC and Stellera chamaejasme. L.
Biochar was made using corn straw at 550 °C, which contained 10.2 g kg−1 total nitrogen, 508.9 g kg−1 organic carbon, 80.95 g kg−1 total phosphorus, 8.96 pH and 1595 μs cm−1 electrical conductivity. Effective microorganisms (EM) were selected as the microbial inoculum in this experiment in view of the good performance of EM in previous studies. EM was purchased from Beijing Baofeng Biological Technology Co. Ltd. (China), mainly including photosynthetic bacteria, lactic acid bacteria and yeast and other bacteria, and the number of effective viable bacteria contained was ≥10 × 108 cfu·mL−1.

2.2. Experimental Design and Sampling

The experiment comprised four treatments, including a control (no biochar or EM, CK), biochar addition alone (2%, 4.00 kg m−2, C), EM addition alone (250 mL m−2 EM, M), and the mixed addition of biochar and EM (C+M). A complete random block design was used with three repetitions. Within each block, experimental plots (2 m length × 2 m width) for each treatment were established with a 1.5 m buffer strip between each plot. The amount of biochar added was based on the ratio of its weight to the dry weight of 0–20 cm soil depth at the experimental site (initial soil bulk density was 1 g cm−3). The dosage of EM was twice the maximum applied in the field, and the EM solution was diluted to 1:4 (EM: water, v/v) before its addition. In order to reduce the destruction to the grassland, the biochar and EM were applied to the soil via hole application and surface application. Details of the addition procedure and method have been described in the article of Li et al. [43]. In short, sixteen soil cores (20 cm depth, 3.5 cm diameter) were drilled in each plot with approximately 50 cm intervals between them. Firstly, half of the additives were added into each hole, then the rest were evenly sprayed on the surface of the plot. In order to prevent disturbance due to grazing, the entire field area was fenced during the experiment. The experiment was set up in May 2017.
Plant and soil samples were collected in late July in 2017, 2018 and 2019. For plant samples, three 50 cm × 50 cm quadrats were randomly selected in each plot to collect aboveground plants, and the collected plant samples were oven-dried at 65 °C to a constant weight and weighted. After harvesting the aboveground plants, soil samples were collected from the same quadrats. Three soil sampling sites were randomly selected and soil samples were separately taken from 0–10 cm and 10–20 cm soil layers using a soil auger (3.5 cm diameter). When collecting the soil samples, if the obtained sample coincided with the hole application, we abandoned that drilling sample and collect a new one.
The same layer of the soil sample was composted, and then, separated into three parts: one part was dried at 65°C for soil physiochemical analysis, one part was placed into an aluminum box to test the soil water content (SWC) and the third part was placed in a plastic bag and stored at −20°C for soil microorganism analysis.
The fresh soil was dried at 105 °C for 24 h to determine the soil water content (SWC), which was determined as follows:
SWC = (A2 − A3) × 100/(A3 − GA1)
where A1 is the weight of the aluminum box, A2 is the weight of the aluminum box plus the original soil sample and A3 is the weight of the aluminum box plus the dried soil sample.

2.3. Soil Physicochemical Properties

Using a Fisher 2000 elemental analyzer, we measured soil total nitrogen (TN) and soil organic carbon (TOC) (Thermo Fisher Scientific, Rome, Italy). Using an acidity meter and conductivity meter, we measured soil pH and soil electric conductivity (EC) (METTLER TOLEDO, Zurich, Switzerland). The sodium bicarbonate extraction molybdenum antimony anti-colorimetric method was used to measure soil available phosphorus (AP). A flow autoanalyzer was used to determine NH4+-N and NO3-N (FIA Compact, Berlin, Germany).

2.4. Soil Microorganisms

The microbial communities and structures were measured using phospholipid fatty acid (PLFA), which was modified by White et al. [44]. Briefly, we added a single-phase mixture of chloroform, methanol and phosphate buffer (1:2:0.8) to 8 g of freeze-dried soil and extract lipids. Silicic acid column chromatography was used to isolate and concentrate the crude extracts. Then, they were saponified and methylated to obtain phospholipid fatty acid methyl esters (FAMEs).
Gas chromatography was used to analyze the FAMEs (Agilent 6850, New York, NY, USA). Then, we used Sherlock MIDI software to define the PLFAs (Newark, NJ, USA). The PLFA classification is shown in Table S1.

2.5. Statistical Analysis

We tested the differences in plant biomass, soil physicochemical properties and microorganisms between treatments and years, respectively, using ANOVA and Tukey’s test (with a confidence of 95%) (using the multcomp package). The soil microbe community and structures indicated by PLFAs were evaluated and analyzed using principal component analysis (PCA) with the vegan package. Redundant analysis (RDA) was used to test the relationships between the microorganisms and environmental variables (using the R vegan packages). The angles between the arrows indicating PLFAs and environmental factors indicate the relationship between microorganisms and environmental factors. The correlation coefficients between soil physical and chemical properties were determined using Pearson correlation in R software. The correlations that were not significant were deleted. The relationships between the environmental variables and microbial communities (PLFAs) of different treatments were compared using the mantel test with the vegan package. To determine the compatibility of microorganisms and environmental factors in different treatments, Procrustes analysis was performed using the PCA (Bray–Curtis) results of different treatments with the vegan package. All statistical analyses were performed using R 4.0.2. The significance level for all statistical tests was p < 0.05.

3. Results

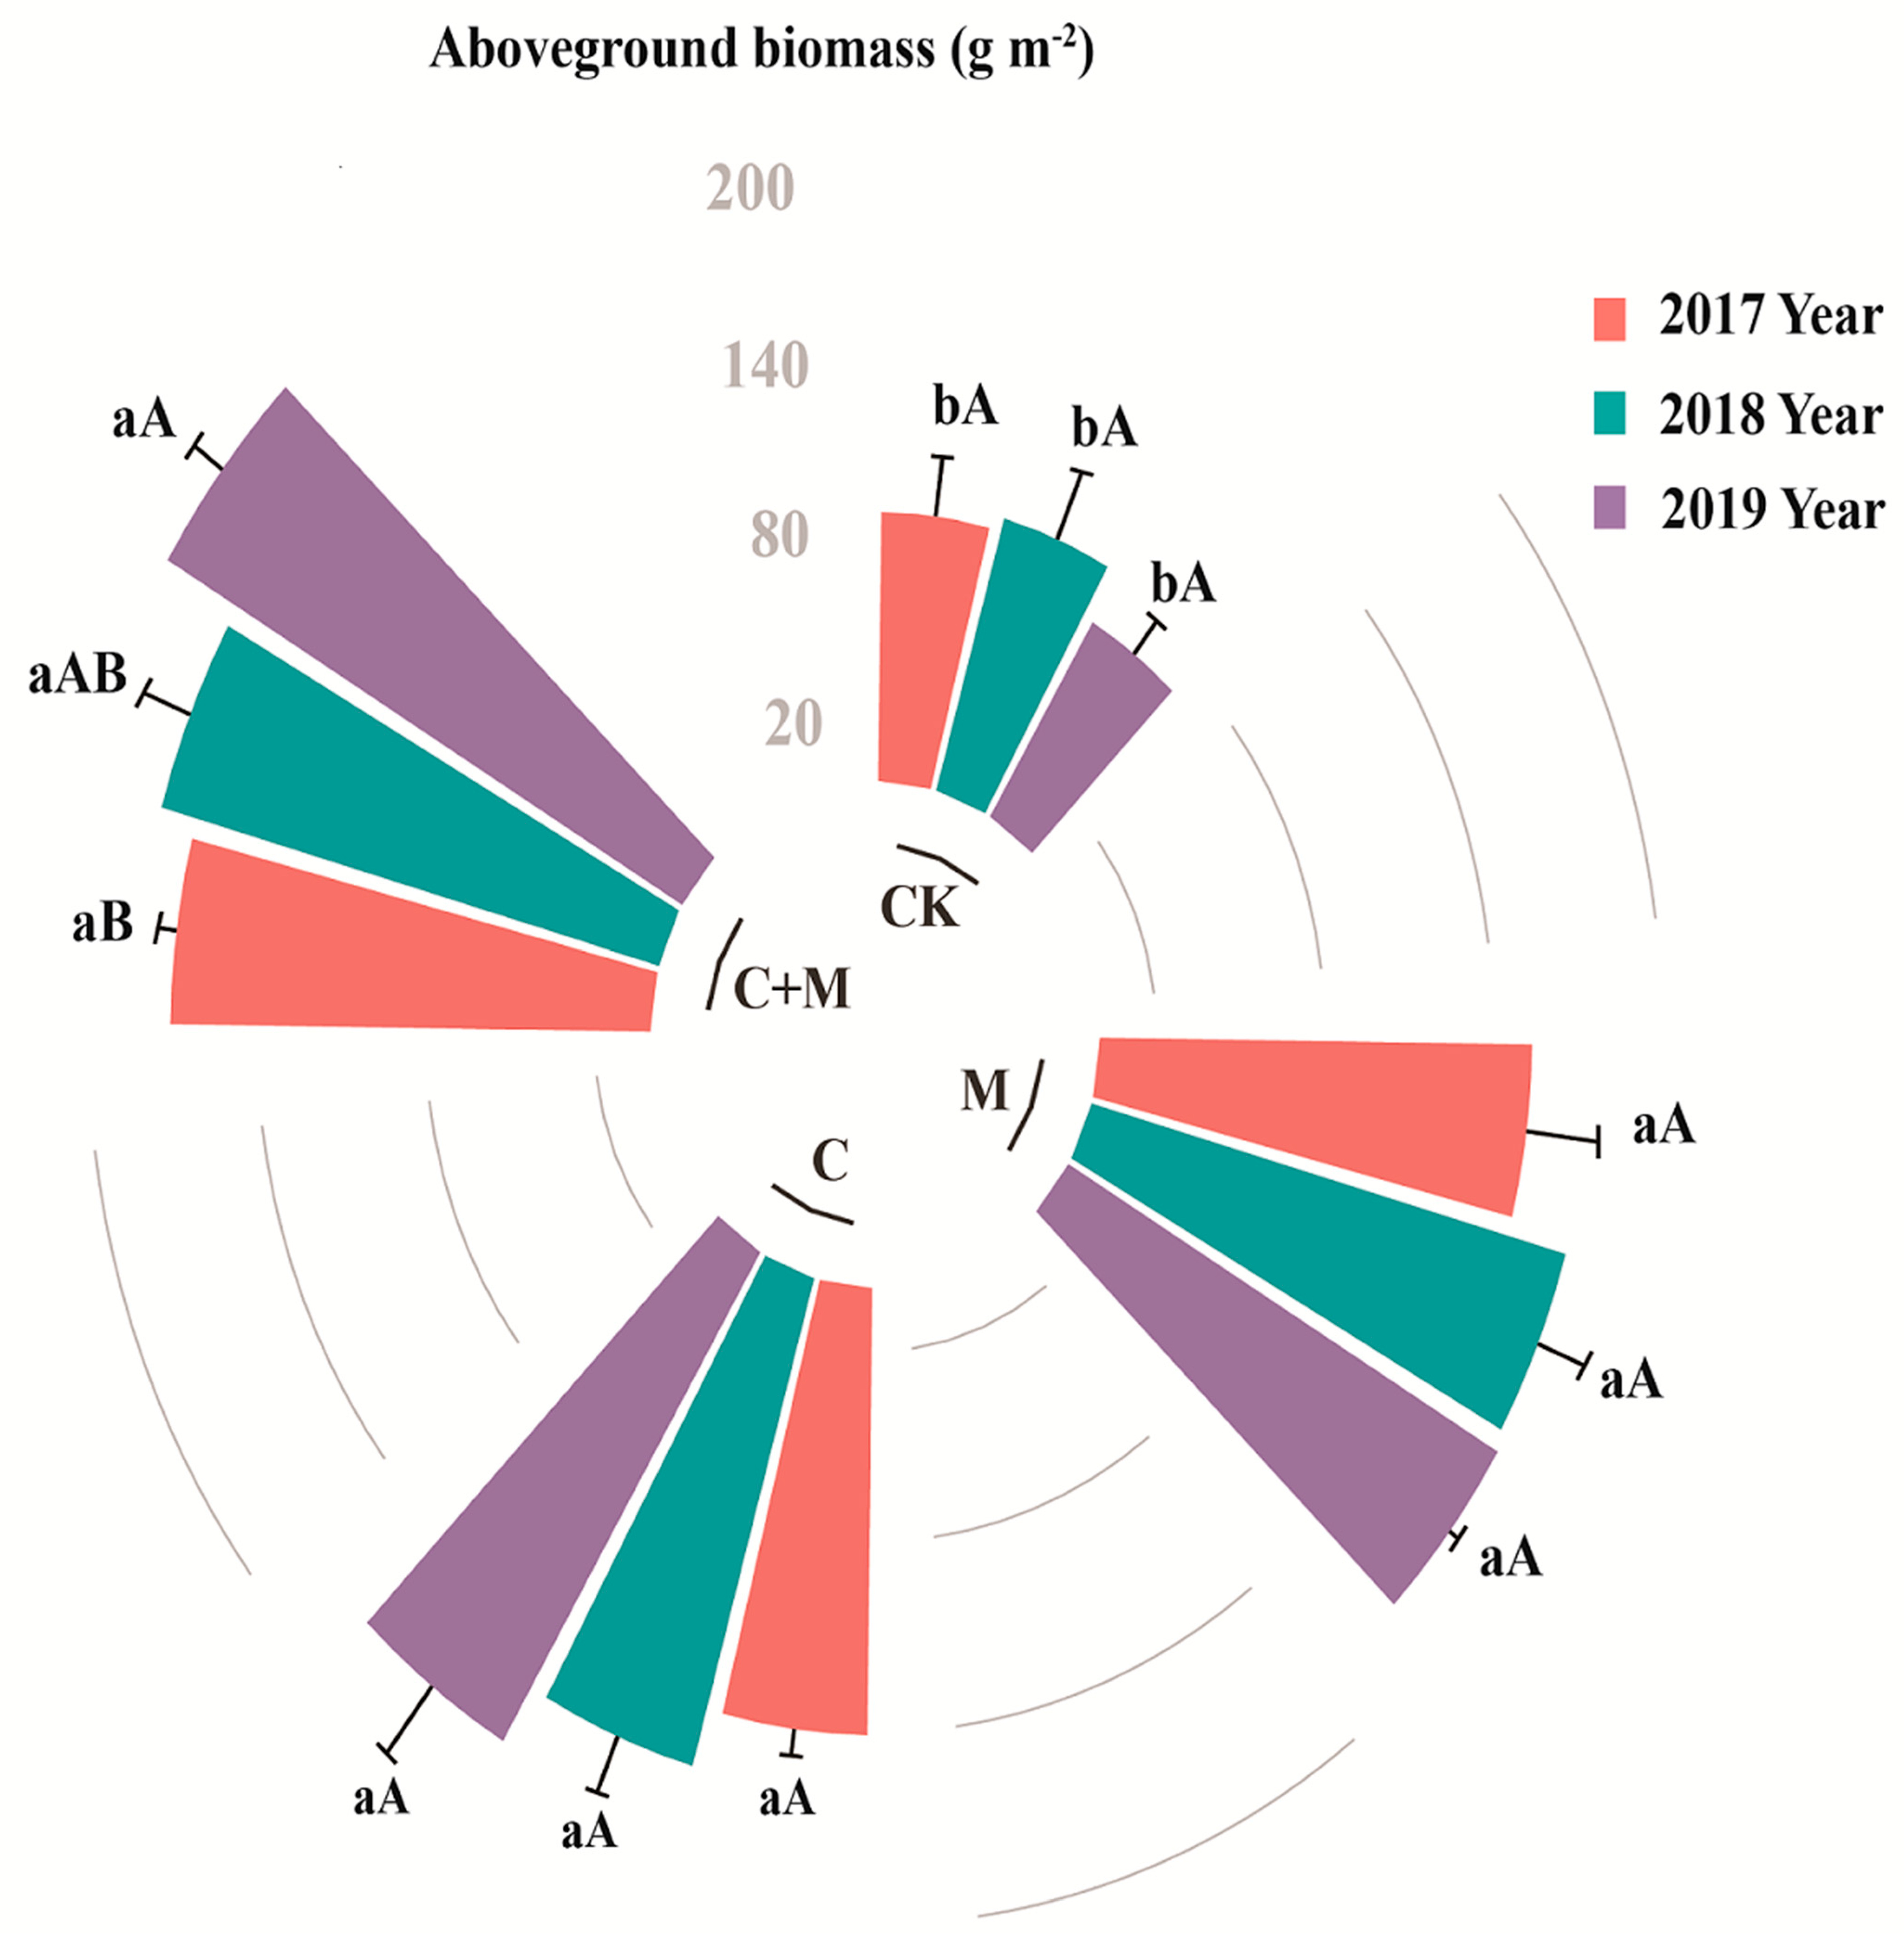
3.1. Changes in Aboveground Vegetation Biomass

Compared with CK, biochar or EM addition (C, M and C+M) significantly increased the aboveground biomass of degraded alpine grassland (Figure 1). During the three years, EM addition alone increased the above-ground biomass of degraded alpine grassland by 81.02~149.10%, biochar-only addition increased the aboveground biomass of degraded alpine grassland by 65.82~151.07%, and the addition of C+M increased the aboveground biomass of degraded alpine grassland by 101.04~198.52%. Overall, the aboveground biomass with the C+M treatment was significantly higher than with the other treatments. In addition, the aboveground biomass increased significantly with the increase in years, with values of 170.72 g m−2, 183.83 g m−2 and 212.86 g m−2 in 2017, 2018 and 2019, respectively.

3.2. Changes in Soil Physicochemical Properties

Biochar addition (C, C+M) increased the pH of the 0–20 cm soil layer, but the pH in each treatment first increased, and then, decreased with the increase in years (Table 1). Compared with CK, EM and biochar addition, especially C+M, significantly decreased soil EC and increased the SWC of the whole soil sample (0–10 cm and 10–20 cm). In addition, SWC had a greater increase with the C and C+M treatments compared with the EM-only addition, especially in the top soil (0–10 cm) (Table 1).
Compared with CK, biochar and EM addition, especially C+M, significantly increased the TOC (Table 2). Moreover, the TOC in the deep soil (10–20 cm) increased significantly with the increase in the residence time of biochar or EM (Table 2). The TN also increased significantly after biochar or EM addition, but there was no significant difference between the C and M treatments (Table 2). The C/N had no significant change between the CK and M treatments, but increased in the treatments with biochar addition (C, C+M, Table 1). The NH4+-N in the treatments with biochar or EM addition was significantly higher in the top soil than that in CK, but in the deep soil, the NH4+-N in the C and C+M treatments was significantly higher than that in CK (Table 2). The NO3-N in the top soil had little change between the M and CK treatments in the first year (2017), but was significantly higher in the C and C+M treatments than in CK. In the third year (2019), the NO3-N in the biochar and EM addition treatments was higher than that in CK (Table 2). In the deep soil, the trend of NO3-N in the first year was similar to the top soil, but in the third year, the NO3-N decreased in the M treatment. However, there was no difference in the C and C+M treatments (Table 2). Interestingly, we found that TOC, NH4+-N and NO3-N in the C+M treatment were lower than those in C treatment, but higher than those in M treatment in 2018 and 2019. Compared with CK, AP in the deep soil was significantly increased in the biochar and EM addition treatments, especially in the C+M treatment (Table 2).

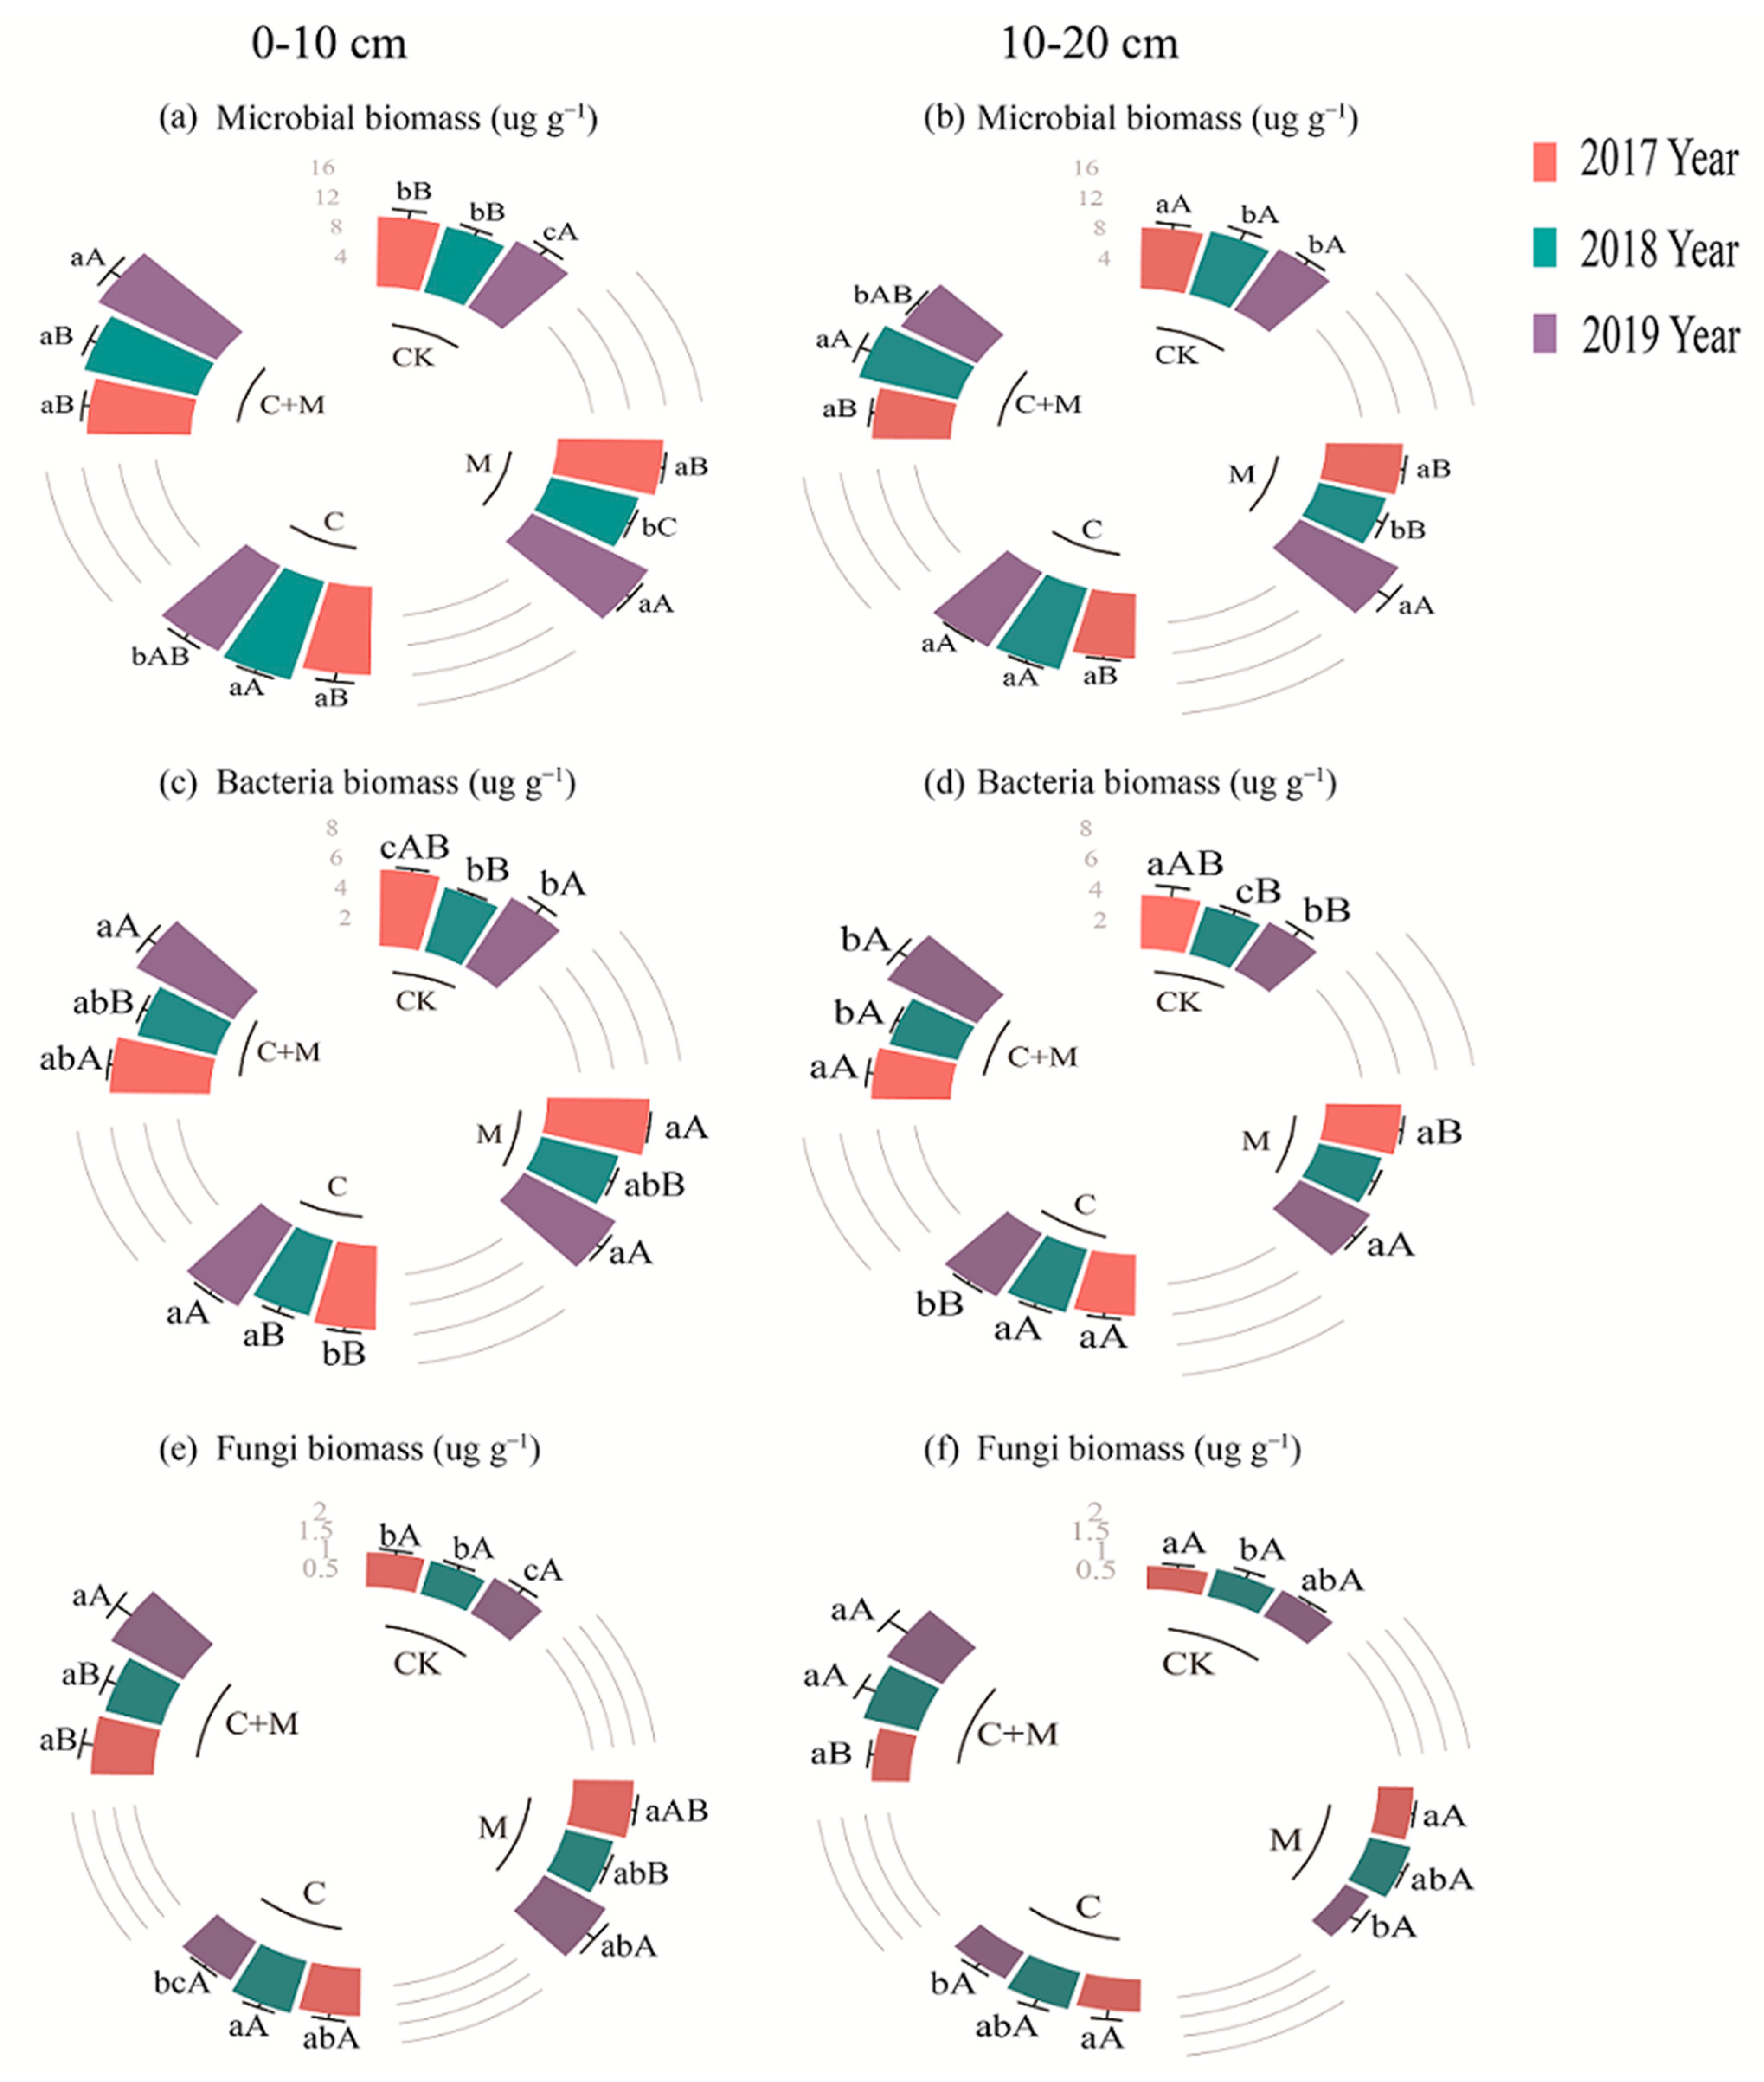
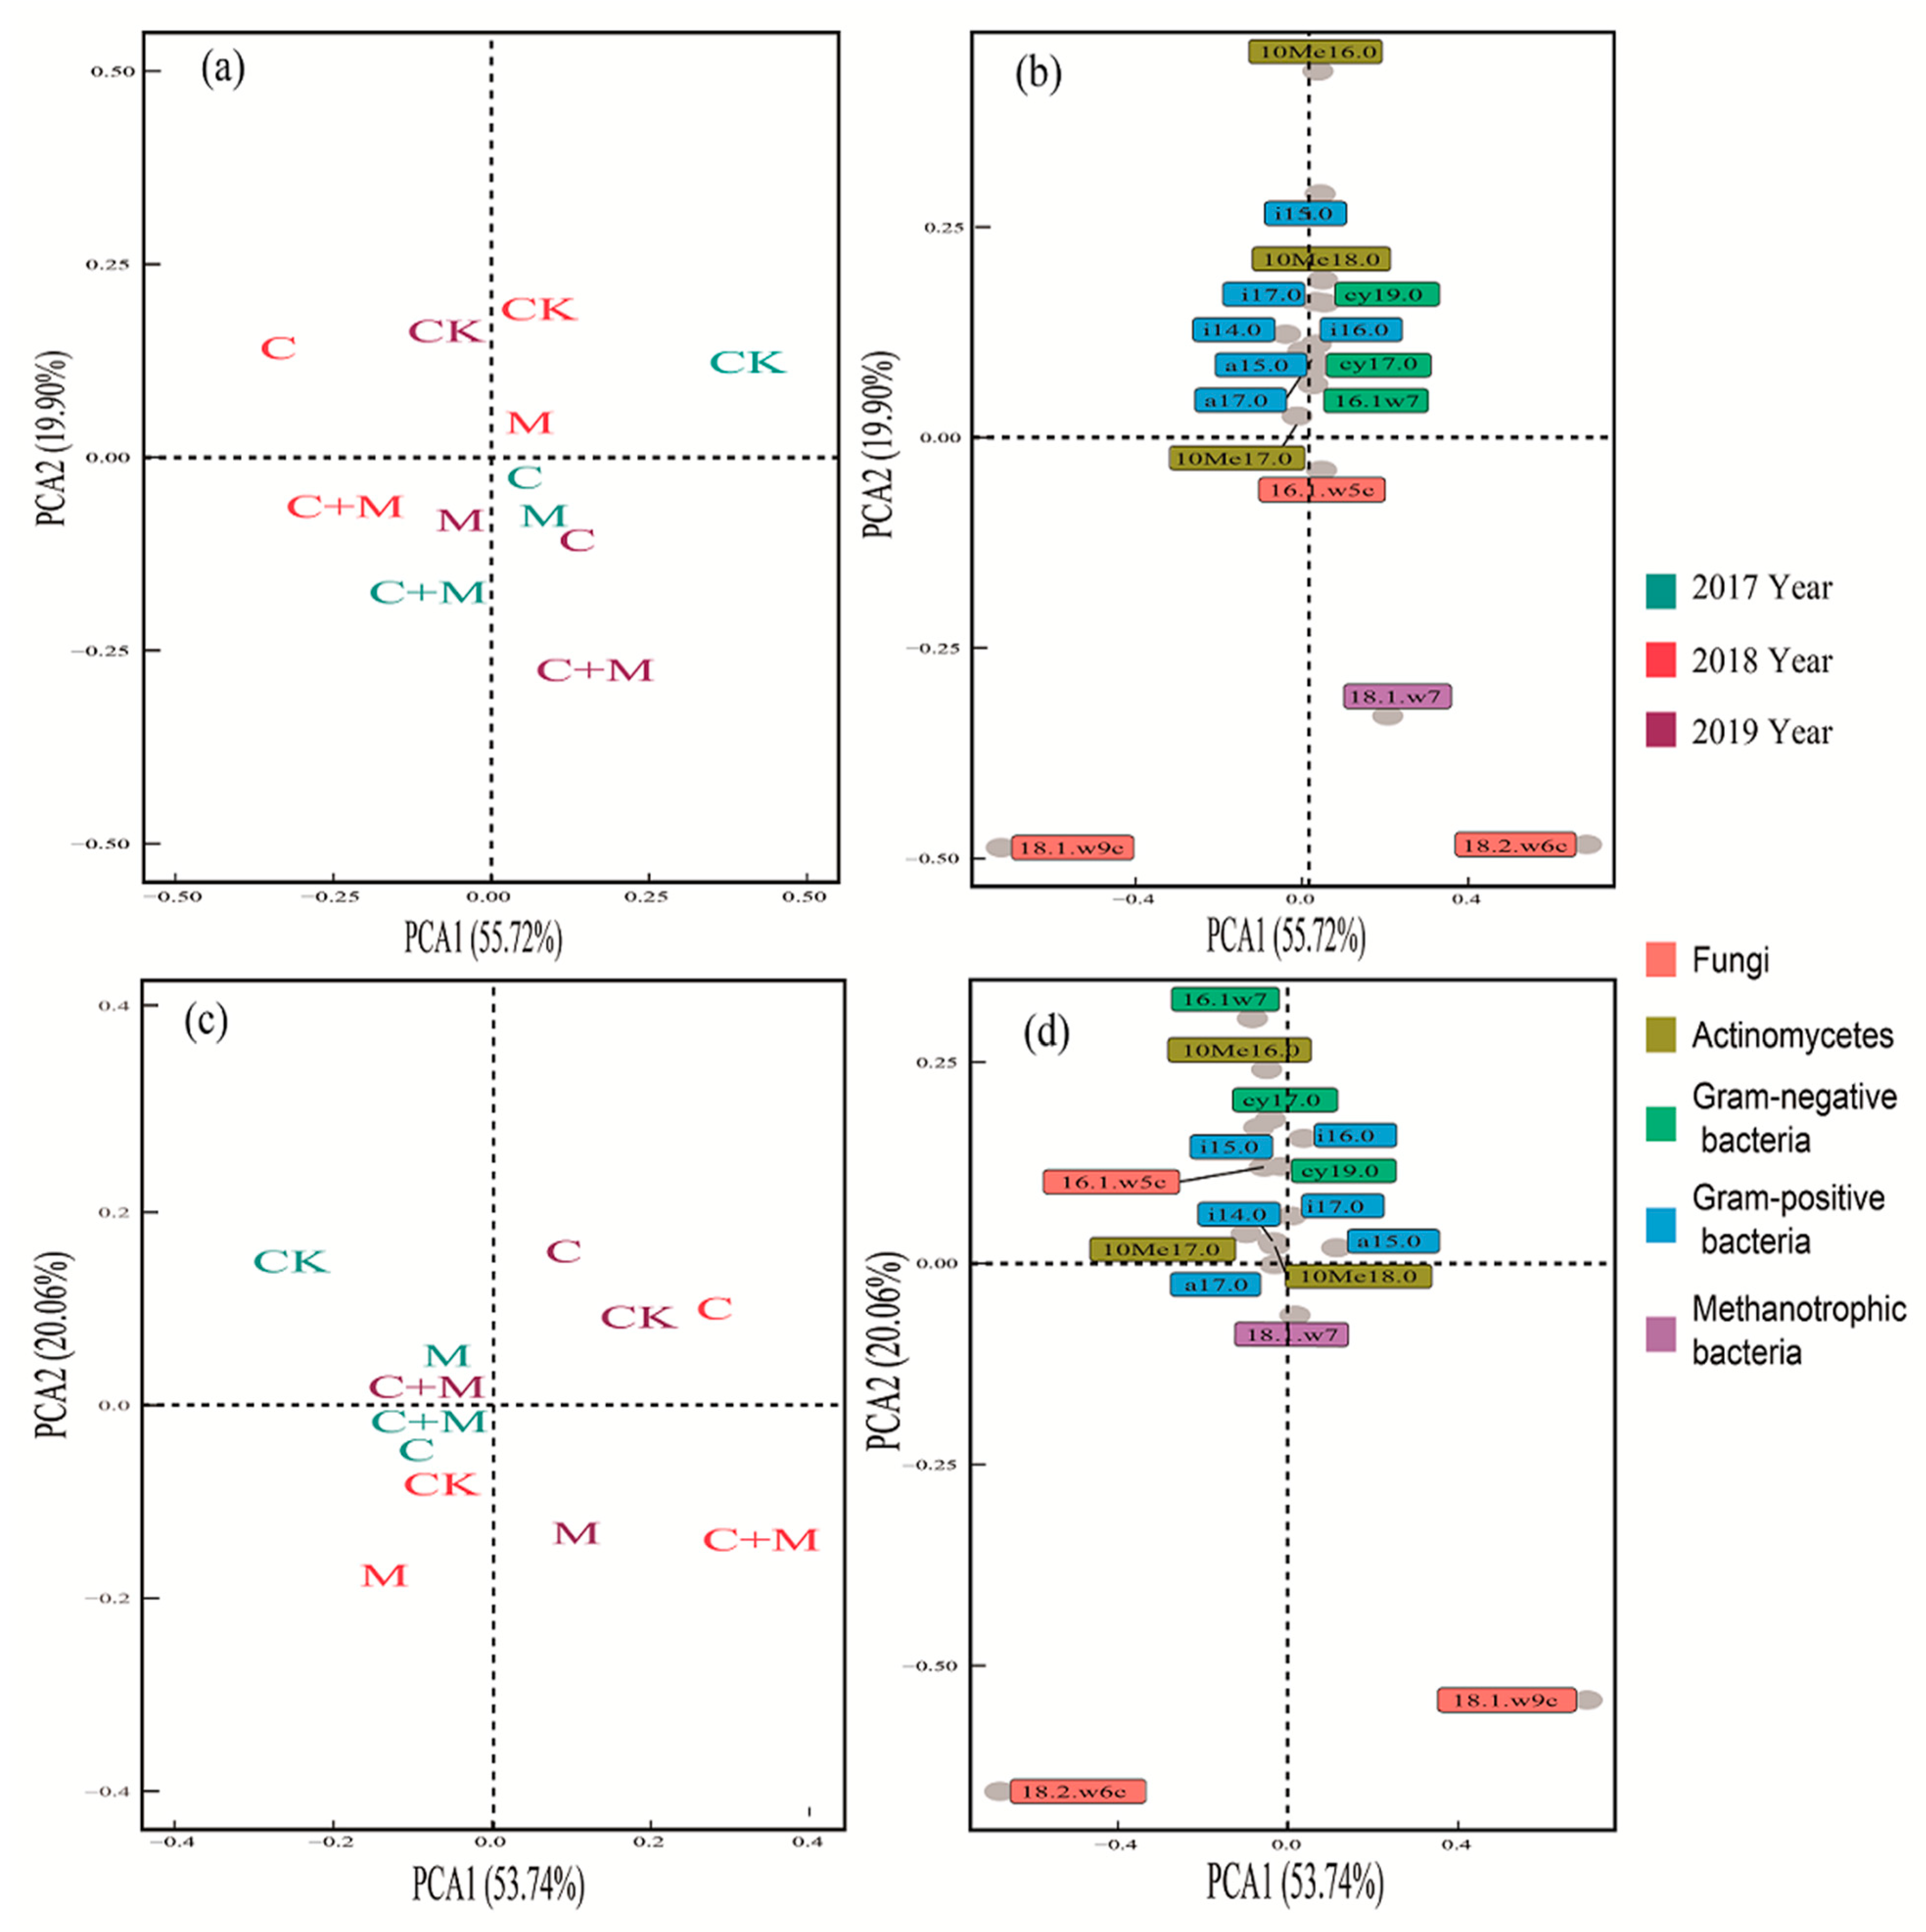
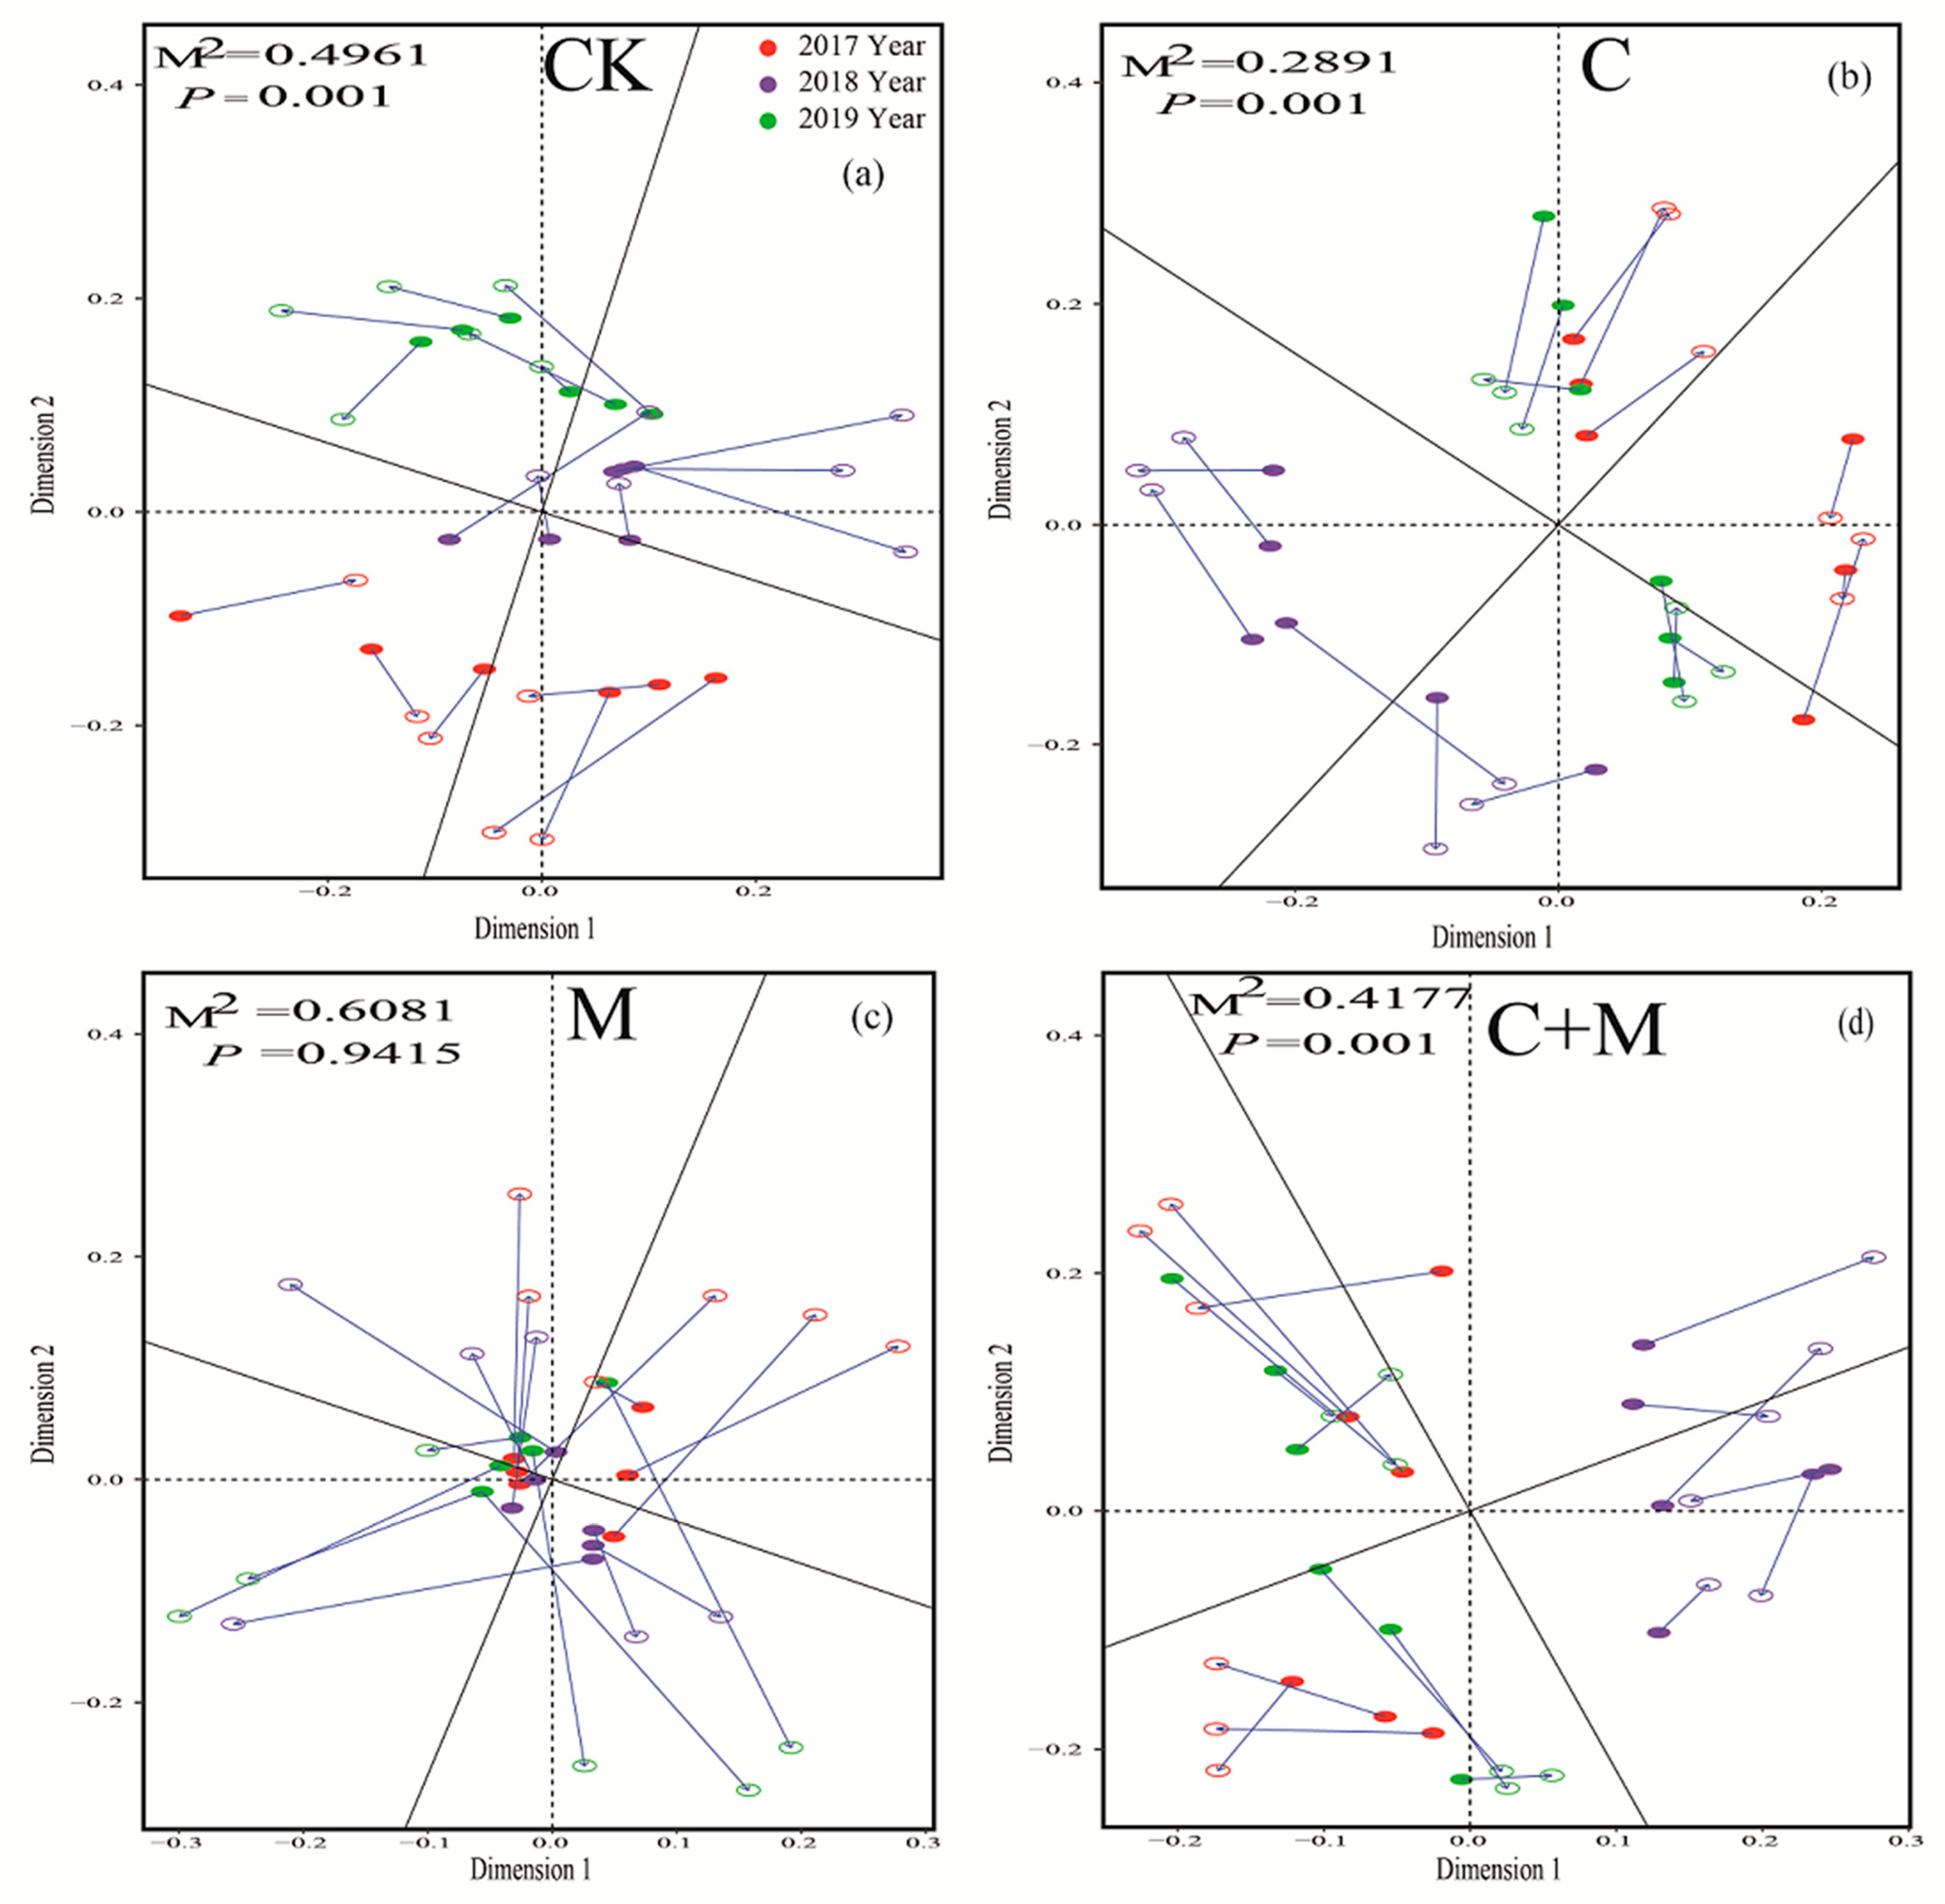
3.3. Changes in Soil Microorganisms

In the 0–10 cm soil layer, biochar and EM addition caused a significant increase in the total biomass of microorganisms compared with CK (Figure 2a). With the increase in years, the microbial biomass in the biochar and EM addition treatments showed a significant increase, especially in the C+M treatment. The microbial biomass in the C+M treatment increased from 11.31 µg g−1 in 2017 to 14.98 µg g−1 in 2019 (Figure 2a). Similar to the top soil (0–10 cm soil depth), the microbial biomass in the deep soil (10–20 cm soil depth) increased significantly in the biochar and EM addition treatments with the increase in years (Figure 2b).
Compared to CK, the content of bacteria in the biochar and EM addition was significantly higher in the top soil (Figure 2c). The bacteria in each treatment decreased first, and then, increased with the increase in years (2019 > 2017 > 2018). Fungus content in the M, C and C+M treatments was significantly higher than that in CK, and showed an increasing trend year by year in the top soil (Figure 2e). In the deep soil, bacteria and fungi had no significant changes among treatments, but increased with the increase in years in the C+M treatment (Figure 2d,f).
Biochar and EM addition significantly increased the F: B in the top soil compared with CK, especially in the C+M treatment (Table 3). GP:GN had no significant difference in the deep soil. However, as the years increased, GP:GN had a downward trend (Table 3). Meanwhile, the addition of biochar (C, C+M) significantly reduced the MB: TOC in the top cm soil (Table 3). The MB:TN in each treatment did not change significantly in the top soil in 2017 and 2018, but the MB:TN in the M, C and C+M treatments was higher in 2019 than in CK, and highest in the C+M treatment (3.94, Table 3).
In PCA, PC1 and PC2 explained the variation of 75.62% and 73.80% in the top and deep soil, respectively (Figure 3). With increasing years, the dispersion degree of the different treatments increased, and the degree of dispersion in the top soil was greater than that in the deep soil (Figure 3a,c). In the top soil, the relative contents of arbuscular mycorrhizal fungi (16.1w5c), saprotrophic fungi (18.2.w6,9c, 18.1.w9c) and methanotrophic bacteria (18.1.w7c) were higher and those of other microorganisms were lower in the biochar and EM addition treatments than in CK, especially in the C+M treatment (Figure 3a,b). In the top soil, the microbial community structure among the treatments was relatively similar in 2017; the relative contents of Gram-positive bacteria (a15.0, i16.0) and saprotrophic fungi (18.1.w9c) in the C and C+M treatments were higher than those in the M and CK treatments in 2018; and the relative contents of saprotrophic fungi (18.1.w9c, 18.2.w6,9c) and methanotrophic bacteria (18.1.w7c) were higher in the M treatment in 2019 (Figure 3c,d).

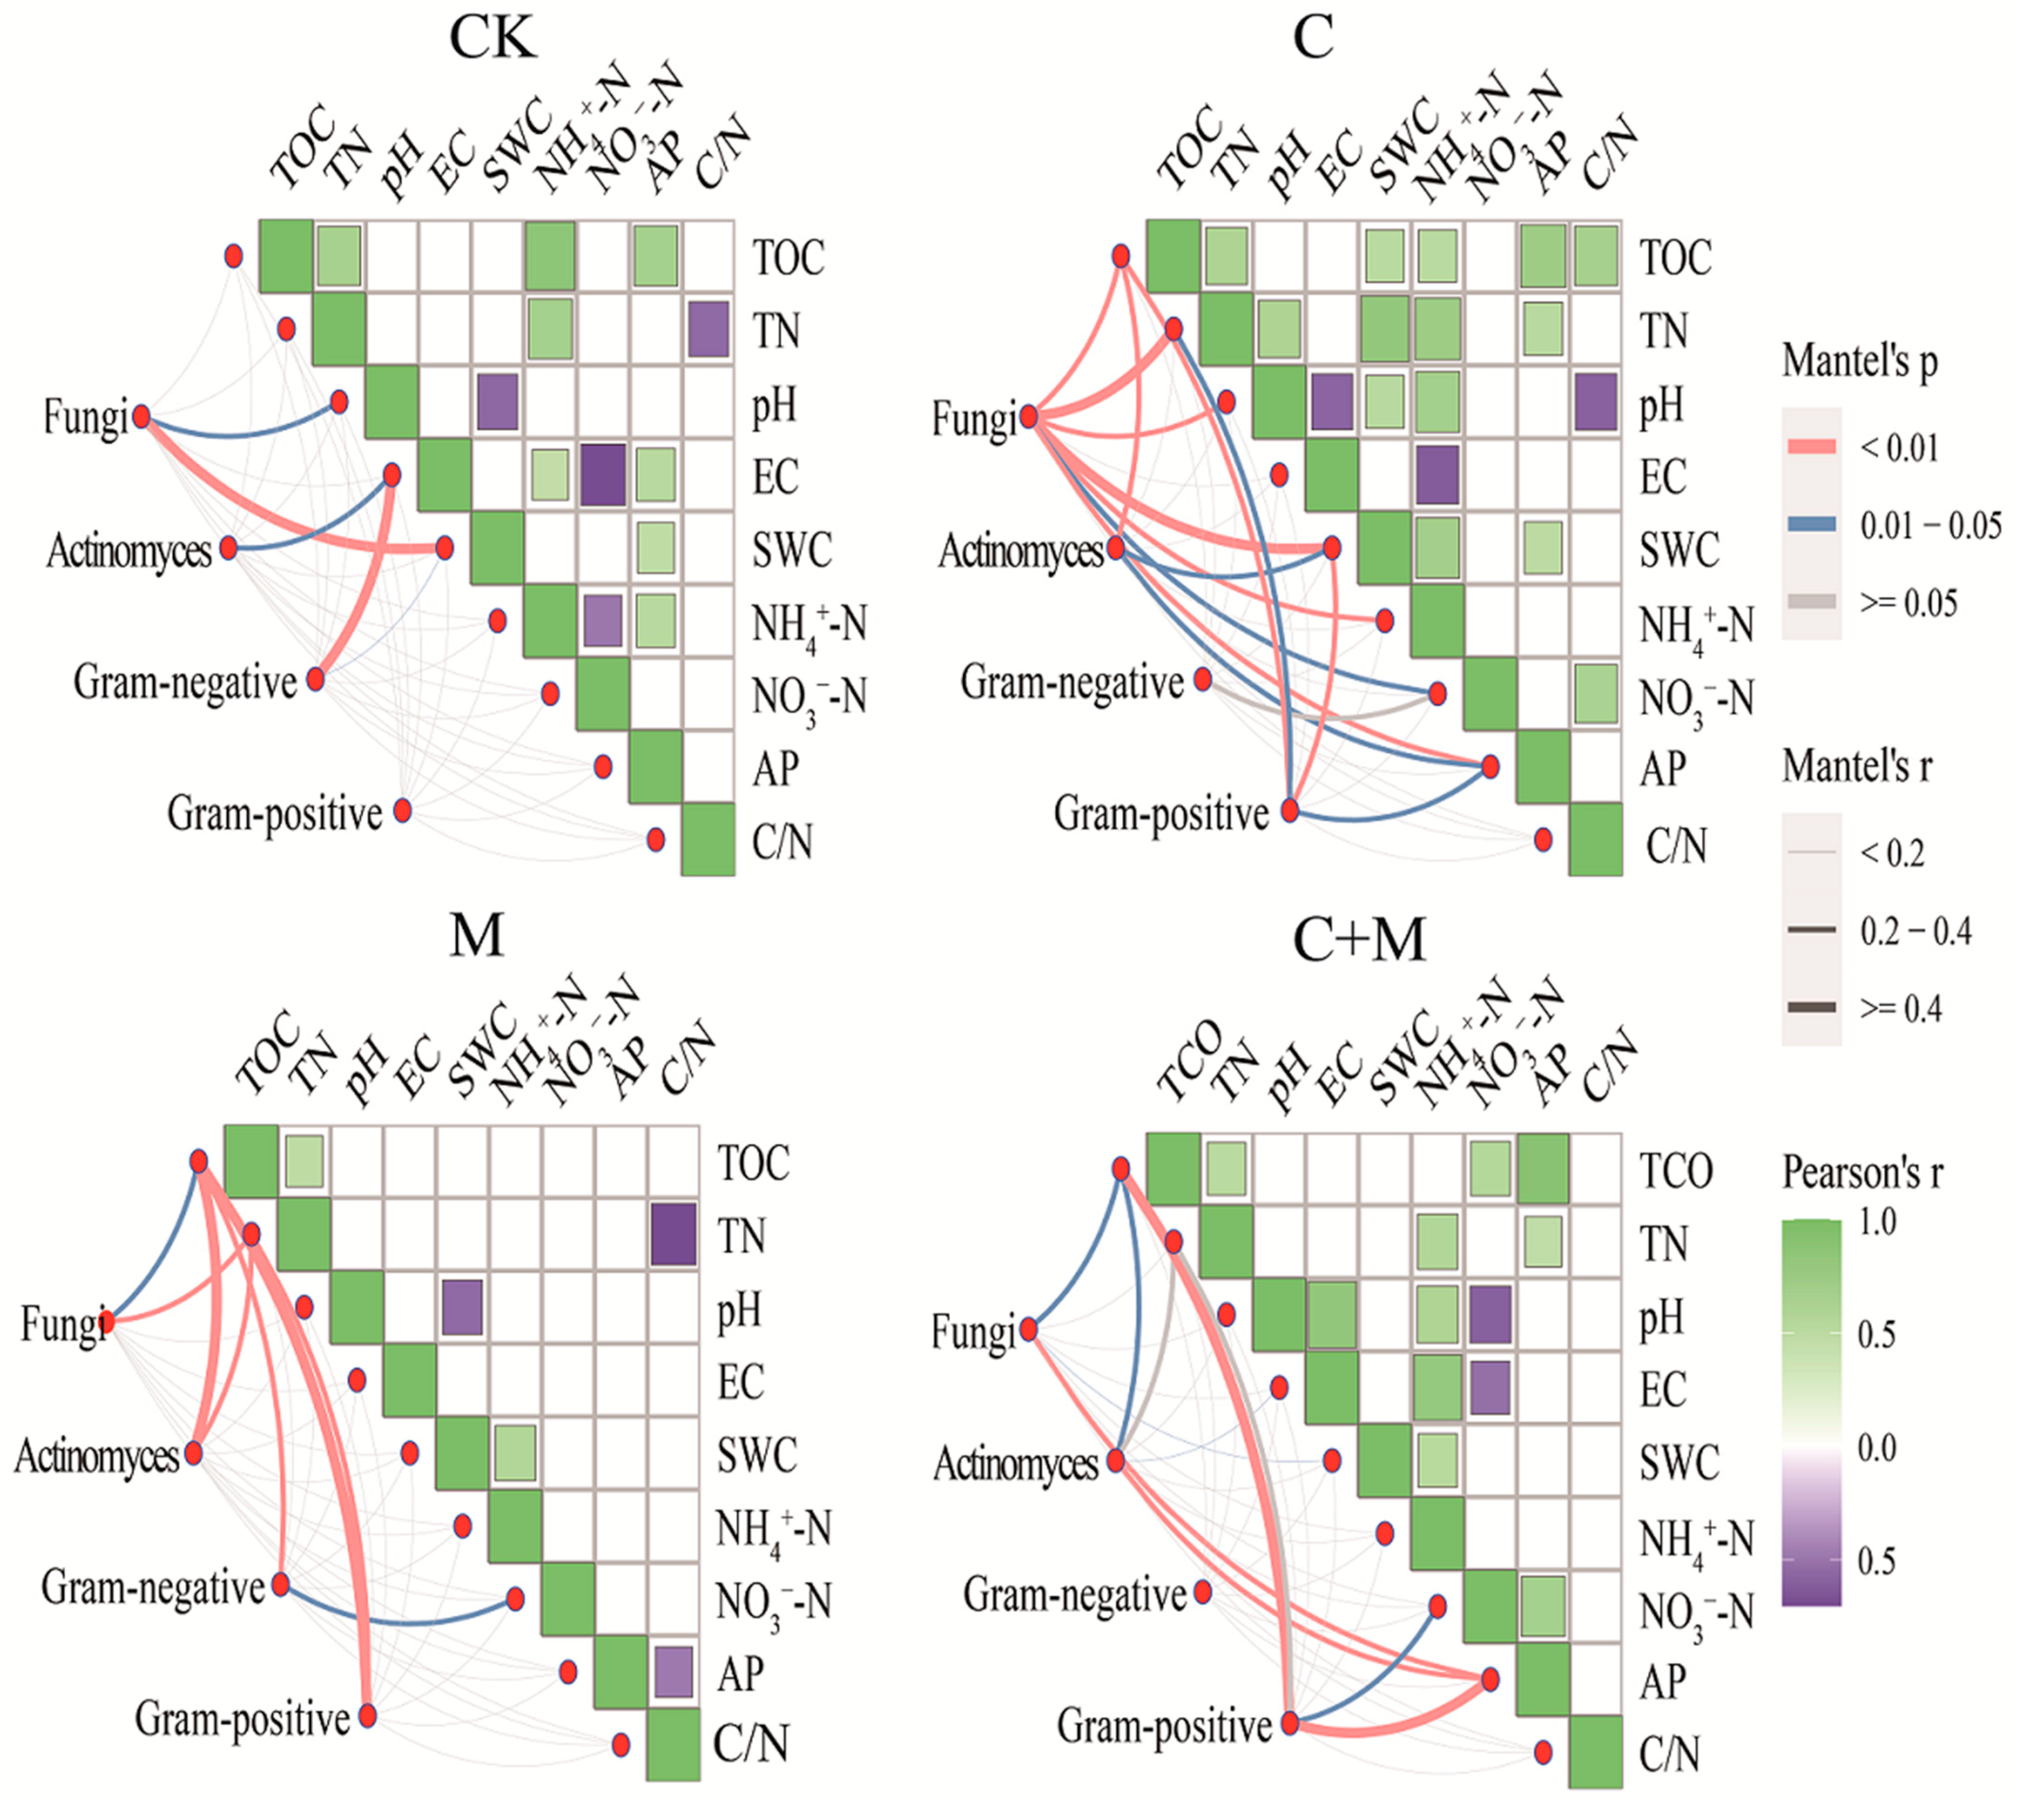
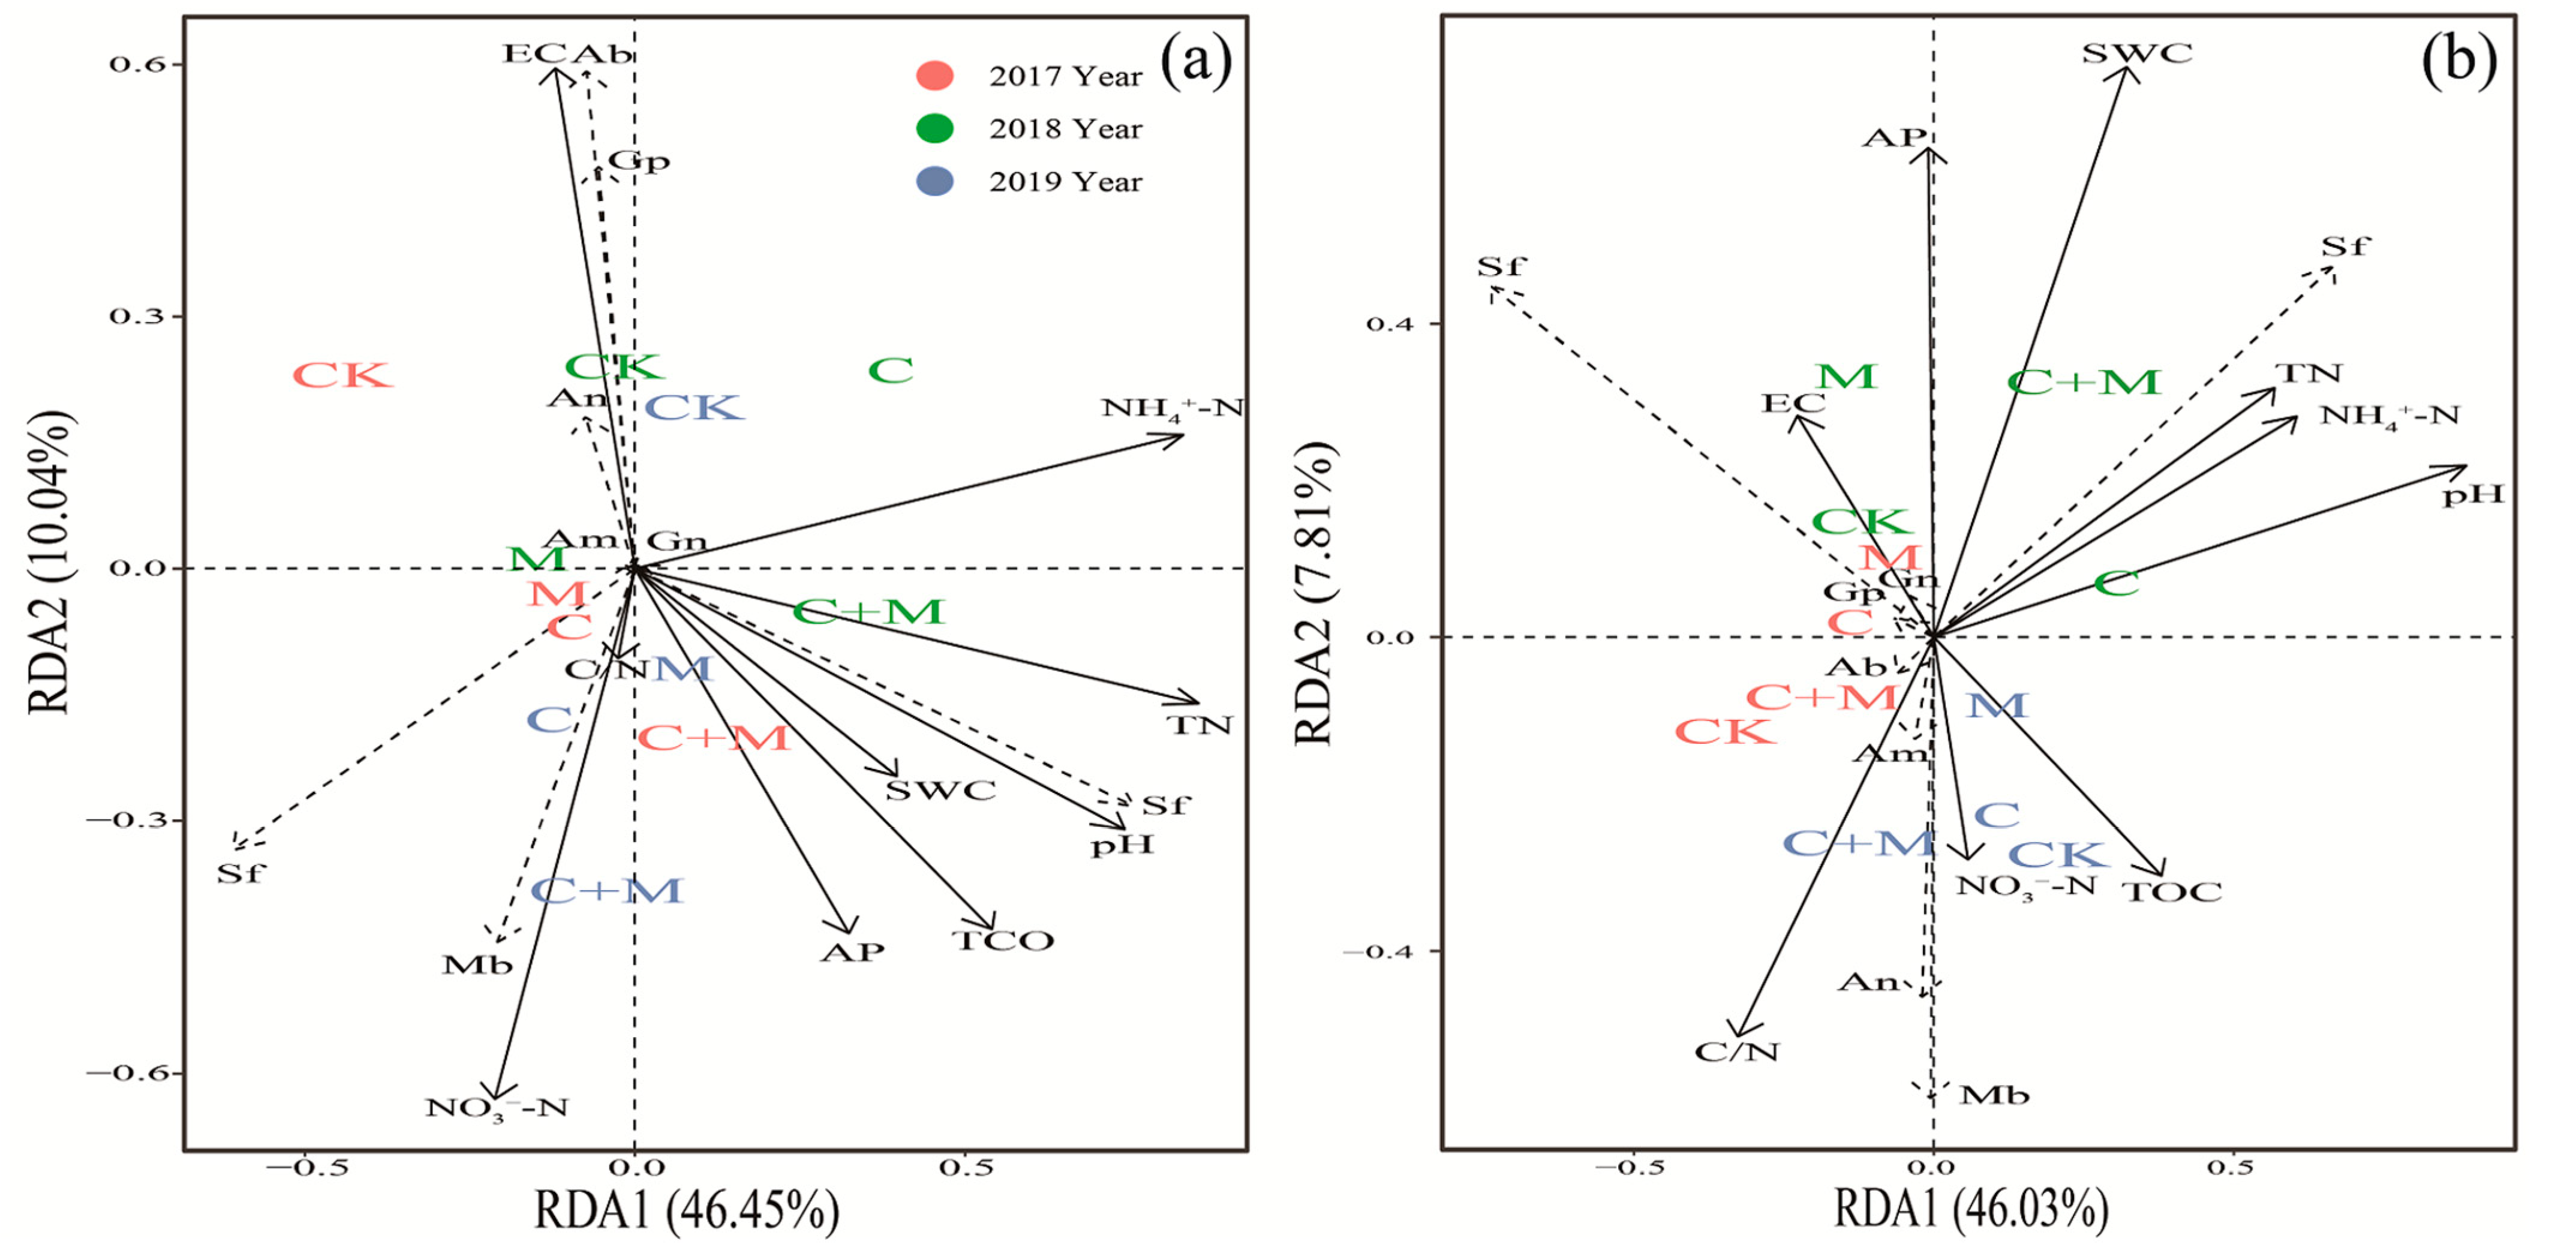
3.4. The Interaction between Microorganisms and Soil Properties

Biochar and EM addition changed the interactions between soil microorganisms and soil properties. In CK, the interaction between different microbial communities and soil physicochemical properties was weak; only pH, EC and SWC had significant interactions with microbial communities. In the M treatment, different microbial communities had a significant relationship with TOC and TN, but the correlation between different soil physicochemical properties was weak. In the C treatment, fungi, actinomyces and Gram-positive bacteria had significant correlations with soil physicochemical properties. In the C+M treatment, TOC, TN and AP were significantly correlated with fungi, actinomyces and Gram-positive bacteria (Figure 4). Except for the M treatment, the P value of the Procrustes analysis in the other treatments was less than 0.05, and the M2 performance was C (M2 = 0.2891) < C+M (M2 = 0.4177) < CK (M2 = 0.4961) < M (M2 = 0.6081) (Figure 5). So, the relationship between the environmental variables and microbial community was better in the C treatment, followed by the C+M treatment (Figure 5b,d).
In the RDA, the influence of C/N and SWC on the microbial community structure was smaller in the top soil than that of the other soil factors. Sf (Saprotrophic fungi) was positively correlated with most soil factors. The sensitivity of microorganisms to soil factors in the C and C+M treatments was higher than that in CK and M treatments, especially the C+M treatment (Figure 6a). In the deep soil, the influence of C/N and SWC on the microbial community structure was higher than that of the other soil factors (Figure 6b).

4. Discussion

4.1. Responses of Aboveground Vegetation Biomass to the Addition of Biochar or EM

Biochar and EM addition significantly increased the biomass of aboveground vegetation (Figure 1). This study also found that the nutrient content in soil increased significantly after the addition of biochar or EM (Table 2). This might be the key reason for the significant increase in aboveground biomass. Studies have shown that biochar can change soil fertility and the availability of nutrients to plants [27,45]. This is because, on the one hand, biochar contains certain nutrients (N, P, K) that can promote the growth of plants [27,45]. On the other hand, biochar can increase the permeability of soil [46], change the physical properties of soil to increase the availability of soil nutrients [22] and improve plant nutrient absorption [27], thus promoting plant growth. And biochar improved soil proteobacteria abundance and most of the ammonia-oxidizing bacteria, including nitrogen-fixing bacteria, ammonia-oxidizing bacteria, cellulose-decomposing bacteria, nitrifying bacteria and denitrifying bacteria belonging to proteobacteria, meaning it plays a significant role in nitrogen recycling, which is beneficial for plant growth, yield and fruit seed quality [47]. Previous studies have shown that EM can be used as an activator of soil. The addition of EM can accelerate the decomposition of soil organic matter, improve soil fertility, increase soil nutrient elements and ultimately promote plant growth [48,49]. In addition, the beneficial flora in EM (such as photosynthetic bacteria and lactic acid bacteria) can not only increase plant photosynthesis and improve plant nutrient absorption, but also inhibit the growth of pathogenic bacteria [49]. We found that the biomass of aboveground vegetation was the largest in the C+M treatment (Figure 1). This indicated that biochar addition combined with EM had a strong synergistic effect. This might be because when biochar and EM were added together, EM compensated for the deficiency in microorganisms and provoked the reproduction of other beneficial bacteria, and biochar addition reduces nutrient loss and provides a good habitat environment for microorganisms [22,29,50]. Many studies confirm the above findings and biochar has been extensively studied as a soil amendment for carbon sequestration and for improving soil quality. The systematic understanding of the responses of soil microbial biomass and diversity to biochar addition shows that biochar increases microbial biomass but has variable effects on microbial diversity [9,51]. The application of biochar, particularly that produced under low temperatures and from nutrient-rich feedstocks, could better increase soil microbial biomass (based on phospholipid fatty acid analysis (MBCPLFA)) and diversity [52]. A study confirmed that the increases in total microbial diversity with biochar addition were greater in acidic and sandy soils with low soil organic carbon content [40]. These studies confirmed that the combination of biochar and EM was a more effective strategy to promote the productivity of degraded alpine grasslands.

4.2. Responses of Soil Physicochemical Properties to the Addition of Biochar or EM

Under the C and C+M treatments, the pH increased significantly (Table 1). Since biochar contains ash elements (K, Na, Mg), it can increase the soil salinity saturation and reduce the level of exchangeable hydrogen ions and aluminum ions through adsorption [53], thereby increasing soil pH. However, we found that the pH did not increase continuously with the increase in experimental time. This may be because the ash elements contained in biochar were leached out or absorbed by plants, preventing the continuous increase in pH. EM containing a lot of lactic acid bacteria not only makes the bacterial liquid acidic, but also produces organic acid during the decomposition of organic matter, therefore decreasing the soil pH [54]. The addition of EM and biochar decreased soil EC (Table 1). This is probably because EM can inhibit the accumulation of Na+ and increase the uptake of N, P, K+, Fe, Zn and Cu by plants [22]. The decreasing effect of biochar on EC occurs mainly because biochar, on the one hand, adsorbs salt through its strong adsorption capacity and reduces soil salt ions [55], and on the other hand, can change the physical structure of the soil (increases its porosity) and accelerate the leaching of soil salts [56].
Soil TOC and TN under biochar and EM addition significantly increased, and showed an increasing trend with the increase in experimental years. The increasing intensity in the top soil was greater than that in the deep soil (Table 2). First, biochar generally contains a large amount of inert organic carbon, a small amount of variable organic carbon and abundant nitrogen. When biochar enters the soil, the organic carbon and nitrogen within the biochar will be added to the soil [57,58]. Second, biochar has a strong adsorption capacity, and can absorb small organic molecules in the soil and make them aggregate to form organic matter; then, it produces a negative priming effect with soil organic carbon mineralization, and finally, it increases soil carbon sequestration [59,60]. In addition, biochar can indirectly increase carbon and nitrogen in the soil by changing the soil physicochemical properties and biological characteristics. Biochar addition increases soil porosity and promotes the formation of soil aggregates [61], increases soil microorganisms to accelerate litter decomposition [62], and increases the formation of endogenous carbon and nitrogen and the input of exogenous carbon and nitrogen [56]. The beneficial microorganisms in the EM not only produce nutrients to improve soil fertility, but also improve soil permeability and aggregate structure to enhance the soil physicochemical properties and reduce soil particle loss, thereby increasing soil carbon and nitrogen [63]. In addition, EM can increase the activity of soil enzymes, promote the decomposition of soil organic matter, and then, increase the accumulation of soil carbon and nitrogen [64]. In this study, biochar-only addition significantly increased the C/N in the top soil, but EM addition (M, C+M) reduced the C/N, especially in the C+M treatment (Table 1). Biochar addition (C, C+M) significantly supplemented soil organic carbon. However, under the addition of M or C+M, some soil organic carbon was decomposed (Table 2), and thereby, the C/N was reduced. The C/N in the C+M treatment was maintained at the global average level of grasslands (11.8) [65]. This indicated that the biochar addition combined with EM could make soil carbon and nitrogen at a relatively balanced level, which was conducive to maintaining the health of the grassland soil system.
Biochar and EM addition also changed the condition of other nutrients in the soil. With the increase in years, NH4+-N first increased, and then, decreased, while the NO3-N was the opposite (Table 2). Jenkins et al. [66] found that the available nitrogen in biochar mostly existed in the form of nitrate nitrogen. So, when biochar entered the soil, nitrate nitrogen was rapidly supplemented (Table 2). In 2018, the soil at the study site had a relatively high pH and SWC. High soil water content may cause soil hypoxia. Together with high pH, this may inhibit nitrification and increase the accumulation of NH4+-N [67]. In addition, microorganisms prefer to use ammonium nitrogen rather than nitrate nitrogen [68]. Meanwhile, the MB: TN in each treatment was lower in 2018 than in 2017 and 2019 (Table 3). The combined effects of these factors might result in the accumulation of NH4+-N. However, with the decrease in SWC in 2019, nitrification was promoted (Table 2). As the residence time of biochar in soil increases, the adsorption capacity of soil to NH4+ is enhanced [69]. Therefore, even if the nitrification was enhanced, there was still high NH4+-N in the C and C+M treatments (Table 2). Although the inter-annual variation in ammonium nitrogen and nitrate nitrogen was different after the addition of biochar, biochar significantly increased the content of soil inorganic nitrogen. This may be because biochar can increase the activity of enzymes and nitrogen-fixing bacteria, thus increasing the mineralization of soil nitrogen [70,71]. Studies have shown that EM addition can promote the activity of soil microorganisms and enzymes, accelerate the decomposition of organic matter and increase the nitrogen fixation ability of beneficial microorganisms. Therefore, the addition of EM can increase the mineralization and fixation of nitrogen, which is consistent with the results of this experiment.

4.3. Responses of Soil Microorganisms to the Addition of Biochar or EM

The total amounts of microorganisms, bacteria and fungi increased in the soil of degraded alpine grassland when biochar or EM was added, and the microbial biomass showed an upward trend with the increase in experimental years (Figure 2). The high adsorption capacity and cation exchange capacity of biochar helps to hold nutrients in the soil, and provides a substrate for the growth and metabolism of soil microorganisms (Table 2) [60,68]. In addition, biochar provides a good habitat for the reproduction of microorganisms due to its porous structure and ability to change the porosity of soil [72]. EM can rapidly increase the activity and amount of microorganisms [25], and decompose soil organic matter to provide a substrate for the growth and metabolism of microorganisms [73].
Some studies have shown that biochar and EM can not only cause changes in microbial biomass but also change microbial community structure [72,74]. In our study, the relative content of saprotrophic fungi (18:1w9c, 18:2w6,9c) and F/B in the C, M and C+M treatments was greater than that in CK, while the relative content of actinobacteria was lower, especially in the C+M treatment (Figure 3). This indicated that the activity of saprotrophic fungi (18:1w9c, 18:2w6,9c) in degraded alpine grassland was promoted by biochar or EM addition. Saprotrophic fungi (18:1w9c, 18:2w6,9c) mainly grow on the surface of young roots, and mycelium can tightly bind around these young roots [75]. The pore size of biochar becomes larger with an increase in the time that biochar stays in soil, which provides a larger habitat for the growth of saprotrophic fungi [37]. EM can promote the growth of plant roots, which is beneficial to the growth of saprotrophic fungi. Therefore, the relative content of saprotrophic fungi in C+M was the highest (Figure 3). The increase in saprotrophic fungi (18:1w9c, 18:2w6,9c) can accelerate the decomposition of litter or dead roots, promote the increase in soil fertility, improve the absorption of mineral elements by vegetation roots and increase plant tolerance to harsh environments and disease resistance [75]. Overall, biochar combined with EM can not only promote the growth of plants on degraded grassland, but also increase soil nutrients and microbial biomass, and change the abundance of specific microorganisms on degraded grassland. In this paper, their joint positive effect was more beneficial to the rapid restoration of degraded alpine grasslands.

5. Conclusions

Biochar addition alone, as well as the combination of biochar and effective microorganisms (EM), demonstrated more pronounced enhancements in vegetation biomass, soil physicochemical properties and microorganisms in degraded alpine grassland, compared to EM addition alone. Soil parameters such as total organic carbon (TOC), total nitrogen (TN), nitrate nitrogen (NO3-N), ammonium nitrogen (NH4+-N), available phosphorus (AP), soil water content (SWC) and microbial biomass exhibited significant increases. The addition of only biochar had the most pronounced impact on soil carbon, nitrogen and phosphorus. Conversely, when biochar was combined with EM, it exerted the strongest influence on above-ground vegetation biomass and microbial biomass. The addition of biochar or EM altered both the structure of the microbial community and its interaction with various soil parameters. The relative content of saprotrophic fungi (18:2w6,9c,18:1w9c) increased in the C, M and C+M treatments, and was the highest in C+M treatment. Consequently, the ecosystem of degraded alpine grassland experienced the most significant improvement when biochar was added in combination with EM.

Supplementary Materials

The following supporting information can be downloaded at: https://www.mdpi.com/article/10.3390/agronomy13092203/s1, Table S1: Microbial PLFA biomarkers and metrics [76,77,78,79,80,81].

Author Contributions

J.L., K.L. and X.S. contributed to the conception and design of this study. H.L. and Y.H. organized the database. J.L. performed the statistical analysis. J.L. and K.L. wrote the first draft of the manuscript. X.S., J.S. and K.L. wrote sections of the manuscript. All authors have read and agreed to the published version of the manuscript.

Funding

This project was supported by the National Key Research and Development Program of China (No. 2021YFD1300503) and the earmarked fund for CARS (CARS-34).

Data Availability Statement

The datasets generated and/or analyzed during the current study are available from the corresponding author on reasonable request.

Conflicts of Interest

The authors declare no conflict of interest.

References

  1. Wei, Y.; Lu, H.; Wang, J.; Wang, X.; Sun, J. Dual Influence of Climate Change and Anthropogenic Activities on the Spatiotemporal Vegetation Dynamics Over the Qinghai-Tibetan Plateau From 1981 to 2015. Earths Future 2022, 10, e2021EF002566. [Google Scholar] [CrossRef]
  2. Dong, S.; Zhang, J.; Li, Y.; Liu, S.; Dong, Q.; Zhou, H.; Yeomans, J.; Li, Y.; Li, S.; Gao, X. Effect of grassland degradation on aggregate-associated soil organic carbon of alpine grassland ecosystems in Qinghai-Tibetan Plateau. Eur. J. Soil Sci. 2019, 71, 69–79. [Google Scholar] [CrossRef]
  3. Ran, Q.; Hao, Y.; Xia, A.; Liu, W.; Hu, R.; Cui, X.; Xue, K.; Song, X.; Xu, C.; Ding, B.; et al. Quantitative Assessment of the Impact of Physical and Anthropogenic Factors on Vegetation Spatial-Temporal Variation in Northern Tibet. Remote Sens. 2019, 11, 1183. [Google Scholar] [CrossRef]
  4. Su, X.; Han, W.; Liu, G.; Zhang, Y.; Lu, H. Substantial gaps between the protection of biodiversity hotspots in alpine grasslands and the effectiveness of protected areas on the Qinghai-Tibetan Plateau, China. Agric. Ecosyst. Environ. 2019, 278, 15–23. [Google Scholar] [CrossRef]
  5. Li, Y.; Dong, S.; Liu, S.; Zhou, H.; Gao, Q.; Cao, G.; Wang, X.; Su, X.; Zhang, Y.; Tang, L.; et al. Seasonal changes of CO2, CH4 and N2O fluxes in different types of alpine grassland in the Qinghai-Tibetan Plateau of China. Soil Biol. Biochem. 2015, 80, 306–314. [Google Scholar] [CrossRef]
  6. Han, W.; Lu, H.; Liu, G.; Wang, J.; Su, X. Quantifying Degradation Classifications on Alpine Grassland in the Lhasa River Basin, Qinghai-Tibetan Plateau. Sustainability 2019, 11, 7067. [Google Scholar] [CrossRef]
  7. Bardgett, R.D.; Bullock, J.M.; Lavorel, S.; Manning, P.; Schaffner, U.; Ostle, N.; Chomel, M.; Durigan, G.; Fry, E.L.; Johnson, D.; et al. Combatting global grassland degradation. Nat. Rev. Earth Environ. 2021, 2, 720–735. [Google Scholar] [CrossRef]
  8. Du, C.; Gao, Y. Grazing exclusion alters ecological stoichiometry of plant and soil in degraded alpine grassland. Agric. Ecosyst. Environ. 2021, 308, 107256. [Google Scholar] [CrossRef]
  9. Zhang, G.; Zhao, Z.; Yin, X.A.; Zhu, Y. Impacts of biochars on bacterial community shifts and biodegradation of antibiotics in an agricultural soil during short-term incubation. Sci. Total Environ. 2021, 771, 144751. [Google Scholar] [CrossRef]
  10. Yan, Y.; Jarvie, S.; Liu, Q.; Zhang, Q. Effects of fragmentation on grassland plant diversity depend on the habitat specialization of species. Biol. Conserv. 2022, 275, 109773. [Google Scholar] [CrossRef]
  11. Che, R.; Wang, Y.; Lia, K.; Xu, Z.; Hua, J.; Wang, F.; Rui, Y.; Li, L.; Pang, Z.; Cui, X. Degraded patch formation significantly changed microbial community composition in alpine meadow soils. Soil Tillage Res. 2019, 195, 104426. [Google Scholar] [CrossRef]
  12. Raiesi, F. A minimum data set and soil quality index to quantify the effect of land use conversion on soil quality and degradation in native rangelands of upland arid and semiarid regions. Ecol. Indic. 2017, 75, 307–320. [Google Scholar] [CrossRef]
  13. Lei, L.; Xiao, W.; Zeng, L.; Frey, B.; Huang, Z.; Zhu, J.; Cheng, R.; Li, M.-H. Effects of thinning intensity and understory removal on soil microbial community in Pinus massoniana plantations of subtropical China. Appl. Soil Ecol. 2021, 167, 104055. [Google Scholar] [CrossRef]
  14. Shen, J.; Tao, Q.; Dong, Q.; Luo, Y.; Luo, J.; He, Y.; Li, B.; Li, Q.; Xu, Q.; Li, M.; et al. Long-term conversion from rice-wheat to rice-vegetable rotations drives variation in soil microbial communities and shifts in nitrogen-cycling through soil profiles. Geoderma 2021, 404, 115299. [Google Scholar] [CrossRef]
  15. Zhao, H.; Li, Q.; Jin, X.; Li, D.; Zhu, Z.; Li, Q.X. Chiral enantiomers of the plant growth regulator paclobutrazol selectively affect community structure and diversity of soil microorganisms. Sci. Total Environ. 2021, 797, 148942. [Google Scholar] [CrossRef]
  16. Qiu, D.; Zhu, G.; Lin, X.; Jiao, Y.; Lu, S.; Liu, J.; Liu, J.; Zhang, W.; Ye, L.; Li, R.; et al. Dissipation and movement of soil water in artificial forest in arid oasis areas: Cognition based on stable isotopes. Catena 2023, 228, 107178. [Google Scholar] [CrossRef]
  17. Ding, M.Q.; Yang, S.S.; Ding, J.; Zhang, Z.R.; Zhao, Y.L.; Dai, W.; Sun, H.J.; Zhao, L.; Xing, D.; Ren, N.; et al. Gut Microbiome Associating with Carbon and Nitrogen Metabolism during Biodegradation of Polyethene in Tenebrio larvae with Crop Residues as Co-Diets. Sci. Total Environ. 2023, 57, 3031–3041. [Google Scholar] [CrossRef]
  18. Zhou, J.; Wang, L.; Zhong, X.; Yao, T.; Qi, J.; Wang, Y.; Xue, Y. Quantifying the major drivers for the expanding lakes in the interior Tibetan Plateau. Sci. Bull. 2022, 67, 474–478. [Google Scholar] [CrossRef]
  19. Liang, J.-P.; Xue, Z.-Q.; Yang, Z.-Y.; Chai, Z.; Niu, J.-P.; Shi, Z.-Y. Effects of microbial organic fertilizers on Astragalus membranaceus growth and rhizosphere microbial community. Ann. Microbiol. 2021, 71, 11. [Google Scholar] [CrossRef]
  20. Mayer, J.; Scheid, S.; Widmer, F.; Fließbach, A.; Oberholzer, H.-R. How effective are ‘Effective microorganisms® (EM)’? Results from a field study in temperate climate. Appl. Soil Ecol. 2010, 46, 230–239. [Google Scholar] [CrossRef]
  21. Mise, K.; Koyama, Y.; Matsumoto, A.; Fujita, K.; Kunito, T.; Senoo, K.; Otsuka, S. Pectin drives microbial phosphorus solubilization in soil: Evidence from isolation-based and community-scale approaches. Eur. J. Soil Biol. 2020, 97, 103169. [Google Scholar] [CrossRef]
  22. Abd El-Mageed, T.A.; Rady, M.M.; Taha, R.S.; Abd El Azeam, S.; Simpson, C.R.; Semida, W.M. Effects of integrated use of residual sulfur-enhanced biochar with effective microorganisms on soil properties, plant growth and short-term productivity of Capsicum annuum under salt stress. Sci. Hortic. 2020, 261, 108930. [Google Scholar] [CrossRef]
  23. Ortega, R.; Miralles, I.; Meca, D.E.; Gázquez, J.C.; Domene, M.Á. Effect of Organic and Synthetic Fertilizers on the Crop Yield and Macronutrients Contents in Soil and Pepper. Commun. Soil Sci. Plant Anal. 2016, 47, 1216–1226. [Google Scholar] [CrossRef]
  24. Cui, Q.; Xia, J.; Yang, H.; Liu, J.; Shao, P. Biochar and effective microorganisms promote Sesbania cannabina growth and soil quality in the coastal saline-alkali soil of the Yellow River Delta, China. Sci. Total Environ. 2021, 756, 143801. [Google Scholar] [CrossRef] [PubMed]
  25. Talaat, N.B. Effective microorganisms: An innovative tool for inducing common bean (Phaseolus vulgaris L.) salt-tolerance by regulating photosynthetic rate and endogenous phytohormones production. Sci. Hortic. 2019, 250, 254–265. [Google Scholar] [CrossRef]
  26. Mitchell, E.; Scheer, C.; Rowlings, D.; Cotrufo, F.; Conant, R.T.; Grace, P. Important constraints on soil organic carbon formation efficiency in subtropical and tropical grasslands. Glob. Change Biol. 2021, 27, 5383–5391. [Google Scholar] [CrossRef] [PubMed]
  27. Agegnehu, G.; Srivastava, A.K.; Bird, M.I. The role of biochar and biochar-compost in improving soil quality and crop performance: A review. Appl. Soil Ecol. 2017, 119, 156–170. [Google Scholar] [CrossRef]
  28. Gao, S.; DeLuca, T.H.; Cleveland, C.C. Biochar additions alter phosphorus and nitrogen availability in agricultural ecosystems: A meta-analysis. Sci. Total Environ. 2019, 654, 463–472. [Google Scholar] [CrossRef]
  29. El-Naggar, A.; Lee, S.S.; Rinklebe, J.; Farooq, M.; Song, H.; Sarmah, A.K.; Zimmerman, A.R.; Ahmad, M.; Shaheen, S.M.; Ok, Y.S. Biochar application to low fertility soils: A review of current status, and future prospects. Geoderma 2019, 337, 536–554. [Google Scholar] [CrossRef]
  30. Gunarathne, V.; Senadeera, A.; Gunarathne, U.; Biswas, J.K.; Almaroai, Y.A.; Vithanage, M. Potential of biochar and organic amendments for reclamation of coastal acidic-salt affected soil. Biochar 2020, 2, 107–120. [Google Scholar] [CrossRef]
  31. Kim, H.S.; Kim, K.R.; Yang, J.E.; Ok, Y.S.; Owens, G.; Nehls, T.; Wessolek, G.; Kim, K.H. Effect of biochar on reclaimed tidal land soil properties and maize (Zea mays L.) response. Chemosphere 2016, 142, 153–159. [Google Scholar] [CrossRef] [PubMed]
  32. Mandal, S.; Thangarajan, R.; Bolan, N.S.; Sarkar, B.; Khan, N.; Ok, Y.S.; Naidu, R. Biochar-induced concomitant decrease in ammonia volatilization and increase in nitrogen use efficiency by wheat. Chemosphere 2016, 142, 120–127. [Google Scholar] [CrossRef]
  33. Bhaduri, D.; Saha, A.; Desai, D.; Meena, H.N. Restoration of carbon and microbial activity in salt-induced soil by application of peanut shell biochar during short-term incubation study. Chemosphere 2016, 148, 86–98. [Google Scholar] [CrossRef]
  34. El-Naggar, A.; Lee, S.S.; Awad, Y.M.; Yang, X.; Ryu, C.; Rizwan, M.; Rinklebe, J.; Tsang, D.C.W.; Ok, Y.S. Influence of soil properties and feedstocks on biochar potential for carbon mineralization and improvement of infertile soils. Geoderma 2018, 332, 100–108. [Google Scholar] [CrossRef]
  35. Elzobair, K.A.; Stromberger, M.E.; Ippolito, J.A.; Lentz, R.D. Contrasting effects of biochar versus manure on soil microbial communities and enzyme activities in an Aridisol. Chemosphere 2016, 142, 145–152. [Google Scholar] [CrossRef]
  36. Xu, W.; Whitman, W.B.; Gundale, M.J.; Chien, C.C.; Chiu, C.Y. Functional response of the soil microbial community to biochar applications. GCB Bioenergy 2020, 13, 269–281. [Google Scholar] [CrossRef]
  37. Dangi, S.; Gao, S.; Duan, Y.; Wang, D. Soil microbial community structure affected by biochar and fertilizer sources. Appl. Soil Ecol. 2020, 150, 103452. [Google Scholar] [CrossRef]
  38. Fernandez, J.M.; Nieto, M.A.; Lopez-de-Sa, E.G.; Gasco, G.; Mendez, A.; Plaza, C. Carbon dioxide emissions from semi-arid soils amended with biochar alone or combined with mineral and organic fertilizers. Sci. Total Environ. 2014, 482–483, 1–7. [Google Scholar] [CrossRef]
  39. Rafique, M.; Ortas, I.; Ahmed, I.A.M.; Rizwan, M.; Afridi, M.S.; Sultan, T.; Chaudhary, H.J. Potential impact of biochar types and microbial inoculants on growth of onion plant in differently textured and phosphorus limited soils. J. Environ. Manag. 2019, 247, 672–680. [Google Scholar] [CrossRef]
  40. Zhang, T.; Song, B.; Han, G.; Zhao, H.; Hu, Q.; Zhao, Y.; Liu, H. Effects of coastal wetland reclamation on soil organic carbon, total nitrogen, and total phosphorus in China: A meta-analysis. Land Degrad. Dev. 2023, 34, 3340–3349. [Google Scholar] [CrossRef]
  41. Li, W.; Shi, Y.; Zhu, D.; Wang, W.; Liu, H.; Li, J.; Shi, N.; Ma, L.; Fu, S. Fine root biomass and morphology in a temperate forest are influenced more by the nitrogen treatment approach than the rate. Ecol. Indic. 2021, 130, 108031. [Google Scholar] [CrossRef]
  42. GB 19733-2003 [S]; Classification Index of Natural Grassland Degradation, Desertification and Salinization. Ministry of Agriculture of the People’s Republic of China, Standards Press of China: Beijing, China, 2003.
  43. Li, J.; Zhao, Y.; Shao, X.; Huang, D.; Shang, J.; Li, H.; He, Y.; Liu, K. The Mixed Addition of Biochar and Nitrogen Improves Soil Properties and Microbial Structure of Moderate-Severe Degraded Alpine Grassland in Qinghai-Tibet Plateau. Front. Plant Sci. 2021, 12, 765041. [Google Scholar] [CrossRef] [PubMed]
  44. White, D.C.; Davis, W.M.; Nickels, J.S.; King, J.D.; Bobbie, R.J. Determination of the sedimentary microbial biomass by extractible lipid phosphate. Oecologia 1979, 40, 51–62. [Google Scholar] [CrossRef] [PubMed]
  45. Ding, Y.; Liu, Y.; Liu, S.; Li, Z.; Tan, X.; Huang, X.; Zeng, G.; Zhou, L.; Zheng, B. Biochar to improve soil fertility. A review. Agron. Sustain. Dev. 2016, 36, 36. [Google Scholar] [CrossRef]
  46. Laghari, M.; Mirjat, M.S.; Hu, Z.; Fazal, S.; Xiao, B.; Hu, M.; Chen, Z.; Guo, D. Effects of biochar application rate on sandy desert soil properties and sorghum growth. Catena 2015, 135, 313–320. [Google Scholar] [CrossRef]
  47. Zhang, H.; Ullah, F.; Ahmad, R.; Ali Shah, S.U.; Khan, A.; Adnan, M. Response of Soil Proteobacteria to Biochar Amendment in Sustainable Agriculture- A mini review. J. Soil Plant Environ. 2022, 1, 16–30. [Google Scholar] [CrossRef]
  48. Hu, C.; Qi, Y. Long-term effective microorganisms application promote growth and increase yields and nutrition of wheat in China. Eur. J. Agron. 2013, 46, 63–67. [Google Scholar] [CrossRef]
  49. Talaat, N.B.; Ghoniem, A.E.; Abdelhamid, M.T.; Shawky, B.T. Effective microorganisms improve growth performance, alter nutrients acquisition and induce compatible solutes accumulation in common bean (Phaseolus vulgaris L.) plants subjected to salinity stress. Plant Growth Regul. 2014, 75, 281–295. [Google Scholar] [CrossRef]
  50. Lehmann, J.; Rillig, M.C.; Thies, J.; Masiello, C.A.; Hockaday, W.C.; Crowley, D. Biochar effects on soil biota—A review. Soil Biol. Biochem. 2011, 43, 1812–1836. [Google Scholar] [CrossRef]
  51. Yang, Y.; Liu, L.; Zhang, P.; Wu, F.; Wang, Y.; Xu, C.; Zhang, L.; An, S.; Kuzyakov, Y. Large-scale ecosystem carbon stocks and their driving factors across Loess Plateau. Carbon Neutrality 2023, 2, 5. [Google Scholar] [CrossRef]
  52. Cheng, M.; Cui, Y.; Yan, X.; Zhang, R.; Wang, J.; Wang, X. Effect of dual-modified cassava starches on intelligent packaging films containing red cabbage extracts. Food Hydrocoll. 2022, 124, 107225. [Google Scholar] [CrossRef]
  53. He, X.; Xie, H.; Gao, D.; Khashi, U.R.M.; Zhou, X.; Wu, F. Biochar and Intercropping with Potato-Onion Enhanced the Growth and Yield Advantages of Tomato by Regulating the Soil Properties, Nutrient Uptake, and Soil Microbial Community. Front. Microbiol. 2021, 12, 695447. [Google Scholar] [CrossRef] [PubMed]
  54. Schweinsberg-Mickan, M.S.Z.; Müller, T. Impact of effective microorganisms and other biofertilizers on soil microbial characteristics, organic-matter decomposition, and plant growth. J. Plant Nutr. Soil Sci. 2009, 172, 704–712. [Google Scholar] [CrossRef]
  55. Thomas, S.C.; Frye, S.; Gale, N.; Garmon, M.; Launchbury, R.; Machado, N.; Melamed, S.; Murray, J.; Petroff, A.; Winsborough, C. Biochar mitigates negative effects of salt additions on two herbaceous plant species. J. Environ. Manage. 2013, 129, 62–68. [Google Scholar] [CrossRef]
  56. Saifullah; Dahlawi, S.; Naeem, A.; Rengel, Z.; Naidu, R. Biochar application for the remediation of salt-affected soils: Challenges and opportunities. Sci. Total Environ. 2018, 625, 320–335. [Google Scholar]
  57. Pan, S.-Y.; Dong, C.-D.; Su, J.-F.; Wang, P.-Y.; Chen, C.-W.; Chang, J.-S.; Kim, H.; Huang, C.-P.; Hung, C.-M. The Role of Biochar in Regulating the Carbon, Phosphorus, and Nitrogen Cycles Exemplified by Soil Systems. Sustainability 2021, 13, 5612. [Google Scholar] [CrossRef]
  58. Wang, X.; Zhou, W.; Liang, G.; Song, D.; Zhang, X. Characteristics of maize biochar with different pyrolysis temperatures and its effects on organic carbon, nitrogen and enzymatic activities after addition to fluvo-aquic soil. Sci. Total Environ. 2015, 538, 137–144. [Google Scholar] [CrossRef]
  59. Biederman, L.A.; Harpole, W.S. Biochar and its effects on plant productivity and nutrient cycling: A meta-analysis. GCB Bioenergy 2013, 5, 202–214. [Google Scholar] [CrossRef]
  60. Jien, S.H.; Kuo, Y.L.; Liao, C.S.; Wu, Y.T.; Igalavithana, A.D.; Tsang, D.C.W.; Ok, Y.S. Effects of field scale in situ biochar incorporation on soil environment in a tropical highly weathered soil. Environ. Pollut. 2021, 272, 116009. [Google Scholar] [CrossRef]
  61. Hu, F.; Xu, C.; Ma, R.; Tu, K.; Yang, J.; Zhao, S.; Yang, M.; Zhang, F. Biochar application driven change in soil internal forces improves aggregate stability: Based on a two-year field study. Geoderma 2021, 403, 115276. [Google Scholar] [CrossRef]
  62. Palansooriya, K.N.; Wong, J.T.F.; Hashimoto, Y.; Huang, L.; Rinklebe, J.; Chang, S.X.; Bolan, N.; Wang, H.; Ok, Y.S. Response of microbial communities to biochar-amended soils: A critical review. Biochar 2019, 1, 3–22. [Google Scholar] [CrossRef]
  63. Yang, W.; Gong, T.; Wang, J.; Li, G.; Liu, Y.; Zhen, J.; Ning, M.; Yue, D.; Du, Z.; Chen, G. Effects of Compound Microbial Fertilizer on Soil Characteristics and Yield of Wheat (Triticum aestivum L.). J. Soil Sci. Plant Nutr. 2020, 20, 2740–2748. [Google Scholar] [CrossRef]
  64. Ren, H.; Qin, X.; Huang, B.; Fernandez-Garcia, V.; Lv, C. Responses of soil enzyme activities and plant growth in a eucalyptus seedling plantation amended with bacterial fertilizers. Arch. Microbiol. 2020, 202, 1381–1396. [Google Scholar] [CrossRef]
  65. Wang, X.; Lü, X.; Zhang, H.; Dijkstrac, F.A.; Jiang, Y.; Wang, X.; Lu, J.; Wu, Y.; Wang, Z.; Han, X. Changes in soil C:N:P stoichiometry along an aridity gradient in drylands of northern China. Geoderma 2019, 361, 114087. [Google Scholar] [CrossRef]
  66. Jenkins, J.R.; Viger, M.; Arnold, E.C.; Harris, Z.M.; Ventura, M.; Miglietta, F.; Girardin, C.; Edwards, R.J.; Rumpel, C.; Fornasier, F.; et al. Biochar alters the soil microbiome and soil function: Results of next-generation amplicon sequencing across Europe. GCB Bioenergy 2017, 9, 591–612. [Google Scholar] [CrossRef]
  67. Ye, Z.; Liu, L.; Tan, Z.; Zhang, L.; Huang, Q. Effects of pyrolysis conditions on migration and distribution of biochar nitrogen in the soil-plant-atmosphere system. Sci. Total Environ. 2020, 723, 138006. [Google Scholar] [CrossRef]
  68. Zhang, Y.; Zhao, H.; Hu, W.; Wang, Y.; Zhang, H.; Zhou, X.; Fei, J.; Luo, G. Understanding how reed-biochar application mitigates nitrogen losses in paddy soil: Insight into microbially-driven nitrogen dynamics. Chemosphere 2022, 295, 133904. [Google Scholar] [CrossRef]
  69. Li, H.; Lu, X.; Xu, Y.; Liu, H. How close is artificial biochar aging to natural biochar aging in fields? A meta-analysis. Geoderma 2019, 352, 96–103. [Google Scholar] [CrossRef]
  70. Sun, H.; Lu, H.; Chu, L.; Shao, H.; Shi, W. Biochar applied with appropriate rates can reduce N leaching, keep N retention and not increase NH3 volatilization in a coastal saline soil. Sci. Total Environ. 2017, 575, 820–825. [Google Scholar] [CrossRef]
  71. Zhang, G.; Bai, J.; Zhao, Q.; Jia, J.; Wang, W.; Wang, X. Bacterial Succession in Salt Marsh Soils Along a Short-term Invasion Chronosequence of Spartina alterniflora in the Yellow River Estuary, China. Microb. Ecol. 2019, 79, 644–661. [Google Scholar] [CrossRef]
  72. Zheng, J.; Chen, J.; Pan, G.; Liu, X.; Zhang, X.; Li, L.; Bian, R.; Cheng, K.; Jinwei, Z. Biochar decreased microbial metabolic quotient and shifted community composition four years after a single incorporation in a slightly acid rice paddy from southwest China. Sci. Total Environ. 2016, 571, 206–217. [Google Scholar] [CrossRef] [PubMed]
  73. Jimenez-Gomez, A.; Garcia-Estevez, I.; Garcia-Fraile, P.; Escribano-Bailon, M.T.; Rivas, R. Increase in phenolic compounds of Coriandrum sativum L. after the application of a Bacillus halotolerans biofertilizer. J. Sci. Food Agric. 2020, 100, 2742–2749. [Google Scholar] [CrossRef] [PubMed]
  74. Xu, Y.; Liu, C.; Bao, J.; Zhu, H.; Chen, Y.; Luo, Y.; Zhang, L. Microbial diversity and physicochemical properties in farmland soils amended by effective microorganisms and fulvic acid for cropping Asian ginseng. Not. Bot. Horti Agrobot. Cluj-Napoca 2022, 50, 12563. [Google Scholar] [CrossRef]
  75. Cao, T.; Fang, Y.; Chen, Y.; Kong, X.; Yang, J.; Alharbi, H.; Kuzyakov, Y.; Tian, X. Synergy of saprotrophs with mycorrhiza for litter decomposition and hotspot formation depends on nutrient availability in the rhizosphere. Geoderma 2022, 410, 115662. [Google Scholar] [CrossRef]
  76. Djukic, I.; Zehetner, F.; Mentler, A.; Gerzabek, M.H. Microbial community composition and activity in different Alpine vegetation zones. Soil Biol. Biochem. 2010, 42, 155–161. [Google Scholar] [CrossRef]
  77. Evgrafova, S.Y.; Santruckova, H.; Shibistova, O.B.; Elhottova, D.; Cerna, B.; Zrazhevskaya, G.K.; Lloyd, D. Phospholipid fatty acid composition of microorganisms in pine forest soils of Central Siberia. Biol. Bull. 2008, 35, 452–458. [Google Scholar] [CrossRef]
  78. Frostegard, A.; Baath, E. The use of phospholipid fatty acid analysis to estimate bacterial and fungal biomass in soil. Biol Fert. Soils 1996, 22, 59–65. [Google Scholar] [CrossRef]
  79. Li, J.; Shao, X.; Huang, D.; Shang, J.; Liu, K.; Zhang, Q.; Yang, X.; Li, H.; He, Y. The addition of organic carbon and nitrogen accelerates the restoration of soil system of degraded alpine grassland in Qinghai-Tibet Plateau. Ecol. Eng. 2020, 158, 106084. [Google Scholar] [CrossRef]
  80. Smith, A.P.; Marin-Spiotta, E.; Balser, T. Successional and seasonal variations in soil and litter microbial community structure and function during tropical postagricultural forest regeneration: A multiyear study. Glob. Chang. Biol. 2015, 21, 3532–3547. [Google Scholar] [CrossRef]
  81. Sundh, I.; Borjesson, G.; Tunlid, A. Methane oxidation and phospholipid fatty acid composition in a podzolic soil profile. Soil Biol. Biochem. 2000, 32, 1025–1028. [Google Scholar] [CrossRef]
Figure 1. The variations in aboveground biomass (g m−1) with different treatments in 2017, 2018 and 2019. Values are mean ± SE (n = 3). Different lowercase letters indicate significant differences among different treatments in the same year. Different capital letters indicate significant differences between years under the same treatments at p < 0.05.
Agronomy 13 02203 g001
Figure 2. The variations in microbial biomass (a,b), bacteria (c,d) and fungi (e,f) with different treatments in 2017, 2018 and 2019 in 0−20 cm soil layers. Values are mean ± SE (n = 3). Different lowercase letters indicate significant differences among different treatments in the same year. Different capital letters indicate significant differences between years under the same treatments at p < 0.05.
Agronomy 13 02203 g002
Figure 3. Principal component analysis (PCA) of microbial community in 0–20 cm soil layers: (a,b) 0–10 cm soil layer, (c,d) 10–20 cm soil layer.
Agronomy 13 02203 g003
Figure 4. Pearson correlation and Mantel tests for different treatments. Statistical significance was set at p < 0.05.
Agronomy 13 02203 g004
Figure 5. Procrustes analysis on the correlation between environmental variables and microbial community in different treatments. (a): CK, (b): C, (c): M, (d): C+M.
Agronomy 13 02203 g005
Figure 6. Redundancy analysis (RDA) of environmental variables and indicator PLFAs: (a) 0–10 cm soil layer, (b) 10–20 cm soil layer. Black lines represent environmental variables, and dashed line represents indicator PLFAs. See Table 1, Table 2 and Table S1 for abbreviations.
Agronomy 13 02203 g006
Table 1. The properties of pH, EC, SWC and C/N under different treatments in the 0–20 cm soil layers in 2017, 2018 and 2019.
ParameterYearLayer (cm)CKMCC+M
pH20170–107.12 ± 0.05 bcB6.99 ± 0.08 cB7.36 ± 0.12 abC7.46 ± 0.18 aB
2018 7.55 ± 0.03 bA7.63 ± 0.09 bA8.22 ± 0.22 aA8.32 ± 0.16 aA
2019 7.28 ± 0.22 bAB7.77 ± 0.13 aA7.78 ± 0.05 aB8.05 ± 0.08 aA
201710–207.24 ± 0.11 bB7.28 ± 0.12 bB7.31 ± 0.08 aC7.33 ± 0.11 aC
2018 7.48 ± 0.09 bA7.65 ± 0.07 bA8.44 ± 0.08 aA8.31 ± 0.08 aA
2019 7.49 ± 0.05 cB7.78 ± 0.01 bA7.81 ± 0.11 bC7.99 ± 0.06 aB
EC20170–10362.76 ± 46.31 aA163.87 ± 27.02 cA312.01 ± 20.85 bA121.77 ± 11.93 cC
2018 274.09 ± 28.54 bB186.53 ± 16.66 bA302.58 ± 31.56 aA253.17 ± 14.39 bA
2019 209.8 ± 21.20 aC208.83 ± 32.09 aA220.73 ± 26.97 aB172.53 ± 17.28 aB
201710–20324.91 ± 11.21 aA161.8 ± 28.45 bA319.01 ± 16.06 aA117.01 ± 11.6 cC
2018 305.27 ± 99.51 aA202.87 ± 26.05 cA282.62 ± 15.51 bB223.27 ± 13.27 cA
2019 197.53 ± 14.41 aB171.83 ± 25.92 aA198.33 ± 23.1 aC161.10 ± 15.5 aB
SWC (%)20170–1024.52 ± 0.93 bA24.48 ± 1.90 bA24.35 ± 0.83 bB30.41 ± 2.82 aA
2018 18.82 ± 0.38 cB26.97 ± 2.41 bA30.69 ± 1.81 aA31.71 ± 1.42 aA
2019 16.46 ± 1.01 cC24.18 ± 0.77 abA27.01 ± 2.66 aAB22.92 ± 0.87 bB
201710–2021.14 ± 0.71 bA21.71 ± 1.87 aA21.89 ± 0.83 bB25.68 ± 1.49 aB
2018 19.85 ± 0.51 bA25.43 ± 1.65 bB27.31 ± 0.75 aA29.70 ± 1.87 aA
2019 16.08 ± 0.81 bA16.86 ± 0.94 bC20.55 ± 0.99 aB19.83 ± 1.06 aC
C/N20170–1012.02 ± 0.49 bA10.78 ± 1.42 bA15.63 ± 1.35 aA15.81 ± 0.09 aA
2018 12.02 ± 1.38 abA11.11 ± 0.31 bA13.13 ± 0.58 aB11.96 ± 1.37 aA
2019 10.85 ± 0.57 bA11.43 ± 0.77 bA15.34 ± 0.58 aAB11.69 ± 1.28 bA
201710–2012.68 ± 1.38 aA12.33 ± 0.68 aA12.73 ± 0.89 aA11.77 ± 0.83 aA
2018 10.08 ± 0.47 aB9.70 ± 1.59 aA9.22 ± 0.82 aB10.33 ± 0.29 aA
2019 11.28 ± 0.8 cA11.34 ± 0.92 cA13.67 ± 1.00 aA12.56 ± 1.10 abA
Note: Values are mean ± standard error (n = 3). Different lowercase letters indicate significant differences among different treatments in the same year. Different capital letters indicate significant differences between years under the same treatments at p < 0.05. EC: electrical conductivity, SWC: soil water content.
Table 2. Soil organic carbon (TOC), soil total nitrogen (TN), soil ammonia-nitrogen (NH4+-N), nitrate nitrogen (NO3-N) and available phosphorus (AP) in the 0–20 cm soil layers with different treatments in 2017, 2018 and 2019.
ParameterYearLayer (cm)CKMCC+M
TOC
(g kg−1)
20170–1033.14 ± 1.63 bB39.56 ± 4.49 bA57.43 ± 5.43 aA58.88 ± 0.75 aA
2018 40.92 ± 1.62 cA40.44 ± 1.05 cA63.54 ± 2.55 aA46.88 ± 0.46 bB
2019 34.26 ± 1.04 dB43.73 ± 0.87 cA56.78 ± 0.43 aA49.85 ± 2.05 bB
201710–2030.16 ± 1.4 bA34.17 ± 1.91 aB36.60 ± 0.87 aB36.47 ± 0.73 aA
2018 30.45 ± 0.68 bA32.95 ± 0.55 bB36.61 ± 0.7 aB36.11 ± 2.26 aA
2019 30.19 ± 0.21 cA37.49 ± 1.1 bA43.35 ± 4.12 aA39.90 ± 1.92 abA
TN
(g kg−1)
20170–102.76 ± 0.12 bB3.67 ± 0.27 aA3.67 ± 0.12 aB3.73 ± 0.10 aA
2018 3.43 ± 0.26 bA3.64 ± 0.02 bA4.84 ± 0.17 aA3.97 ± 0.45 bA
2019 3.17 ± 0.24 bAB3.84 ± 0.3 aA3.71 ± 0.17 abB3.80 ± 0.22 aA
201710–202.40 ± 0.18 bB2.78 ± 0.19 abA2.89 ± 0.15 aB3.11 ± 0.17 aB
2018 3.03 ± 0.20 bA3.51 ± 0.71 abA4.00 ± 0.30 aA3.49 ± 0.13 abA
2019 2.69 ± 0.20 bB3.33 ± 0.27 aA3.17 ± 0.12 aB3.31 ± 0.08 aAB
NH4+-N
(mg kg−1)
20170–1018.33 ± 0.83 cC23.13 ± 2.22 bC11.74 ± 0.09 dC29.45 ± 1.61 aB
2018 35.05 ± 3.67 cA43.15 ± 1.73 cA70.37 ± 6.75 aA58.74 ± 6.01 bA
2019 26.13 ± 1.20 cB28.39 ± 2.31 bB48.35 ± 2.37 aB36.97 ± 3.07 abB
201710–2016.71 ± 1.50 bB23.96 ± 1.31 aA9.65 ± 0.43 cB19.36 ± 3.60 abB
2018 22.17 ± 1.31 cA16.42 ± 2.04 dB34.56 ± 2.70 bA40.44 ± 2.72 aA
2019 14.64 ± 2.11 cB9.27 ± 0.93 cC36.06 ± 2.54 aB22.19 ± 3.78 bB
NO3N
(mg kg−1)
20170–107.57 ± 1.56 cAB6.47 ± 0.47 cB21.62 ± 1.25 aB15.56 ± 0.33 bA
2018 4.97 ± 0.70 bB7.51 ± 0.33 aB5.77 ± 1.08 bC6.40 ± 0.33 abB
2019 8.96 ± 1.72 cA18.25 ± 4.49 bA31.70 ± 5.22 aA14.28 ± 2.08 bcA
201710–207.18 ± 1.08 bAB7.95 ± 0.79 bA13.29 ± 1.11 aA13.30 ± 0.26 aA
2018 4.94 ± 0.79 bB9.09 ± 0.56 aA8.01 ± 1.31 aB6.99 ± 1.22 abC
2019 11.09 ± 2.99 aAB9.90 ± 2.19 bA13.79 ± 1.11 aA10.83 ± 0.17 aB
AP
(mg kg−1)
20170–102.68 ± 0.24 bA2.91 ± 0.36 bA4.10 ± 0.41 aA4.35 ± 0.20 aA
2018 3.02 ± 0.24 bA3.27 ± 0.95 abAB4.37 ± 0.07 aA3.43 ± 0.19 abB
2019 1.57 ± 0.17 cB3.16 ± 0.10 bA3.31 ± 0.10 bB4.02 ± 0.15 aA
201710–201.79 ± 0.13 bA2.83 ± 0.24 aAB3.12 ± 0.24 aA2.76 ± 0.10 aA
2018 1.89 ± 0.36 bA3.08 ± 0.35 aA2.72 ± 0.12 aAB2.79 ± 0.07 aA
2019 1.49 ± 0.03 bA2.24 ± 0.19 aB2.37 ± 0.23 aA2.60 ± 0.22 aA
Note: Values are mean ± standard error (n = 3). Different lowercase letters indicate significant differences among different treatments in the same year. Different capital letters indicate significant differences between years under the same treatments at p < 0.05.
Table 3. The properties of microorganisms in 0–20 cm soil layers with different treatments in 2017, 2018 and 2019.
ParameterYearLayer (cm)CKMCC+M
F:B20170–100.18 ± 0.01 bB0.24 ± 0.01 aA0.22 ± 0.01 abB0.25 ± 0.04 aA
2018 0.21 ± 0.01 bA0.25 ± 0.03 abA0.27 ± 0.01 aA0.29 ± 0.04 aA
2019 0.20 ± 0.01 bA0.27 ± 0.04 aA0.19 ± 0.01 bC0.30 ± 0.04 aA
201710–200.17 ± 0.01 aB0.19 ± 0.02 aB0.21 ± 0.06 aA0.19 ± 0.03 aB
2018 0.22 ± 0.03 bA0.27 ± 0.01 abA0.23 ± 0.05 bA0.32 ± 0.07 aA
2019 0.19 ± 0.02 abC0.16 ± 0.01 bB0.24 ± 0.07 aA0.19 ± 0.03 abB
GP:GN20170–101.44 ± 0.11 aAB1.51 ± 0.07 aA1.37 ± 0.03 aB1.45 ± 0.04 aA
2018 1.55 ± 0.05 aA1.47 ± 0.03 aA1.41 ± 0.17 aA1.41 ± 0.08 aA
2019 1.29 ± 0.05 aB1.34 ± 0.01 aB1.13 ± 0.01 bB1.13 ± 0.04 bB
201710–201.12 ± 0.19 aA1.24 ± 0.15 aA1.24 ± 0.08 aA1.00 ± 0.07 aB
2018 1.22 ± 0.04 aA1.14 ± 0.04 aA1.24 ± 0.17 aA1.22 ± 0.10 aA
2019 1.11 ± 0.08 aA1.12 ± 0.05 aA1.21 ± 0.12 aA1.04 ± 0.05 aAB
MB:TOC20170–100.28 ± 0.01 aA0.30 ± 0.04 aAB0.21 ± 0.02 bA0.19 ± 0.01 bB
2018 0.22 ± 0.01 bB0.25 ± 0.02 abB0.21 ± 0.01 bA0.27 ± 0.02 aA
2019 0.30 ± 0.01 aA0.34 ± 0.01 aA0.23 ± 0.01 bA0.30 ± 0.03 aA
201710–200.27 ± 0.04 aB0.24 ± 0.01 aB0.23 ± 0.01 aB0.23 ± 0.01 aB
2018 0.28 ± 0.04 abB0.23 ± 0.01 bB0.30 ± 0.01 aAB0.30 ± 0.04 aA
2019 0.31 ± 0.01 aA0.26 ± 0.03 aA0.33 ± 0.05 aA0.24 ± 0.02 aB
MB:TN20170–103.36 ± 0.11 aA3.16 ± 0.34 aB3.20 ± 0.39 aAB3.04 ± 0.13 aB
2018 2.65 ± 0.19 bB2.73 ± 0.10 bB2.82 ± 0.05 abB3.26 ± 0.35 aAB
2019 3.27 ± 0.22 bA3.85 ± 0.29 abA3.57 ± 0.17 abA3.96 ± 0.44 aA
201710–203.34 ± 0.16 aA2.95 ± 0.11 bAB2.94 ± 0.20 bB2.69 ± 0.08 bA
2018 2.84 ± 0.45 abAB2.21 ± 0.43 bB2.78 ± 0.24 abB3.14 ± 0.38 aA
2019 3.50 ± 0.27 abA3.58 ± 0.20 aA3.74 ± 0.71 aA2.85 ± 0.09 bA
Note: Values are mean ± standard error (n = 3). Different lowercase letters indicate significant differences among different treatments in the same year. Different capital letters indicate significant differences between years under the same treatments at p < 0.05. F/B—fungi: bacteria, GP/GN—Gram-positive: Gram-negative, MB: TOC—microbial biomass: total organic carbon, MB:TN—microbial biomass: total nitrogen.
Disclaimer/Publisher’s Note: The statements, opinions and data contained in all publications are solely those of the individual author(s) and contributor(s) and not of MDPI and/or the editor(s). MDPI and/or the editor(s) disclaim responsibility for any injury to people or property resulting from any ideas, methods, instructions or products referred to in the content.

