Article

Construction of an Early Warning System Based on a Fuzzy Matter-Element Model for Diagnosing the Health of Alpine Grassland: A Case Study of Henan County, Qinghai, China

1
College of Eco-Environmental Engineering, Qinghai University, Xining 810016, China
2
Bureau of Ecology and Environment of Puyang, Puyang 457005, China
3
State Key Laboratory of Plateau Ecology and Agriculture, Qinghai University, Xining 810016, China
*
Author to whom correspondence should be addressed.
Agronomy 2023, 13(8), 2176; https://doi.org/10.3390/agronomy13082176
Submission received: 25 June 2023 / Revised: 11 August 2023 / Accepted: 16 August 2023 / Published: 19 August 2023
(This article belongs to the Special Issue Grassland and Pasture Ecological Management and Utilization)

Abstract

:
To maintain alpine grassland in a healthy and sustainable state, a sound warning system was developed to diagnose its potential degradation risk. Data related to grassland quality (six indicators), habitat (six indicators), and eco-carrying capacity (three indicators) at eight sampling plots were collected from Henan Mongol Autonomous County of West China in 2014 and 2017, representing five types of grassland and three grazing styles. Compared to the warning level in 2014, alpine grassland had a higher warning level in 2017, demonstrating the degradation of grassland ecosystems. Kobresia tibetica exhibited the lowest level of warning, while Kobresia humilis had the highest, indicating its corresponding safety and unsafety under the environmental change. Grassland quality is the most important index for grassland health, and soil total carbon and available phosphorus are the most important indices of habitat quality, which finally greatly influence the warning level of alpine grassland. Further analysis results suggested that winter grazing is beneficial for the health of grassland, and moderate grazing can accelerate the self-recovery of the alpine grassland due to the increase in organic matter. This study is crucial for understanding the health level of alpine grassland and its further change trends, and providing an important scientific basis for rational grazing.

1. Introduction

Grassland is a renewable natural resource that provides various important eco-services [1]. The alpine grassland ecosystem on the vast Qinghai-Tibet Plateau not only protects the land surface, but also supports livestock grazing. Owing to the harsh natural environment, this ecosystem is particularly sensitive to disturbances and prone to degradation [2]. With population growth, the grassland ecosystem is facing a mounting pressure of overgrazing, which makes it highly vulnerable to degradation [3]. In recent years, due to overgrazing and climate warming [4], the alpine grassland ecosystem has shown signs of degraded functionality [5,6], declined grass coverage, and reduced biomass [7,8]. In order to prevent the grassland from further degradation, it is rather important to comprehensively and realistically assess its health so that appropriate measures can be put in place to protect it. An early warning system is a multi-functional network being able to assess capacities and identify gaps and opportunities in comprehensively evaluating all kinds of natural hazards. It can also be used for the evaluation, prediction, and warning about the potential destruction to the grassland eco-environment triggered by excessive resource exploitation [9]. Pioneering research on early warning systems mainly focused on the principles and methods of ecological early warning on environmental disasters and environmental pollution [10]. It has also been used to study the early warning signal to mitigate abrupt climate change [11]. Early warning systems have been developed to protect endangered species [12], predict rainfall-induced land sliding [13], and monitor and manage land resources [14]. In addition, early warning systems have also been developed to detect and predict long-term marine pollution [15], monitor wetland water eutrophication and eco-environment [16,17], and assess the ecological risk of wetlands for water scarcity [18].
In spite of its proved utility in managing diverse natural hazards and conserving natural resources [19], however, no early-warning systems have been constructed for effectively managing alpine grassland on the Qinghai-Tibet Plateau that has been degraded even severely with reduced ecological functions [20]. While the mechanism of grassland degradation has been studied in depth [3,20], inadequate attention has been paid to diagnose grassland health and the effect that different grazing styles have upon it. In order to protect this vulnerable resource, it is important to assess its current potential risk of degradation, which can be achieved by constructing an early warning system. With the assistance of this system, it is possible to determine the warning level of the grassland. This system can also provide an early warning of potential risks of degradation, based on which measures regarding how the grassland should be managed properly can be prescribed. However, a rare study has developed an early warning system for predicting the health of grassland, especially its potential for degradation.
A fuzzy matter-element model based on matter-element analysis is used to describe the fuzziness of objects. This is a method that falls between mathematics and experimentation. Fuzzy-matter elements have been widely used in fields such as environmental safety assessment, comprehensive evaluation of water quality, ecological environment warning, and sustainable utilization comprehensive evaluation due to their ability to effectively address the impact of fuzzy uncertainty in evaluation criteria and overall objectivity in evaluation [21,22,23].
The objective of this study is to develop an ecological early warning system for diagnosing the health of alpine grassland and assessing the impact of different grazing styles on its resilience to degradation. Specifically, it develops a structured model for an early warning system applying a fuzzy matter-element model. This early warning system helps to (1) reveal the risk level of degradation for different types of grassland under varying grazing styles, (2) assess the effectiveness of various indicators in the early warning system in different eco-environments, and (3) evaluate the current vulnerability of five types of grassland in the study area on the Qinghai-Tibet Plateau, a geographic area with widespread grassland resources that have shown signs of degradation.
Study area: The study site is located in Henan Mongol Autonomous County (100°34′–102°28′ E, 34°04′–36°10′ N) in the south-eastern Qinghai Province of western China (Figure 1). The County has a total area of 6997.45 km2 and a mean elevation of 3600 m. It is the largest organic animal husbandry production base in China, with horses, sheep, and yak as the main stock. It has an alpine continental climate with a large diurnal temperature range. The annual temperature averages between −0.4 and −2.6 °C. The warm season is very short, resulting in a short growing period of about 150 days per annum. Annual rainfall varies between 591.1 and 615.5 mm, concentrating mostly between May and October. Annual evaporation mounts to 1349.70 mm, leading to a water deficit.
Land use in the study area is primarily grazing, with alpine grassland totaling 63.12 × 10⁴ ha (93.76% of the total land area). The alpine grassland comprises four sub-categories of alpine meadow, shrub meadow, marsh meadow, and mountain meadow. The common plant species are Kobresia humilis, Potentilla fruticose, Kobresia tibetica, and Elymus nutans, of which Kobresia humilis—the dominant species—has a short rhizome and a height of 3–10 cm.
As one of the main organic grazing bases in China, it faces an aggravated conflict between protection of the grazing resource and its utilization for grazing. Consequently, the grassland has shown signs of degradation. Different types of grassland have different levels of degradation risk owing to variable grazing pressure. In order to remedy the negative effect of grazing, various grassland management strategies have been implemented. However, their impact on grassland degradation thresholds remains unknown. There is a dire need for constructing an ecological early warning system to comprehensively reflect the multi-functions of various types of grassland so that safe management practices can be applied to the grassland system to achieve sustainable grazing.

2. Research Methodology

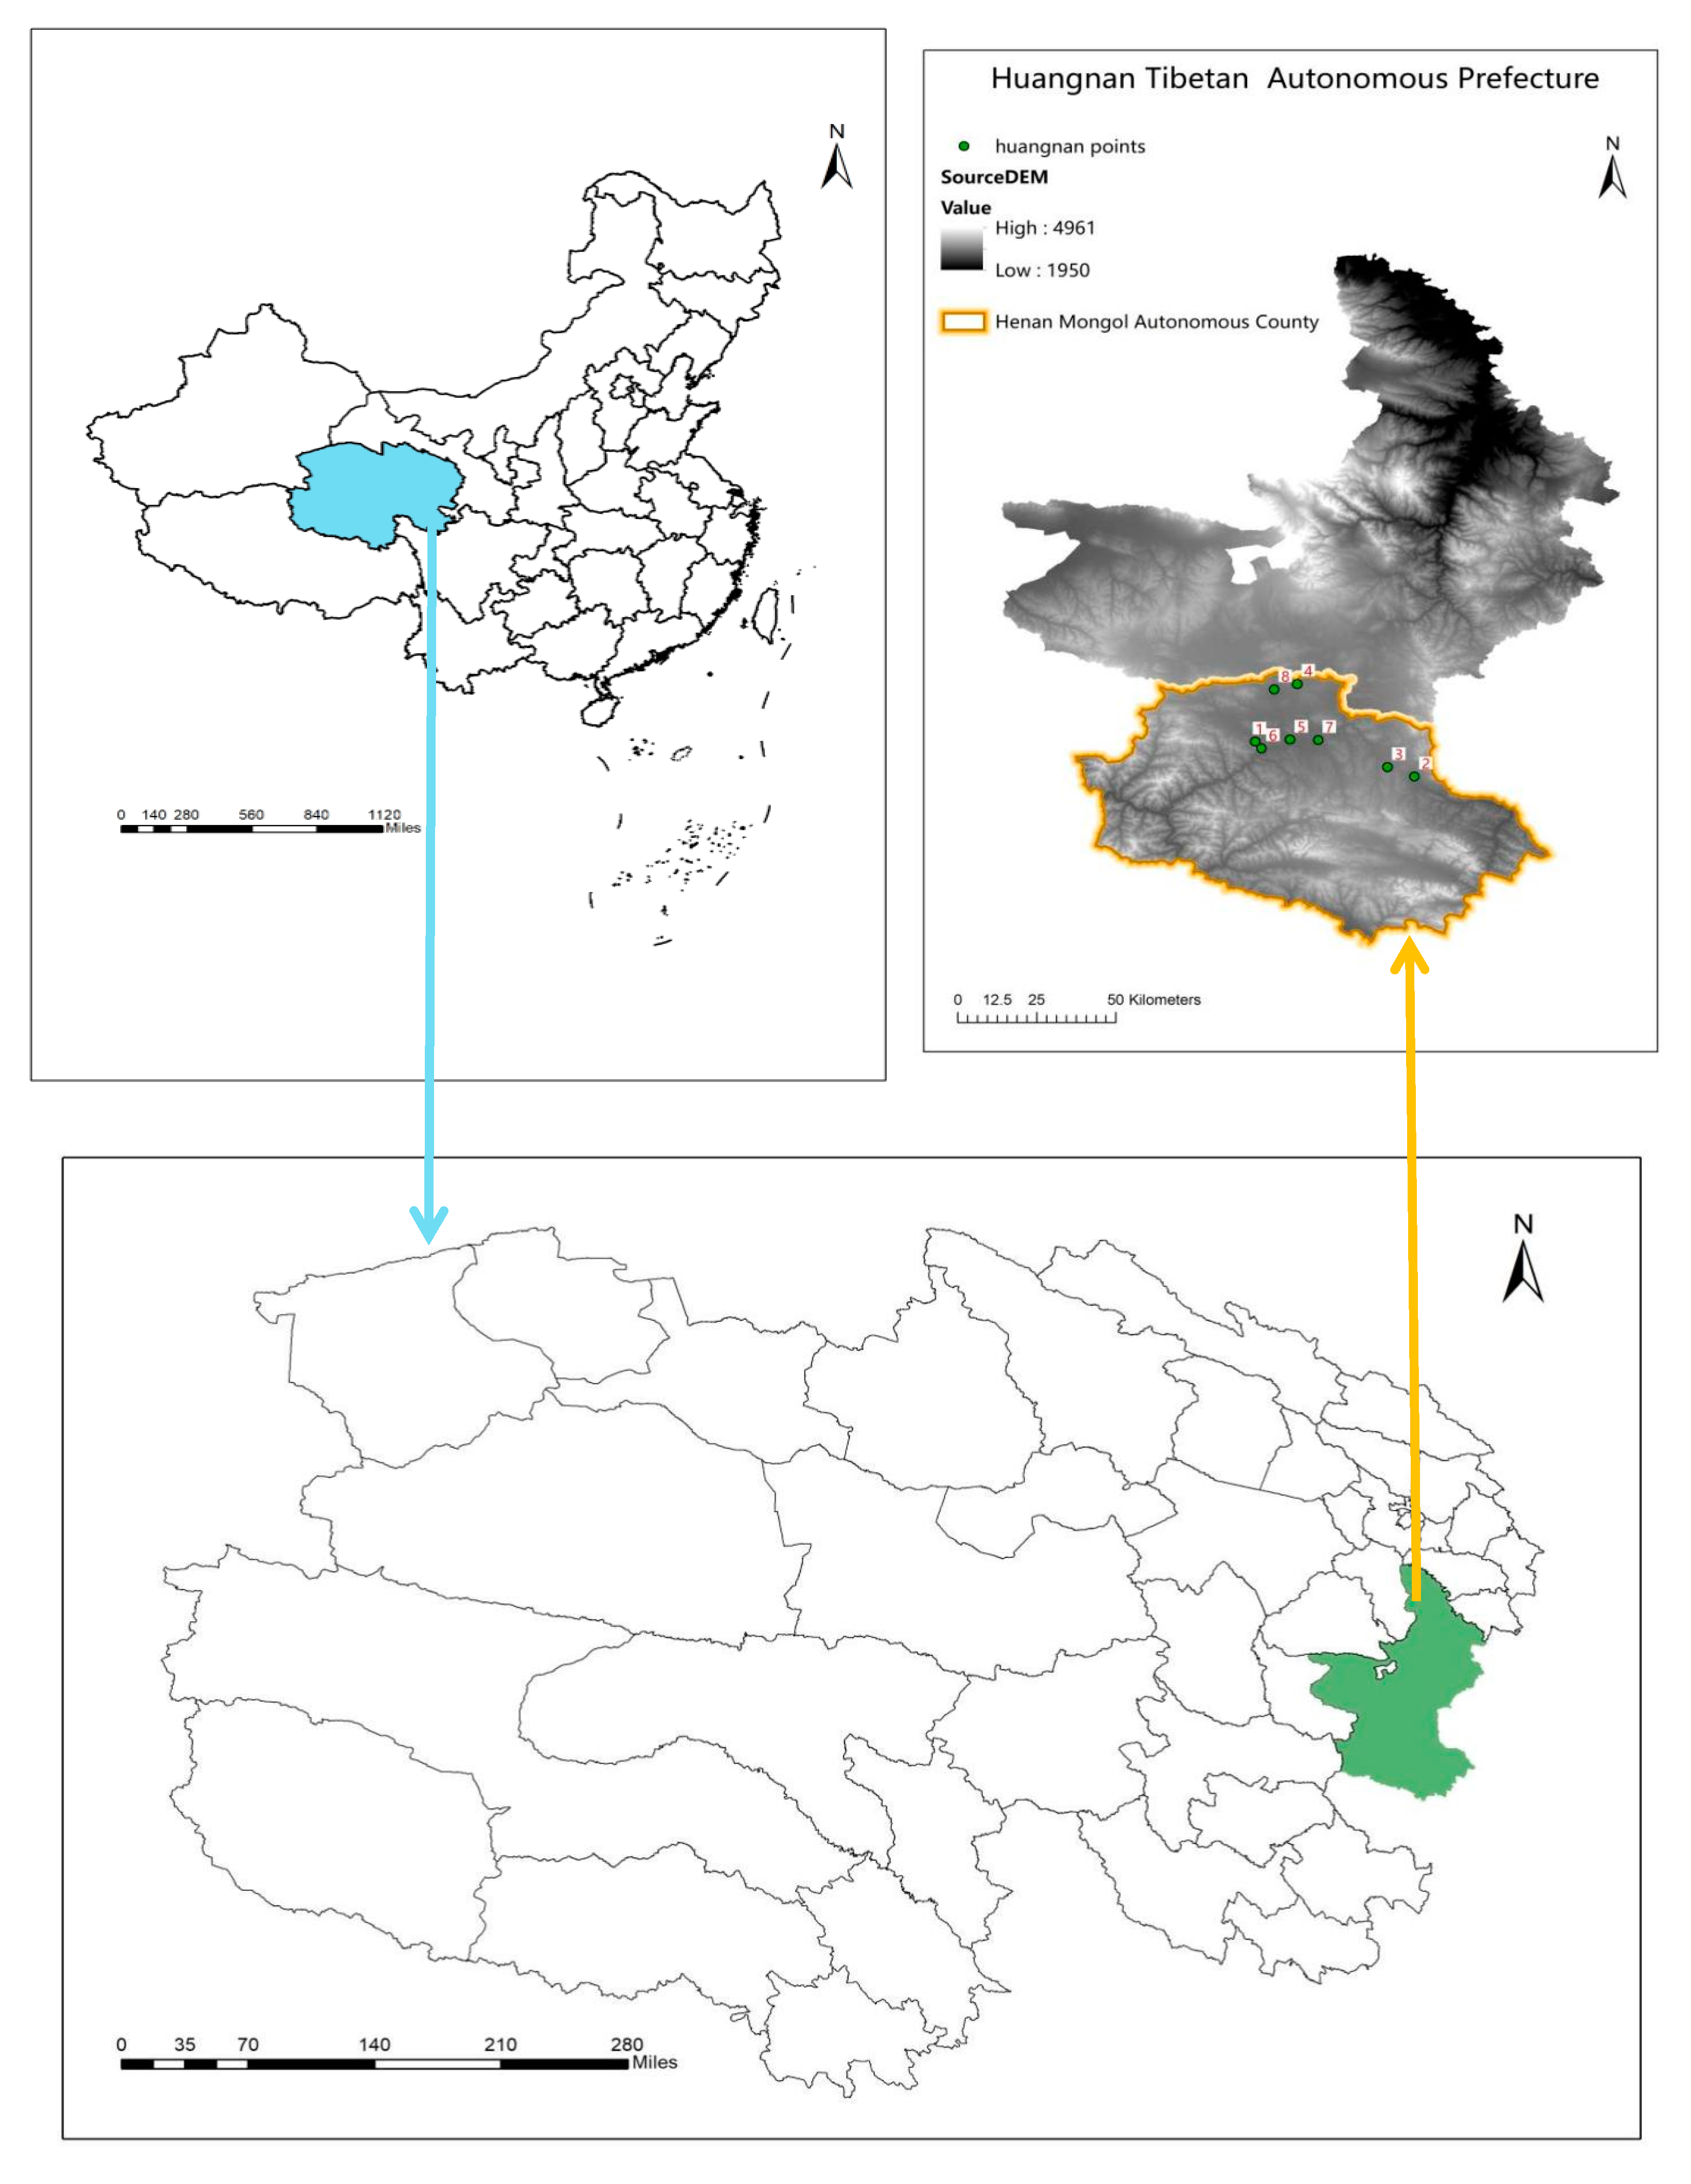
2.1. Field Data Collection

Field samples were collected from eight plots of 1 km by 1 km in size in 2014 and 2017 (Figure 1). They have a slope gradient mostly within 5–10% but can be as steep as 15–25%. These plots cover five types of grassland, including shrub Potentilla fruticosa (PF) and forbs species as Elymus nutas (EN), Kobresia humilis (KH), Ligularia birgaurea (LB), and Kobresia tibetica (KT), all of which are grazed in one of three styles (winter, summer, and no grazing) (Table 1). These plots also capture different proportions of vegetative cover. As shown in the table, each site has a unique community of dominant species and grazing style. The community structure and characteristics in each sampling plot were surveyed along three parallel transects in August when the biomass was maximum [24]. Each transect contains five sampling plots of 0.5 m × 0.5 m in size (changed to 1 m by 1 m for shrubbery vegetation). Within these randomly selected plots, aboveground biomass of all plants was measured by clipping the vegetation to the ground surface as closely as possible. Vegetation cover was estimated within 10 spatially adjoining plots at each site. Forage quantity was measured in three randomly selected plots [24]. The fresh grass was dried at 70 °C for 48 h in an oven to measure the biomass [25].
Soil samples were collected with an earth drill of 40 mm in inner diameter (φ) at three depths of 0~10 cm (top soil), 10~20 cm (top-sub soil), and 20~30 cm (sub soil) within each plot after plants and surface litters had been removed. The soil samples collected at three drills were mixed in a plastic bag and taken to the lab where they were dried at 105 °C for 48 h. Afterwards, soil properties such as CSOC (potassium dichromate oxidation with external Heating) [26], CTN (Kjeldahl procedure followed by colorimetric analysis) [27], CAN (Alkaline hydrolysis diffusion method) [28], CTP (the sodium bicarbonate alkali digestion method and molybdenum antimony colorimetry) [29], and CAP (0.5 mol·L−1 NaHCO3 solution) were analyzed.

2.2. Indicators

The ecological early warning system needs to reflect the eco-carrying capacity and plant and soil characteristics, which can be achieved by including the most appropriate and important indicators of grassland ecosystem health. Commonly considered indicators include vegetation properties, soil properties, and grazing intensity [30]. In addition to these factors, this study also takes into consideration topography, grazing style, grassland type, and grassland eco-carrying capacity. In total, 15 indicators were included in the early warning system: bare ground proportions, vegetation coverage, biomass, grass layer thickness, plant diversity, forage production and quality, height of dominant species, soil total nitrogen, available phosphorus, potassium, moisture, soil slope, and grazing styles, all of which have been extensively used in classification and grading system of grassland [31,32].
Due to the lack of literature on this topic, the ecological early warning system was constructed jointly based on theoretical analysis [5,33,34] and experts’ opinions. Specifically, the analytical hierarchy process (AHP) [35] was used to construct the system comprising three layers (target, criterion, and indicator). The target layer (A) aims to derive the level of warning on the potential risk of grassland degradation (Table 2). The criterion layer (B) contains three categories of grassland quality (B1), habitat index (B2), and eco-carrying capacity (B3). The indicator layer (C) contains 15 indicators termed as C1–C15 (Table 2).

2.3. Weighting Indicators

The 15 selected indicators must be assigned the appropriate weights in accordance with their importance using the fuzzy matter-element model. It can deal with fuzzy objects by precise digital means, and make a more scientific, reasonable, and close-to-reality representation of the information. This is commonly achieved through AHP because of its multi-functionality. This decision-making approach can aid in the solution to complex multiple criteria problems. This effective and practical approach can reach complex and unstructured decisions by weighting the indicators selected for the early warning system.
AHP was used to process the collected data and to construct the early warning system in three steps. The first was to determine the relative weight W (varying between 1, 3, 5, 7, and 9) by comparing a pair of indicators (Supplementary Table S1). A larger weight suggests that one of the indicators is increasingly more important than the other. The comparison between any two potential pairs resulted in an evaluation matrix [36]. The second was to determine the relative importance of the elements. The third was to test for consistency using the consistency index (C.I.); it was calculated using the following formula:
C . I . = λ m a x n 1
where n refers to the dimension of the evaluation matrix (n = 15) and λmax = n. The larger the C.I. value is, the more consistent the evaluation matrix is. If C.R. ≤ 0.1, the evaluation matrix is considered consistent [34] (Supplementary Table S5). The revised value R.I. is the random consistency index; it is introduced according to the dimension of the evaluation matrix. The mean random consistency index R.I. values depend on 1–15 order average consistency index used in this study (Supplementary Table S2). The C.R. is taken as an index as follows,
C . R . = C . I . R . I .

2.4. Data Processing—Fuzzy Matter Element Standardization

AHP was implemented using a fuzzy matter element that is used to generate the standard fuzzy matter element Rmn (m = 15 indicators, n = 8 sites). This fuzzy value matrix can be expressed as follows:
R m n = M 1 M m c 1 u 11 u m 1 c n u 1 n u m n
This matrix was used to derive a composite prosperity index Im by multiplying the W matrix (15 × 8) derived using the AHP method, namely,
I m = W m × R mn = I 1 , I 2 , , I m
where m = 1, 2, 3, …, 8 (8 sampling plots).

2.5. Grading the Severity of Warning

The derived composite prosperity index value I with a range of 0–10 was converted to five warning levels of no warning, light warning, medium warning, serious warning, and extreme warning, at an interval of 2 (Table 3). The actual threshold value Si (for the calculation of this value, refer to Supplementary Table S3) was compared with these theoretical threshold values in the table to determine its warning level and to produce a comprehensive and objective ecological warning for the alpine grassland.
On the basis of fuzzy matter-element matrix, combined with the range of the prosperity index value, each standard early warning index and standardized fuzzy matter-element matrix was calculated. If the calculated standard early warning index is <0, it is set to 0; if the value is >10, it is set to 10 [36].

3. Results

3.1. Standardized Fuzzy Matter-Element Matrix of the Alpine Grassland

The standard fuzzy matter-element matrix of 2014 is calculated as below:
R m n = M 1 M 2 M 3 M 4 M 5 M 6 M 7 M 8 C 1 0.20 1.14 7.90 1.58 3.40 5.60 7.10 0.34 C 2 8.00 2.00 8.67 6.00 8.00 1.67 2.00 1.00 C 3 0 0 0 0 0 1.98 0 0 C 4 1.80 1.90 4.90 1.95 2.40 3.60 4.10 1.82 C 5 0 0 0 7.27 0 0 0 0 C 6 0 0.27 1.87 0.27 0 1.20 0 0 C 7 1.48 1.25 1.64 3.24 2.77 1.53 3.44 0.40 C 8 5.97 7.00 7.66 7.65 7.80 5.09 8.38 5.25 C 9 8.96 8.13 8.69 7.97 8.52 8.15 8.51 8.52 C 10 1.64 1.73 0.95 1.59 1.99 1.93 5.48 0.16 C 11 0.69 1.61 4.63 2.91 2.64 1.71 3.71 0.90 C 12 6.60 2.00 3.40 2.60 2.80 5.40 3.40 2.20 C 13 3.33 2.00 2.00 1.11 6.00 4.00 8.22 1.11 C 14 4.40 1.60 1.96 6.40 4.40 8.20 6.20 2.32 C 15 9.80 2.47 9.86 8.64 9.79 5.7 7.64 1.99
The standard fuzzy matter-element matrix in 2017 is calculated as below:
R m n = M 1 M 2 M 3 M 4 M 5 M 6 M 7 M 8 C 1 1.68 1.12 0.8 2.12 0.74 0.66 7.2 0 C 2 8.33 1.67 8.00 8.00 7.00 1.50 5.00 4.00 C 3 0 0 0 0 0 0 0 0 C 4 1.96 1.90 1.90 2.07 1.86 1.85 4.67 1.78 C 5 0 0 0 6.70 0 0 0 0 C 6 1.73 2.40 2.40 5.00 4.00 2.80 3.60 3.60 C 7 1.07 0.90 1.24 2.01 3.46 1.38 1.86 0.87 C 8 7.17 5.87 5.5 6.97 7.1 5.83 6 6.87 C 9 8.68 8.23 8.20 9.02 9.04 8.89 8.52 7.73 C 10 5.47 2.11 2.00 2.10 1.71 3.22 1.18 2.15 C 11 1.69 2.97 1.63 3.48 2.71 4.77 1.98 1.71 C 12 6.60 2.00 3.40 2.60 2.80 5.40 3.40 2.20 C 13 4.67 2.67 2.70 0 0 4.67 0 0 C 14 5.20 1.64 2.60 6.4 4.8 8.3 7.4 4.8 C 15 1.74 4.64 1.61 8.1 7.82 1.80 1.41 3.18
The standardized fuzzy matter-element and the composite prosperity index (Table 3) indicate that the eight typical alpine grasslands (M1–M8) in the study area in 2014 generally showed no warning in terms of their aboveground biomass. Sample plot 6 had light warning, indicating that the vegetation growth in the sample plots was generally good, and the plant diversity was the light warning and below. The content of soil total nitrogen is medium warning and above. The contents of available phosphorus in soil are all heavy warning or huge warning, which indicates that the vegetation habitat is poor and the soil nutrient is low. The proportion of fine herbage is in the light warning only in the sample plot 2 and 8; the rest are in the middle warning and above, which indicates that except for plots 2 and plots 8, the forage quality is lower and there were more poisonous weeds.

3.2. Importance of All Indicators

The weight of all the 15 evaluation indicators considered for possible inclusion in the early warning index system passed the random consistency test (Supplementary Table S4) as the single ranking C.I. value and the total sorting C.R. value are both smaller than 0.1, suggesting that the ranking results are acceptable. The experts’ judgments are consistent with the importance of each index. Hence, all the 15 indicators are retained in the constructed early warning system.
Of the three criterion layers, the most important layer is the quality of grassland (B1) that receives a weight of 0.630, followed by habitat quality (B2) (weight = 0.218), and eco-carrying capacity (B3) (weight = 0.151) (Table 4). Therefore, the quality of grassland is the absolute determinant of whether the grassland faces the risk of degradation, given that its weight is almost twice higher than the combined weight of the other two layers. This outcome is attributable likely to the fact that the habitat quality can account for the eco-carrying capacity of the grassland partially.
The most critical indicator in the grassland quality layer is the number of species or species richness C6. It has a weight of 0.278, the highest among all the six indicators in this layer. Moreover, this weight is more than twice higher than the next most important indicator, height of predominant species C5 (0.114). This indicator is nearly as important as the proportion of bare ground C1 (0.101). Jointly, C5 and C1 can account for the quantity of grassland biomass to a certain degree. This is because bare ground can lead to a loss of nutrients from the grassland through soil erosion and result ultimately in the grassland being degraded, even directly to a serious level. The side effect of bare ground is a reduced yield of fine forage, which makes the grassland sensitive to grazing intensity. A lower plant community exposes the ground to more evaporation and hence a lower soil moisture that is detrimental to grassland health. In contrast, the other three indicators of turf thickness C2, aboveground biomass C3, and vegetation coverage C4 are much less important, probably because their effect has been taken into consideration indirectly via the remaining three indicators.
Of the six habitat quality indicators, total carbon C7 (0.082) is the most significant, followed by available potassium C10 (0.049) and moisture C11 (0.039). In comparison, available phosphorus C8, soil total nitrogen C9, and plot slope (C12) are much less important. This is because a higher biomass on the ground will lead to more decomposition of plant litters. Moisture is rather critical to the health of grasses as it affects whether and how quickly the grass can absorb nutrients from the soil.

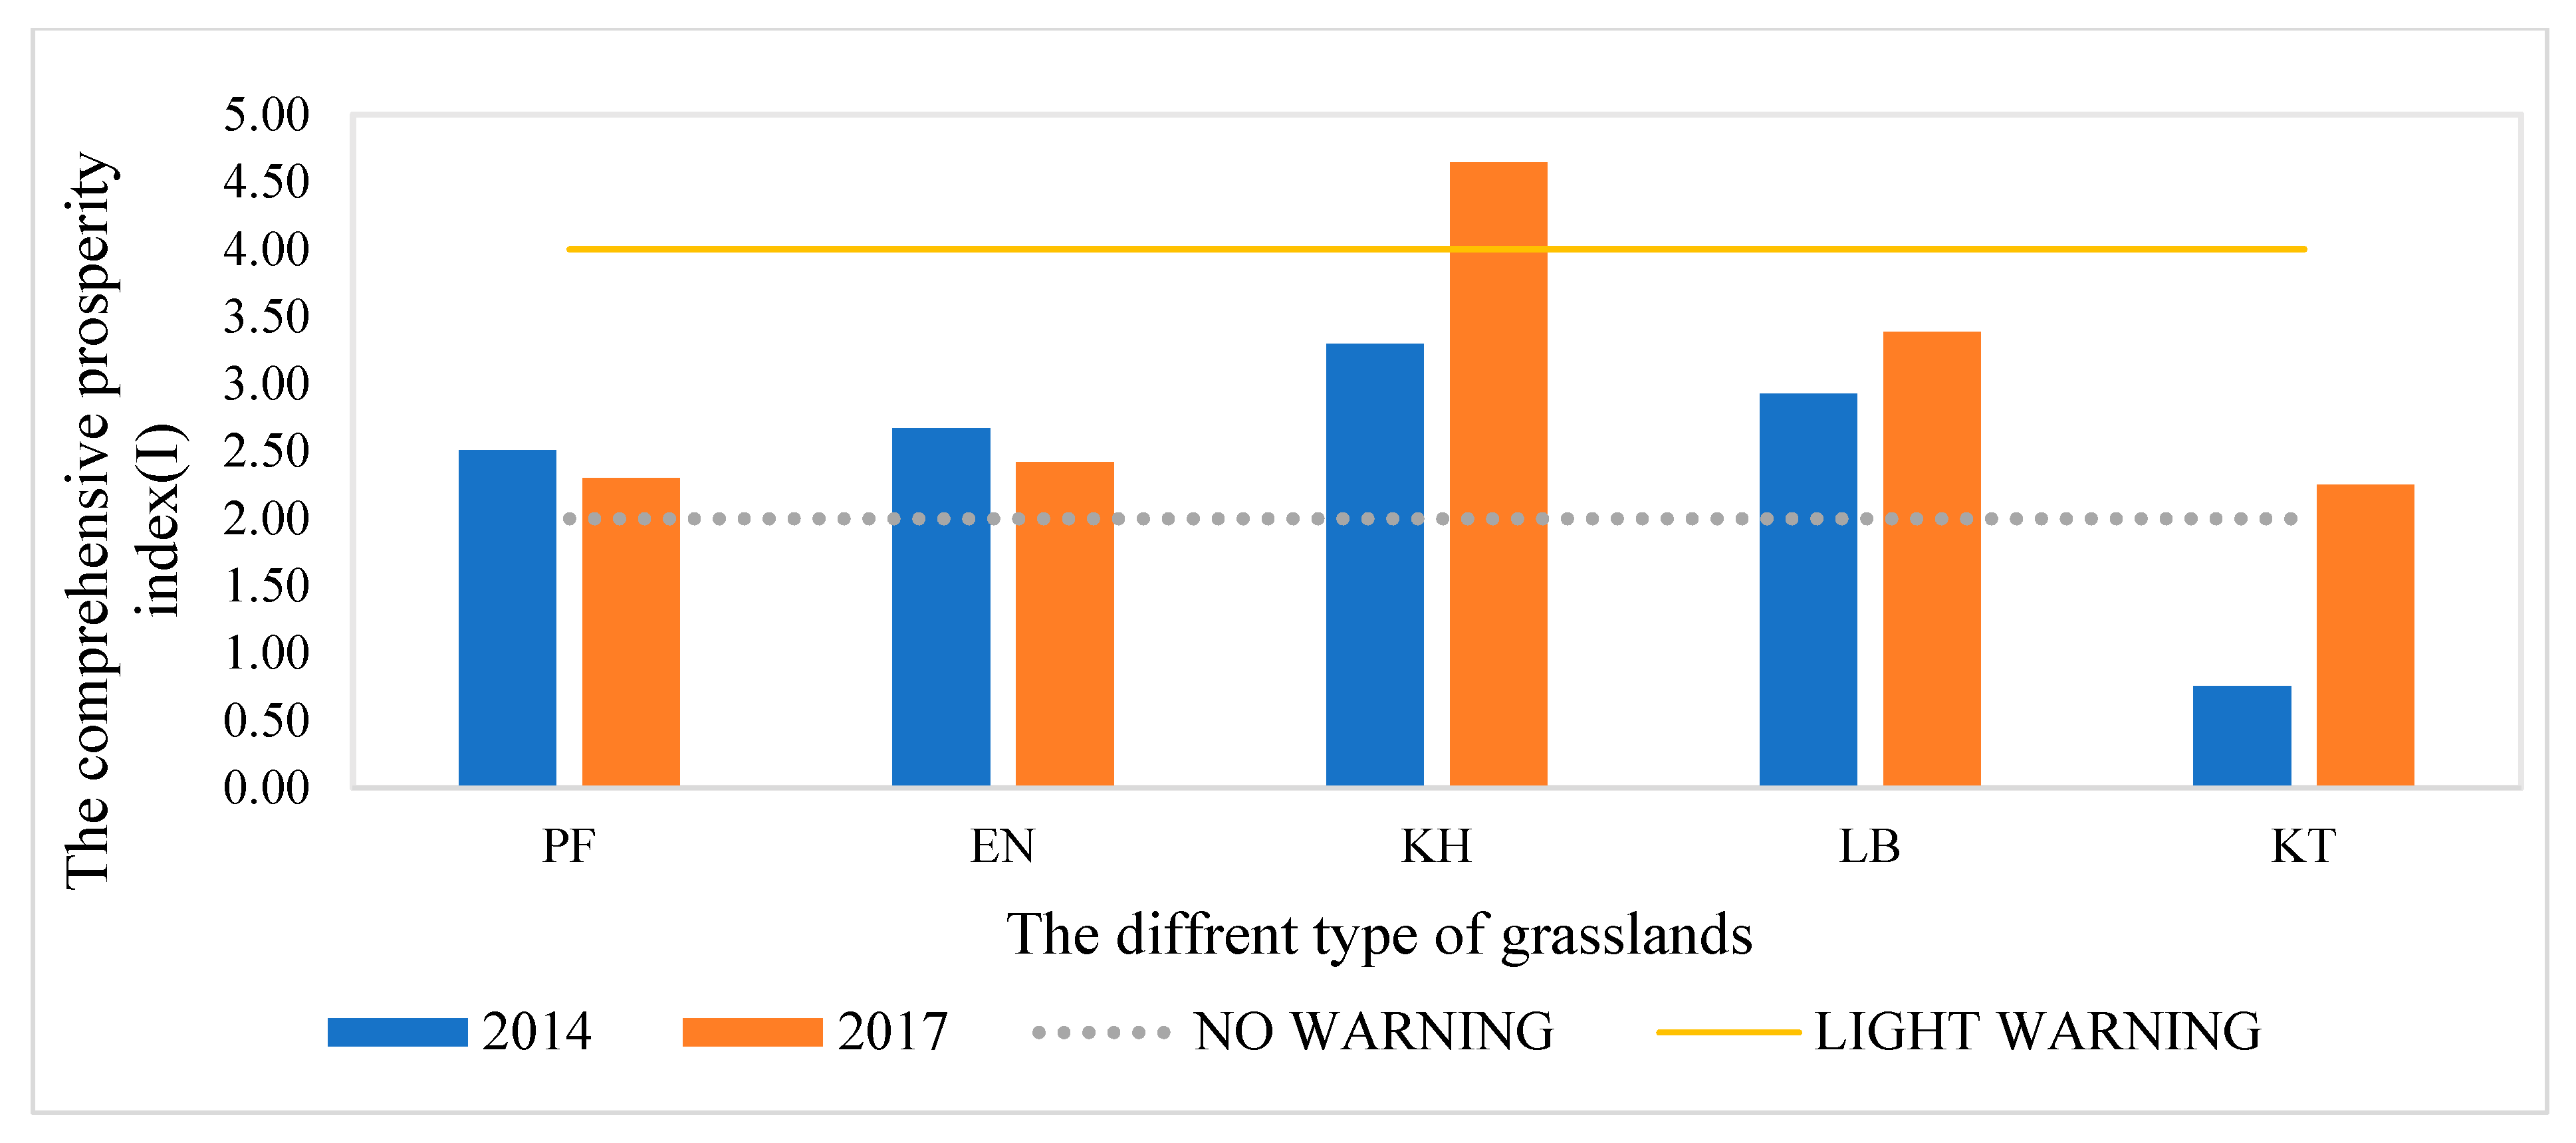
3.3. Level of Early Warning by Grassland Type

As shown in Figure 2, in 2014 all the five types of grassland except KT had a composite prosperity index larger than 2, the threshold for light warning. In contrast, KH had the highest warning index value of 3.4. There is no noticeable difference among the other three types of grassland in their composite prosperity index. The lowest warning index for KT is explained by its change from a former Kobresia marsh to alpine grassland. The relative high warning level of KH is accounted for mainly by the dwarf stature (about 2–3 cm in height) of the grass. In addition, it is also the backbone and dominant grassland that is grazed regularly. Overall, the general level of warning indicates that caution must be exercised in grazing the grassland rationally to prevent it from evolving to the moderate warning level.
However, the index value changed differently among the five types of grassland from 2014 to 2017 (Figure 2). Only two of them (PF and EN) had a lower warning level in 2017 than in 2014. The decrease in PF’s index value is attributed to the marked increase in the height of the fine dominant species of grasses and fine forage, in spite of the fact that its moisture level and aboveground biomass both decreased (Table 5). The decrease in the proportion of bare ground also contributed to the lessened level of warning. Similarly, EN also had a lower proportion of bare ground in 2017 than in 2014. Its soil nitrogen and carbon both increased, despite the highest drop in its aboveground biomass among all the five types of grassland, and a decrease in the portion of fine forage.
Of the five types of grassland, KT suffered the biggest increase in warning level that more than doubled within three years. Such a drastic increase is accounted for by the change in its grassland type from the former marshy grassland to alpine grassland through artificial planting of the Elymus plant species, leading to an increase in grass cover and height as well as biomass. However, this intervention decreased the portion of Kobresia plant species that is resistant to degradation owing to its well-developed root system. Although this intervention increased the average height of grasses and vegetation cover, quite a number of indicators actually decreased in their prosperity index value. In spite of this, however, its vulnerability to degradation actually increased due to its shallower roots. Accompanying these changes is a reduction in aboveground biomass, biodiversity, soil nutrients (total C and P) and moisture, and fine forage.
The worsened index value of KH is related closely to its reduced above-ground biomass, biodiversity, fine species of grass, and vegetation cover (Table 5). Also associated with these changes are decreases in some soil properties. The most important indicators to the observed change are turf layer thickness and total nitrogen. LB grassland suffered a decrease in biomass and grass diversity and soil total P, even though its plant coverage increased while its bare ground decreased.
Of the five types of grassland, Kobresia grassland has the highest composite prosperity index value while Elymus grassland has the lowest, mainly because plant height makes the most contribution to the composite prosperity index (Figure 2). Of all types of Kobresia grassland, its composite prosperity index all increased from 2014 to 2017, irrespective of the exact sub-type of grassland. For instance, Kobresia humilis with a thin turf layer is more sensitive to external disturbance. However, the composite prosperity index of Kobresia tibetica grassland was lower in 2014, but this value increased the most after artificial planting of Elymus. Therefore, appropriate external intervention is beneficial to the restoration of grassland ecosystem. The composite prosperity index of Elymus grassland is variable in 2014 and 2017. Overall, the average prosperity index increased by 0.27 from 2014 to 2017, indicating that the grasslands urgently need strengthened management.

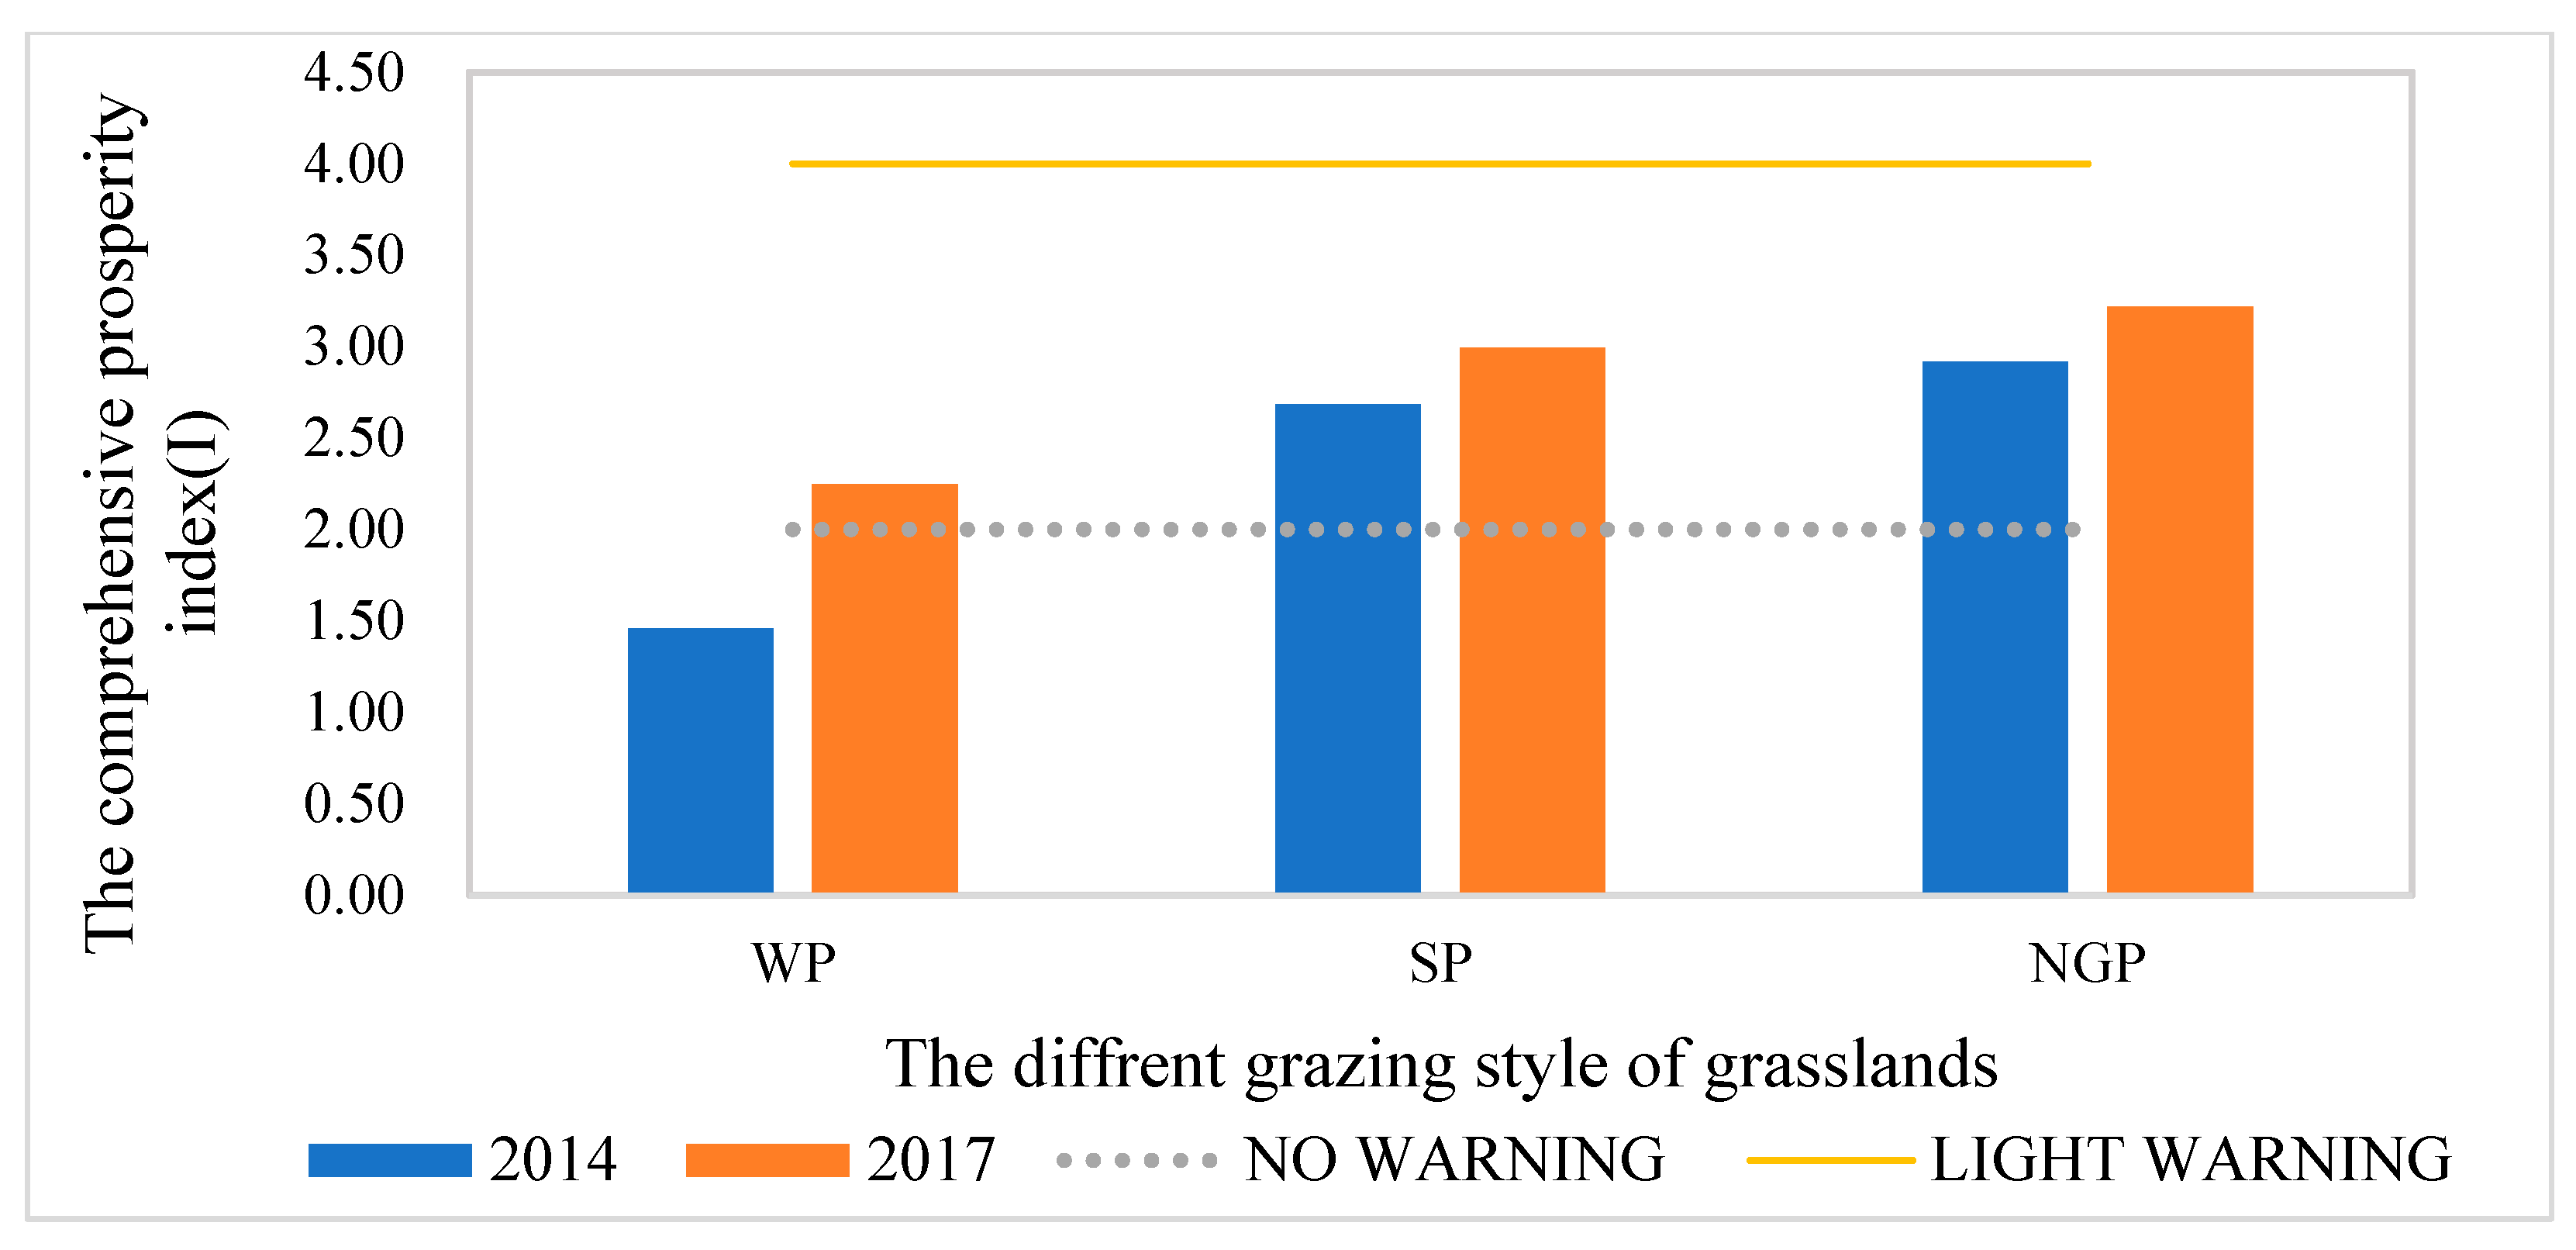
3.4. Level of Early Warning by Grazing Style

In total, there are three grazing styles: winter pasture (WP), summer pasture (SP), and no grazing pasture (NGP). In 2014, all three grazing styles had a composite prosperity index value less than 4 (Figure 3) while WP had a value below 2. Therefore, compared with grasslands under grazing and utilization in winter, the impact of grazing methods on grassland stability is relatively small. Both SP and NGP had a similar level of light warning with a composite index value around 2.8. Thus, grazing style affects the composite prosperity index, and the level of degradation risk. From 2014 to 2017, all three grazing styles had a larger composite prosperity index value (Figure 3). In particular, WP had the largest increase (35.1%), followed by SP (10.33%). In contrast, NGP had the lowest increase of only 9.3%. These changes are related closely to the change in the properties of the relevant indicators. For instance, WP suffered a decrease in aboveground biomass, biodiversity, and soil available K, in spite of the increase in the height of fine species and soil available P (Table 6). For SP, its aboveground biomass, biodiversity, and soil available K all decreased. However, such decreases did not translate into a lower prosperity index value because its turf thickness, vegetation cover, and the portion of fine grasses all increased while its bare ground portion decreased. For NGP, above ground biomass, biodiversity, forage production and soil total P all decreased. Therefore, for NGP grassland, the most important factors to the change in its composite prosperity index are related to the vegetation conditions.

4. Discussion

4.1. Grassland Type and Its Best Way of Use

The stable states of plant communities have been described as high and low steady states [37], and community stable states have been characterized by species turnover rate in community succession. Based on the theory of “ecological monoclimax” or “succession”, the system must overcome the threshold to transfer from one state to another. During early warning, the community state that can be identified and the factors threshold value is difficult to cross is called the stable state when early warning is given [38], so the detectability of early warning is very important [39]. The index characterizing species turnover rate is the number of species, the variation of which is very important, and the index chosen in this study is C6 (Plant diversity) with a weighting index of 0.278.
In the study, 3 types of grazing methods, 5 types of alpine scrub and grassland, and 15 indicator factors were selected to construct a grassland ecological early warning system, which comprehensively considered the effects of grassland types, utilization methods, and early warning indicator factors on the ecological early warning of alpine grassland.
From the study, it can be seen that from 2014 to 2017, the composite prosperity index value all showed an increasing trend, with the greatest degree of change in winter pastures.
There is a complex relationship between the type of grassland and its best way of use or grazing style due to its varying composite prosperity index. In 2014, the composite prosperity index of the five types of grassland and the three types of grazing follows the sequence of Kobresia tibetica (winter pasture) < Elymus (winter pasture) < forbs (no grazing), Kobresia humilis (summer pasture) < Elymus (summer pasture). In 2017, this order changed to Elymus (winter pasture) < Elymus (summer pasture) < Kobresia tibetica (winter pasture) < forbs (no grazing) < Kobresia humilis (summer pasture). This change in sequence demonstrates that the style of grazing exerts a critical impact on the sustainable grazing of a given type of grassland. According to Figure 3, summer pasture had a significantly lower composite prosperity index in 2017 than in 2014 because the ecological recovery benefits showed up only within three years following the sowing of the Elymus grass (summer pasture). Thus, in order to reap the benefits, both the existing intervention intensity and grazing style should be maintained. In the winter pasture of Kobresia tibetica grassland, artificial construction of Elymus has seriously altered the natural state of the ecological system. Different grazing styles should be applied to different types of grassland to maximize the economic return from the grassland without the negative impact on its quality and long-term sustainability. Potentilla fruticosa shrub is best to be used as winter pasture to make the grazing more sustainable, whereas the vegetation of Elymus nutans grassland is low, but the forage is high in nutritional value, which is most suitable for as summer pasture.

4.2. Influence of Grazing Intensity

Under natural conditions, the steady-state transition period is relatively long. When disturbed, the system will undergo gentle and continuous changes in the current steady state. When the disturbance intensity is large enough, the system can be pushed to cross the unstable equilibrium point and fall to another steady state [40]; when the disturbance reaches a certain regime, alternative stable states occur; when the disturbance is greater than the steady-state threshold, a jump between different steady states occurs [41].
The threshold is different depending on the configuration of the community stable state, and the grazing pressure threshold is different in herbaceous grassland and shrub communities [42]. The mono-climax communities which are dominated by single species that are strongly resistant to changes caused by grazing are inconsistently affected by grazing closures on community stable state [43]. Intense disturbances such as heavy grazing can remove dominant species from the dwarf grassland [44]. The large-scale Artemisia annua shrub vegetation, which has been in a stable state for 10 years, lacks response to grazing [45]. The steady state of desert grassland shrub communities is difficult to break [46].
Since it is difficult to control grazing intensity during the study period, this indicator was not included in the early warning system. However, it has been taken into consideration partially through the indicator of grassland eco-carrying capacity. Judging from its highest weight (0.022) in the criterion layer (Table 2), it can be seen that grazing is fundamental to the grassland warning level. This is because more intense grazing will lead directly to a reduction in aboveground biomass, vegetation cover, and change in soil physical properties (e.g., soil compactness), indirectly increasing soil available P [47].
The study shows (Table 6) that the effects of winter grazing, summer grazing, and no grazing on the health status of alpine grasslands were considered in this study. However, the impact of grazing intensity on the health of alpine grasslands was not set, and there was no experiment conducted to determine whether summer grazing avoided the grass rejuvenation period (from April to May each year). Therefore, further research is needed to construct and apply an ecological warning system for alpine grasslands under grazing interference.

4.3. Impact of Human Intervention

Different ecosystem structures and functions correspond to different stable states, and the internal stability of ecosystems can be represented by the “attraction domain” and elasticity. If the “attraction domain” is wide, the system elasticity is large, and vice versa, the system elasticity is small [48]. When the attraction domain of a stable system narrows, small disturbances can also drive the stable state into another attraction domain, leading to significant changes in the ecosystem [49]. Ecosystem mutations have a hysteresis effect, and a greater disturbance is required to return to the original state [50]. Alpine grassland ecosystems are multistable systems. Irreversibility makes the detection of major ecosystem mutations of practical significance, and regime determination and ecological early warning become the focus of homeostatic applications. Accurate estimation of biophysical and chemical covariates of grassland vegetation to realize the dynamic detection of spatial and temporal changes in grassland is an important basis for ecological early warning systems for grassland.
Whether a grassland is grazed or not affected the grassland condition as the composite prosperity index of non-grazing pasture also increased, just like grazed pasture. This demonstrates that a moderate level of grazing is actually conducive to maintaining the health of the grassland. We should consider the modified warning model to adjust the classification standard of total carbon and available phosphorus and adapt to the alpine grassland ecosystem [51].
In this study, the early warning model constructed by the fuzzy object element method and the comprehensive prosperity index was used to evaluate the health status of the grassland and the warning status in 2014 and 2017, and to analyze the changes in the health status of different alpine grasslands and the degree of changes in the early warning and alert changes from the specific changes in the 15 index factors, which not only achieves the purpose of the health evaluation and ecological early warning, but also provides the healthy management of grassland ecosystems with a method of screening the early warning factors, the specific numerical indicators of the changes in the warning factors, and the methods of health management for each warning factor to be performed. It also provides a method for the health management of grassland ecosystems to identify the early warning factors, the specific numerical indexes of the changes of the warning factors, and the health management for the early warning factors. It will also provide references for the selection of sensitivity indicators for grassland ecosystem resilience in future studies, as well as quantitative research on the theory of steady-state critical slowdown and the critical transition [52] of early warning ecosystems.

5. Conclusions

The ecological early warning system constructed in this study for diagnosing grassland health is comprehensive and sound as it comprises a total of 15 indicators related to grassland quality, habitat, and its ecological carrying capacity in three layers (target, criterion, and indicator). It can paint a holistic picture about the true risk of grassland degradation in the study area that cannot be generated from each of the indicators individually. This system is able to yield warning levels of grassland degradation and diagnose its change over a period of time when grassland grazing style may have changed. Grassland quality is the most important to grassland health, followed by habitat quality among the three layers. In turn, grassland habit quality is subject the most to total carbon and available potassium of the soil. Of the five types of grassland, K. Tibetic had the lowest composite prosperity index, and hence the lowest level of warning (safe level), while all other four types of grassland had a higher but very similar level of warning (light) in 2014. However, in 2017, K. tabetic’s index increased the most (198%). K. humilis’s index had the next highest increase to reach the moderate warning level. All three grazing styles had a higher index in 2017 than in 2014. In particular, the winter pasture had the largest increase (35.1%), followed by the spring pasture (10.33%). In contrast, the no-grazing pasture had the lowest increase of only 9.3% to reach the light warning level. The fact that no indicators are equally important to all five types of grassland and the three grazing styles shows that grazing practices should vary with the conditions of the grassland so as to reap the most benefits from the resource without compromising its sustainability.
The fuzzy matter-element model for ecological warning of alpine grassland not only inherits the advantages of classical matter-element analysis such as clear concepts, strong logic, simple calculation process, and high resolution of evaluation results, but also fully considers the uncertainty of weights, comprehensively evaluates grassland conditions, reflects the trend of alpine grassland or reverse succession, and provides protection for targeted health management of grasslands [53]. However, there may be subjectivity when setting weights, so the model application requires a complete rule base [21].

Supplementary Materials

The following supporting information can be downloaded at: https://www.mdpi.com/article/10.3390/agronomy13082176/s1, Table S1: The weights and steps of each evaluation factor; Table S2: Mean random consistency index values; Table S3: Thresholds values (Si) of individual indicators Ci (Uij) used in calculating the level of warning; Table S4: The formula used to standardize Uij to Xij based on the level of warning judged from; Table S5: Test of the consistency of the indicators’ weights.

Author Contributions

Conceptualization, Investigation, Writing—review & editing, H.S.; Software, Writing-original draft, M.L.; Methodology, Investigation, S.Z.; Formal analysis, Z.D.; Investigation, R.W.; Data curation, X.Q.; Formal analysis, M.C.; Writing—original draft, J.Z.; Supervision, Funding acquisition, Y.Q. All authors have read and agreed to the published version of the manuscript.

Funding

This work was funded by the Basic Research Project of Science and Technology Department of Qinghai Province (2021-ZJ-715); Project to promote scientific research cooperation and high-level talent training with CANZ and Latin America (No. [2021]109); Famous Teachers cultivation project of Qinghai University (2019-2022); First-class discipline “Ecosystem Management” in Sanjiangyuan of Qinghai University (ZYHX-202208).

Data Availability Statement

The data presented in this study are available on request from the corresponding author.

Conflicts of Interest

The authors declare no conflict of interest.

References

  1. Zhang, J.N.; Zhang, J.G. Grazing strategies and suggestions for sustainable utilization of alpine meadow resources on the Qinghai Tibet Plateau. Chin. Herbiv. Sci. 2017, 37, 63–67. [Google Scholar]
  2. Wu, G.L.; Du, G.Z. Discussion on the restoration and sustainable development of degraded alpine grassland ecosystem in Qinghai Tibet Plateau. Nat. J. 2007, 29, 159–164. [Google Scholar]
  3. Li, X.L.; Gao, J.; Brierley, G.; Qiao, Y.M.; Zhang, J.; Yang, Y.W. Rangeland degradation on the Qinghai—Tibet Plateau: Implications for rehabilitation. Land Degrad. Dev. 2013, 80, 72–80. [Google Scholar] [CrossRef]
  4. Song, Y.; Long, J.; Wang, H.B. Vegetation Changes along the Qinghai-Tibet Plateau Engineering Corridor since 2000 Induced by Climate Change and Human Activities. Remote Sens. 2018, 10, 95. [Google Scholar] [CrossRef]
  5. Zhao, X.Q.; Zhou, H.K. Eco-environmental degradation, vegetation regeneration and sustainable development in the headwaters of three rivers on Tibetan Plateau. China Acad. J. Electron. Publ. House 2005, 20, 471–476. [Google Scholar]
  6. Hu, L.; Wang, C.T.; Wang, G.X.; Ma, L.; Liu, W.; Xiang, Z.Y. Changes in the activities of soil enzymes and microbial community structure at different degradation successional stages of alpine meadows in the headwater region of three rivers, China. Acta Prataculturae Sin. 2014, 23, 8–19. [Google Scholar]
  7. Wang, G.X.; Li, Y.S.; Wang, Y.B.; Shen, Y.P. Impacts of alpine ecosystem and climate changes on surface runoff in the headwaters of the Yangtze River. J. Glaciol. Geocryol. 2007, 29, 159–168. [Google Scholar]
  8. Li, N.; Wang, G.X.; Liu, G.S.; Liu, Y.; Sun, X.Y. The ecological implications of land use change in the source regions of the Yangtze and Yellow Rivers, China. Reg. Environ. Chang. 2013, 13, 1099–1108. [Google Scholar]
  9. Soyza, A.G.; Whitford, W.G.; Herrick, J.E.; Van Zee, J.W.; Havstad, K.M. Early warning indicators of desertification: Examples of tests in the Chihuahuan Desert. J. Arid. Environ. 1998, 39, 101–112. [Google Scholar] [CrossRef]
  10. Fu, B.j. Principle and method of regional ecological environment early warning. Resour. Dev. Prot. 1991, 7, 138–141. [Google Scholar]
  11. Dakos, V.; Scheffer, M.; Van Nes, E.H.; Held, H. Slowing down as an early warning signal for abrupt climate change. Proc. Natl. Acad. Sci. USA 2008, 105, 14308–14312. [Google Scholar] [CrossRef]
  12. Drake, J.M.; Griffen, B.D. Early warning signals of extinction in deteriorating environments. Nature 2010, 467, 456–459. [Google Scholar] [CrossRef]
  13. Capparelli, G.; Tiranti, D. Application of the MoniFLaIR early warning system for rainfall-induced landslides in Piedmont region (Italy). Landslides 2010, 7, 401–410. [Google Scholar] [CrossRef]
  14. Wen, D.L.; Pan, H. Construction of monitoring and early warning system for cold soil black soil environment. Environ. Sci. Manag. 2010, 35, 124–126. [Google Scholar]
  15. Hackett, B.; Comerma, E.; Daniel, P. Marine pollution monitoring and prediction. Oceanography 2009, 22, 168–175. [Google Scholar] [CrossRef]
  16. Wright, A.L. Wetland Eutrophication: Early Warning Biogeochemical Indicators. Soil Water Sci. 2016, 304, 1–3. [Google Scholar] [CrossRef]
  17. Van Dam, R.A.; Camilleri, C.; Finlayson, C.M. The potential of rapid assessment techniques as early warning indicators of wetland degradation: A review. Environ. Toxicol. 2015, 13, 297–312. [Google Scholar] [CrossRef]
  18. Qin, Y.; Yang, Z.; Yang, W. Ecological risk assessment for water scarcity in China’s Yellow River Delta Wetland. Stoch. Environ. Res. Risk Assess. 2011, 25, 697–771. [Google Scholar] [CrossRef]
  19. Romañach, S.S.; Benscoter, A.M.; Brandt, L.A. Value-focused framework for defining landscape-scale conservation targets. J. Nat. Conserv. 2016, 32, 53–61. [Google Scholar] [CrossRef]
  20. Shang, Z.H.; Dong, Q.M.; Shi, J.J.; Zhou, H.K.; Dong, S.K.; Shao, X.Q.; Li, S.X.; Wang, Y.L.; Ma, Y.S.; Ding, L.M.; et al. Research progress in recent ten years of ecological restoration for ‘Black Soil Land’ degraded grassland on Tibetan plateau-concurrently discuss of ecological restoration in Sangjiangyuan region. Acta Agrestia Sin. 2018, 26, 1–21. [Google Scholar]
  21. Liu, D.J.; Zou, Z.H. Water quality evaluation based on improved fuzzy matter-element method. J. Environ. Sci. 2012, 24, 1210–1216. [Google Scholar] [CrossRef] [PubMed]
  22. Zhu, J.; Tao, X. Evaluation of Land Ecological Safety Based on Fuzzy Matter-Element Theory. J. Comput. 2011, 6, 2639–2646. [Google Scholar] [CrossRef]
  23. Li, L.; Xu, Y.L.; Jiang, S.H.; Wu, Q.M. Evaluation of Urban Vitality Based on Fuzzy Matter-Element Model. Geogr. Geo-Inf. Sci. 2010, 26, 73–77. [Google Scholar]
  24. Ren, J.Z. Methods of Grassland Science Research; China Agriculture Press: Beijing, China, 1998. [Google Scholar]
  25. You, Q.G.; Xian, X.; Peng, F.; Dong, S.Y. Alpine meadow degradation effect on soil thermal and hydraulic properties and its environmental impacts. J. Desert Res. 2015, 35, 1183–1192. [Google Scholar]
  26. Cai, X.B.; Zhou, J. Spatial-temporal variation of soil organic carbon and its relations to soil physical properties in degraded alpine grasslands. Chin. J. Appl. Ecol. 2009, 20, 2639–2645. [Google Scholar]
  27. Wei, J.; Jiang, P.; Yu, D.Y.; Wu, G.; Fu, H.W. Distribution patterns of vegetation biomass and nutrients bio-cycle in alpine tundra ecosystem on Changbai Mountains. Northeast. China J. For. Res. 2007, 18, 271–278. [Google Scholar] [CrossRef]
  28. Saccone, P.; Cirel, J.; Pages, J.P.; Brun, J.J.; Michalet, R. Ecological resistance to Acer negundo invasion in a European riparian forest: Relative importance of environmental and biotic drivers. Appl. Veg. Sci. 2013, 16, 184–192. [Google Scholar] [CrossRef]
  29. Cao, Y.Z.; Wang, X.D.; Lu, X.Y.; Yan, Y.; Fan, J.H. Soil organic carbon and nutrients along an alpine grassland transect across Northern Tibet. J. Mt. Sci. 2013, 10, 564–573. [Google Scholar] [CrossRef]
  30. Hou, F.J.; Li, G.; Chang, S.H. Physiological indicators of grazing grassland health management. J. Appl. Ecol. 2002, 13, 1049–1053. [Google Scholar]
  31. Liu, J.Y.; Xu, X.L.; Shao, Q.Q. Grassland degradation in the “Three-River Headwaters” region, Qinghai Province. J. Geogr. Sci. 2008, 18, 259–273. [Google Scholar] [CrossRef]
  32. Dong, Q.M.; Ma, Y.S.; Xu, C.J.; Shi, J.J.; Wang, Y.; Wang, Y.L.; Sheng, L.; Li, S.X. Study of Classification and Gradation, Restoration of Black-Soil Beach Degraded Grassland in the Headwaters of Three Rivers. Acta Agrestia Sin. 2015, 23, 441–447. [Google Scholar]
  33. Yang, W.C. Health Evaluation of Qinghai Tibet Alpine Meadow Ecosystem: A Case Study of Chengduo County; Gansu Agricultural University: Lanzhou, China, 2010. [Google Scholar]
  34. Liu, Z. Evaluation of Ecological Carrying Capacity of Qilian Mountains Nature Reserve; Nanjing Normal University: Nanjing, China, 2004. [Google Scholar]
  35. Partovi, F.Y. Determining what to benchmark: An analytic hierarchy process approach. Int. J. Oper. Prod. Manag. 1994, 14, 25–39. [Google Scholar] [CrossRef]
  36. Jing, P. The Fuzzy Matter-Element Model for Forewarning Analysis of Regional Water Resources Sustainable Development. China Rural Water Hydropower 2005, 8, 22–24. [Google Scholar]
  37. Murray, R.B.; Mayland, H.F.; Van Soest, P.J. Growth and Nutritional Value to Cattle of Grasses on Cheatgrass Range in Southern Idaho; Department of Agriculture, Forest Service, Intermountain Forest and Range Experiment Station: Ogden, UT, USA, 1978.
  38. Xu, C.; Wang, H.J.; Liu, Q.X.; Wang, B. Alternative stable states and tipping points of ecosystems. Biodivers. Sci. 2020, 28, 1417–1430. [Google Scholar] [CrossRef]
  39. Dakos, V.; Van Nes, E.H.; Donangelo, R.; Fort, H.; Scheffer, M. Spatial correlation as leading indicator of catastrophic shifts. Theor. Ecol. 2010, 3, 163–174. [Google Scholar] [CrossRef]
  40. Sutherland, W.J.; Freckleton, R.P.; Godfray, H.C.J.; Beissinger, S.R.; Benton, T.; Cameron, D.D.; Carmel, Y.; Coomes, D.A.; Coulson, T.; Emmerson, M.C.; et al. Identification of 100 fundamental ecological questions. J. Ecol. 2013, 101, 58–67. [Google Scholar] [CrossRef]
  41. Berdugo, M.; Kéfi, S.; Soliveres, S.; Maestre, F.T. Plant spatial patterns identify alternative ecosystem multifunctionality states in global drylands. Nat. Ecol. Evol. 2017, 1, 0003. [Google Scholar] [CrossRef]
  42. Liautaud, K.; van Nes, E.H.; Barbier, M.; Scheffer, M.; Loreau, M. Superorganisms or loose collections of species? A unifying theory of community patterns along environmental gradients. Ecol. Lett. 2019, 22, 1243–1252. [Google Scholar] [CrossRef]
  43. Rosindell, J.; Hubbell, S.P.; Etienne, R.S. The Unified Neutral Theory of Biodiversity and Biogeography at Age Ten. Trends Ecol. Evol. 2011, 26, 340–348. [Google Scholar] [CrossRef]
  44. Beck, R.F.; Tober, D.A. Vegetational changes on creosotebush sites after removal of shrubs, cattle and rabbits. Agric. Exp. Stn. Bull. 1985, 717, 1–22. [Google Scholar]
  45. Allen, E.B. The Reconstruction of Disturbed Arid Lands: An Ecological Approach; Routledge Press: New York, NY, USA, 2019. [Google Scholar]
  46. Costello, D.F.; Turner, G.T. Judging Condition and Utilization of Short-Grass Ranges on the Central Great Plains; US Department of Agriculture: Washington, DC, USA, 1944.
  47. Proffitt, A.; Bendotti, S.; Eastham, J. The effect of sheep trampling and grazing on soil physical properties and pasture growth for a red-brown earth. Aust. J. Agric. Res. 1993, 44, 317–331. [Google Scholar] [CrossRef]
  48. Scheffer, M.; Carpenter, S.R. Catastrophic regime shifts in ecosystems: Linking theory to observation. Trends Ecol. Evol. 2003, 18, 648–656. [Google Scholar] [CrossRef]
  49. Mäler, K.G. Development ecological resources and their management: A study of complex dynamic systems. Eur. Econ. Rev. 2009, 44, 645–665. [Google Scholar] [CrossRef]
  50. Ellison, L. Influence of grazing on plant succession of rangelands. Bot. Rev. 1960, 26, 1–78. [Google Scholar] [CrossRef]
  51. Rohde, K.; Stauffer, D. Simulation of geographical trends in Chowdhury ecosystem model. Adv. Complex Syst. 2005, 8, 4. [Google Scholar] [CrossRef]
  52. Hu, Z.M.; Guo, Q.; Li, S.G.; Piao, S.L.; Knapp, A.K.; Ciais, P.; Li, X.R.; Yu, G.R. Shifts in the dynamics of productivity signal ecosystem state transitions at the biome-scale. Ecol. Lett. 2018, 21, 1457–1466. [Google Scholar] [CrossRef] [PubMed]
  53. Wang, R.E.; He, B. Concept’s Representation and Extension Nature Based on Matter-Element Models. J. Petrochem. Univ. 1997, 10, 83–87. [Google Scholar]
Figure 1. Location of Henan Mongol Autonomous County (orange) in Huangnan Tibetan Autonomous Prefecture (green) and Qinghai Province (sky blue).
Agronomy 13 02176 g001
Figure 2. The composite prosperity index value of the five types of grassland in 2014 and 2017 (PF—Potentilla fruticosa shrub, EN—Elymus nutans, KH—Kobresia humilis, LB—forbs, and KT—Kobresia tibetica).
Agronomy 13 02176 g002
Figure 3. The composite prosperity index of grassland by grazing style in 2014 and 2017 (WP stands for winter pasture, SP stands for summer pasture, NGP stands for no grazing pasture).
Agronomy 13 02176 g003
Table 1. Properties of the eight sampling plots.
Type
of
Grassland
Longitude
(E)
Latitude
(N)
Altitude (m)Species Richness
(S)
Veg Coverage (%)Veg
Height
(cm)
Dominant SpeciesGrazing Style
PHM1101°24′41″34°41′53″35414899.060Potentilla fruticosa (0.051)Winter Pasture (WP)
M6101°25′48″34°40′42″35182182.035Potentilla fruticosa (0.225)Summer Pasture (SP)
ENM2101°51′53″34°35′36″35902894.375Elymus nutans (0.108)Winter Pasture (WP)
M3101°47′17″34°37′16″36361675.555Elymus nutans (0.150)Summer Pasture (SP)
M7101°35′27″34°42′11″35423579.570Elymus nutans (0.182)No Grazing (NGP)
KHM4101°31′51″34°52′21″36102892.13Kobresia humilis (0.079)Summer Pasture (SP)
LBM5101°30′37″34°42′15″35093088.028Ligularia birgaurea (0.114)No Grazing (NGP)
KTM8101°27′57″34°51′22″35883398.355Kobresia tibetica (0.180)Winter Pasture (WP)
Table 2. The indicators selected in the early warning system.
Target Layer (A) Criterion Layer (B)Indicator Layer (C)
WeightFactorUnit
Derive the level of warning on the potential risk of grassland degradation0.630B1—grassland qualityC1Bare ground proportion%
C2Turf layer thicknesscm
C3Above ground biomassg/m2
C4Vegetation coverage%
C5Height of dominant speciescm
C6Plant richnessNumber of species
0.218B2—habitat qualityC7Total carbong/Kg
C8Available phosphorusg/Kg
C9Total nitrogenmg/Kg
C10Available potassiummg/Kg
C11Moisture%
C12Slope°
0.151B3—eco-carrying capacityC13Grazing intensitysheep-unit/hm2.year
C14Forage productionRMB/hm2
C15Fine forage ratio%
Table 3. The corresponding relations of alert degree, booming exponents, and index scope.
Warning DegreeNo WarningLight WarningMedium WarningSerious WarningExtreme Warning
Prosperity index[0, 2][2, 4][4, 6][6, 8][8, 10]
Range of indicators<S4[S4, S3][S3, S2][S2, S1]≥S1
Note: S 1 > S 2 > S 3 > S 4 indicates the critical value of different warning ranges.
Table 4. Weights of evaluation matrix.
B1-CParameterB1C1C2C3C4C5C6
W ¯ l b 2.2891.2460.8880.3420.5251.4143.448
W i b 0.6300.110.0660.0280.0420.1140.278
B2-C B2C7C8C9C10C11C12
W ¯ l b 0.7942.9280.2930.5671.7631.3990.833
W i b 0.2180.0820.0080.0160.0490.0390.023
B3-C B3C13C14C15
W ¯ l b 0.5502.4660.4053.271
W i b 0.1510.0220.0120.110
Table 5. Change in the 15 indicators among the five types of grassland during 2014–2017.
IndicatorFactorChange Degree (%)
PFENKHLBKT
C1Bareground proportion−38.42−35.7030.38−69.17147.06
C2Turf layer thickness0.0010.71−25.0016.67−7.69
C3Aboveground biomass−20.86−72.75−68.66−28.49−38.18
C4Vegetation coverage4.037.26−2.619.43−2.54
C5Height of dominant species21.482.764.880.007.09
C6Plant diversity−57.14−50.63−67.86−66.67−72.73
C7Total carbon11.2618.6118.19−9.5713.99
C8Available phosphorus−21.1249.4314.4918.1841.92
C9Total nitrogen−15.937.76−51.46−35.22−1.05
C10Available potassium−30.742.91−18.0414.0539.99
C11Moisture−35.4115.94−7.99−0.9514.37
C12Slope0.000.000.000.000.00
C13Grazing intensity13.04−47.3720.00−100.00−400.00
C14Forage production−8.93−7.860.00−5.26−14.29
C15Fine forage ratio102.7492.9943.57925.0042.68
Note: Change degree—The degree of the indicators change, PF—Mean values of indicators for Potentilla fruticosa under winter pasture and summer pasture, EN—Mean values of indicators for Elymus nutans under no grazing, winter pasture, and summer pasture.
Table 6. Change in the 15 indicators among the three types of grazing.
Value DifferenceChange Degree (%)
WPSPNGPWPSPNGP
C1Bareground proportion−1.8710.932.90−17.0899.8926.53
C12Slope0.000.000.000.000.000.00
C13Grazing intensity−0.13−0.101.75−7.62−5.710.00
C2Turf layer thickness0.00−0.330.000.00−100.000.00
C3Above ground biomass183.40113.9985.26100.0062.1546.49
C4Vegetation coverage1.87−10.93−2.9017.08−100.00−26.53
C5Height of dominant species−4.130.27−1.00−100.006.46−24.21
C6Plant diversity22.679.6722.0099.9942.6497.04
C7Total carbon−1.93−5.76−3.31−33.56−100.00−57.38
C8Available phosphorus0.86−0.42−1.5954.09−26.62100.00
C9Total nitrogen−0.811.090.67−74.19100.0061.56
C10Available potassium88.8049.73−75.44100.0056.00−84.95
C11Moisture16.330.62−4.29100.003.80−26.24
C14Forage production3.671.674.0091.6741.67100.00
C15Fine forage ratio−5.33−44.54−32.72−11.97−100.00−73.46
Note: Value difference—The value of the indicators change from 2014 to 2017; Change degree—the value/the valuemax.
Disclaimer/Publisher’s Note: The statements, opinions and data contained in all publications are solely those of the individual author(s) and contributor(s) and not of MDPI and/or the editor(s). MDPI and/or the editor(s) disclaim responsibility for any injury to people or property resulting from any ideas, methods, instructions or products referred to in the content.

