Article

Interacting Effects of Nitrogen Addition and Mowing on Plant Diversity and Biomass of a Typical Grassland in Inner Mongolia

1
Jiangsu Collaborative Innovation Center of Atmospheric Environment and Equipment Technology, School of Environmental Science and Engineering, Nanjing University of Information Science & Technology, Nanjing 210044, China
2
School of Ecology and Environment, Inner Mongolia University, Hohhot 010021, China
*
Author to whom correspondence should be addressed.
These authors contributed equally to this work.
Agronomy 2023, 13(8), 2125; https://doi.org/10.3390/agronomy13082125
Submission received: 1 July 2023 / Revised: 8 August 2023 / Accepted: 11 August 2023 / Published: 14 August 2023
(This article belongs to the Special Issue Grassland and Pasture Ecological Management and Utilization)

Abstract

:
It is unclear how N addition and mowing interactively affect grassland community structure and function. We studied the short-term effects of N addition and mowing on the species diversity and biomass of a typical grassland in Inner Mongolia using a split-plot design, with the whole plot representing the mowing treatment and the subplot representing the N addition rate. Three stubble heights were set at 10 cm (M2), 6 cm (M3) and 3 cm (M4), and a no-mowing treatment (M1) was also included. N addition consisted of five rates, i.e., 0 (N1), 2 (N2), 5 (N3), 10 (N4) and 20 (N5) g N m2.yr−1. Mowing significantly increased species diversity. Mowing with a stubble height of 10 cm (M2) significantly increased both species biomass and community biomass. Heavy mowing (3 cm stubble height, M4) weakened the difference in C. squarrosa biomass caused by N addition. Species richness decreased, while community biomass and Leymus chinensis biomass increased significantly with increasing N addition rate. Mowing alleviated the negative effects of N addition on species richness, and this effect was influenced by stubble height. Community biomass and L. chinensis biomass tended to be stable when N addition was greater than 10 g N m2.yr−1. The N saturation threshold of C. squarrosa biomass was much lower than that of community biomass and L. chinensis biomass. Species richness was negatively correlated with the Gini coefficient and litter production, which indicated that light competition and litter accumulation were important factors affecting the decrease in species richness in our study.

1. Introduction

Since the industrial revolution, human activities such as fossil fuel combustion and agricultural production have led to a substantial increase in reactive nitrogen (N) entering the terrestrial ecosystem [1,2]. It is estimated that the amount of N deposition caused by human activities has increased from 31.6 Tg per year in 1860 to 103 Tg per year in the 1990s and is expected to increase to 195 Tg per year by 2050 [3]. Many studies have indicated that the enhancement of N deposition could profoundly impact the structure, function and processes of ecosystems [4,5]. The response of ecosystems to N deposition has always been a popular research topic in the field of global change. Under the background of the continuous increase in global N deposition, exploring the effects of N addition on plant community structure and function will be beneficial for better understanding ecosystem responses to global change.
As one of the most widely distributed vegetation types worldwide, grassland accounts for approximately 20% of the global land surface [6] and plays an important role in supporting livestock production and providing ecosystem services such as sand fixation, soil and water conservation and biodiversity conservation [7,8]. N is a key factor limiting the productivity of grassland ecosystems [4]. N enrichment can directly increase the availability of soil N and subsequently alleviate N limitation to plant growth [9,10], thereby changing plant community structure and function [11,12]. The response of soil N availability and the community light environment to nitrogen enrichment is a gradually changing process, resulting in phase-dependent community changes with the continuous input of reactive N [13]. Therefore, exploring the short-term effects of N addition on grassland community biomass and diversity is critical for comprehensively evaluating the effects of N enrichment on grassland ecosystems. Most studies have indicated that N enrichment results in a decline in species diversity [14,15,16]; however, some studies have also shown that N enrichment leads to positive or no change in diversity [17,18,19]. The changes in community biomass and species diversity and their underlying mechanisms vary depending on the grassland type, experiment duration and N deposition rate [14,16,20]. Given these uncertainties, it is necessary to verify the response of grassland community biomass and diversity to N addition.
Mowing for hay and silage is both a widely used human disturbance and a pasture management activity in grassland ecosystems across the world [21,22]. Mowing can change community structure and function by removing aboveground biomass, altering structural heterogeneity and decreasing litter accumulation [23,24]. Moderate mowing can improve species diversity and biomass, while heavy mowing can decrease productivity and thus threaten ecosystem stability [25,26]. Stubble height is a key factor affecting mowing effects on community structure and function [22]. A study carried out in a semiarid steppe showed that plant biomass production increased under light mowing (stubble height > 12 cm) but decreased under heavy mowing (stubble height < 6 cm) [22]. Suitable stubble height may increase light availability [25], thereby increasing species diversity by promoting the growth of subdominant species and forbs [26]. For example, one previous study indicated that an 8 cm stubble height significantly increased the Shannon diversity index of a typical grassland in Inner Mongolia. Another study, however, reported that there was no significant difference in Shannon index and evenness index among stubble heights [22]. In general, the effects of stubble height on community structure and function are still unclear.
The N addition can promote light interception by upper-layer tall grasses and thereby decrease the light availability for lower-layer plants; however, mowing can initially enhance the light availability of subdominant species [26,27]. N addition causes an increase in litter accumulation, while mowing can remove litter [26,28], which produces the opposite effects on seed germination and seedling regeneration. The decrease in N accumulation caused by the mowing-induced removal of aboveground biomass would weaken the soil N availability enhanced by N enrichment [29,30,31]. However, it is unclear how N addition and mowing interactively affect grassland community structure and function. The uncertainty related to the mechanisms of how the plant community responds to N addition and mowing requires further investigation to fill our knowledge gap.
The typical grasslands in Inner Mongolia account for approximately 10.5% of the total grassland area in China and are an important livestock production base and green ecological barrier in northern China [32,33]. Continuous input of reactive N will inevitably change the plant community structure and function of this typical grassland [34]. Apart from N enrichment, mowing is a widely used practice in this temperate grassland [22]. Therefore, the objective of this study was to determine the independent and joint effects of N addition and mowing on the plant biomass and species diversity of a typical grassland in Inner Mongolia.

2. Materials and Methods

2.1. Study Site

Our study was conducted in a typical steppe region located in the Grassland Ecology Research Station of Inner Mongolia University (44°09′~44°18′ N, 116°12′~116°30′ E, 1160 m a.s.l). The climate is temperate and semiarid with a dry spring and wet summer. The long-term (1971–2010) mean annual temperature was 2.8 °C, with the lowest monthly mean temperature in January (−19.03 °C) and highest in July (21.38 °C). The annual mean precipitation is 272 mm, 87% of which falls in the plant growing season from May to September. The soil is a sandy loam light chestnut soil according to the Chinese soil taxonomy classification, which is equivalent to Calcic-orthic Aridisol in the United States Soil Taxonomy classification system [22]. Mean soil pH of the top 10 cm is 8.4. Soil organic carbon, total N and total phosphorus concentrations for the top 10 cm are 12.8, 1.7 and 0.3 g kg−1, respectively. The vegetation is dominated by native rhizomatous perennial C3 grass, i.e., Leymus chinensis and native perennial C4 bunchgrass, i.e., Cleistogenes squarrosa, which together account for more than 80% of the total aboveground biomass. The experimental grassland with fairly uniform vegetation appeared topographically and floristically similar. According to background investigation, the species richness, Shannon-Wiener index and evenness index ranged from 6 to 10 averaging 8, 0.32 to 0.63 averaging 0.47 and 0.15 to 0.34 averaging 0.23, respectively.

2.2. Experimental Design and Sampling

The experiment was established in 2018 using a split-plot design, with the whole plot being the mowing treatment and the subplot being N addition. The mowing treatment included a no-mowing control (M1) and mowing at stubble heights of 10 cm (M2), 6 cm (M3) and 3 cm (M4). Mowing treatments were implemented once a year at the time of peak plant biomass (mid-August). N addition consisted of five rates, i.e., 0 (N1), 2 (N2), 5 (N3), 10 (N4) and 20 (N5) g N m2.yr−1. There were 20 experimental treatments in total, with 5 replicate blocks for each treatment, resulting in 100 treatment plots in total. Each plot was 5 m × 5 m in area, separated by 1 m rows. Starting in 2018, CO(NH2)2 was applied to the soil surface in each N3-N5 plot twice a year with 50% of N applied at each time. The first nitrogen application time was the early growing season (8–10 May), and the second application time was the middle of the growing season (3–5 July). For the N2 plot, the level of 2 g N m2.yr−1 was too low to split and applied once a year at the first application time.
In 2020, just before annual mowing at the time of peak biomass (middle–late August), one 1 m × 1 m quadrat was randomly placed within 5 m × 5 m each plot for vegetation measurement. The quadrat was placed at least 50 cm inside the border of each plot to avoid edge effects. Individuals of all vascular plant species were identified in quadrats, and the height and density of each species were measured. All vascular plants in the quadrat were clipped and sorted by species. Litter was collected from each quadrat after clipping. The plant samples were oven-dried at 65 °C for 48 h to a constant weight and then weighed.

2.3. Data Analysis and Statistics

For each plot, we determined the vascular plant species richness (S), Shannon-Wiener index (H′) and evenness index (J′) as H′ = − p i × ln p i and J′ = H′/ln S, where pi is the proportion of the total abundance of the ith species. Community density was abundance of vascular plants per unit area. Community biomass was calculated by adding the dry weights of all vascular plants. The asymmetry of plant height can reflect species competition ability for light resources. The Gini coefficient (G) was calculated based on the plant height of each species to quantify the intensity of interspecific competition in the community [35]. The Gini coefficient was calculated as follows:
G = i = 1 n j = 1 n X i X j 2 n X ¯
where Xi and Xj represent the plant height of the ith species and jth species, respectively. X ¯   is the mean height of all species and n is the number of species for each plot.
Statistical analyses were conducted using the GLM procedure. Treatment effects on community density, species diversity, biomass, litter production and the Gini coefficient were analyzed by univariate ANOVA with mowing and nitrogen addition as the fixed factors and with block as random factor. If the interaction term was nonsignificant, then it was removed from the statistical model, and the main factor effects were reanalyzed using one-way ANOVAs. Data were tested for normality using the Kolmogorov–Smirnov test and for equality of error variance using Levene’s test. Duncan’s test was used for multiple comparisons in all cases of significant treatment effects. Regression models with N as a continuous variable were used to determine the general relationship between N addition and the response variable, i.e., response variable = Intercept + Slope × Ln (N). The relationships between species richness and litter production and the Gini coefficient were analyzed using linear regression. In all analyses, a difference was considered significant at p < 0.05. All analyses were conducted using version 20.0 of SPSS software (SPSS Inc., Chicago, IL, USA).

3. Results

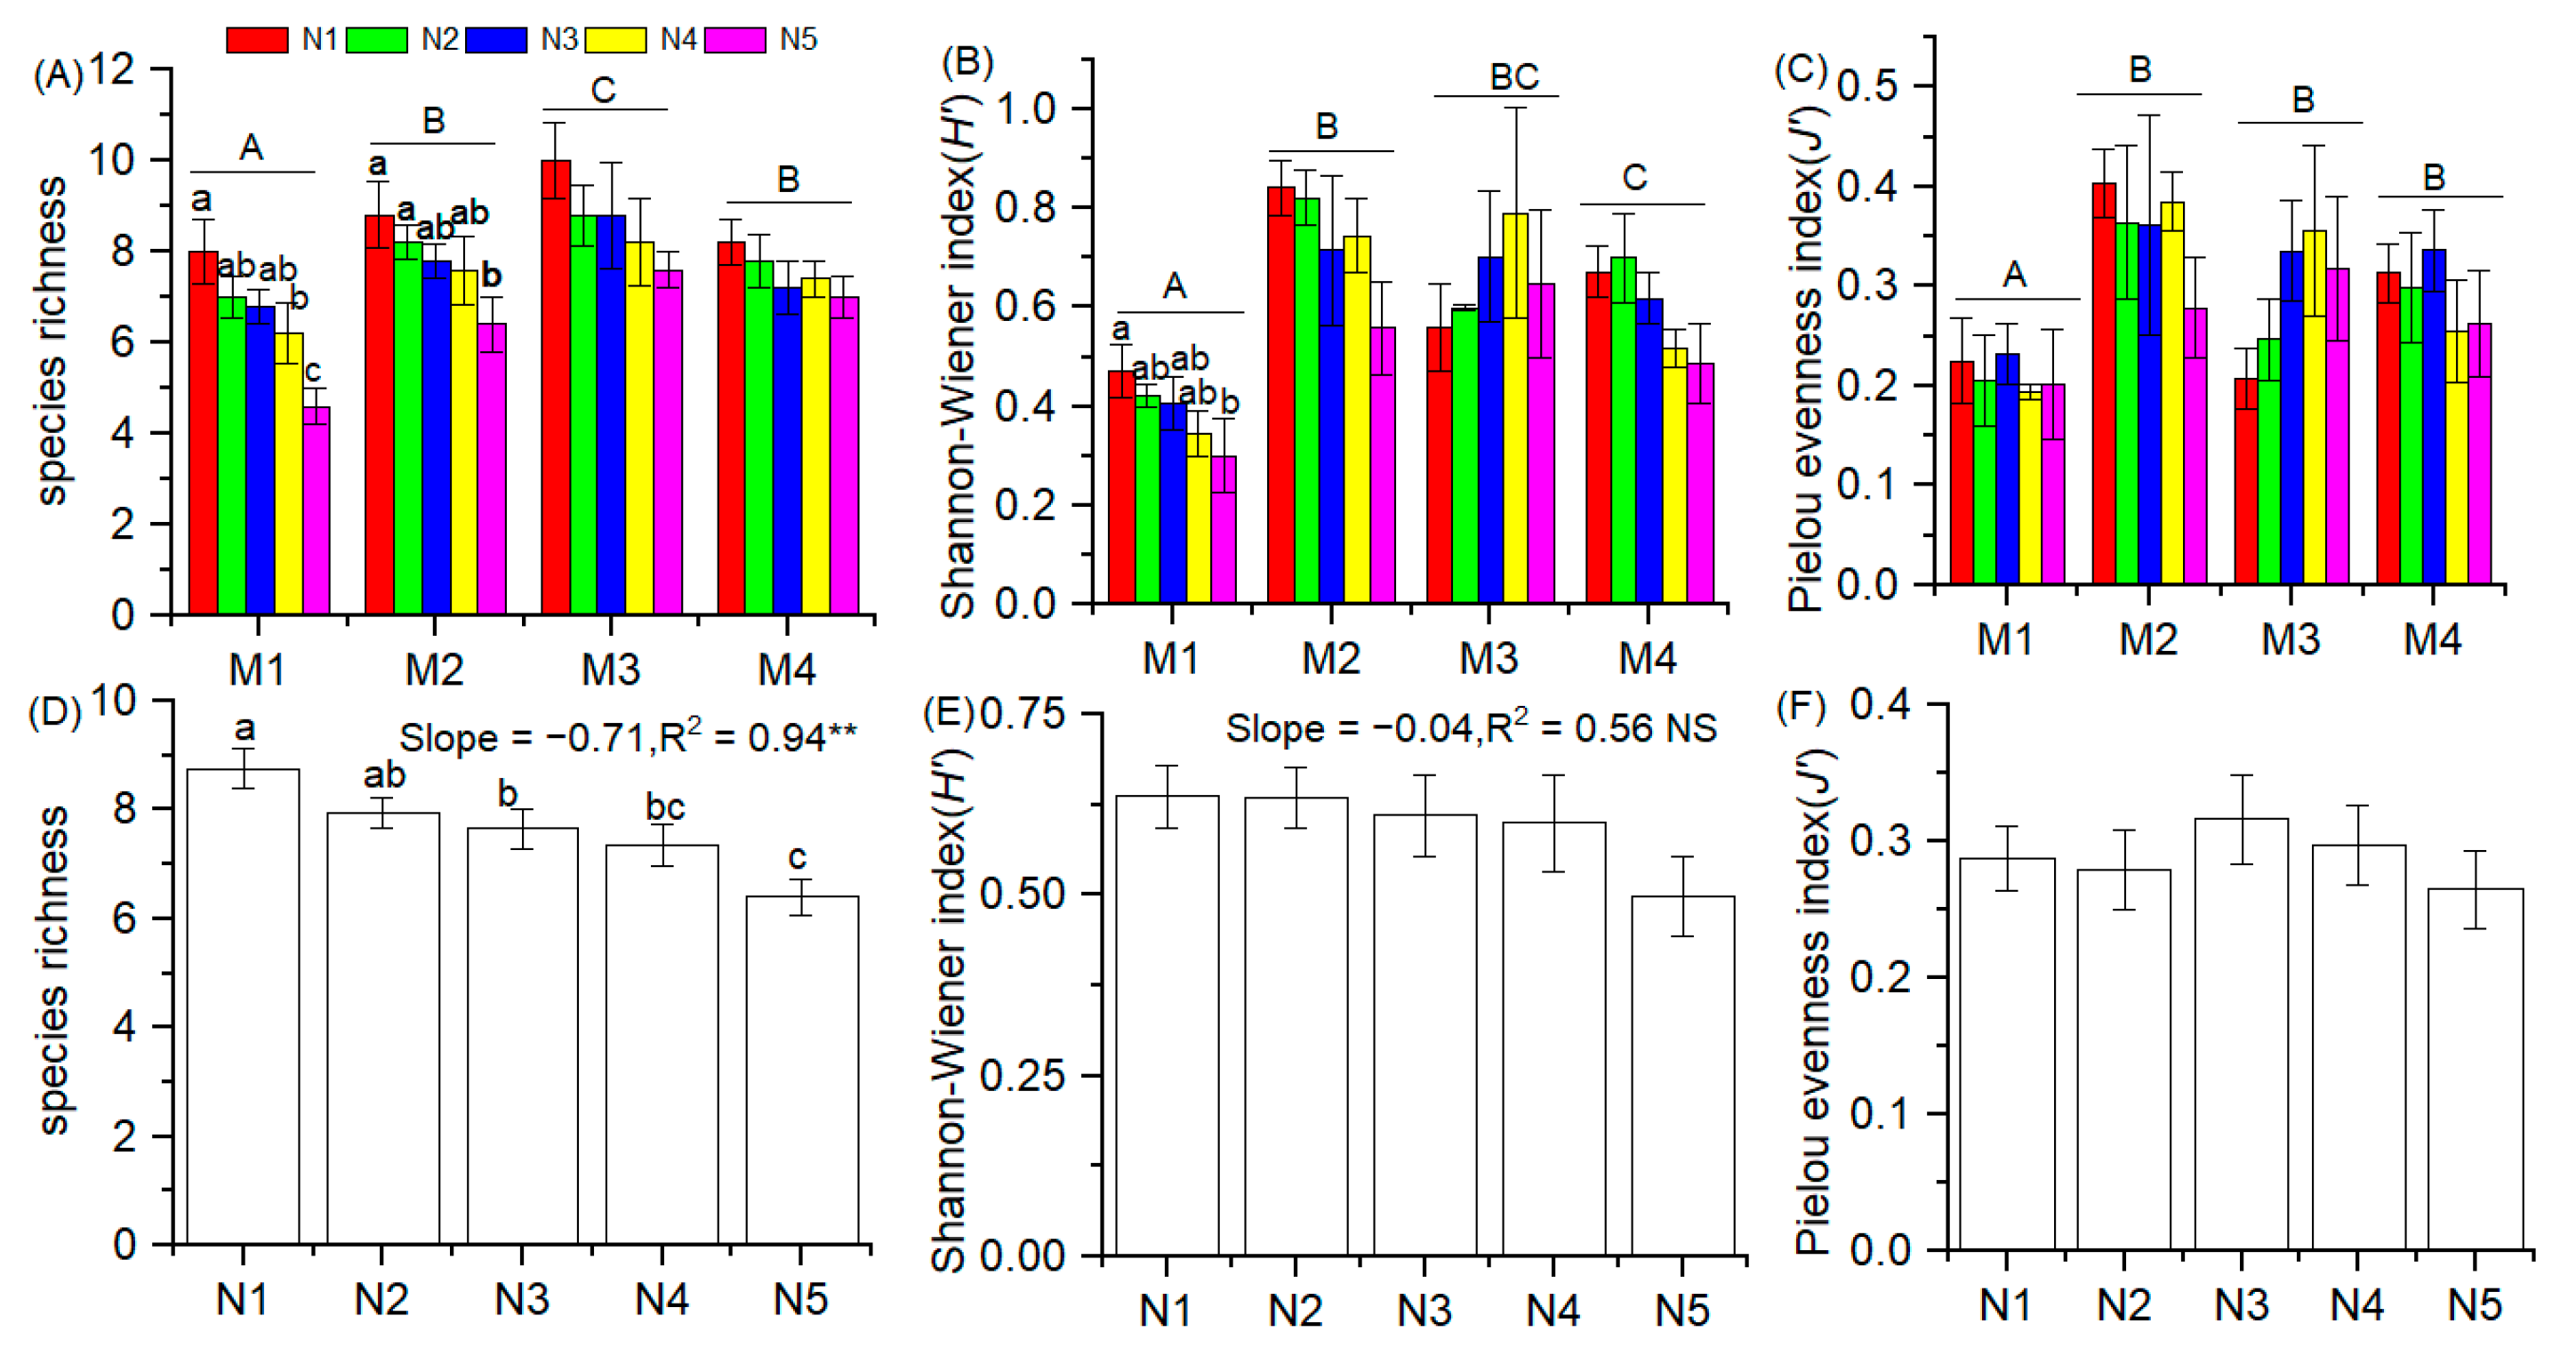
3.1. Plant Diversity
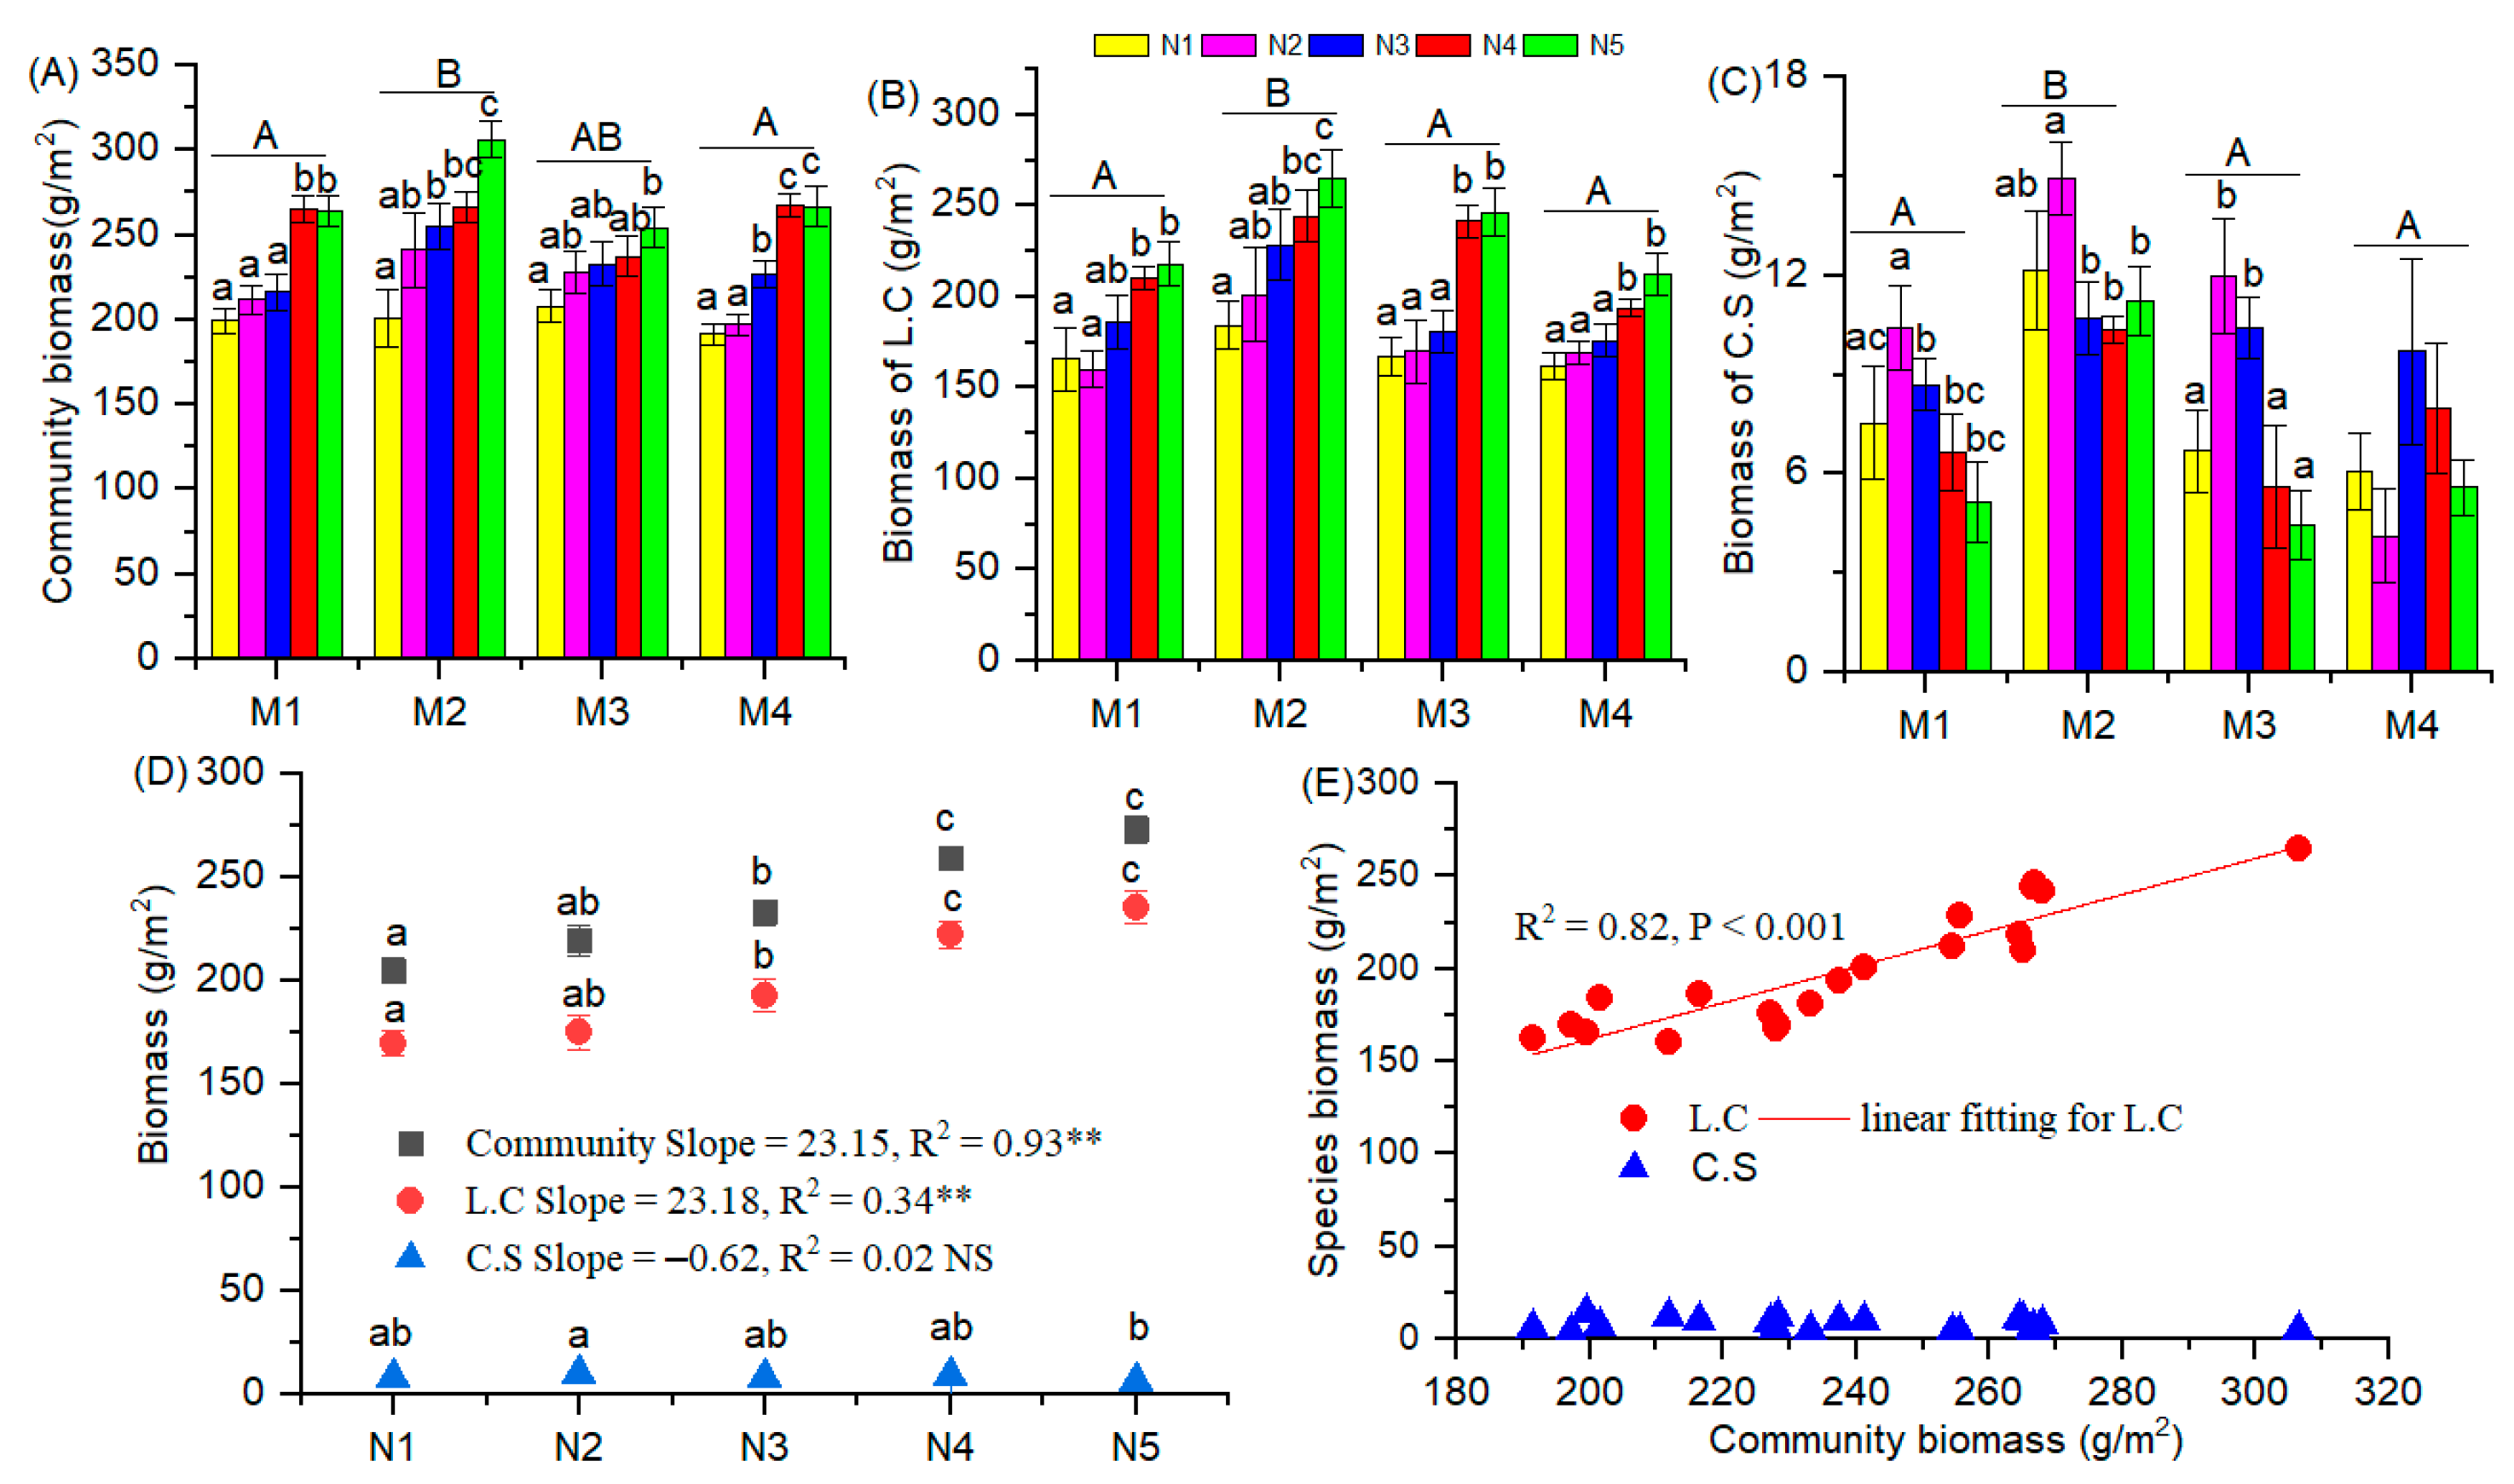
Mowing treatment had significant impacts on the plant diversity of a typical steppe in Inner Mongolia (p < 0.05) (Table 1, Figure 1A–C). There was no significant difference in the species richness between mowing at 10 cm (M2) and 3 cm (M4) treatments (p > 0.05), but they were significantly lower compared with mowing at 3 cm (M3) treatment (p < 0.05). In no-mowing control (M1) and mowing at 10 cm (M2) treatments, the species richness with the rate of 20 g N m2.yr−1 (N5) was significantly lower than that with the rates of 0 (N1) and 2 g N m2.yr−1 (N2). Mowing at a stubble height of 10 cm (M2) increased plant diversity as measured by the Shannon-Wiener index more than mowing at a stubble height of 3 cm (M4) (p < 0.05), and there was no significant difference in Shannon-Wiener diversity between these treatments and mowing at 6 cm stubble height (M3) (p > 0.05). In no-mowing treatment (M1), the Shannon-Wiener diversity with the rate of 20 g N m2.yr−1 was significantly lower than that with no N addition (N1). No significant difference in Pielou evenness existed between mowing with 3–10 cm stubble height (M2-M4) (p > 0.05), but they were significantly higher than that in no-mowing control treatment (M1) (p < 0.05). In all mowing treatments, N addition did not significantly alter the species evenness.
The species richness with the level of 20 g N m2.yr−1 (N5) was significantly lower than that with no N addition (N1) (p < 0.05), and there was no significant difference in species richness among the rates of 2-10 N g N m2.yr−1 (N2-N4) (p > 0.05) (Figure 1D). Species richness showed a significant decreasing trend with increasing N addition rate (p < 0.001). N addition did not significantly affect Shannon-Wiener diversity (Table 1, Figure 1E) or Pielou evenness (Table 1, Figure 1F) (p > 0.05).

3.2. Biomass

The biomass of community, L. chinensis and C. squarrosa was significantly affected by the N addition rate and mowing (p < 0.05) (Table 1, Figure 2A–C). The mowing and N addition rates interactively affected the community biomass and biomass of C. squarrosa. The biomass of community, L. chinensis and C. squarrosa in mowing at 10 cm (M2) treatment were the highest and were significantly higher than those in no-mowing (M1) and mowing at 3 cm (M4) treatments (p < 0.05) (Figure 2A–C). In all mowing treatments, no significant differences in community biomass and L. chinensis biomass between the rates of 10 g N m2.yr−1 (N4) and 20 g N m2.yr−1 (N5) treatments were observed (p > 0.05), and they were both significantly higher than those with the no N addition (N1) treatment (p < 0.05) (Figure 2A,B). In the no-mowing (M1) and mowing at 6–10 cm (M2 and M3) treatments, there was no significant difference in C. squarrosa biomass between the rates of 10 g N m2.yr−1 (N4) and 20 g N m2.yr−1 (N5) (p > 0.05), and they were both lower than that with the rate of 2 g N m2.yr−1 (N2) (p < 0.05) (Figure 2C). No significant difference in C. squarrosa biomass was found in any of the nitrogen addition rates in mowing at 3 cm (M4) treatment (p > 0.05) (Figure 2C).
The community biomass with rate 5 g N m2.yr−1 (N3) was significantly lower than that with the rates of 10 g N m2.yr−1 (N4) and 20 g N m2.yr−1 (N5), but significantly higher than that with no N addition (N1) (p < 0.05) (Figure 2D). The response of L. chinensis biomass to the N addition rate was consistent with that of community biomass (Figure 2D). The plot with the rate of 2 g N m2.yr−1 (N2) had the highest C. squarrosa biomass, which was significantly higher than that in the plot with the rate of 20 g N m2.yr−1 (N5) (p < 0.05) (Figure 2D). Both community biomass and L. chinensis biomass showed a significant increasing trend with increasing N addition rate (p < 0.05) (Figure 2D). Although C. squarrosa biomass presented a decreasing trend with increasing N addition rate, this trend was not statistically significant (p > 0.05). The results of the linear regressions showed that the community biomass was significantly positively correlated with L. chinensis biomass (p < 0.05) (Figure 2E).

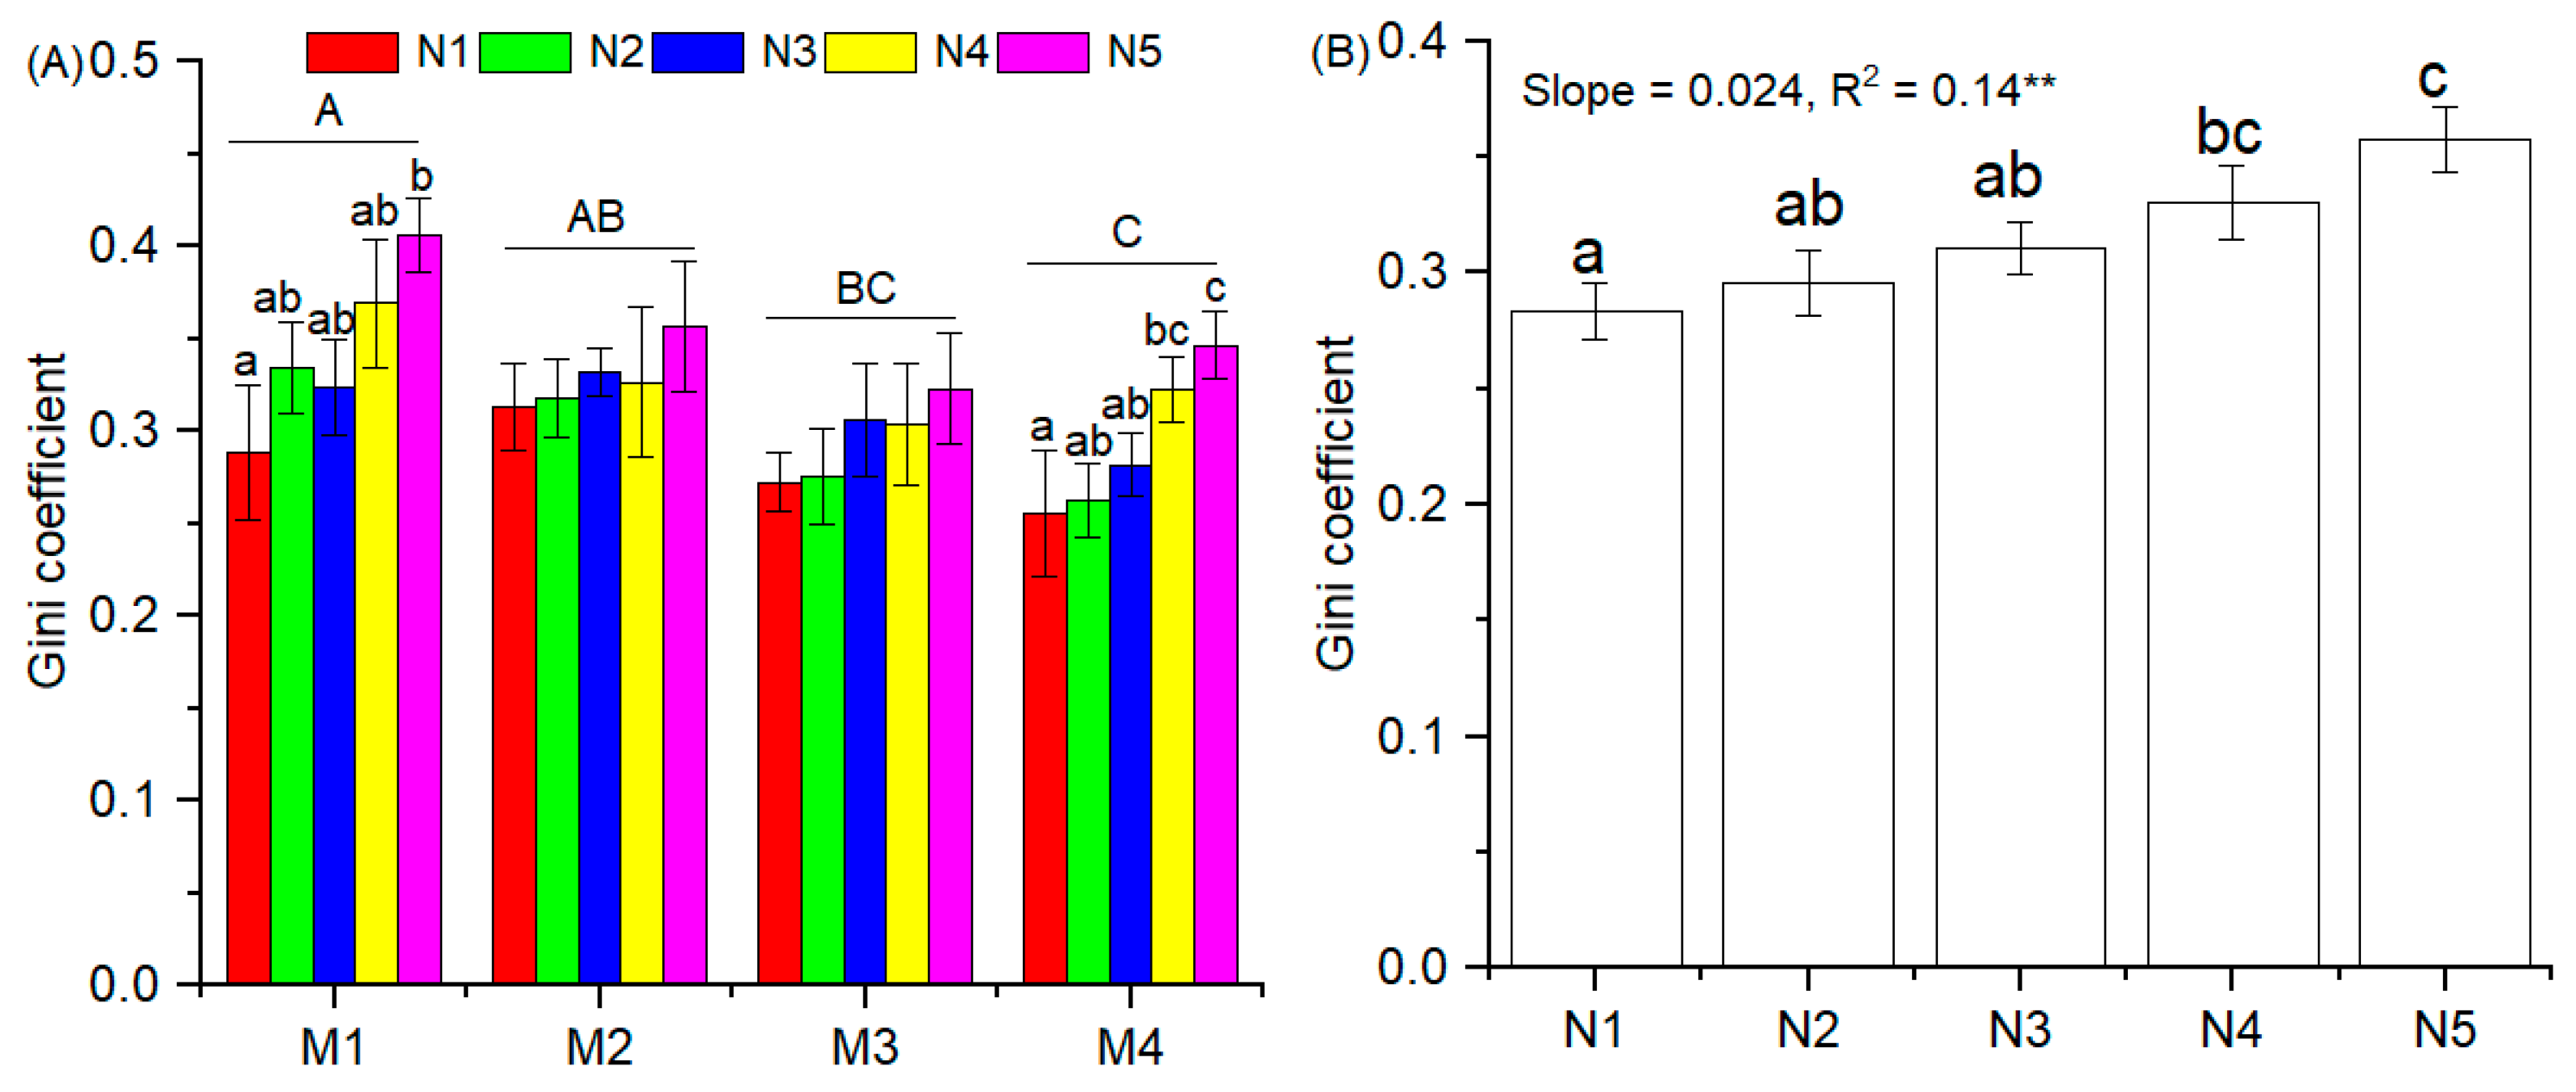
3.3. Gini Coefficient

The effect of mowing on the Gini coefficient was highly significant (p < 0.05) (Table 1). In no-mowing (M1) and mowing at 3 cm (M4) treatments, the Gini coefficient with a rate of 20 g N m2.yr−1 (N5) was significantly higher than that with no N addition (N1) (p < 0.05), and no significant differences existed among the rates of 2-10 N g N m2.yr−1 (N2-N4) (p > 0.05) (Figure 3A). N addition did not significantly change the Gini coefficient when mowing at 10 cm (M2) and 6 cm (M3) (p > 0.05) (Figure 3A). The Gini coefficient in mowing at 6 cm (M3) treatment was significantly lower than that in the no-mowing (M1) treatment (p < 0.05) and was not significantly different from those in the mowing at 10 cm (M2) and 3 cm (M4) treatments (p > 0.05) (Figure 3A). The main effect of the N addition rate had a significant impact on the Gini coefficient (p < 0.05) (Table 1, Figure 3B). No significant differences in the Gini coefficient were detected among the rate of 0–5 g N m2.yr−1 (N1-N3) (p > 0.05) (Figure 3B), and they were all significantly lower than that with the rate of 20 g N m2.yr−1 (N5) (p < 0.05). The Gini coefficient showed a significant increasing trend with the increasing rate of N addition (R2 = 0.14, p < 0.01) (Figure 3B).

3.4. Community Density and Litter

The main effects of mowing and N addition rate had significant effects on community density and litter, and their interactions had a significant effect on litter (Table 1, Figure 4). No significant difference in community density was found between the no-mowing (M1) and mowing at 10 cm (M2) treatments (p > 0.05), which were significantly different from that in the mowing at 3 cm (M4) treatment (p < 0.05) (Figure 4A). There was no significant difference in the community density among the different N addition rates in no-mowing (M1) treatment (p > 0.05) (Figure 4A), while the community density with a rate of 20 g N m2.yr−1 (N5) was significantly higher than that with the rates of 0 (N1) and 2 g N m2.yr−1 (N2) in the other mowing treatments (p < 0.05) (Figure 4A). The community densities with the rates of 10 g N m2.yr−1 (N4) and 20 g N m2.yr−1 (N5) were significantly higher than that in the other N addition rates (p < 0.05) (Figure 4C). No significant differences in community density were observed between the rates of 2–5 g N m2.yr−1 (N2-N3) or between the rates of 5–10 g N m2.yr−1 (N3-N4) (p > 0.05) (Figure 4C).
No significant difference in litter production existed between the mowing at 10 cm (M2) and 6 cm (M3) treatments (p > 0.05), and they were significantly lower than that in the no-mowing (M1) treatment and significantly higher than the litter production in mowing at 3 cm (M4) treatment (p < 0.05) (Figure 4B). In the mowing at 10 cm (M2) and 6 cm (M3) treatments, no significant differences in litter production existed between the rates of 10 (N4) and 20 g N m2.yr−1 (N5) (p < 0.05). The litter production with the rate of 10 g N m2.yr−1 (N4) and 20 g N m2.yr−1 (N5) was not significantly different (p > 0.05), but was significantly higher than that with the rates of 0 (N1) and 2 g N m2.yr−1 (N2) (p < 0.05) (Figure 4D). In the regression analyses, the N addition rate had a significant positive linear relationship with community density (R2 = 0.28, p < 0.01) and litter (R2 = 0.30, p < 0.01).

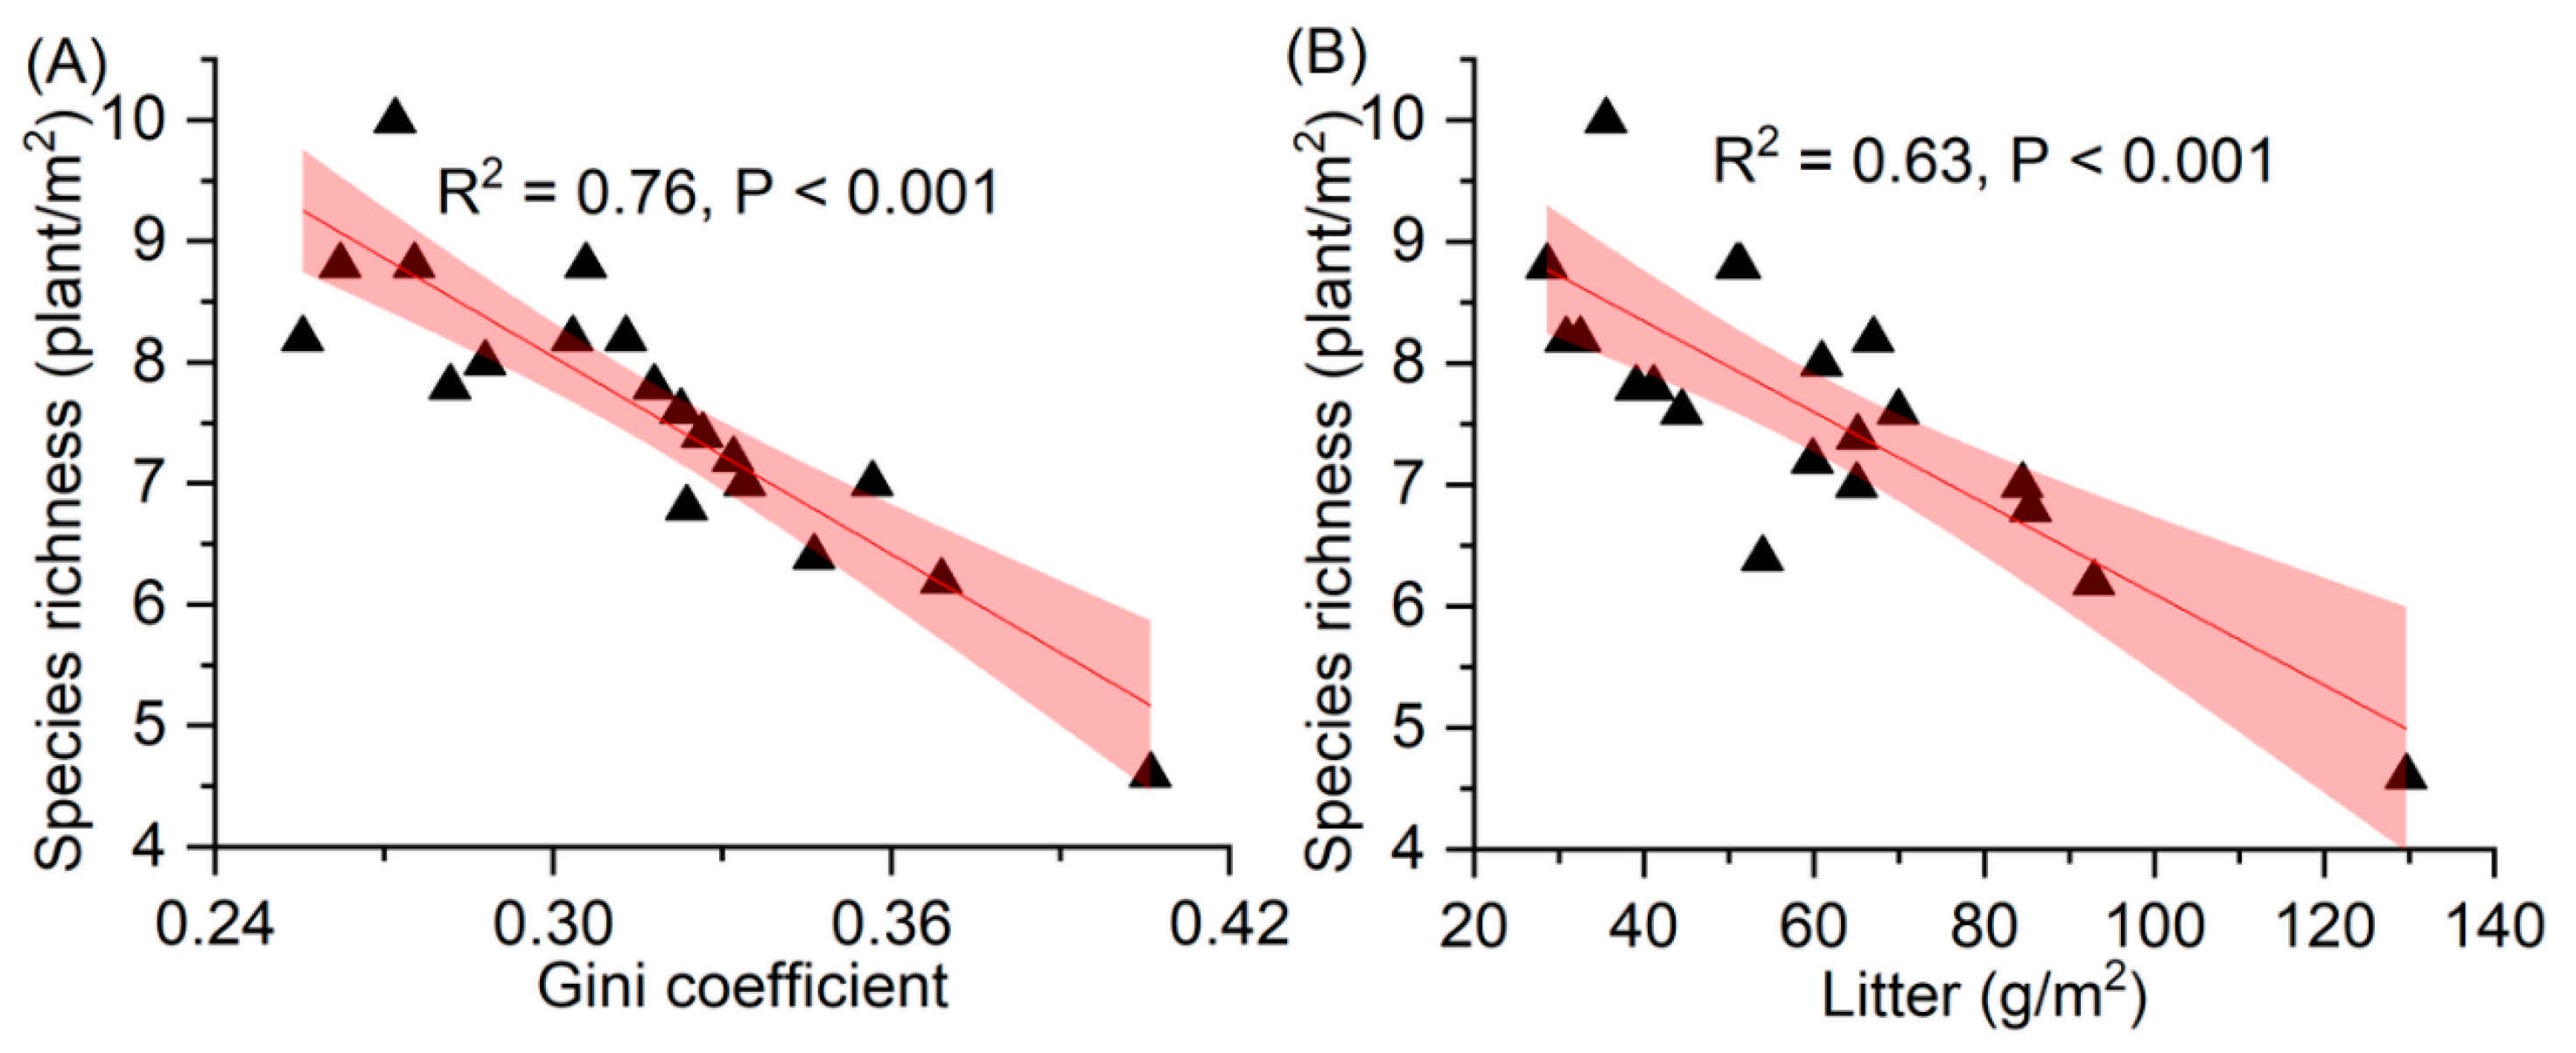
3.5. Relationship between Species Richness and the Gini Coefficient and Litter

The Gini coefficient was significantly negatively correlated with species richness (R2 = 0.76, p < 0.001, Figure 5A). Our results also showed that species richness was significantly negatively correlated with litter (R2 = 0.63, p < 0.001, Figure 5B).

4. Discussion

The effects of exogenous nitrogen input on plant species diversity have always been a popular topic in the field of global change. Most studies have shown that nitrogen enrichment will lead to a decline in species diversity [12,36,37,38]; however, some studies have shown that N enrichment has positive or neutral effects on species diversity [17,18,19]. As N addition increases, species richness decreases significantly, which is consistent with existing research results [36,38]. Various mechanisms have been proposed to explain the decrease in species richness caused by nitrogen enrichment, such as light competition [27,39], regeneration constraints and soil acidification [38,40,41,42]. Some studies have confirmed that nitrogen addition can shift plant competition from underground nutrient resources to aboveground light resources [43]. There was a significant positive correlation between the N addition rate and Gini coefficient (p < 0.05) (Figure 3B), indicating that the competition for light resources among species intensified with increasing N addition rate. The intensification of aboveground light resource competition in this study occurred for the following reasons. First, as the dominant species in our experimental grassland, L. chinensis is an upper-layer tall grass and has an efficient N utilization strategy [44]. Therefore, the increase in soil N availability caused by N addition promoted its rapid growth. With an increasing N addition rate, the interception of light resources by L. chinensis was enhanced, which gradually reduced the light availability of middle- and lower-layer plants [26,27]. Second, the significant increase in litter caused by N addition reduced the light availability of lower-layer vegetation in the community through the shading effect (Figure 4D). Third, N addition significantly increased the community density (Figure 4C), which reduced the light transmittance of the community. The light efficiency for the lower-layer dwarf or shade-intolerant species gradually decreased with increasing N rate, and finally, they were excluded from the community. Therefore, our results highlight that light competition was an important reason for the significant decrease in species richness due to the increase in the N addition rate in this study [25,26,27]. Species richness had a significant negative correlation with litter production (Figure 5B), which indicates that the increase in litter production was an important factor that caused a significant decrease in species richness [26,28]. The increase in litter production can inhibit seed germination and seedling colonization, which may also have been an important factor in the negative effect of N addition on species richness in this study. Numerous studies have shown that N enrichment will significantly reduce the Shannon-Wiener diversity index [12,36] and species evenness [45,46], which is different from our results. The short experimental duration may have been the reason why the Shannon-Wiener diversity index and species evenness among the N addition rates were not significant.
The enhanced species richness that occurred with mowing is in line with the results of studies conducted in threatened temperate grasslands [47]. The increase of species richness with mowing may be ascribed to mowing’s positive effects on subdominant species and germination rates via increased light availability [25,26]. In this study, mowing reduced the Gini coefficient (Figure 3A), indicating that mowing decreased the intensity of light competition among species in the community, which was beneficial for promoting the survival of light-demanding seedlings and low-growth species and led to an increase in species richness. In this study, mowing increased the species richness, Shannon-Wiener diversity index and evenness index (Figure 1A–C), demonstrating that short-term mowing was beneficial for maintaining the species diversity of the community. Research has confirmed that litter accumulation will have a negative impact on species diversity because it will inhibit seedling establishment of some target species and reduce the survival rate of seedlings [26,28]. Mowing significantly reduced litter production (Figure 4B), which contributed to improving forb richness, thus leading to a significant increase in community species richness. Mowing weakens the inhibition of upper-layer tall plants on middle- and lower-layer plants [25], which causes mowing treatment to significantly improve species evenness.
Species richness was significantly different among the N addition rates in no-mowing (M1) and mowing at 10 cm (M2) treatments; however, there was no significant difference among the N addition rates in mowing at 6 cm (M3) and 3 cm (M4) treatments (Figure 1A). Significant differences in the Shannon-Wiener diversity indices among N addition rates only existed in no-mowing (M1) treatment (Figure 1B). Our results demonstrated that mowing alleviated the negative effects of N addition on species richness and Shannon-Wiener diversity, which is consistent with the research results carried out in European grasslands [48,49]. Therefore, mowing under the background of nitrogen deposition can maintain the relative stability of species richness in typical grasslands. In addition, our results further confirm that decreased mowing to reduce the negative effects of nitrogen addition on species diversity is influenced by stubble height.
N is one of the key factors limiting the productivity of grassland ecosystems [50]. Many studies have shown that N addition can increase soil N availability, alleviate nutrient constraints on plant growth, and promote the growth of plant aboveground parts. In our study, the community biomass increased significantly with increasing N addition (Figure 2D). As an N-exploitative species, L. chinensis has a flexible N absorption strategy and can adjust its N uptake preference as nutrient availability changes [44]. With the increase in N addition, the rhizome of L. chinensis will extend more ramets to use nutrients more effectively and maintain its dominance in the community, resulting in a significant increase in L. chinensis biomass. The significant positive correlation between L. chinensis biomass and community biomass indicated that the increase in community biomass was mainly due to the contribution of L. chinensis (Figure 2E). Our results indicated that the community biomass and dominant species biomass increased first and then tended to be stable with increasing N addition rate (Figure 2D). Previous studies have shown that there may be a threshold for aboveground productivity with increasing N addition rate, beyond which N fertilizer effects on aboveground productivity will be weakened [51]. Community biomass and L. chinensis biomass tended to be stable when N deposition was greater than 10 g N m2.yr−1 (Figure 2D), indicating that the saturation threshold of grassland ecosystem productivity in response to the N addition rate in this study was 10 g N m2.yr−1, which is consistent with results from a previous nitrogen addition experiment on a typical grassland in Inner Mongolia [14]. C. squarrosa is a perennial bunchgrass and belongs to the middle- and lower-layer dominant species in our experimental grassland. The increase in the N addition rate reduced the light availability of the middle and lower layers of plants [26,27], thereby limiting the growth of C. squarrosa and resulting in its biomass not significantly changing or even showing a downward trend with increasing N addition rate (Figure 2D). With a conservative nutrient acquisition strategy, C. squarrosa exhibited a low plasticity of N uptake under a changing soil nutrient environment [44], which may be another important reason why its biomass did not change with increasing N addition rate.
Previous studies have shown that mowing may stimulate plant growth through compensatory growth [52]. Mowed plants may exhibit equal, under- or overcompensatory growth depending on stubble height [53]. In this study, compared with no mowing, with mowing, both species biomass and community biomass at 10 cm stubble height showed overcompensatory growth, resulting in the species biomass and community biomass in mowing at 10 cm (M2) treatment being higher than that in no-mowing (M1) treatment (Figure 2A–C). Mowing at a 10 cm stubble height can remove the apical meristem and senescent plant tissues of upper-layer tall plants that stimulate the growth of collateral branches and formation of new tissues. At the same time, light mowing can improve the light conditions of middle- and lower-layer plants [54], thus increasing their biomass. Therefore, mowing at 10 cm (M2) treatment significantly increased the biomass of L. chinensis and C. squarrosa compared with no-mowing (M1) treatment. Due to the increase in the biomass of the upper-layer tall plants and the middle- and lower-layer plants, the community biomass increased significantly (Figure 2A). When the stubble height was 3–6 cm, L. chinensis and C. squarrosa had equal compensatory growth, which may explain why there was no significant difference between community biomass in the M1 treatment and community biomass in the M3 and M4 treatments.
In mowing at 3 cm (M4) treatment, no significant difference existed in C. squarrosa biomass among the N addition rates (Figure 2C), which indicated that heavy mowing (i.e., 3 cm stubble height) could weaken the difference in C. squarrosa biomass caused by the N addition treatment. C. squarrosa biomass in no-mowing (M1), mowing at 10 cm (M2) and 6 cm (M3) treatments reached the maximum value with level of 2 g N m2.yr−1 (N2) and then decreased (Figure 2C), which reflected that the N saturation threshold of C. squarrosa biomass was much lower than that of community biomass and L. chinensis biomass. When the N addition rate was greater than 2 g N m2.yr−1, the changes in the L. chinensis biomass and C. squarrosa biomass showed an opposite trend (Figure 2B,C). We speculate that there are two reasons for the continuous decline in C. squarrosa from the level of 2 g N m2.yr−1 (N2) to 20 g N m2.yr−1 (N5). C. squarrosa has a conservative N acquisition strategy [44], and the increase in the N addition rate did not promote the increase in C. squarrosa biomass. The continuous increase in L. chinensis biomass gradually enhanced the shading effect on C. squarrosa [26], which is another reason for this result. With the increase in the N addition rate, the space released by the decrease in C. squarrosa biomass was occupied by L. chinensis to enhance its community dominance under the interference of N addition.
This study concludes that light availability is a key factor affecting the response of species richness to N addition and mowing based on the measurement results of the Gini coefficient. In future work, community light intensity should be measured to further elucidate the role of light limitation in reducing species richness under N addition and mowing interference. Similarly, it is necessary to further clarify the relationship between seed germination, seedling colonization and litter production to determine how litter accumulation regulates the response of species richness to N addition and mowing. Our results show that mowing and N addition both increase community biomass, and they have a synergistic effect on changes in ecosystem productivity. However, studies on different types of grassland ecosystems show that long-term mowing will lead to a decrease in community biomass [29]. N addition over a long period will lead to community biomass first increasing and then reaching saturation [14,55]. Theoretically, community biomass will be in a relatively stable state under N addition and mowing interference. Therefore, long-term monitoring and research are needed to determine the time threshold of community biomass stability. Long-term N enrichment will lead to soil acidification [38,42], which can be alleviated by mowing to remove N from the ecosystem [30,31]. Stubble height is the key factor affecting the amount of nutrients removed [22]. A suitable stubble height that can eliminate soil acidification and maintain ecosystem stability under future conditions of N deposition is important to study. N addition and mowing both affect soil nitrogen availability [56,57], and the response of plants to soil N availability is species-specific [44,58]. The existing studies show that N addition can promote the growth of nitrogen-loving plants, thus excluding forbs that are insensitive to soil N availability. Therefore, clarifying the N acquisition strategy and plasticity of species is the key approach for explaining the influence of N enrichment and mowing on species richness and community biomass.

5. Conclusions

Our results show that mowing significantly increased species diversity. Species richness decreased significantly with increasing N addition rate. Short-term N addition did not significantly affect Shannon-Wiener diversity and Pielou evenness. Mowing at a stubble height of 10 cm significantly increased the biomass of community, L. chinensis and C. squarrosa, indicating that light mowing can improve ecosystem productivity. Community biomass and L. chinensis biomass showed a significant increasing trend with increasing N addition rate. Species richness was significantly negatively correlated with litter production and the Gini coefficient, which demonstrated that light competition and litter accumulation were important reasons for the significant decrease in species richness in this study. Our results also demonstrated that mowing can alleviate the negative effects of N addition on species richness, and mowing to alleviate the negative effects of N addition on species diversity is influenced by stubble height. The response mechanism of the grassland community to the interaction between N addition and mowing and the suitable stubble height maintaining ecosystem stability under future conditions of N deposition need further study.

Author Contributions

Z.Y. and H.M. designed the research and conducted the field investigation. Z.Y. wrote the original draft. Q.W. and H.P. analyzed the data. All authors have read and agreed to the published version of the manuscript.

Funding

This study was funded by the National Natural Science Foundation of China (31870413).

Data Availability Statement

Please contact the first author with requests for data.

Acknowledgments

Special thanks are given to Baoyin Taogetao for his valuable help in experiment design. This experimental site has been managed by Grassland Ecology Research Station of Inner Mongolia University. Many thanks are expressed to the anonymous reviewers for their helpful suggestions.

Conflicts of Interest

The authors declare no conflict of interest.

References

  1. Vitousek, P.M.; Aber, J.D.; Howarth, R.W.; Likens, G.E.; Matson, P.A.; Schindler, D.W.; Schlesinger, W.H.; Tilman, D.G. Human alteration of the global nitrogen cycle: Sources and consequences. Ecol. Appl. 1997, 7, 737–750. [Google Scholar] [CrossRef] [Green Version]
  2. Galloway, J.N.; Bleeker, A.; Erisman, J.W. The human creation and use of reactive nitrogen: A global and regional perspective. Annu. Rev. Environ. Resour. 2021, 46, 255–288. [Google Scholar] [CrossRef]
  3. Galloway, J.N.; Dentener, F.J.; Capone, D.G.; Boyer, E.W.; Howarth, R.W.; Seitizinger, S.P.; Asner, G.P.; Cleveland, C.C.; Green, P.A.; Holland, E.A.; et al. Nitrogen cycles: Past, present and future. Biogeochemistry 2004, 70, 153–226. [Google Scholar] [CrossRef]
  4. Elser, J.J.; Bracken, M.E.S.; Cleland, E.E.; Gruner, D.S.; Harpole, W.S.; Hillebrand, H.; Ngai, J.T.; Seabloom, E.W.; Shurin, J.B.; Smith, J.E. Global analysis of nitrogen and phosphorus limitation of primary producers in freshwater, marine and terrestrial ecosystems. Ecol. Lett. 2007, 10, 1135–1142. [Google Scholar] [CrossRef] [Green Version]
  5. Pierik, M.; van Ruijven, J.; Bezemer, T.M.; Geerts, R.H.E.M.; Berendse, F. Recovery of plant species richness during long-term fertilization of a species-rich grassland. Ecology 2011, 92, 1393–1398. [Google Scholar] [CrossRef] [PubMed] [Green Version]
  6. Scurlock, J.; Hall, D.O. The global carbon sink: A grassland perspective. Glob. Chang. Biol. 1998, 4, 229–233. [Google Scholar] [CrossRef] [Green Version]
  7. Havstad, K.M.; Peters, D.P.C.; Skaggs, R.; Brown, J.; Bestelmeyer, B.; Fredrickson, E.; Herrick, J.; Wright, J. Ecological services to and from rangelands of the United States. Ecol. Econ. 2007, 64, 261–268. [Google Scholar] [CrossRef]
  8. Schirpke, U.; Kohler, M.; Leitinger, G.; Fontana, V.; Tasser, E.; Tappeiner, U. Future impacts of changing land-use and climate on ecosystem services of mountain grassland and their resilience. Ecosyst. Serv. 2017, 26, 79–94. [Google Scholar] [CrossRef]
  9. Chapman, S.K.; Devine, K.A.; Curran, C.; Jones, R.O.; Gilliam, F.S. Impacts of Soil Nitrogen and Carbon Additions on Forest Understory Communities with a Long Nitrogen Deposition History. Ecosystems 2016, 19, 142–154. [Google Scholar] [CrossRef]
  10. Stevens, C.J.; Lind, E.M.; Hautier, Y.; Harpole, W.S.; Borer, E.T.; Hobbie, S.; Seabloom, E.W.; Ladwig, L.; Bakker, J.D.; Chu, C.J.; et al. Anthropogenic nitrogen deposition predicts local grassland primary production worldwide. Ecology 2015, 96, 1459–1465. [Google Scholar] [CrossRef] [Green Version]
  11. Tognetti, P.M.; Prober, S.M.; Báez, S.; Chaneton, E.J.; Firn, J.; Risch, A.C.; Schuetz, M.; Simonsen, A.K.; Yahdjian, L.; Borer, E.T.; et al. Negative effects of nitrogen override positive effects of phosphorus on grassland legumes worldwide. Proc. Natl. Acad. Sci. USA 2021, 118, e2023718118. [Google Scholar] [CrossRef]
  12. Isbell, F.; Reich, P.B.; Tilman, D.; Hobbie, S.E.; Polasky, S.; Binder, S. Nutrient enrichment, biodiversity loss, and consequent declines in ecosystem productivity. Proc. Natl. Acad. Sci. USA 2013, 110, 11911–11916. [Google Scholar] [CrossRef] [PubMed]
  13. Tian, Q.; Yang, L.; Ma, P.; Zhou, H.; Liu, N.; Bai, W.; Wang, H.; Ren, L.; Lu, P.; Han, W.; et al. Below-ground-mediated and phase-dependent processes drive nitrogen-evoked community changes in grasslands. J. Ecol. 2020, 108, 1874–1887. [Google Scholar] [CrossRef]
  14. Bai, Y.; Wu, J.; Clark, C.M.; Naeem, S.; Pan, Q.; Huang, J.; Zhang, L.; Han, X. Tradeoffs and thresholds in the effects of nitrogen addition on biodiversity and ecosystem functioning: Evidence from inner Mongolia Grasslands. Glob. Chang. Biol. 2010, 16, 358–372. [Google Scholar] [CrossRef]
  15. Stevens, C.J.; Dise, N.B.; Mountford, J.O.; Gowing, D.J. Impact of nitrogen deposition on the species richness of grasslands. Science 2004, 303, 1876–1879. [Google Scholar] [CrossRef] [PubMed] [Green Version]
  16. Humbert, J.Y.; Dwyer, J.M.; Andrey, A.; Arlettaz, R. Impacts of nitrogen addition on plant biodiversity in mountain grasslands depend on dose, application duration and climate: A systematic review. Glob. Chang. Biol. 2016, 22, 110–120. [Google Scholar] [CrossRef]
  17. Goldberg, D.E.; Miller, T.E. Effects of different resource additions on species diversity in an annual plant community. Ecology 1990, 71, 213–225. [Google Scholar] [CrossRef]
  18. Huberty, L.E.; Gross, K.L.; Miller, C.J. Effects of nitrogen addition on successional dynamics and species diversity in Michigan old-fields. J. Ecol. 1998, 86, 794–803. [Google Scholar] [CrossRef]
  19. Zheng, H.P.; Chen, Z.X.; Wang, S.R.; Niu, J.Y. Effects of fertilizer on plant diversity and productivity of desertified alpine grassland at Maqu, Gansu. Acta Pratacult. Sin. 2007, 16, 34–39, (In Chinese with English Abstract). [Google Scholar]
  20. Yang, Q.; Wang, W.; Zeng, H. Effects of nitrogen addition on the plant diversity and biomass of degraded grasslands of NeiMongol, China. Chin. J. Plant Ecol. 2018, 42, 430–441. [Google Scholar] [CrossRef]
  21. Hou, S.L.; Yin, J.X.; Sistla, S.; Yang, J.J.; Sun, Y.; Li, Y.Y.; Lü, X.T.; Han, X.G. Long-term mowing did not alter the impacts of nitrogen deposition on litter quality in a temperate steppe. Ecol. Eng. 2017, 102, 404–410. [Google Scholar] [CrossRef]
  22. Yang, Z.P.; Hugjiltu, M.; Baoyin, T.; Li, F.Y. Plant production decreases whereas nutrients concentration increases in response to the decrease of mowing stubble height. J. Environ. Manag. 2020, 253, 109745. [Google Scholar] [CrossRef]
  23. Kotas, P.; Choma, M.; Šantrůčková, H.; Lepš, J.; Tříska, J.; Kaštovská, E. Linking above- and belowground responses to 16 years of fertilization, mowing, and removal of the dominant species in a temperate grassland. Ecosystems 2017, 20, 354–367. [Google Scholar] [CrossRef]
  24. Blüthgen, N.; Dormann, C.F.; Prati, D.; Klaus, V.H.; Kleinebecker, T.; Hölzel, N.; Alt, F.; Boch, S.; Gockel, S.; Hemp, A.; et al. A quantitative index of land-use intensity in grasslands: Integrating mowing, grazing and fertilization. Basic Appl. Ecol. 2012, 13, 207–220. [Google Scholar] [CrossRef]
  25. Borer, E.T.; Seabloom, E.W.; Gruner, D.S.; Harpole, W.S.; Hillebrand, H.; Lind, E.M.; Adler, P.B.; Alberti, J.; Anderson, T.M.; Bakker, J.D.; et al. Herbivores and nutrients control grassland plant diversity via light limitation. Nature 2014, 508, 517–520. [Google Scholar] [CrossRef] [Green Version]
  26. Socher, S.A.; Prati, D.; Boch, S.; Müller, J.; Klaus, V.H.; Hölzel, N.; Fischer, M. Direct and productivity-mediated indirect effects of fertilization, mowing and grazing on grassland species richness. J. Ecol. 2012, 100, 1391–1399. [Google Scholar] [CrossRef]
  27. Hautier, Y.; Niklaus, A.P.; Hector, A. Competition for light causes plant biodiversity loss after eutrophication. Science 2009, 324, 636–638. [Google Scholar] [CrossRef] [Green Version]
  28. Foster, B.L.; Gross, K.L. Species richness in a successional grassland: Effects of nitrogen enrichment and plant litter. Ecology 1998, 79, 2593–2602. [Google Scholar] [CrossRef]
  29. Maron, J.L.; Jefferies, R.L. Restoring enriched grasslands: Effects of mowing on species richness, productivity, and nitrogen retention. Ecol. Appl. 2001, 11, 1088–1100. [Google Scholar] [CrossRef]
  30. Hiernaux, P.; Turner, M.D. The effect of clipping on growth and nutrient uptake of Sahelian annual rangelands. J. Appl. Ecol. 1996, 33, 387–399. [Google Scholar] [CrossRef]
  31. Barker, C.G.; Power, S.A.; Bell, J.N.B.; Orme, C.D.L. Effects of habitat management on heathland response to atmospheric nitrogen deposition. Biol. Conserv. 2004, 120, 41–52. [Google Scholar] [CrossRef]
  32. Li, Z.Q.; Liu, Z.G.; Chen, Z.Z.; Yang, Z.G. The effects of climate changes on the productivity in the Inner Mongolia steppe of China. Acta Pratacult. Sin. 2003, 12, 4–10, (In Chinese with English Abstract). [Google Scholar]
  33. Pan, Q.M.; Xue, J.G.; Tao, J.; Xu, M.Y.; Zhang, W.H. Current status of grassland degradation and measures for grassland restoration in northern China. Chin. Sci. Bull. 2018, 63, 1642–1650. [Google Scholar] [CrossRef]
  34. Lü, C.Q.; Tian, H.Q. Spatial and temporal patterns of nitrogen deposition in China: Synthesis of observational data. J. Geophys. Res. 2007, 112, 10–15. [Google Scholar] [CrossRef]
  35. Ren, Z.W.; Li, Q.; Chu, C.J.; Zhao, L.Q.; Zhang, J.Q.; Ai, D.X.C.; Yang, Y.B.; Wang, G. Effects of resource additions on species richness and ANPP in an alpine meadow community. J. Plant Ecol. 2010, 3, 25–31. [Google Scholar] [CrossRef] [Green Version]
  36. Niu, D.C.; Yuan, X.B.; Cease, A.J.; Wen, H.Y.; Zhang, C.P.; Fu, H.; Elser, J.J. The impact of nitrogen enrichment on grassland ecosystem stability depends on nitrogen addition level. Sci. Total Environ. 2017, 618, 1529–1538. [Google Scholar] [CrossRef]
  37. Clark, C.M.; Tilman, D. Loss of plant species after chronic low-level nitrogen deposition to prairie grasslands. Nature 2008, 451, 712–715. [Google Scholar] [CrossRef]
  38. Zhang, Y.H.; Lü, X.T.; Isbell, F.; Stevens, C.; Han, X.; He, N.P.; Zhang, G.M.; Yu, Q.; Huang, J.H.; Han, X.G. Rapid plant species loss at high rates and at low frequency of N addition in temperate steppe. Glob. Chang. Biol. 2014, 20, 3520–3529. [Google Scholar] [CrossRef]
  39. Newman, E.I. Competition and diversity in herbaceous vegetation. Nature 1973, 244, 310. [Google Scholar] [CrossRef]
  40. Henry, M.; Stevens, H.; Bunker, D.E.; Schnitzer, S.A.; Carson, W.P. Establishment limitation reduces species recruitment and species richness as soil resources rise. J. Ecol. 2004, 92, 339–347. [Google Scholar] [CrossRef] [Green Version]
  41. Tilman, D. Species richness of experimental productivity gradients: How important is colonization limitation? Ecology 1993, 74, 2179–2191. [Google Scholar] [CrossRef]
  42. Tian, D.S.; Niu, S.L. A global analysis of soil acidification caused by nitrogen addition. Environ. Res. Lett. 2015, 10, 024019. [Google Scholar] [CrossRef]
  43. Dickson, T.L.; Foster, B.L. Fertilization decreases plant biodiversity even when light is not limiting. Ecol. Lett. 2011, 14, 380–388. [Google Scholar] [CrossRef] [PubMed]
  44. Yang, Z.P.; Li, Y.L.; Wang, Y.D.; Cheng, J.W.; Li, F.Y.H. Preferences for different nitrogen forms in three dominant plants in a semi-arid grassland under different grazing intensities. Agric. Ecosyst. Environ. 2022, 333, 107959. [Google Scholar] [CrossRef]
  45. Avolio, M.L.; Koerner, S.E.; La Pierre, K.J.; Wilcox, K.R.; Wilson, G.W.T.; Smith, M.D.; Collins, S.L. Changes in plant community composition, not diversity, during a decade of nitrogen and phosphorus additions drive above-ground productivity in a tallgrass prairie. J. Ecol. 2014, 102, 1649–1660. [Google Scholar] [CrossRef] [Green Version]
  46. van den Berg, L.J.L.; Vergeer, P.; Tim, C.G.R.; Smart, S.M.; Guest, D.; Ashmore, M.R. Direct and indirect effects of nitrogen deposition on species composition change in calcareous grasslands. Glob. Chang. Biol. 2011, 17, 1871–1883. [Google Scholar] [CrossRef] [Green Version]
  47. Smith, A.L.; Barrett, R.L.; Milner, R.N.C. Annual mowing maintains plant diversity in threatened temperate grasslands. Appl. Veg. Sci. 2017, 12, 3218–3221. [Google Scholar] [CrossRef]
  48. Socher, S.A.; Prati, D.; Boch, S.; Müller, J.; Baumbach, H.; Gockel, S.; Hemp, A.; Schöning, I.; Wells, K.; Kalko, E.K.V.; et al. Interacting effects of fertilization, mowing and grazing on plant species diversity of 1500 grasslands in Germany differ between regions. Basic Appl. Ecol. 2013, 14, 126–136. [Google Scholar] [CrossRef]
  49. Jones, L.; Stevens, C.; Rowe, E.C.; Payne, R.; Caporn, S.J.M.; Evans, C.D.; Field, C.; Dale, S. Can on-site management mitigate nitrogen deposition impacts in non-wooded habitats? Biol. Conserv. 2016, 212, 464–475. [Google Scholar] [CrossRef] [Green Version]
  50. Lebauer, D.S.; Treseder, K.K. Nitrogen limitation of net primary productivity in terrestrial ecosystems is globally distributed. Ecology 2008, 89, 371–379. [Google Scholar] [CrossRef] [Green Version]
  51. Niu, S.; Classen, A.T.; Dukes, J.S.; Kardol, P.; Liu, L.; Luo, Y.; Rustad, L.; Sun, J.; Tang, J.; Templer, P.H.; et al. Global patterns and substrate-based mechanisms of the terrestrial nitrogen cycle. Ecol. Lett. 2016, 19, 697–709. [Google Scholar] [CrossRef] [PubMed] [Green Version]
  52. Zhao, W.; Chen, S.P.; Lin, G.H. Compensatory growth responses to clipping defoliation in Leymus chinensis (Poaceae) under nutrient addition and water deficiency conditions. Plant Ecol. 2008, 196, 85–99. [Google Scholar] [CrossRef]
  53. Liu, Y.; Pan, Q.; Liu, H.; Bai, Y.; Simmons, M.; Dittert, K.; Han, X. Plant responses following grazing removal at different stocking rates in an Inner Mongolia grassland ecosystem. Plant Soil. 2011, 340, 199–213. [Google Scholar] [CrossRef]
  54. Keddy, P.A.; Twolan-Sstrutt, L.; Shipley, B. Experimental evidence that interspecific competitive asymmetry increases with soil production. Oikos 1997, 80, 253–256. [Google Scholar] [CrossRef]
  55. Yang, G.J.; Hautier, Y.; Zhang, Z.J.; Lü, X.T.; Han, X.G. Decoupled responses of above- and below-ground stability of productivity to nitrogen addition at the local and larger spatial scale. Glob. Chang. Biol. 2022, 28, 2711–2720. [Google Scholar] [CrossRef]
  56. Cheng, Y.; Wang, J.; Chang, S.X.; Cai, Z.; Mueller, C.; Zhang, J. Nitrogen deposition affects both net and gross soil nitrogen transformations in forest ecosystems: A review. Environ. Pollut. 2019, 244, 608–616. [Google Scholar] [CrossRef]
  57. Mikola, J.; Setälä, H.; Virkajärvi, P.; Saarijärvi, K.; Ilmarinen, K.; Voigt, W.; Vestberg, M. Defoliation and patchy nutrient return drive grazing effects on plant and soil properties in a dairy cow pasture. Ecol. Monogr. 2009, 79, 221–244. [Google Scholar] [CrossRef] [Green Version]
  58. Houle, D.; Moore, J.D.; Ouimet, R.; Marty, C. Tree species partition N uptake by soil depth in boreal forests. Ecology 2014, 95, 1127–1133. [Google Scholar] [CrossRef] [Green Version]
Figure 1. Effects of mowing and N addition on plant diversity. The values are mean ± SE. For (AC), different lowercase letters under the line denote significant differences among the N addition treatments with p < 0.05; different capital letters above the line denote significant differences among mowing treatments with p < 0.05. For (DF), different lowercase letters denote significant differences among the treatments with p < 0.05; regression parameters were estimated for species richness and Shannon-Wiener index using log-linear model with N treatment as a continuous predictor, i.e., species richness or Shannon-Wiener index = Intercept + Slope × Ln (N); significant differences are reported as NS, p > 0.05; ** p < 0.01. M1, no-mowing control; M2, M3 and M4 are mowing at stubble heights of 10 cm, 6 cm and 3 cm, respectively; N1, N2, N3, N4 and N5 are N addition rate with 0, 2, 5, 10 and 20 g N m2.yr−1, respectively.
Agronomy 13 02125 g001
Figure 2. Effects of mowing and nitrogen addition on biomass and the relationship between community biomass and species biomass. The values are mean ± SE. For (AC), different lowercase letters under the line denote significant differences among the N addition treatments with p < 0.05; different capital letters above the line denote significant differences among the mowing treatments with p < 0.05. For (D), different lowercase letters under the line denote significant differences among the treatments with p < 0.05; regression parameters were estimated for biomass using a log-linear model with N treatment as a continuous predictor, i.e., biomass = Intercept + Slope × Ln (N); significant differences are reported as NS, p > 0.05; ** p < 0.01. L.C: Leymus chinensis, C.S: Cleistogenes squarrosa. M1, no-mowing control; M2, M3 and M4 are mowing at stubble heights of 10 cm, 6 cm and 3 cm, respectively; N1, N2, N3, N4 and N5 are N addition rate with 0, 2, 5, 10 and 20 g N m2.yr−1, respectively. (E) indicates the relationship between community biomass and species biomass.
Agronomy 13 02125 g002
Figure 3. Effects of mowing and N addition on the Gini coefficient. The values are mean ± SE. For (A), different lowercase letters under the line denote significant differences among nitrogen addition treatments with p < 0.05; different capital letters above the line denote significant differences among mowing treatments with p < 0.05. For (B), different lowercase letters under the line denote significant differences among treatments with p < 0.05; regression parameters were estimated for Gini coefficient using log-linear model with N treatment as a continuous predictor, i.e., Gini coefficient = Intercept + Slope × Ln (N); significant differences are reported as ** p < 0.01. M1, no-mowing control; M2, M3 and M4 are mowing at stubble heights of 10 cm, 6 cm and 3 cm, respectively; N1, N2, N3, N4 and N5 are N addition rate with 0, 2, 5, 10 and 20 g N m2.yr−1, respectively.
Agronomy 13 02125 g003
Figure 4. Effects of mowing and N addition on community density and litter. The values are mean ± SE. For (A,B), different lowercase letters under the line denote significant differences among N addition treatments with p < 0.05; different capital letters above the line denote significant differences among mowing treatments with p < 0.05. For (C,D), different lowercase letters under the line denote significant differences among treatments with p < 0.05; regression parameters were estimated for community density and litter using log-linear model with N treatment as a continuous predictor, i.e., community density or litter = Intercept + Slope × Ln (N); significant differences are reported as ** p < 0.01. M1, no-mowing control; M2, M3 and M4 are mowing at stubble heights of 10 cm, 6 cm and 3 cm, respectively; N1, N2, N3, N4 and N5 are N addition rate with 0, 2, 5, 10 and 20 g N m2.yr−1, respectively.
Agronomy 13 02125 g004
Figure 5. Relationship between species richness and the Gini coefficient (A) and litter (B).
Agronomy 13 02125 g005
Table 1. ANOVA of the mowing effects, N addition and their interactions on community response variables.
Source of Variance
Whole PlotSub Plot
BMNM * N
df (4, 12)df (3, 12)df (4, 64)df (12, 64)
F-TestpF-TestpF-TestpF-Testp
Species richness1.030.434.410.0310.630.000.520.89
Shannon–Wiener index0.070.9911.68<0.0011.450.230.800.65
Pielou evenness index0.170.954.850.020.500.730.690.75
Community biomass0.210.936.210.0126.240.002.290.02
Litter production0.510.74145.12<0.00166.00<0.0013.92<0.001
L. chinensis biomass0.970.466.200.0116.140.001.040.43
C. squarrosa biomass0.400.817.960.008.780.002.980.00
Gini coefficient1.600.325.520.014.560.010.400.96
Community density10.390.028.690.0014.270.000.610.82
Note: B, block; M, mowing; N, nitrogen addition; * interaction; df, degree of freedom.
Disclaimer/Publisher’s Note: The statements, opinions and data contained in all publications are solely those of the individual author(s) and contributor(s) and not of MDPI and/or the editor(s). MDPI and/or the editor(s) disclaim responsibility for any injury to people or property resulting from any ideas, methods, instructions or products referred to in the content.

