Article

Evaluation of the Relationship between Cultivar, Endophyte and Environment on the Expression of Persistence in Perennial Ryegrass Populations Using High-Throughput Phenotyping

1
Agriculture Victoria, Hamilton Centre, Hamilton, VIC 3300, Australia
2
Agriculture Victoria, Ellinbank Centre, Ellinbank, VIC 3821, Australia
3
School of Agriculture, Food and Ecosystem Sciences, Faculty of Science, The University of Melbourne, Parkville, VIC 3010, Australia
*
Author to whom correspondence should be addressed.
Agronomy 2023, 13(9), 2292; https://doi.org/10.3390/agronomy13092292
Submission received: 10 August 2023 / Revised: 27 August 2023 / Accepted: 28 August 2023 / Published: 30 August 2023
(This article belongs to the Special Issue Grassland and Pasture Ecological Management and Utilization)

Abstract

:
Perennial ryegrass (Lolium perenne L.) is a commonly grown pasture species in temperate agriculture, mainly serving as a primary energy source for dairy cows. However, its limited persistence often leads to missed production potential and early resowing, especially in countries that experience summer drought, e.g., Australia and New Zealand. Therefore, understanding the factors influencing perennial ryegrass pasture persistence is crucial for sustainable land management and climate resilience in pasture-based animal production systems. Significant gaps in knowledge exist regarding the factors influencing pasture persistence, as the number of conducted studies in this area remains limited. This study aimed to investigate the factors influencing the expression of persistence in perennial ryegrass populations using airborne and ground-based sensors. A field experiment was conducted in the southwest region of Victoria, Australia, involving ten commercial perennial ryegrass cultivar–endophyte combinations in two different populations. Persistence was evaluated using sensor-based and conventional pasture measurements over two consecutive autumns. The results revealed significant fixed effects of cultivar, endophyte, and environment and their interactions on persistence traits of perennial ryegrass. Cultivars Alto, Samson, and One50 exhibited high levels of persistence when infected with novel endophyte strains. Furthermore, prolonged environmental stresses were found to drive directional selection within pasture populations. The findings emphasise the importance of selecting appropriate cultivar–endophyte combinations and early detection of signs of poor persistence to optimise sward longevity and financial returns from pasture-based animal production systems. This study fills a knowledge gap regarding the factors influencing pasture persistence and provides valuable insights for sustainable pasture management strategies.

1. Introduction

Perennial ryegrass (Lolium perenne L.) is one of the major perennial pasture species used in global temperate agriculture due to its desirable traits, including producing high nutrient density for livestock and its ability to withstand frequent grazing pressure compared with other perennial pasture species [1,2]. Perennial ryegrass is native to southern Europe, temperate regions of Asia and northern Africa, and is used in the temperate regions of many other countries including Australia, New Zealand, and the United States [3]. Perennial ryegrass can survive for several years under defoliation pressure [3,4]. However, perennial ryegrass may not persist well in the majority of Australian and New Zealand livestock farms where they have rainfall <700 mm [5]. Temperature extremes, drought, pests, and diseases have all been identified as significant productivity-limiting factors of perennial pasture species [1]. Complex interactions between these environmental stressors influence plant growth and development [6], triggering protective mechanisms in perennial pasture species that enable plants to survive in a challenging environment. These protective mechanisms may include alterations in the expression of plant morphological, physiological, and biochemical traits. For example, as a response to drought stress, carbon dioxide assimilation rate of plants progressively decreases, resulting in reduced leaf size, stem extension, and root proliferation [7]. Persistence of perennial pastures species is the ability to maintain plant density and dry matter production throughout the life of the sward. Peak dry matter production per hectares during the first 4–7 years can be used as the threshold value of a sward to define perennial pasture persistence and identify the timing for pasture replacement or renovation [8].
Perennial ryegrass is a diploid species and exhibits outcrossing tendencies. The presence of a gametophytic, two-locus incompatibility system (SZ) at the stigmatic surface effectively restricts the occurrence of self-fertilization [9]. The out-breeding nature of perennial ryegrass shows a high degree of genetic diversity within and between populations [10]. As a result, there can be considerable overlap in the distribution of quantitative traits among wild populations [9]. Furthermore, cross-pollination in perennial ryegrass can lead to the production of heterozygous individuals and heterogeneous populations, resulting in high genetic variability within and between cultivars. For instance, the variation in heading date among individuals in a perennial ryegrass population can range from 35 days between the earliest and latest flowering individuals [11].
Perennial ryegrass has a symbiotic relationship with a fungal endophyte [12]. The endophyte colonises intercellular spaces in the above-ground tissues of healthy plants, typically near the base of the tillers, and is sustained by its host plant [13]. During the reproductive phase, the endophyte moves into seed heads and spreads to the next generation through seeds [12]. Neotyphodium lolii is a wild-type or standard endophyte strain that releases bioactive alkaloids into plant tissues when the host plant is under stress conditions such as water deficit and pest attack, which aid the plant’s defense against these stress conditions [14]. Therefore, endophyte-infected plants may have greater persistence in a given environment. For example, endophyte-infected tillers in perennial ryegrass showed much lower Argentine stem weevil and African black beetle populations than in ryegrass tillers with low endophyte concentrations. Furthermore, a study found that wild-type endophyte-infected perennial ryegrass produced 38% greater dry matter, more leaf area, tillers, and roots than endophyte-free clones [15]. A recent study demonstrated that endophyte-infected ryegrass seeds have a higher seedling establishment, that may contribute to increased pasture DM yield and persistence of a sward through greater establishment [14].
Persistence of perennial ryegrass in temperate regions may similarly depend on various environmental factors, including rainfall distribution, temperature, and day length during the growing season [16]. However, other biotic and abiotic factors, such as defoliation, disease, and soil conditions, can also affect the persistence of perennial ryegrass in a dairy sward [1]. Extreme changes in these factors can create stress on individual plants, and those lacking the potential to resist such conditions may be eliminated from the sward. However, the impact of environmental factors on persistence can be managed at the initial stage.
Intensive rotational grazing, as used in dairy systems, may have both beneficial and destructive influences on the productivity and persistence of a sward [17]. The main detrimental effect of dairy grazing is defoliation, which forcefully removes available plant tissues, resulting in low water-soluble carbohydrate (WSC) reserves in the sward [18]. Defoliation can promote regrowth by enhancing light penetration, soil moisture, and nutrient availability for healthy tiller production [19]. However, the ability for shoot and root regrowth after defoliation may be limited by environmental stresses like prolonged dry and hot conditions. If the WSC reserves in the sward remain low during hot dry conditions, plants may die without entering conditional dormancy [20]. Moreover, increasing the frequency and intensity of grazing may reduce persistence and productivity in subsequent seasons, resulting in weed ingression to the sward.
Cultivar genomics of perennial ryegrass, endophyte, and environmental factors can interact and can result in adverse consequences for ryegrass persistence. For example, in the high rainfall zone of southern Australia, perennial grass ground cover is mainly influenced by growing season length, grazing method, and the interaction of stocking rate [21]. However, there needs to be more understanding of perennial ryegrass persistence and the main factors that affect it, as only a few studies have been conducted under real grazing conditions. These studies depended on traditional pasture measurements [22,23]. Investigating the potential factors that affect the expression of perennial ryegrass persistence may help in breeding cultivars with enhanced persistence and for farmers applying the proper mitigation practices to extend the life span of the dairy sward.
Traditional plant phenotyping methods have many limitations for large-scale plant screening, such as low repeatability, high labour cost, and user bias [24]. High-throughput phenotyping has emerged as a new technology in precision agriculture for non-destructive plant screening in controlled environments and under field conditions [25]. High-throughput phenotyping consists of utilising advanced sensors and computer vision-based pipelines for data acquisition and processing large data sets to extract specific plant traits from individual plants, plots or at the paddocks [26]. Field-based HTP platforms range from simple handheld devices to complex ground-based or space-borne systems, and the core element of remote sensing platforms is the sensors themselves. Sensors capture energy from specific segments of the electromagnetic spectrum (EMS), reflecting the morphological, physiological, and biochemical attributes of the target object [27]. Sensors can be classified into imaging and non-imaging types for precision agriculture in terms of imaging and non-imaging functionality, and image sensors have gained prominence due to advancements in image capture and processing technologies, facilitating efficient plant phenotyping [24]. A wide range of airborne and ground-based image sensors along with image-processing algorithms have shown high potential to estimate phenomic features related to pasture persistence, such as biomass [28], fractional ground cover [29], rate of pasture senescence [24,30], and pathogen infection [31]. The objective of this study was to evaluate the persistence of perennial ryegrass cultivars at plot scale and identify potential constraints on their expression of persistence using airborne multispectral and ground-based sound navigation and ranging (SONAR) and hyperspectral sensors.

2. Materials and Methods

2.1. Plant Materials for the Field Experiment

The plant material used in this study was obtained from an existing commercial study located in southwest Victoria, Australia (GPS coordinates: 38°14′28.8″ S 142°56′50.5″ E). The commercial study comprised 32 perennial ryegrass cultivars in four replicates, with all plots previously exposed to dairy grazing from 2013 for a further five years. Ten cultivars were subsequently selected for this experiment, representing combinations of four endophytes and four cultivar backgrounds. For each of the selected ten cultivars, one hundred soil cores with living perennial ryegrass tillers were randomly selected and excavated from each replicate using a 50 mm wide soil auger. Three healthy tillers were then randomly selected from each soil core and transferred to propagation seedling trays for field experiment planting. This group of tillers is referred to as “the selected population” in this experiment. Additionally, remnant seeds of the ten selected cultivars were sown in seedling trays, and approximately one hundred seedlings were grown from each cultivar. This group of seedlings is referred to as “the base population” of this experiment. Both the base and selected populations were then subjected to similar growing conditions to facilitate the growth of new tillers and roots until field experiment establishment.

2.2. Endophyte Status of Plant Materials

Genetic analysis was performed on the selected perennial ryegrass cultivars to test the presence of endophyte in plant materials in 2020. Three fully emerged young tillers from each plant was selected with 0.5–0.7 cm long stem at the base and sampled from the tiller using QIAGEN DNeasy 96 plant extraction kit. DNA was extracted from each cultivar using the MagAttract Plant DNA kit (Qiagen, Hilden, Germany) in an automated workflow with liquid handling platforms (Beckman Coulter, Brea, CA, USA). Each DNA sample was genotyped using a strain-specific Kompetitive Allele Specific PCR. (KASPTM) genotyping method was used to diagnose SNPs and KASP primers in this analysis. Each plate contained four positive controls as template controls (without DNA) for quality control. Each sample was tested for the presence of the expected endophyte. In addition, an immunoblot assay was used to quantify the presence of endophytes in the original populations in 2014 and the selected and base populations in 2021.

2.3. Experimental Design

The field experiment was established in May 2018 at the Hamilton Smart Farm, Agriculture Victoria Research, Hamilton, Victoria, Australia (GPS coordinates: 37°50′28.4″ S 142°04′16.9″ E). Hamilton receives its highest precipitation in July, August, and September, with an average annual temperature of 27 °C, and a mean annual precipitation of 660 mm. These weather conditions provide favourable environmental conditions for pasture growth and selection. As such, the region is considered an excellent location for conducting pasture research and breeding. Weather data were recorded throughout the experiment using an on-site meteorological station (Wireless Vantage Pro2™ Plus, Davis, CA, USA).
The experiment consisted of a completely randomised design, comprising four replicates. Each plot (3.5 m × 4.75 m) comprised four rows of the selected population and four rows of the base population, with both populations arranged adjacent to each other and spaced at 0.6 m intervals between rows. Twenty plants were established within each row, ensuring a spacing of 0.25 m between individual plants. This planting arrangement provided sufficient room for plant growth while fostering healthy competition among neighbouring plants.

2.4. Manual Pasture Measurements

In autumn 2019 and 2020, the number of surviving plants in each row was manually documented by an experienced pasture breeder. Destructive harvests were scheduled based on a predetermined criterion: when approximately 80% of the plants in each row reached the 3-leaf stage, indicating the development of three fully emerged leaves [32]. This stage was selected as an indicator of optimal growth and maturity for harvesting purposes. By employing this standardised approach, the timing of the harvests ensured consistency and allowed for accurate comparisons across the selected and base populations in each harvest. For each harvest, both the selected and base populations in each plot were mechanically harvested using a 21″ self-propelled lawn mower (Model: Honda HRX217K5HYUA) set at a cutting height of approximately 5 cm. The fresh weight of the harvested samples was subsequently measured using a precise compact scale manufactured by Mettler Toledo GmbH, Greifensee, Switzerland (Model: ICS6x5-1).

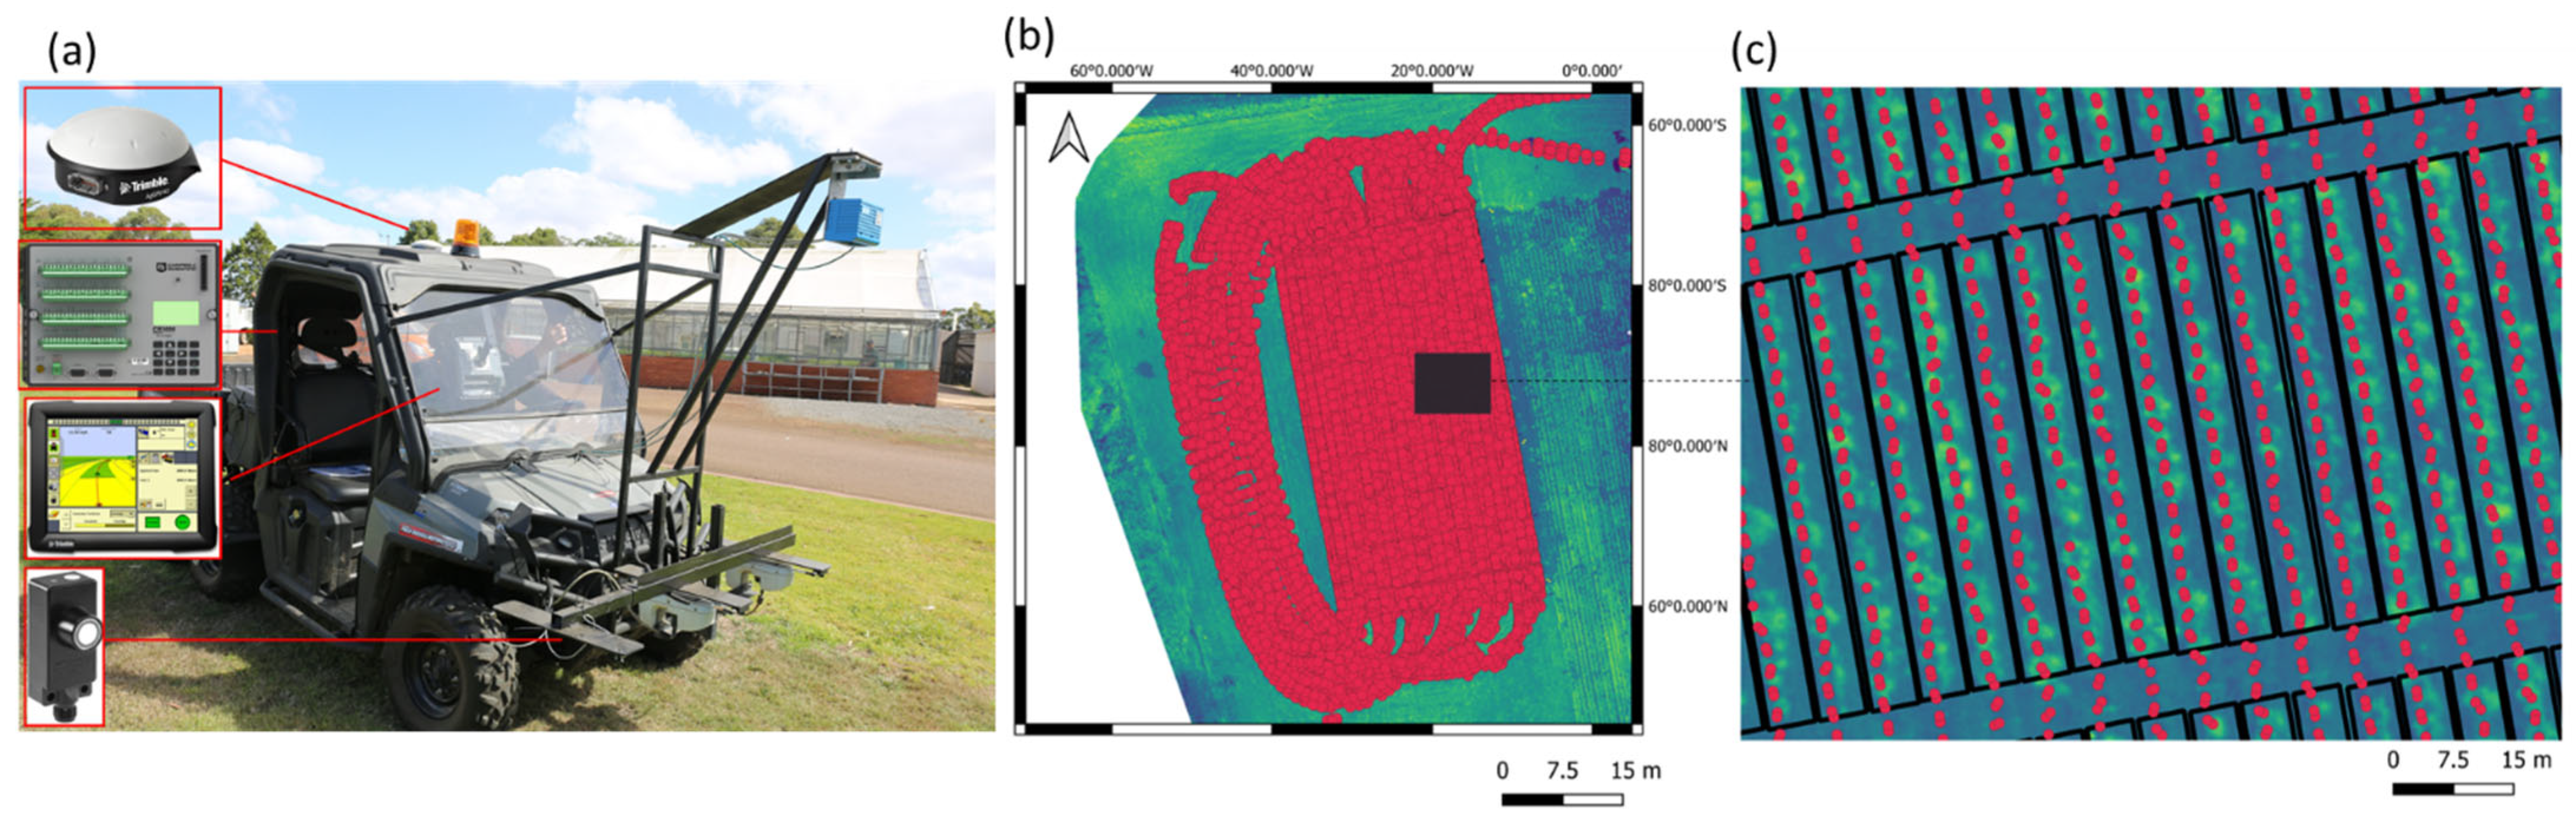
2.5. Sensor-Based Pasture Height

Prior to the destructive harvests, sensor-based pasture measurements were collected. This approach allowed for simultaneous data collections from sensors and the manual assessment at each harvest. The plant height of each row was recorded using a custom-modified side-by-side vehicle (Polaris Industries Inc., Medina, MN, USA). The vehicle was equipped with a set of integrated sensors, as illustrated in Figure 1. This innovative vehicle was developed by Agriculture Victoria [28], exclusively for the purpose of pasture height measurement. The vehicle was equipped with six ultrasonic sonar sensors (UNDK 30U6103/S14, Baumer group, Frauenfeld, Switzerland), mounted at the front of the vehicle, 0.6 m above the ground and in three rows 0.6 m apart, using a 1.45 m wide steel boom (Figure 1a). This configuration allowed for precise and accurate plant height measurement across the rows. Additionally, the vehicle was equipped with a Global Navigation Satellite System (GNSS) antenna (AG25, Trimble, Westminster, CO, USA) mounted on the rooftop. The GNSS antenna was connected to a real-time kinematics GNSS (RTK-GNSS) receiver (FMX Integrated Display, Trimble, Westminster, CA, USA), enabling the generation of georeferenced and geolocated sensor data. This integration ensured that the recorded plant height measurements were associated with their corresponding geographic position. A datalogger (model: CR3000, Campbell Scientific, Inc., Logan, UT, USA) was attached to the back of the vehicle to record plant height data. The datalogger facilitated the collection and storage of plant height measurements, ensuring accurate and reliable data acquisition for subsequent analysis.
The plant height data obtained from ultrasonic sonar sensors were processed using the methodology outlined by [28]. The georeferenced plant height measurements were autonomously recorded in the data logger and then transformed into a compatible format for third-party software using Loggernet 4.5 software (Campbell Scientific, Inc., Logan, UT, USA). To facilitate further analysis, the converted file containing the RTK-GNSS sensor data was georeferenced and transformed into the Universal Transverse Mercator (UTM) coordinate system using Microsoft Excel 2019 (https://www.microsoft.com/, accessed on 24 August 2020). The resulting file was saved in a comma-separated values (.csv) format for easy integration with other software. The UTM positions of each sensor measurement were calculated in QGIS 3.12.3 (QGIS Development Team, 2017, Raleigh, NC, USA; https://qgis.org/, accessed on 24 August 2020) utilising a pre-designed offset template within the HTP Geoprocessor 1.2 Python plugin. This allowed for precise spatial referencing of the plant height measurements. The data were extracted into a plot overlay in QGIS 3.12.3 through the processing steps provided by the HTP Geoprocessor 1.2 Python plugin (Figure 1b,c). This facilitated the creation of a vector file overlay representing the plant height measurements within the designated plan row.

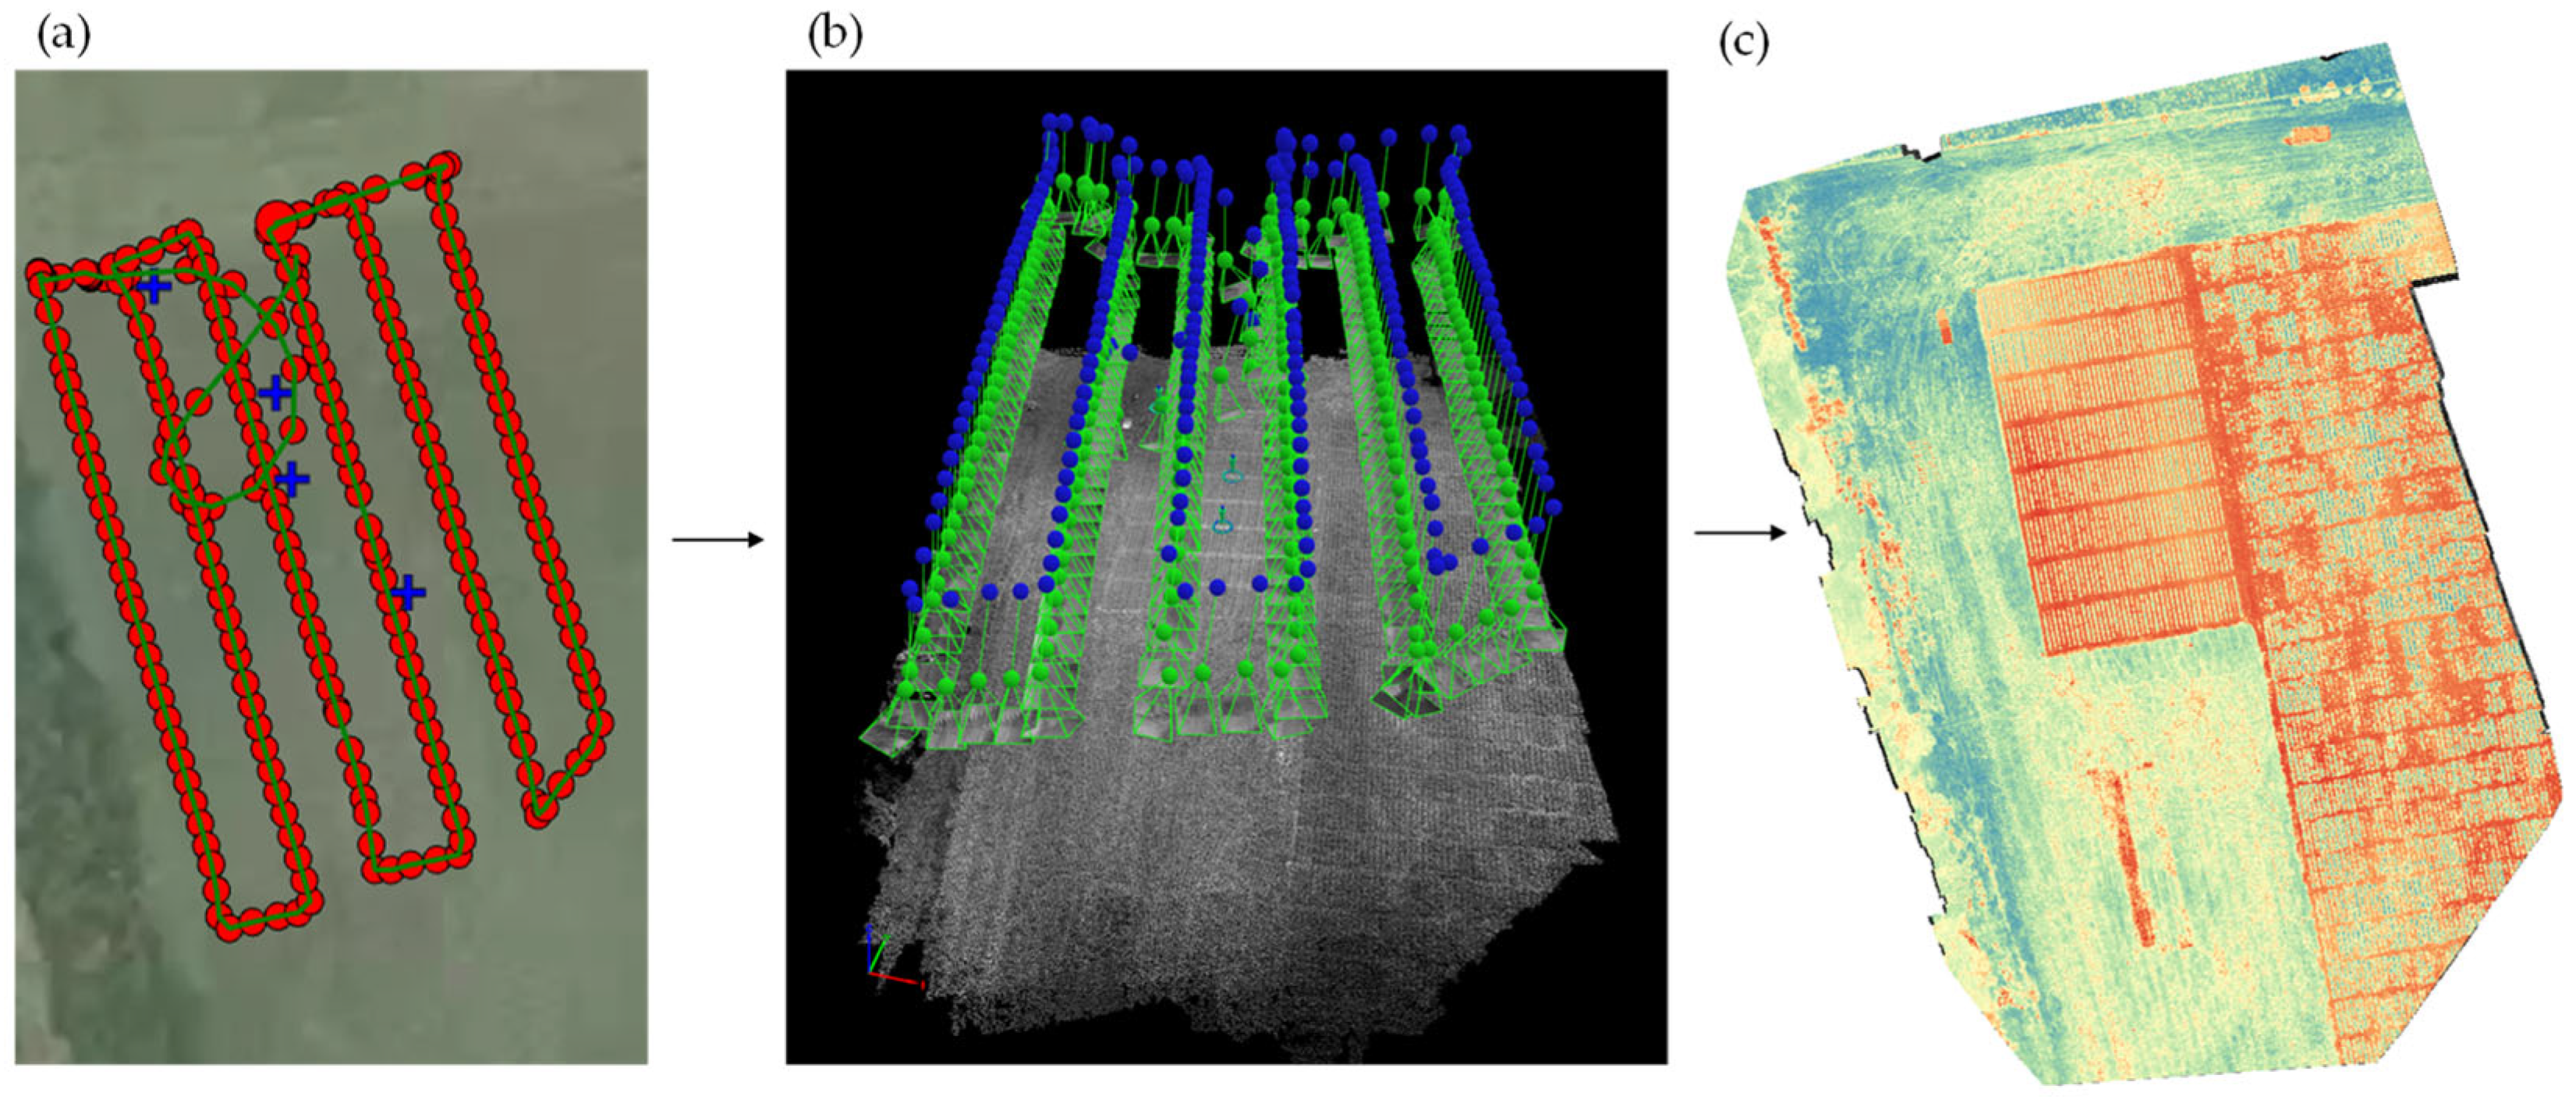
2.6. Airborne Phenomic Data Acquisition

Prior to the destructive harvest, multispectral images were captured using a RedEdge-M camera (MicaSense, Inc., Seattle, WA, USA) mounted on a DJI Matrice 100 quadcopter (DJI Technology Co., Shenzhen, China). To facilitate the efficient collection of data, the Pix4D capture 4.9.0 application (Pix4D SA, Prilly, Switzerland; https://www.pix4d.com/, accessed on 2 February 2019) was utilised for the design, saving, and loading of pre-designed flight paths onto the quadcopter, automating the flight during data acquisition. Turning points of the flight path were positioned outside the area of interest to ensure comprehensive coverage of the experimental site. This ensured that the multispectral imaging process captured the entire experimental site. The flight mission was set with recommended overlap parameters for optimal image quality and accuracy. Specifically, 80% forward overlap and 75% sideways overlap were established for the RedEdge-M sensor. During the flight, the quadcopter maintained a consistent altitude of 30 m above ground level while the ground speed was set at 6 ms−1 (21 km/h) to ensure the capture of stable and clear images. Calibration targets with known reflectance values (3%, 6%, 11%, 22%, and 33%) were placed on the ground within the sensor’s field of view during image acquisition to facilitate accurate calibration and analysis. Furthermore, ground control points (GCPs) were strategically located within the experimental area. These GCPs played a crucial role in the georectification process of the airborne images during the image pre-processing steps.
Using Pix4D mapper 4.2.16 software (Pix4D SA, Prilly, Switzerland; https://www.pix4d.com/, accessed on 2 February 2019), digital terrain models (DTMs) and orthomosaic images were generated for each multispectral band, including green, blue, near-infrared (NIR), red, and red edge. During image pre-processing in Pix4D 4.2.16 software, the GCPs were used to ensure accurate georeferencing of the resulting DTM and orthomosaic images (Figure 2). The root mean square (RMS) error and ground sampling distance (GSD) of the orthomosaic images were approximately 2 cm in flight data (as detailed in Table 1). To establish a consistent coordinate reference system (CRS), the EPSG:32755–WGS 84/UTM zone 55S was adopted as the output coordinate system for both the DTM and orthomosaic images within the Pix4D workflow. The radiometric calibration of the orthomosaic images derived from the Pix4D workflow was conducted using QGIS 2.18.20 (QGIS Development Team, 2017, Raleigh, NC, USA; https://qgis.org/, accessed on 24 August 2020). The process involved employing the Zonal statistics plugin and raster calculator functions within QGIS. By applying radiometric calibration, the raw digital numbers (DNs) recorded by the RedEdge-M multispectral camera were converted into reflectance values, enabling further interpretation of the data. The resulting radiometrically corrected raster orthomosaics were subsequently employed in the phenomics pipeline to extract digital features of radiometrically calibrated images.

2.7. Vegetation Indices Extraction

The plot overlay, that followed the (CRS) EPSG:32755–WGS 84/UTM zone 55S, was digitised by importing calibrated orthomosaic bands into QGIS 2.1. (QGIS Development Team, 2017, Raleigh, NC, USA; https://qgis.org/, accessed on 24 August 2020). Orthomosaic images (raster format) of broadband vegetation indices (listed in Table 2.) were generated under the same CRS (EPSG:32755–WGS 84/UTM zone 55S) using the raster calculator. Reflectance values of generated vegetation indices were extracted through the Zonal statistics plugin. Reflectance values associated with the generated vegetation indices were extracted using the Zonal statistics plugin in QGIS 2.1.

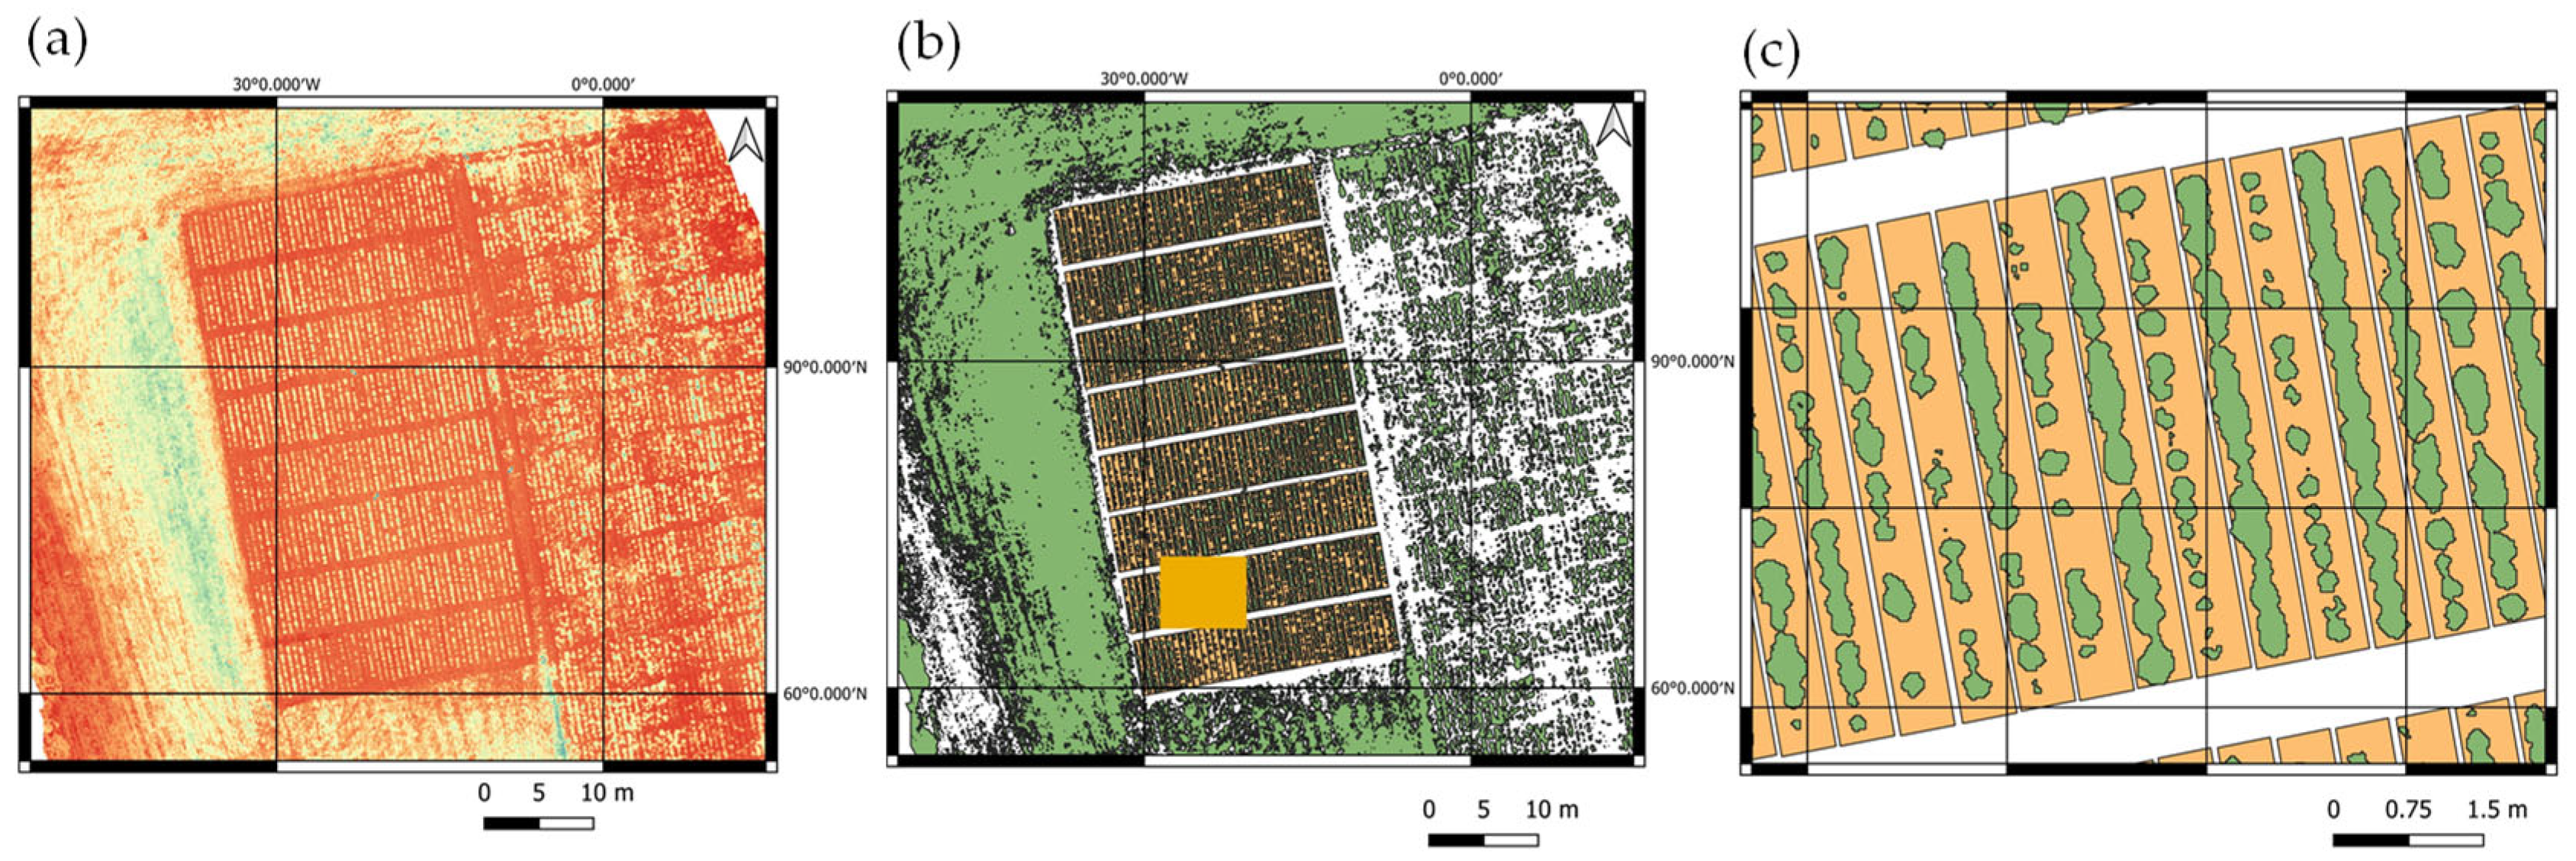
2.8. Ground Cover Extraction from Multispectral Images

Ground cover extraction from the multispectral images was conducted using eCognition Developer 9.3.2 (Trimble Germany GmbH, Munich, Germany; http://www.ecognition.com/, accessed on 20 August 2020) with a predefined rule set, as illustrated in Figure 3. The plot overlay (vector file) and radiometrically corrected multispectral bands were imported into eCognition Developer 9.3.2 for further analysis. The rule set included image segmentation and ground cover classification, following previously described methodology [29]. The plot IDs from the plot overlay were used to reclassify the segmented objects using the “assign class by thematic layer” algorithm in eCognition Developer 9.3.2. The resulting green fraction data were exported as a comma-separated values (.csv) file using the “export object statistics” algorithm in eCognition Developer 9.3.2 for further analysis.

2.9. Statistical Analysis

Interval plots of variables were generated using Minitab 19.1.1 (https://www.minitab.com, accessed on 20 August 2020). The most important VIs for representing perennial ryegrass persistence were selected by performing a correlation coefficient (Pearson’s correlation coefficient) using pasture ground cover and plant surviving percentage. The effect of genotype, endophyte, and environment on the expression of selected variables was analysed using a linear mixed effect model approach using the following model
Variable = Fixed (Cultivar + Endophyte + Population type + Harvesting year) + all interaction + Random (Replicate + Row) + error
All variables were assumed to follow a normal distribution and denote interaction. All parameters were estimated using a residual maximum likelihood (REML) technique due to a missing cultivar–endophyte combination. Statistical analyses were performed in Genstat 18.2.0.18409 (https://www.vsni.co.uk, accessed on 20 August 2020).

3. Results

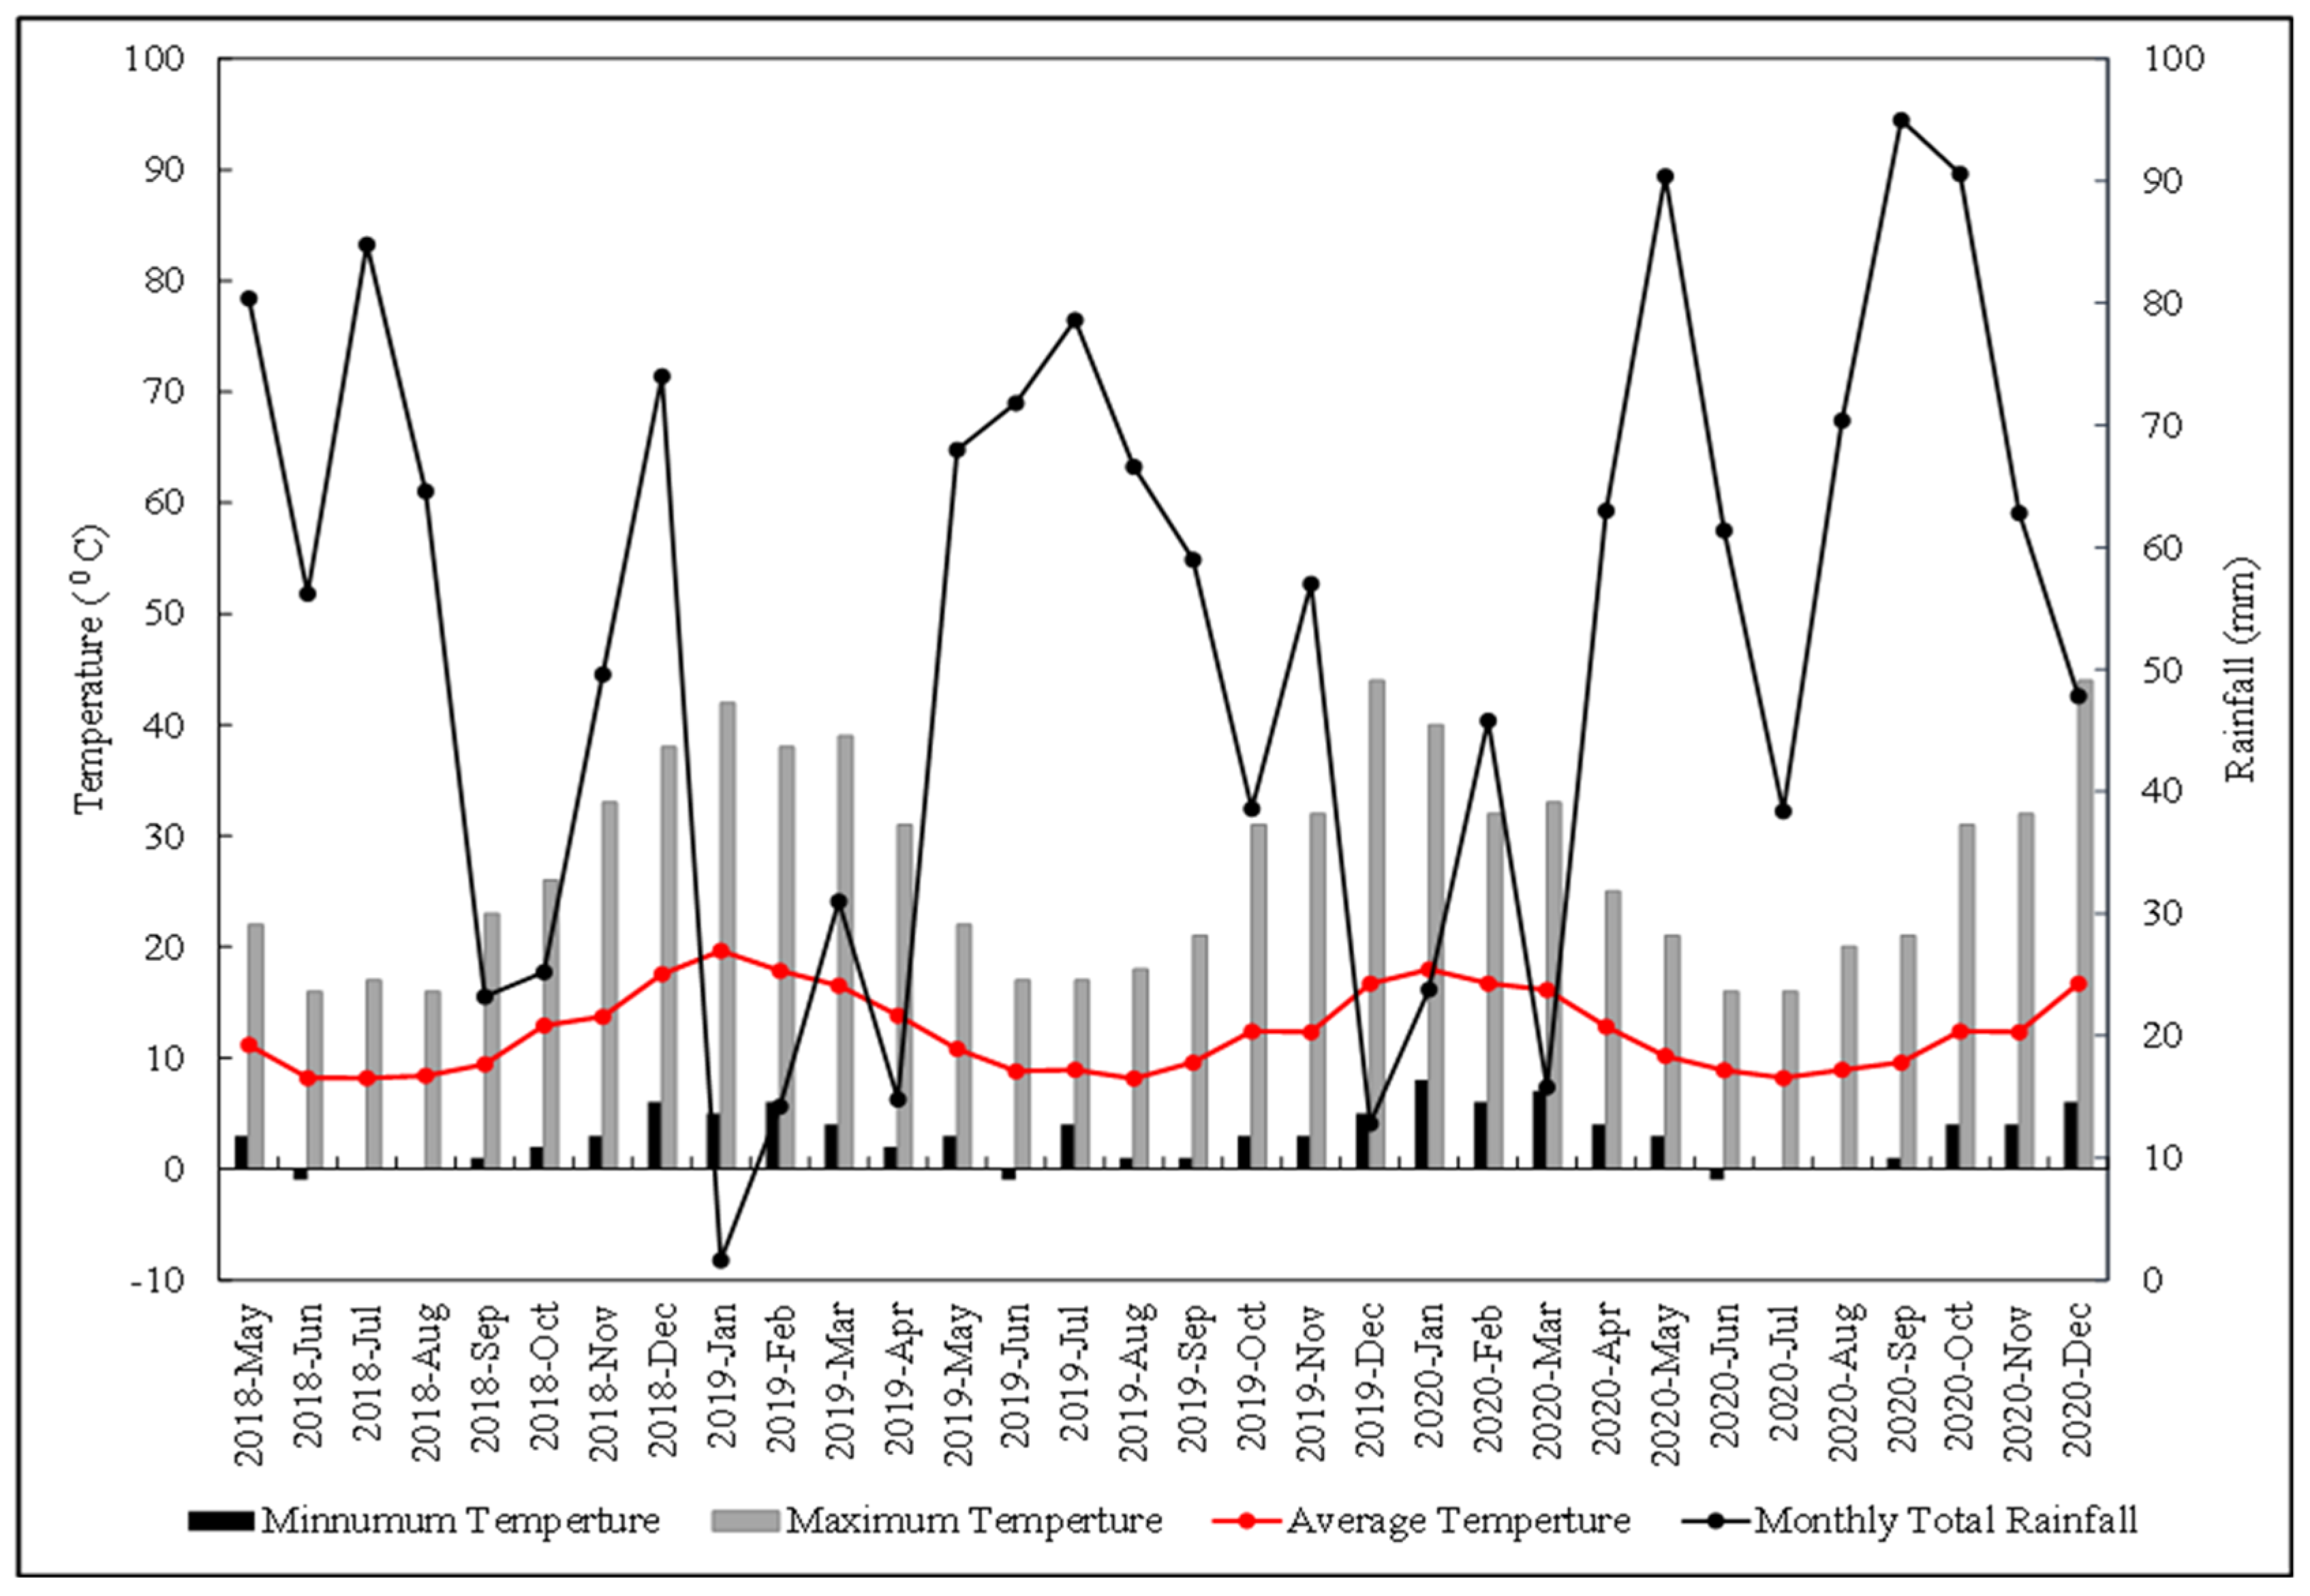
3.1. Meteorological Data

The monthly mean minimum and maximum temperature patterns exhibited a similar seasonal trend during the experimental period: May 2018–May 2020, as illustrated in Figure 4. The average maximum temperature from May 2018 to April 2019 was 27.9 °C. In the subsequent period from May 2019 to May 2020, the average maximum temperature slightly decreased to 27.1 °C. A comparable trend was also observed for the total seasonal rainfall during the different growing seasons. In winter, the total rainfall was 70.5 mm in 2018 and increased to 75.2 mm in 2019. In the early spring (September–October) period, the total rainfall was 43.9 mm in 2018 and raised to 62.8 mm in 2019 (Figure 4).
Similarly, in the late spring period (November), the total rainfall increased from 37.4 mm in 2018 to 47.8 mm in 2019. In autumn, the total rainfall was 37.9 mm in 2019 and raised to 60.9 mm in 2020. However, in summer, there was a decrease in the total rainfall from 29.9 mm in 2018 to 22.0 mm in 2019.

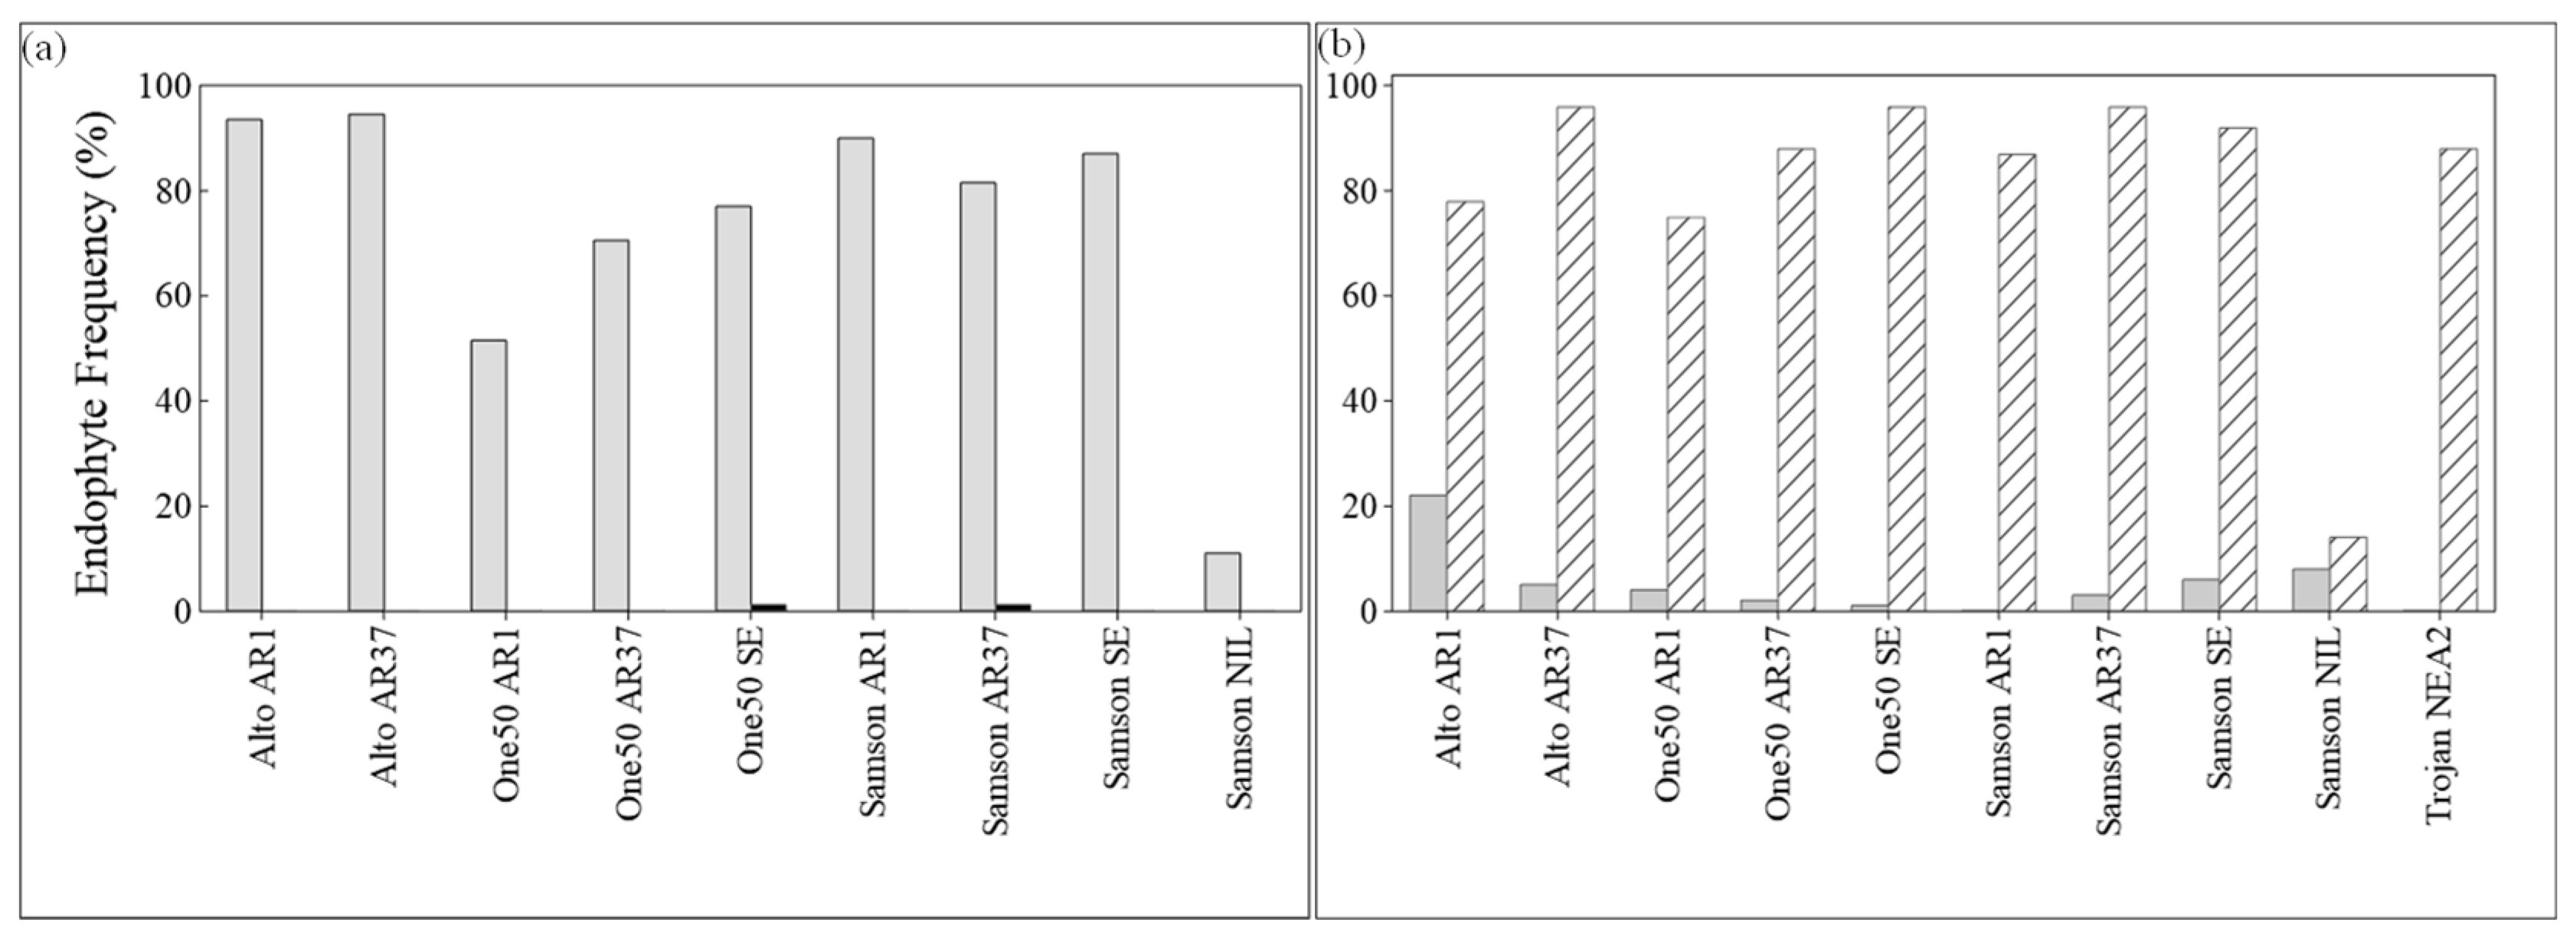
3.2. Endophyte Frequency

In 2014, immunoblot assay data showed that the endophyte frequency exceeded 60% for most cultivars. However, only 1% of One50 SE and Samson SE exhibited positive endophyte presence in their remnant seeds in 2020 (Figure 5a). In 2021, the selected populations showed a significantly higher endophyte frequency compared with their respective base populations, except for Samson Nil (p < 0.001; Figure 5b). This result was similar to the endophyte percentage observed in the original populations when tested in 2014, and a similar trend was observed in the base populations of all cultivars, except for base populations of Alto AR1, which had a higher frequency of 21%.

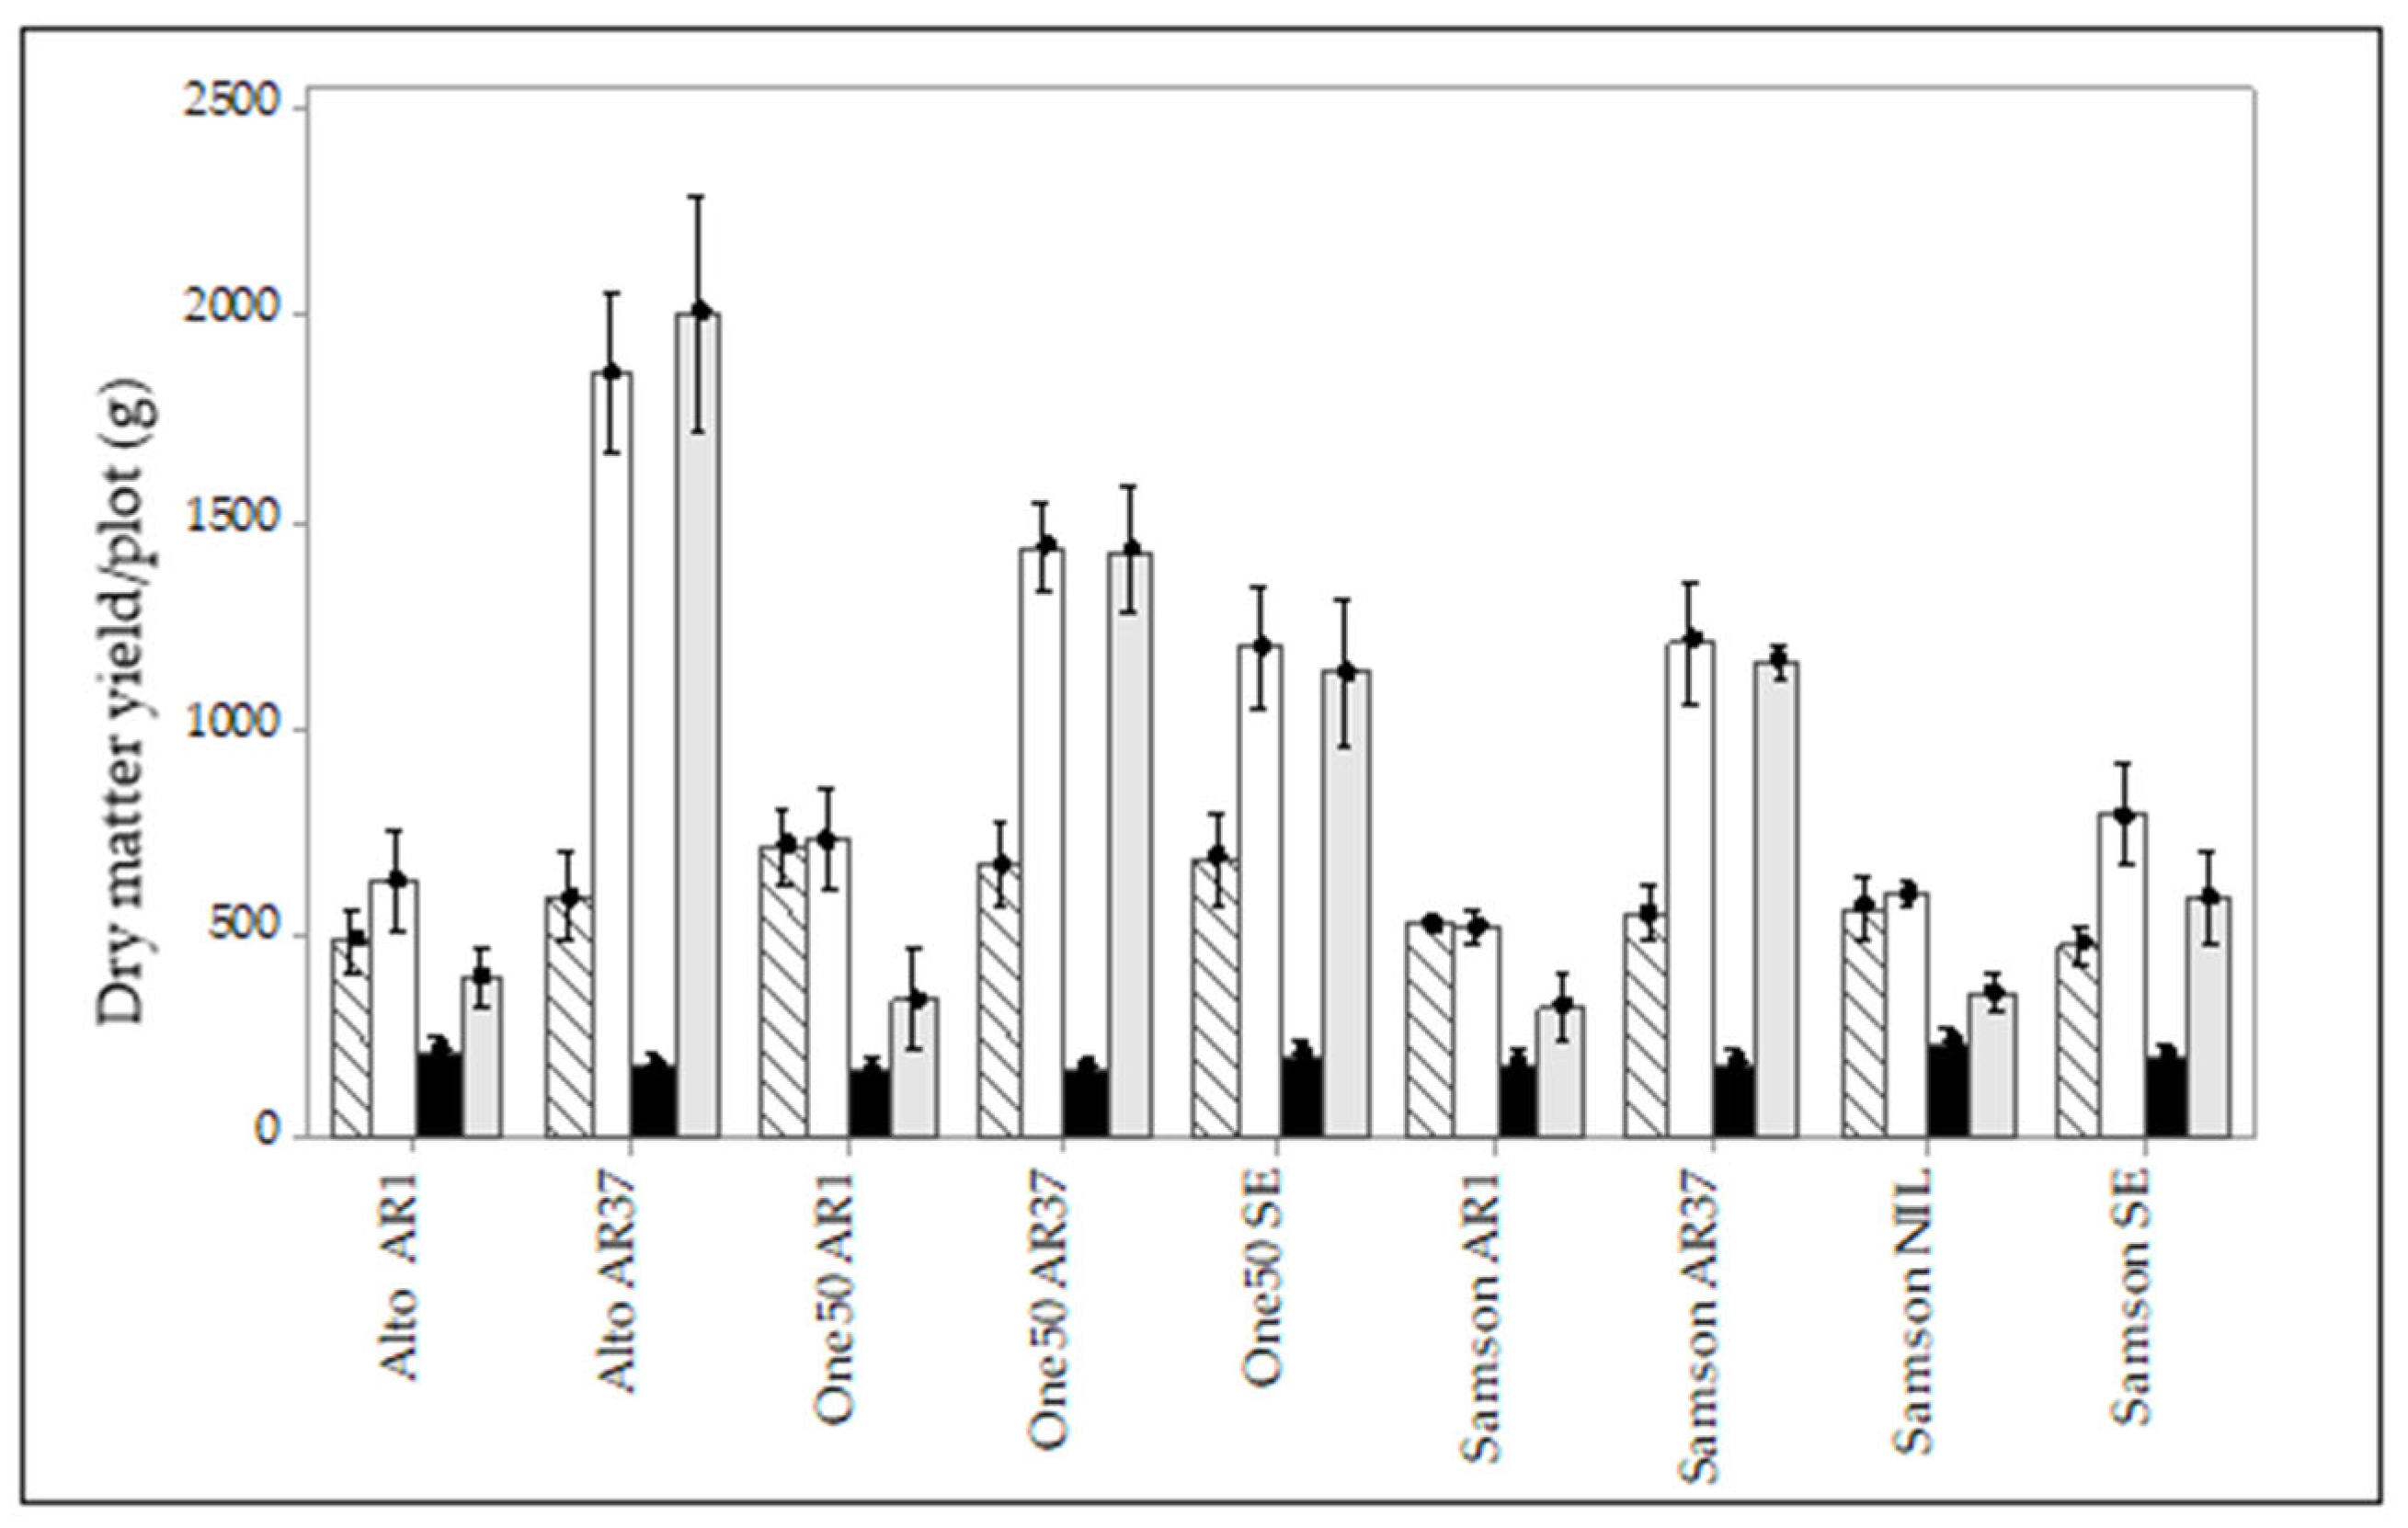
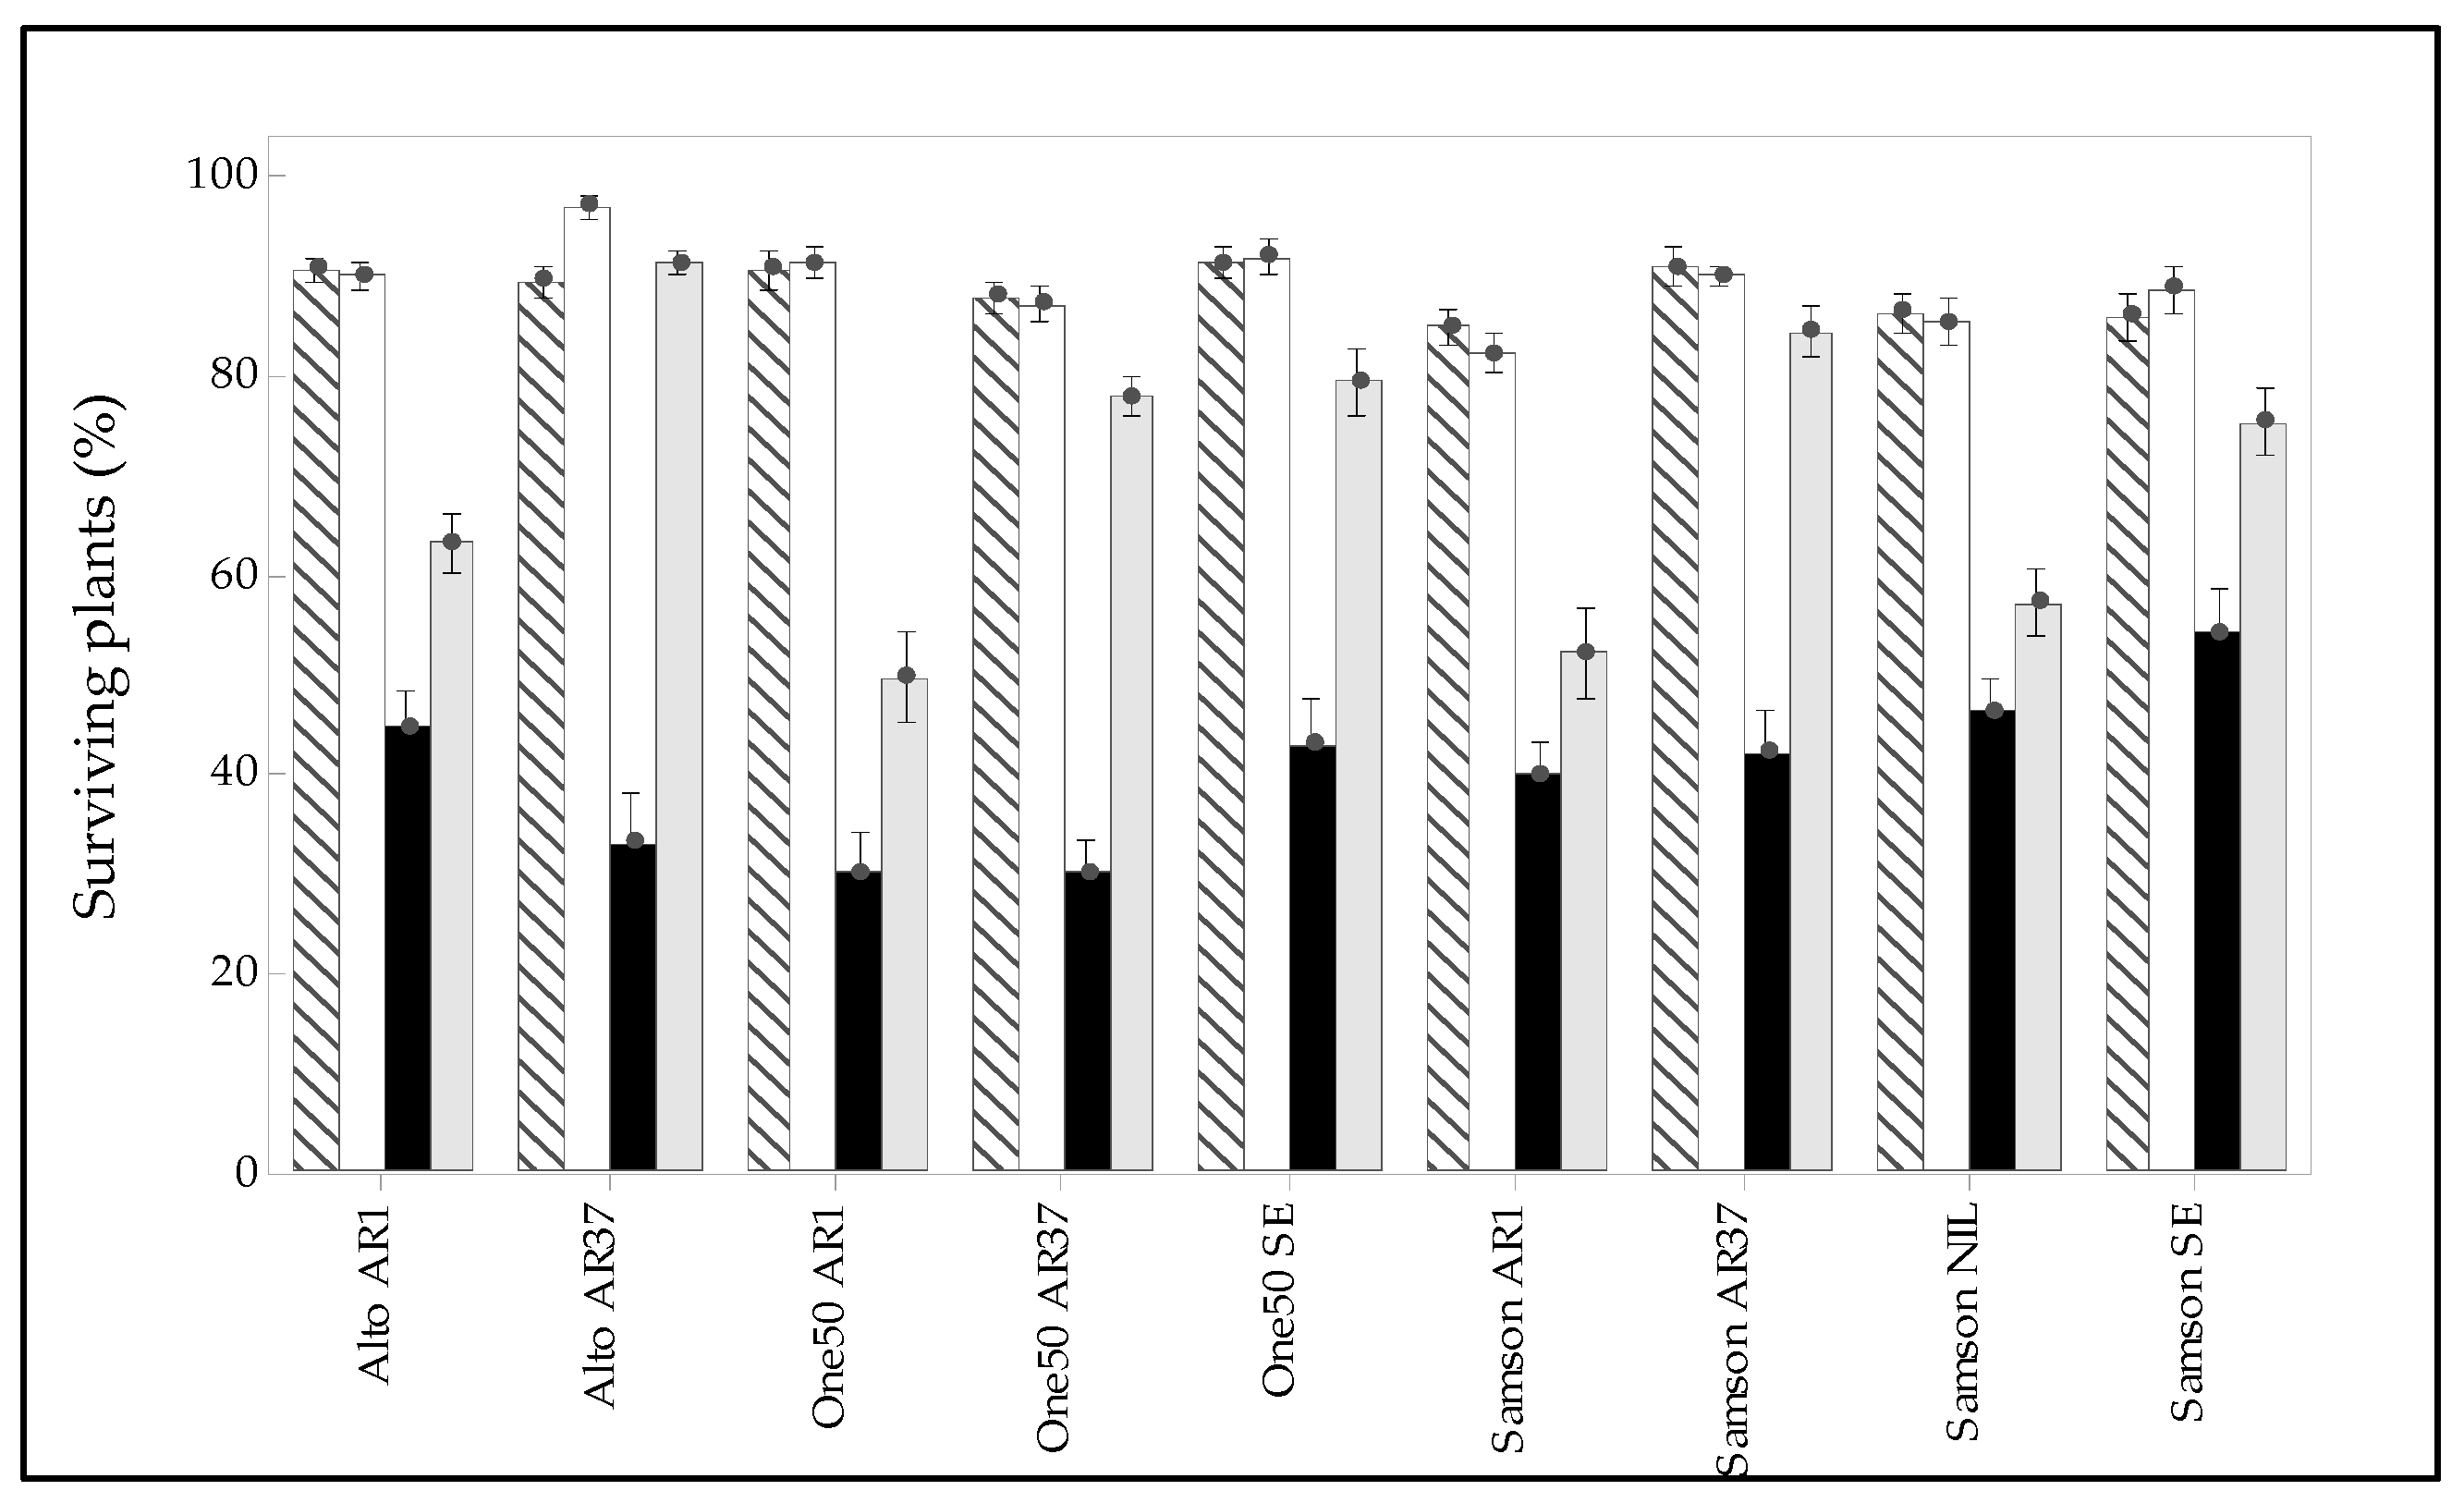
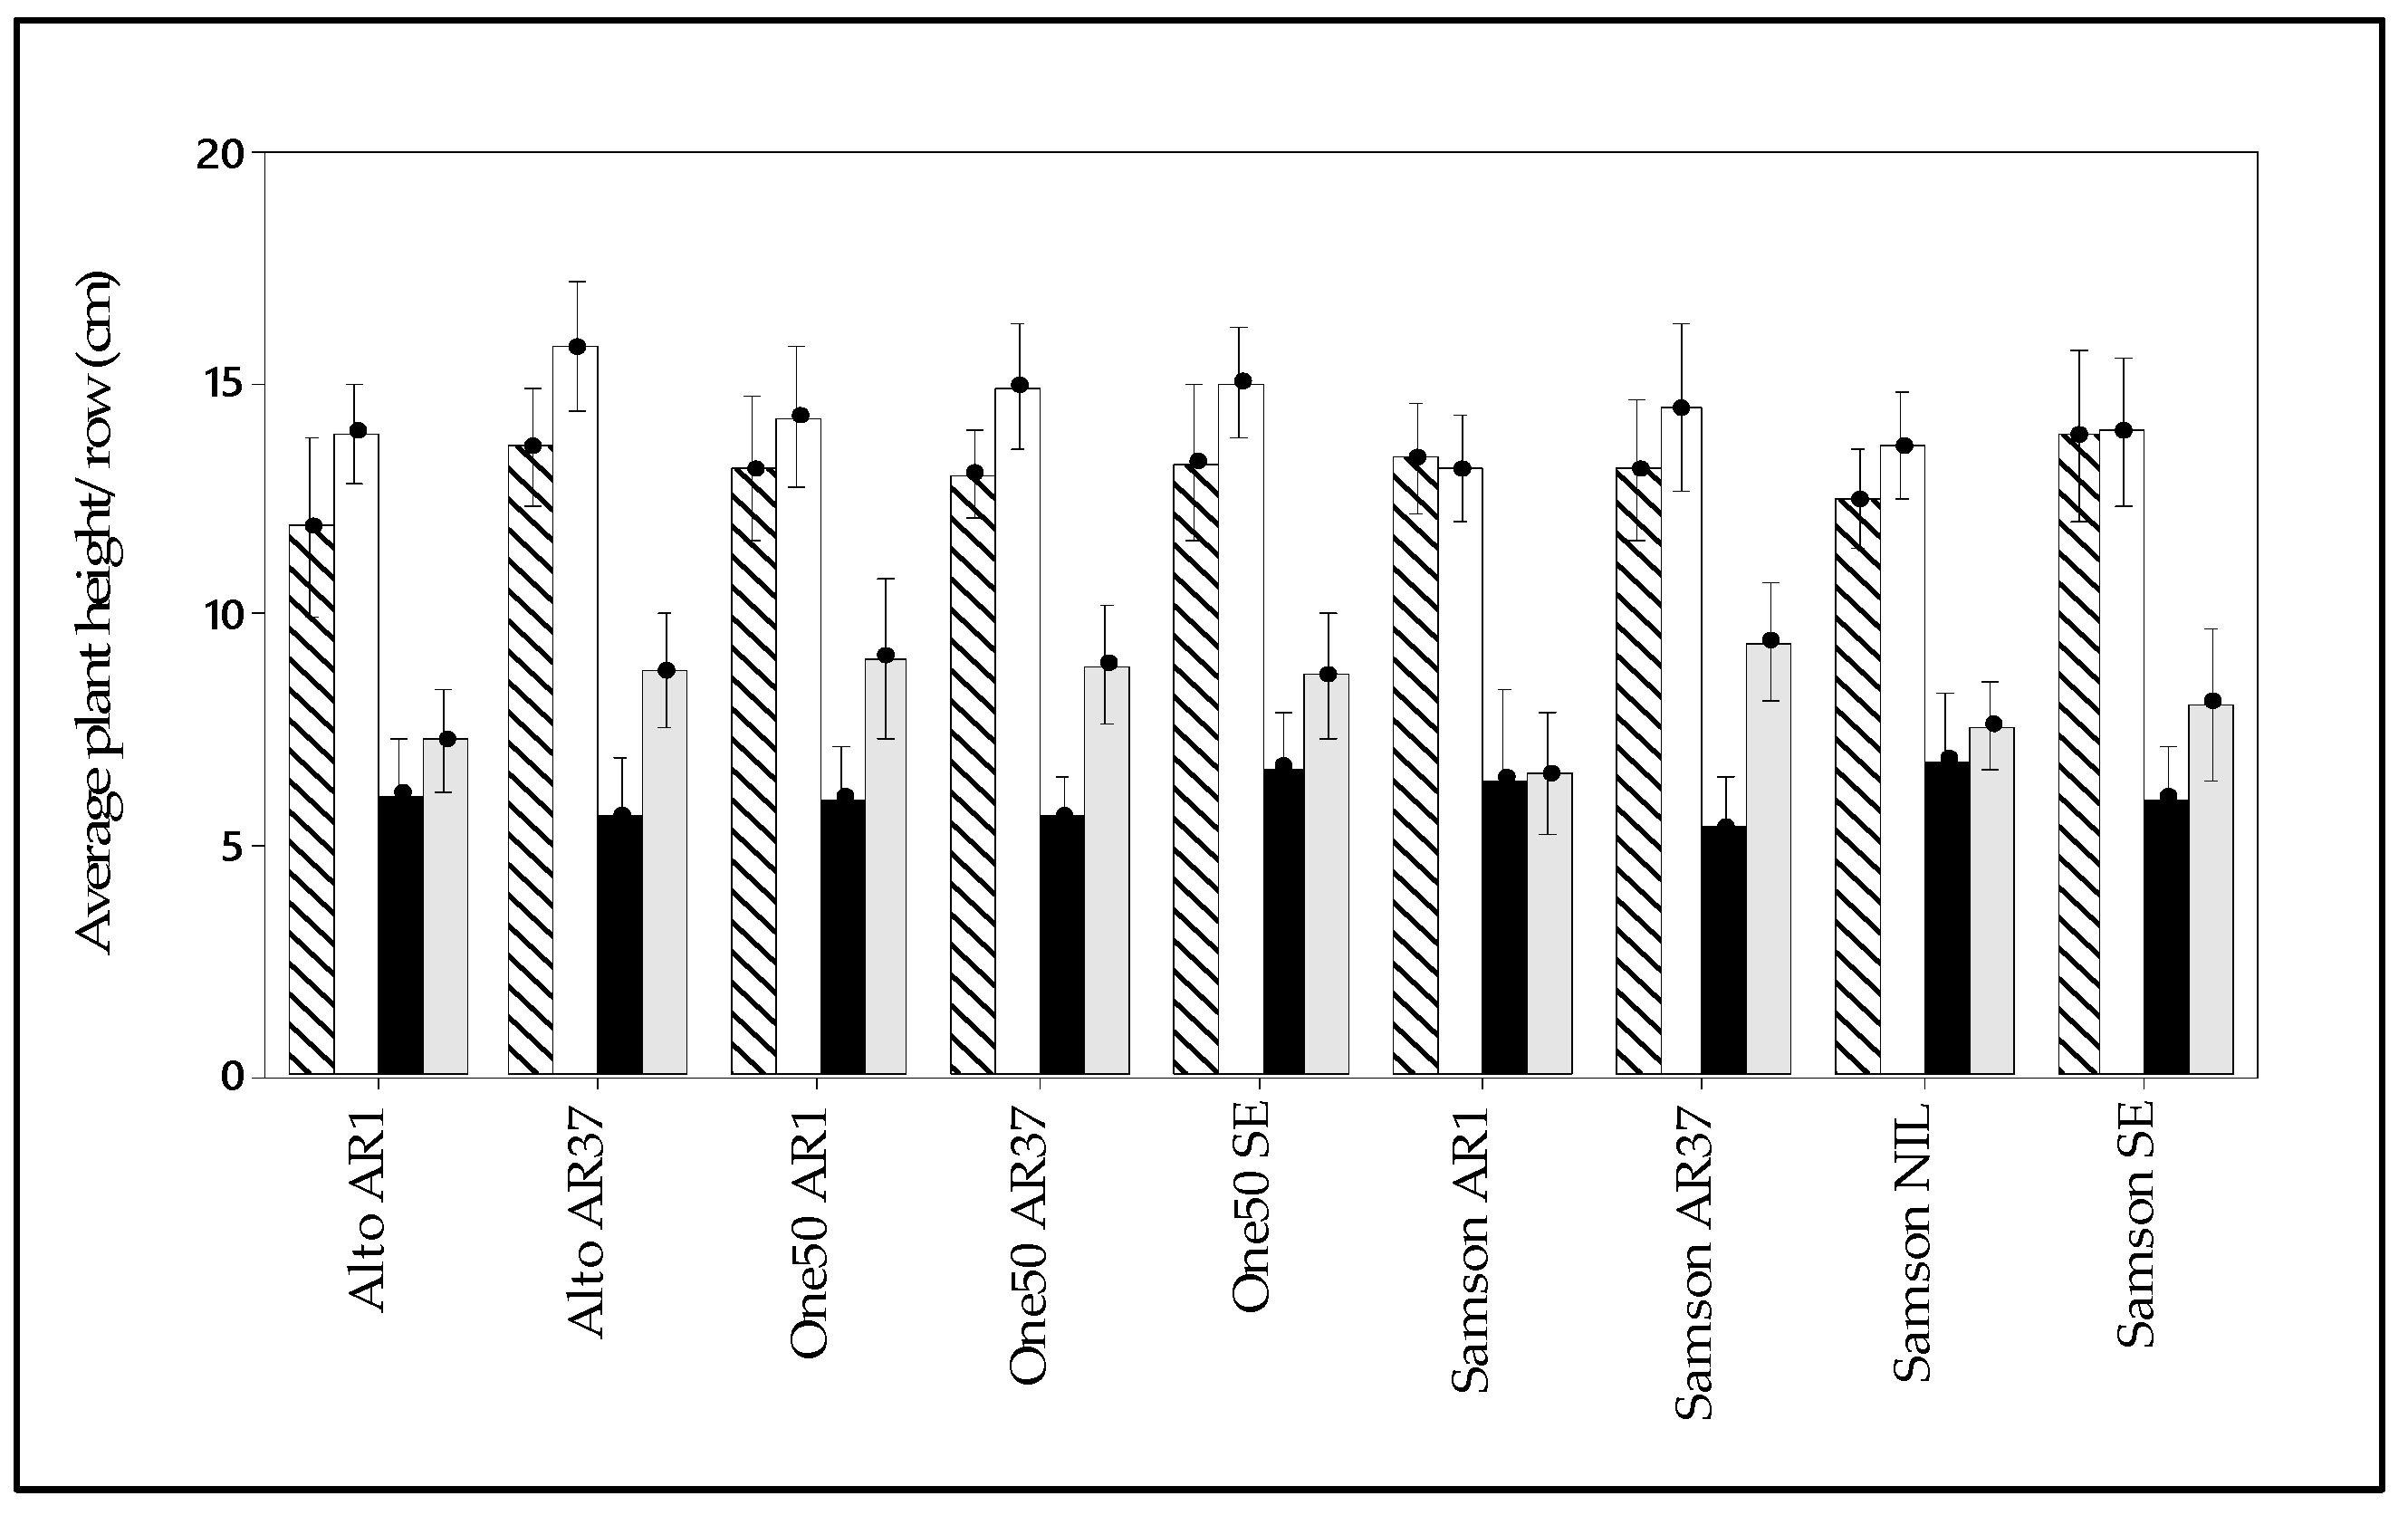
3.3. Manual Pasture Measurement

During the autumn harvest of 2019, a significant increase in dry matter yield was observed in the selected populations of Alto AR37, One50 AR37, One50 SE, Samson AR37, and Samson SE compared with their respective base populations (p < 0.001). This finding was consistent with the subsequent autumn harvest in 2020, where the selected populations of all cultivars displayed significantly higher dry matter yield compared with their base populations (p < 0.001). There were no significant differences in the base populations of all tested cultivars at the 2019 and 2020 autumn harvests (p > 0.05). However, the average of the base population for each cultivar experienced a significant reduction during the 2020 autumn harvest (p > 0.05; Figure 6).
At the plot level, the dry matter yield of the selected populations exhibited significant variation among the cultivars in both 2019 and 2020 (p < 0.001). Alto AR37 consistently demonstrated the highest dry matter yield among all cultivars in both growing years, and this was not statistically significance in these two different harvest years (p > 0.05). However, in the 2020 autumn harvest, a significant decrease in average plot-level dry matter yield was observed for both selected and base populations of Alto AR1, One50 AR1, Samson AR1, and Samson Nil.
Except for Alto AR37, the surviving plant percentage of all selected cultivars did not significantly (p > 0.05) differ between the selected and base populations at the 2019 harvest. However, plant surviving percentage was significantly different among cultivars (p < 0.001). Moreover, Alto AR37 showed the highest surviving plant percentage, and Samson AR1 showed the lowest plant surviving percentage at the 2019 harvest. In 2020, the selected population of all cultivars showed significantly higher surviving plant percentages compared with the surviving plant percentage of the base population (p < 0.001), and the surviving plant percentage of the selected population was significantly different among all cultivars (Figure 7). Alto AR37 showed the highest plant surviving percentage in selected population at the 2020 autumn harvest. The base population of Alto AR37, One50 AR1 and One50 AR37 showed a similar trend, which was the lowest surviving percentage at the 2020 autumn harvest (p > 0.05).
In the 2019 harvest, the surviving plant percentage of all cultivars, except for Alto AR37, was not significantly different (p > 0.05) between the selected and base populations. In contrast, during the 2020 harvest, the selected populations of all cultivars demonstrated significantly higher plant surviving percentages than those of their respective base populations, as depicted in Figure 7 (p < 0.001). Alto AR37 exhibited the highest surviving plant percentage within the selected population during the 2020 autumn harvest, and the base populations of Alto AR37, One50 AR1, and One50 AR37 displayed a similar trend, with the lowest plant surviving percentages observed at the 2020 autumn harvest (p > 0.05).

3.4. Sensor-Based Pasture Measurements

At the 2019 autumn harvest, the average row-level plant height of both the selected and base populations was found to be significantly lower compared with the row-level plant height observed at the 2020 autumn harvest (p > 0.05), as illustrated in Figure 8. However, the selected populations of Alto AR37, One50 AR37, and Samson AR37 exhibited significantly higher plant heights compared with their respective base populations when evaluated at the 2019 autumn harvest (p < 0.001). Similar trends in average plant height were observed for all other tested cultivars in both the selected and base populations during the same harvest. However, no significant differences in average row-level plant height were observed among Alto AR37, One50 AR37, and Samson AR37 within the selected population or the base population (p > 0.05) (Figure 8). The expression of fractional ground cover also showed the same trend in both selected and base populations (Figure 9).
Analysis of preharvest multispectral images in 2019 revealed a positive correlation between all vegetation indices (VIs) and both row-level surviving plant percentage and pasture ground cover. However, the canopy chlorophyll concentration index (CCCI) did not show a significant correlation with either pasture ground cover or surviving plant percentage. The relationship between ground cover and VIs was stronger than the relationship between VIs and surviving plant percentage. Vegetation indices such as NDVI, GNDVI, RDVI, SAVI, SRI, IPVI, RDI, GDI, and CreTVI exhibited a robust positive relationship with ground cover at the 2019 harvest, with correlation coefficients (r) exceeding 0.95 (p < 0.001). This indicates a strong association between these VIs and the extent of ground cover, highlighting their potential as reliable indicators of vegetation density and coverage. A similar trend was observed in the analysis of 2020 autumn sensor-based data, including ground cover and plant surviving percentage. The relationship between VIs and ground cover at the 2020 harvest was even stronger than that observed in the 2019 harvest (Figure 10). These findings further emphasise the utility of VIs in assessing and quantifying ground cover, providing valuable insights into the overall vegetation dynamics and health of the experimental plots.

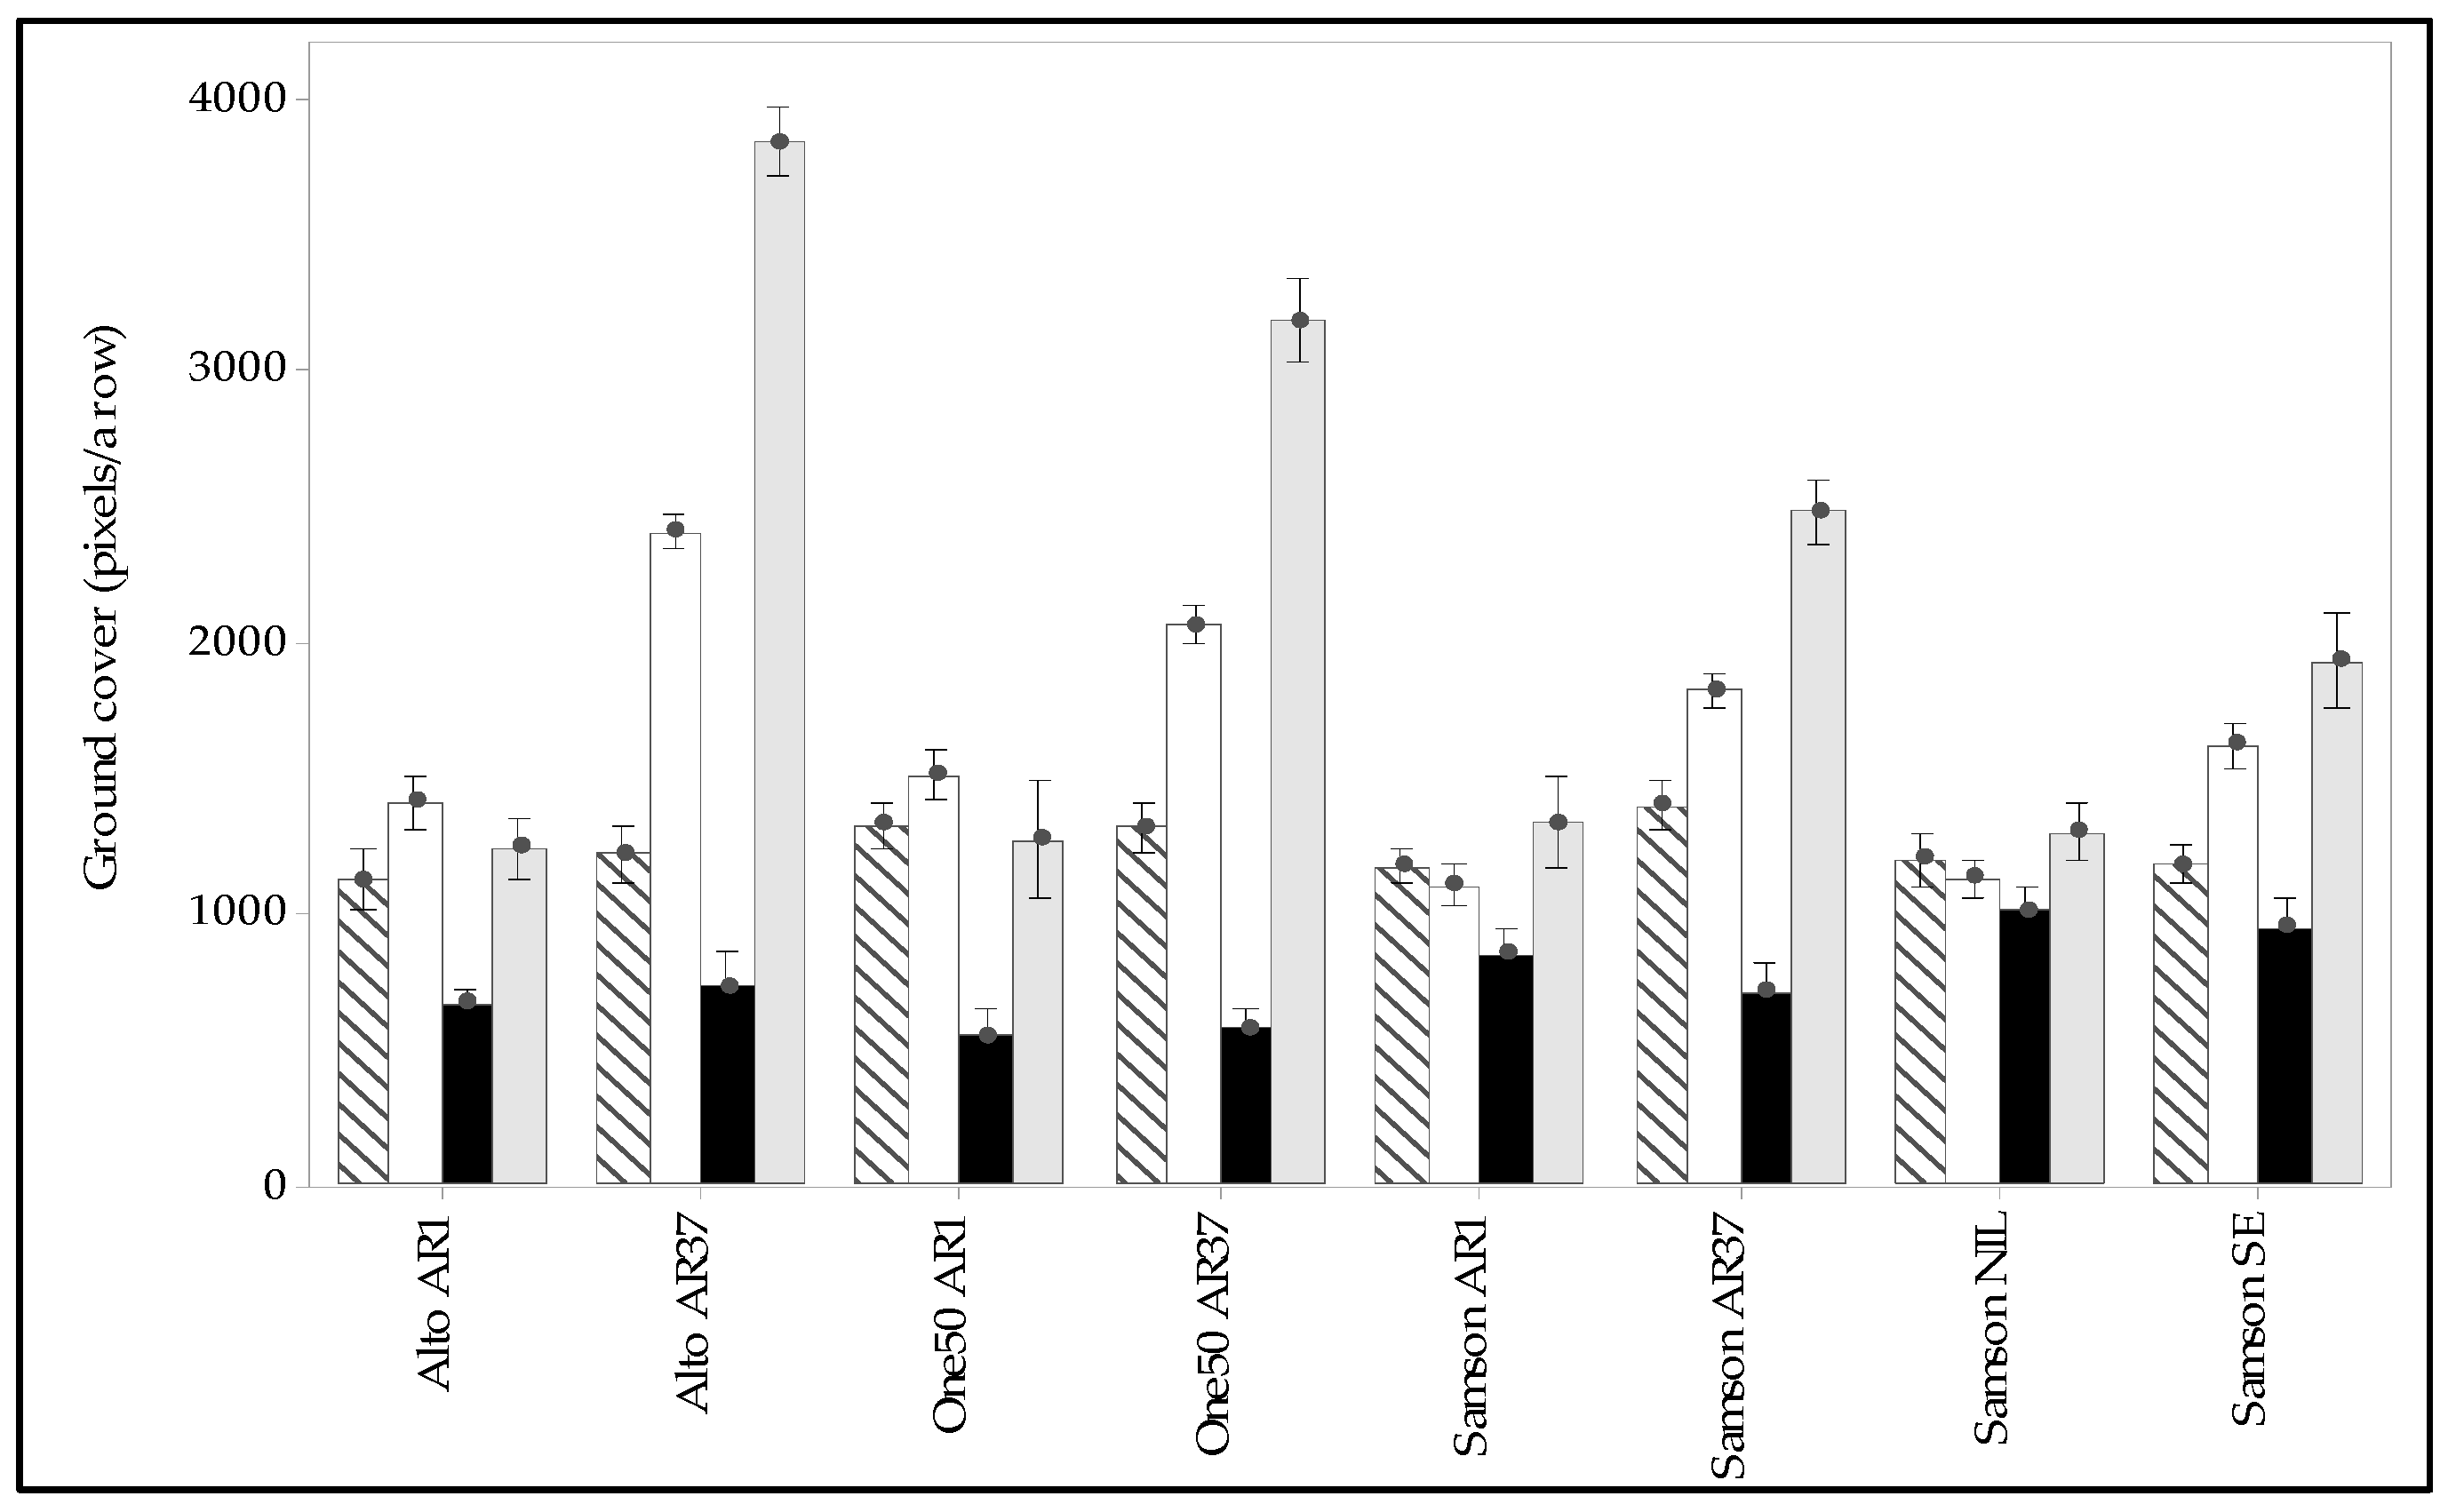
3.5. Interaction of Endophyte, Cultivar, and Environment on Pasture Persistence

Table 3 provides an overview of the influence of four main factors, cultivar, endophyte, population type, and harvest year, on the expression of measured pasture traits. The results indicate that all four factors have significant main effects on dry matter yield, ground cover, surviving plant percentage, and several vegetation indices (SAVI, SRI, RDI, GLI, and CreTVI). However, the impact of the cultivar on plant height and the average row-level values of NDVI, GNDVI, RDVI, SAVI, and IPVI were not significant (p > 0.05). Furthermore, the expression of plant surviving percentage was observed to be independent of the influence of endophyte (p = 0.07), suggesting that endophyte presence or absence did not have a significant fixed effect on surviving plant number. Similarly, perennial ryegrass plant height was not influenced by the two-way interaction between endophyte and cultivar (p = 0.336), and a similar trend was observed for the two-way interaction between cultivar and population. However, the two-way interaction between endophyte and population significantly (p < 0.05) influenced all tested variables, both sensor-based and manual measurements (Figure 10).
The impact of the two-way interaction between cultivar and harvest year was not significant for most variables, except for plant surviving percentage and plant height. Conversely, the two-way interaction between endophyte and harvest year significantly influenced the expression of all tested variables except for plant height. The interaction between population and harvest year also significantly influenced the expression of all tested variables (p < 0.05). Furthermore, the three-way interaction among cultivar, endophyte, population, and harvest year had an impact on all tested variables except for row-level surviving plant percentage. However, the strength and nature of this three-way interaction varied among the different variables (Table 3).

4. Discussion

4.1. Pasture Traits for Pasture Persistence Estimation

The aim of this experiment was to evaluate the impact of pasture cultivar, endophyte, and environment on the persistence of perennial ryegrass populations using sensor-based and manual pasture measurements. Persistence is a crucial trait in perennial pastures, typically assessed through field observations in the second or third year after sowing [50]. In the southeast region of Australia, where this study took place, perennial ryegrass experiences a period of no net growth during the summer months due to high temperatures and limited soil moisture. However, with the arrival of opening rainfall and the decline in temperature during autumn, active growth resumes in perennial ryegrass, providing an ideal time to evaluate persistence [30]. Therefore, pasture measurements collected after the autumn break were utilised to investigate the influence of cultivar, endophyte, and environment on perennial ryegrass persistence. The selected population in this experiment was derived from a pre-grazed sward that had experienced five previous summer periods before the start of this experiment. In contrast, the base population was obtained from remnant seeds of the selected population, with the plants experiencing two summer periods during the experiment. By using both the selected and base populations of the cultivars, this study aimed to examine the impact of short-term and long-term environmental factors on the expression of perennial ryegrass persistence within the same breeding line.
Persistence, along with productivity, is a critical characteristic of perennial pastures [51]. The assessment of pasture persistence can be determined through methods such as plant ground cover estimation or counting the number of plants in a defined area. Additionally, pasture height provides an approximate estimation of the available green feed in a paddock. However, pasture height may indicate plant surviving percentage or pasture density of a pasture population. Over time, a cultivar with poor persistence will experience a decline in annual pasture dry matter production due to the depletion of surviving plants [30]. As a result, there is a close relationship between pasture persistence and variables such as plant ground cover, dry matter yield, plant height, and the number of surviving plants in a sward [29]. Moreover, recent studies showed multispectral vegetation indices have great feasibility to assess persistence of perennial ryegrass at plot scale [24]. Therefore, this study used dry matter yield, fractional ground cover, plant surviving rate, and multispectral vegetation indices to evaluate the persistence of perennial ryegrass cultivars at plot scale and identify potential constraints on their expression of persistence.
The conventional methods employed for assessing pasture persistence within breeding trials and at the paddock scale present significant limitations, relying on destructive, labour-intensive, and non-digital approaches that hinder comprehensive analysis [24,29,30]. These constraints have made it challenging to efficiently phenotype plant traits, impeding the progress of pasture breeding programs. However, recent advances in sensor technology offer a promising avenue to address the challenge of plant phenotyping at scale. This experiment we were able to monitor persistence traits non-destructively throughout the experiment by utilising sensor-based platforms. These high-throughput phenotyping platforms enabled rapid and efficient screening of a large number of plots, maintaining data accuracy and consistency. As this research paper investigates the existing image-based high-throughput approaches for field phenotyping and evaluates their potential to replace conventional methods in pasture breeding programs, it contributes to the broader understanding of how such cutting-edge technologies can propel the advancement of agricultural practices. Therefore, in this experiment, along with high-throughput data from ground-based and airborne remote sensing platforms, the number of surviving plants, pasture height, pasture herbage yield, are used as indicators to assess the persistence of selected cultivars.
The presence of endophyte in perennial ryegrass may significantly improve the persistence of perennial ryegrass in temperate environments by enhancing protection from insect attack and water deficit conditions [52]. The fixed effect of endophyte infection of selected cultivar–endophyte combinations suggests that infection of endophyte may improve herbage dry matter yield, surviving plant percentage, and ground cover (Table 3). The selected population of cultivars with novel endophytes; Samson AR37 and One50 AR37, showed greater persistence than breeding lines with standard enodophytes: Samson SE and One50 SE. Our results suggest that novel endophytes such as AR37 may be more effective than standard endophytes (SEs) as these novel endophytes improved dry matter yield, resistance against biotic and abiotic stresses [53], and competition with other pasture species. Sutherland and Hoglund, 1989 [54], discovered that endophyte-infected ryegrass cultivars are more resistant to Argentine stem weevil and offered better persistence and higher dry matter yields than endophyte-free perennial ryegrasses. However, they are also more competitive against white clover and can reduce clover dry matter yield and persistence. Recent studies reported that there is a positive effect of novel endophyte on perennial ryegrass dry matter yield in the temperate region of New Zealand particularly during autumn and summer [14] and under subtropical conditions [53]. The findings of these recent studies agreed with the observed pattern of pasture measurements in our study. However, infection with endophyte in perennial ryegrass plants did not change the expression of some plant traits, such as plant height (Table 3).

4.2. Effect of the Environment on the Expression of Pasture Persistence

In the temperate region of Australia, pasture persistence is influenced by a combination of primary climatic conditions, defoliation, and diseases [15]. In this experiment, the base and selected population offered a long-term and short-term environmental effect on pasture persistence. Our results indicated that the population type had a significant fixed effect on the expression of all measured pasture measurements. Over time, the selected population may have undergone selection pressure, leading to the development of stronger genotypes that exhibit higher dry matter yields, greater ground cover, increased plant survival, and taller plant height. Adaption of the selected population explains its superior performance in terms of these phenotypic traits [55]. Additionally, the harvesting year was identified as a short-term environmental influence on the expression of plant phenotypic traits. The fixed effect of the harvest year was significant for all measured parameters (Table 3). Individual genotypes within the selected population may have developed adaptations to specific environmental conditions experienced during different harvesting years. The variations observed in terms of dry matter yield, ground cover, plant survival, and plant height in both the 2019 and 2020 autumn harvests may be attributed to differences in primary climatic conditions during the experiment. The distribution of rainfall in different seasons can significantly impact on pasture dry matter yield and plant survival [56]. Frequent rainfall events were recorded in the summer of 2019, potentially increasing soil moisture compared with the previous year. This change in environmental conditions may have triggered the activation of dormant ryegrass buds, leading to their premature death when exposed to subsequent hot and dry summer conditions. Failure to produce new buds during suitable growing conditions can result in a decrease in plant density [57]. The observed decrease in plant survival percentage of all cultivars at the 2020 autumn harvest may be influenced by fluctuations in primary climatic factors, including temperature and rainfall (Figure 4). Thus, changes in short-term environmental factors during the harvest year were significant contributors to the variation in perennial ryegrass persistence [58]. However, the impact of these environmental factors on the persistence of the selected populations was minor compared with their respective base populations. Nevertheless, the expression patterns of pasture traits in both populations may depend on the interactions among perennial ryegrass genotypes, endophytes, and environmental factors.

4.3. Interaction of Cultivar, Endophyte, and Environment

The REML analysis conducted in this experiment revealed an interaction between perennial ryegrass cultivars and endophytes in the expression of persistence within a given environment. The perennial ryegrass cultivars exhibited higher dry matter yields, ground cover, and plant survival percentages when interacting with endophytes or the environment. For instance, endophyte AR1 improved dry matter yield when paired with Alto but decreased dry matter yield when paired with Samson. Among the cultivars, the selected populations of Alto AR37, Samson AR37, and One50 AR37 showed the most stable cultivar–endophyte interactions in terms of persistence. The AR37 endophyte, that produces a complex of janthitrems and lacks the alkaloids found in wild-type endophytes [59] may contribute to enhance of persistence in a given environment. A recent study reported that the presence of the AR37 endophyte in the cultivar Alto increased the survival rate [60]. However, the expression of persistence in perennial ryegrass cultivars did not vary significantly due to rainfall and temperature variations during the growing periods. Therefore, of the endophytes tested in this study, AR37 endophyte appears to be the most suitable strain for enhancing persistence in the southwest region of Victoria.
The occurrence and performance of endophytes can be influenced by plant genotype and environmental factors, and the genomic information of endophytes can undergo changes through natural selection [55]. Thus, the observed persistence of perennial ryegrass can be influenced by the interaction between endophytes and the environment and between cultivars and the environment. Moreover, the persistence of perennial ryegrass is attributed to three-way interactions among cultivar, endophyte, and environmental factors, whether they are long-term or short-term in nature. These complex interactions highlight the multifaceted nature of persistence in perennial ryegrass and emphasise the need to consider both genetic and environmental factors in breeding and management practices.

5. Conclusions

The experiment aimed to investigate the factors influencing the persistence of perennial ryegrass in the temperate region of Australia, focusing on cultivar, endophyte, and environmental factors. The results revealed that the selected population exhibited higher dry matter yields, ground cover, and plant survival percentages compared with the base population, indicating the importance of long-term environmental effects. Additionally, the presence of the AR37 endophyte, with its unique janthitrem production, was associated with enhanced persistence in specific cultivars such as Alto, Samson, and One50. This study indicated that cultivars exhibit high levels of persistence when cultivars infect with novel endophyte strains. Therefore, this study revealed significant fixed effects of cultivar, endophyte, and environmental factors. Moreover, the interaction between cultivars, endophytes, and environmental factors played a significant role in the expression of persistence. Although variations in rainfall and temperature during growing periods did not significantly impact persistence, the AR37 endophyte emerged as the most suitable strain for enhancing perennial ryegrass persistence in the southwest region of Victoria. These findings highlight the complex interplay of genetic traits, endophyte interactions, and environmental conditions in determining the persistence of perennial ryegrass. This knowledge can guide breeding programs and management strategies to develop improved cultivars with enhanced persistence under diverse environmental conditions. Further research is warranted to unravel the underlying mechanisms of these interactions, aiding in the development of sustainable and resilient perennial ryegrass pastures.

Author Contributions

C.J.: data collection, data analysis, writing-original draft preparation, K.S. and J.J.: supervision, review and editing, A.T.: review and editing. All authors have read and agreed to the published version of the manuscript.

Funding

This research was funded by Dairy Australia, Gardiner Dairy Foundation, and Agriculture Victoria Research under Dairy Feedbase Project.

Data Availability Statement

Data sharing not applicable.

Acknowledgments

We thank DairyBio Hamilton team for their technical assistance during data collection and Kathryn Guthridge, Emma Ludlow, and Inoka Hettiarachchige for genetic analysis.

Conflicts of Interest

The authors declare no conflict of interest.

References

  1. Waller, R.A.; Sale, P.W.G. Persistence and productivity of perennial ryegrass in sheep pastures in south-western Victoria: A review. Aust. J. Exp. Agric. 2001, 41, 117–144. [Google Scholar] [CrossRef]
  2. Kemp, D.R.; Dowling, P.M. Towards sustainable temperate perennial pastures. Aust. J. Exp. Agric. 2000, 40, 125–132. [Google Scholar] [CrossRef]
  3. Cunningham, P.J.; Blumenthal, M.J.; Anderson, M.W.; Prakash, K.S.; Leonforte, A. Perennial ryegrass improvement in Australia. N. Z. J. Agric. Res. 1994, 37, 295–310. [Google Scholar] [CrossRef]
  4. Cunningham, P.; Graves, W.; Chakroun, M.; Mezni, M.; Saidi, S.; Ounejmate, M.; Porqueddu, C.; Reed, K. Novel perennial forage germplasm from North Africa and Sardinia. Aust. Plant Introd. Rev. 1997, 27, 13–46. [Google Scholar]
  5. Fulkerson, W.; Sinclair, K.; Moore, K.; Rolfe, C. Management of Lolium perenne/Trifolium repens pastures in the subtropics. I. Effect of defoliation interval, seeding rate and application of N and lime. Aust. J. Agric. Res. 1993, 44, 1947–1958. [Google Scholar] [CrossRef]
  6. Mantri, N.; Patade, V.; Penna, S.; Ford, R.; Pang, E. Abiotic Stress Responses in Plants: Present and Future. In Abiotic Stress Responses in Plants: Metabolism, Productivity and Sustainability; Ahmad, P., Prasad, M.N.V., Eds.; Springer: New York, NY, USA, 2012; pp. 1–19. [Google Scholar] [CrossRef]
  7. Anjum, S.; Xie, X.-Y.; Wang, L.-C.; Saleem, M.; Man, C.; Lei, W. Morphological, physiological and biochemical responses of plants to drought stress. Afr. J. Agric. Res. 2011, 6, 2026–2032. [Google Scholar] [CrossRef]
  8. Malcolm, B.; Smith, K.F.; Jacobs, J.L. Perennial pasture persistence: The economic perspective. Crop Pasture Sci. 2014, 65, 713–720. [Google Scholar] [CrossRef]
  9. Bolaric, S.; Barth, S.; Melchinger, A.E.; Posselt, U.K. Molecular characterization of genetic diversity in European germplasm of perennial ryegrass. Euphytica 2005, 146, 39–44. [Google Scholar] [CrossRef]
  10. Guthridge, K.M.; Dupal, M.P.; Kölliker, R.; Jones, E.S.; Smith, K.F.; Forster, J.W. AFLP analysis of genetic diversity within and between populations of perennial ryegrass (Lolium perenne L.). Euphytica 2001, 122, 191–201. [Google Scholar] [CrossRef]
  11. Skøt, L.; Sanderson, R.; Thomas, A.; Skøt, K.; Thorogood, D.; Latypova, G.; Asp, T.; Armstead, I. Allelic Variation in the Perennial Ryegrass flowering locus T Gene Is Associated with Changes in Flowering Time across a Range of Populations. Plant Physiol. 2011, 155, 1013–1022. [Google Scholar] [CrossRef]
  12. Thom, E.R.; Popay, A.J.; Hume, D.E.; Fletcher, L.R. Evaluating the performance of endophytes in farm systems to improve farmer outcomes—A review. Crop Pasture Sci. 2012, 63, 927–943. [Google Scholar] [CrossRef]
  13. Hume, D.E.; Sewell, J.C. Agronomic advantages conferred by endophyte infection of perennial ryegrass (Lolium perenne L.) and tall fescue (Festuca arundinacea Schreb.) in Australia. Crop Pasture Sci. 2014, 65, 747–757. [Google Scholar] [CrossRef]
  14. Popay, A.J.; Hume, D.E.; Davis, K.L.; Tapper, B.A. Interactions between endophyte (Neotyphodium spp.) and ploidy in hybrid and perennial ryegrass cultivars and their effects on Argentine stem weevil (Listronotus bonariensis). N. Z. J. Agric. Res. 2003, 46, 311–319. [Google Scholar] [CrossRef]
  15. Latch, G.C.M. Physiological interactions of endophytic fungi and their hosts. Biotic stress tolerance imparted to grasses by endophytes. Agric. Ecosyst. Environ. 1993, 44, 143. [Google Scholar] [CrossRef]
  16. Culvenor, R.A.; Simpson, R.J. Persistence traits in perennial pasture grasses: The case of phalaris. Crop Pasture Sci. 2014, 65, 1165–1176. [Google Scholar] [CrossRef]
  17. Finch, H.J.S.; Samuel, A.M.; Lane, G.P.F. 21—Grazing management. In Lockhart & Wiseman’s Crop Husbandry Including Grassland, 9th ed.; Finch, H.J.S., Samuel, A.M., Lane, G.P.F., Eds.; Woodhead Publishing: London, UK, 2014; pp. 499–512. [Google Scholar] [CrossRef]
  18. Boschma, S.P.; Hill, M.J.; Scott, J.M.; Lutton, J.J. Carbohydrate reserves of perennial ryegrasses: Effect drought and defoliation intensity. In Proceedings of the Grasslands 2000—Proceedings of the XVIII International Grassland Congress, Winnipeg, MB, Saskatoon, SK, Canada, 8–19 June 1997; pp. 22–42. [Google Scholar]
  19. Frank, D.A.; McNaughton, S.J.; Tracy, B.F. The Ecology of the Earth’s Grazing Ecosystems: Profound functional similarities exist between the Serengeti and Yellowstone. BioScience 1998, 48, 513–521. [Google Scholar] [CrossRef]
  20. Kemp, D.R.; Culvenor, R.A. Improving the grazing and drought tolerance of temperate perennial grasses. N. Z. J. Agric. Res. 1994, 37, 365–378. [Google Scholar] [CrossRef]
  21. Sanford, P.; Cullen, B.R.; Dowling, P.M.; Chapman, D.F.; Garden, D.L.; Lodge, G.M.; Andrew, M.H.; Quigley, P.E.; Murphy, S.R.; King, W.M.; et al. SGS Pasture Theme: Effect of climate, soil factors and management on pasture production and stability across the high rainfall zone of southern Australia. Aust. J. Exp. Agric. 2003, 43, 945–959. [Google Scholar] [CrossRef]
  22. Tozer, K.; Bourdôt, G.W.; Edwards, G.R. What factors lead to poor pasture persistence and weed ingress? NZG Res. Pract. Ser. 2011, 15, 129–137. [Google Scholar] [CrossRef]
  23. Brougham, R.W. Some factors affecting the persistency of short-rotation ryegrass. N. Z. J. Agric. Res. 1961, 4, 516–522. [Google Scholar] [CrossRef]
  24. Jayasinghe, C.; Badenhorst, P.; Jacobs, J.; Spangenberg, G.; Smith, K. Image-based high-throughput phenotyping for the estimation of persistence of perennial ryegrass (Lolium perenne L.)—A review. Grass Forage Sci. 2021, 76, 321–339. [Google Scholar] [CrossRef]
  25. Pratap, A.; Tomar, R.; Kumar, J.; Pandey, V.R.; Mehandi, S.; Katiyar, P.K. High-Throughput Plant Phenotyping Platforms. In Phenomics in Crop Plants: Trends, Options and Limitations; Kumar, J., Pratap, A., Kumar, S., Eds.; Springer: New Delhi, India, 2015; pp. 285–296. [Google Scholar] [CrossRef]
  26. Araus, J.L.; Cairns, J.E. Field high-throughput phenotyping: The new crop breeding frontier. Trends Plant Sci. 2014, 19, 52–61. [Google Scholar] [CrossRef]
  27. Qiu, Q.; Sun, N.; Bai, H.; Wang, N.; Fan, Z.; Wang, Y.; Meng, Z.; Li, B.; Cong, Y. Field-Based High-Throughput Phenotyping for Maize Plant Using 3D LiDAR Point Cloud Generated With a “Phenomobile”. Front. Plant Sci. 2019, 10, 554. [Google Scholar] [CrossRef]
  28. Gebremedhin, A.; Badenhorst, P.; Wang, J.; Giri, K.; Spangenberg, G.; Smith, K. Development and Validation of a Model to Combine NDVI and Plant Height for High-Throughput Phenotyping of Herbage Yield in a Perennial Ryegrass Breeding Program. Remote Sens. 2019, 11, 2494. [Google Scholar] [CrossRef]
  29. Jayasinghe, C.; Badenhorst, P.; Wang, J.; Jacobs, J.; Spangenberg, G.; Smith, K. An Object-Based Image Analysis Approach to Assess Persistence of Perennial Ryegrass (Lolium perenne L.) in Pasture Breeding. Agronomy 2019, 9, 501. [Google Scholar] [CrossRef]
  30. Jayasinghe, C.; Badenhorst, P.; Jacobs, J.; Spangenberg, G.; Smith, K. High-Throughput Ground Cover Classification of Perennial Ryegrass (Lolium perenne L.) for the Estimation of Persistence in Pasture Breeding. Agronomy 2020, 10, 1206. [Google Scholar] [CrossRef]
  31. Siebring, J.; Valente, J.; Domingues Franceschini, M.H.; Kamp, J.; Kooistra, L. Object-Based Image Analysis Applied to Low Altitude Aerial Imagery for Potato Plant Trait Retrieval and Pathogen Detection. Sensors 2019, 19, 5477. [Google Scholar] [CrossRef] [PubMed]
  32. Donaghy, D.; Fulkerson, B. Principles for Developing an Effective Grazing Management System for Ryegrass-Based Pastures. 1999. Available online: https://www.dairyaustralia.com.au/resource-repository/2020/07/08/principles-for-developing-an-effective-grazing-management-system-for-ryegrass-based-pastures (accessed on 24 July 2019).
  33. Alem, G.; Badenhorst, P.E.; Wang, J.; Spangenberg, G.C.; Smith, K.F. Prospects for Measurement of Dry Matter Yield in Forage Breeding Programs Using Sensor Technologies. Agronomy 2019, 9, 65. [Google Scholar]
  34. Hunt, R.; Hively, W.; McCarty, G.; Daughtry, C.; Forrestal, P.; Kratochvil, R.; Carr, J.; Allen, N.; Fox-Rabinovitz, J.; Miller, C. NIR-Green-Blue High-Resolution Digital Images for Assessment of Winter Cover Crop Biomass. GIScience Remote Sens. 2011, 48, 86–98. [Google Scholar] [CrossRef]
  35. Fu, Y.; Yang, G.; Wang, J.; Feng, H. A comparative analysis of spectral vegetation indices to estimate crop leaf area index. Intell. Autom. Soft Comput. 2013, 19, 315–326. [Google Scholar] [CrossRef]
  36. Haboudane, D.; Miller, J.R.; Tremblay, N.; Zarco-Tejada, P.J.; Dextraze, L. Integrated narrow-band vegetation indices for prediction of crop chlorophyll content for application to precision agriculture. Remote Sens. Environ. 2002, 81, 416–426. [Google Scholar] [CrossRef]
  37. Prabhakara, K.; Hively, W.D.; McCarty, G.W. Evaluating the relationship between biomass, percent groundcover and remote sensing indices across six winter cover crop fields in Maryland, United States. Int. J. Appl. Earth Obs. Geoinf. 2015, 39, 88–102. [Google Scholar] [CrossRef]
  38. Jordan, C.F. Derivation of Leaf-Area Index from Quality of Light on the Forest Floor. Ecology 1969, 50, 663–666. [Google Scholar] [CrossRef]
  39. Gitelson, A.A.; Viña, A.; Ciganda, V.; Rundquist, D.C.; Arkebauer, T.J. Remote estimation of canopy chlorophyll content in crops. Geophys. Res. Lett. 2005, 32, 688. [Google Scholar] [CrossRef]
  40. Sripada, R.; Heiniger, R.; White, J.; Meijer, A. Aerial Color Infrared Photography for Determining Early In-Season Nitrogen Requirements in Corn. Agron. J. 2006, 98, 200. [Google Scholar] [CrossRef]
  41. Louhaichi, M.; Borman, M.M.; Johnson, D.E. Spatially Located Platform and Aerial Photography for Documentation of Grazing Impacts on Wheat. Geocarto Int. 2001, 16, 65–70. [Google Scholar] [CrossRef]
  42. Vincini, M.; Frazzi, E. Comparing narrow and broad-band vegetation indices to estimate leaf chlorophyll content in planophile crop canopies. Precis. Agric. 2011, 12, 334–344. [Google Scholar] [CrossRef]
  43. Woebbecke, D.M.; Meyer, G.E.; Von Bargen, K.; Mortensen, D.A. Color Indices for Weed Identification Under Various Soil, Residue, and Lighting Conditions. Trans. ASAE 1995, 38, 259–269. [Google Scholar] [CrossRef]
  44. Payero, J.O.; Christopher, N.; Wright, J.L. Comparison of eleven vegetation indices for estimating plant height of alfalfa and grass. Appl. Eng. Agric. 2004, 20, 57. [Google Scholar] [CrossRef]
  45. Gitelson, A.A.; Kaufman, Y.J.; Stark, R.; Rundquist, D. Novel algorithms for remote estimation of vegetation fraction. Remote Sens. Environ. 2002, 80, 76–87. [Google Scholar] [CrossRef]
  46. Tucker, C.J. Red and photographic infrared linear combinations for monitoring vegetation. Remote Sens. Environ. 1979, 8, 127–150. [Google Scholar] [CrossRef]
  47. Sripada, R. Determining In-Season Nitrogen Requirements for Corn Using Aerial Color-Infrared Photography. 2005. Available online: https://repository.lib.ncsu.edu/handle/1840.16/4200 (accessed on 24 July 2019).
  48. Jago, R.A.; Cutler, M.E.J.; Curran, P.J. Estimating Canopy Chlorophyll Concentration from Field and Airborne Spectra. Remote Sens. Environ. 1999, 68, 217–224. [Google Scholar] [CrossRef]
  49. Chen, P.-F.; Nicolas, T.; Wang, J.-H.; Philippe, V.; Huang, W.-J.; Li, B.-G. New Index for Crop Canopy Fresh Biomass Estimation. Spectrosc. Spectr. Anal. 2010, 30, 512–517. [Google Scholar] [CrossRef]
  50. Wilkins, P.W. Breeding perennial ryegrass for agriculture. Euphytica 1991, 52, 201–214. [Google Scholar] [CrossRef]
  51. Cullen, B.R.; Rawnsley, R.P.; Eckard, R.J.; Christie, K.M.; Bell, M.J. Use of modelling to identify perennial ryegrass plant traits for future warmer and drier climates. Crop Pasture Sci. 2014, 65, 758–766. [Google Scholar] [CrossRef]
  52. Hume, D.E.; Barker, D.J. Growth and Management of Endophytic Grasses in Pastoral Agriculture. In Neotyphodium in Cool-Season Grasses; John Wiley & Sons: Hoboken, NJ, USA, 2005; pp. 201–226. [Google Scholar] [CrossRef]
  53. Lowe, K.F.; Bowdler, T.M.; Hume, D.E.; Casey, N.D.; Tapper, B.A. The effect of endophyte on the performance of irrigated perennial ryegrasses in subtropical Australia. Aust. J. Agric. Res. 2008, 59, 567–577. [Google Scholar] [CrossRef]
  54. Sutherland, B.L.; Hoglund, J.H. Effcet of ryegrass containing the endophyte (Acremonium lolii), on the performance of associated white clover and subsequent crops. Proc. N. Z. Grassl. Assoc. 1989, 50, 265–269. [Google Scholar]
  55. Cashman, P.; Gilliland, T.; McEvoy, M.; Watson, S.; O’Donovan, M. Changes in plant morphological expression in 12 perennial ryegrass cultivars following frequent and infrequent cutting management. J. Agric. Sci. 2015, 154, 456–471. [Google Scholar] [CrossRef]
  56. Kaloki, P.; Trethowan, R.; Tan, D.K.Y. Effect of genotype × environment × management interactions on chickpea phenotypic stability. Crop Pasture Sci. 2019, 70, 453–462. [Google Scholar] [CrossRef]
  57. Biddiscombe, E.; Rogers, A.; Maller, R. Summer dormancy, regeneration and persistence of perennial grasses in south-western Australia. Aust. J. Exp. Agric. 1977, 17, 795–801. [Google Scholar] [CrossRef]
  58. Nie, Z.; Norton, M.R. Stress Tolerance and Persistence of Perennial Grasses: The Role of the Summer Dormancy Trait in Temperate Australia. Crop Sci. 2009, 49, 2405–2411. [Google Scholar] [CrossRef]
  59. Tian, P.; Le, T.-N.; Ludlow, E.J.; Smith, K.F.; Forster, J.W.; Guthridge, K.M.; Spangenberg, G.C. Characterisation of novel perennial ryegrass host-Neotyphodium endophyte associations. Crop Pasture Sci. 2013, 64, 716–725. [Google Scholar] [CrossRef]
  60. Faville, M.J.; Crush, J.R.; Hong, W.; Phillips, H.; Lee, J.M.; Chapman, D. Effects of pasture age on the genotype and phenotype of perennial ryegrass. Grass Forage Sci. 2020, 75, 135–144. [Google Scholar] [CrossRef]
Figure 1. Simplified process of pasture plant height extraction (a) a modified side-by-side vehicle, (b) data extraction process in QGIS 3.12.3 (c) enlarged area of the dark square in image (b) where red colour dots represent georectified plant height and black polygons are row boundaries. Both point vector points and row plot polygons are overlayed on pseudocolour rendered NIR raster band.
Agronomy 13 02292 g001
Figure 2. Simplified orthomosaic generating process using aerial multispectral images, (a) the flight path (b) image alignment and 3D point cloud along the flight path and (c) a georectified NIR orthomosaic raster where the band was rendered using pseudocolour (spectral) to visualise intensity variations in the NIR band across the experiment.
Agronomy 13 02292 g002
Figure 3. Perennial ryegrass ground cover extraction pipeline (a) radiometrically calibrated orthomosaic raster band where the band was rendered using pseudocolour (spectral) to visualise intensity variations across the study site, (b) green fraction classification in eCognition developer, (c) enlarged area of the light brown square in image (b) where green area represents living pasture ground cover and light brown polygons is boundaries of row plots.
Agronomy 13 02292 g003
Figure 4. Changes in monthly mean, maximum and minimum temperate, and monthly total rainfall during the experimental period (May 2018−May 2020).
Agronomy 13 02292 g004
Figure 5. (a) Endophyte frequency of selected cultivars in original seed samples, tested in 2014 () and 2020 (▨), (b) endophyte frequency of perennial ryegrass populations in the base () and the selected population (▨) in each cultivar in 2021.
Agronomy 13 02292 g005
Figure 6. Plot level average DM yield in 2019 and 2020 autumn. Values are means (±SE) of n = 4, where ▧ base population of 2019 autumn, □ selected population of 2019 autumn, ■ base population of 2020 autumn, selected population of 2020 autumn. Two side error bars represent the standard error of reported measurements at 95% confidence interval.
Agronomy 13 02292 g006
Figure 7. Row level plant surviving percentage, where ▧ base population of 2019 autumn, □ selected population of 2019 autumn, base population of 2020 autumn, ■ selected population of 2020 autumn. Two side error bars represent standard error of reported.
Agronomy 13 02292 g007
Figure 8. Row level average plant height, where ▧ base population of 2019 autumn, □ selected population of 2020 autumn, ■ base population of 2020 autumn, selected population of 2020 autumn. Two side error bars represent the standard error of reported measurements at 95% confidence interval.
Agronomy 13 02292 g008
Figure 9. Row level plant ground cover, where ▧ base population of 2019 autumn, □ selected population of 2019 autumn, ■ base population of 2020 autumn, selected population of 2020 autumn. Two side error bars represent the standard error of reported measurements at a 95% confidence interval.
Agronomy 13 02292 g009
Figure 10. The correlogram for ground truth data (plant surviving % and ground cover) and multispectral vegetation indices; plot (a) 2019 autumn data (b) represents 2020 autumn data. Positive correlations are displayed in blue and negative correlations in red colour. The colour intensity and the size of the circle are proportional to the correlation coefficients and “×” indicates that no linear relationship exists between two variables.
Agronomy 13 02292 g010
Table 1. Details of UAV image acquisition and orthomosaicing quality summary.
Image Acquisition DateImage Overlap
Forward/Side
Flight Speed
(m/s)
Flight Height
(m)
Mean RMS Error (m)GSD
(cm/pixels)
2019 Autumn80%/75%6300.0192.26
2020 Autumn80%/75%6300.0102.16
Table 2. The list of vegetation indices derived from multispectral bands.
Vegetation IndexAbbreviationEquation
Normalised Difference Vegetation IndexNDVI(Rn − Rr)/(Rn + Rr) [33]
Green Normalised Difference Vegetation IndexGNDVI(Rn − Rg)/(Rn + Rg) [34]
Red Edge Normalised Difference Vegetation IndexReNDVI(Rn − Rre)/(Rn + Rre)
Renormalised Difference Vegetation IndexRDVI(Rn − Rr)/(Rn + Rr)1/2 [35]
Soil Adjusted Vegetation IndexSAVI(Rn − Rr)/(Rn + Rr + 0.5) × (1 + 0.5) [36]
Normalised green-red Difference IndexNGRDI(Rg − Rr)/(Rg + Rr) [37]
Simple Ratio IndexSRIRn/Rr [38]
Red Edge Simple Ratio IndexReSRIRn/Rre [39]
Green Simple Ratio IndexGSRIRn/Rg [40]
Green Leaf IndexGLI(2 × Rg − Rr- Rb)/(2 × Rg + Rr + Rb) [41]
Chlorophyll Vegetation IndexCVIRn × Rr/Rg [42]
Normalised Green IntensityNGIRg/(Rr + Rg + Rb) [43]
Infrared Percentage Vegetation IndexIPVIRn/(Rn + Rr) [44]
Visible Atmospherically Resistant IndexVARI(Rn − Rr)/(Rr + Rg + Rb) [45]
Red Difference IndexRDIRn − Rr [46]
Green Difference IndexGDIRn − Rg [47]
Canopy Chlorophyll Concentration IndexCCCI((Rn − Rre)/(Rn + Rre))/NDVI [48]
Core Red Edge Triangular Vegetation IndexCReTVI100(Rn − Rre) − 10(Rn − Rg) [49]
Rn: reflectance of NIR band; Rr: reflectanceof red band; Rre: reflectance of red edge band; Rb: reflectance of blue band; and Rg: reflectance of green band.
Table 3. Summary of REML outcome for measured sensor-based and manual pasture measurements where cultivar, endophyte, population type, and harvest year were considered as fixed factors.
Variable
HYPSPGCPHNDVIGNDVIRDVISAVISRIIPVIRDIGLI
Host grass <0.0010.0060.0030.1860.0550.09430.0570.049<0.0010.058<0.0010.027
Endophyte<0.001<0.001<0.0010.07<0.001<0.001<0.001<0.001<0.001<0.001<0.001<0.001
Population<0.001<0.001<0.001<0.001<0.001<0.001<0.001<0.001<0.001<0.001<0.001<0.001
Season<0.001<0.001<0.001<0.001<0.001<0.001<0.001<0.001<0.001<0.001<0.001<0.001
Host grass × Endophyte<0.001<0.0039<0.0010.336<0.001<0.001<0.001<0.001<0.001<0.001<0.001<0.001
Host grass × Population<0.001<0.0010.0120.069<0.001<0.001<0.001<0.001<0.001<0.001<0.001<0.001
Endophyte × Population<0.001<0.001<0.0010.047<0.001<0.001<0.001<0.001<0.001<0.001<0.001<0.001
Host grass × Season0.280.0010.0010.7490.0550.1540.0550.0590.0630.0550.2620.474
Endophyte × Season0.356<0.001<0.0010.53<0.001<0.001<0.001<0.001<0.001<0.001<0.0010.003
Population × Season<0.001<0.001<0.0010.028<0.001<0.001<0.001<0.001<0.001<0.001<0.001<0.001
Host grass × Endophyte × Population0.0030.2910.8960.3460.0810.0870.0710.074<0.0010.0710.2620.027
Host grass × Endophyte × Season0.8310.212<0.0010.635<0.001<0.001<0.001<0.001<0.001<0.001<0.0010.273
Host grass × Population × Season0.3950.0060.0010.5620.0790.080.0790.080.0090.0890.2010.038
Endophyte × Population × Season 0.192<0.001<0.0010.335<0.001<0.001<0.001<0.001<0.001<0.001<0.001<0.001
HY: herbage yield; PSP: plant surviving percentage; GC: ground cover; PH: plant height; abbreviations for vegetation indices are similar to Table 2. In cell show p-value for fixed effect or interaction effect at 95% confidence level. In REML analysis, F-tests are calculated using algebraic derivatives, ignoring fixed/boundary/singular variance parameters.
Disclaimer/Publisher’s Note: The statements, opinions and data contained in all publications are solely those of the individual author(s) and contributor(s) and not of MDPI and/or the editor(s). MDPI and/or the editor(s) disclaim responsibility for any injury to people or property resulting from any ideas, methods, instructions or products referred to in the content.

