Article

Effects of Combined Application of Biological Agent and Fertilizer on Fungal Community Structure in Rhizosphere Soil of Panax notoginseng

1
Faculty of Modern Agricultural Engineering, Kunming University of Science and Technology, Kunming 650500, China
2
Yunnan Provincial Field Scientific Observation and Research Station on Water-Soil-Crop System in Seasonal Arid Region, Kunming University of Science and Technology, Kunming 650500, China
3
Yunnan Provincial Key Laboratory of High-Efficiency Water Use and Green Production of Characteristic Crops in Universities, Kunming University of Science and Technology, Kunming 650500, China
4
Inner Mongolia Academy of Agricultural and Animal Husbandry Sciences, Hohhot 010031, China
*
Authors to whom correspondence should be addressed.
Agronomy 2023, 13(8), 2093; https://doi.org/10.3390/agronomy13082093
Submission received: 12 July 2023 / Revised: 3 August 2023 / Accepted: 7 August 2023 / Published: 9 August 2023

Abstract

:
The fungal community structure and soil fertility in rhizosphere soil have an important effect on the health of Panax notoginseng (P. notoginseng). The attack of pathogenic fungi and the imbalance of soil fertility can easily lead to diseases. The effect of Bacillus subtilis on improving the community structure of soil fungi has been confirmed, and the corresponding biological agent products have been commercialized. A pot experiment carried out in a greenhouse explored the effect of a biological agent and fertilizer on the fungal community in the rhizosphere of P. notoginseng. In the experiment, fertilization and the addition of biological agents were set up with three gradients, respectively, and the full coupling experiment was adopted, and the blank control group (CK) was set up at the same time. Therefore, there were thirteen treatments in the experiment. NH4 decreased between 36.42% and 11.56%, AP increased between 6.03% and 92.46%, AK increased between 2.99% and 25.40%, TN increased between 0.10% and 9.41%, and TP increased by 18.25% to 47.73% The addition of Bacillus subtilis biological agent decreased the Chao1, Shannon, Simpson, and ACE index of fungi in the rhizosphere soil of P. notoginseng. The Chao1 index decreased between 0.39% and 78.22%; the ACE index decreased between 0.43% and 78.24%. The main pathogenic fungi Cylindrocarpon and Fusarium of P. notoginseng were different in the experimental results. Cylindrocarpon decreased under F1C1, F2C1, and F3C2 treatments, while Fusarium increased under F1C1, F2C2, F3C1, and F3C3 treatments and decreased Fusarium content in rhizosphere soil of P. notoginseng in other treatments. RDA analysis (Redundancy analysis) showed that NH4-N was negatively correlated with the main pathogen Cylindrocarpon, Fusarium, and Ilyonectria, while AP and AK were positively correlated with Cylindrocarpon, Fusarium, and Ilyonectria. The results of the GRA-TOPSIS analysis showed that the score of F3C2 was the highest, while F2C3 and F2C1 ranked second and third, respectively. The calculation results of the theoretical model based on GRA-TOPSIS analysis showed that the GRA-TOPSIS score was highest when the theoretical optimal fertilizer application rate and bacteria application rate were 116.31 kg hm−2 and 15.83 kg hm−2, respectively.

1. Introduction

P. notoginseng is a perennial herb preferring moisture and shade. The main root has high medicinal value. P. notoginseng is mainly produced in southwest China (Yunnan and Guangxi). Previous studies have shown that P. notoginseng is mostly used to stop bleeding and treat cardiovascular diseases [1,2]. At the same time, P. notoginseng also plays a role in anti-thrombosis, lowering blood pressure and relieving pain and neuroprotection [3,4]. With the increase of cardiovascular diseases in the world and the modern application of traditional Chinese medicine, the demand for P. notoginseng is increasing [5,6]. At present, the research on P. notoginseng focuses on water and fertilizer management, pesticide residues, and pest control [7,8,9]. Water and fertilizer management in the field of P. notoginseng is very important for the sustainable cultivation of the crop. Water and fertilizer mismanagement will lead to soil consolidation, nutrient loss, agricultural pollution, and low efficiency of water and fertilizer use. Pesticide spraying is not only the main means to prevent insect pests but also an important aspect to ensure yield. Excessive pesticide spraying will, however, lead to pesticide residues. In the actual planting process, yield was seriously restricted by diseases. Such as root rot, black spot, and round spot [10]. Previous studies have shown that root rot is the main cause of yield reduction, with annual losses of up to 30% [11]. Continuous cropping obstacles not only reduce the quality and yield but also affect the health of planting soil and limit the planting area [12]. However, the main reason for the production issues is the imbalance of fungal structure in soil and the increase of pathogenic bacteria [13]. The main pathogens causing root rot are Cylindrocarpon, Fusarium, and Ilyonectria [14], while Alternaria causes black leaf disease [15].
Rhizosphere soil is the main active area of crop roots [16], so the structure and fertility of rhizosphere soil microorganisms play a very important role in crop growth [17,18]. The accumulation of P. notoginseng saponins is greatly affected by soil water content and fertilizer application [19]. Previous studies have shown that the structure of the soil microorganism community changes significantly with the increase in fertilizer application [20]. Fertilization not only changes the content of nutrients in the soil but also changes the structure of the microbial community in the soil, which in turn affects the transport of soil nutrients and inhibits or increases plant morbidity. The relationship between microorganisms and crops in rhizosphere soil is generally divided into positive interaction, negative interaction and non-interaction [21]. Positive microorganisms are not only involved in the growth and development of crops, but also one of the key factors to ensure plant health and soil fertility [22,23]. For example, plant growth-promoting rhizobacteria (PGPR) and arbuscular mycorrhizal (AM) fungi enhance plant nutrition, improve plant growth and protect host plants from pathogen infection [24,25,26]. Although plants benefit from some rhizosphere microorganisms, some microbes also spread diseases [27]. Plant diseases caused by soil fungi can greatly reduce crop yield and even lead to crop death in serious cases [28]. In summary, in the process of planting P. notoginseng, the characteristics of the rhizosphere soil fertility and fungal community jointly affected the health and final yield of P. notoginseng.
Many microbes have the ability to promote plant growth [29,30,31]. These microbes promote plant growth by producing compounds that stimulate plant growth or inducing plants to produce antibiotics [32,33]. Bacillus subtilis is a kind of thermophilic and aerobic Gram-positive rod-shaped bacteria. Its endospores are heat-resistant, drought-resistant, and UV-resistant [34]. Previous studies have shown that a variety of secondary metabolites produced by Bacillus subtilis have the potential to mediate the production of antibiotics. It is estimated that at least 4% to 5% of the genome of any given group of Bacillus subtilis is used to produce antimicrobial compounds (AMCs) [35]. These molecules are mainly antimicrobial peptides (AMPs) and contain special parts, such as D-amino acids (AA) or intramolecular thioether bonds, whose overall structure is usually cyclic and has some hydrophobicity [36]. Bacillus subtilis can enhance plant resistance by secreting extracellular polysaccharides to iron carriers to inhibit the movement of toxic ions, maintain the movement of water molecules in plant tissues, and inhibit pathogenic microorganisms in soil [37]. Previous experiments have shown that adding Bacillus subtilis to farmland can not only reduce nitrogen and ammonia emissions [38] but also improve soil colony structure [39]. Bacillus subtilis performs well in the control of tomato blight [40]. Therefore, we hope to explore whether Bacillus subtilis can inhibit pathogenic microorganisms in the production process of P. notoginseng. Due to the potential of Bacillus subtilis to secrete antimicrobial compounds, it is possible to improve the rhizosphere soil microenvironment of P. notoginseng. On this basis, we speculated that adding Bacillus subtilis could improve the fungal community in the rhizosphere soil of P. notoginseng and inhibit a series of pathogenic fungi in the rhizosphere soil.
In this study, we applied biological agents together with fertilizer for the first time to reduce the pathogenic bacteria in Panax notoginseng soil through the improvement effect of biological agents on the soil fungal community. Therefore, this study introduced Bacillus subtilis biological agent as an exogenous additive bacteria, hoping to explore the possibility of Bacillus subtilis in improving the rhizosphere soil microenvironment of P. notoginseng by way of co-application with fertilizer. The aims of this study are to explore: (1) the effect of fertilization on the nutrient characteristics in the rhizosphere; (2) the structural characteristics of the microenvironment in the rhizosphere under different bacterial and fertilizer combinations; (3) whether the addition of Bacillus subtilis can inhibit the pathogenic bacteria in the rhizosphere; and (4) the potential of adding Bacillus subtilis to improve the rhizosphere.

2. Materials and Methods

2.1. Experimental Site and Experimental Setup

Yunnan has more suitable climatic conditions for the growth of P. notoginseng. In March 2021, we transplanted P. notoginseng from the Intelligent Agriculture Demonstration Greenhouse at Kunming University of Science and Technology (24°50′49.95″ N, 102°5′37.54″ E, 1778.9 m above sea level). Eight hundred grams of soil was loaded into a PVC basin with upper and lower diameters of 18 cm and 13 cm and a height of 15 cm. Fifteen days later, the transplant that did not survive was removed. P. notoginseng with similar growth was then selected to be taken further in the experiment. The potting soil was collected from the forest soil of Kunming University of Technology. The soil pH was 7.61, and the soil ammonium nitrogen (NH4-N), total nitrogen (TN), available phosphorus (AP), total phosphorus (TP), and available potassium (AK) were 34.67 mg·kg−1, 38.22 mg·kg−1, 80.27 mg·kg−1, 433.75 mg·kg−1, and 35.24 mg·kg−1, respectively. According to the results of previous studies [41,42], there were three gradients fertilizer application and the Bacillus subtilis biological agent in which the fertilizer application rate was 80 kg·hm−2 with the low fertilizer application, 110 kg·hm−2 with medium and 140 kg·hm−2 with high fertilizer application, 10 kg·hm−2 with low bacterial application, 15 kg·hm−2 with medium bacterial application, and 20 kg·hm−2 with high bacterial application. The current experiment used the full combination and set up a blank control group, a total of 10 treatment groups, each treatment group repeated three times. The treatments were as follows (Table 1): low fertilizer and low bacteria (F1C1), low fertilizer and medium bacteria (F1C2), low fertilizer and high bacteria (F1C3), medium fertilizer and low bacteria (F2C1), medium fertilizer bacteria (F2C2), medium fertilizer and high bacteria (F2C3), high fertilizer and low bacteria (F3C1), high fertilizer and medium bacteria (F3C2), high fertilizer and high bacteria (F3C3), and the blank control group (CK). Each treatment of processing was repeated three times. Organic carbon water-soluble fertilizer (21%N − 21%P2O5 − 21%K2O + 6% humic acid + trace elements). The contents of chelated iron(Fe), chelated zinc(Zn), chelated copper(Cu), chelated manganese(Mn), boron(B), and molybdenum(Mo) were 0.05%, 0.05%, 0.017%, 0.05%, 0.1%, and 0.007%, produced by Sichuan Shifang Demi Industrial Co., Ltd., Shifang City, China, and Bacillus subtilis (enhanced microbial agent, implementation Standard: GB 20287-2006). A bacterial fertilizer produced by Shandong Suyuan Ecological Agriculture Development Co., Ltd., Dezhou City, China was used in the experiment.

2.2. Determination of Soil Physical and Chemical Properties

After the completion of the harvest, three replicates of the soil from each treatment were collected and brought back to the laboratory for related data determination. The indexes using fresh soil were determined as soon as the soil arrived in the laboratory. The indexes that could be determined from air-dried soil were placed in a ventilated and sheltered place to be tested later. All samples were tested at the same time to ensure that the results were not disturbed by temperature, humidity, or chemical batch variation. pH was determined by PHS-3C using a pH acidity meter, NH4-N by extraction colorimetry, TN by Kjeldahl nitrogen meter, AP and TP by molybdenum antimony sulfate colorimetric method, The content of AK was determined by using an ammonium acetate extraction atomic absorption spectrophotometer.

2.3. DNA Extraction and Amplification

The rhizosphere soil was quickly frozen and preserved in liquid nitrogen at −80 °C. Fungus DNA was isolated using a DNeasy PowerSoil kit (Qiagen, Hilden, Germany) following the manufacturer’s instructions. DNA concentration and integrity were measured by a NanoDrop 2000 spectrophotometer (Thermo Fisher Scientific, Waltham, MA, USA) and agarose gel electrophoresis, respectively. Fungal ITS diversity identification corresponding region: front primer: ITS1 FCTTGGTCATTTAGAGGAAGTAA’; back-end primer: ITS2 GCTGCGTTCTTCATCGATGC. The PCR products were detected by electrophoresis, purified by magnetic beads, purified as a second round of PCR template, and then amplified by two rounds of PCR and detected again by electrophoresis. After detection, magnetic beads were used to purify the PCR products. After purification, the PCR products were quantified by Qubit. The same amounts of samples were mixed according to the concentration of PCR products and sequenced on the computer. The Amplicon quality was visualized using gel electrophoresis. The PCR products were purified with Agencourt AMPure XP beads (Beckman Coulter Co., Brea, CA, USA) and quantified using Qubit dsDNA assay kit. The concentrations were then adjusted for sequencing. Sequencing was performed on an IlluminaNovaSeq6000 with two paired-end read cycles of 250 bases each. (Illumina Inc., San Diego, CA, USA; OEBiotech Company; Shanghai, China)

2.4. Bioinformatic Analysis

Raw sequencing data were done in FASTQ format. Paired-end reads were then preprocessed using Cutadapt (Version 2.6) software to detect and cut off the adapter. After trimming, paired-end reads were filtered low-quality sequences, denoised, merged, and detected and cut off the chimera reads using DADA2 with the default parameters of QIIME2 [43] (November 2020). The final product was the representative reads and the ASV abundance table.
The representative sequences of each ASV are selected by using the QIIME 2 software package compared with the Unite database (https://unite.ut.ee/repository.php (accessed on 17 March 2023)). Species comparison annotations were analyzed using default parameters of q2-feature-classifier software (Version 2022.2.0-1).
The soil’s physical and chemical properties were processed by Microsoft Excel 2016 and SPSS 22 to use in the statistical analysis via the Duncan method [44]. The vegan package in R (Version 3.5.1) was used to draw heat maps and the composition of fungal communities for principal coordinate analysis (PCoA). The effects of physical and chemical properties of the rhizosphere soil on fungal microorganisms in rhizosphere soil were analyzed by redundancy analysis (RDA) in Canoco 5.0. Indicator analysis was completed by R (Version 3.5.1); random forest analysis was drawn by R package randomForest (Version 4.7-1.1); GRA-TOPSIS analysis was completed by Python 3.9; theoretical model was established and solved by MATLAB (r2020a); theoretical model function diagram was drawn by Origin 2018.

3. Results

3.1. Physical and Chemical Properties of Rhizosphere Soil of P. notoginseng

The nutrient characteristics of the rhizosphere soil of P. notoginseng are shown in Table 2. Generally, the soil pH was between 7.32 and 7.55 and slightly alkaline. The results indicated that the pH value of the soil of the CK treatment decreased after adding biological agents and fertilization. Duncan’s analysis showed a significant decrease in the pH of the F3C2 treatment (p < 0.05). The content of NH4-N in soil was between 38.44 mg·kg−1 and 24.44 mg·kg−1 for the CK treatment was 38.44 mg·kg−1. The results showed that NH4-N decreased significantly under all treatments compared to the CK treatment. The NH4-N content in the F2 C3 treatment was 24.44 mg·kg−1 and showed the biggest decrease. The total content of AP was between 65.66 and 126.37 mg·kg−1. The content of AP increased in all treatments compared with the control, with the highest increase in treatment F3C2 (126.37 mg·kg−1). The AP content increased significantly in treatments F2C2, F3C1, F3C2, and F3C3 (p < 0.05). The AK content ranged between 24.76 mg kg−1 and 31.05 mg·kg−1. Compared with the control, the content of AK was increased in some of the treatments, although there were no significant differences. Treatment F3C2 had the highest improvement effect (31.05 mg·kg−1). The soil TN content ranged between 368.90 mg·kg−1 and 403.68 mg·kg−1. The same trend as was the case with AK was evident in TN content. The TP content ranged between 335.15 and 495.13 mg·kg−1. All treatments, except F1C2, showed significant improvements (p < 0.05), with the highest in treatment F3C1 (495.13 mg·kg−1).
After harvest, the roots of P. notoginseng were separated from the stems and leaves, cleaned, and the fresh weight was recorded as the yield. The results showed that the yield increased in all treatments compared with the control (CK), but with no statistical differences.

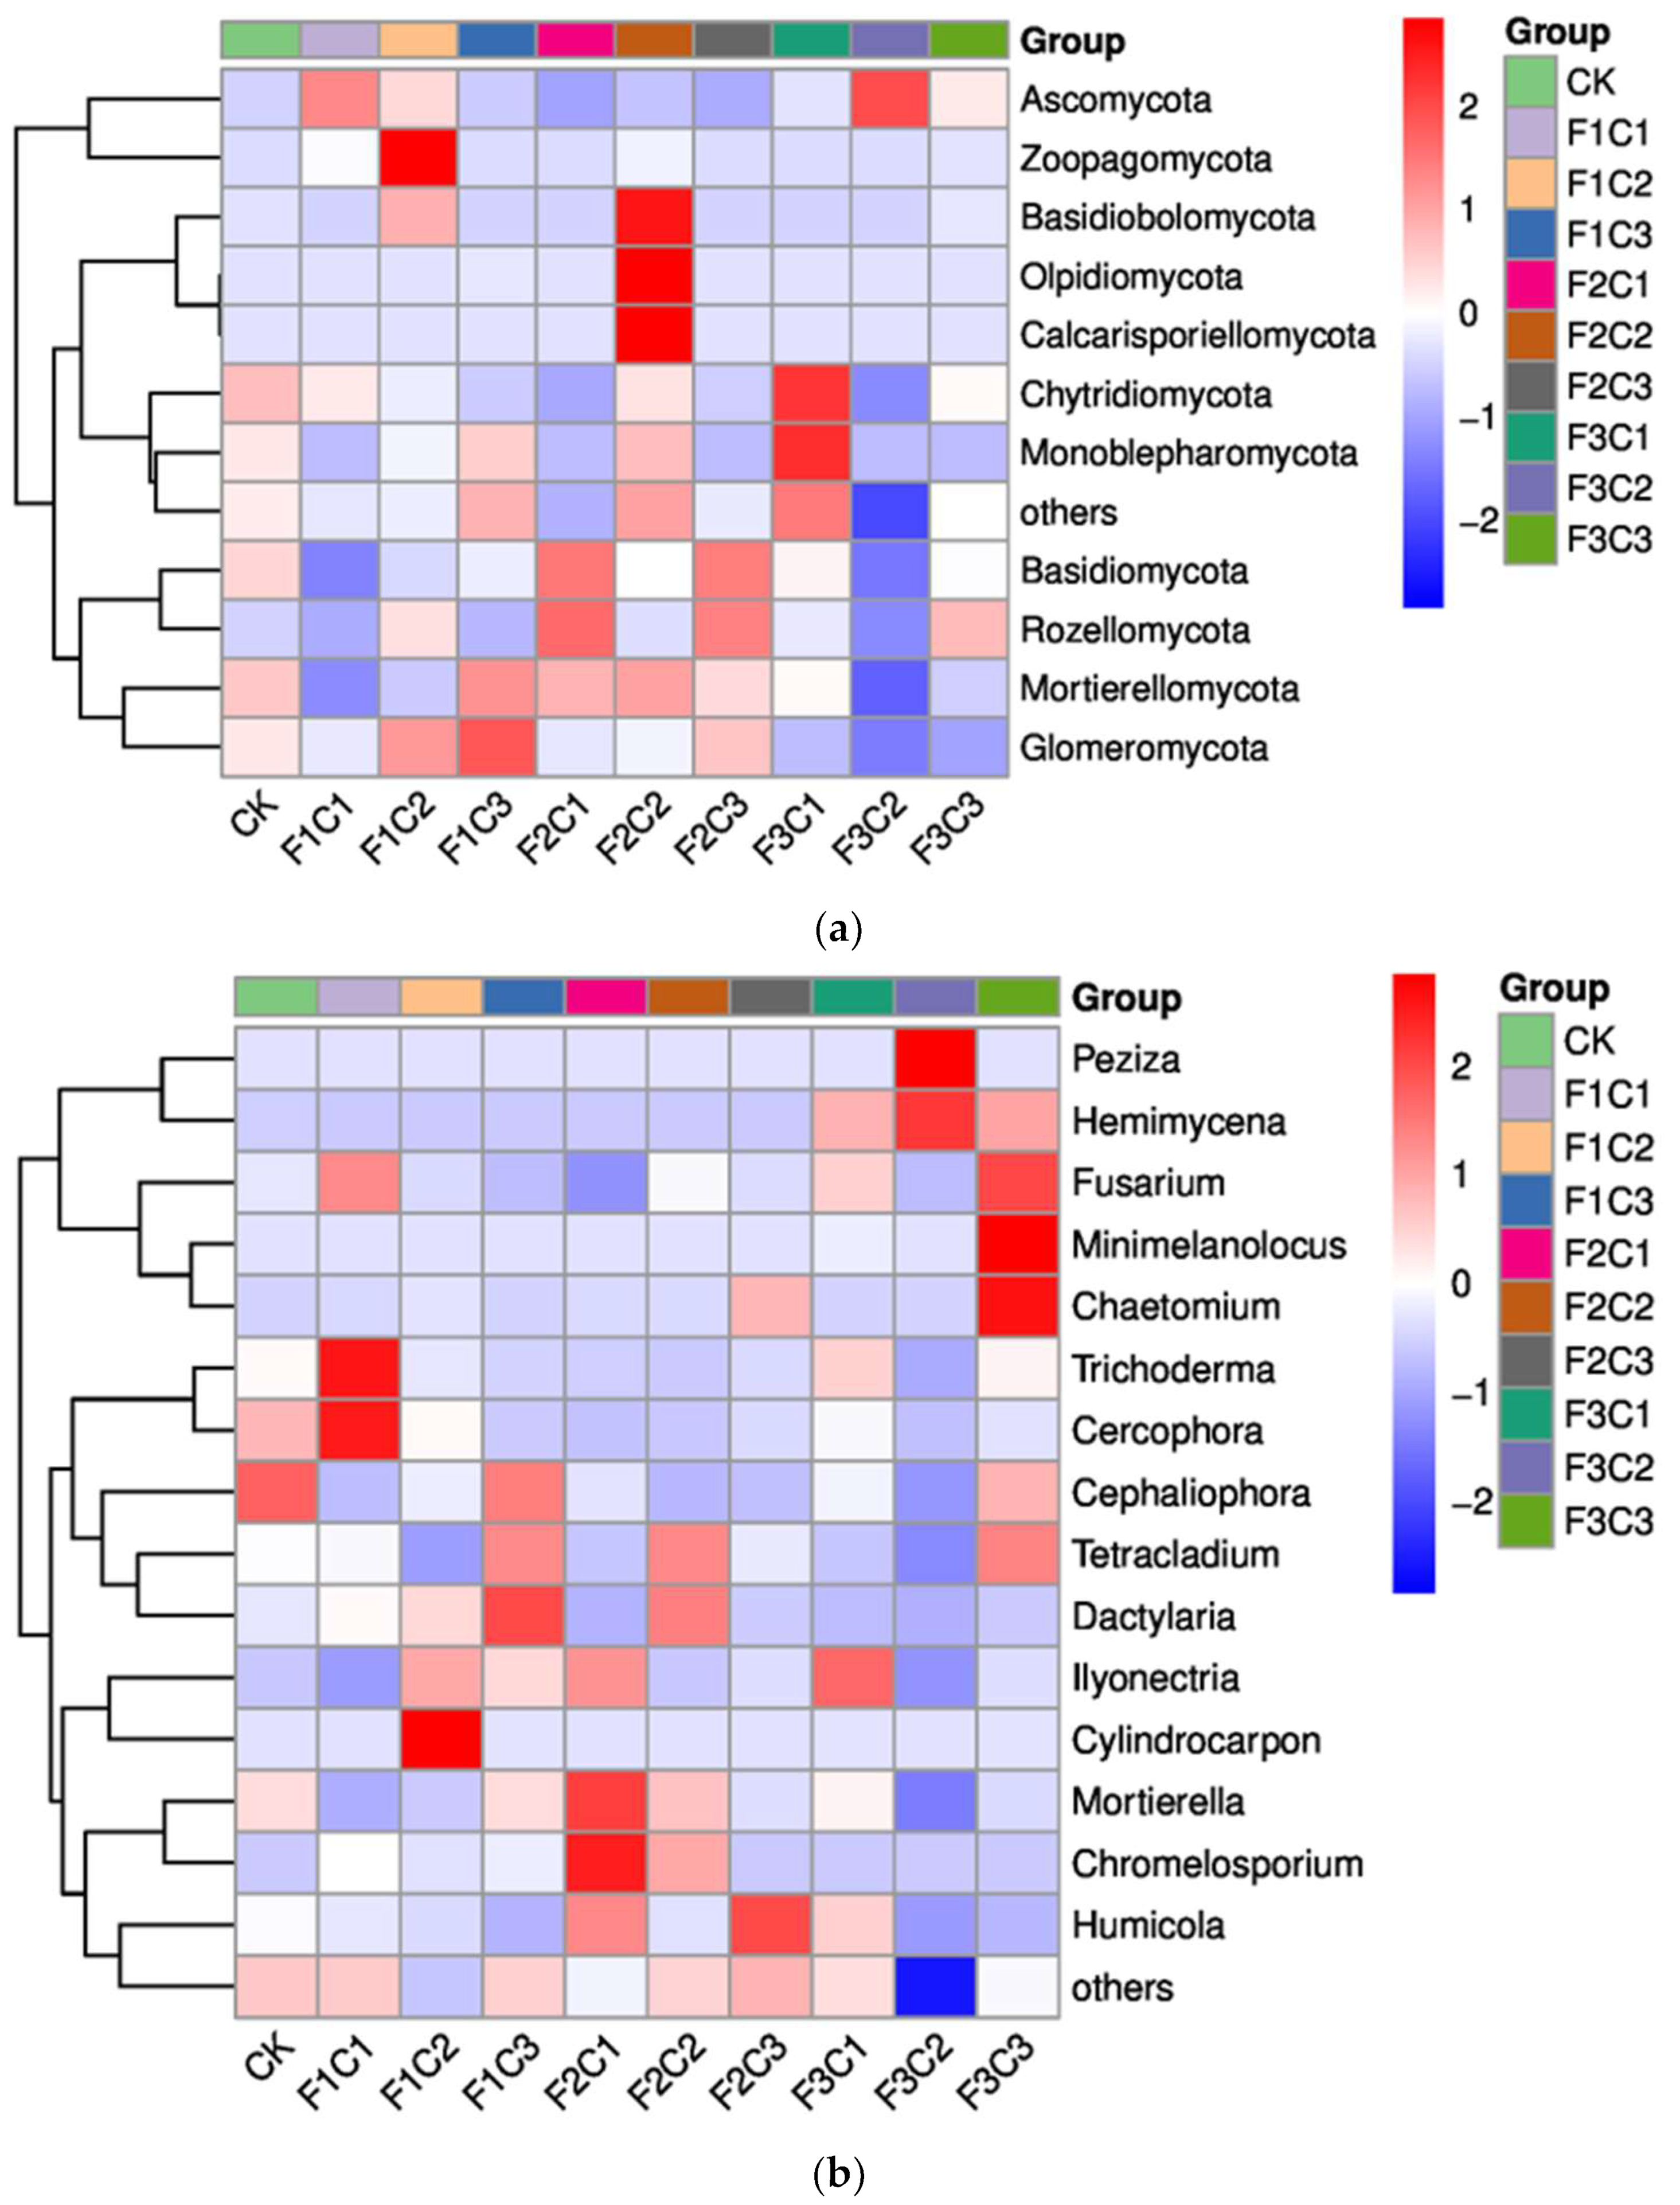
3.2. Diversity and Structural Characteristics of Fungi in Rhizosphere Soil of P. notoginseng

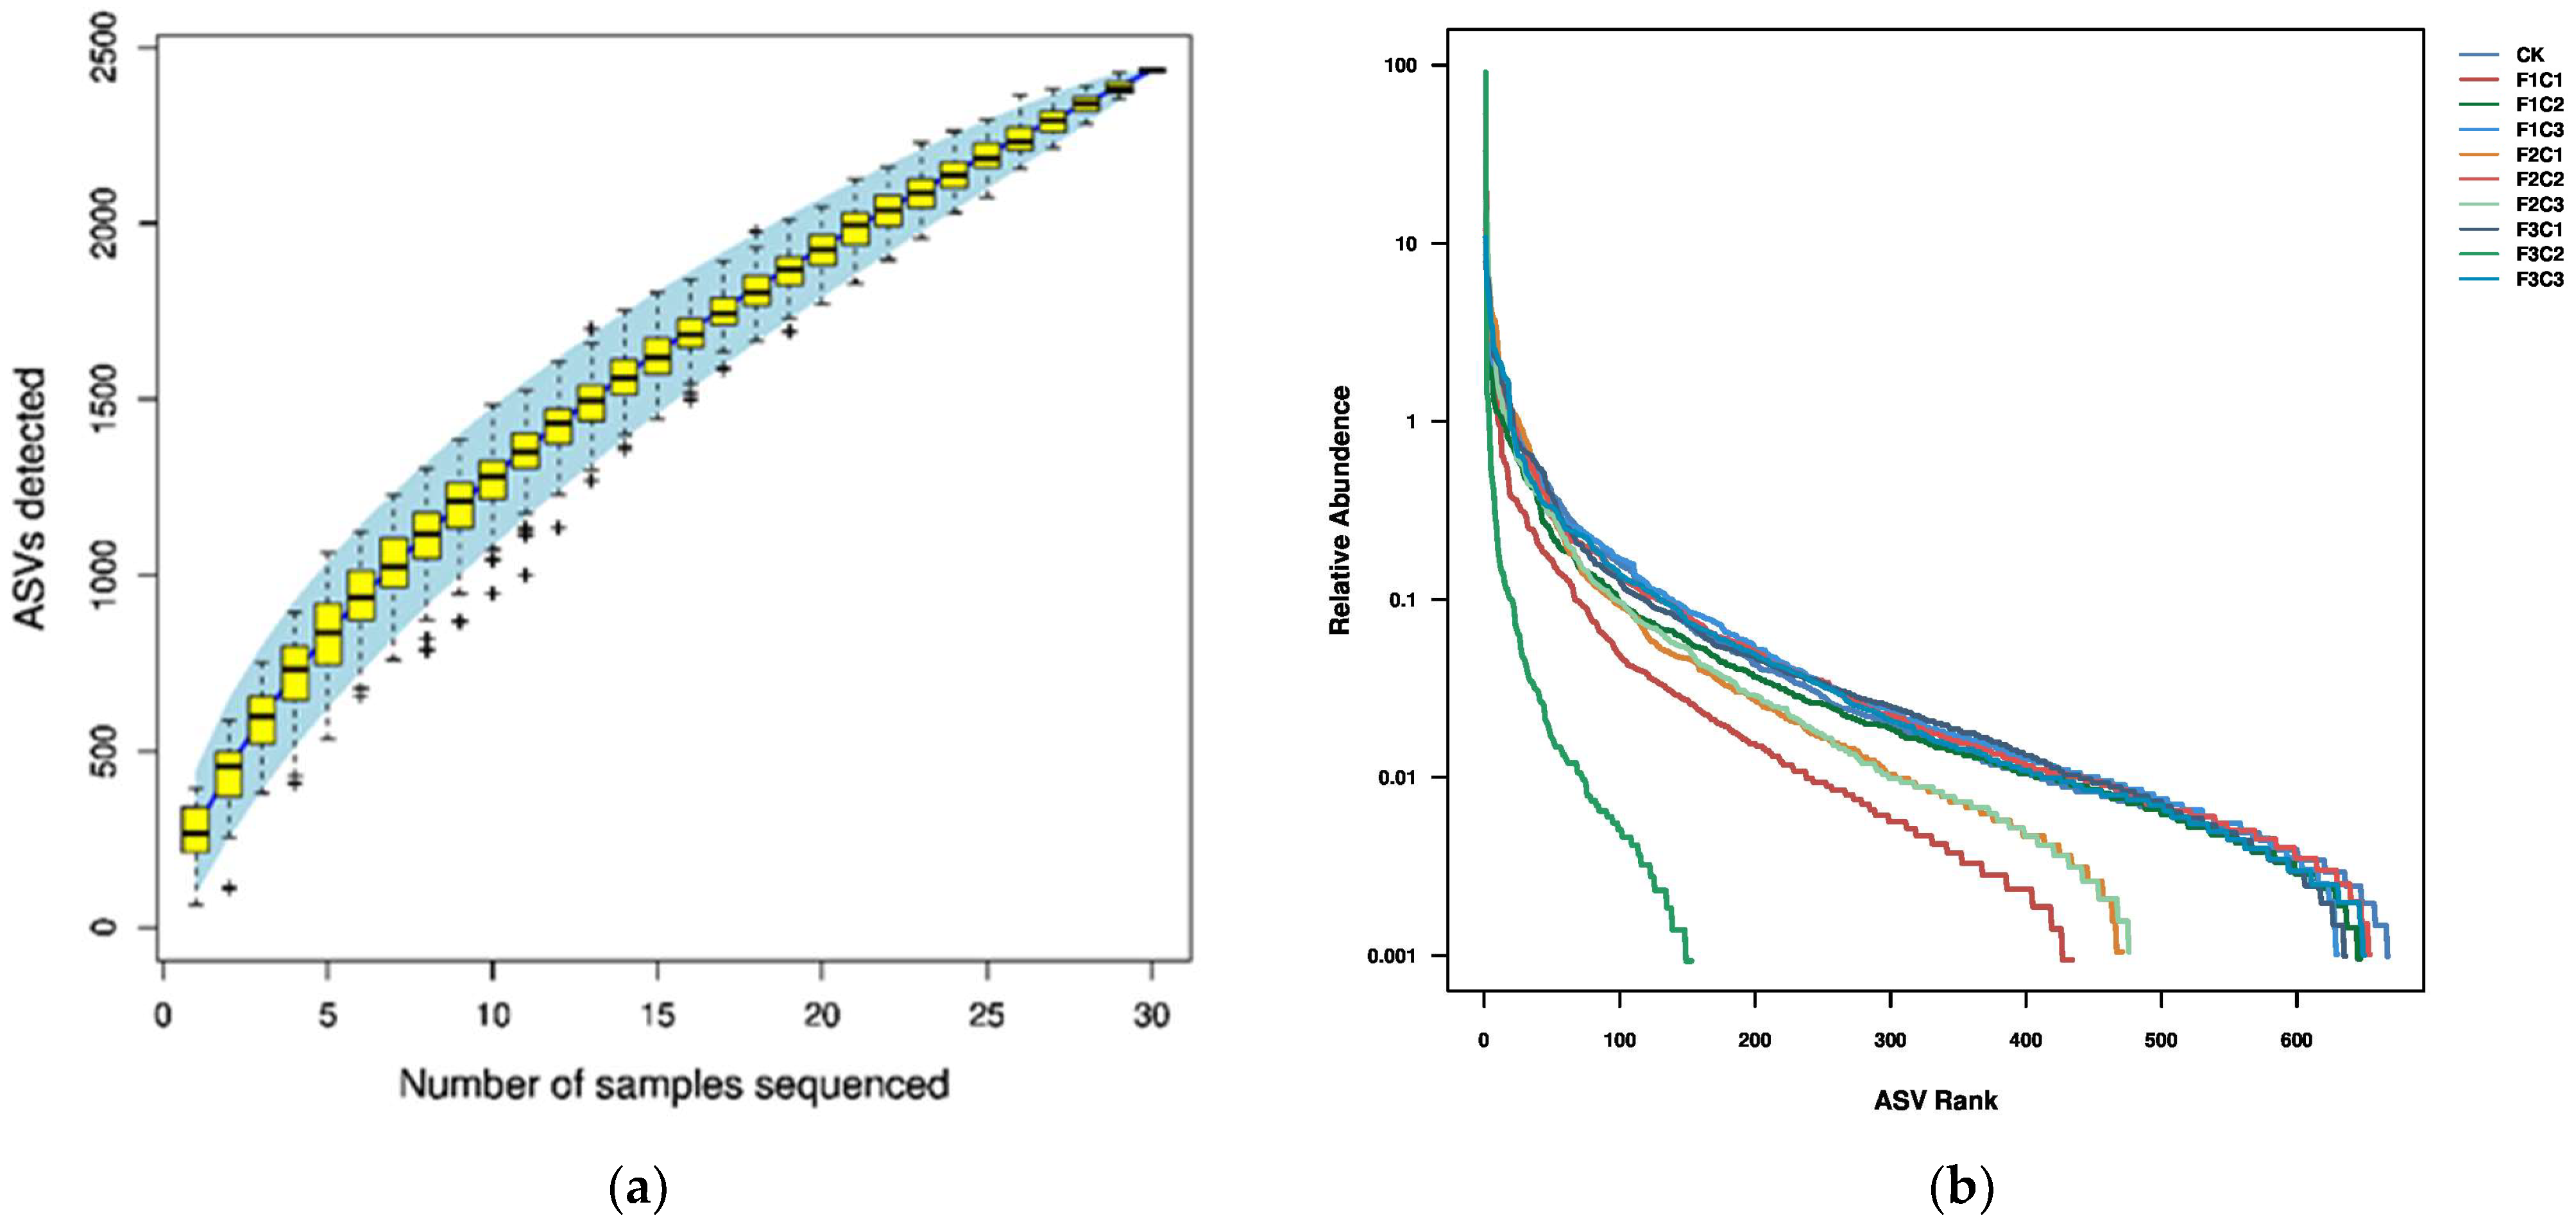
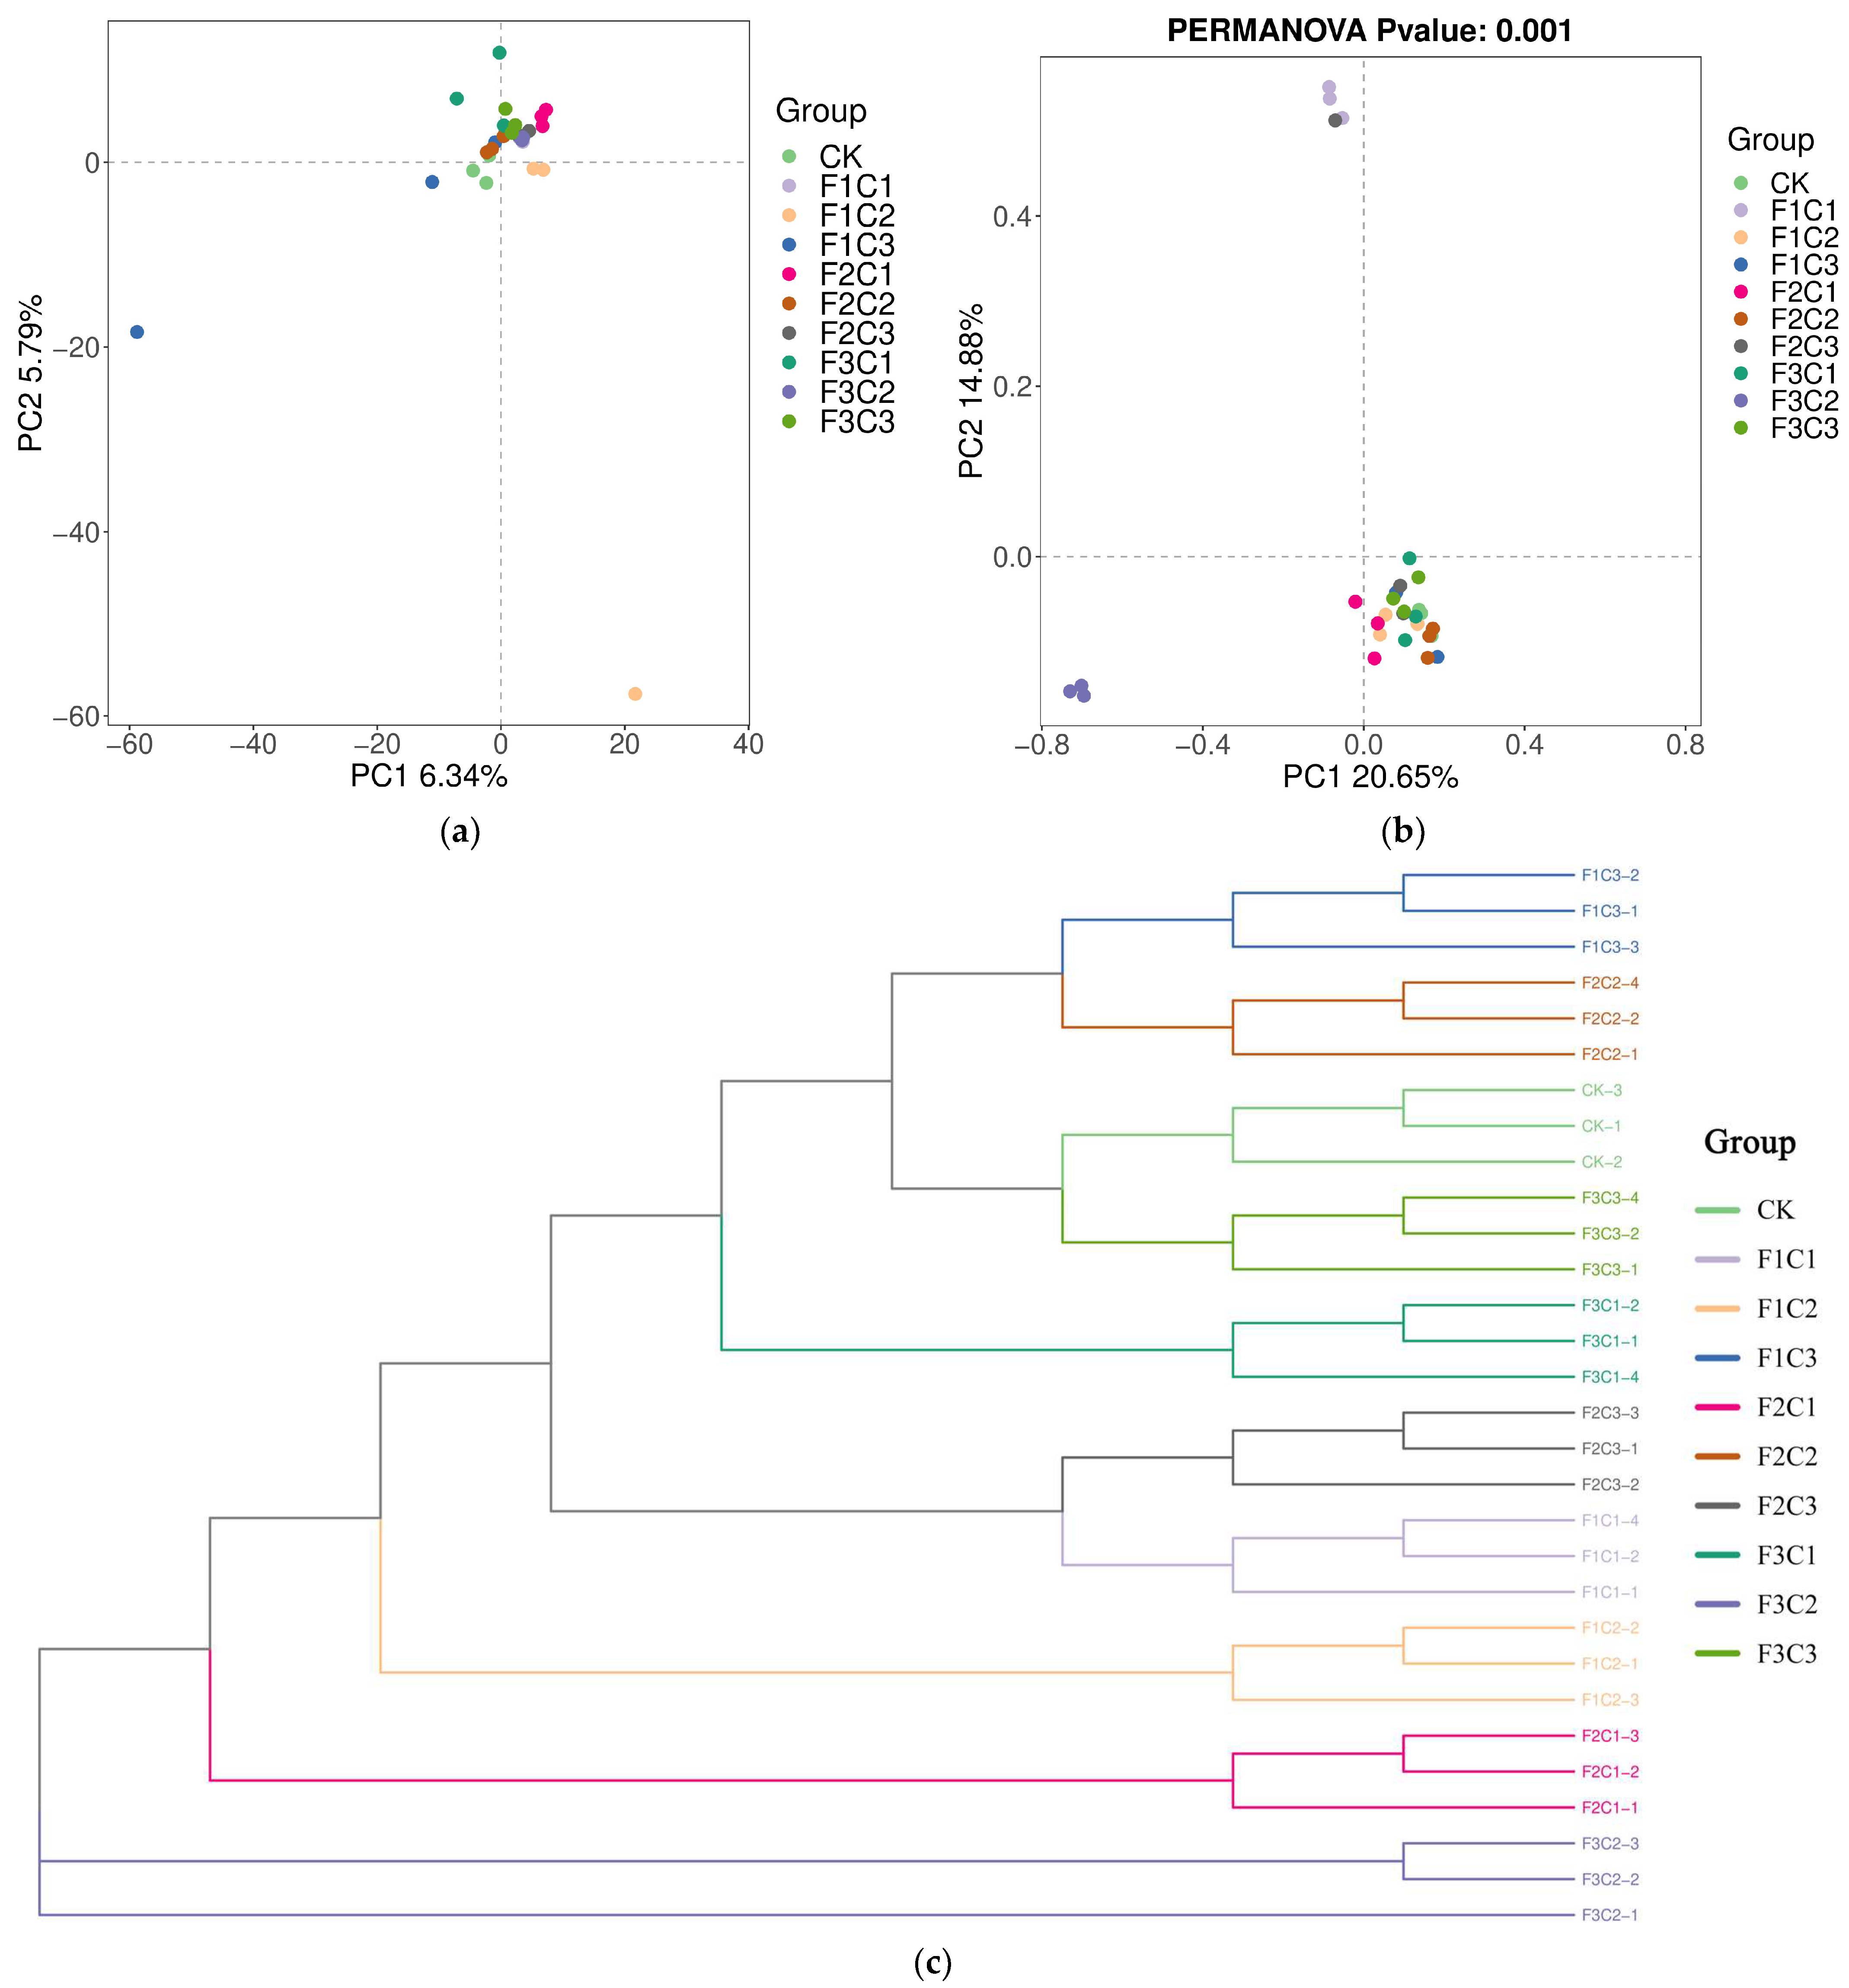
3.2.1. Diversity and Abundance

The average number of fungal ASVs under different treatments ranged from 75 to 342. The average ASV numbers were 342, 224, 310, 306, 232, 341, 233, 320, 75, and 340 for CK, F1C1, F1C2, F1C3, F2C1, F2C2, F2C3, F3C1, F3C2, and F3C3, respectively. The average number of ASV in the CK treatment was the highest, while that in the F3C2 group was the lowest. From the results of species annotation, the Heatmap map (Figure 1a) of the community structure of each group in the top 15 at the phylum level was selected. The results showed that Ascomycota, Mortierellomycota, and Basidiomycota were the dominant fungal groups in the rhizosphere soil of P. notoginseng. Compared with the control, the relative abundance (Table 3) of Mortierellomycota increased by 5.23% under F1C3 treatment; the relative abundance of Mortierellomycota decreased by 20.43% under F3C2 treatment. The relative abundance of Basidiomycota under F1C3 treatment increased by 7.96% compared with CK treatment; the relative abundance of Basidiomycota decreased by 15.07% under F3C2 treatment compared with CK treatment.
Generating the community structure Heatmap (Figure 1b) diagram of the top 15 species abundance at the genus level. The results showed that the relative abundances of Mortierella, Ilyonectria, Fusarium, Trichoderma, Cephaliophora, and Cercophora in the CK group were 8.85%, 1.89%, 2.23%, 1.75%, 3.28%, and 1.77%, respectively, and the relative abundances were all greater than 1% (Table 4).

Analysis of the Alpha and Beta Diversity of Fungi Community

The species accumulation curve (Figure 2a) describes the increase of species with the rise of sampling volume. It is widely used to judge sampling volume adequacy and species richness estimation in biodiversity and community surveys. The results show that as the sample size increases, the curve tends to be stable, which shows that the species in this environment will not increase significantly with the increase in the sample size, and the sampling is sufficient.
The results of the Alpha analysis (Table 5) showed that the ASV, Chao1, and ACE indexes decreased with the addition of fertilization and biological agents. Compared with the control, the ASV decreased by 0.29–78.07%; the Chao1 index decreased between 0.39% and 78.22%; the ACE index decreased between 0.43% and 78.24%. The decreases for ASV, Chao1 and ACE were significant for treatmen F1C1, F2C1, F2C3, and F3C2 (p < 0.05). This showed that the number of fungi in the rhizosphere soil of P. notoginseng decreased after fertilization and adding biological agents. The Shannon index, which can simultaneously reflect the species richness and evenness of distribution, only increased by 0.33% under the F1C3 treatment while decreasing between 0.33% and 87.15% in the other treatments. The decreases were significant in the F1C1, F1C2, F2C3, and F3C2 treatments. This result indicated that the richness and uniformity of fungal colonies in the rhizosphere soil of P. notoginseng decreased after adding fertilizers and biological agents. The Simpson index mainly reflects the diversity of the community. The Simpson index increased slightly by 1.05% in the F2C2 treatment, while the rest of the treatments stayed the same or decreased. It was only significant in the F1C1 and F3C2 treatments (p < 0.05). The Alpha index analysis showed that the number, richness, and uniformity of fungi in the rhizosphere decreased compared with the untreated soil.
Rank abundance (Figure 2b) is used to simultaneously account for two aspects of sample diversity: the richness and uniformity of the species contained in the sample. The richness of species is reflected by the length of the curve on the horizontal axis; the more significant the span of the horizontal axis of the curve, the richer the composition of species; the uniformity of species composition is reflected by the shape of the curve, and the smaller the span of the vertical axis of the curve is, the higher the uniformity of species composition is. The results showed that the species richness of each group decreased compared with CK, and the species richness of the F3C2 group was the lowest.
Beta diversity analysis is mainly used to evaluate the differences in species composition between different samples. The more similar the sample composition, the closer the distance reflected in the PCA diagram (Figure 3a). The results of the PCA analysis showed that the explanatory degree of PC1 was 6.34%, the explanatory degree of PC2 was 5.79%, and the total explanatory degree was 12.13%. There was a good aggregation among the samples, and the sample points of different groups were close, which indicated that the fungal community in the rhizosphere soil of P. notoginseng did not change significantly after fertilization and biological agent addition.
PCoA analysis (Figure 3b) was performed based on the Bray-Curtis distance calculation method. The results showed that the explanation rates of PC1 and PC2 for the differences between groups were 20.65% and 14.88%, respectively, and the repeated distance parameters among the samples were close. The distance between the F1C1 and F3C2 treatments was farther than that of the CK treatment, which indicated that the change of the rhizosphere soil fungal community was more significant than that of other treatments.
The clustering results based on the binary-Jaccard distance algorithm (Figure 3c) show that the groups can be better clustered together, which shows that the grouping effect was excellent. The branching distance reflects the degree of similarity between samples, and the sample most similar to CK is F3C3 processing.

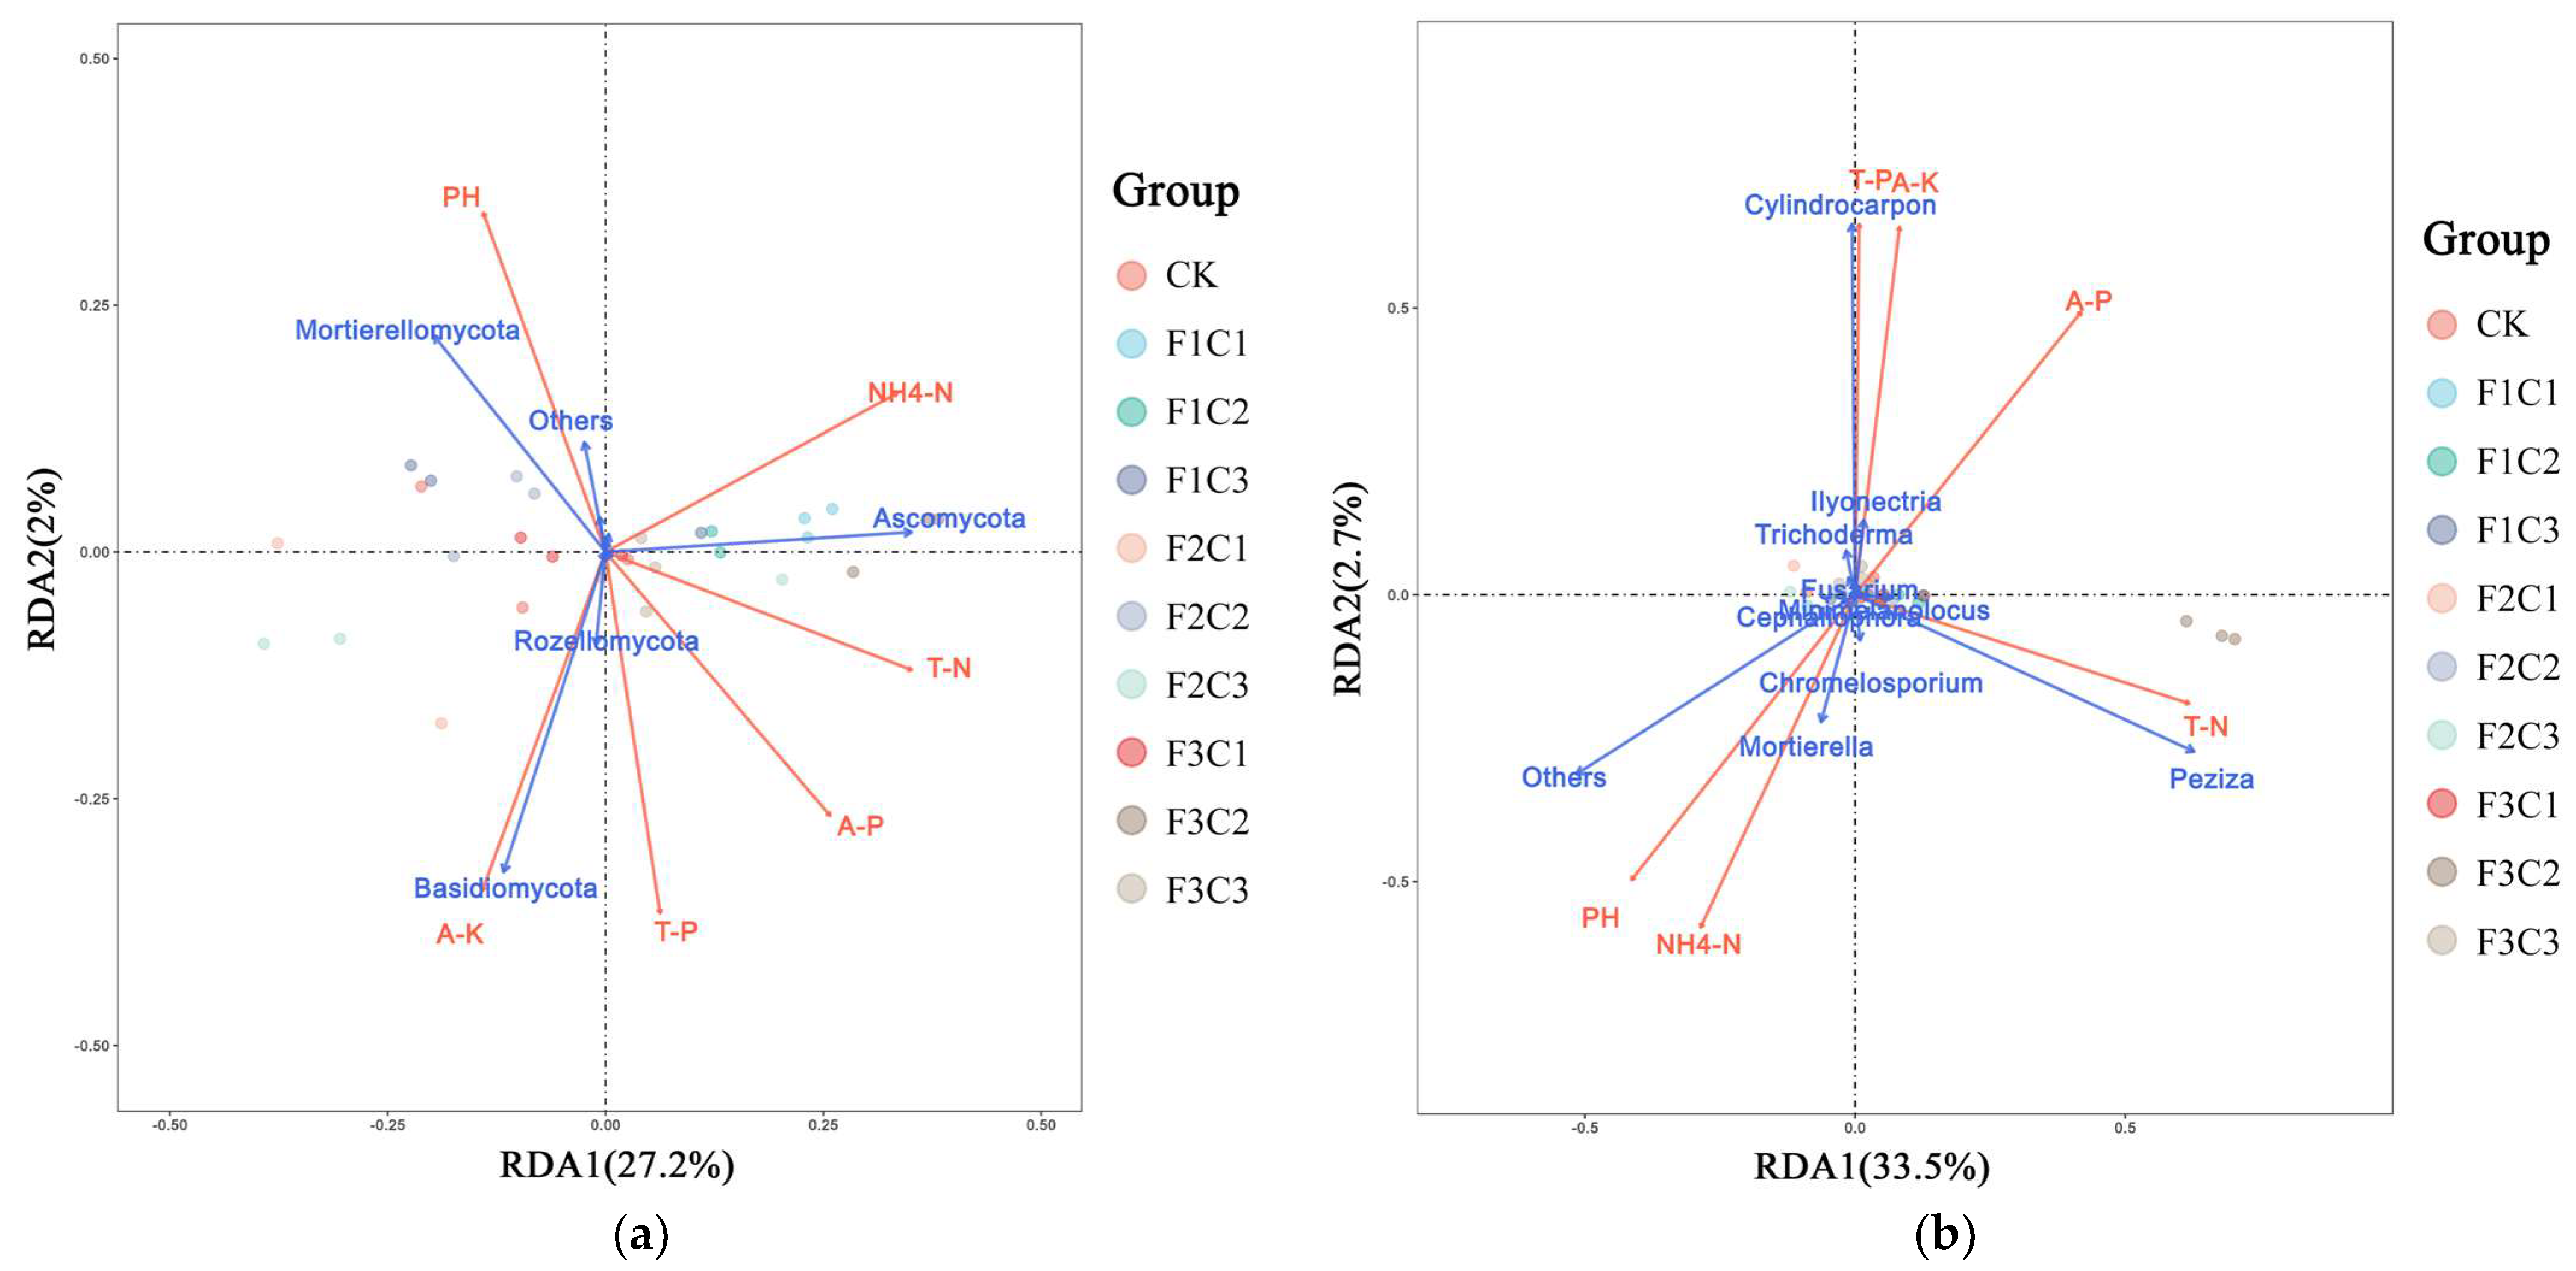
3.3. Relationship between Rhizosphere Soil Microorganisms and Environmental Physicochemical Parameters

The relative abundance of dominant phyla of soil fungi in the rhizosphere of P. notoginseng and the RDA analysis (Figure 4a) of soil physical and chemical properties showed that RDA1 and RDA2 explained 27.2% and 2% of the changes in the composition of soil fungi. The relationship between the environmental indicators and RDA1 and RDA2 showed that pH, AK, and RDA1 were negatively correlated; NH4-N, TN, AP, TP, and RDA1 were positively correlated; pH, NH4-N, and RDA2 were positively correlated; TN, AP, TP, AK, and RDA2 were negatively correlated. Ascomycota was positively correlated with RDA1; Rozellomycota, Basidiomycota, Mortierellomycota, and RDA1 were negatively correlated; Mortierellomycota, Ascomycota, and RDA2 were positively correlated; Rozellomycota, Basidiomycota, and RDA2 were negatively correlated.
At the genus level, the relative abundance of rhizosphere fungi Top10 species and soil physical and chemical properties of redundancy analysis (Figure 4b) showed that RDA1 and RDA2 explained 33.5% and 2.7% of the changes in soil fungal colony composition, respectively. AP, AK, TP, TN, and RDA1 were positively correlated; NH4-N, pH, and RDA1 were negatively correlated; pH, NH4-N, and RDA2 were positively correlated; TN, AP, TP, AK, and RDA2 were negatively correlated. Peziza, Ilyonectria, Chromelosporium, Minimelanolocus, and RDA1 were positively correlated; Mortierella, Cylindrocarpon, Fusarium, Trichoderma, and Cephaliophora were negatively correlated with RDA1; Ilyonectria, Cylindrocarpon, Fusarium, and Trichoderma were positively correlated with RDA2; Peziza, Mortierella, Chromelosporium, Cephaliophora, and Minimelanolocus were negatively correlated with RDA2.

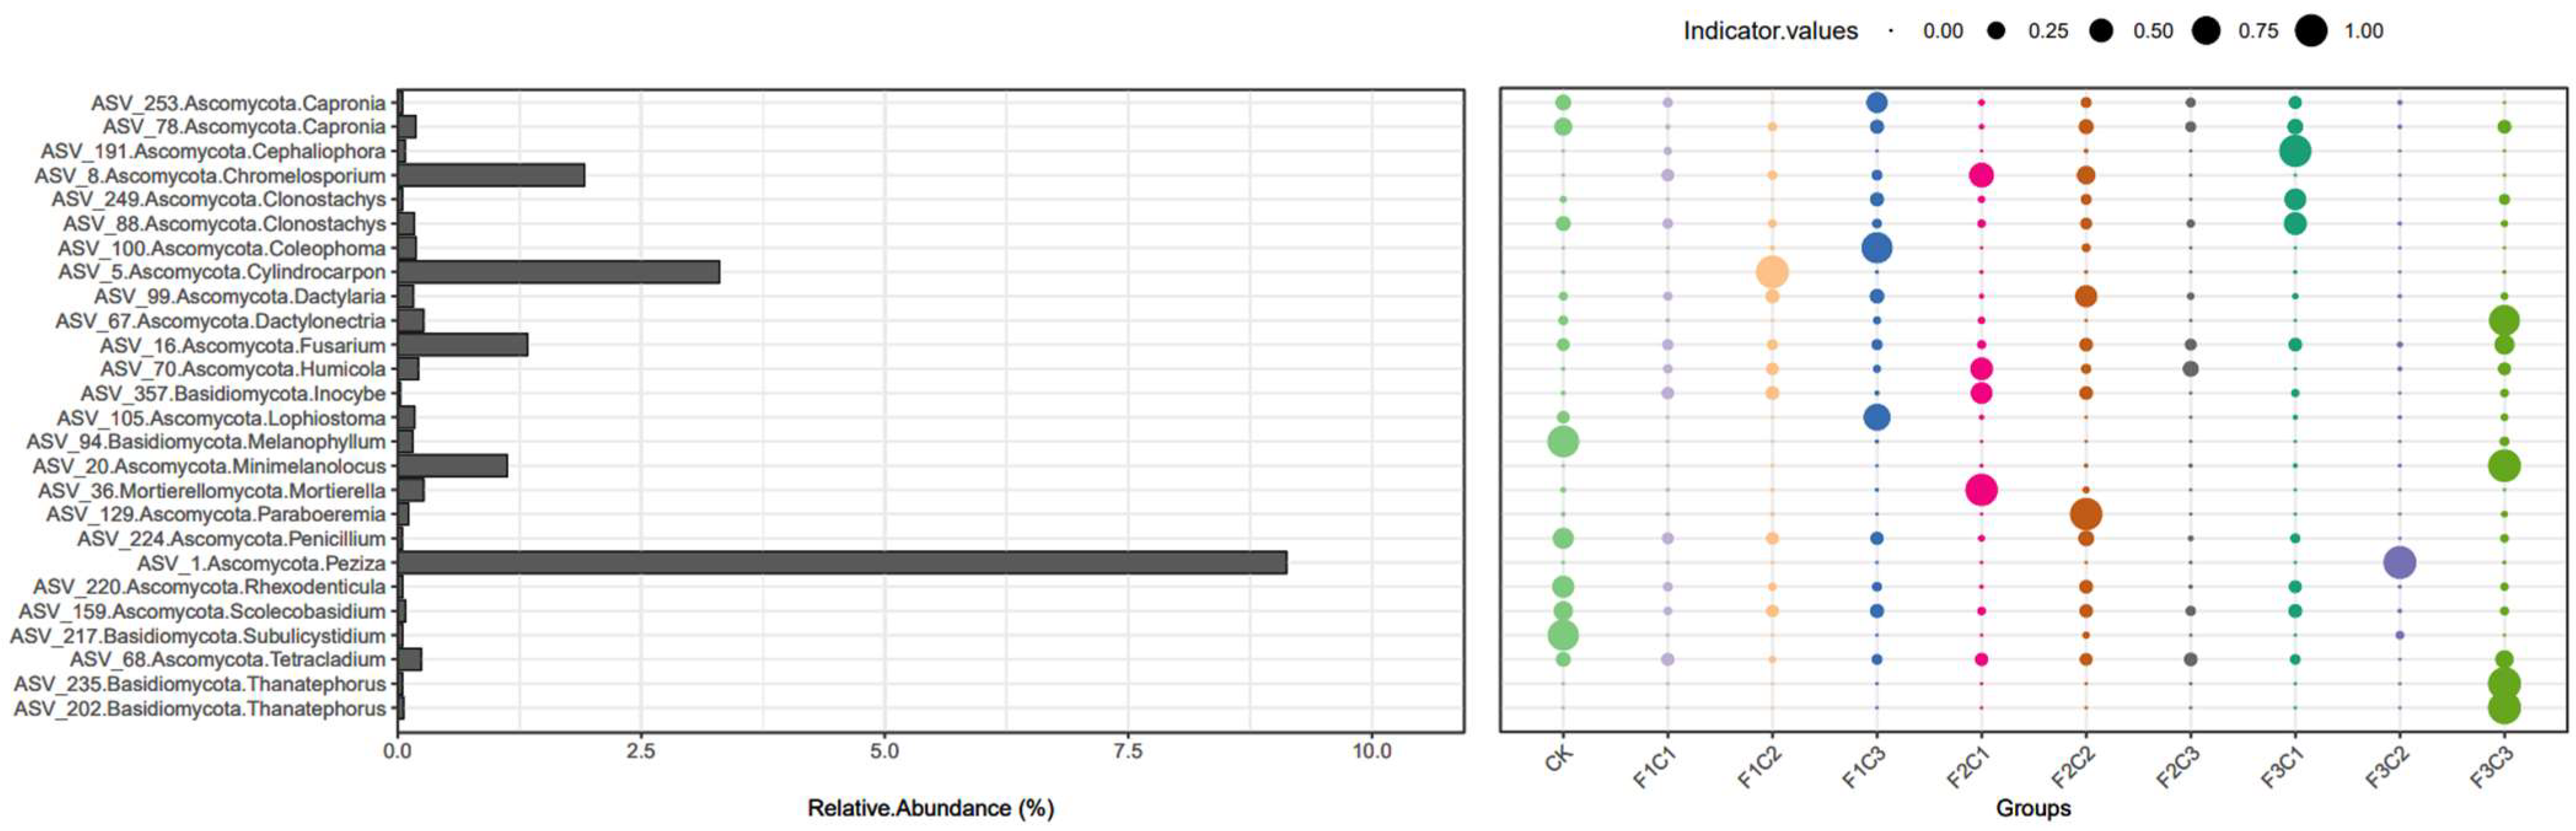
3.4. Indicator Analysis

Using the R software package(indicspecies_1.7.14), by calculating the indicator value of ASV in each group and then conducting a statistical analysis of the indicator value between groups, the index species of each group were revealed (Figure 5). The index species mainly refer to the biological species, genera, or communities that can have a great impact on the growth environment in a certain area. At the gate level, the indicative species of each group were mainly Ascomycota, Basidiomycota, and Rozellomycota, in which the relative abundance of Ascomycota was the highest; at the genus level, it was mainly Peziza, Cylindrocarpon, and Chromelosporium, in which the relative abundance of Peziza was the highest. There were significant differences in the distribution of indicative species among treatments. The main indicative species (Indicator.values > 0.75) were summarized in a table (Table 6).

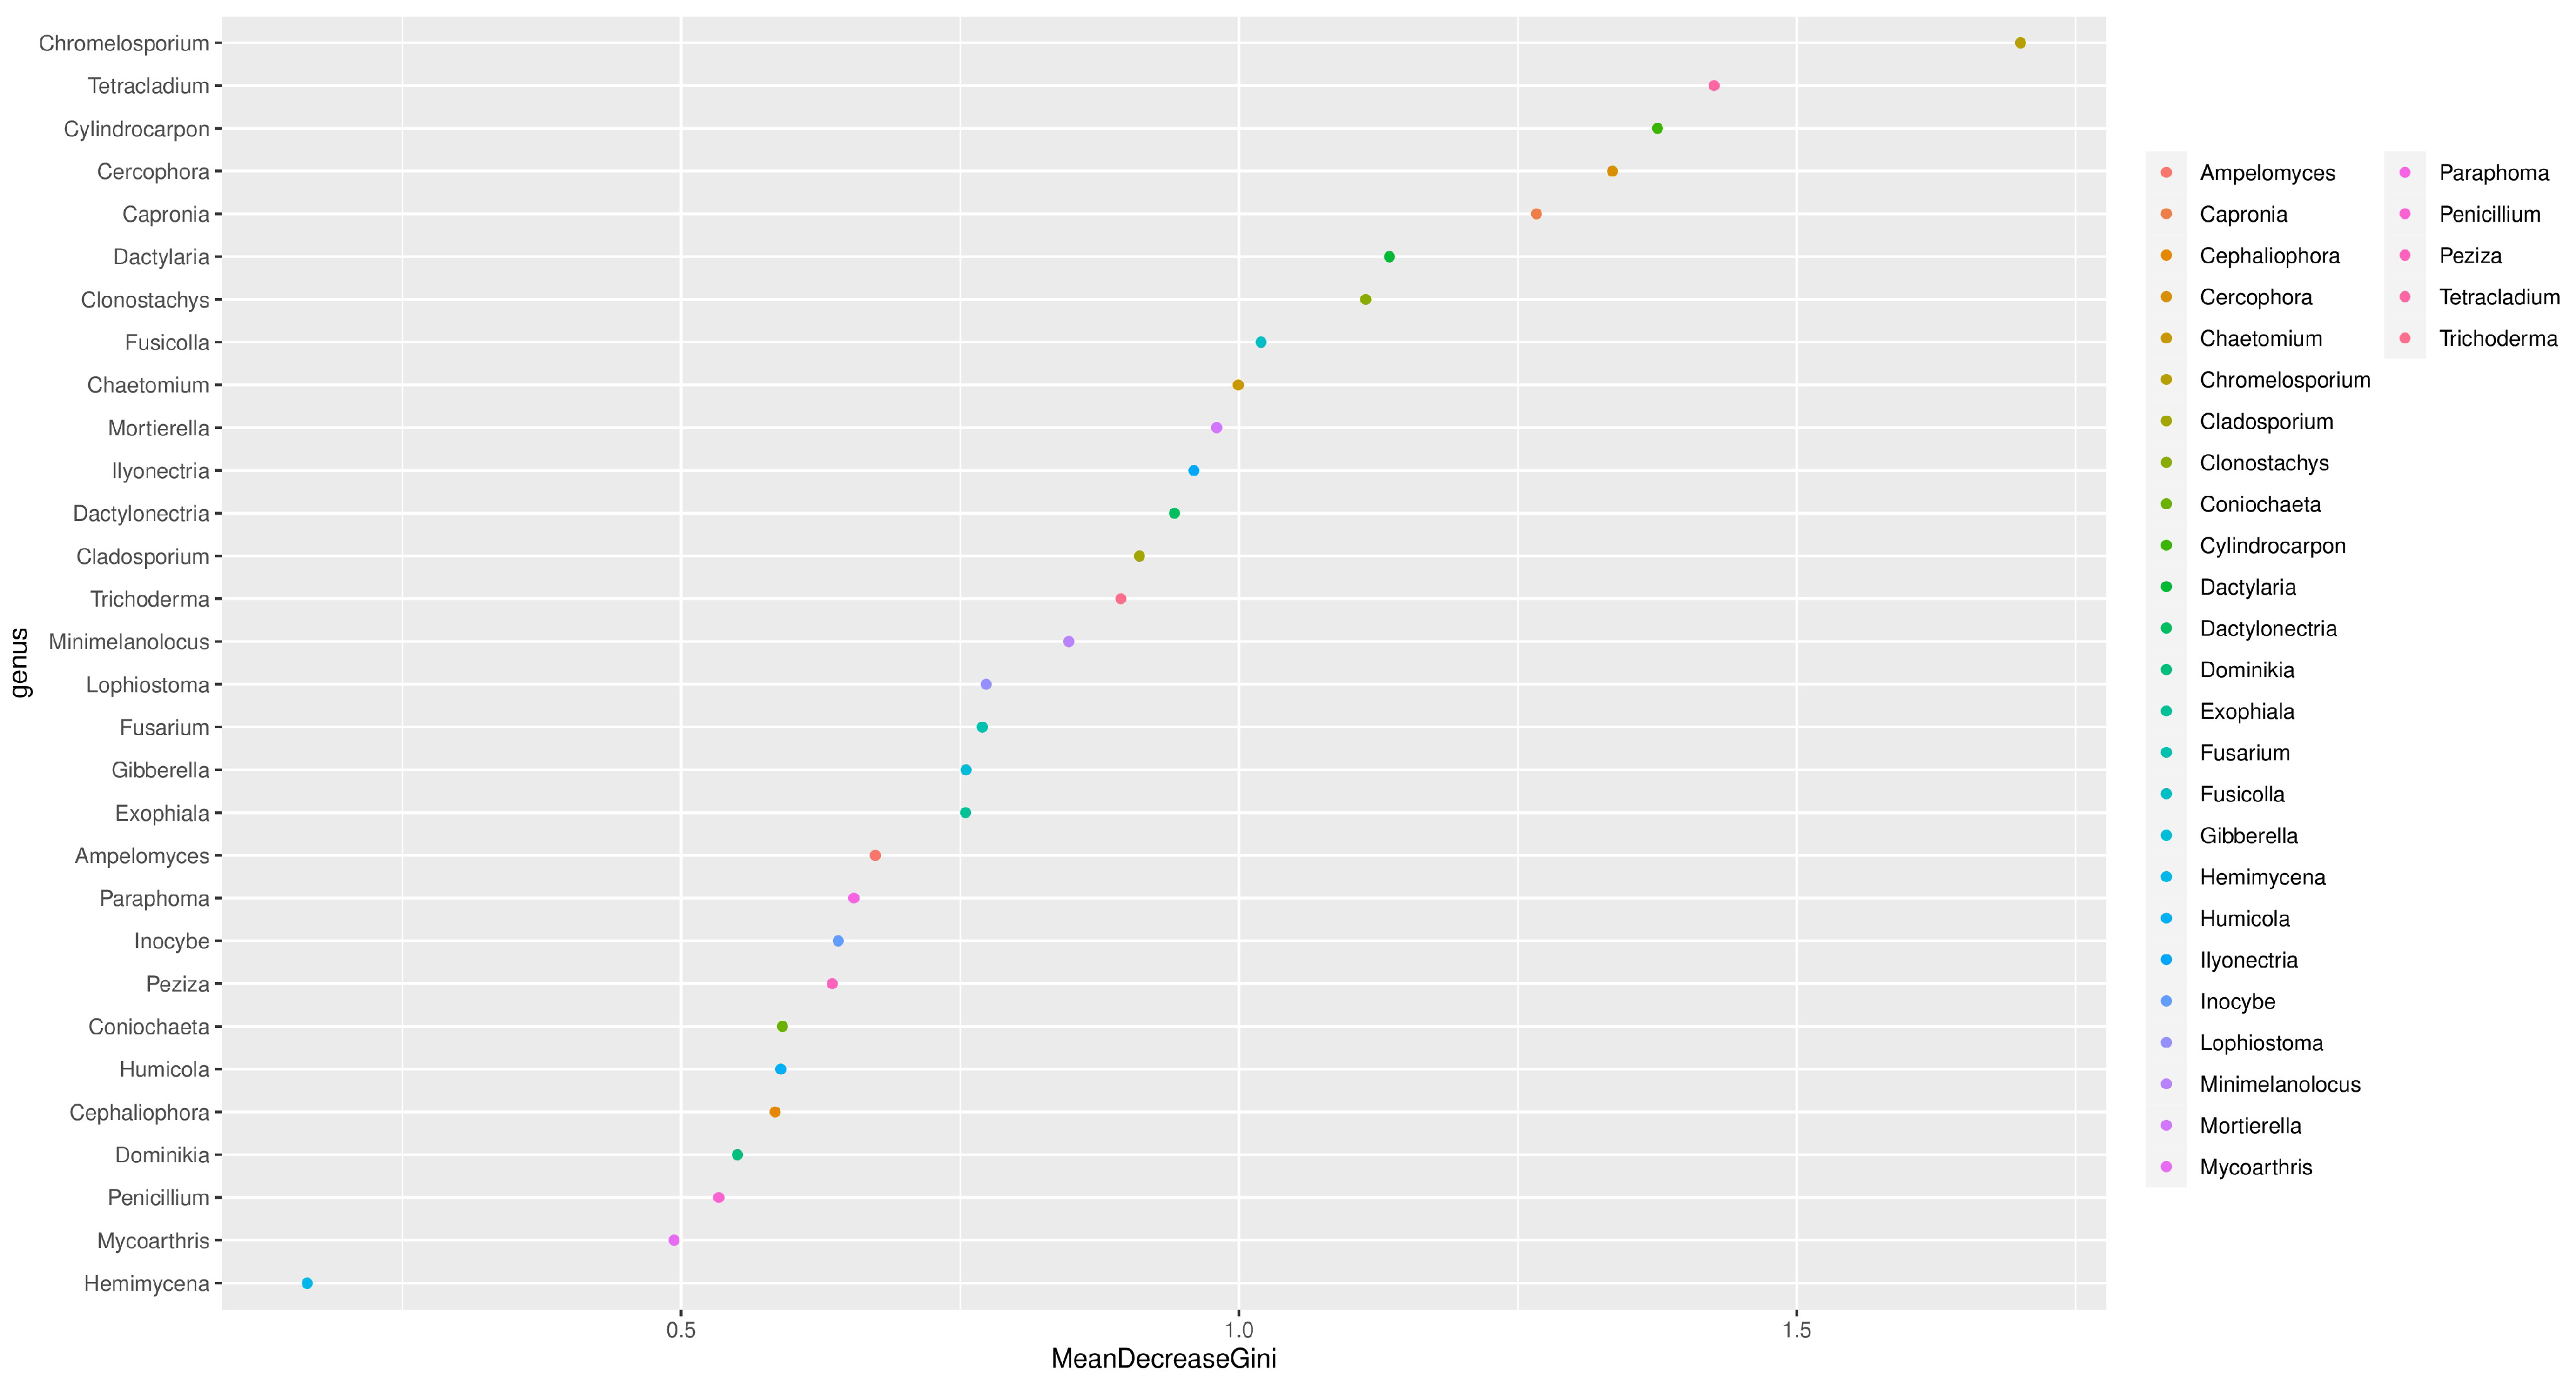
3.5. Random Forest Analysis

In order to classify microbial community samples effectively and accurately and to find out the key species that can differ among groups, the genera with the top 30 relative abundance are selected, and R-packet randomForest was used to draw the species importance point map (Figure 6).

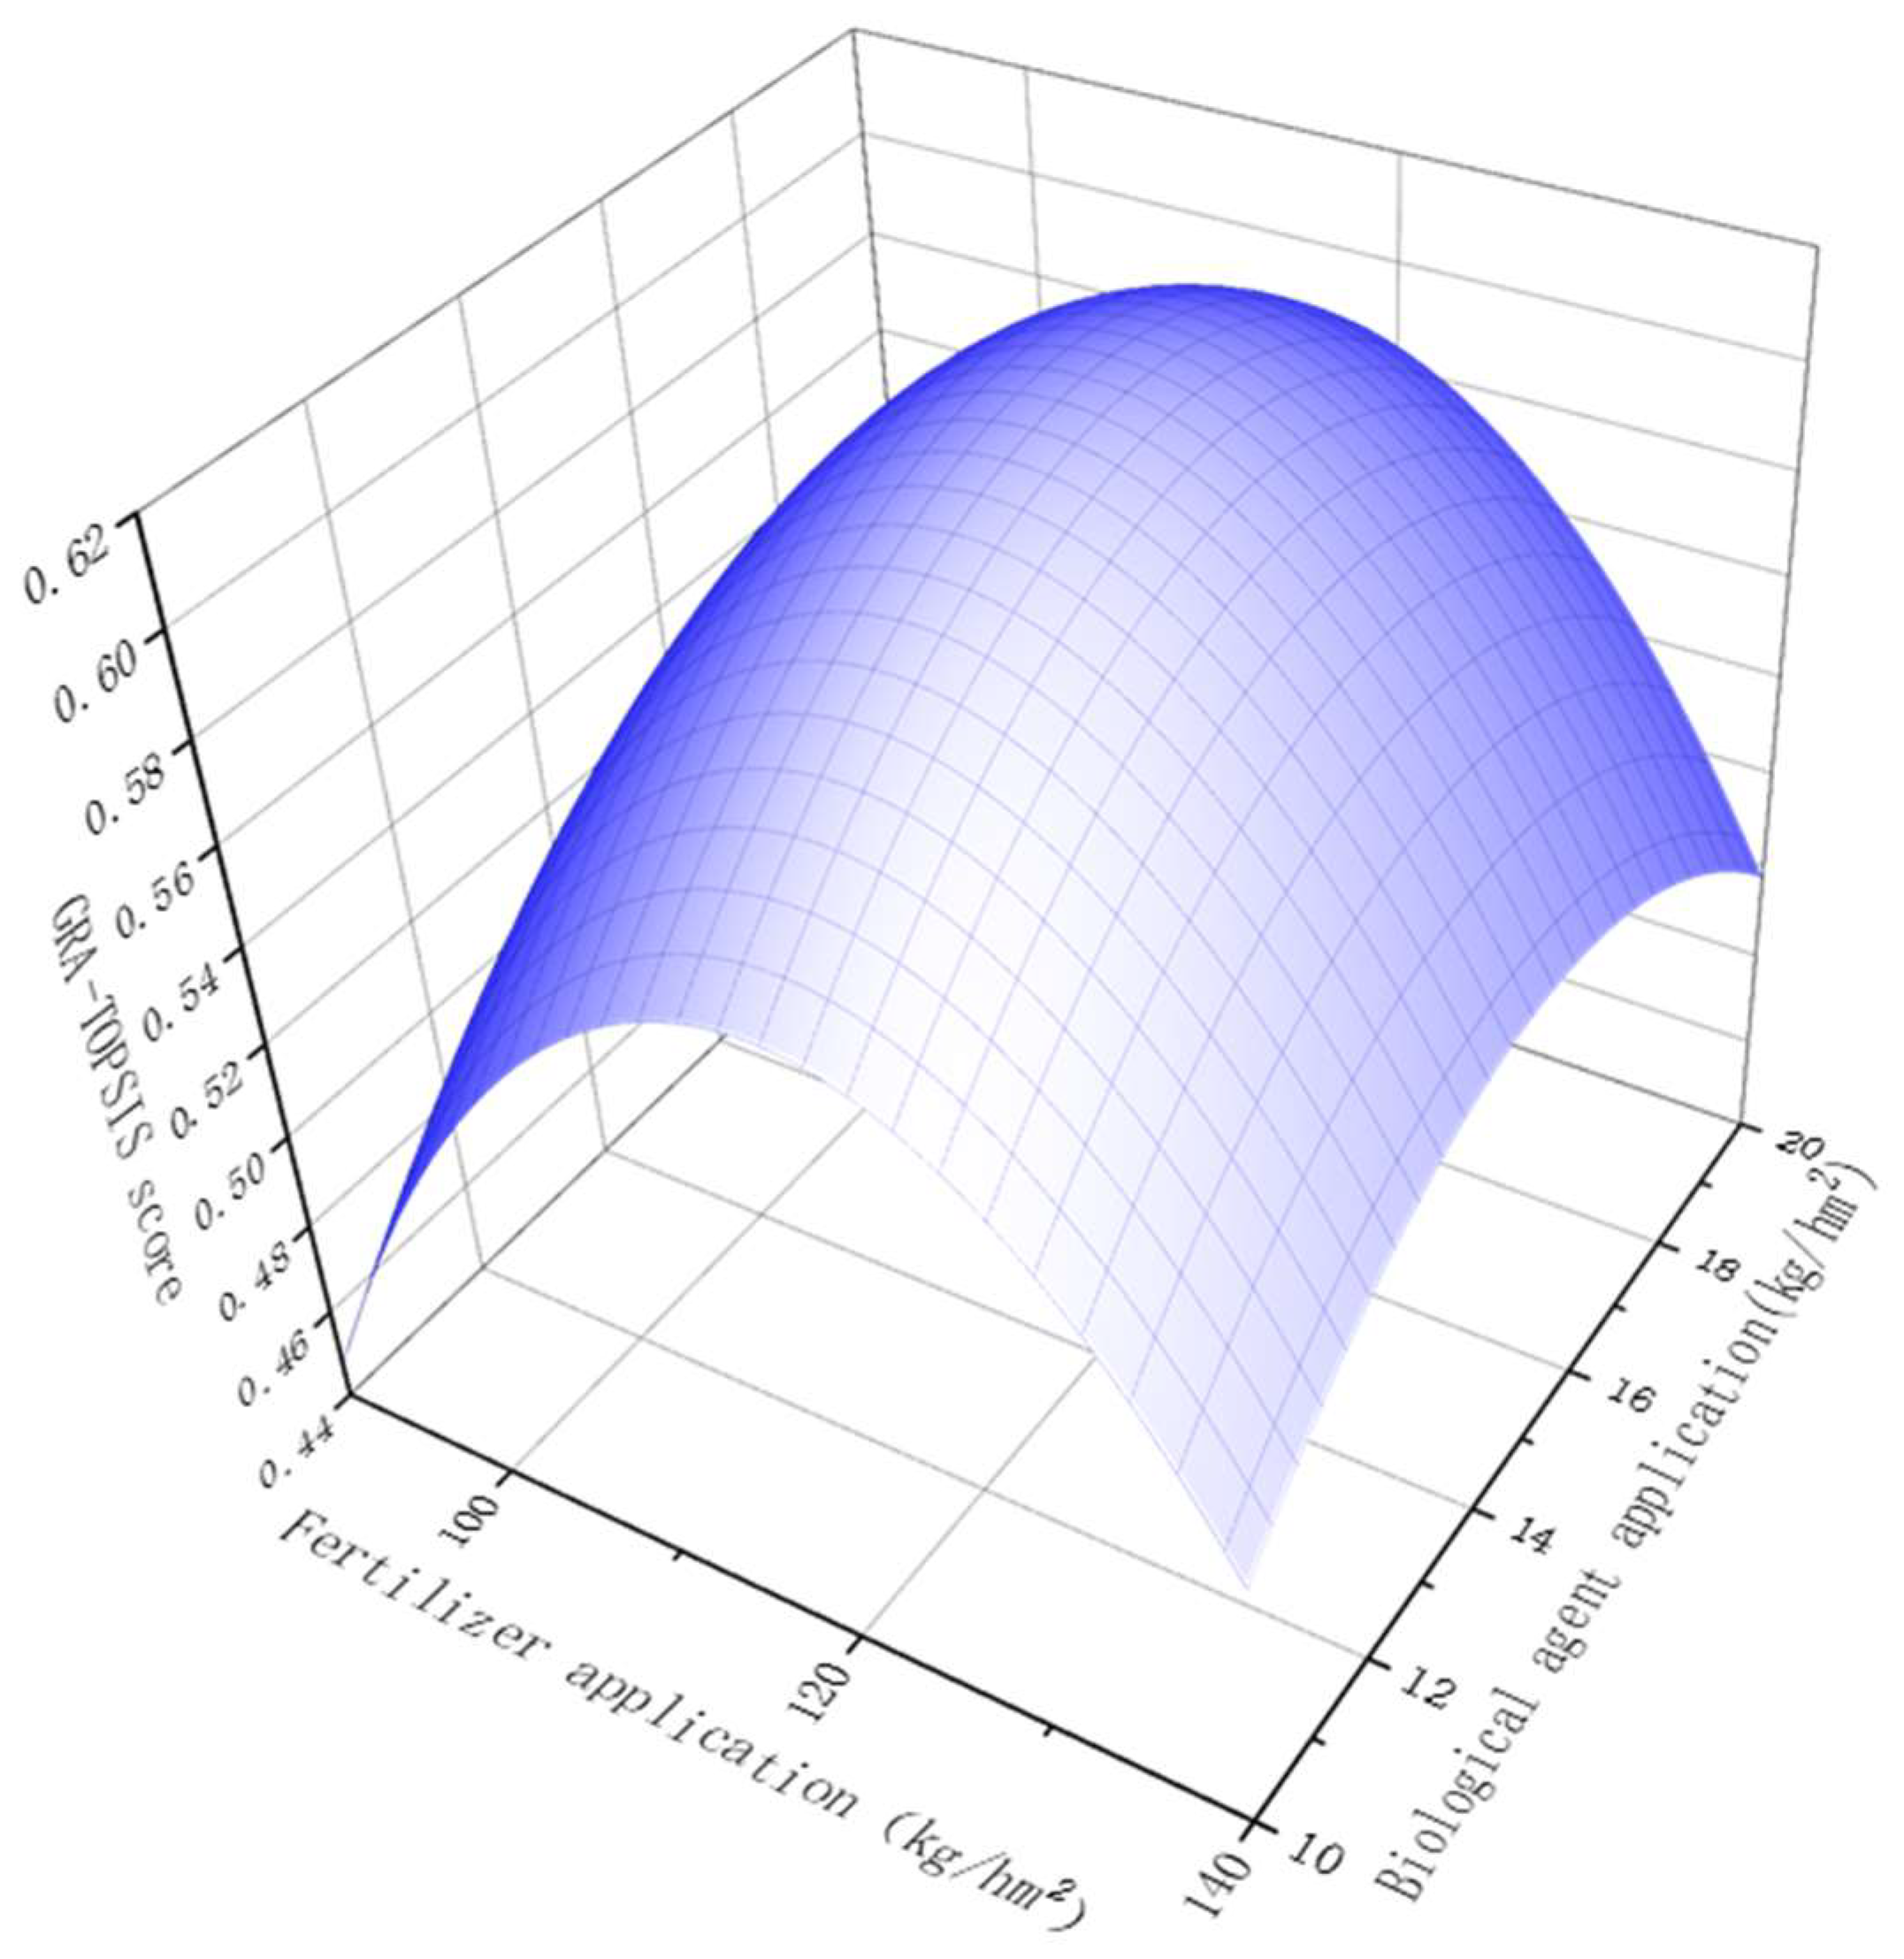
3.6. GRA-TOPSIS Analysis

To explore the best combination of bacterial fertilizer, we integrated ten indexes of pH, NH4-N, AP, AK, TN, TP, Cylindrocarpon, Ilyonectria, Fusarium, and yield, and sorted each treatment by GRA-TOPSIS analysis (Table 7). The sort results were displayed in the table.

3.7. Establish the Best Model in Theory

To further determine the response characteristics of biological agents and fertilizer to the rhizosphere and the yield of P. notoginseng, we established a theoretical model using MATLAB according to the results of the GRA-TOPSIS analysis. The regression model is as follows:
Z = −1.9032 + 0.035192X + 0.059526Y − 0.00014534X2 − 0.0015591Y2 − 8.7333 × 10⁻⁵XY
In the formula, X represents the fertilizer application amount, kg·hm−2; Y represents ap plication amount of biological agent, kg·hm−2; and Z represents GRA-TOPSIS Score.
The calculation results of the theoretical model were as follows: the maximum value of the GRA-TOPSIS score was 0.61469, and the coordinate of the maximum point of the model was X = 116.31 and Y = 15.83. Generally, the best coupling scheme of biological agent and fertilizer, in theory, was as follows: the amount of fertilizer was 116.31 kg·hm−2; when the number of bacteria was 15.83 kg·hm−2, the score of GRA-TOPSIS was the highest, reaching the comprehensive best.
According to the theoretical model, the corresponding function diagram (Figure 7) was drawn, and the best application interval of biological agents and fertilizer was calculated. The part of the graph with the maximum GRA-TOPSIS score of 0.5% as the optimal interval (GRA-TOPSIS score ∈ (0.61~0.61)). It was calculated that the optimal interval of fertilization was 111.74~120.86 kg·hm−2, and the optimal interval of adding biological agents was 14.43~17.23 kg·hm−2.

4. Discussion

There is an interactive relationship between soil microorganisms, plants, and the soil environment. In the cultivation of oil peony, as an example, not only the soil’s physical and chemical properties of the plants with black root rot were changed, but also the fungal network structure in the soil of diseased plants was more complex than that of healthy plants [45]. Long-term tillage or long-term fertilization will change the soil’s physical and chemical properties and soil microbial structure [46,47]. After long-term continuous cropping, the fungal colony of peanuts changed, the pathogenic fungi increased, and the beneficial fungi decreased. At the same time, the bacterial abundance decreased with the increase of continuous cropping years, and the soil microbial structure was destroyed, which led to a decrease in peanut yield [48,49]. There was a similar trend in the planting process of buckwheat and apple [50,51,52,53]. Long-term fertilization will also change the soil microbial structure [54]. Long-term application of nitrogen fertilizer will reduce the diversity of soil bacteria [55]. The experiment was carried out in alkaline soil (pH > 7.5), and the soil pH decreased after planting P. notoginseng. The experimental results showed that the pH value decreased significantly only in the F3C2 treatment and CK treatments (p < 0.05), and similar results also appeared in previous studies [56,57], mainly due to the selective absorption of ions by crops after fertilization. At the same time, NH4-N was acidic and easily neutralized with alkaline soil [58]. The experimental results showed that with a decrease in soil pH, the soil NH4-N decreased. The soil microbial community will degrade the residual plants deposited in the soil to provide energy for itself, but when the plant residual nitrogen cannot satisfy the microbial community, the microbial community will also absorb nitrogen in soil and fertilizer [59]. This is called nitrogen immobilization. AP and AK were significantly increased with the increase in fertilizer application, which was due to the accumulation of AP and AK in the soil because they were not fully absorbed and utilized by P. notoginseng after fertilization. TN and TP increased with the increase in fertilizer application rate, but the increase was not significant (p > 0.05). This may be due to the fact that exogenous N and P were not all absorbed and utilized by the roots of P. notoginseng after fertilization, and the remaining N and P were fixed and transformed into a steady state by soil. The experimental results are in good agreement with the previous experimental results [60].
Many microorganisms have the ability to promote plant growth and have beneficial effects on root systems and overall plant growth by colonizing the plant rhizosphere [29]. These bacteria have been designated as plant growth-promoting rhizosphere bacteria (PGPR). PGPR promotes plant growth mainly by improving plant abiotic stress tolerance; nutrient immobilization for plant absorption; plant growth regulators; production of iron carriers, and production of volatile organic compounds [61]. It has been confirmed that Bacillus subtilis is an excellent biocontrol bacterium in previous reports [62,63,64,65]. When applied, it will reduce the diversity of the fungal community in plant rhizosphere soil [66,67]. The diversity index of the fungal community in the rhizosphere soil of P. notoginseng decreased after the addition of biological agents in this experiment, which may be due to the antagonism between Bacillus subtilis and fungi in the soil after planting inhibiting the increase of fungi in the soil. Ascomycota, Mortierellomycota, and Basidiomycota were the dominant fungal species in the rhizosphere soil of P. notoginseng, which was similar to the results of the dominant species during the sitting period of wild ginseng [68]. Furthermore, the results of the genus-level analysis showed that Cylindrocarpon and Fusarium, which are considered to be the main pathogens causing P. notoginseng [14], showed different trends. Cylindrocarpon decreased in the F1C1, F2C1, and F3C2 treatments but increased slightly in other treatments. Fusarium was increased in the treatment of F1C2, F1C3, F2C1, F2C3, and F3C2. Some studies have shown that many species of Ilyonectria can cause plant root rot [69]. The same conclusion was drawn from the comparative experiment on the composition of rhizosphere fungi in healthy and diseased P. notoginseng soil [23]. However, the experimental results showed that the co-application of biological agents and fertilizers could not inhibit Ilyonectria. Therefore, the effects of biological agents on specific pathogenic fungi in complex soil environments need to be studied in more detail. Based on the diversity of soil fungal community and its inhibitory effect on some pathogenic fungi, the effect of Bacillus subtilis on the rhizosphere soil microenvironment of P. notoginseng was comprehensively evaluated. Bacillus subtilis has application potential.
The increase of soil nitrogen and phosphorus will increase the relative abundance of soil fungal pathogens [70]. Our experimental results showed that the nutrients in the rhizosphere soil of P. notoginseng showed a significant upward trend with the increase in fertilizer application rate. RDA analysis showed that NH4-N was negatively correlated with Rozellomycota, Basidiomycota, and Mortierellomycota, while AP was negatively correlated with Mortierellomycota. RDA analysis at the genus level showed that NH4-N was negatively correlated with the main pathogenic bacteria Cylindrocarpon, Fusarium, and Ilyonectria of P. notoginseng; AP was positively correlated with Cylindrocarpon, Fusarium, and Ilyonectria, the main pathogenic bacteria of P. notoginseng. AK in the rhizosphere soil of P. notoginseng also increased with the increase in fertilizer application. The results of RDA analysis were the same as AP, and the main pathogenic fungi were proportional to AK. Therefore, we speculated that excessive fertilization increased the increase of AP and AK in the rhizosphere soil of P. notoginseng, which was an indirect cause of P. notoginseng disease, which was confirmed in previous reports [71]. Soil pH has significant effects on microbial growth, community structure, and biomass [72,73,74]. High-pH soil was beneficial to bacterial growth, which led to the inhibition of fungal growth. RDA analysis at the gate level showed that soil pH was negatively correlated with Ascomycota, Rozellomycota, and Basidiomycota but positively correlated with Mortierellomycota. RDA analysis at the genus level showed that pH was positively correlated with Cephaliophora, Mortierella, and Chromelosporium and negatively correlated with others, including Cylindrocarpon, Fusarium, and Ilyonectria, the main pathogens of P. notoginseng root rot. This shows that the pathogenic fungi in the slightly alkaline soil will be inhibited to a certain extent with the increase in soil pH.
There is competition between pathogenic bacteria and probiotics in soil, which is one of the reasons for the change of colony structure in soil [75]. Previous studies have confirmed that this competition is mainly the competition for space and resources [76]. Strains that can reproduce rapidly tend to occupy more space and resources. When artificially increasing the number of probiotics in the soil can enhance the reproduction speed of probiotics, make them occupy space and resources faster, compress the living space and resources of pathogens, and finally achieve the role of inhibiting pathogens [77]. After long-term planting of a single crop, plant growth will be inhibited, which is also known as soil fatigue [78]. Previous studies have shown that the inhibitory effect of soil on plant growth is weakened after heating and disinfection at 100 °C, which indicates that soil fatigue is related to biological factors in biological soil, especially microbial communities [79]. The space and resources in the soil are often gradually occupied by pathogens with the increase of planting time, and the planting life of P. notoginseng is often longer, so P. notoginseng diseases caused by the imbalance of soil colony structure are particularly frequent [79]. The microbial structure in the soil is affected by many factors, such as plant root exudates, plant residue decay, external interference, and other factors. Our experimental results showed that the indicative species were different under different treatments, which indicated that the application of biological agents and fertilizers had complex effects on the colony structure in the soil. Therefore, in order to explore the changes of soil colony structure under specific exogenous interference, more detailed and in-depth research should be carried out.

5. Conclusions

The results showed that fertilization increased the nutrient content in the rhizosphere soil of P. notoginseng. Excessive fertilization was one of the causes of P. notoginseng disease. Co-application of bacterial fertilizer shows that Bacillus subtilis biological agent has potential application value in improving the rhizosphere soil fungal community of P. notoginseng.
According to the results of the GRA-TOPSIS theoretical model analysis, we established the theoretical model and obtained the theoretical optimal coupling scheme of bacterial fertilizer as follows: the amount of fertilizer application was 116.31 kg·hm−2, and the amount of bacteria application was 15.83 kg·hm−2. Taking part with the maximum score of 0.5% of GRA-TOPSIS as the optimal interval, it was calculated that the optimal range of fertilization was 111.74–120.86 kg·hm−2, and the optimal interval of adding biological agents was 14.43–17.23 kg·hm−2. Bacillus subtilis needs further study on other potential pathogens. Although our experiments have verified that the combined application of Bacillus subtilis biological agent and fertilizer has an inhibitory effect on pathogenic fungi in the soil, in the field where the actual situation is complex, the change of colony structure in soil needs further systematic and perfect demonstration.

Author Contributions

Conceptualization, Y.L. and Y.Z.; methodology, Y.Z.; software, X.Z.; validation, Y.L., J.L. and B.L.; formal analysis, Y.L.; investigation, Y.Z.; resources, Q.Y.; data curation, Y.Z. and N.C.; writing—original draft preparation, Y.Z.; writing—review and editing, Y.L. and J.L.; visualization, Y.Z.; supervision, Y.L. and B.L.; project administration, Q.Y.; funding acquisition, Q.Y. All authors have read and agreed to the published version of the manuscript.

Funding

This study was, in part, supported by Yunnan Fundamental Research Projects (grant No. 202101AT070125), supported by the National Natural Science Foundation of China (51979134), supported by the Analysis and Testing Founding of Kunming University of Science and Technology (grant No. 2021T20110170), Key projects of Yunnan Provincial Department of Science and Technology (202201AS070034), the Key Laboratory of Universities in Yunnan Province (KKPS201923009), Yunnan Provincial Field Scientific Observation and Research Station on Water-Soil-Crop System in Seasonal Arid Region (Grant No. 202305AM070006), supported by the Yunnan Fundamental Research Projects (No. 202301AU070061).

Informed Consent Statement

Informed consent was obtained from all subjects involved in the study.

Data Availability Statement

The data are contained within the article.

Acknowledgments

We thank Qiliang Yang and Jiaping Liang for their support and help in the research process.

Conflicts of Interest

The authors declare no conflict of interest.

References

  1. Sun, H.X.; Qin, F.; Ye, Y.P. Relationship between haemolytic and adjuvant activity and structure of protopanaxadiol-type saponins from the roots of Panax notoginseng. Vaccine 2005, 23, 5533–5542. [Google Scholar] [CrossRef] [PubMed]
  2. Zhao, H.; Han, Z.; Li, G.; Zhang, S.; Luo, Y. Therapeutic Potential and Cellular Mechanisms of Panax notoginseng on Prevention of Aging and Cell Senescence-Associated Diseases. Aging Dis. 2017, 8, 721–739. [Google Scholar] [CrossRef] [PubMed] [Green Version]
  3. Yang, M.; Yuan, Y.; Huang, H.; Ye, C.; Guo, C.; Xu, Y.; Wang, W.; He, X.; Liu, Y.; Zhu, S. Steaming combined with biochar application eliminates negative plant-soil feedback for sanqi cultivation. Soil Tillage Res. 2019, 189, 189–198. [Google Scholar] [CrossRef]
  4. Guo, W.Q.; Chen, Y.G.; Shi, R.Z.; He, K.; Wang, J.F.; Shao, J.H.; Wan, J.B.; Gao, J.L. 20(S)-Protopanaxdiol Suppresses the Abnormal Granule-Monocyte Differentiation of Hematopoietic Stem Cells in 4T1 Breast Cancer-Bearing Mouse. Evid. Based Complement Altern. Med. 2020, 2020, 8747023. [Google Scholar] [CrossRef] [PubMed] [Green Version]
  5. Hawthorne, B.; Lund, K.; Freggiaro, S.; Kaga, R.; Meng, J. The mechanism of the cytotoxic effect of Panax notoginseng extracts on prostate cancer cells. Biomed. Pharmacother. 2022, 149, 10. [Google Scholar] [CrossRef]
  6. Santhakumar, A.B.; Battino, M.; Alvarez-Suarez, J.M. Dietary polyphenols: Structures, bioavailability and protective effects against atherosclerosis. Food Chem. Toxicol. 2018, 113, 49–65. [Google Scholar] [CrossRef]
  7. Xia, P.; Guo, H.; Zhao, H.; Jiao, J.; Deyholos, M.K.; Yan, X.; Liu, Y.; Liang, Z. Optimal fertilizer application for Panax notoginseng and effect of soil water on root rot disease and saponin contents. J. Ginseng. Res. 2016, 40, 38–46. [Google Scholar] [CrossRef] [Green Version]
  8. Zhang, Y.; Ye, C.; Su, Y.; Peng, W.; Lu, R.; Liu, Y.; Huang, H.; He, X.; Yang, M.; Zhu, S. Soil Acidification caused by excessive application of nitrogen fertilizer aggravates soil-borne diseases: Evidence from literature review and field trials. Agric. Ecosyst. Environ. 2022, 340, 108176. [Google Scholar] [CrossRef]
  9. Fu, Y.; Dou, X.; Lu, Q.; Qin, J.; Luo, J.; Yang, M. Comprehensive assessment for the residual characteristics and degradation kinetics of pesticides in Panax notoginseng and planting soil. Sci. Total Environ. 2020, 714, 136718. [Google Scholar] [CrossRef]
  10. Jiang, N.; Qin, L.; Ye, Y. Research advances in diseases of Panax notoginseng. J. South. Argic. 2011, 42, 1070–1074. [Google Scholar]
  11. Li, J.B.; Bao, Y.L.; Wang, Z.R.; Yang, Q.; Cui, X.M. Research progress in diseases of Panax notoginseng. Physiol. Mol. Plant Pathol. 2022, 121, 8. [Google Scholar] [CrossRef]
  12. Tan, Y.; Cui, Y.; Li, H.; Kuang, A.; Li, X.; Wei, Y.; Ji, X. Rhizospheric soil and root endogenous fungal diversity and composition in response to continuous Panax notoginseng cropping practices. Microbiol. Res. 2017, 194, 10–19. [Google Scholar] [CrossRef]
  13. Ma, Y.N.; Chen, C.J.; Li, Q.Q.; Xu, F.R.; Cheng, Y.X.; Dong, X. Monitoring Antifungal Agents of Artemisia annua against Fusarium oxysporum and Fusarium solani, Associated with Panax notoginseng Root-Rot Disease. Molecules 2019, 24, 213. [Google Scholar] [CrossRef] [PubMed] [Green Version]
  14. Zuoqing, M.; Shidong, L.I.; Xingzhong, L.I.U.; Yujun, C.; Yunhua, L.I.; Yong, W.; Rongjun, G.U.O.; Zhenyuan, X.I.A.; Keqin, Z. The Causal Microorganisms of Panax notoginseng Root Rot Disease. Sci. Agric. Sin. 2006, 39, 1371–1378. [Google Scholar]
  15. Wei, S.; Sun, Y.; Xi, G.; Zhang, H.; Xiao, M.; Yin, R. Development of a single-tube nested PCR-lateral flow biosensor assay for rapid and accurate detection of Alternaria panax Whetz. PLoS ONE 2018, 13, e0206462. [Google Scholar] [CrossRef]
  16. Sunera; Amna; Saqib, S.; Uddin, S.; Zaman, W.; Ullah, F.; Ayaz, A.; Asghar, M.; Rehman, S.U.; Munis, M.F.H.; et al. Characterization and phytostimulatory activity of bacteria isolated from tomato (Lycopersicon esculentum Mill.) rhizosphere. Microb Pathog 2020, 140, 103966. [Google Scholar] [CrossRef]
  17. Ou, X.; Cui, X.; Zhu, D.; Guo, L.; Liu, D.; Yang, Y. Lowering Nitrogen and Increasing Potassium Application Level Can Improve the Yield and Quality of Panax notoginseng. Front. Plant Sci. 2020, 11, 595095. [Google Scholar] [CrossRef]
  18. Tuo, Y.; Wang, Z.; Zheng, Y.; Shi, X.; Liu, X.; Ding, M.; Yang, Q. Effect of water and fertilizer regulation on the soil microbial biomass carbon and nitrogen, enzyme activity, and saponin content of Panax notoginseng. Agric. Water Manag. 2023, 278, 108145. [Google Scholar] [CrossRef]
  19. Li, J.; Yang, Q.; Shi, Z.; Zang, Z.; Liu, X. Effects of deficit irrigation and organic fertilizer on yield, saponin and disease incidence in Panax notoginseng under shaded conditions. Agric. Water Manag. 2021, 256, 107056. [Google Scholar] [CrossRef]
  20. Zhang, Y.; Liang, J.; Tang, Z.; Yang, Q. Rain Shelter Cultivation Reduces Root Rot Incidence of Panax notoginseng by Altering Root Exudates and Bacterial Communities under Micro-Irrigation and Fertilization. Agronomy 2023, 13, 1257. [Google Scholar] [CrossRef]
  21. Singh, B.K.; Millard, P.; Whiteley, A.S.; Murrell, J.C. Unravelling rhizosphere-microbial interactions: Opportunities and limitations. Trends Microbiol. 2004, 12, 386–393. [Google Scholar] [CrossRef]
  22. Zhang, J.; Liu, W.; Wang, W. Effects of rhizosphere microbes and status of rihzosphere soil nutrients under different vegetations in south subtropical region. Soil Environ. Sci. 2002, 11, 279–282. [Google Scholar]
  23. Wu, Z.; Hao, Z.; Zeng, Y.; Guo, L.; Huang, L.; Chen, B. Molecular characterization of microbial communities in the rhizosphere soils and roots of diseased and healthy Panax notoginseng. Antonie Van Leeuwenhoek 2015, 108, 1059–1074. [Google Scholar] [CrossRef]
  24. Vacheron, J.; Desbrosses, G.; Bouffaud, M.L.; Touraine, B.; Moenne-Loccoz, Y.; Muller, D.; Legendre, L.; Wisniewski-Dye, F.; Prigent-Combaret, C. Plant growth-promoting rhizobacteria and root system functioning. Front. Plant Sci. 2013, 4, 356. [Google Scholar] [CrossRef] [Green Version]
  25. Chiappero, J.; Cappellari, L.d.R.; Sosa Alderete, L.G.; Palermo, T.B.; Banchio, E. Plant growth promoting rhizobacteria improve the antioxidant status in Mentha piperita grown under drought stress leading to an enhancement of plant growth and total phenolic content. Ind. Crops Prod. 2019, 139, 111553. [Google Scholar] [CrossRef]
  26. Cavagnaro, T.R.; Bender, S.F.; Asghari, H.R.; Heijden, M. The role of arbuscular mycorrhizas in reducing soil nutrient loss. Trends Plant Sci. 2015, 20, 283–290. [Google Scholar] [CrossRef] [Green Version]
  27. Bailey, K.L.; Lazarovits, G. Suppressing soil-borne diseases with residue management and organic amendments. Soil Tillage Res. 2003, 72, 169–180. [Google Scholar] [CrossRef]
  28. De Corato, U. Disease-suppressive compost enhances natural soil suppressiveness against soil-borne plant pathogens: A critical review. Rhizosphere 2020, 13, 100192. [Google Scholar] [CrossRef]
  29. Hashem, A.; Tabassum, B.; Fathi Abd Allah, E. Bacillus subtilis: A plant-growth promoting rhizobacterium that also impacts biotic stress. Saudi J. Biol. Sci. 2019, 26, 1291–1297. [Google Scholar] [CrossRef]
  30. Zhang, G.; Zhao, Z.; Yin, X.A.; Zhu, Y. Impacts of biochars on bacterial community shifts and biodegradation of antibiotics in an agricultural soil during short-term incubation. Sci. Total Environ. 2021, 771, 144751. [Google Scholar] [CrossRef]
  31. Qin, X.Y.; Zhang, K.D.; Fan, Y.Z.; Fang, H.; Nie, Y.; Wu, X.L. The Bacterial MtrAB Two-Component System Regulates the Cell Wall Homeostasis Responding to Environmental Alkaline Stress. Microbiol. Spectr. 2022, 15, e0231122. [Google Scholar] [CrossRef] [PubMed]
  32. Goswami, D.; Thakker, J.N.; Dhandhukia, P.C.; Tejada Moral, M. Portraying mechanics of plant growth promoting rhizobacteria (PGPR): A review. Cogent Food Agric. 2016, 2, 1127500. [Google Scholar] [CrossRef]
  33. Tripathi, D.K.; Singh, V.P.; Kumar, D.; Chauhan, D.K. Impact of exogenous silicon addition on chromium uptake, growth, mineral elements, oxidative stress, antioxidant capacity, and leaf and root structures in rice seedlings exposed to hexavalent chromium. Acta Physiol. Plant. 2011, 34, 279–289. [Google Scholar] [CrossRef]
  34. Emmert, E.A.B.; Handelsman, J. Biocontrol of plant disease: A (Gram-) positive perspective. FEMS Microbiol. Lett. 1999, 171, 1–9. [Google Scholar] [CrossRef] [PubMed]
  35. Stein, T. Bacillus subtilis antibiotics: Structures, syntheses and specific functions. Mol. Microbiol. 2005, 56, 845–857. [Google Scholar] [CrossRef]
  36. Caulier, S.; Nannan, C.; Gillis, A.; Licciardi, F.; Bragard, C.; Mahillon, J. Overview of the Antimicrobial Compounds Produced by Members of the Bacillus subtilis Group. Front. Microbiol. 2019, 10, 19. [Google Scholar] [CrossRef] [Green Version]
  37. Radhakrishnan, R.; Hashem, A.; Abd Allah, E.F. Bacillus: A Biological Tool for Crop Improvement through Bio-Molecular Changes in Adverse Environments. Front. Physiol. 2017, 8, 667. [Google Scholar] [CrossRef] [Green Version]
  38. Sun, B.; Bai, Z.; Bao, L.; Xue, L.; Zhang, S.; Wei, Y.; Zhang, Z.; Zhuang, G.; Zhuang, X. Bacillus subtilis biofertilizer mitigating agricultural ammonia emission and shifting soil nitrogen cycling microbiomes. Environ. Int. 2020, 144, 105989. [Google Scholar] [CrossRef]
  39. Gadhave, K.R.; Devlin, P.F.; Ebertz, A.; Ross, A.; Gange, A.C. Soil Inoculation with Bacillus spp. Modifies Root Endophytic Bacterial Diversity, Evenness, and Community Composition in a Context-Specific Manner. Microb. Ecol. 2018, 76, 741–750. [Google Scholar] [CrossRef] [Green Version]
  40. Chowdappa, P.; Mohan Kumar, S.P.; Jyothi Lakshmi, M.; Upreti, K.K. Growth stimulation and induction of systemic resistance in tomato against early and late blight by Bacillus subtilis OTPB1 or Trichoderma harzianum OTPB3. Biol. Control 2013, 65, 109–117. [Google Scholar] [CrossRef]
  41. Xueling, Z.; Chunhua, Z.; Ruyue, G.; Yichao, D.; Yangang, W.; Zhongxin, G.; Zhenzhong, Z.; Xueling, R. Effects of Biological Fertilizer on Rhizosphere and Endophytic Bacterial Community of Panax notoginseng with Continuous Cropping Disorder. J. Henan Agric. Sci. 2021, 50, 78–91. [Google Scholar] [CrossRef]
  42. Tang, J.; Han, H.; Liu, B.; Yang, Q.; Liu, X.; Liu, Y. Effects of irrigation frequency and fertilization amount on active ingredient accumulation and morbidity of Panax notoginseng. Trans. Chin. Soc. Agric. Eng. 2020, 36, 55–63. [Google Scholar]
  43. Bolyen, E.; Rideout, J.R.; Dillon, M.R.; Bokulich, N.A.; Abnet, C.C.; Al-Ghalith, G.A.; Alexander, H.; Alm, E.J.; Arumugam, M.; Asnicar, F.; et al. Reproducible, interactive, scalable and extensible microbiome data science using QIIME 2. Nat. Biotechnol. 2019, 37, 852–857. [Google Scholar] [CrossRef]
  44. Rodrigues, J.; Piedade, S.M.D.S.; Lara, I.A.R.d.; Henrique, F.H. Type I error in multiple comparison tests in analysis of variance. Acta Scientiarum. Agron. 2022, 45, e57742. [Google Scholar] [CrossRef]
  45. Jia, M.; Sun, X.; Chen, M.; Liu, S.; Zhou, J.; Peng, X. Deciphering the microbial diversity associated with healthy and wilted Paeonia suffruticosa rhizosphere soil. Front. Microbiol. 2022, 13, 967601. [Google Scholar] [CrossRef]
  46. Xiong, W.; Zhao, Q.; Zhao, J.; Xun, W.; Li, R.; Zhang, R.; Wu, H.; Shen, Q. Different continuous cropping spans significantly affect microbial community membership and structure in a vanilla-grown soil as revealed by deep pyrosequencing. Microb. Ecol. 2015, 70, 209–218. [Google Scholar] [CrossRef]
  47. Wang, C.; Lu, X.; Mori, T.; Mao, Q.; Zhou, K.; Zhou, G.; Nie, Y.; Mo, J. Responses of soil microbial community to continuous experimental nitrogen additions for 13 years in a nitrogen-rich tropical forest. Soil Biol. Biochem. 2018, 121, 103–112. [Google Scholar] [CrossRef]
  48. Chen, M.; Liu, H.; Yu, S.; Wang, M.; Pan, L.; Chen, N.; Wang, T.; Chi, X.; Du, B. Long-term continuously monocropped peanut significantly changed the abundance and composition of soil bacterial communities. PeerJ 2020, 8, e9024. [Google Scholar] [CrossRef]
  49. Chen, M.; Zhang, J.; Liu, H.; Wang, M.; Pan, L.; Chen, N.; Wang, T.; Jing, Y.; Chi, X.; Du, B. Long-term continuously monocropped peanut significantly disturbed the balance of soil fungal communities. J. Microbiol. 2020, 58, 563–573. [Google Scholar] [CrossRef]
  50. Wang, Y.; Zhang, Y.; Li, Z.-Z.; Zhao, Q.; Huang, X.-Y.; Huang, K.-F. Effect of continuous cropping on the rhizosphere soil and growth of common buckwheat. Plant Prod. Sci. 2019, 23, 81–90. [Google Scholar] [CrossRef] [Green Version]
  51. Mazzola, M.; Manici, L.M. Apple replant disease: Role of microbial ecology in cause and control. Annu. Rev. Phytopathol. 2012, 50, 45–65. [Google Scholar] [CrossRef] [PubMed]
  52. Yim, B.; Smalla, K.; Winkelmann, T. Evaluation of apple replant problems based on different soil disinfection treatments—Links to soil microbial community structure? Plant Soil 2012, 366, 617–631. [Google Scholar] [CrossRef]
  53. Weiss, S.; Bartsch, M.; Winkelmann, T. Transcriptomic analysis of molecular responses in Malus domestica ‘M26′ roots affected by apple replant disease. Plant Mol. Biol. 2017, 94, 303–318. [Google Scholar] [CrossRef] [PubMed]
  54. Li, M.; Wang, G.; Kang, X.; Hu, H.; Wang, Y.; Zhang, X.; Sun, X.; Zhang, H.; Hu, Z.; Xi, B. Long-term fertilization alters microbial community but fails to reclaim soil organic carbon stocks in a land-use changed soil of the Tibetan Plateau. Land Degrad. Dev. 2019, 31, 531–542. [Google Scholar] [CrossRef]
  55. Ren, N.; Wang, Y.; Ye, Y.; Zhao, Y.; Huang, Y.; Fu, W.; Chu, X. Effects of Continuous Nitrogen Fertilizer Application on the Diversity and Composition of Rhizosphere Soil Bacteria. Front. Microbiol. 2020, 11, 1948. [Google Scholar] [CrossRef]
  56. Francioli, D.; Schulz, E.; Lentendu, G.; Wubet, T.; Buscot, F.; Reitz, T. Mineral vs. Organic Amendments: Microbial Community Structure, Activity and Abundance of Agriculturally Relevant Microbes Are Driven by Long-Term Fertilization Strategies. Front. Microbiol. 2016, 7, 1446. [Google Scholar] [CrossRef] [Green Version]
  57. Lin, Y.; Ye, G.; Kuzyakov, Y.; Liu, D.; Fan, J.; Ding, W. Long-term manure application increases soil organic matter and aggregation, and alters microbial community structure and keystone taxa. Soil Biol. Biochem. 2019, 134, 187–196. [Google Scholar] [CrossRef]
  58. Dou, Y.; Lu, K.; Deng, P.; Zhang, F.; Zhang, X.; Luo, W. Study on the nitrogenous transformation in weak alkaline soil amended with different rates of nitrite. Appl. Chem. Ind. 2019, 48, 1830–1832, 1836. [Google Scholar]
  59. Chen, B.; Liu, E.; Tian, Q.; Yan, C.; Zhang, Y. Soil nitrogen dynamics and crop residues. A review. Agron. Sustain. Dev. 2014, 34, 429–442. [Google Scholar] [CrossRef] [Green Version]
  60. Oladele, S.O.; Adeyemo, A.J.; Awodun, M.A. Influence of rice husk biochar and inorganic fertilizer on soil nutrients availability and rain-fed rice yield in two contrasting soils. Geoderma 2019, 336, 1–11. [Google Scholar] [CrossRef]
  61. Vejan, P.; Abdullah, R.; Khadiran, T.; Ismail, S.; Nasrulhaq Boyce, A. Role of Plant Growth Promoting Rhizobacteria in Agricultural Sustainability—A Review. Molecules 2016, 21, 573. [Google Scholar] [CrossRef] [Green Version]
  62. Ali, M.A.; Ren, H.; Ahmed, T.; Luo, J.; An, Q.; Qi, X.; Li, B. Antifungal Effects of Rhizospheric Bacillus Species against Bayberry Twig Blight Pathogen Pestalotiopsis versicolor. Agronomy 2020, 10, 1811. [Google Scholar] [CrossRef]
  63. You, C.; Zhang, C.; Kong, F.; Feng, C.; Wang, J. Comparison of the effects of biocontrol agent Bacillus subtilis and fungicide metalaxyl–mancozeb on bacterial communities in tobacco rhizospheric soil. Ecol. Eng. 2016, 91, 119–125. [Google Scholar] [CrossRef]
  64. Gajbhiye, A.; Rai, A.R.; Meshram, S.U.; Dongre, A.B. Isolation, evaluation and characterization of Bacillus subtilis from cotton rhizospheric soil with biocontrol activity against Fusarium oxysporum. World J. Microbiol. Biotechnol. 2010, 26, 1187–1194. [Google Scholar] [CrossRef]
  65. Rahman, M.M.E.; Hossain, D.M.; Suzuki, K.; Shiiya, A.; Suzuki, K.; Dey, T.K.; Nonaka, M.; Harada, N. Suppressive effects of Bacillus spp. on mycelia, apothecia and sclerotia formation of Sclerotinia sclerotiorum and potential as biological control of white mold on mustard. Australas. Plant Pathol. 2016, 45, 103–117. [Google Scholar] [CrossRef]
  66. Sui, J.; Yu, Q.; Yang, K.; Yang, J.; Li, C.; Liu, X. Effects of Bacillus subtilis T6-1 on the Rhizosphere Microbial Community Structure of Continuous Cropping Poplar. Biology 2022, 11, 791. [Google Scholar] [CrossRef]
  67. Zhao, W.; Guo, Q.; Li, S.; Wang, P.; Dong, L.; Su, Z.; Zhang, X.; Lu, X.; Ma, P. Effects of Bacillus subtilis NCD-2 and broccoli residues return on potato Verticillium wilt and soil fungal community structure. Biol. Control 2021, 159, 104628. [Google Scholar] [CrossRef]
  68. Miao, C.P.; Mi, Q.L.; Qiao, X.G.; Zheng, Y.K.; Chen, Y.W.; Xu, L.H.; Guan, H.L.; Zhao, L.X. Rhizospheric fungi of Panax notoginseng: Diversity and antagonism to host phytopathogens. J. Ginseng. Res. 2016, 40, 127–134. [Google Scholar] [CrossRef] [Green Version]
  69. Cabral, A.; Groenewald, J.Z.; Rego, C.; Oliveira, H.; Crous, P.W. Cylindrocarpon root rot: Multi-gene analysis reveals novel species within the Ilyonectria radicicola species complex. Mycol. Prog. 2011, 11, 655–688. [Google Scholar] [CrossRef] [Green Version]
  70. Lekberg, Y.; Arnillas, C.A.; Borer, E.T.; Bullington, L.S.; Fierer, N.; Kennedy, P.G.; Leff, J.W.; Luis, A.D.; Seabloom, E.W.; Henning, J.A. Nitrogen and phosphorus fertilization consistently favor pathogenic over mutualistic fungi in grassland soils. Nat. Commun. 2021, 12, 3484. [Google Scholar] [CrossRef]
  71. Wu, F.; Cui, X.; Yang, Y.; Guan, H. Effects of soil pH values regulated by different fertilization on the disease incidence and growth of Panax notoginseng. J. Yunnan Univ. Nat. Sci. 2017, 39, 908–914. [Google Scholar]
  72. Kamble, P.N.; Gaikwad, V.B.; Kuchekar, S.R.; Bååth, E. Microbial growth, biomass, community structure and nutrient limitation in high pH and salinity soils from Pravaranagar (India). Eur. J. Soil Biol. 2014, 65, 87–95. [Google Scholar] [CrossRef]
  73. Rousk, J.; Brookes, P.C.; Bååth, E. Investigating the mechanisms for the opposing pH relationships of fungal and bacterial growth in soil. Soil Biol. Biochem. 2010, 42, 926–934. [Google Scholar] [CrossRef]
  74. Rousk, J.; Baath, E.; Brookes, P.C.; Lauber, C.L.; Lozupone, C.; Caporaso, J.G.; Knight, R.; Fierer, N. Soil bacterial and fungal communities across a pH gradient in an arable soil. ISME J. 2010, 4, 1340–1351. [Google Scholar] [CrossRef] [PubMed]
  75. Compant, S.; Brader, G.; Muzammil, S.; Sessitsch, A.; Lebrihi, A.; Mathieu, F. Use of beneficial bacteria and their secondary metabolites to control grapevine pathogen diseases. BioControl 2012, 58, 435–455. [Google Scholar] [CrossRef] [Green Version]
  76. Mousavi Khaneghah, A.; Abhari, K.; Eş, I.; Soares, M.B.; Oliveira, R.B.A.; Hosseini, H.; Rezaei, M.; Balthazar, C.F.; Silva, R.; Cruz, A.G.; et al. Interactions between probiotics and pathogenic microorganisms in hosts and foods: A review. Trends Food Sci. Technol. 2020, 95, 205–218. [Google Scholar] [CrossRef]
  77. Chen, Y.; Du, J.; Li, Y.; Tang, H.; Yin, Z.; Yang, L.; Ding, X. Evolutions and Managements of Soil Microbial Community Structure Drove by Continuous Cropping. Front. Microbiol. 2022, 13, 839494. [Google Scholar] [CrossRef]
  78. Wolińska, A.; Kuźniar, A.; Zielenkiewicz, U.; Banach, A.; Błaszczyk, M. Indicators of arable soils fatigue Bacterial families and genera: A metagenomic approach. Ecol. Indic. 2018, 93, 490–500. [Google Scholar] [CrossRef]
  79. Pervaiz, Z.H.; Iqbal, J.; Zhang, Q.; Chen, D.; Wei, H.; Saleem, M. Continuous Cropping Alters Multiple Biotic and Abiotic Indicators of Soil Health. Soil Syst. 2020, 4, 59. [Google Scholar] [CrossRef]
Figure 1. Heatmap diagram of the community structure of each group at the phylum level (Plotting a heatmap requires species relative abundance information. At the phylum level, we selected the top 15 relative abundance species for Heatmap drawing in groups. The Abscissa is sample information, the right ordinate is species annotation information, and the left ordinate is clustering information). (a) Heatmap diagram of the community structure of each group at the phylum level; (b) heatmap diagram of the community structure of each group at the genus level.
Agronomy 13 02093 g001
Figure 2. (a) Species accumulation curve. The horizontal axis represents the sample size, and the vertical axis represents the number of ASV detected. (b) Rank Abundance curve. Abscissa, which is sorted by ASV according to the number of sequences it contains.
Agronomy 13 02093 g002
Figure 3. (a) PCA analysis; (b) PCoA analysis based on the Bray–Curtis distance calculation method (c) Clustering tree based on binary-Jaccard distance.
Agronomy 13 02093 g003
Figure 4. Relative abundance of dominant phylum (a), relative abundance of dominant genus (b), and redundancy analysis of soil physical and chemical properties in the rhizosphere of P. notoginseng. NH4-N: Nitrate nitrogen; T-N: Total nitrogen; A-P: Available phosphorus; T-P: Total phosphorus A-K: Available potassium; PH: Soil pH value.
Agronomy 13 02093 g004
Figure 5. Indicator indicative species map. The first is the species gate level annotation information; the second is the species–genus level annotation information; the third column is the corresponding ASV; the bar chart is the relative abundance of each ASV, the Abscissa of the bubble chart is the sample grouping, and the bubble size represents the indicator value of each species in the sample group, that is, the indicative size of the species in the group.
Agronomy 13 02093 g005
Figure 6. The Abscissa is the measure of importance, and the ordinate is the species name sorted by importance. Standardized importance values are used by default.
Agronomy 13 02093 g006
Figure 7. A theoretical model based on GRA-TOPSIS scores. The X-axis is the amount of fertilizer, the kg·hm−2; Y-axis is the amount of biological agents, and the kg·hm−2; Z-axis is the GRA-TOPSIS score.
Agronomy 13 02093 g007
Table 1. The amount of fertilizer and biological agents.
TreatmentsFertilizer (kg·hm−2)Biological Agents (kg·hm−2)
CK00
F1C18010
F1C28010
F1C38010
F2C111015
F2C211015
F2C311015
F3C114020
F3C214020
F3C314020
Table 2. Physical and chemical properties of rhizosphere soil of P. notoginseng. (a, b, c, d indicate significant differences (p < 0.05) among treatments based on Duncan’s mean test).
TreatmentsPHNH4-N(mg·kg−1)AP
(mg·kg−1)
AK
(mg·kg−1)
TN
(mg·kg−1)
TP
(mg·kg−1)
Yield (g)
CK7.55 ± 0.06 a38.44 ± 0.94 a65.66 ± 4.25 d24.76 ± 1.25 a368.90 ± 10.27 a335.15 ± 7.56 c10.91 ± 0.72 a
F1C17.38 ± 0.03 a34.19 ± 0.50 b71.34 ± 4.36 cd26.10 ± 2.28 a369.27 ± 6.97 a448.72 ± 32.69 ab11.09 ± 0.48 a
F1C27.41 ± 0.02 a34.19 ± 1.20 b73.64 ± 8.82 cd26.4 ± 2.4 a373.94 ± 7.32 a396.32 ± 11.07 bc11.49 ± 0.29 a
F1C37.51 ± 0.01 a25.22 ± 0.52 c69.62 ± 10.23 cd25.50 ± 1.96 a369.83 ± 8.75 a449.36 ± 20.03 ab11.90 ± 0.51 a
F2C17.33 ± 0.01 a25.41 ± 0.45 c97.98 ± 8.04 abcd30.48 ± 2.49 a377.58 ± 11.52 a445.51 ± 14.69 ab12.55 ± 1.04 a
F2C27.45 ± 0.02 a25.55 ± 0.29 c99.42 ± 6.16 abc30.44 ± 2.09 a389.94 ± 11.25 a430.32 ± 14.77 ab11.99 ± 1.07 a
F2C37.36 ± 0.06 a24.44 ± 1.69 c91.50 ± 12.82 bcd30.42 ± 1.18 a379.77 ± 14.9 a455.99 ± 20.19 ab11.66 ± 1.51 a
F3C17.40 ± 0.02 a26.04 ± 0.12 c120.6 ± 8.99 ab30.60 ± 0.76 a399.46 ± 12.07 a495.13 ± 27.46 a11.71 ± 0.42 a
F3C27.32 ± 0.03 b27.08 ± 0.46 c126.37 ± 7.54 a31.05 ± 1.39 a403.62 ± 1.96 a410.43 ± 3.34 b11.44 ± 0.74 a
F3C37.36 ± 0.04 a25.83 ± 0.48 b125.46 ± 7.11 a30.65 ± 3.22 a400.68 ± 2.48 a453.64 ± 22.35 ab13.05 ± 20 a
NH4-N: soil ammonium nitrogen, TN: total nitrogen, AP: available phosphorus, TP: total phosphorus, AK: available potassium. CK: blank control group, F1C1: low fertilizer and low bacteria, F1C2: low fertilizer and medium bacteria, F1C3: low fertilizer and high bacteria, F2C1: medium fertilizer and low bacteria, F2C2: medium fertilizer bacteria, F2C3: medium fertilizer and high bacteria, F3C1: high fertilizer and low bacteria, F3C2: high fertilizer and medium bacteria, F3C3: high fertilizer and high bacteria.
Table 3. The relative abundance of different treatments at the phylum level. Different values in the table represent the percentage of relative abundance, %.
TreatmentsAscomycotaMortierellomycotaBasidiomycota
CK50.5421.4818.17
F1C183.415.154.22
F1C267.1711.0811.29
F1C349.0626.7113.09
F2C140.6123.3626.13
F2C247.5325.1214.49
F2C342.8619.7725.63
F3C153.8516.5915.75
F3C295.321.053.10
F3C363.4711.5314.39
Table 4. The relative abundance of different treatments at the genus level. Different values in the table represent the percentage of relative abundance, %.
TreatmentsPezizaMortierellaIlyonectriaCylindrocarponFusariumTrichodermaCephaliophoraMinimelanolocus
CK0.028.851.890.122.341.753.280.02
F1C102.770.640.075.095.520.590.02
F1C20.014.256.0433.022.091.251.160.05
F1C308.804.610.301.560.932.950.02
F2C10.0117.036.630.080.690.861.050.05
F2C2010.171.890.192.710.810.500.05
F2C30.015.282.550.152.141.060.610.04
F3C107.597.850.263.732.411.230.44
F3C291.160.190.440.011.520.260.100.01
F3C30.065.052.560.426.381.842.2911.72
Table 5. Alpha diversity of fungi in rhizosphere soil of P. notoginseng. The data in the table are average ± standard error, and those with the same letter after the same column of data indicate that there is no significant difference between processing (p > 0.05, Duncan’s method).
TreatmentsASVChao1ShannonSimpsonACE
CK342 ± 15.00 a342.31 ± 14.62 a5.99 ± 0.13 a0.95 ± 0.011 a342.63 ± 14.58 a
F1C1224 ± 7.00 c224.14 ± 7.41 c3.49 ± 0.21 c0.69 ± 0.052 b224.07 ± 7.93 c
F1C2311 ± 36.00 ab310.65 ± 36.21 ab4.96 ± 0.44 b0.86 ± 0.045 a310.40 ± 36.05 ab
F1C3307 ± 46.00 ab306.68 ± 46.25 ab6.01 ± 0.04 a0.95 ± 0.007 a306.83 ± 46.29
F2C1232 ± 9.00 bc232.01 ± 9.01 bc5.43 ± 0.10 ab0.95 ± 0.004 a231.82 ± 9.18 bc
F2C2341 ± 6.00 a340.98 ± 6.59 a5.97 ± 0.09 a0.96 ± 0.005 a341.16 ± 6.68 a
F2C3233 ± 7.00 bc233.33 ± 7.22 bc4.77 ± 0.36 b0.87 ± 0.044 a233.26 ± 7.50 bc
F3C1320 ± 9.00 a320.09 ± 9.20 a5.91 ± 0.20 a0.95 ± 0.009 a319.95 ± 9.42 a
F3C275 ± 3.00 d74.54 ± 3.90 d0.77 ± 0.25 d0.16 ± 0.065 c74.56 ± 4.49 d
F3C3340 ± 15.00 a340.34 ± 15.50 a5.87 ± 0.08 a0.95 ± 0.012 a340.33 ± 15.48 a
ASV is the Amplicon Sequence Variant (amplified subsequence variation). Each de-duplicated feature sequence is produced by quality control operations such as denoising and splicing by the DADA2 method. The abundance table of these sequences in the sample is called feature table (feature-table); Chao index: The actual number of species in the community was estimated by calculating the ASV of only one or two reads in the community; Shannon index: the higher the species diversity is, the more uniform the species distribution is, and the larger the Shannon index value is (which can reflect both the species richness and the evenness of distribution); Simpson index: the probability that two randomly selected individuals belong to different species. The higher the Simpson index, the higher the community diversity; Ace index: an index used to estimate the number of ASV in a community.
Table 6. The main indicative species, The “\” in the indicative species column, indicates that there is no indicative species indicator.values > 0.75.
TreatmentsIndicative SpeciesIndicator.Values
CKASV_94.Basidiomycota.Melanophyllum0.93
ASV_217.Basidiomycota.Subulicystidium0.90
F1C1\\
F1C2ASV_5.Ascomycota.Cylindrocarpon0.99
F1C3ASV_100.Ascomycota.Coleophoma0.88
F2C1ASV_36.Mortierellomycota.Mortierella0.96
F2C2ASV_129.Ascomycota.Paraboeremia0.96
F2C3\\
F3C1ASV_191.Ascomycota.Cephaliophora0.95
F3C2ASV_1.Ascomycota.Peziza1.00
F3C3ASV_235.Basidiomycota.Thanatephorus1.00
ASV_202.Basidiomycota.Thanatephorus1.00
ASV_20.Ascomycota.Minimelanolocus0.99
ASV_67.Ascomycota.Dactylonectria0.87
Table 7. GRA-TOPSIS analysis results.
TreatmentsScoreSort
CK0.516
F1C10.487
F1C10.458
F1C20.535
F2C30.573
F2C20.574
F2C30.602
F3C10.4210
F3C20.631
F3C30.459
Disclaimer/Publisher’s Note: The statements, opinions and data contained in all publications are solely those of the individual author(s) and contributor(s) and not of MDPI and/or the editor(s). MDPI and/or the editor(s) disclaim responsibility for any injury to people or property resulting from any ideas, methods, instructions or products referred to in the content.

