Article

Scale Effects on the Reduction of Drainage Water and Nitrogen and Phosphorus Loads in Hilly Irrigation Areas

1
Agricultural Water Conservancy Department, Changjiang River Scientific Research Institute, Wuhan 430010, China
2
Key Laboratory of River Regulation and Flood Control of Ministry of Water Resources, Changjiang River Scientific Research Institute, Wuhan 430010, China
*
Author to whom correspondence should be addressed.
Agronomy 2023, 13(8), 2083; https://doi.org/10.3390/agronomy13082083
Submission received: 26 February 2023 / Revised: 24 July 2023 / Accepted: 5 August 2023 / Published: 8 August 2023

Abstract

:
The objectives of this study were to clarify the effects of scale on farmland drainage water and the nitrogen and phosphorusload discharged in hilly irrigation areas. An experimental study was conducted to monitor the drainage water volume and nitrogen and phosphorus concentrations at the field, lateral ditch (with a control area of 1.16 km2), branch ditch (with a control area of 7.76 km2), and watershed (with a control area of 43.3 km2) scales in the Yangshudang watershed of the Zhanghe Irrigation District during the rice growth period in 2022. The results showed that from the field scale to the watershed scale, the volume of drainage water, total nitrogen load, nitrate nitrogen load, ammonia nitrogen load, and total phosphorus load per unit area were reduced by 74.6%, 88%, 85%, 87%, and 60%, respectively. The loads of total nitrogen, nitrate nitrogen, ammonia nitrogen, and total phosphorus decreased with the increase of scale, showing a pronounced scale effect; however, the infrequent recharge of ponds and weirs and the insufficient storage capacity of ditches led to an increase in nitrogen and phosphorus concentrations and hence an increase in the load discharge instead, as in the branch ditch scale of this study. The scale effect was mainly caused by the reuse of farmland drainage water; thus, the ability of ponds and weirs, ditches, and reservoirs in hilly irrigation areas to regulate nitrogen and phosphorus concentrations should be improved. Irrigation methods have a significant influence on nitrogen and phosphorus load discharge. The control of farmland non-point sources in hilly irrigation areas should focus on controlling drainage water at the late tillering stage and improving the recharge function of ponds and weirs and the storage capacity of ditches above the branch ditch scale so as to control the concentrations of nitrogen and phosphorus pollutants.

1. Introduction

Irrigated areas are of great significance to guarantee the grain production security in China. Due to the spatial variability of underlying surface properties and human activities on the water cycle, the water cycle process in irrigated areas not only includes precipitation, evaporation, seepage, and runoff in natural watersheds, but is also affected by irrigation, drainage, and water storage, so the water cycle process varies greatly among different scales [1,2]. A large number of experiments and studies have been carried out on the water cycle and transformation regularity at the farmland scale and at irrigation units. On the basis of experimental observations, evapotranspiration [3], vertical seepage [4], lateral seepage [5,6], water absorption by roots [7], drainage [8], and other elements have been numerically simulated, and different models for the water transformation process at field scales have been developed [9,10,11,12]. The water balance model, hydrodynamics model, and watershed hydrological model are often used to study the water cycle process in irrigated areas. For example, Cui et al., 2018 [13] used the improved SWAT model to study the water cycle process in the irrigated area of the Tongjiqiao Reservoir in Zhejiang Province. Gosain et al., 2005 [14] applied the SWAT model to study the spatial-temporal variation characteristics of groundwater regression caused by irrigation in the Pslleru Basin, India, and predicted the runoff of the basin without human intervention (reservoir management and irrigation). Gosain et al., 2005 [14] also evaluated the influence of irrigation and other human activities on regional water balance. Cui et al., 2006 [15] believed that reclaimed water and reuse existed in the water cycle process of irrigated areas due to irrigation and rainfall. Schulze, 2000 [16] found significant differences in water movement in irrigated areas at different spatial and temporal scales. Loeve et al., 2004 [17] studied the water productivity at different scales in the Zhanghe irrigated area and found that, influenced by the reuse of irrigation backwater, the water productivity based on irrigation water consumption was lowest at the channel scale and highest at the irrigated area scale.
Southern China is rich in water resources, and the rainfall is sufficient to easily cause a coincidence of rainfall and fertilizer from May to September, which, in turn, causes a large amount of farmland nitrogen and phosphorus runoff losses. Rice field and dryland field rotation have been widely used in this irrigation area and have resulted in the boundary of the land and the watershed changing in one or several rotation cycles. This has aggravated the spread of nitrogen and phosphorus, easily triggering non-point source pollution. In addition, the river network and the canal system in the irrigated area are interlaced, connecting farmland with the main river and lake, providing convenient conditions for the diffusion of nitrogen and phosphorus in the farmland. In addition, flood irrigation has been adopted in southern China, and in order to improve production, the use of chemical fertilizers and pesticides is high, resulting in increasingly serious non-point source pollution. In recent years, many studies have been carried out on water saving and emission reduction in irrigated areas [18,19,20,21,22].
Using the water cycle as a carrier to study the patterns of the migration and transformation of pollutants at different scales in irrigation areas, especially nitrogen and phosphorus, the most important pollution factors, is of great significance for water conservation and discharge reduction in China’s southern irrigation areas. A previous study showed that there are significant differences in the migration and transformation of nitrogen and phosphorus at different scales in irrigation areas [23]. The migration and transformation of nitrogen and phosphorus at the field scale are affected by factors such as fertilization, irrigation, and precipitation [24,25]. In contrast, the migration and transformation of nitrogen and phosphorus in ditches, ponds, and weirs are affected by factors such as the project layout, vegetation types, irrigation and drainage management measures, and seasons [26]. The amount of pollution produced at the source is not equal to the amount of discharge that finally enters the downstream water bodies during the migration and transformation of nitrogen and phosphorus in farmland to the downstream, during which nitrogen and phosphorus are subject to plant uptake, nitrification–denitrification, soil adsorption, and drainage water reuse. This pattern of changes in non-point source pollution with the increase of scale is known as the scale effect on non-point source pollution discharge [27]. A study by He et al. [28], 2010, on the nitrogen and phosphorus discharge of paddy fields at six scales in the Zhanghe Irrigation District found that the nitrogen and phosphorus load discharged from paddy fields decreased as the scale increased. Based on the SWAT model, Liu et al., 2016 [29] found that agricultural non-point source pollution in the Fangxihu Irrigation District had a greater reduction effect at the field scale than at the watershed scale, which implied that improving the field irrigation methods at the source could achieve a better pollution reduction effect. Chen et al., 2016 [30] used the SWAT model to simulate and analyze the change pattern of total nitrogen (TN) and total phosphorus (TP) load discharge with the increase of the scale under different scenarios, and their results showed that the TN and TP load discharge per unit area increased gradually with the increase of the scale due to the increase in the proportion of paddy field area as the scale increased. In hilly irrigation areas, due to their topography, drainage occurring in the fields after precipitation or irrigation is characterized by high intensity and short duration, and ponds and weirs and ditches of various scales are the first carriers to receive the drainage water. The recycling of this water is an important cause of the scale effect on the nitrogen and phosphorus load discharged in irrigation areas [31,32,33,34,35]. The focus and challenges of the current research center on the relationship between the reduction or increase of nitrogen and phosphorus loads at different scales, the mechanisms underlying this reduction or increase, and how to quantitatively describe and predict the changes in nitrogen and phosphorus pollution loads at different scales.
In this study, a relatively closed zone was selected in a hilly irrigation area, and four nested scales from small to large, namely the field, lateral ditch, branch ditch, and watershed scales, were set up. Monitoring experiments on the volume of irrigation water, the volume of drainage water, and the water quality were conducted during rice growth stages in 2022 to investigate the changes in the volume of drainage water, the nitrogen and phosphorus concentrations in the drainage water, and the nitrogen and phosphorus load discharged at different scales, and to analyze the influence of scale on the drainage water quality and pollution load, with an aim of revealing the mechanism of the scale effect in hilly irrigation areas and providing a basis for the targeted prevention and control of non-point source pollution in irrigation areas.

2. Materials and Methods

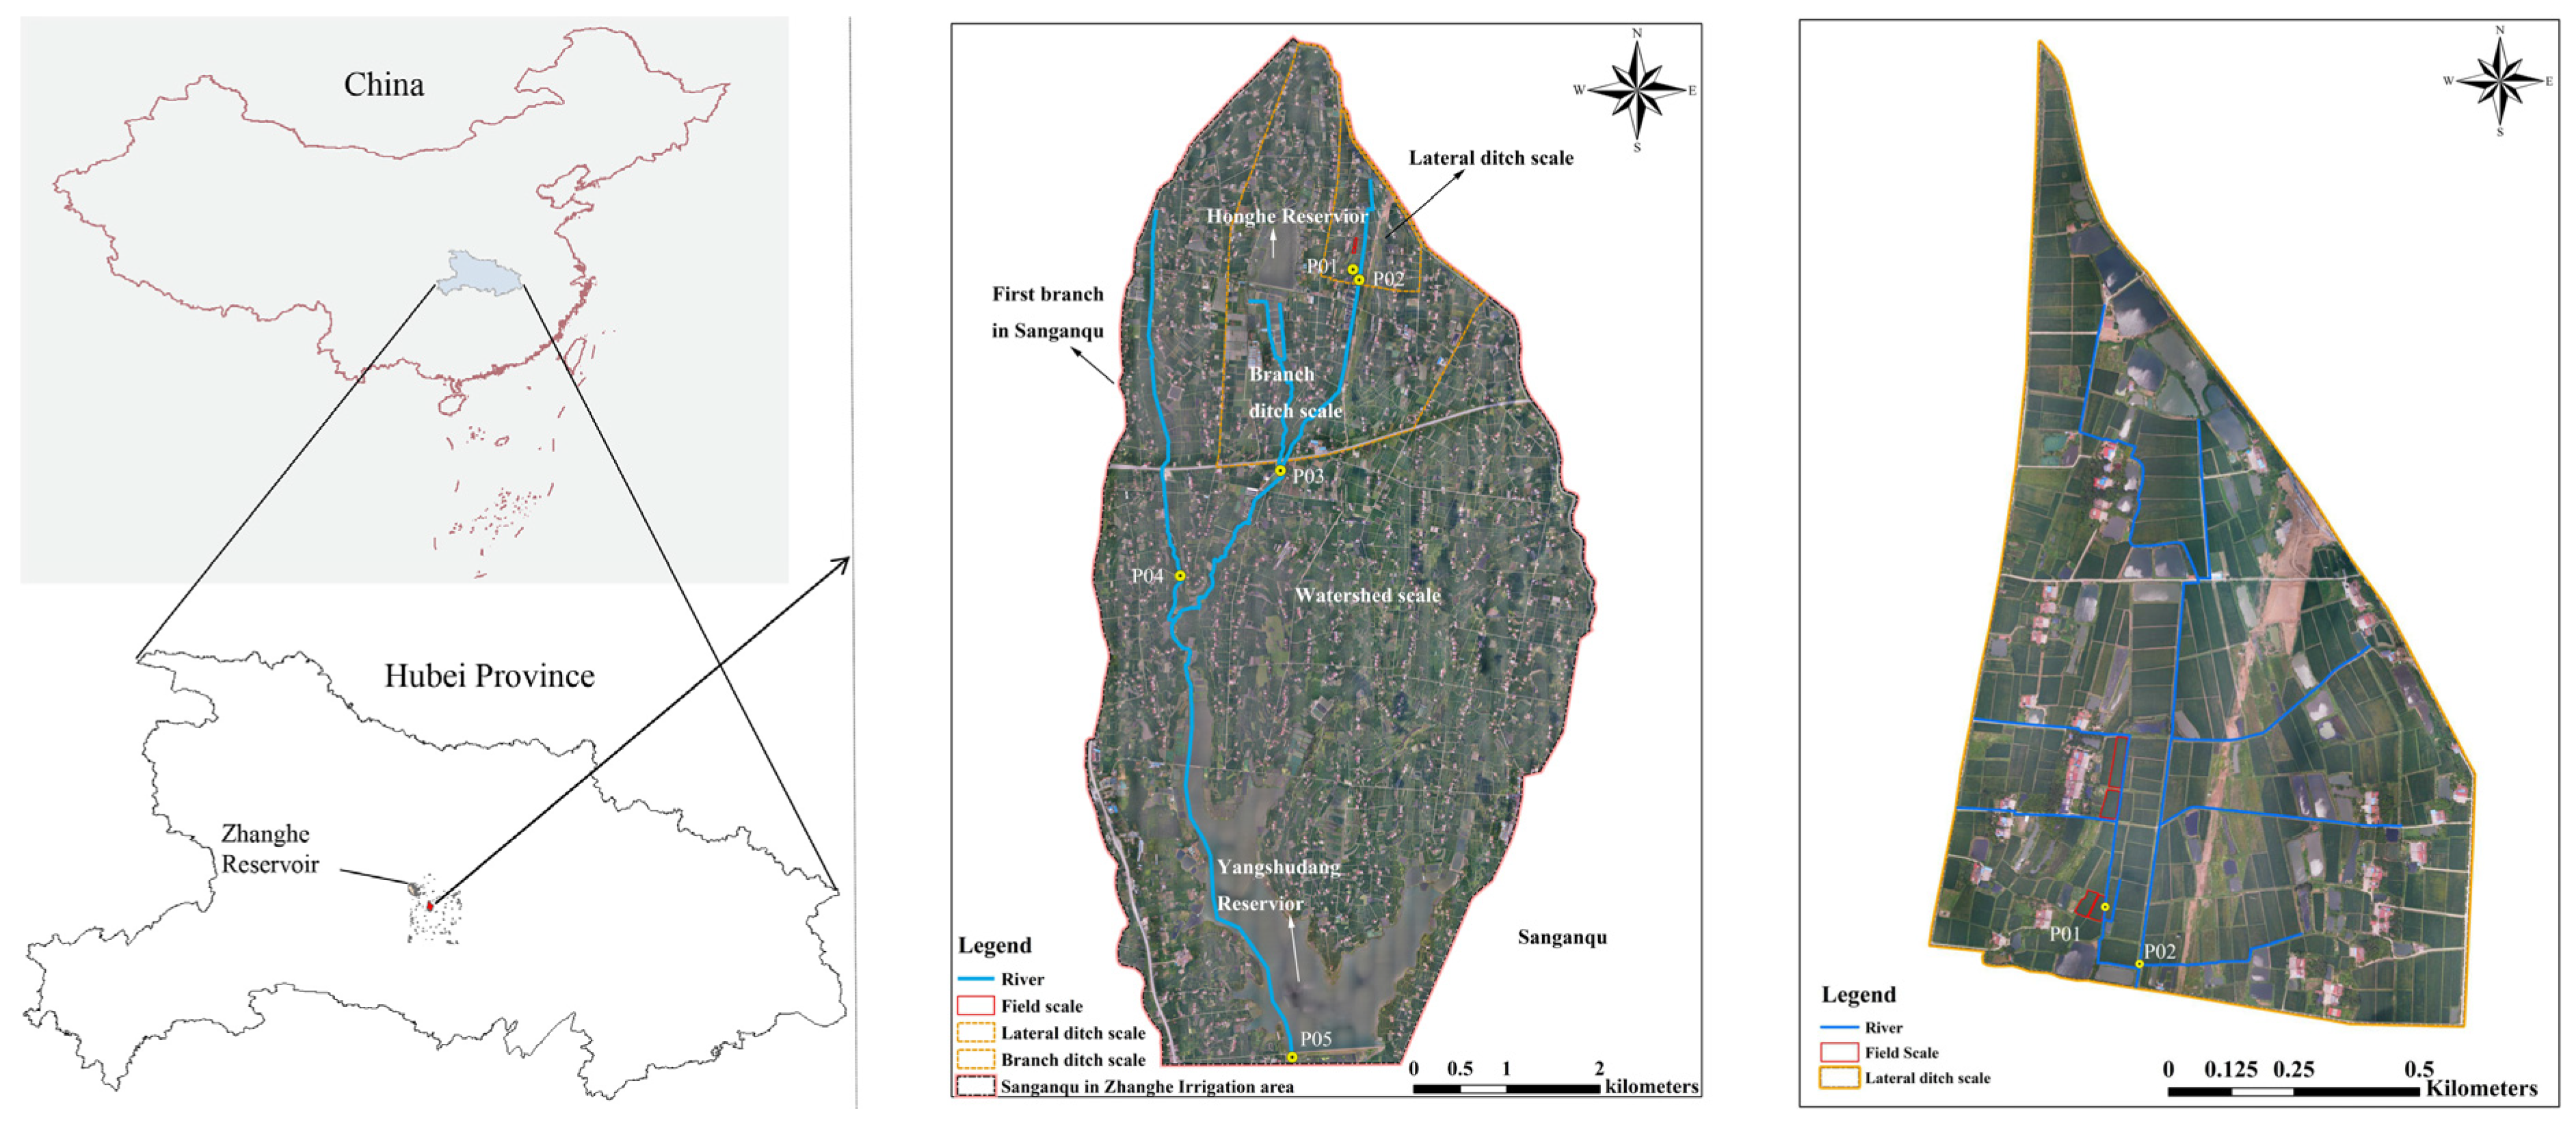
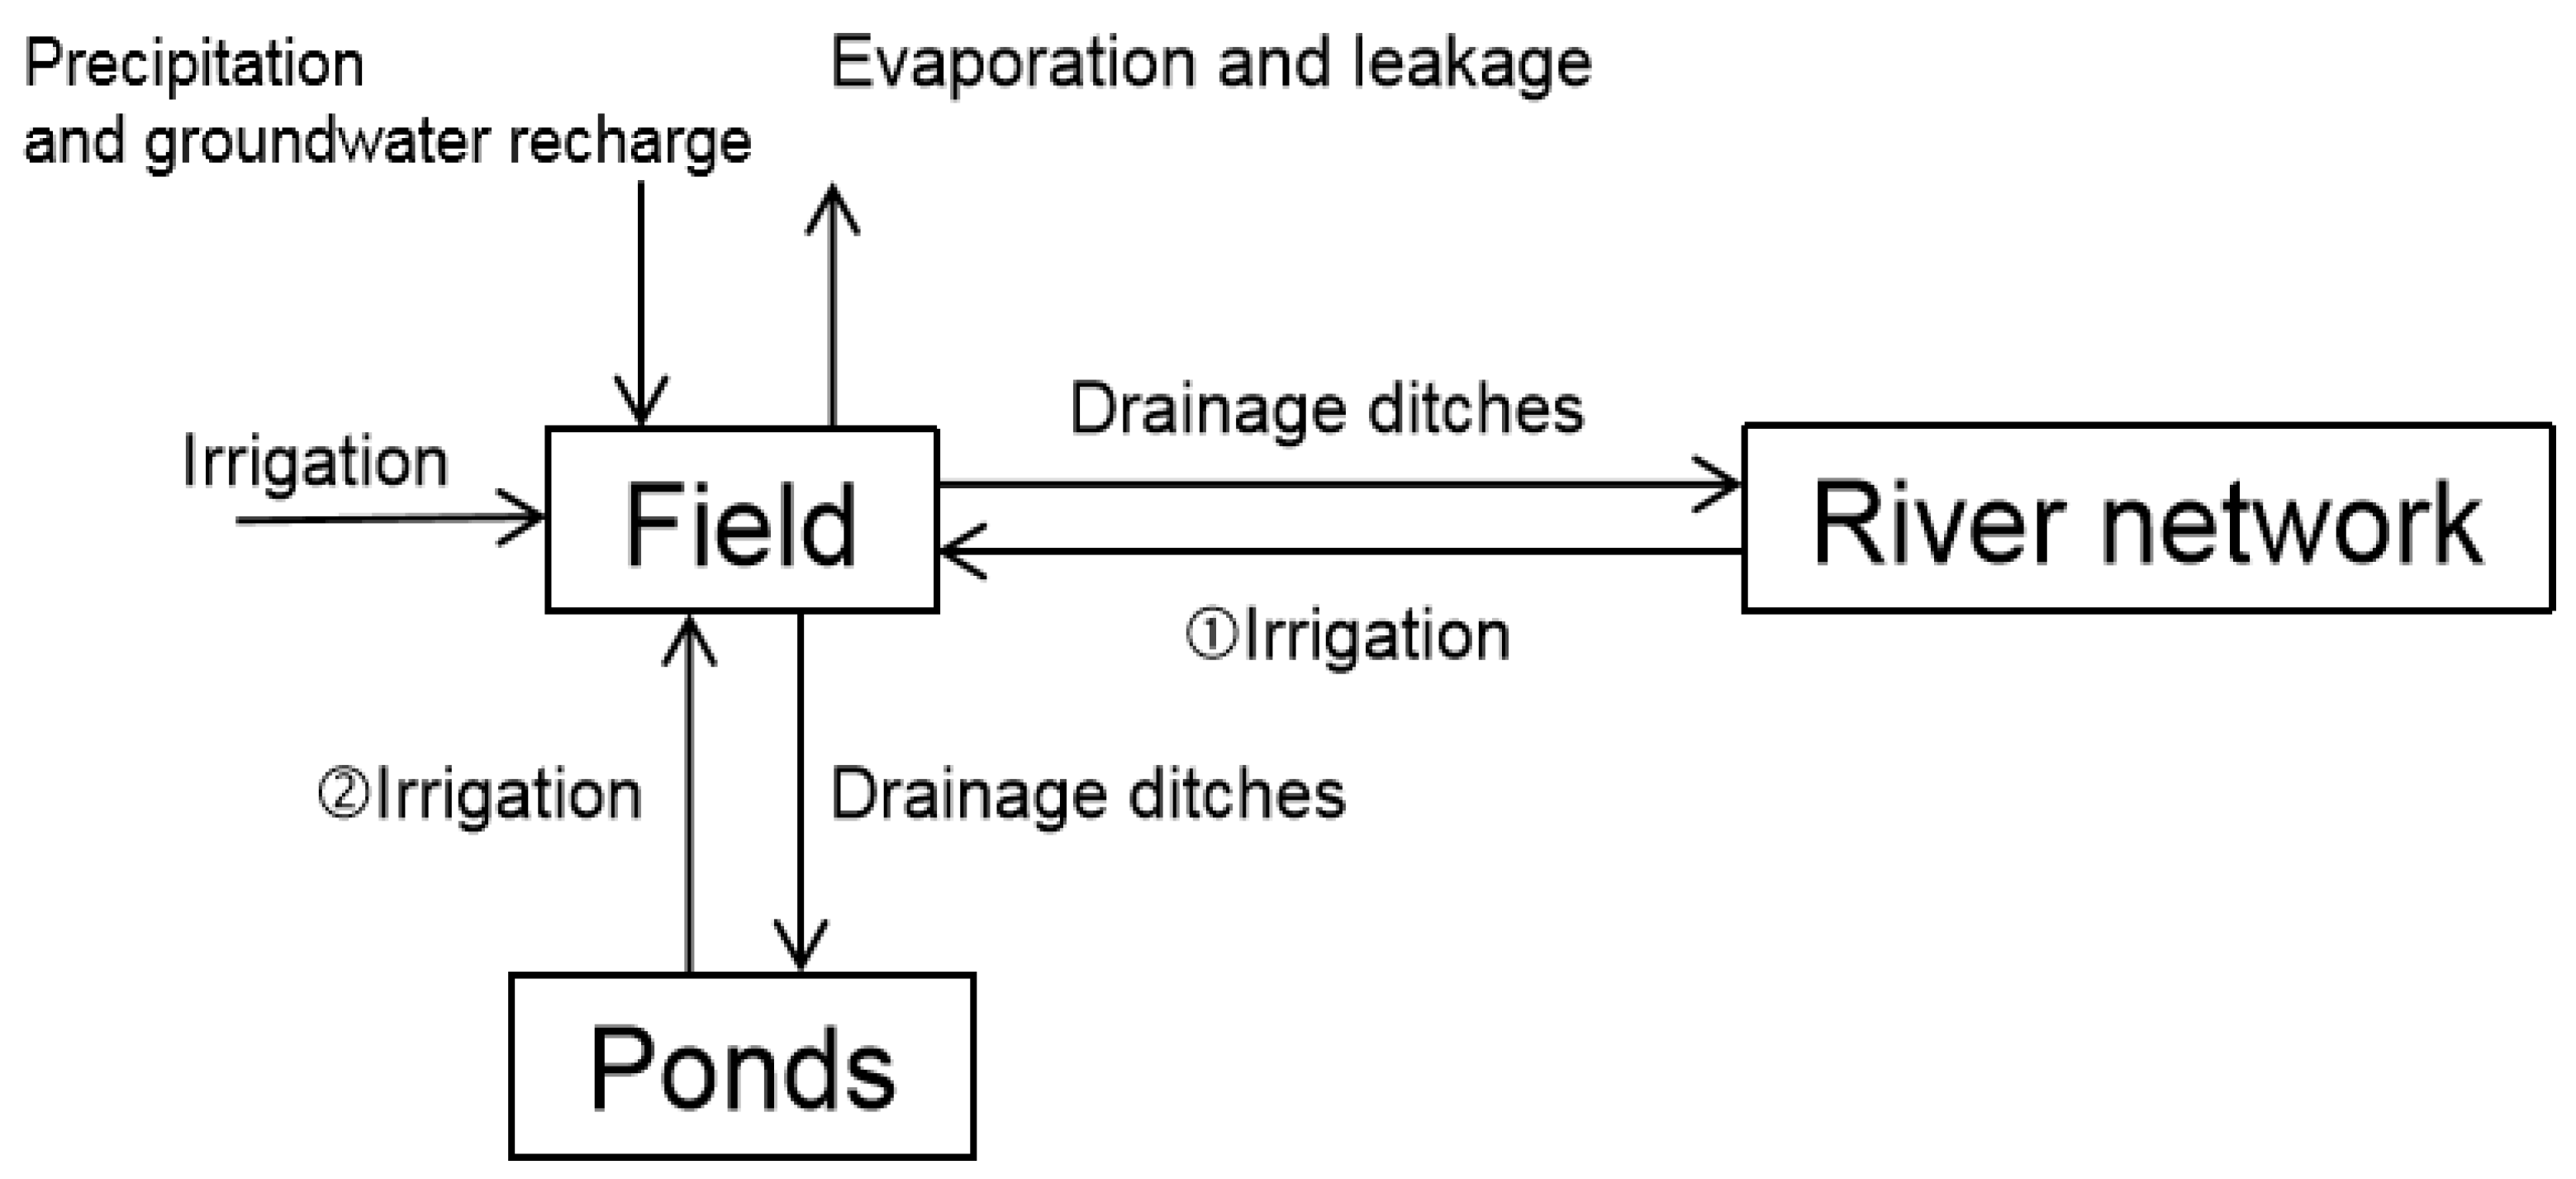
2.1. Overview of the Experimental Area

The experimental area was located in the Yangshudang watershed of the Zhanghe Irrigation District. Three catchment scales, namely the lateral ditch, branch ditch, and watershed scale, were delineated based on elevation lines to form, with the experimental field, study areas at four scales. The four study scales were nested successively from small to large, and each was relatively closed. The basic situation of each scale was as follows: (1) Watershed scale: located between Sanganqu and the first branch of Sanganqu in the Zhanghe Irrigation District, this was a relatively closed area within the Zhanghe Irrigation District, with an area of about 43.3 km2. (2) Branch ditch scale: the closed area formed by two branch canals near the Honghe reservoir upstream of the Yangshudang watershed. The outer ring line was selected as the study area at the branch ditch scale, with an area of 7.76 km2. (3) Lateral ditch scale: the relatively closed area between two lateral canals was selected as the study area at the lateral ditch scale, with a total area of about 1.16 km2. (4) Field scale: four paddy field plots where lateral ditches were drained directly within the area at the lateral ditch scale were selected as a typical experimental field. The land in the studied area was used mainly for middle rice cultivation during the trial period for many years. The relative locations of the study areas at different scales are shown in Figure 1.

2.2. Data Collection and Processing

2.2.1. Fertilizer

The fertilizer was applied twice during the whole growth phase. The base fertilizer was applied on 16 May, and the nitrogen, phosphorus, and potassium compound fertilizer was 675 kg per hectare. Topdressing was performed on 28 May, applying 58 kg urea per hectare.

2.2.2. Sampling and Measurement

Water quantity. We installed water level monitoring equipment, HOBO (U20L-04), at each drainage outlet and collected data once every 10 d. In the process of rainfall, irrigation or drainage, the water level-velocity relationship curve was monitored, and the drain outflow and irrigation amount were calculated according to the curve.
Field discharge (P01). Field discharge was measured by the Bacher tank installed at the field drainage outlet.
Lateral ditch scale discharge (P02). A triangular weir was installed to obtain the water level-velocity curve.
Branch ditch scale discharge (P03). A wide-crest weir was installed to measure the flow.
Watershed scale discharge (P05). The drainage was measured according to gate opening.
Rainfall. The HOBO RG3 tip-bucket self-recording rain gauge was installed in the study area.
Water quality. Sampling at the HOBO installation site was performed every 10 days, increasing the frequency after irrigation, rainfall, and fertilization. After the rainfall, samples were taken on the 1st day, 3rd day, 5th day, 7th day, and 9th day after the rain. Water samples were collected and refrigerated. Field surface water and deep seepage water samples were taken at the same time as drainage water samples.
The deep seepage water was collected by a PVC pipe like shaped like a “7.” The transverse section was about 50 cm and buried 40 cm underground horizontally. Small holes with a diameter of about 5 mm were made on the wall of the pipe, and the filter gauze was wrapped. The vertical section was exposed to the ground vertically with a lid at the top, which was closed when not sampling. Water was pumped out 12 h in advance when sampling.
Field surface water samples were taken directly from the surface. In the field, 5 points were selected according to the shape of plum blossom, and 5 water samples were mixed in equal amounts as primary sample.
A total of 255 samples were sampled during the rice growth period in 2022, and the sample date is shown in Table 1. Total nitrogen, nitrate nitrogen, ammonia nitrogen, and total phosphorus were determined by a continuous-flow-chemical analyzer (AA3).

2.2.3. Data Processing

According to the monitored nitrogen and phosphorus concentrations in farmland drainage water and in drainage ditches of different scales as well as the corresponding volumes of drainage water, the load W carried in each drainage process during the monitoring period was calculated using Equation (1) based on the calculation principle of the average concentration method.
W = C ¯ 0 t Q ( t ) d t = C ¯ Q ,
where C ¯ is the mass concentration of nitrogen and phosphorus pollutants in the drainage water, mg/L; Q ( t ) is the drainage flow rate, m3/s; and Q is the total volume of drainage water at all scales, m3. Three parallel samples were measured at each point to ensure the accuracy of the concentration. The standard deviation of statistical parameters was used to evaluate the reliability of the 255 samples [36].

3. Results

Field water balance elements and field water quality were analyzed. Nitrogen and phosphorus load discharge in the field were calculated by the volume and concentration. Changes in the volume of drainage water at different scales are shown by graphs and tables. Variations in the nitrogen and phosphorus loads in the drainage water with the increase of scale were analyzed.

3.1. Change Pattern of Field Water Balance Elements

Table 2 shows the field water balance elements. As we can see from the table, a total of 475 mm of precipitation fell during the rice growth period in 2022. Precipitation was mainly concentrated in the tillering stage and jointing-booting stage, with 300.5 mm of precipitation in the tillering stage accounting for 63.2% of the total precipitation.
The typical experimental field was irrigated 12 times during the whole growth period, using a total volume of irrigation water of 317.1 mm. During irrigation, 49.5% was applied at the regreening stage, about 20% at the tillering stage, 18.5% at the heading-flowering stage, and 10.9% at the milk stage.
Evapotranspiration was the main form of water output from the field, accounting for 45.4% of the output water, followed by drainage water (35.7%), as well as deep seepage and lateral seepage, which were largely the same and each accounted for 9.6% and 9.3% of the output water, respectively. The evapotranspiration of rice at the jointing-booting stage and at the heading-flowering stage were 23.8% and 23.3%, respectively, which were larger than that at other growth stages.
The volume of deep seepage in the field was large at the regreening stage and the early tillering stage, about twice that at other growth stages. During this period of time, the field needed soaking irrigation to maintain a certain depth of the water layer on the field surface, thus resulting in a large volume of deep seepage.
The volume of lateral seepage was ranked in the order of regreening stage > early tillering stage > heading-flowering stage > jointing-booting stage > late tillering stage > milk stage > yellow ripening stage. This was because there was a large volume of irrigation water but a small amount of precipitation at the regreening stage, so the drainage ditches adjacent to the field were basically dry, resulting in an increase in the volume of lateral seepage. In contrast, there were large volumes of precipitation and drainage water at the late tillering stage, with precipitation accounting for 42.3% of the total precipitation and drainage water accounting for 43.0% of the total drainage water, resulting in a certain volume of water in the adjacent ditches. Therefore, there was a low volume of lateral seepage from the field to the ditches, indirectly indicating that irrigation had a greater influence on lateral seepage than precipitation.

3.2. Changes of Nitrogen and Phosphorus Concentrations in Different Water Bodies in the Field

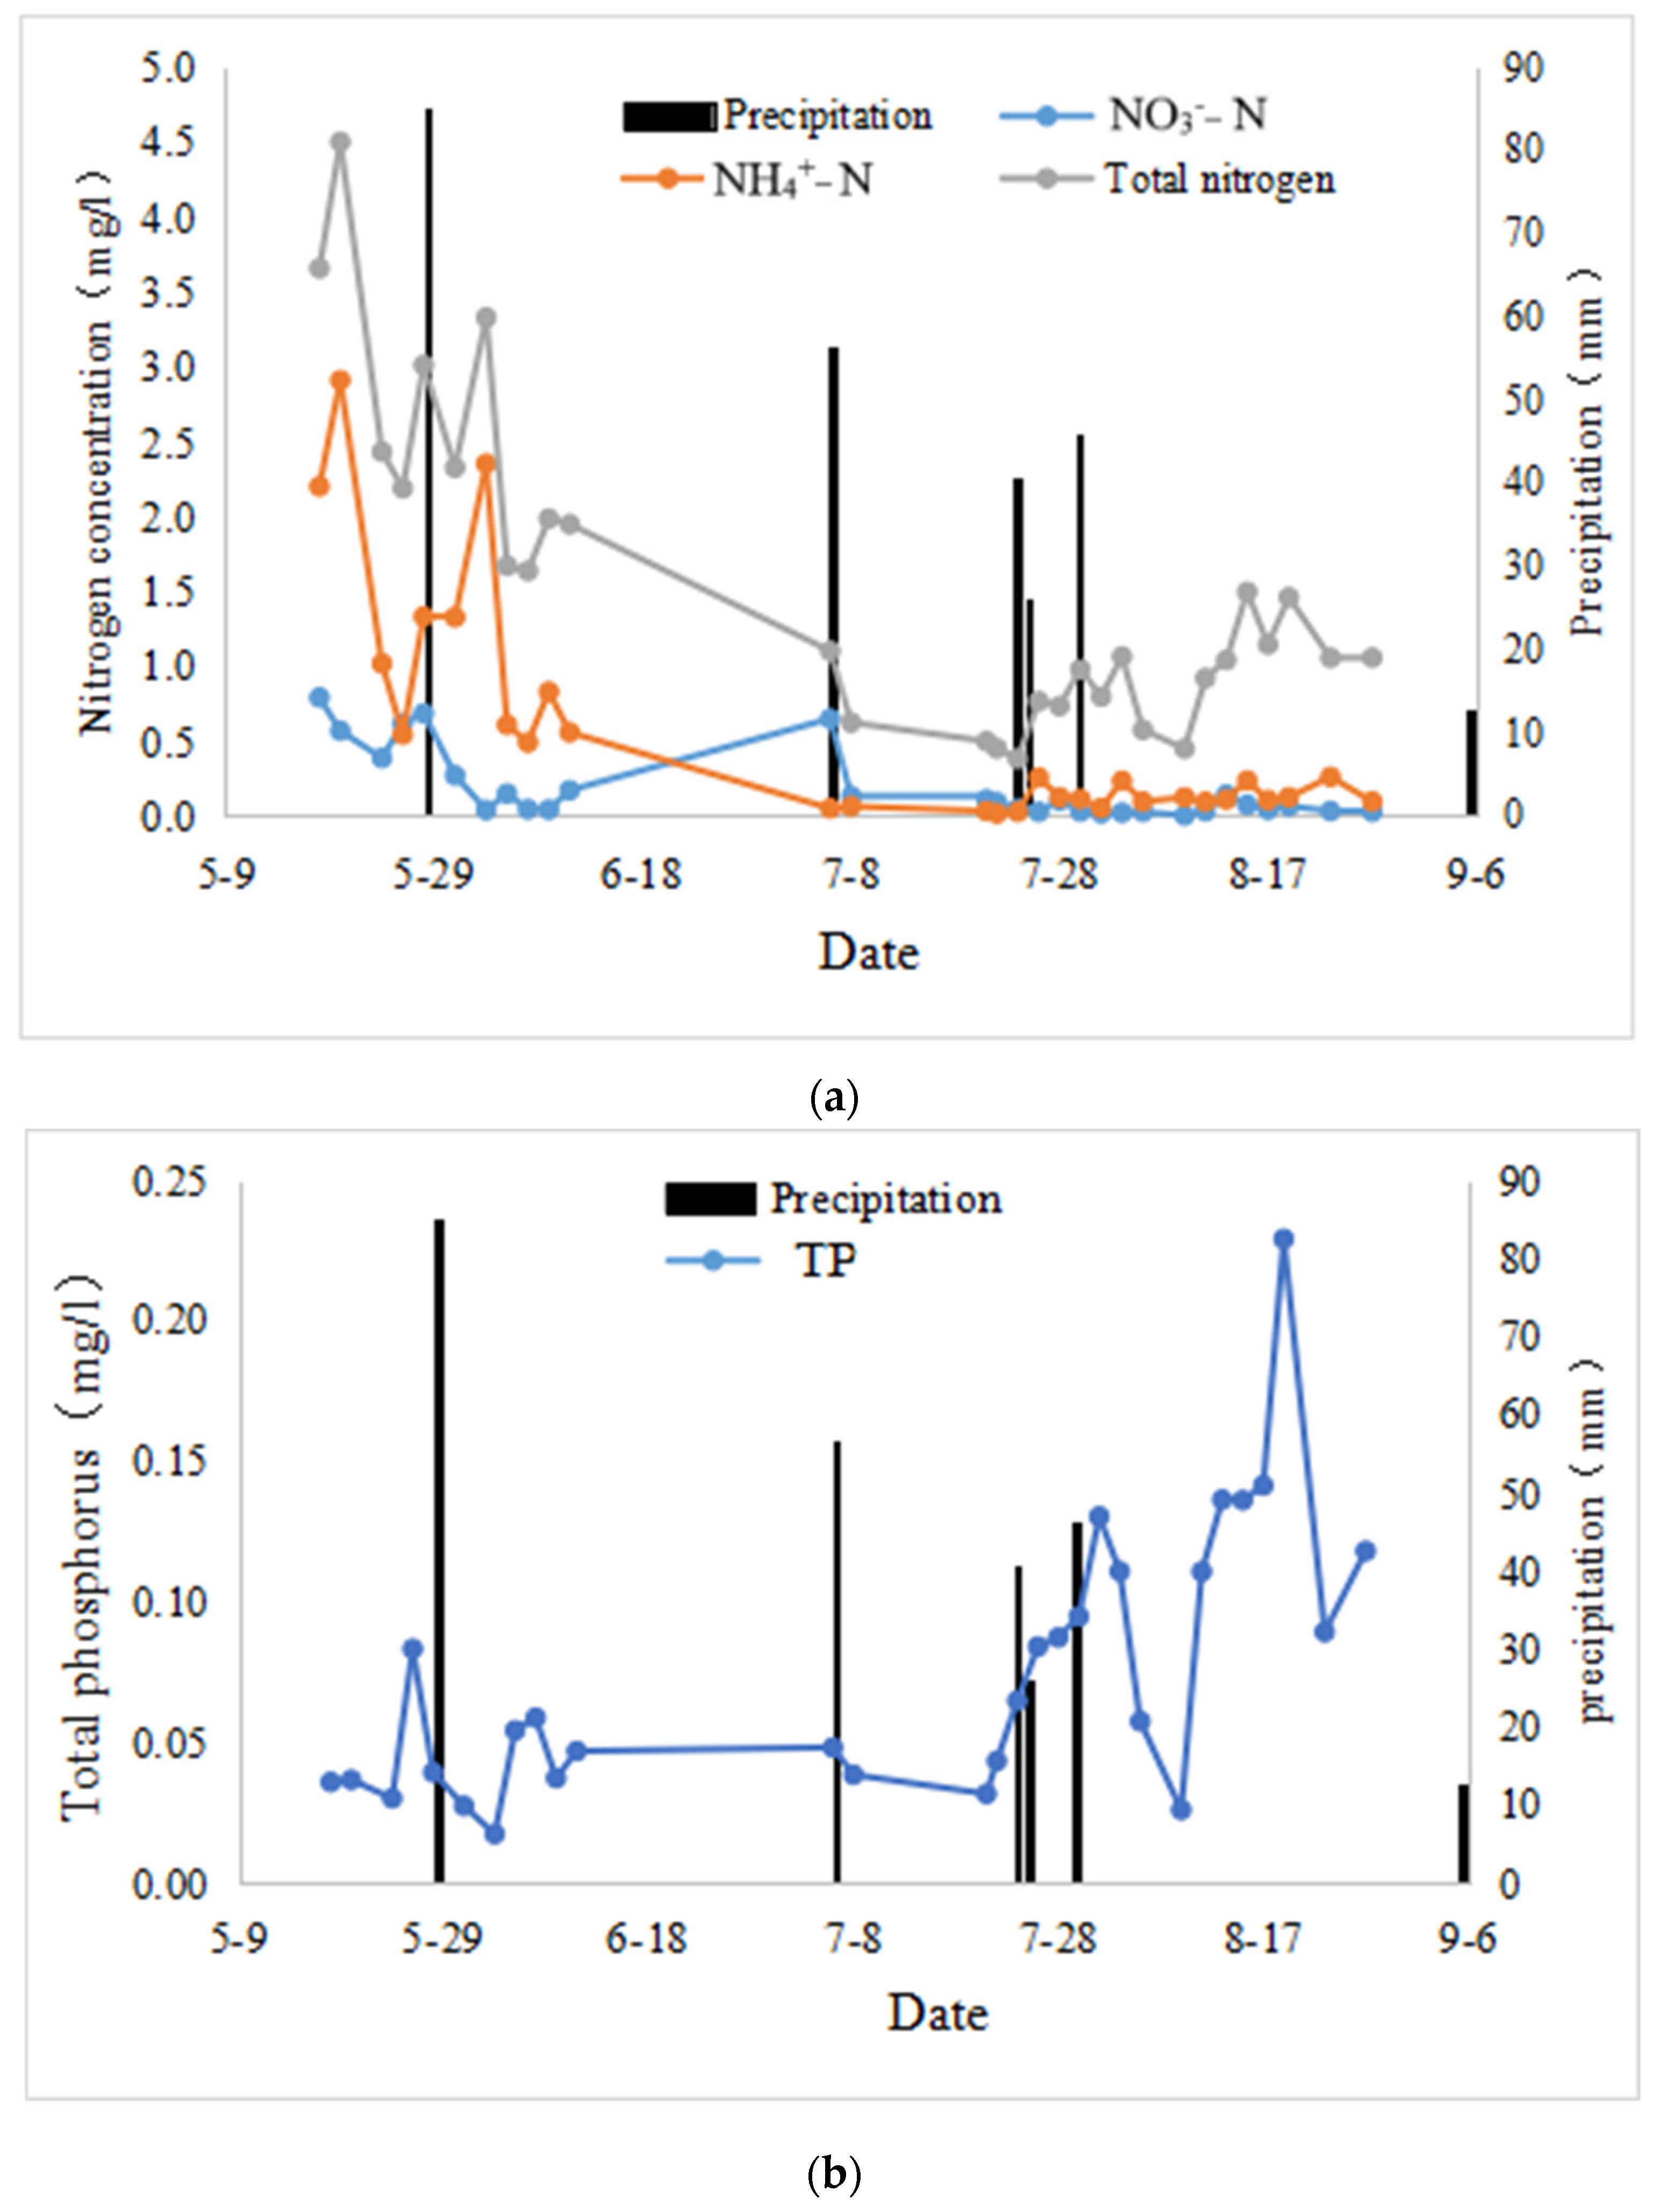
3.2.1. Field Water Quality

As shown in Figure 2, before the late tillering stage, the nitrogen content was high and had large fluctuations, with several fluctuations closely related to the precipitation and irrigation after fertilization. At the late tillering stage, the nitrogen concentration was low and fluctuated very little, which was related to the scarcity of water in the field and no fertilization.
TP experienced several significant fluctuations throughout the whole growth period, with a peak at every growth stage. These fluctuations were considered to be mainly related to rice growth and uptake under the condition of no fertilization.

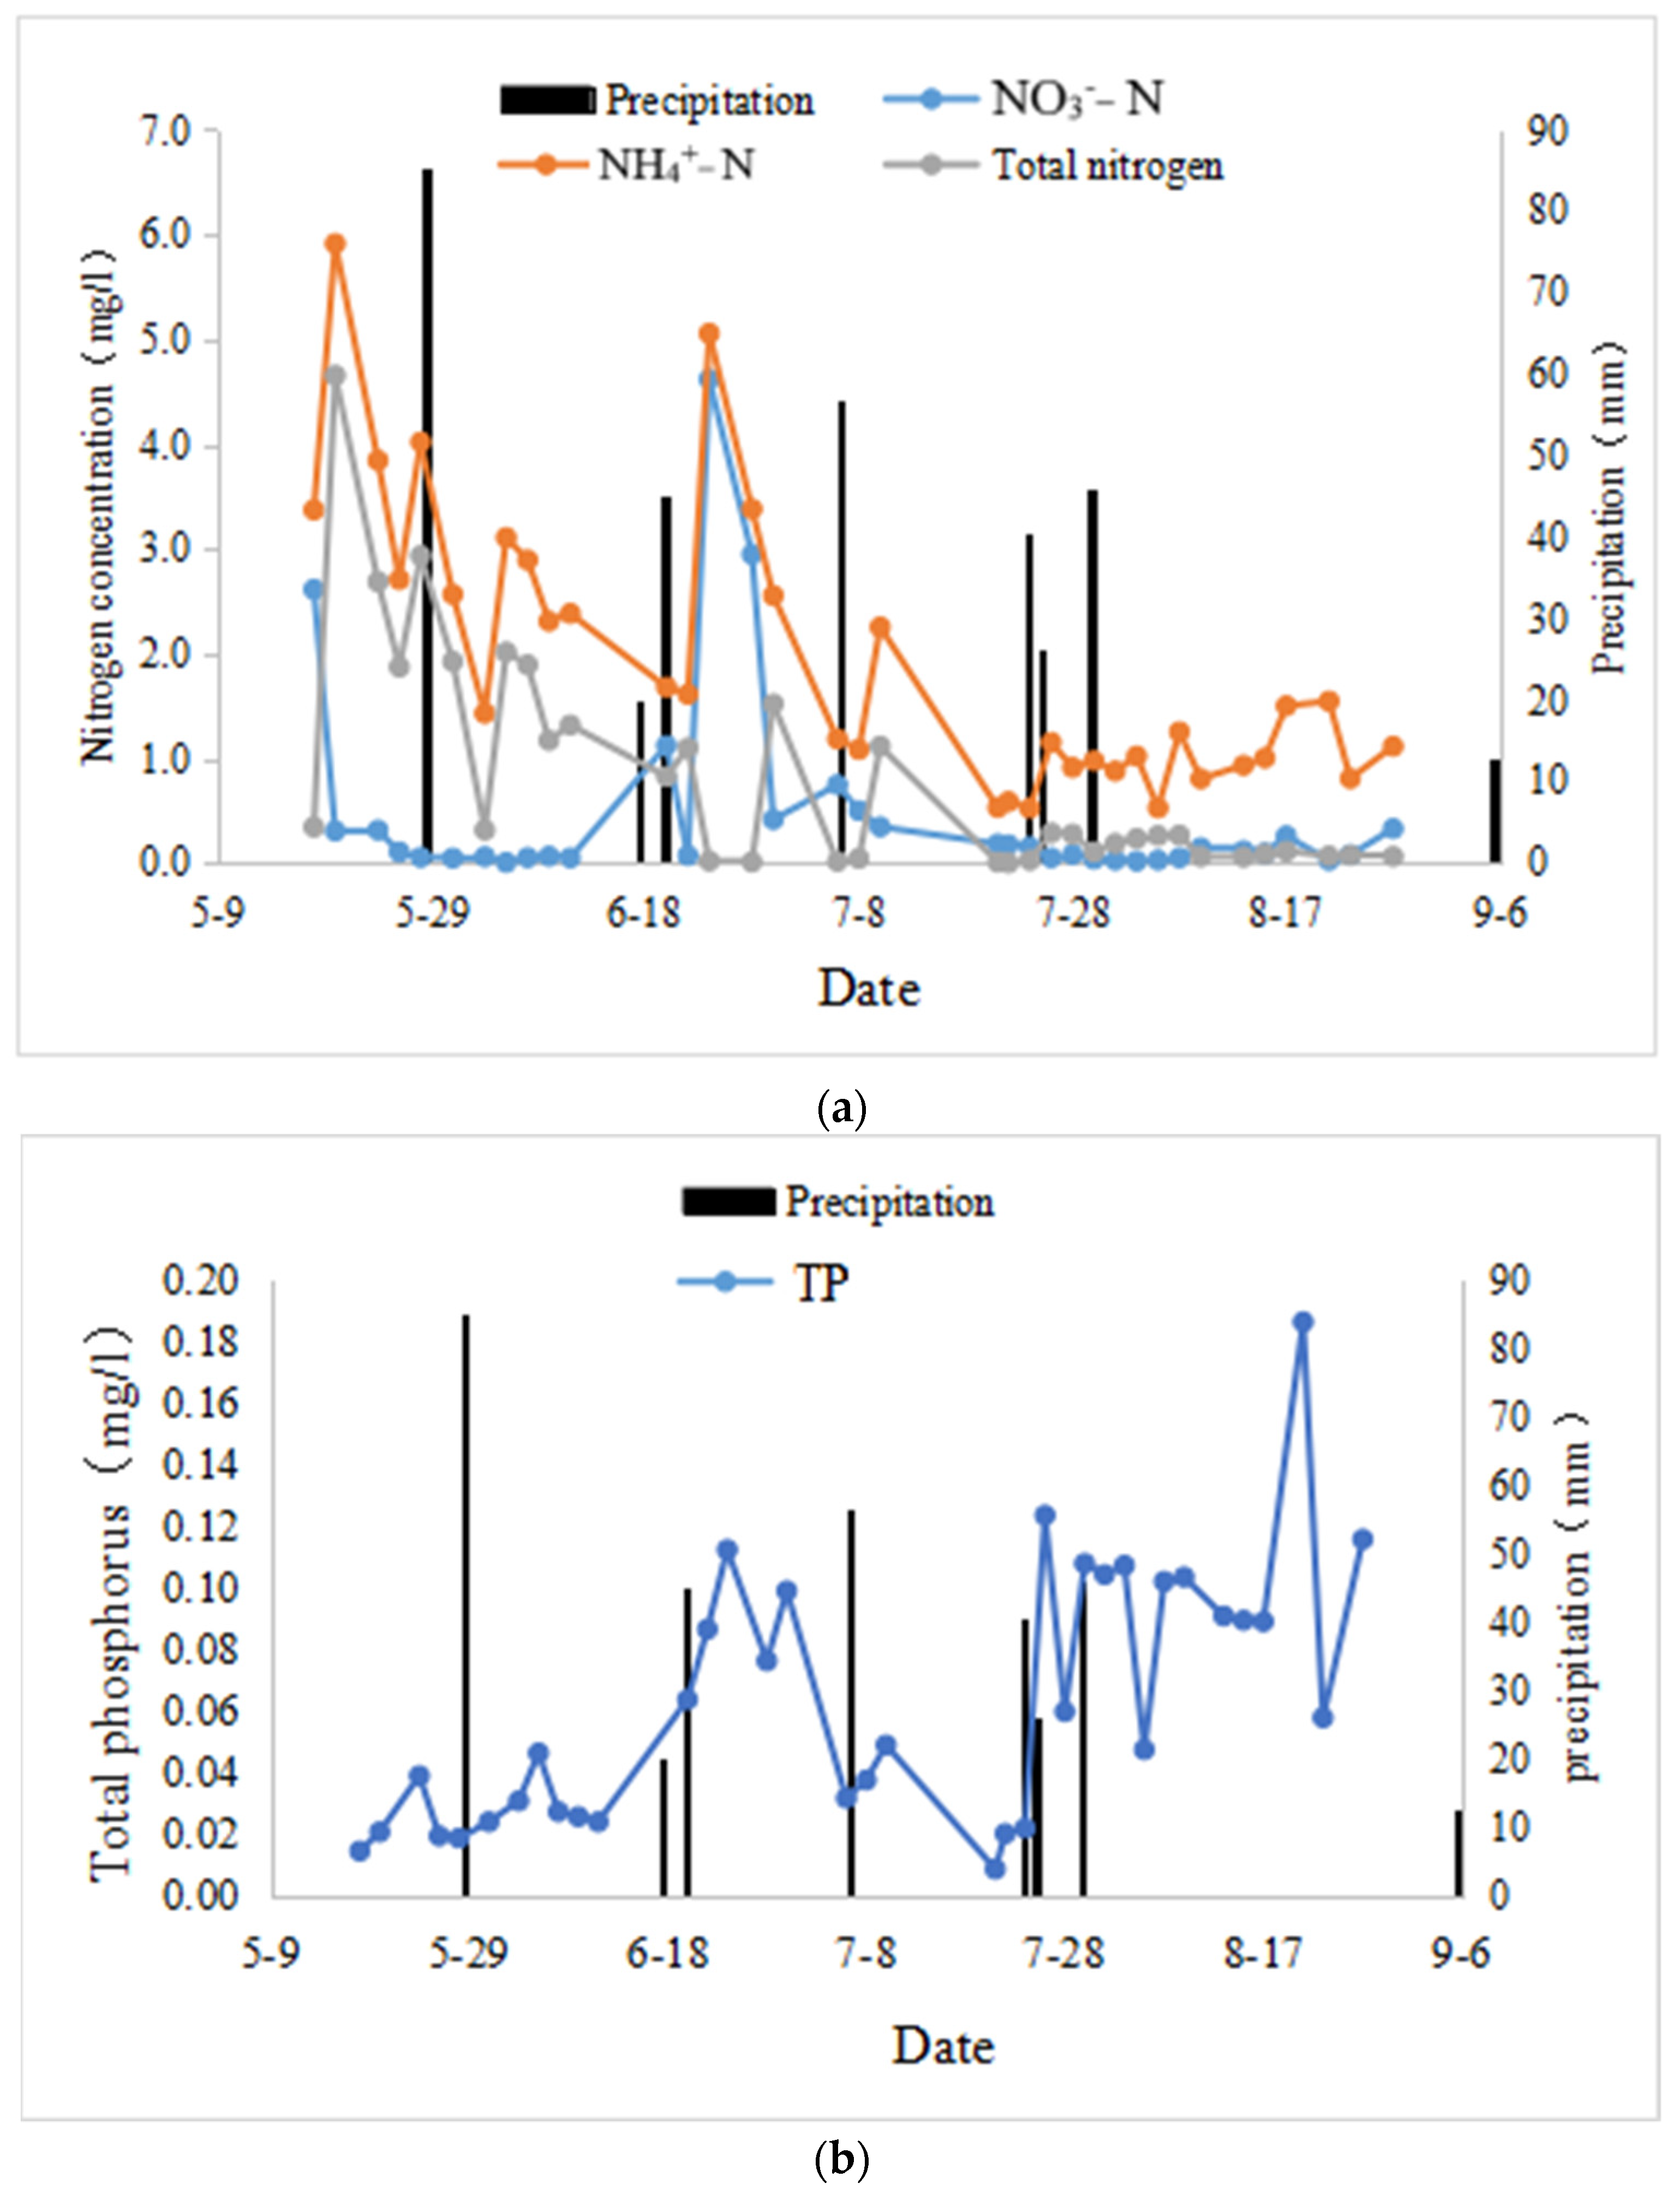
3.2.2. Seepage Water Quality

As shown in Figure 3, the nitrogen in the seepage water at a depth of 40 cm in the field fluctuated significantly throughout the entire growth period, with the fluctuation in the early tillering stage related to precipitation and irrigation after fertilization and the fluctuation in the late tillering stage mainly caused by precipitation, which led to nitrogen leaching.
TP underwent several obvious fluctuations during the entire growth period, reaching a peak at each growth stage. These fluctuations were considered to be mainly due to precipitation.

3.3. Patterns of Nitrogen and Phosphorus Load Discharge in the Field

3.3.1. Nitrogen Load Discharge in the Field

Table 3 shows an analysis of the nitrogen load discharge in the field. Combined with the analysis in Table 3, it can be seen that the change trend of the nitrogen load of the drainage water in field was similar with that of the drainage water volume. The nitrogen load was the greatest at the regreening stage and gradually decreased with the development of growth stages, becoming basically zero at the milk and yellow ripening stages. The total nitrogen (TN) load, nitrate nitrogen (NO3-N) load, and ammonium nitrogen (NH4+-N) load discharge all peaked at the regreening stage, the early tillering stage, and the late tillering stage, with the TN, NO3−_N, NH4+_N load discharge reaching over 97.9%, 86.4%, 92.2%, 98.3%, 88.4%, 80.5%, 99.2%, 94.1%, and 98.9% of that during the whole growth period from drainage and from deep seepage and lateral seepage, respectively. TN and NO3-N loads were discharged the most via drainage, followed by deep seepage, and the least via lateral seepage. The NH4+-N load was discharged the most via drainage, followed by lateral seepage, and the least via deep seepage. Controlling drainage from the regreening stage to the late tillering stage is key to reducing the nitrogen load discharge.

3.3.2. TP Load Discharge in the Field

Table 4 shows an analysis of the TP load discharge in the field. Combined with the analysis in Table 1, it can be seen that the TP load discharge in the field was small, and the change law was similar with that of the volume of the drainage water. The TP load was discharged the most via drainage, followed by deep seepage, and the least via lateral seepage. The discharge of the TP load via drainage mainly occurred before the late tillering stage, with the amount of loss accounting for 89% of the total load discharge. The discharge of the TP load via deep seepage was basically present throughout the entire growth period and mainly occurred at the late tillering stage and the heading-flowering stage. The discharge of the TP load via lateral seepage did not vary greatly across growth stages and remained around 10% in most stages. These findings indicate that drainage should be controlled to reduce the TP load at the late tillering stage.

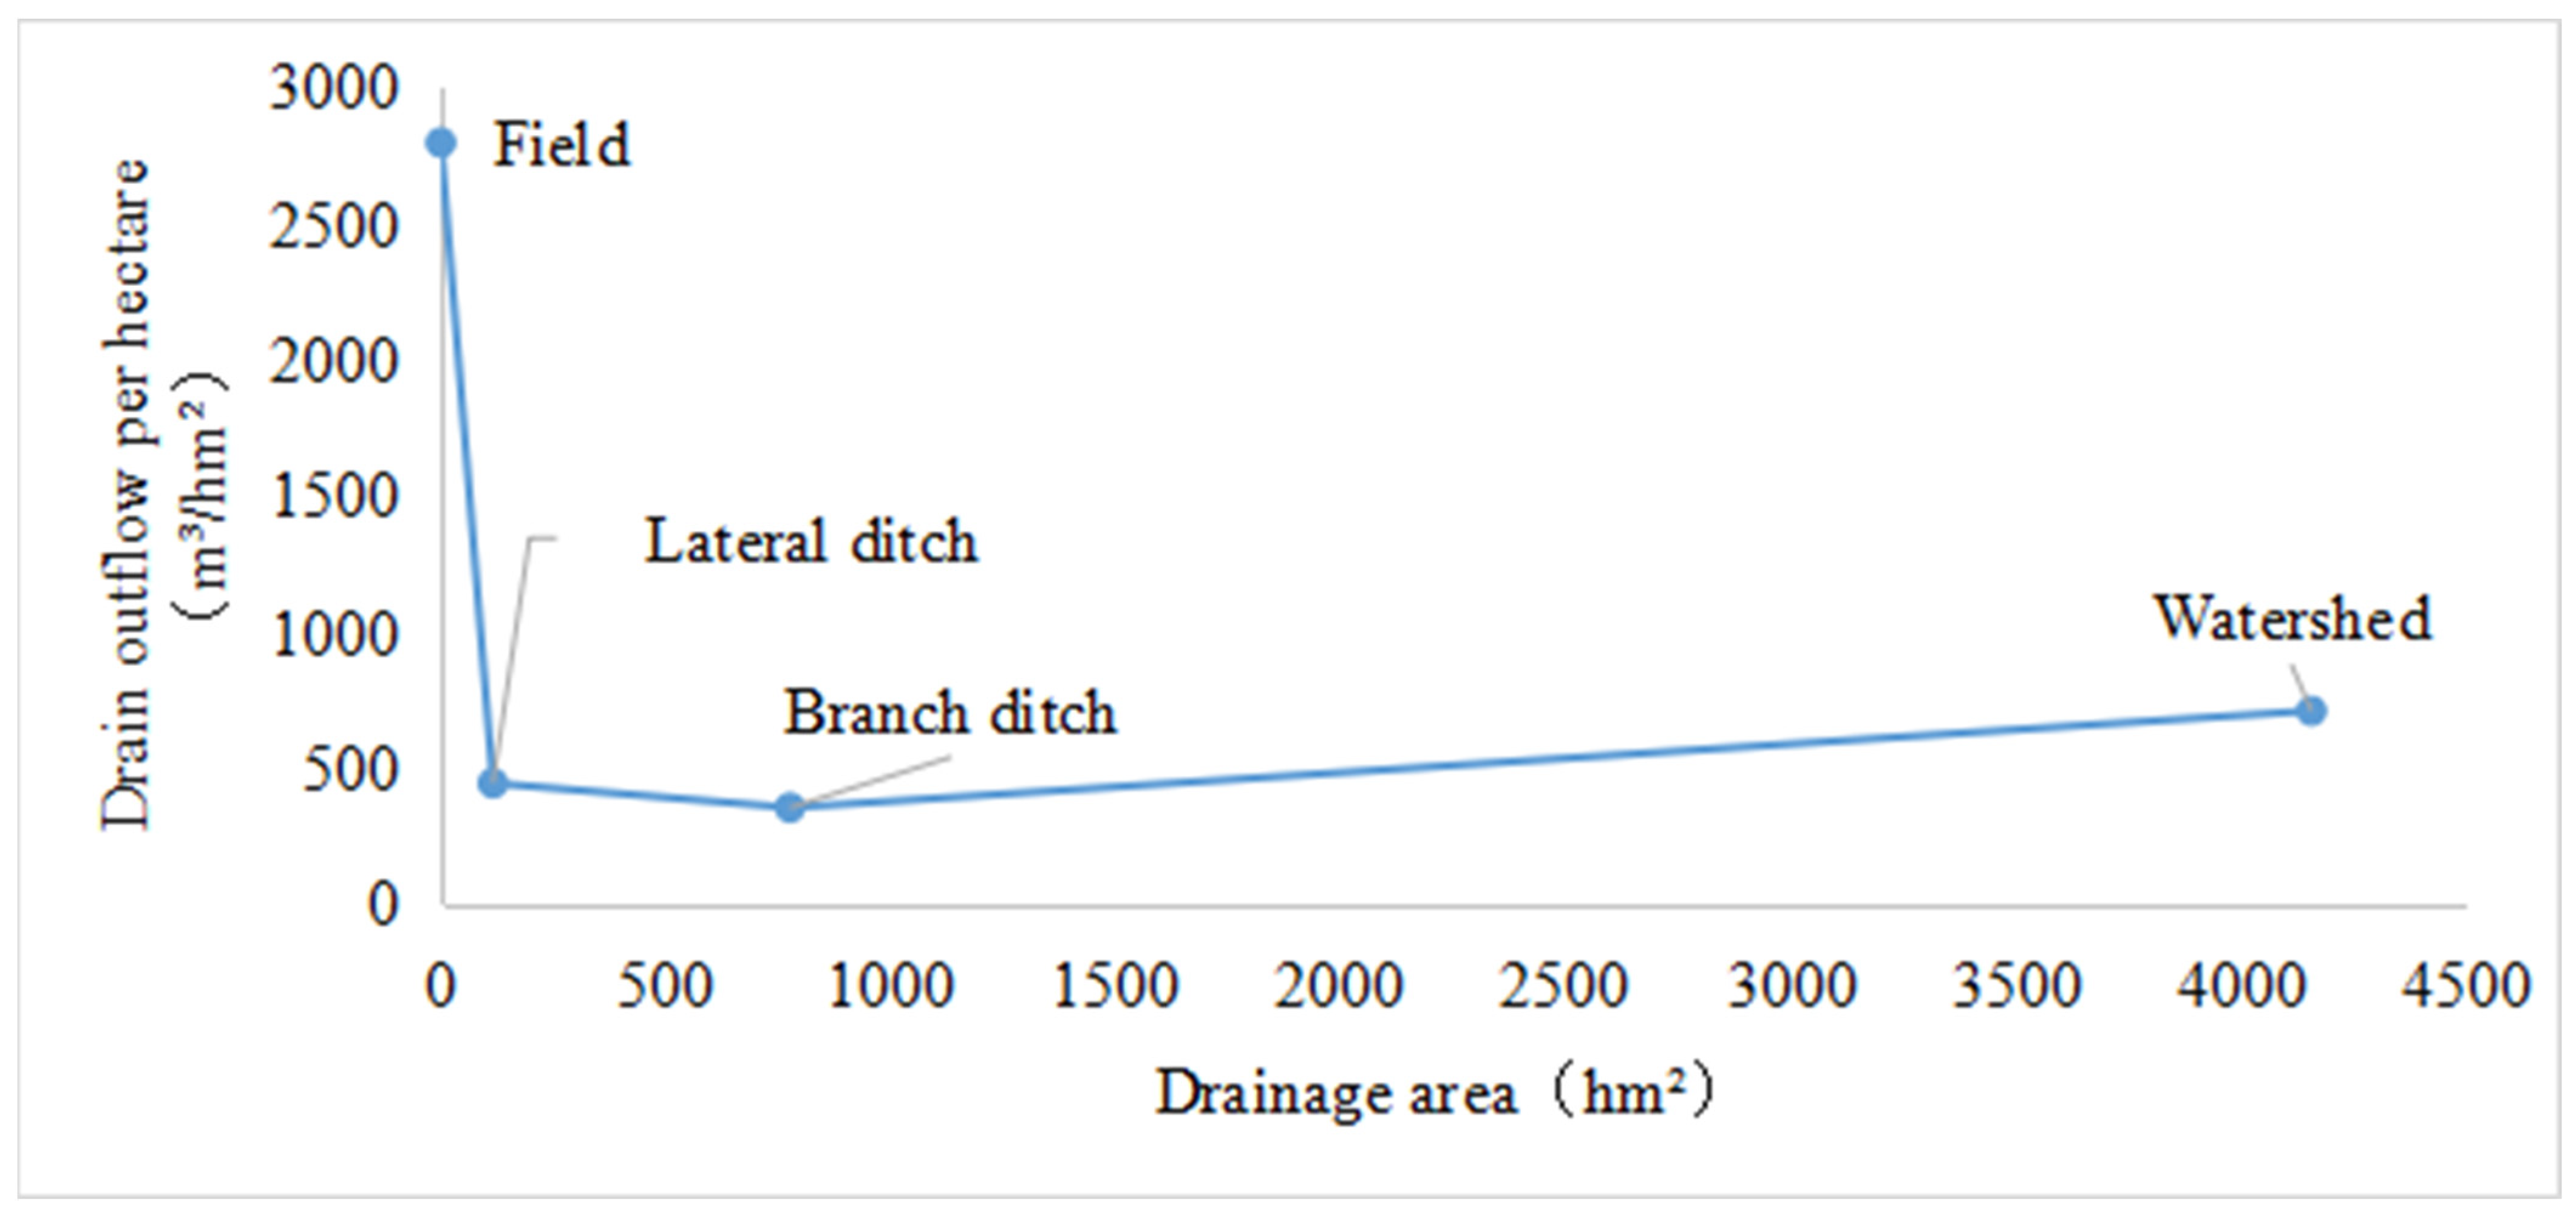
3.4. Changes in the Volume of Drainage Water at Different Scales

Table 5 shows the volume of drainage water at different scales during different growth stages. It can be seen from Table 4 that the volume of drainage water was the largest at the late tillering stage at all scales. In addition, the proportion of the volume of drainage water at the early and late tillering stages to the total volume of drainage water increased from 43.0% to 69.3% with the increase of the scale and began to decrease to 43.7% at the watershed scale. There was basically no drainage at each scale during the milk and yellow ripening stages; the proportion of the volume of drainage water at the heading-flowering stage to the total volume of drainage water increased from 0% to 17.4% with the increase of the scale, reaching its maximum at the watershed scale; at the jointing-booting stage, the proportion of the volume of drainage water at the field, lateral ditch, and branch ditch scales to the total volume of drainage water was around 10%, increasing to 22.9% at the watershed scale.
At the same scale, the proportion of the volume of drainage water at a certain growth stage to the total volume of drainage water was basically the largest at the late tillering stage, zero (no drainage) at the milk and yellow ripening stages, and essentially the same at the early tillering and heading-flowering stages. At the regreening stage, the volume of drainage water at the field scale accounted for the largest proportion of the total volume of drainage water, while the proportions at other scales were largely the same. At the jointing-booting stage, the volume of drainage water at the watershed scale accounted for the largest proportion of the total volume of drainage water, while the proportions at other scales were basically the same.
Figure 4 shows the volume of drainage water per unit area at different scales. As shown in the figure, there was a pronounced scale effect on drainage in the experimental area, and the volume of drainage water per unit area dropped significantly from the field scale (2796 m3/hm2) to the lateral ditch scale (444.07 m3/hm2) and then rebounded slightly at the watershed scale. In comparison, the volume of drainage water at the lateral ditch, branch ditch, and watershed scales decreased by 84.1%, 87.3%, and 74.6%, respectively, compared to that at the field scale.

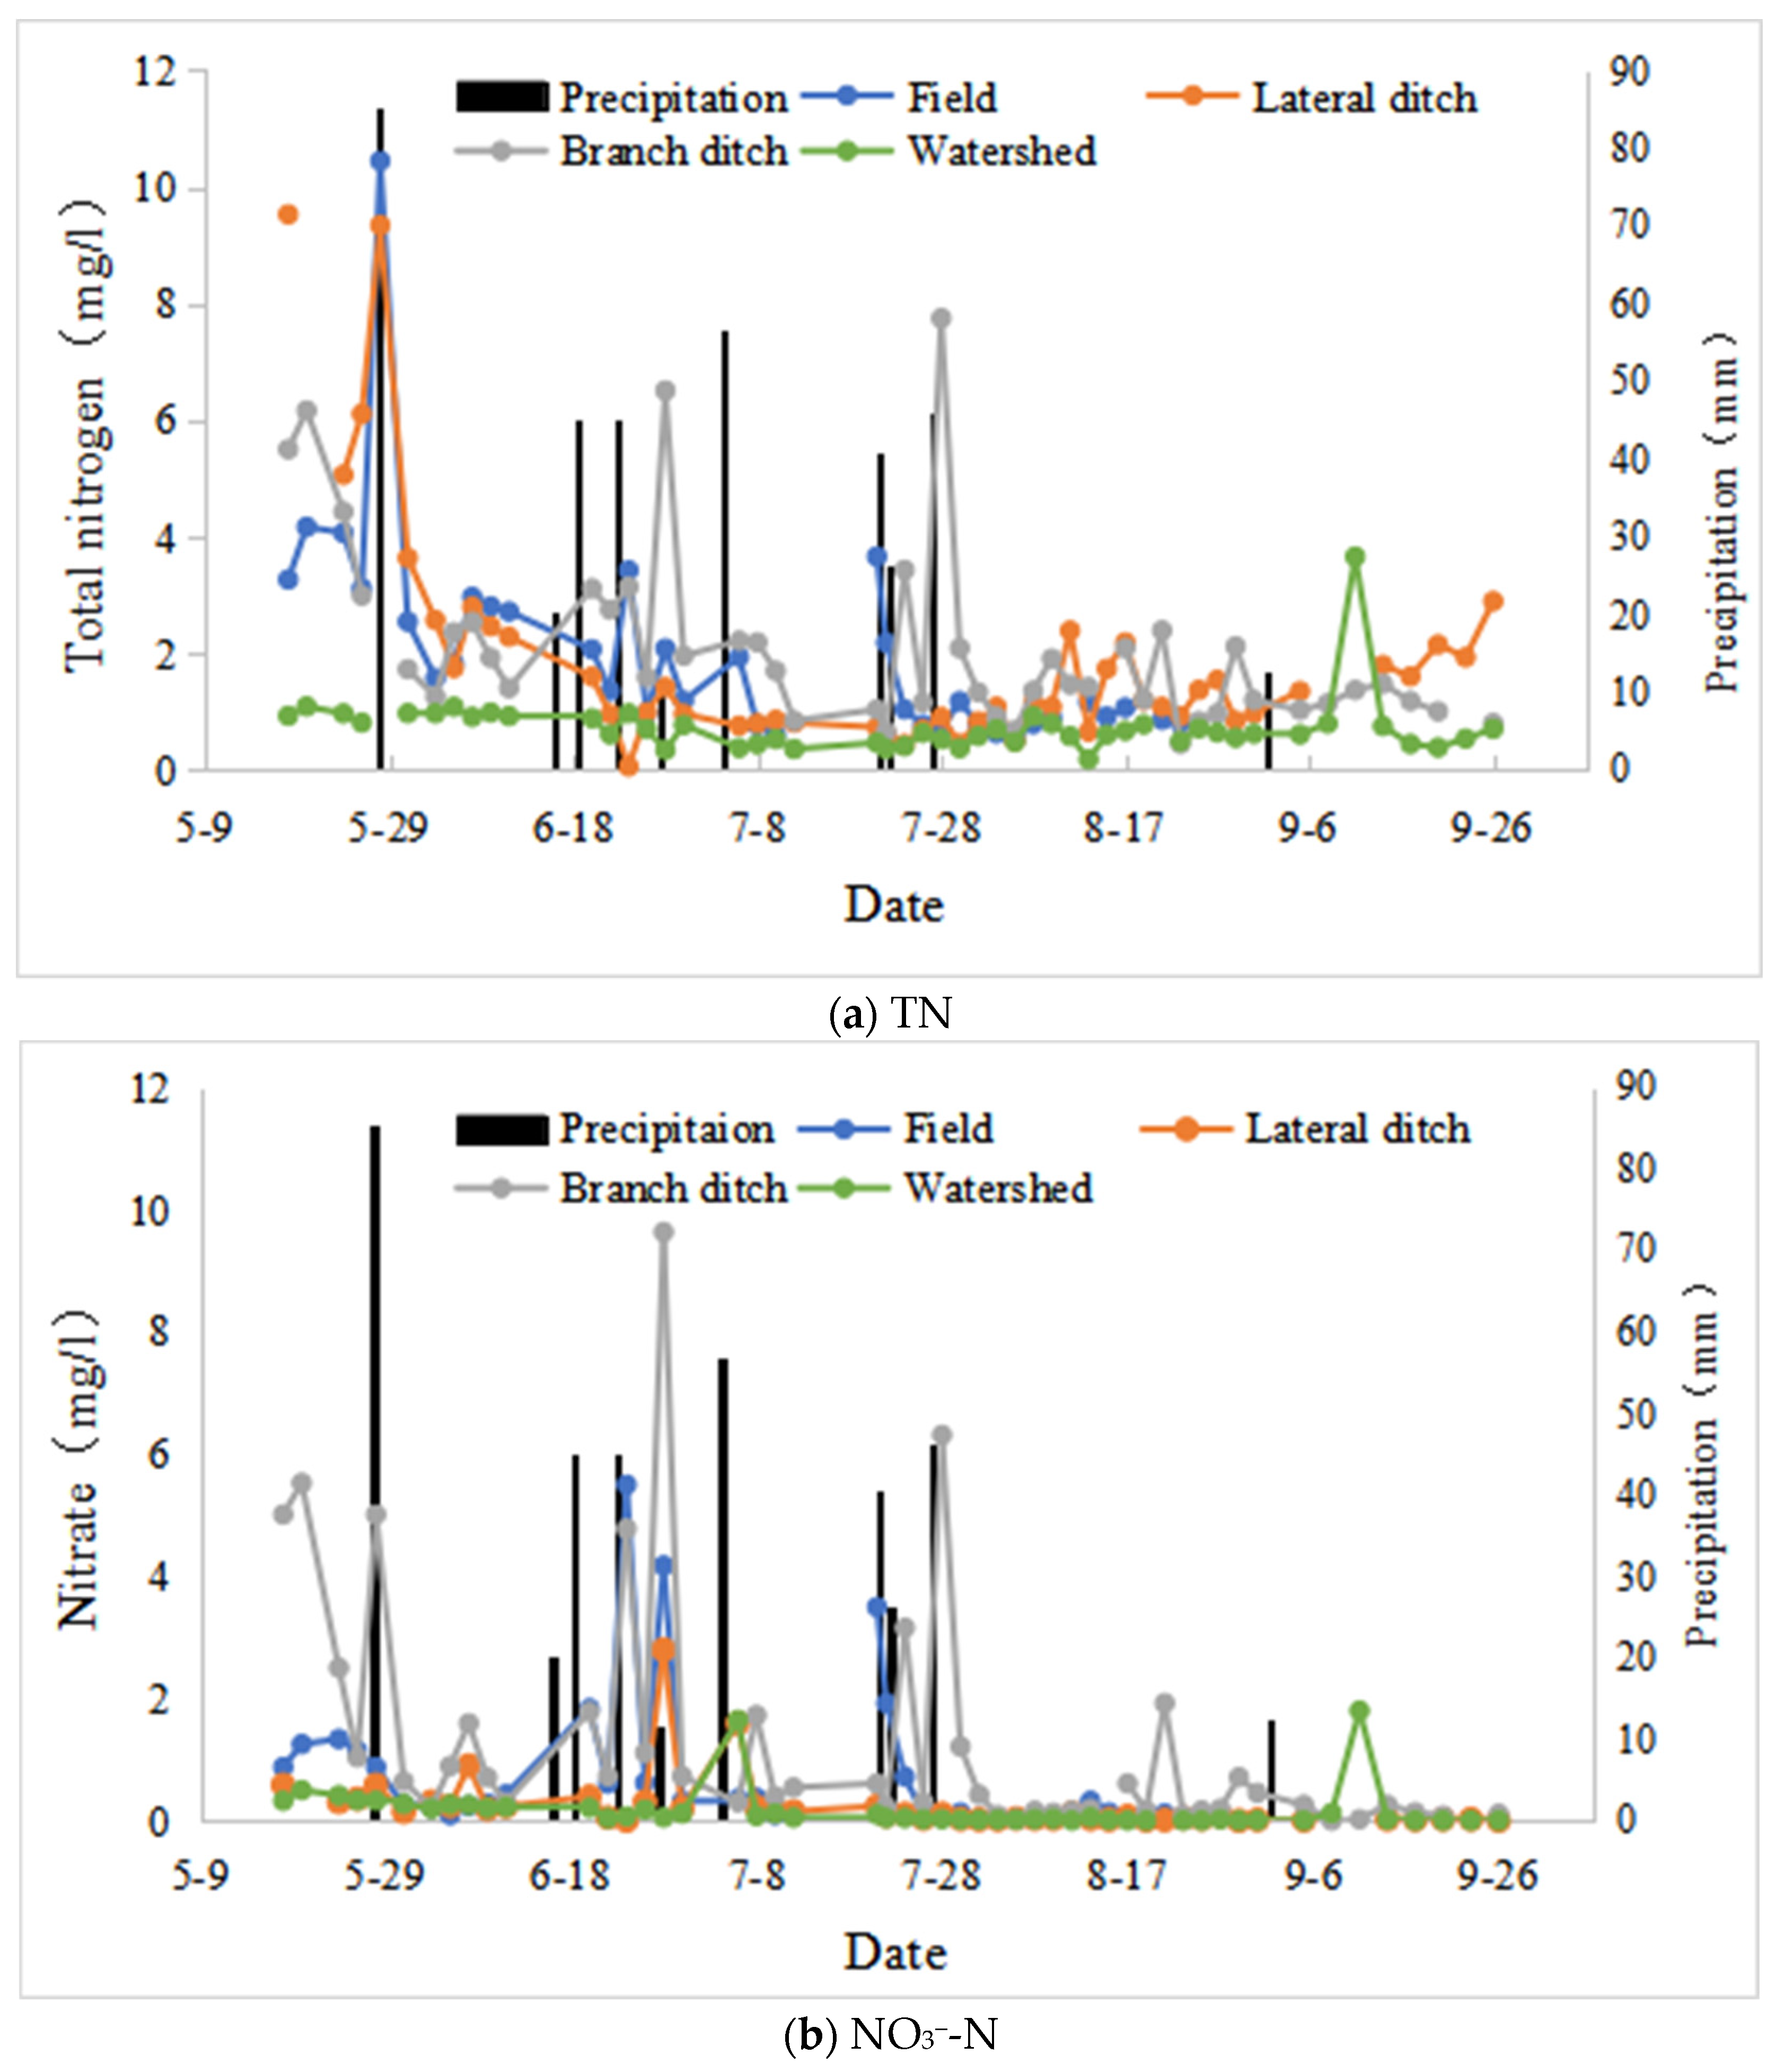
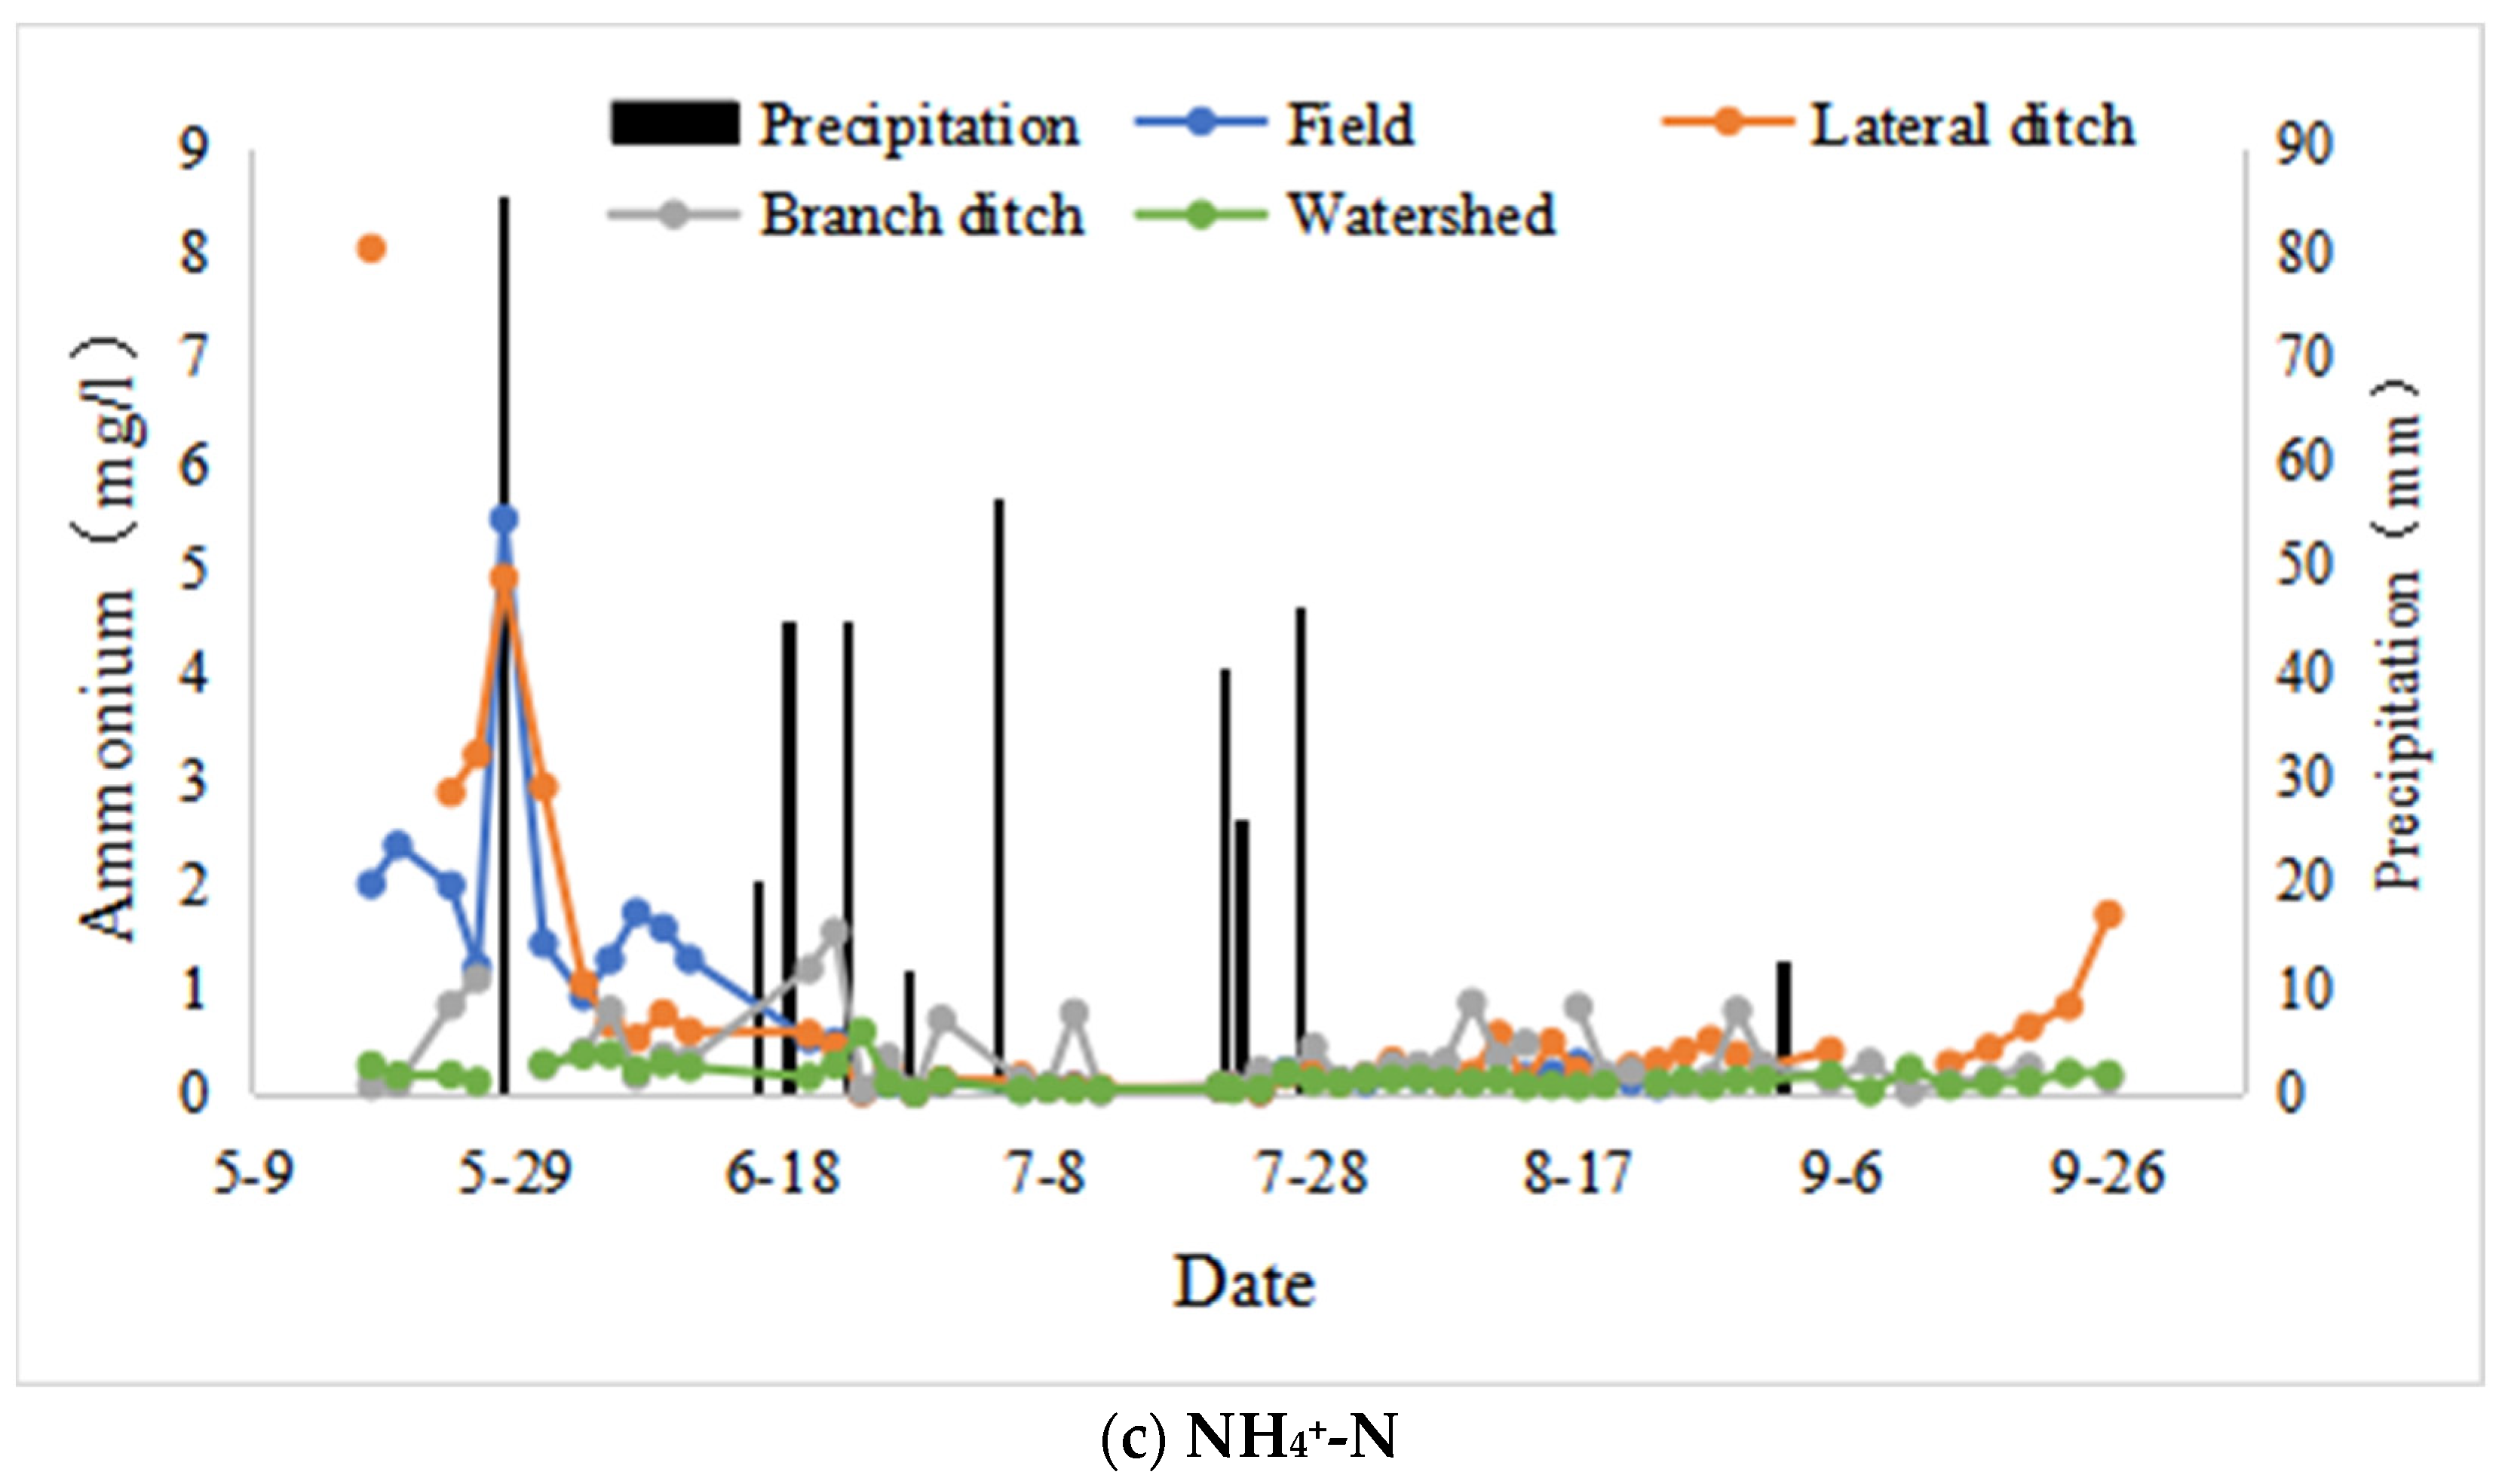
3.5. Changes in Nitrogen and Phosphorus Concentrations in Drainage Water at Different Scales

3.5.1. Nitrogen Concentration in Drainage Water at Different Scales

Figure 5 shows the curves of changes of the measured nitrogen concentration in drainage water at different scales during the entire growth period. The nitrogen concentration in drainage water varied considerably at the field, lateral ditch, and branch ditch scales and varied slowly at the watershed scale. After the application of base fertilizer, the concentrations of TN, NO3-N, and NH4+-N were at high values at all scales, with the concentration at the lateral ditch scale being the highest at 9.5 mg/L. Samples taken one day after topdressing showed the highest nitrogen concentrations at the field and lateral ditch scales, reaching 10.4 mg/L at the field scale and then decreasing rapidly. TN and NO3-N peaked once at the late tillering stage and the heading-flowering stage, respectively, which was related to the precipitation on 27 June and on 26 and 27 July, respectively, while the NH4+-N concentration remained stable at less than 1 mg/L after the decrease. Overall, nitrogen concentrations increased rapidly after fertilization at all scales, especially at the field and lateral ditch scales. Precipitation also led to a rapid increase in TN and NO3-N concentrations at the field, lateral ditch, and branch ditch scales, but had little influence on nitrogen concentrations at the watershed scale, which was related to the regulating effect of the Yangshudang Reservoir at the watershed scale.

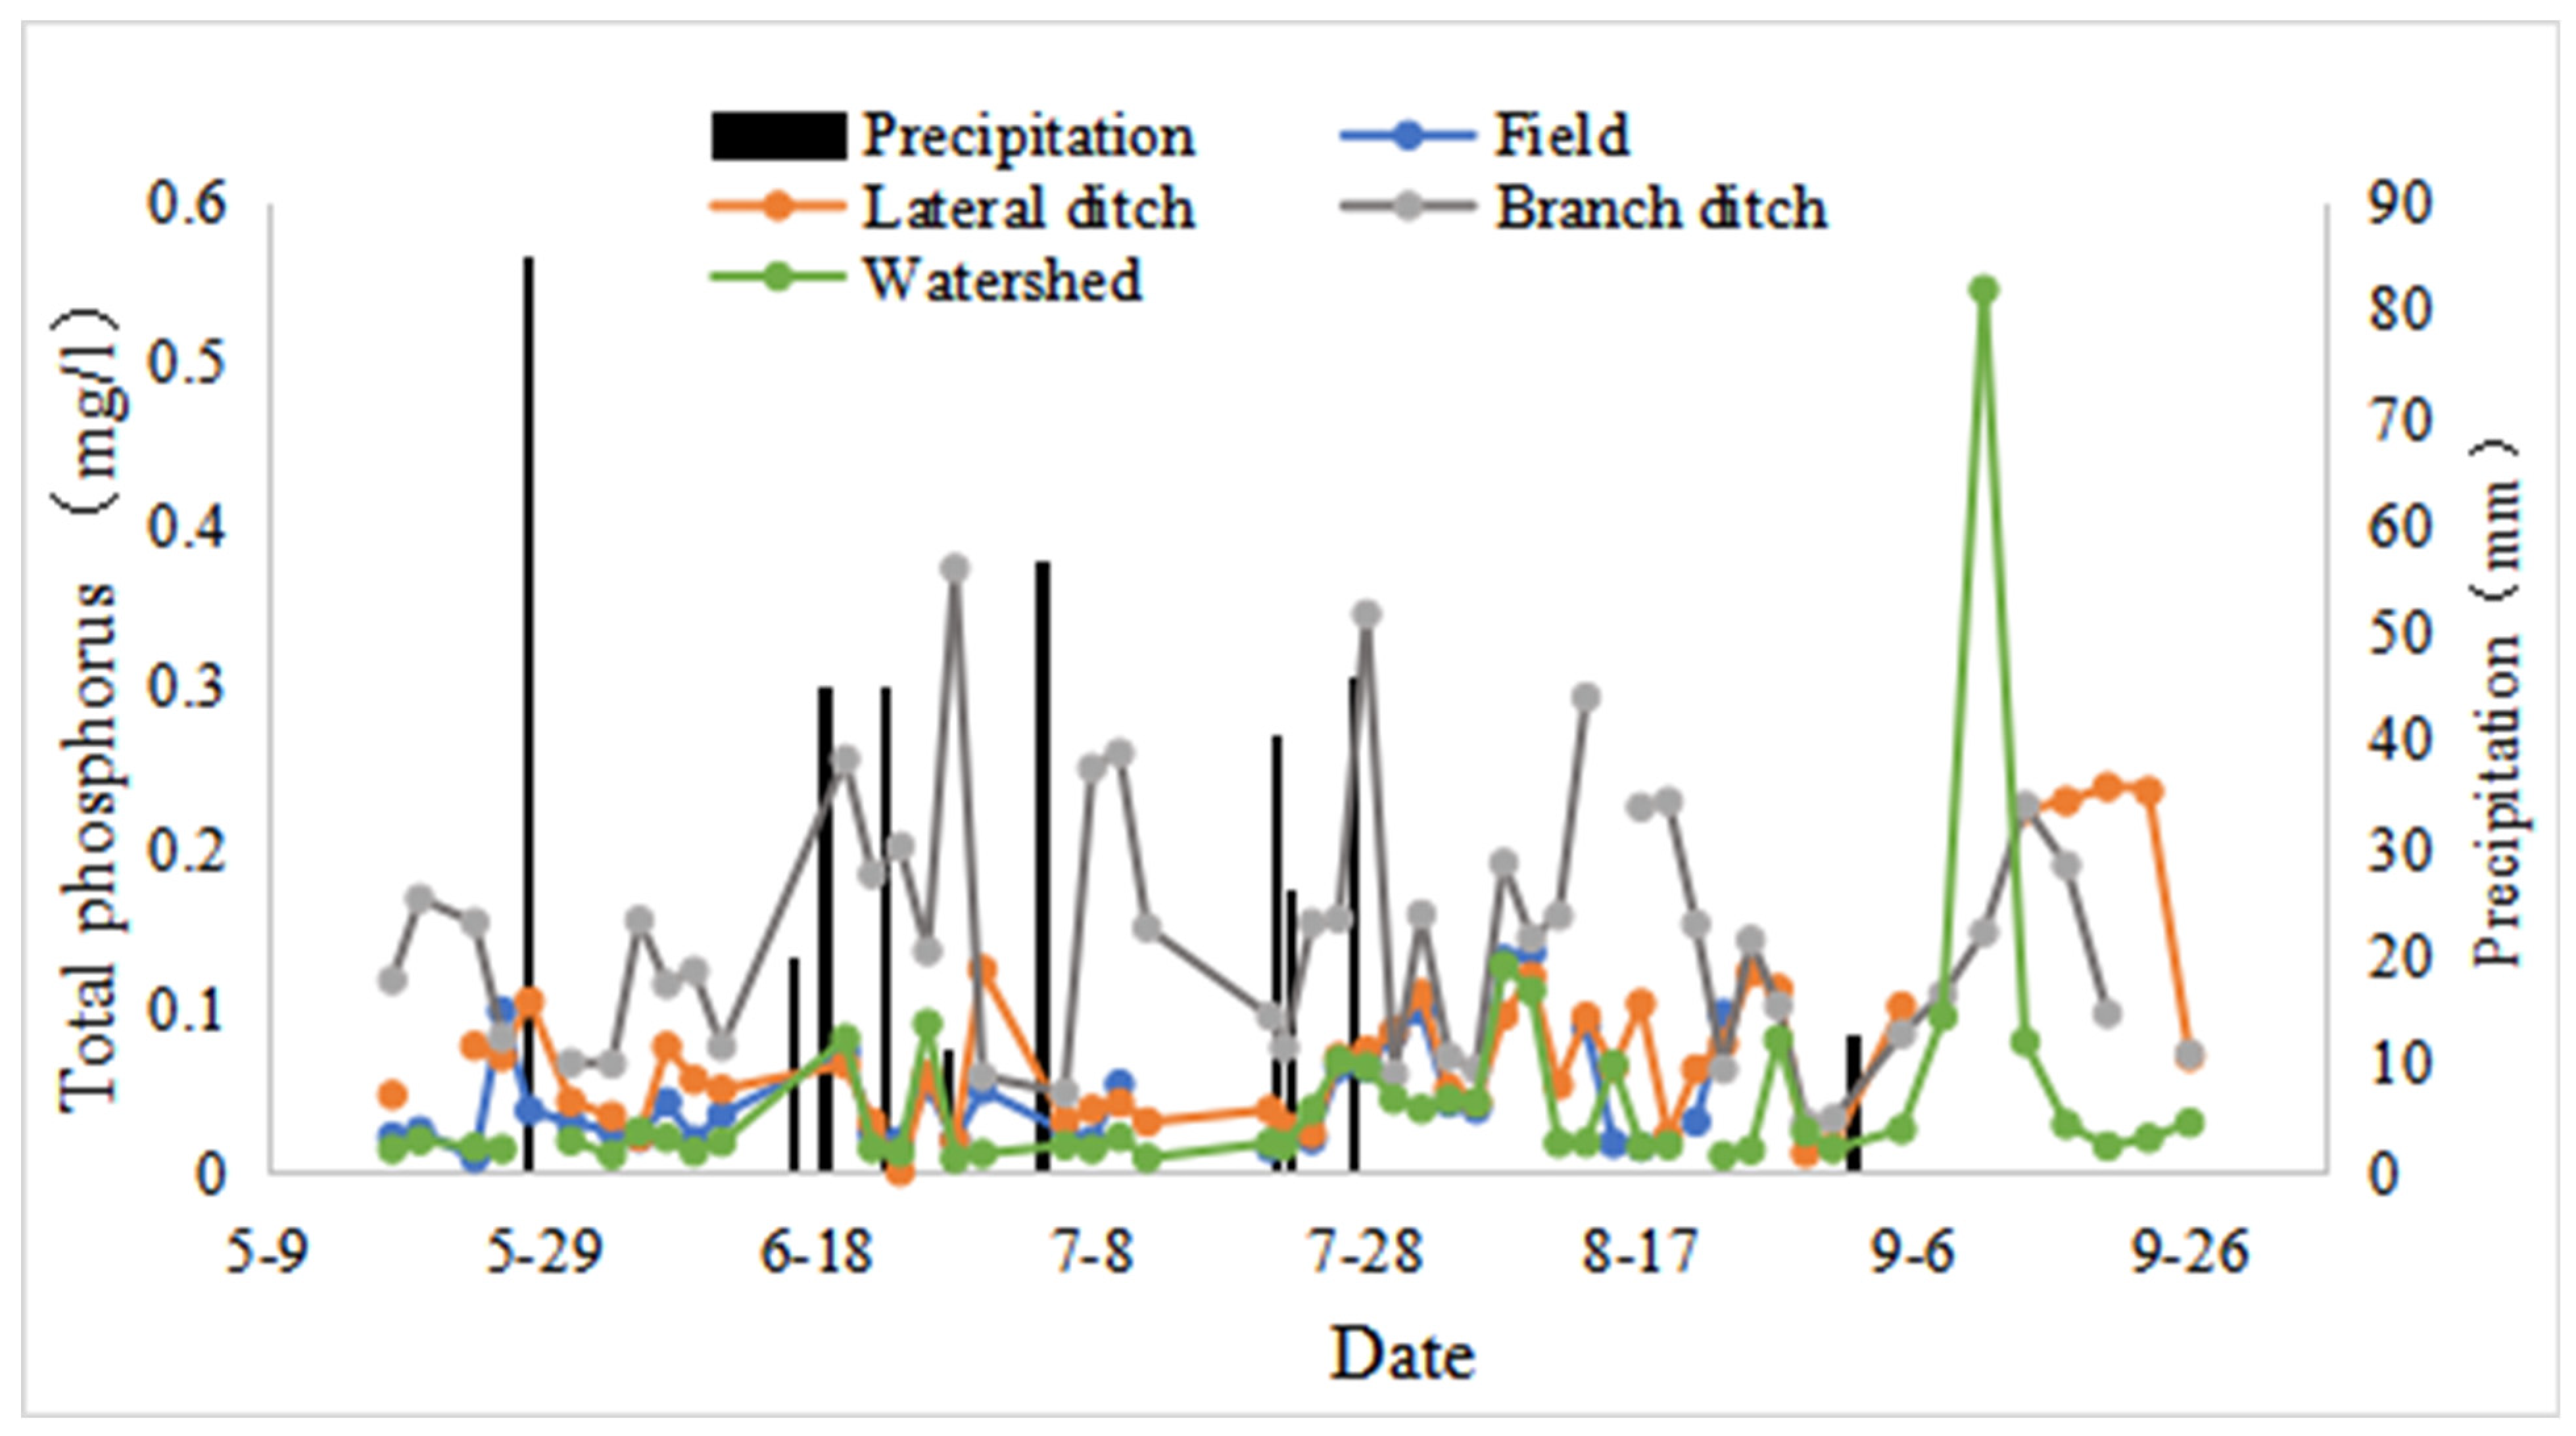
3.5.2. TP Concentrations in Drainage Water at Different Scales

Figure 6 shows the curves of changes of the measured TP concentrations in drainage water at different scales during the entire growth period. It can be seen from Figure 6 that the TP concentration fluctuated greatly throughout the entire growth period but was generally lower than 1 mg/L. As with nitrogen, the two large fluctuations in TP concentration occurred after precipitation. The pattern of concentration fluctuation was basically the same at all scales except for at the branch ditch scale. The TP concentration was the largest at the branch ditch scale at any given stage.

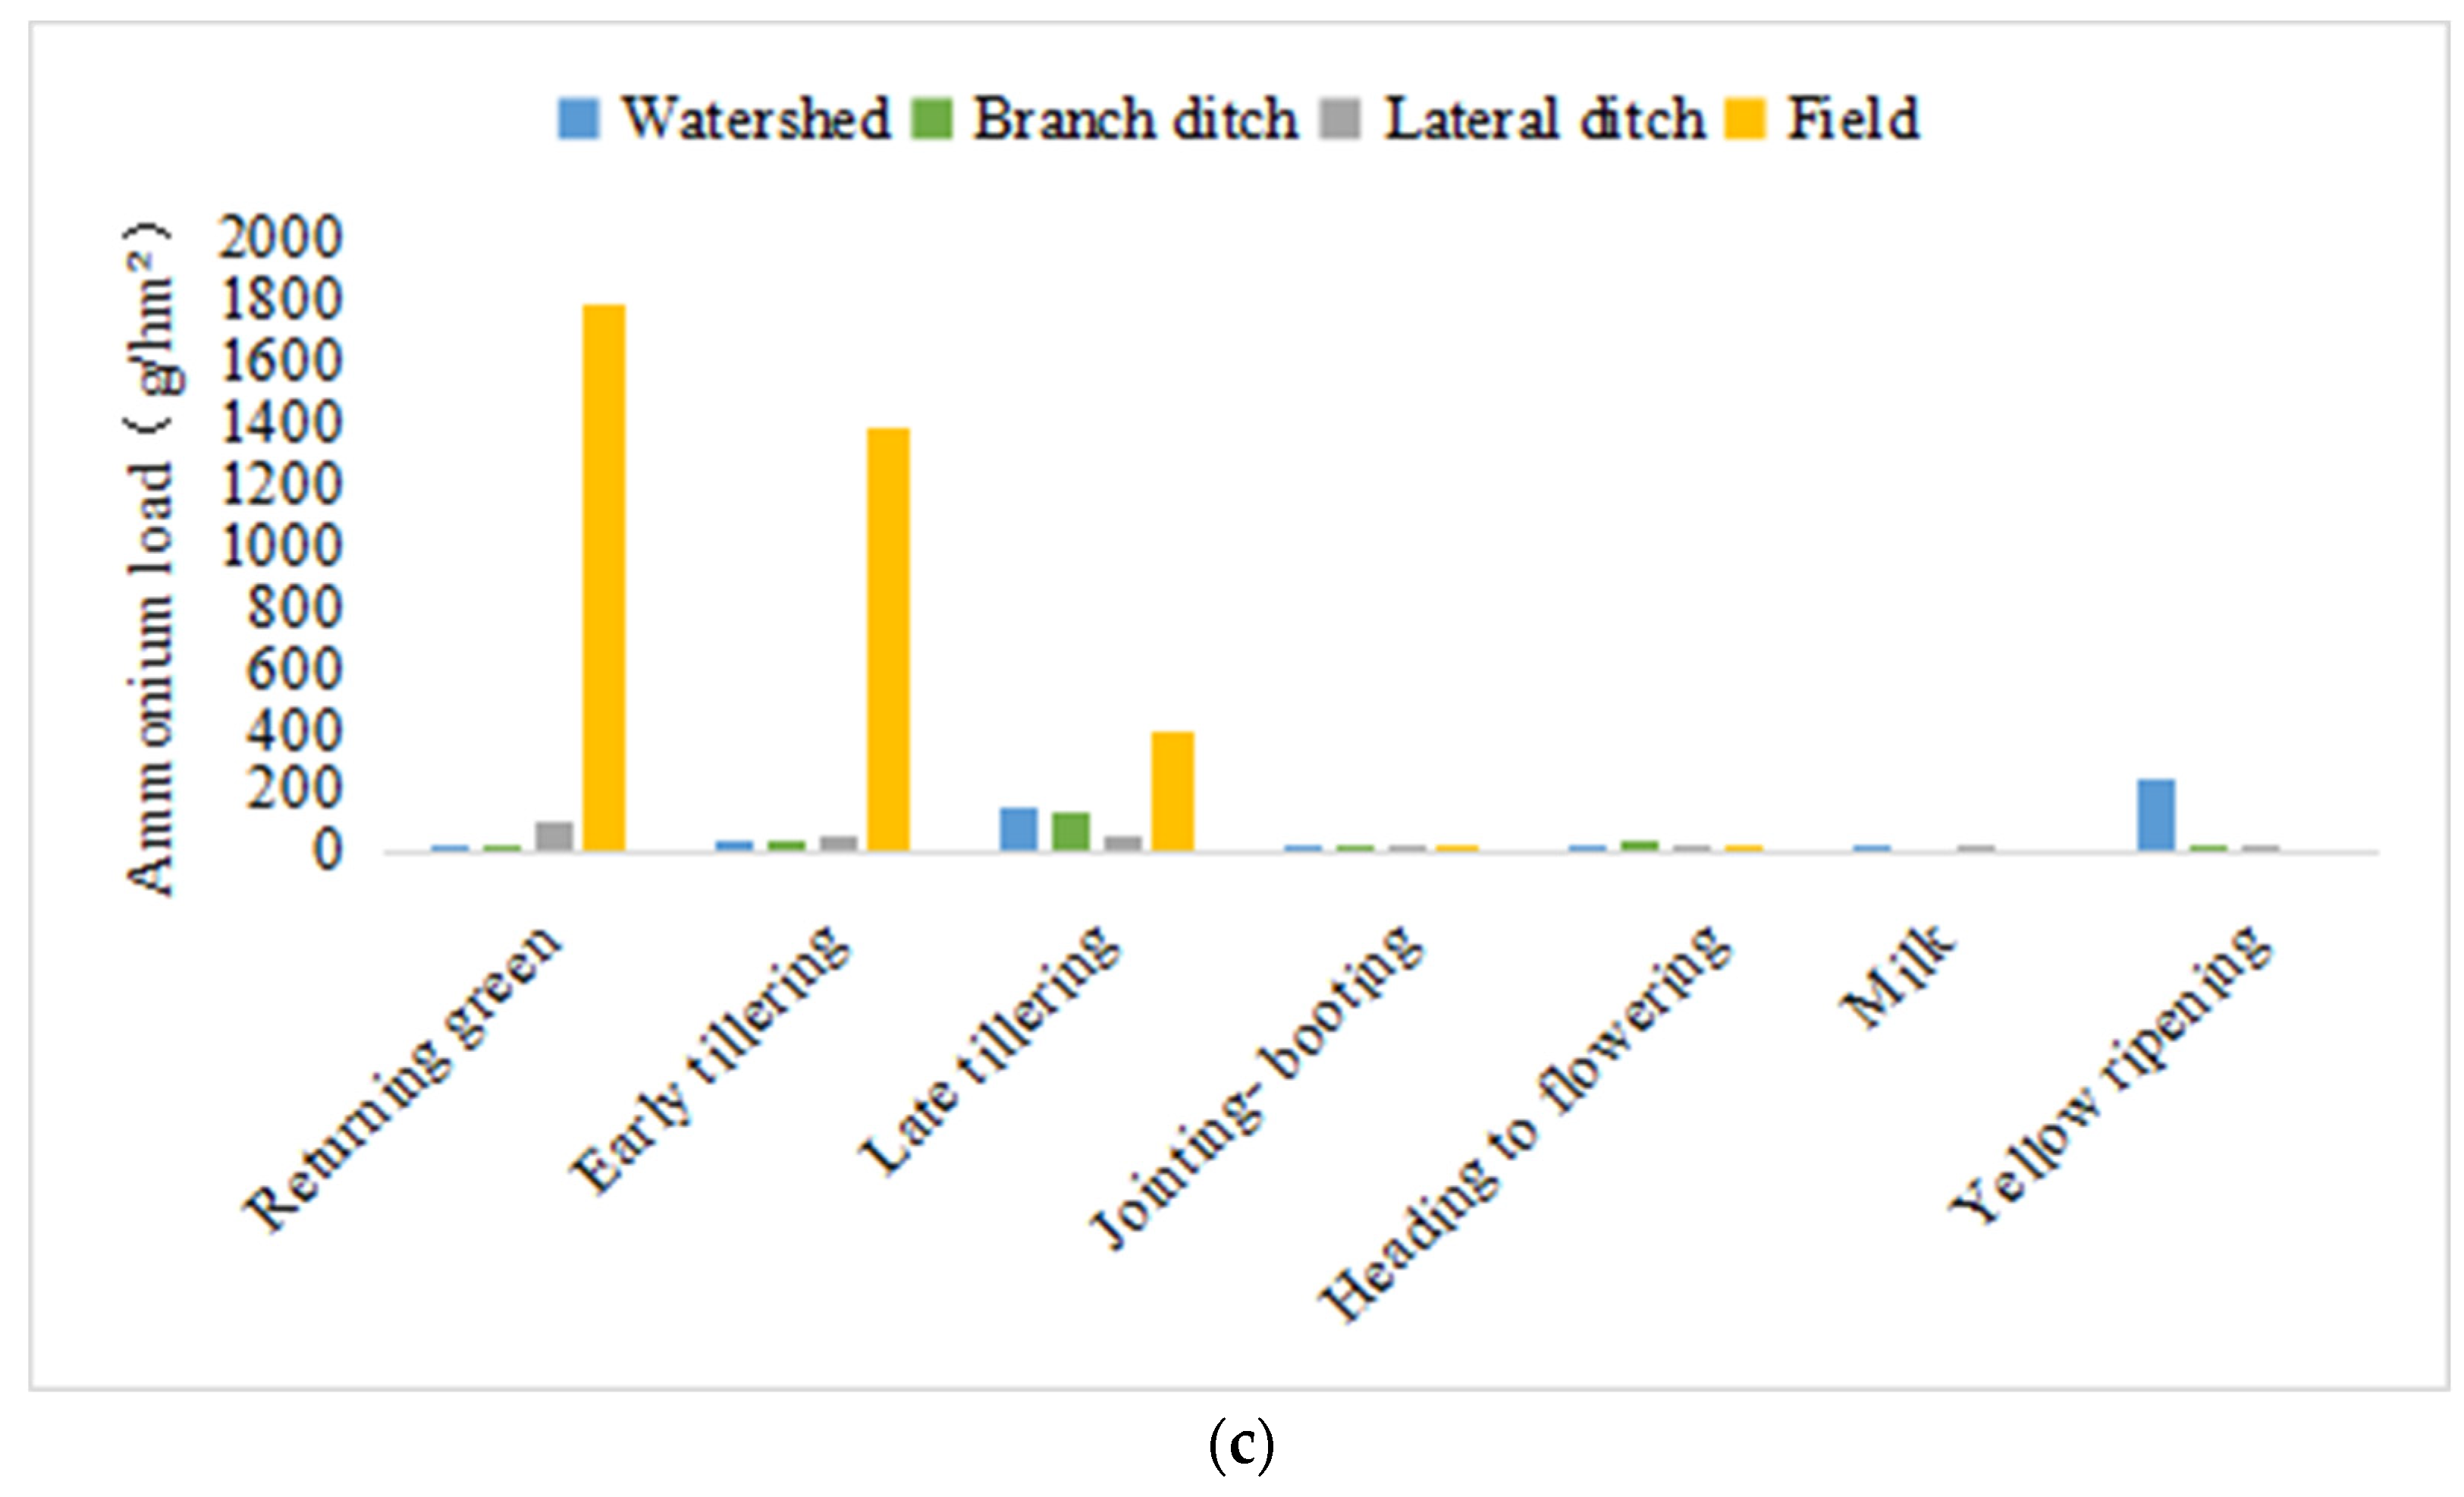
3.6. Changes in Nitrogen and Phosphorus Loads in Drainage Water with the Increase of the Scale

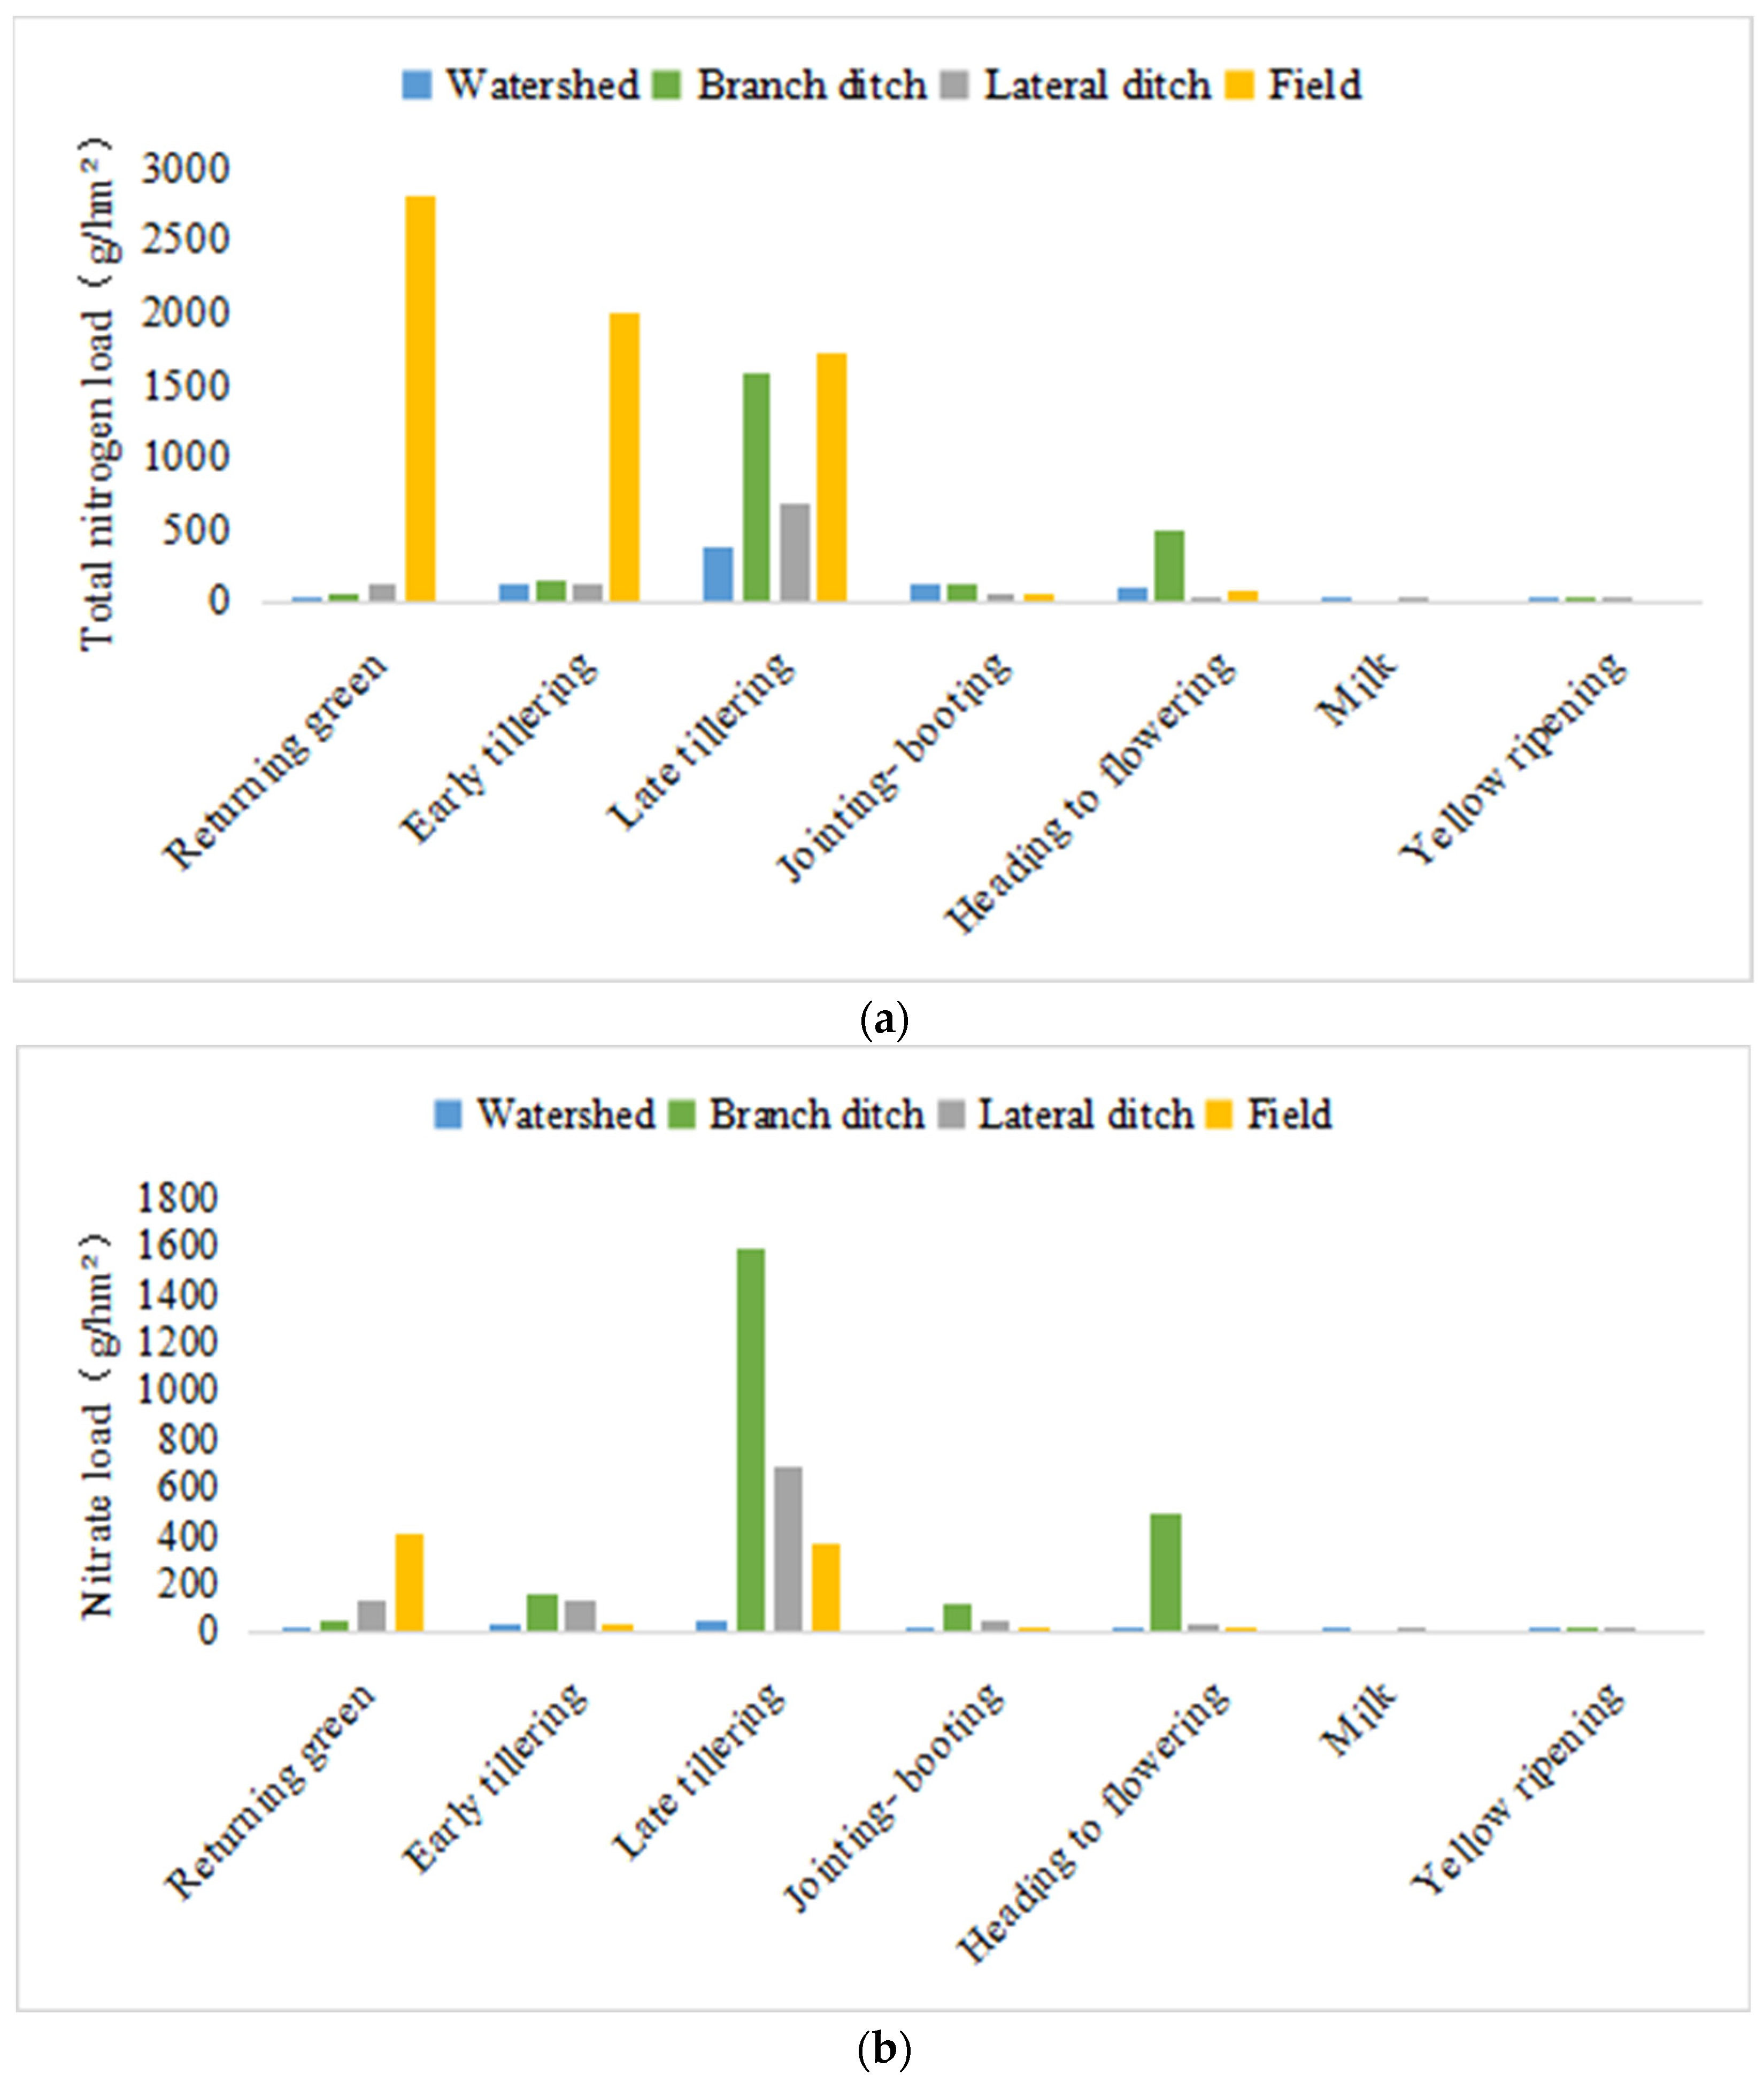
3.6.1. Nitrogen Load in Drainage Water in Different Growth Phases

Figure 7 shows the nitrogen load in the drainage water. The change trend between the nitrogen load in the drainage water and the volume of drainage water at different growth stages at all scales was similar. The nitrogen load in the drainage water decreased with the increase of the scale during the entire growth period. Compared with that at the field scale, the TN load decreased by 84% at the lateral ditch scale, 64% at the branch ditch scale, and 88% at the watershed scale; the NO3-N load decreased by 57% at the lateral ditch scale, increased at the branch ditch scale, and decreased by 85% at the watershed scale; and the NH4+-N load decreased by 94% at the lateral ditch scale, 94% at the branch ditch scale, and 87% at the watershed scale. The nitrogen load discharge at the branch ditch scale increased significantly in the late tillering stage.

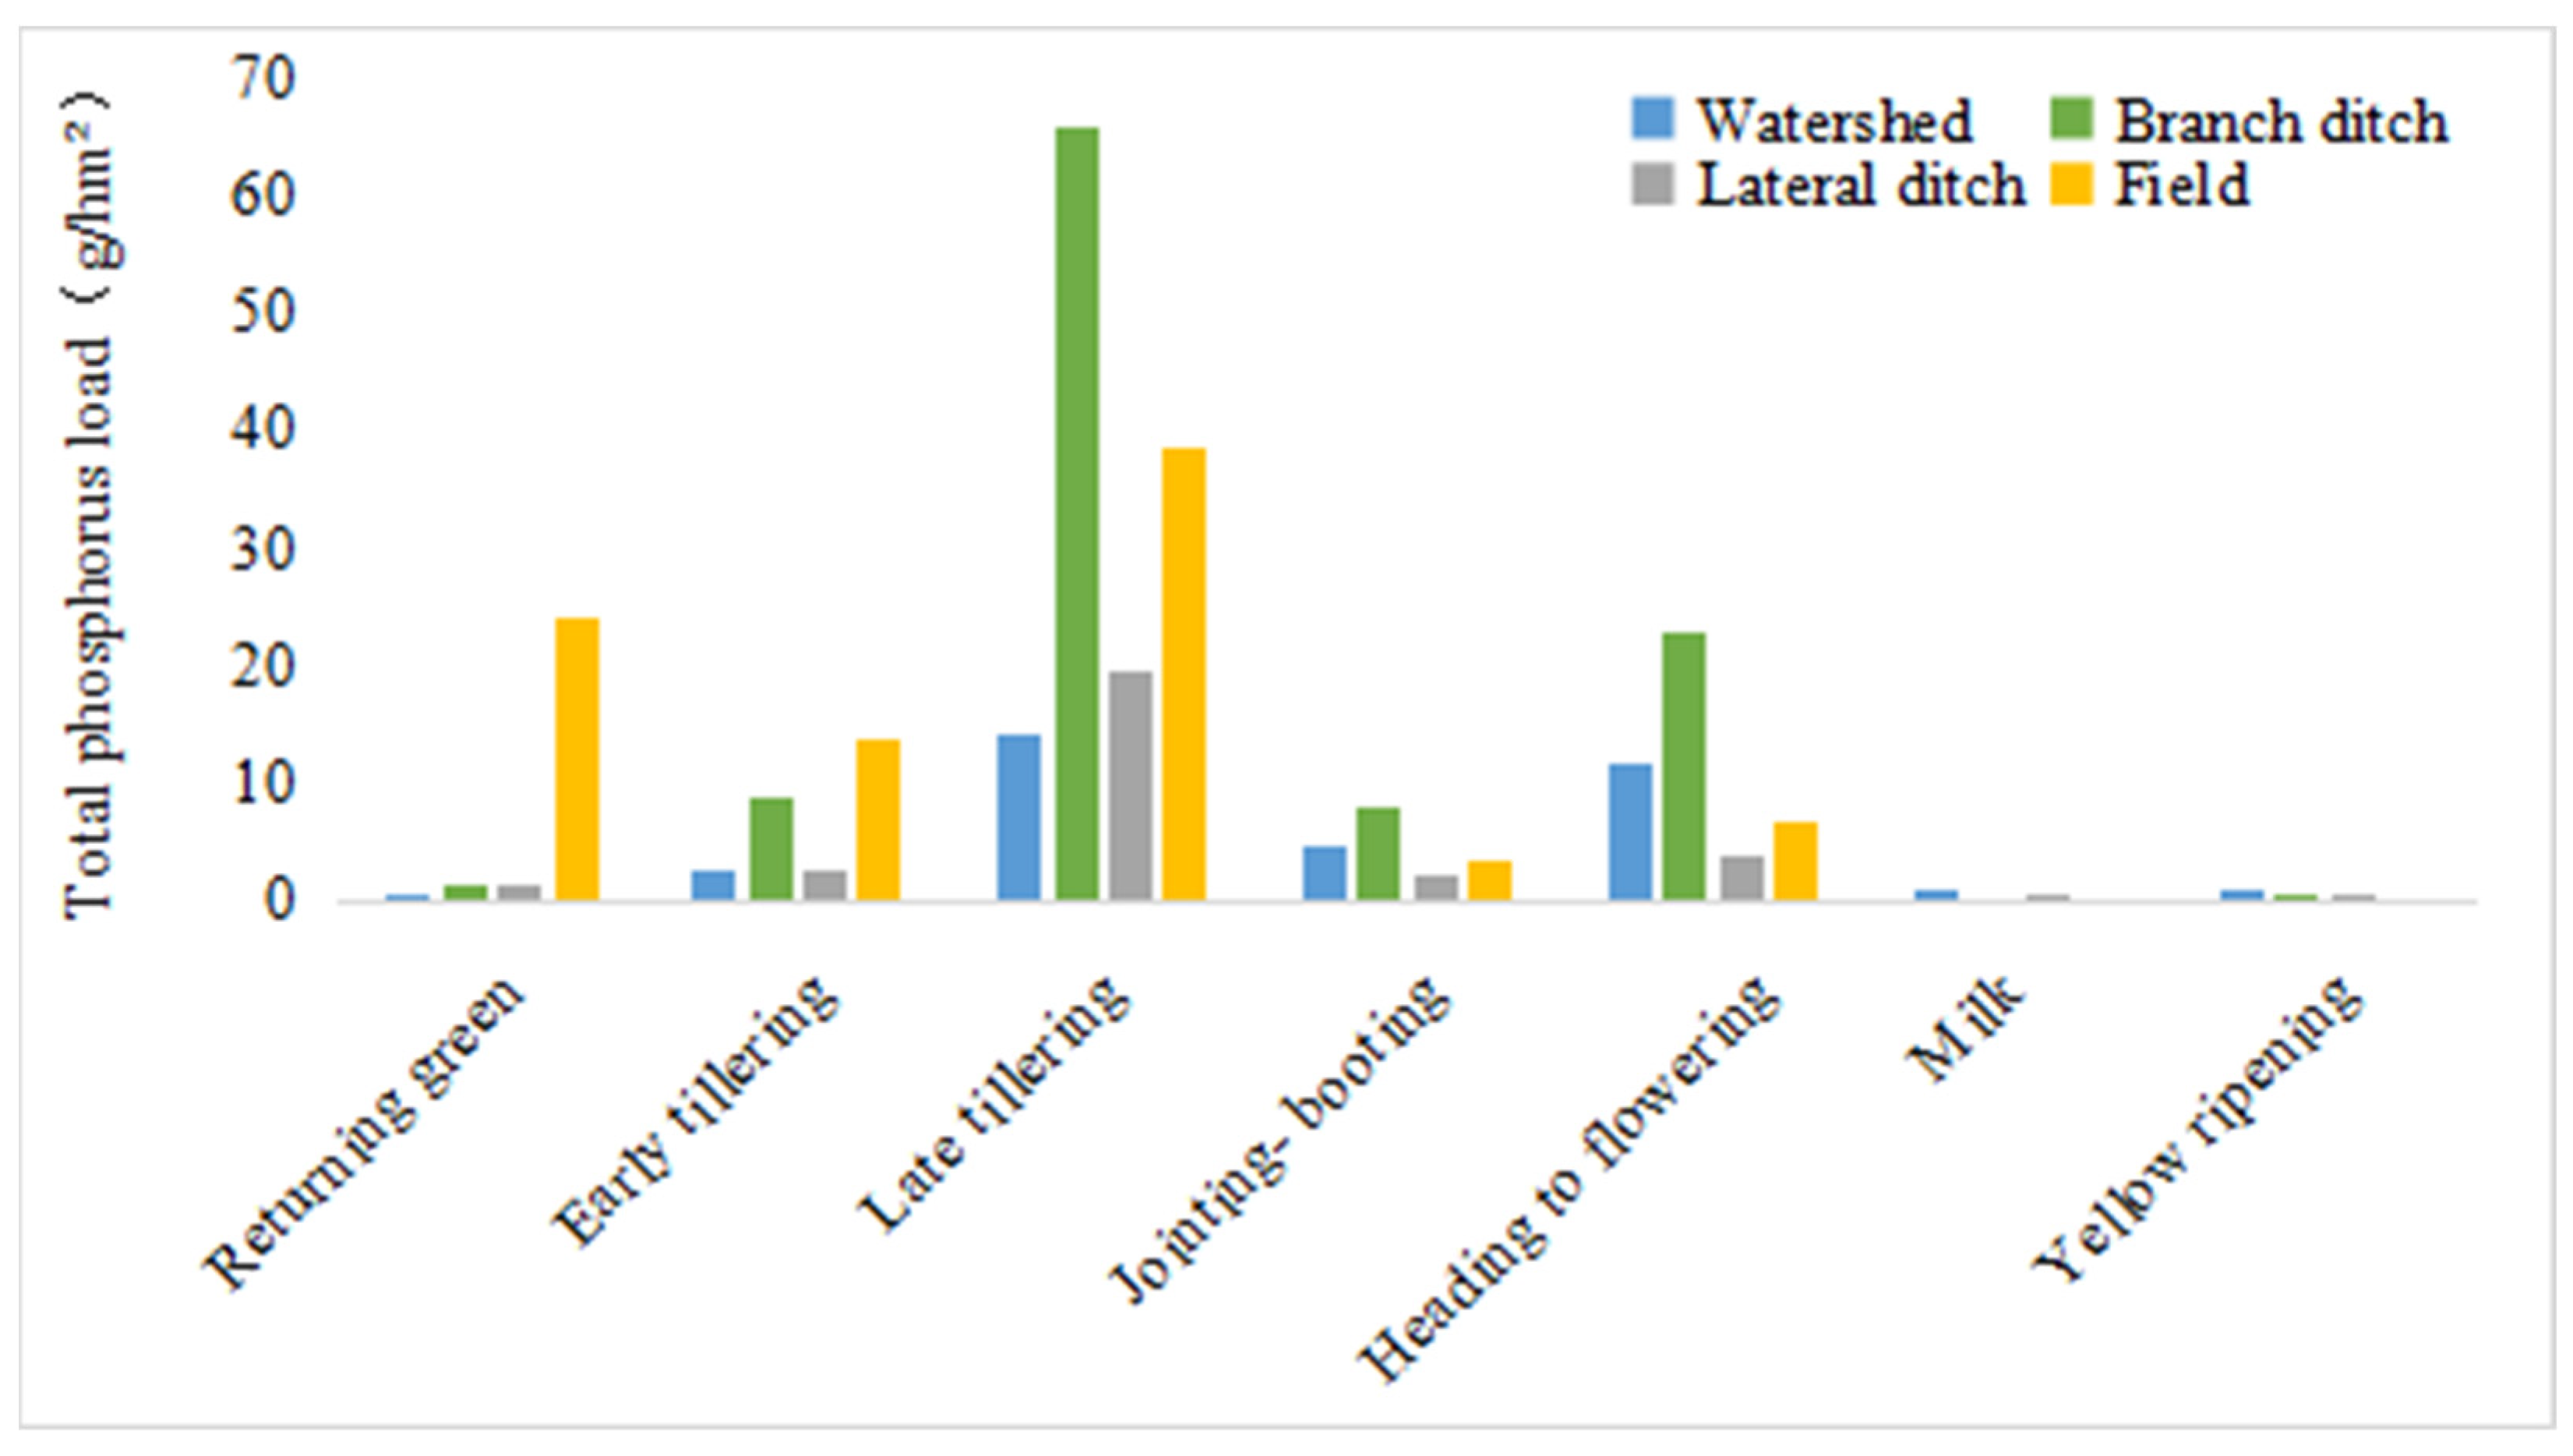
3.6.2. TP Load in Drainage Water in Different Growth Phases

Figure 8 shows the TP load in the drainage water at each growth stage and throughout the entire growth period. The change trend between the TP load in the drainage water and the volume of drainage water at different growth stages at all scales was similar. It can be seen from Figure 8 that the TP load at each growth stage basically decreased with the increase of the scale but was abnormal at the late tillering stage and the heading-flowering stage. In particular, the TP load increased significantly at all scales at the late tillering stage, with 38 g/hm2 at the field scale and up to 65 g/hm2 at the branch ditch scale. During the entire growth period, the TP load decreased with the increase of the scale; compared with that at the field scale, the TP load decreased by 66% at the lateral ditch scale and 60% at the watershed scale but increased instead at the branch ditch scale. This was related to the significant increase in the TP load at the branch ditch scale at the late tillering stage.

4. Discussion

The influence of irrigation methods on the drainage and nitrogen and phosphorus discharge load are explored, the regression utilization model of irrigation water is analyzed, and the mechanism of the scale effect is discussed.

4.1. Influence of Irrigation Methods on the Volume of Drainage Water and on Nitrogen and Phosphorus Loads in Drainage Water

The rice irrigation in the study area was generally in intermittent mode [29], with soaking irrigation during the regreening stage, draining and sunning the field during the late tillering stage, and irrigating or draining the field during the other growth stages according to soil moisture conditions. The main task at the late tillering stage of rice is to control the number of ineffective tillers. When the number of tillers reaches the expected number of panicles, excess water in the field must be removed in time; that is, the field should be actively drained when it is flooded due to precipitation during this stage [37]. In 2022, there was a total of 201 mm of precipitation at the late tillering stage (from 15 June to 4 July), accounting for 42.3% of the total precipitation during the rice growth period. Combined with the low water demand of rice, a large volume of drainage water was therefore generated from the field at this growth stage. The increase in drainage caused significant fluctuations in the concentrations of NH4+-N, which is morphologically unstable, and TP, which is highly susceptible to adsorption and leaching. This resulted in a significant increase in the nitrogen and phosphorus discharge loads at the lateral ditch, branch ditch, and watershed scales during this stage, as shown in Figure 7 and Figure 8, especially at the branch ditch scale. This is consistent with the results of previous studies [38].

4.2. Influence of Reuse of Farmland Drainage Water on the Scale Effect

According to the field survey, the area of ponds and weirs and the area of irrigation and drainage systems at all levels in the study area accounted for 13.4% and 7.3% of the total area, respectively, and their function as an intermediate carrier for water storage should not be overlooked. There are two modes of reuse of farmland drainage water in south China: ① water in drainage ditches for irrigation; and ② drainage water received by ponds and weirs for irrigation. The process of reusing farmland drainage water is shown in Figure 9. The reuse frequency of farmland drainage is determined by the demand in our system, which is similar to the recycling system of ponds-wetland constructed by Wang et al., 2022 [39] in Shanghai. The system established by Wang et al. stipulates that the pond water is reused three times a year. SWAT model analysis also shows that making full use of pond water can reduce irrigation water [40].
According to the result of a previous study by this research group on this subject, the farmland drainage water at the lateral ditch scale in this study area reached a reuse rate of 89.93% [41], which is not far from the result of 85.3% reported by Takehide et al. [42], 2011 for the surface watershed of Lake Biwa in Japan and 75.50% reported by Fleifle et al. [10], 2012 in Egypt. There was a large area and a large number of ponds, weirs, and ditches at the branch ditch scale. Due to the limited quantity and accuracy of test monitoring equipment, no specific data were available for the reuse rate of drainage water. However, the volume of drainage water per unit area at the branch ditch scale was slightly smaller than that at the lateral ditch scale. The research results in the same area indicated that the larger the scale, the higher the degree of reuse of ditch drainage [41,43].
At the watershed scale, the volume of drainage water per unit area increased slightly with the increase of the catchment area, as shown in Figure 4. The overall change trend is similar to the results of previous similar studies [27,28,44]. The available irrigation return flows are mainly related to the engineering condition, water management level, crop type, soil type, and other factors in the irrigation systems. As these factors are similar at different scales, the percentage of the available irrigation return flows in the gross irrigation water consumption over a certain scale is also similar at different scales [34].
Return flow is dependent on many aspects, such as soil characteristics, method of irrigation, rainfall, etc., and it is not appropriate to put a rule-of-thumb value on such quantities [14]. Considering the uncertainties of the watershed control area and precipitation, further monitoring experiments are needed to characterize the changes in the volume of discharge water per unit area with the increase of scale.
The discharge loads at the field scale and watershed scale were larger than those at the lateral ditch scale and branch ditch scale, which was due to the large drainage quantity. From the field scale to the lateral ditch scale and branch ditch scale, the drainage water was reduced, indicating that a large amount of water was reused in ponds and ditches.
The nitrogen and phosphorus load discharges at the farmland scale were largest due to the drainage quantity. From the farmland scale to the lateral ditch scale and branch ditch scale, ponds and ditches were recharged sufficiently. From the lateral ditch scale to the branch ditch scale, the control area increased significantly, while the density of ponds and weirs in this area was lower than that at other scales. In addition, there was a large number of farming ponds that were recharged infrequently, coupled with the general short duration and high intensity of precipitation in this area. Therefore, the farmland runoff had a high intensity and a strong scouring effect. As a result, the nitrogen and phosphorus load discharges were high at the drainage outlets at the branch ditch scale.
As can be seen from Figure 6 and Figure 7, after passing through the Yangshudang Reservoir, the concentrations of TP, TN, NO3-N, and NH4+-N all decreased, and the load discharge was reduced at the outlet of the watershed. This indicates that the drainage transfer stations, such as ponds and weirs, depressions, and the Yangshudang Reservoir, weakened the drainage intensity and load discharge and had a strong regulating effect on agricultural non-point pollution in this area, which was a key cause for the scale effect on the drainage water volume and the nitrogen and phosphorus discharge loads in similar areas. This is basically consistent with the research results of He Jun, 2010 [28] and Yang Baolin, 2014 [27], who believed that ecological channels have a significant improvement effect on drainage water quality at the farmland scale and lateral scale.

5. Conclusions

The effects of lateral seepage and deep seepage on field water balance and the effects of scale effect on drainage and nitrogen and phosphorus discharge load are summarized. The reason of scale effect is mentioned, and strategies to reduce the drainage and nitrogen and phosphorus discharge load in hilly irrigation areas are put forward.
(1) The water output from the field was dominated by evapotranspiration, accounting for 45% of the total output water; followed by drainage, accounting for 36% of the total output water; and lateral seepage and deep seepage, each accounting for about 10% of the output water from the field. Attention should be paid to controlling lateral seepage and deep seepage to reduce the loss of farmland water. From the field scale to the watershed scale, the volume of drainage water per unit area decreased by 74.6%, the TN load decreased by 88%, the NO3-N load decreased by 85%, the NH4+-N load decreased by 87%, and the TP load decreased by 60%, showing a pronounced scale effect.
(2) The scale effect was mainly caused by the reuse of farmland drainage water from the irrigation area, and the ponds and weirs, ditches, and reservoirs in the irrigation area had a strong regulating effect on the nitrogen and phosphorus concentrations. The sudden change in the load discharge at the branch ditch scale was mainly due to the low density and low recharge frequency of ponds and weirs in the control area of this scale, which led to the continuous rise of nitrogen and phosphorus concentrations at this scale. Therefore, during time periods in which a large volume of drainage water occurs, ponds, weirs, and ditches should be emptied in advance to enhance their recharge function and thus store drainage water to reduce the concentration and load discharge of nitrogen and phosphorus.
(3) Irrigation methods had a marked influence on nitrogen and phosphorus load discharges, and the adoption of high-intensity irrigation and drainage at a particular growth stage was highly likely to lead to the loss and leaching of nitrogen and phosphorus. Therefore, in hilly irrigation areas with sufficient moisture, the wet irrigation mode should be adopted as much as possible to keep the field from being too dry or too wet for a long period of time and to minimize the occurrence of high-intensity drainage. When treating non-point source pollution with the watershed as a unit, the focus should be placed on controlling drainage at the late tillering stage and improving the recharge function of ponds and weirs and the water storage capacity of ditches after the branch ditch scale to control the concentrations of nitrogen and phosphorus pollutants.

Author Contributions

N.Y.: Data curation; Formal analysis; Investigation; Writing—original draft. Y.L.: Writing—review and editing. Y.X.: Formal analysis; Investigation; B.X.: Formal analysis; Investigation; F.L.: Project management; H.F.: Writing—original draft. All authors have read and agreed to the published version of the manuscript.

Funding

We are grateful for grants from the National Natural Science Foundation of China (U2040213), the Science and Technology Project of Jiangxi Provincial Department of Water Resources (No. 202123YBKT22), the Fundamental Research Funds for Central Public Welfare Research Institutes (No. CKSF2021299/NY).

Data Availability Statement

Data is contained within the article.

Acknowledgments

We thank LetPub (www.letpub.com (accessed on 14 February, 2023)) for its linguistic assistance during the preparation of this manuscript.

Conflicts of Interest

The authors declare no conflict of interest.

References

  1. Dai, J.; Cui, Y. Progress in study of the irrigation hydrology. Adv. Water Sci. 2008, 19, 294–300, (In Chinese with English abstract). [Google Scholar]
  2. Droogers, P.; Kite, G. Estimating productivity of water at different spatial scales using simulation modeling. Iwmi Res. Rep. 2001. [Google Scholar]
  3. Janssen, M.; Lennartz, B. Water losses through paddy bunds: Methods, experimental data, and simulation studies. J. Hydrol. 2009, 369, 142–153. [Google Scholar] [CrossRef]
  4. Janssen, M.; Lennartz, B. Horizontal and vertical water and solute fluxes in paddy rice fields. Soil Tillage Res. 2006, 94, 133–141. [Google Scholar] [CrossRef]
  5. Liang, X.Q.; Li, H.; Chen, Y.X.; He, M.M.; Tian, G.M.; Zhang, Z.J. Nitrogen loss through lateral seepage in near-trench paddy fields. J. Environ. Qual. 2008, 37, 712–717. [Google Scholar] [CrossRef] [PubMed]
  6. Youssef, M.A.; Liu, Y.; Chescheir, G.M.; Skaggs, R.W.; Negm, L.M. DRAINMOD modeling framework for simulating controlled drainage effect on lateral seepage from artificially drained fields. Agric. Water Manag. 2021, 254, 106944. [Google Scholar] [CrossRef]
  7. Henry, A.; Cal, A.J.; Batoto, T.C.; Torres, R.O.; Serraj, R. Root attributes affecting water uptake of rice (Oryza sativa) under drought. J. Exp. Bot. 2012, 63, 4751–4763. [Google Scholar] [CrossRef] [Green Version]
  8. Yuan, N.; Xiong, Y.; Li, Y.; Xu, B.; Liu, F. Experimental study of the effect of controlled drainage on soil water and nitrogen balance. Water 2021, 13, 2241. [Google Scholar] [CrossRef]
  9. Zhang, X.; Cui, Y.; Dong, B. The system dynamic model of the return flow. J. Irrig. Drain. 2005, 24, 57–62, (In Chinese with English abstract). [Google Scholar]
  10. Fleifle, A.E.; Valeriano, O.C.S.; Nagy, H.M.; Elfetiany, F.A.; Tawfik, A.; Elzeir, M. Simulation-optimization model for intermediate reuse of agriculture drainage water in Egypt. J. Environ. Eng. 2013, 139, 391–401. [Google Scholar] [CrossRef]
  11. Negm, L.M.; Youssef, M.A.; Jaynes, D.B. Evaluation of DRAINMOD-DSSAT simulated effects of controlled drainage on crop yield, water balance, and water quality for a corn-soybean cropping system in central Iowa. Agric. Water Manag. 2017, 187, 57–68. [Google Scholar] [CrossRef]
  12. Youssef, M.A.; Abdelbaki, A.M.; Negm, L.M.; Skaggs, R.W.; Thorp, K.R.; Jaynes, D.B. DRAINMOD-simulated performance of controlled drainage across the U.S. Midwest. Agric. Water Manag. 2018, 197, 54–66. [Google Scholar] [CrossRef]
  13. Cui, Y.; Wu, D.; Wang, S.; Wen, J.; Wang, H. Simulation and analysis of irrigation water consumption in multi-source water irrigation districts in Southern China based on modified SWAT model. Trans. Chin. Soc. Agric. Eng. (Trans. CSAE) 2018, 34, 94–100, (In Chinese with English abstract). [Google Scholar] [CrossRef]
  14. Gosain, A.K.; Rao, S.; Srinivasan, R.; Reddy, N.G. Return-flow assessment for irrigation command in the Palleru river basin using SWAT model. Hydrol. Process. 2005, 19, 673–682. [Google Scholar] [CrossRef]
  15. Cui, Y.L.; Dong, B.; Li, Y.H. Variation of water productivity in different spatial scales. J. Hydraul. Eng. 2006, 1, 45–51, (In Chinese with English abstract). [Google Scholar]
  16. Schulze, R. Transcending scales of space and time in impact studies of climate and climate change on agrohydrological responses. Agric. Ecosyst. Environ. 2000, 82, 185–212. [Google Scholar] [CrossRef]
  17. Loeve, R.; Hong, L.; Dong, B.; Mao, G.; Chen, C.D.; Dawe, D.; Barker, R. Long-term trends in intersectoral water allocation and crop water productivity in Zhanghe and Kaifeng, China. Paddy Water Environ. 2004, 2, 237–245. [Google Scholar] [CrossRef]
  18. Luckeydoo, L.M.; Fausey, N.R.; Brown, L.C.; Davis, C.B. Early development of vascular vegetation of constructed wetlands in northwest Ohio receiving agricultural waters. Agric. Ecosyst. Environ. 2002, 88, 89–94. [Google Scholar] [CrossRef]
  19. Wan, Y. Study on Drainage System and its Effect of Preventing Farmland Non-Point Source Water Pollution in Rice Irrigated Area. Ph.D. Thesis, Wuhan University, Wuhan, China, June 2017. (In Chinese with English abstract). [Google Scholar]
  20. Karegoudar, A.V.; Vishwanath, J.; Anand, S.R.; Rajkumar, R.H.; Ambast, S.K.; Kaledhonkar, M.J. Feasibility of controlled drainage in saline vertisols of TBP Command Area of Karnataka, India. Irrig. Drain. 2019, 68, 969–978. [Google Scholar] [CrossRef]
  21. Yang, S.; Xu, J.; Zhang, J.; Wang, Y.; Peng, S. Reduction of non-point source pollution from paddy fields through controlled drainage in an aquatic vegetable wetland-ecological ditch system. Irrig. Drain. 2016, 65, 734–740. [Google Scholar] [CrossRef]
  22. Yu, Y.; Xu, J.; Zhang, P.; Meng, Y.; Xiong, Y. Controlled irrigation and drainage reduce rainfall runoff and nitrogen loss in Ppaddy fields. Int. J. Env. Res. Public Health 2021, 18, 3348. [Google Scholar] [CrossRef]
  23. Li, J. Effects of Different Fertilizations Treatments on Rice Yield and the Risk of Nitrogen and Phosphorus Losses from Paddy Field. Master’s Thesis, Zhejiang University, Hangzhou, China, June 2016. (In Chinese with English abstract). [Google Scholar]
  24. Abdelnabi, A.A.H. Field Drainage Strategies to Adapt Climate Change and Crop Production in the Lower Reaches of the Yangtze River Basin, China. Ph.D. Thesis, Yangzhou University, Yangzhou, China, May 2022. [Google Scholar]
  25. Hama, T.; Aoki, T.; Osuga, K.; Sugiyama, S.; Iwasaki, D. Reducing the phosphorus effluent load from a paddy-field district through cyclic irrigation. Ecol. Eng. 2013, 54, 107–115. [Google Scholar] [CrossRef] [Green Version]
  26. Vymazal, J. Emergent plants used in free water surface constructed wetlands: A review. Ecol. Eng. 2013, 61, 582–592. [Google Scholar] [CrossRef]
  27. Yang, B.L.; Cui, Y.L.; Zhao, S.J.; Lu, C.Z.; Wang, W.C. Scale effects of the emission laws of nitrogen and phosphorus from paddy fields in south China’s Hills. China Rural Water Hydropower 2014, 7, 85–88, (In Chinese with English abstract). [Google Scholar]
  28. He, J.; Cui, Y.; Wang, J.; Shi, W. Experiments on nitrogen and phosphorus losses from paddy fields under different scales. Trans. CSAE 2010, 26, 56–62, (In Chinese with English abstract). [Google Scholar]
  29. Liu, F. Effects of irrigation and fertilization in paddy field on discharge of agricultural non-point-source pollution in different scale districts. Acta Agric. Jiangxi 2016, 28, 105–109, (In Chinese with English abstract). [Google Scholar]
  30. Chen, M.; Cui, Y.; Zheng, S.; Yang, B.; Zhao, S. Scale effect of agriculturalnon-point source pollution based on SWAT model. China Rural. Water Hydropower 2016, 9, 187–191, (In Chinese with English abstract). [Google Scholar]
  31. Feng, Y.W.; Yoshinaga, I.; Shiratani, E.; Hitomi, T.; Hasebe, H. Characteristics and behavior of nutrients in a paddy field area equipped with a recycling irrigation system. Agric. Water Manag. 2004, 68, 47–60. [Google Scholar] [CrossRef]
  32. Dong, B.; Cui, Y.L.; Li, Y.H. Scale effect of water saving in rice-based irrigation system. Adv. Water Sci. 2005, 16, 833–839, (In Chinese with English abstract). [Google Scholar]
  33. Cui, Y.; Dong, B.; Li, Y.; Cai, X. Assessment indicators and scales of water saving in agricultural irrigation. Trans. Chin. Soc. Agric. Eng. 2007, 23, 1–7, (In Chinese with English abstract). [Google Scholar]
  34. Wu, D.; Cui, Y.; Wang, Y.; Chen, M.; Luo, Y.; Zhang, L. Reuse of return flows and its scale effect in irrigation systems based on modified SWAT model. Agric. Water Manag. 2019, 213, 280–288. [Google Scholar] [CrossRef]
  35. Takeda, I.; Fukushima, A. Long-term changes in pollutant load outflows and purification function in a paddy field watershed using a circular irrigation system. Water Res. 2006, 40, 569–578. [Google Scholar] [CrossRef] [PubMed]
  36. Shao, P.; Li, Y.; Xiong, Y.; Yuan, N.; Su, P. Reusing effluent water in drainage ditches for irrigation in hilly regions. J. Irrig. Drain. 2023, 42, 136–144, (In Chinese with English abstract). [Google Scholar]
  37. Zhang, L.J.; Ma, Y.; Shi, Y.; Zhu, X.; Wang, L.; Ma, Z.; Fang, R. Effects of irrigation and fertilization on nitrogen and phosphorus runoff from paddy field. J. Soil Water Conserv. 2011, 25, 7–12. (In Chinese) [Google Scholar]
  38. Tan, X.; Shao, D.; Gu, W.; Liu, H. Field analysis of water and nitrogen fate in lowland paddy fields under different water managements using HYDRUS-1D. Agric. Water Manag. 2015, 150, 67–80. [Google Scholar] [CrossRef]
  39. Wang, P.; Qian, J.; Hu, B.; Wang, X.; Jin, Q.; Hu, S.; Qiu, W. Construction method of irrigation water recycling system of farmland. J. Hohai Univ. Nat. Sci. 2022, 50, 7–12. [Google Scholar] [CrossRef]
  40. Dai, J.; Cui, Y.; Cai, X.; Brown, L.C.; Shang, Y. Influence of water management on the water cycle in a small watershed irrigation system based on a distributed hydrologic model. Agric. Water Manag. 2016, 174, 52–60. [Google Scholar] [CrossRef]
  41. Shao, P.; Xiong, Y.; Yuan, N.; Peng, Z.; Li, Y.; Su, P.; Wei, G. Hydrological cycle for Paddy-Ponds-Ditches system and reuse of return flow in Southern hilly irrigated areas. Trans. Chin. Soc. Agric. Eng. (Trans. CSAE) 2023, 39, 66–77, (In Chinese with English abstract). [Google Scholar] [CrossRef]
  42. Hama, T.; Nakamura, K.; Kawashima, S.; Kaneki, R.; Mitsuno, T. Effects of cyclic irrigation on water and nitrogen mass balances in a paddy field. Ecol. Eng. 2011, 37, 1563–1566. [Google Scholar] [CrossRef] [Green Version]
  43. Wu, D.; Cui, Y.; Huang, W.; Gong, L.; Fan, G.; An, L.; Li, D.; Yu, Q. Scale effect of water-saving potential in multi-source irrigation systems based on modified SWAT model. Trans. Chin. Soc. Agric. Eng. (Trans. CSAE) 2021, 37, 82–90, (In Chinese with English abstract). [Google Scholar]
  44. Gao, Y.; Wang, C.; Wang, P.; Chen, J.; You, G. Removal performance of nitrogen and phosphorus in farmland and drainage by different scale drainage ditches and the influence factors. Environ. Eng. 2023, 41, 8–15. [Google Scholar]
Figure 1. Location map of the nested watershed, branch ditch, and lateral ditch scales and layout of drainage points (P01: field scale drainage outlet; P02: lateral ditch scale drainage outlet; P03: branch ditch scale drainage outlet; P04: 2 km downstream of the drainage outlet of branch ditch scale; P05: watershed scale drainage outlet).
Agronomy 13 02083 g001
Figure 2. Change patterns of nitrogen and phosphorus concentrations in the field surface water. (a) Change pattern of the nitrogen concentration in the field surface water. (b) Change pattern of the total phosphorus (TP) concentration in the field surface water.
Agronomy 13 02083 g002
Figure 3. Change patterns of nitrogen and phosphorus concentrations in the seepage water. (a) Change pattern of the nitrogen concentration in the seepage water. (b) Change pattern of total phosphorus (TP) concentration in the seepage water.
Agronomy 13 02083 g003
Figure 4. Comparison of the drainage per unit area at different scales in the experimental area.
Agronomy 13 02083 g004
Figure 5. Change patterns of the nitrogen concentrations at different scales during the entire growth period.
Agronomy 13 02083 g005aAgronomy 13 02083 g005b
Figure 6. Change patterns of the total phosphorus (TP) concentration at different scales during the entire growth period.
Agronomy 13 02083 g006
Figure 7. Nitrogen load in drainage at different scales. (a) Total nitrogen (TN) load in drainage at different growth stages. (b) Nitrate nitrogen (NO3-N) load in drainage at different growth stages. (c) Ammonia nitrogen (NH4+-N) load in drainage at different growth stages.
Agronomy 13 02083 g007aAgronomy 13 02083 g007b
Figure 8. TP load in drainage at different scales at different growth stages.
Agronomy 13 02083 g008
Figure 9. Schematic diagram of the farmland drainage water cycle process in the study area.
Agronomy 13 02083 g009
Table 1. Date of water sampling.
MonthExact date
May18 May, 20 May, 24 May, 26 May, 28 May, 31 May
June3 June, 5 June, 7 June, 9 June, 11 June, 20 June, 22 June, 24 June, 26 June, 28 June, 30 June
July6 July, 8 July, 10 July, 12 July, 21 July, 22 July, 24 July, 26 July, 28 July, 30 July
August1 August, 3 August, 5 August, 7 August, 9 August, 11 August, 13 August, 15 August, 17 August, 19 August, 21 August, 23 August, 25 August, 27 August, 29 August, 31 August
September 5 September, 8 September, 11 September, 14 September, 17 September, 20 September, 23 September, 26 September
Table 2. Field water balance terms at different growth stages.
Growth StagesIrrigation (mm)Precipitation (mm)Evapotranspiration (mm)Infiltration (mm)Lateral Seepage (mm)Drainage (mm)
Regreening157.024.537.620.026.165.5
Early tillering24.399.550.019.318.164.0
Late tillering34.4201.047.59.05.4120.2
Jointing-booting0.091.584.712.09.829.9
Heading-flowering66.946.083.08.511.60.0
Milk34.512.551.06.01.80.0
Yellow ripening0.00.01.90.00.00.0
Total317.1475.0355.774.872.9279.6
Growth stagesRatio of the quantity at each growth stage to the total during the entire growth period
Regreening49.5%5.2%10.6%26.7%35.8%23.4%
Early tillering7.7%20.9%14.1%25.8%24.8%22.9%
Late tillering10.8%42.3%13.4%12.0%7.4%43.0%
Jointing-booting019.3%23.8%16.0%13.4%10.7%
Heading-flowering21.1%9.7%23.3%11.4%15.9%0.0%
Milk10.9%2.6%14.3%8.0%2.5%0.0%
Yellow ripening00.0%0.5%0.0%0.0%0.0%
Table 3. Analysis of the field nitrogen load discharge.
Growth StageTN (kg/hm2)NO3-N (kg/hm2)NH4+-N (kg/hm2)
DrainageDeep SeepageLateral SeepageDrainageDeep SeepageLateral SeepageDrainageDeep SeepageLateral Seepage
Regreening2.8060.8441.0950.4090.2010.1671.7850.4930.715
Early tillering2.0050.5340.4470.0320.0090.0081.3730.3240.276
Late tillering1.7230.3380.0910.3720.2320.0610.3840.0790.045
Jointing-booting0.0650.1420.0920.0140.0470.0530.0040.0350.002
Heading-flowering0.0760.0940.0450.0020.0070.0040.0250.0190.010
Milk00.034000.004000.0020
Yellow ripening000000000
Total6.6751.9861.7710.8290.5000.2933.5720.9521.048
Growth stageRatio of each growth stage to the total during the whole growth period
Regreening42.0%42.5%61.8%49.3%40.2%57.0%50.0%51.8%68.2%
Early tillering30.0%26.9%25.2%4.0%1.8%2.7%38.4%34.0%26.3%
Late tillering25.8%17.0%5.1%45.0%46.4%20.8%10.8%8.3%4.3%
Jointing-booting1.0%7.2%5.2%2.0%9.4%18.1%0.1%3.7%0.2%
Heading-flowering1.1%4.7%2.5%0%1.4%1.4%0.7%2.0%1.0%
Milk0%1.7%0%0%0.8%0.0%0.0%0.0%0.0%
Yellow ripening0%0%0%0%0.0%0.0%0.0%0.0%0.0%
Table 4. Analysis of the total phosphorus (TP) load discharge in the field.
Growth StageDrainage (kg/hm2)Deep Seepage (kg/hm2)Lateral Seepage (kg/hm2)
Regreening0.0240.0040.006
Early tillering0.0140.0060.005
Late tillering0.0390.0100.003
Jointing-booting0.0030.0040.003
Heading-flowering0.0060.0090.004
Milk00.0030
Yellow ripening000
Total0.0860.0360.021
Growth stageRatio of a quantity at each growth stage to the total during the whole growth period
Regreening27.9%11.1%28.6%
Early tillering16.3%16.7%23.8%
Late tillering45.3%27.8%14.3%
Jointing-booting3.5%11.1%14.3%
Heading-flowering7.0%25.0%19.0%
Milk0%8.3%0%
Yellow ripening0%0%0%
Table 5. Analysis of the changes in drainage with scale at different growth stages.
Growth StageDrainage (m3/hm2)
WatershedBranch DitchLateral DitchField
Regreening22.514.8411.80655
Early tillering76.9850.3940.06640
Late tillering310.45216.21307.531202
Jointing-booting163.0332.2743.60299
Heading-flowering123.9051.5233.920
Milk5.7805.400
Yellow ripening8.000.461.750
Total710.66355.69444.072796.00
Growth stageRatio of drainage at each growth stage to the total drainage during the whole growth period
Regreening3.2%1.4%2.7%23.4%
Early tillering10.8%14.2%9.0%22.9%
Late tillering43.7%60.8%69.3%43.0%
Jointing-booting22.9%9.1%9.8%10.7%
Heading-flowering17.4%14.5%7.6%0.0%
Milk0.8%0.0%1.2%0.0%
Yellow ripening1.1%0.1%0.4%0.0%
Disclaimer/Publisher’s Note: The statements, opinions and data contained in all publications are solely those of the individual author(s) and contributor(s) and not of MDPI and/or the editor(s). MDPI and/or the editor(s) disclaim responsibility for any injury to people or property resulting from any ideas, methods, instructions or products referred to in the content.

