Article

Appropriate Water and Nitrogen Regulation Improves the Production of Wolfberry (Lycium barbarum L.)

College of Water Conservancy and Hydropower Engineering, Gansu Agricultural University, Lanzhou 730070, China
*
Author to whom correspondence should be addressed.
Agronomy 2024, 14(3), 607; https://doi.org/10.3390/agronomy14030607
Submission received: 14 February 2024 / Revised: 11 March 2024 / Accepted: 15 March 2024 / Published: 18 March 2024

Abstract

:
Wolfberry (Lycium barbarum L.) production in arid and semi-arid areas is drastically affected by the low utilization rate of soil and water resources and the irrational application of water and nitrogen fertilizers. Thus, this study explored a high-yielding, high-quality, and efficient irrigation and nitrogen regulation model to promote the production efficiency of wolfberry and rational utilization of water and land resources in arid and semi-arid areas. We compared and analyzed the effects of different soil water treatments (the upper and lower limits of soil water were estimated as the percentage of soil water content to field water capacity (θf), with the following irrigation regimen: adequate irrigation (W0, 75–85% θf), mild water deficit (W1, 65–75% θf), moderate water deficit (W2, 55–65% θf), and severe water deficit (W3, 45–55% θf)) and nitrogen levels (no nitrogen (N0, 0 kg·ha−1), low nitrogen (N1, 150 kg·ha−1), moderate nitrogen (N2, 300 kg·ha−1), and high nitrogen (N3, 450 kg·ha−1)) on the growth, physiology, and production of wolfberry. The results showed that water regulation, nitrogen application level, and their interaction significantly affected plant height and stem diameter growth amount (p < 0.05). Additionally, the relative chlorophyll content of wolfberry leaves first increased and then decreased with increasing nitrogen levels and water deficit. The average net photosynthetic rate (Pn), stomatal conductance (gs), intercellular carbon dioxide concentration, and transpiration rate (Tr) reached the highest values in plants exposed to W0N2 (19.86 μmmol·m−2·s−1), W1N1 (182.65 mmol·m−2·s−1), W2N2 (218.86 μmol·mol−1), and W0N2 (6.44 mmol·m−2·s−1) treatments, respectively. Pn, gs, and Tr were highly correlated with photosynthetically active radiation and water vapor pressure difference (goodness-of-fit: 0.366–0.828). Furthermore, water regulation and nitrogen levels exhibited significant effects on the yield and water- (WUE), and nitrogen-use efficiency (NUE) (p < 0.01), and their interactions exhibited significant effects on the yield, WUE, and nitrogen partial productivity of wolfberry plants (p < 0.05). Moreover, the contents of total sugar, polysaccharides, fats, amino acids, and proteins were the highest in W1N2, W1N2, W1N2, W2N3, and W0N2 treatments, respectively, which were increased by 3.32–16.93%, 7.49–54.72%, 6.5–45.89%, 11.12–86.16%, and 7.15–71.67%, respectively. Under different water regulations (except for the W3 condition) and nitrogen level treatments, the net income and input–output ratio of wolfberry were in the order W1 > W0 > W2 > W3 and N2 > N3 > N1 > N0. The TOPSIS method also revealed that the yield, quality, WUE, NUE, and economic benefits of wolfberry improved under the W1N2 treatment, suggesting that WIN2 might be the most suitable irrigation and nitrogen regulation model for wolfberry production in regions with scarce land and water resources such as the Gansu Province and areas with similar climate.

1. Introduction

Salinization control and soil and water conservation are key to the rational utilization of land and water resources and the improvement in land productivity, as well as the ways to offer complete ecological, economic, and social benefits of soil and water resources [1,2]. Presently, the global salinized land spans approximately 956 million ha, accounting for 8.70% of the total land area, mostly distributed in arid and semi-arid zones in Africa, Asia, and Latin America [3]. According to the Food and Agriculture Organization of the United Nations (FAO) statistics, approximately one-third of the global land area, including more than 25 billion tons of arable land, has been degraded by soil erosion [4]. With a salinized area of 99.13 million ha and 2.4 billion tons of soil eroded annually, which is characterized by wide distribution, type ranges, and considerable regional differentiation, China is one of the countries that face the most serious problems associated with the salinization of arable land resources and erosion [5]. This is contrary to the “120 million ha of arable land red line”, “food security”, and other major national strategic deployment measures. Wolfberry (Lycium barbarum L.) is a perennial deciduous shrub belonging to the family Solanaceae [6], with a variety of biological functions, such as promotion of metabolism and regulation of immunity [7,8], and properties such as anti-aging and resistance to salinity, barrenness, and drought [9]. Thus, wolfberry has become a pioneering species for afforestation of arid and semi-arid areas to ensure saline- and alkaline-land improvement and soil and water conservation [10]. At present, the area under wolfberry cultivation in China spans approximately 100 thousand ha, accounting for more than 80% of the wolfberry cultivation area worldwide, which is mainly distributed in arid and semi-arid areas with a shortage of soil and water resources such as the Ningxia, Xinjiang, Qinghai, and Gansu Provinces [11]. Therefore, exploring appropriate irrigation and nitrogen management methods for wolfberry cultivation is significant for saline-land improvement, soil and water conservation, and developing and utilizing saline-cultivated land resources in China and even globally.
Water and nitrogen are two key factors affecting crop growth and development [12]. Water is required for maintaining cell structure and function, and suitable soil water conditions are conducive to the migration, absorption, and utilization of essential nutrients, such as nitrogen, which promote the growth of crop crowns and roots [13]. Nitrogen is an important element that contributes to protein synthesis and the production of other biologically active substances, and its dissolution in water reduces soil water evaporation, enhances leaf photosynthesis, and promotes the metabolism of photosynthetic products [14]. However, water-nitrogen supply is not always positively associated with crop growth, development, or yield, and excessive water-nitrogen inputs can lead to resource wastage, soil acidification, water pollution, increase in agricultural production costs, and other undesirable consequences [15,16]. Therefore, improving the efficiency of water and nitrogen utilization has become a hot topic in agricultural production. Crops respond to different water and nitrogen conditions through a series of responses [17]. Studies have shown that reasonable nitrogen application under low-to-moderate drought stress can increase chlorophyll content (Soil Plant Analysis Development, SPAD) and photosynthetic enzyme activities of potato leaves and reduce the damage caused by drought stress on the photosynthetic system [18]. Adequate irrigation (200 mm water) of winter wheat, coupled with nitrogen application (240 kg·ha−1), significantly increased the leaf area index and aboveground biomass [19]. Additionally, the application of 225 kg·ha−1 of nitrogen and 600 mm of water significantly increased nutrient accumulation and the yield of maize roots, stems, and leaves [20]. However, under certain water-deficit conditions, an appropriate application of nitrogen fertilizers can improve plant water status, promote root absorption and transport capacity, increase the accumulation of osmotic substances, and improve drought resistance, thus improving the quality of raw coffee beans [21]. Water-nitrogen levels exhibit antagonistic effects on yield, organic acid content, and vitamin C and lycopene contents but synergistic effects on soluble solid content in tomatoes [22].
Nonetheless, studies on the effects of water-nitrogen regulation on crop growth, physiology, and yield primarily focus on grain crops, such as wheat [23,24], potato [25,26], and corn [27,28], and economic crops, such as cotton [29,30] and tomato [31,32], and very few studies focus on economic forest species such as wolfberry. The irrigation area of the Yellow River in Gansu Province, China, is located in the middle and upper reaches of the Yellow River, with sufficient solar radiation (the sunshine duration was more than 2652 h), and the temperature difference between day and night was more than 15 °C, which are suitable for wolfberry cultivation [33]. However, soil erosion and salinization are serious issues in the area, as there is a shortage of water resources, and the soil is poor in nutrients [34]. Therefore, we used wolfberry from this region to address the following aims: (1) to systematically analyze the effects of water and nitrogen regulation on plant height, stem diameter, SPAD value, photosynthetic characteristics, yield, quality, water- (WUE) and nitrogen-use efficiency (NUE), and economic benefits of wolfberry in the Gansu diversion irrigation area; and (2) to conduct a multi-index comprehensive evaluation of each treatment using the TOPSIS method, to determine a water-nitrogen management method for increasing yield and growing high-quality and efficient plants, as well as provide a theoretical basis for the rational utilization of soil and water resources for high-quality production of wolfberry in saline and alkaline areas.

2. Materials and Methods

2.1. Description of the Experimental Site

The study was conducted at the Irrigation Experimental Station (37°23′ N, 104°08′ E; average altitude of approximately 1562 m) of the Jingtaichuan Electric Power Irrigation Water Resource Utilization Center in Gansu Province, in the middle and upper reaches of the Yellow River from May 2022 to September 2022. The region is characterized by a temperate continental arid climate with rare precipitation; the annual average precipitation was 184 mm, the sunshine duration was more than 2652 h, the annual average evaporation was 3029 mm, and the temperature difference between day and night was more than 15 °C. The annual average temperature, radiation, and frost-free period were 8.6 °C, 6.18 × 10⁵ J·cm−2, and 191 days, respectively. The vegetation coverage rate was approximately 18.35%, the soil texture was sandy loam, and the dry bulk weight and field water-holding capacity were 1.61 g·cm−3 and 24.10% (mass water content), respectively. The characteristics of the 0–60 cm soil layer at the test site were as follows: the organic matter content was 13.20 g·kg−1; total nitrogen, total phosphorus, and total potassium contents were 1.62 g·kg−1, 1.32 g·kg−1, and 34.03 g·kg−1, respectively; the contents of available nitrogen, available phosphorus, and available potassium were 74.51 mg·kg−1, 26.31 mg·kg−1, and 173.00 mg·kg−1, respectively; and the pH, salt content, alkalinity, and electrical conductivity were 8.11, 7.38 g·kg−1, 26.56%, and 2.34 dS·m−1, respectively. The meteorological data were obtained from a Davis small weather station installed in the field. The distribution of total precipitation (118 mm) and average daily temperatures (21.3 °C) during the study period are shown in Figure 1.

2.2. Experimental Design and Field Management

We adopted a completely randomized block design, and based on local production practices and previous studies [35], the following two factors were established: irrigation characteristics and nitrogen application levels. The depth of the wet layer of the irrigation plan was 60 cm, and the upper and lower limits of soil water were regulated using the percentage of soil water content to field water capacity (θf). Accordingly, we employed the following irrigation treatments: adequate irrigation (W0, 75–85% θf), mild water deficit (W1, 65–75% θf), moderate water deficit (W2, 55–65% θf), and severe water deficit (W3, 45–55% θf). Nitrogen treatments (using urea with a nitrogen content of 46%) were as follows: no nitrogen (N0, 0 kg·ha−1), low nitrogen (N1, 150 kg·ha−1), moderate nitrogen (N2, 300 kg·ha−1), and high nitrogen (N3, 450 kg·ha−1). Thus, there were 16 treatments in total, with each treatment repeated three times. Wolfberry trees (“Ningqi 5”) were grown in early April 2021, with row spacings of 1.5 m × 3 m and five rows of five trees in each plot (10.2 m × 7.5 m), making a total of 20 trees. Nitrogen fertilizer was applied in a ratio of 6:2:2 at the vegetative growth, full flowering stage, and peak of the summer fruit stage. Phosphate fertilizer (calcium superphosphate with 12% phosphorus content) and potassium fertilizer (potassium chloride with 60% potassium content) were applied at a rate of 130 kg·ha−1 once at the germination stage. The experiment integrated drip irrigation and fertilizers. Irrigation pipes were laid in each row, and valves and water meters (accuracy: 0.0001 m3) were installed to control the amount of irrigation. Drip irrigation was applied 15 cm away from wolfberry trees at a flow rate of 2 L·h−1. Other field management practices and pest control measures were consistent with local farming practices.

2.3. Indicators and Methods for Measurement

2.3.1. Soil Moisture

A portable soil-profile moisture meter with TDR (PICO-BT, IMKO, Germany) was used to measure soil moisture content. Measurements were taken once every 7 days, both before and after irrigation and rainfall events. In addition, the soil moisture content was checked regularly using the drying method.
Water consumption (ET, mm) during the growth period was calculated as follows:
E T = P + W 2 W 1 + I + K R D P
where P is the effective precipitation during the growth period (mm); W2 is the annual water storage (mm) of the 0–120 cm soil layer after harvest; W1 is the annual water storage in the 0–120 cm soil layer (mm) at the beginning of the experiment; I is the irrigation amount (mm); K is groundwater recharge (mm); R is the runoff (mm); and Dp is deep leakage (mm). As the groundwater depth at the study site was <5 m, the terrain was flat, and the single rainfall amount was small, K, R, and Dp could be ignored.

2.3.2. Plant Height and Stem Diameter Growth Amount

Three wolfberry plants with the same growth trend were randomly selected from each set, and the fixed-plant method was used to measure plant height (cm) and stem diameter (mm) using a tape measure at the time of planting (in 2021) and at the end of the growth stage (in 2022). The difference between the values was used to determine the increase in plant height (cm) and stem diameter (mm).

2.3.3. Chlorophyll Content (SPAD)

Three wolfberry plants with the same growth trend were randomly selected from each set, and SPAD values were determined using a portable chlorophyll meter (SPAD-502Plus Konica Minolta, Tokyo, Japan) at the vegetative growth, full flowering, summer fruit, and autumn fruit stages.

2.3.4. Photosynthetic Index

Leaf photosynthetic indexes, including net photosynthetic rate (Pn, μmol·m−2·s−1), transpiration rate (Tr, mmol·m−2·s−1), stomatal conductance (gs, mmol·m−2·s−1), and intercellular carbon dioxide concentration (Ci, μmol·mol−1), were monitored using the LI-6400XT portable photosynthetic measurement system (Li-Cor, Lincoln, NE, USA) at the peak of the summer fruit stage. All measurements were recorded between 08:00 and 18:00 on a sunny day, every 2 h, for 3 days, and their average values were calculated. Three wolfberry leaves, which were completely unfolded outside the branches and free of pests, diseases, and mechanical damage, were selected from each tree for the abovementioned estimations.

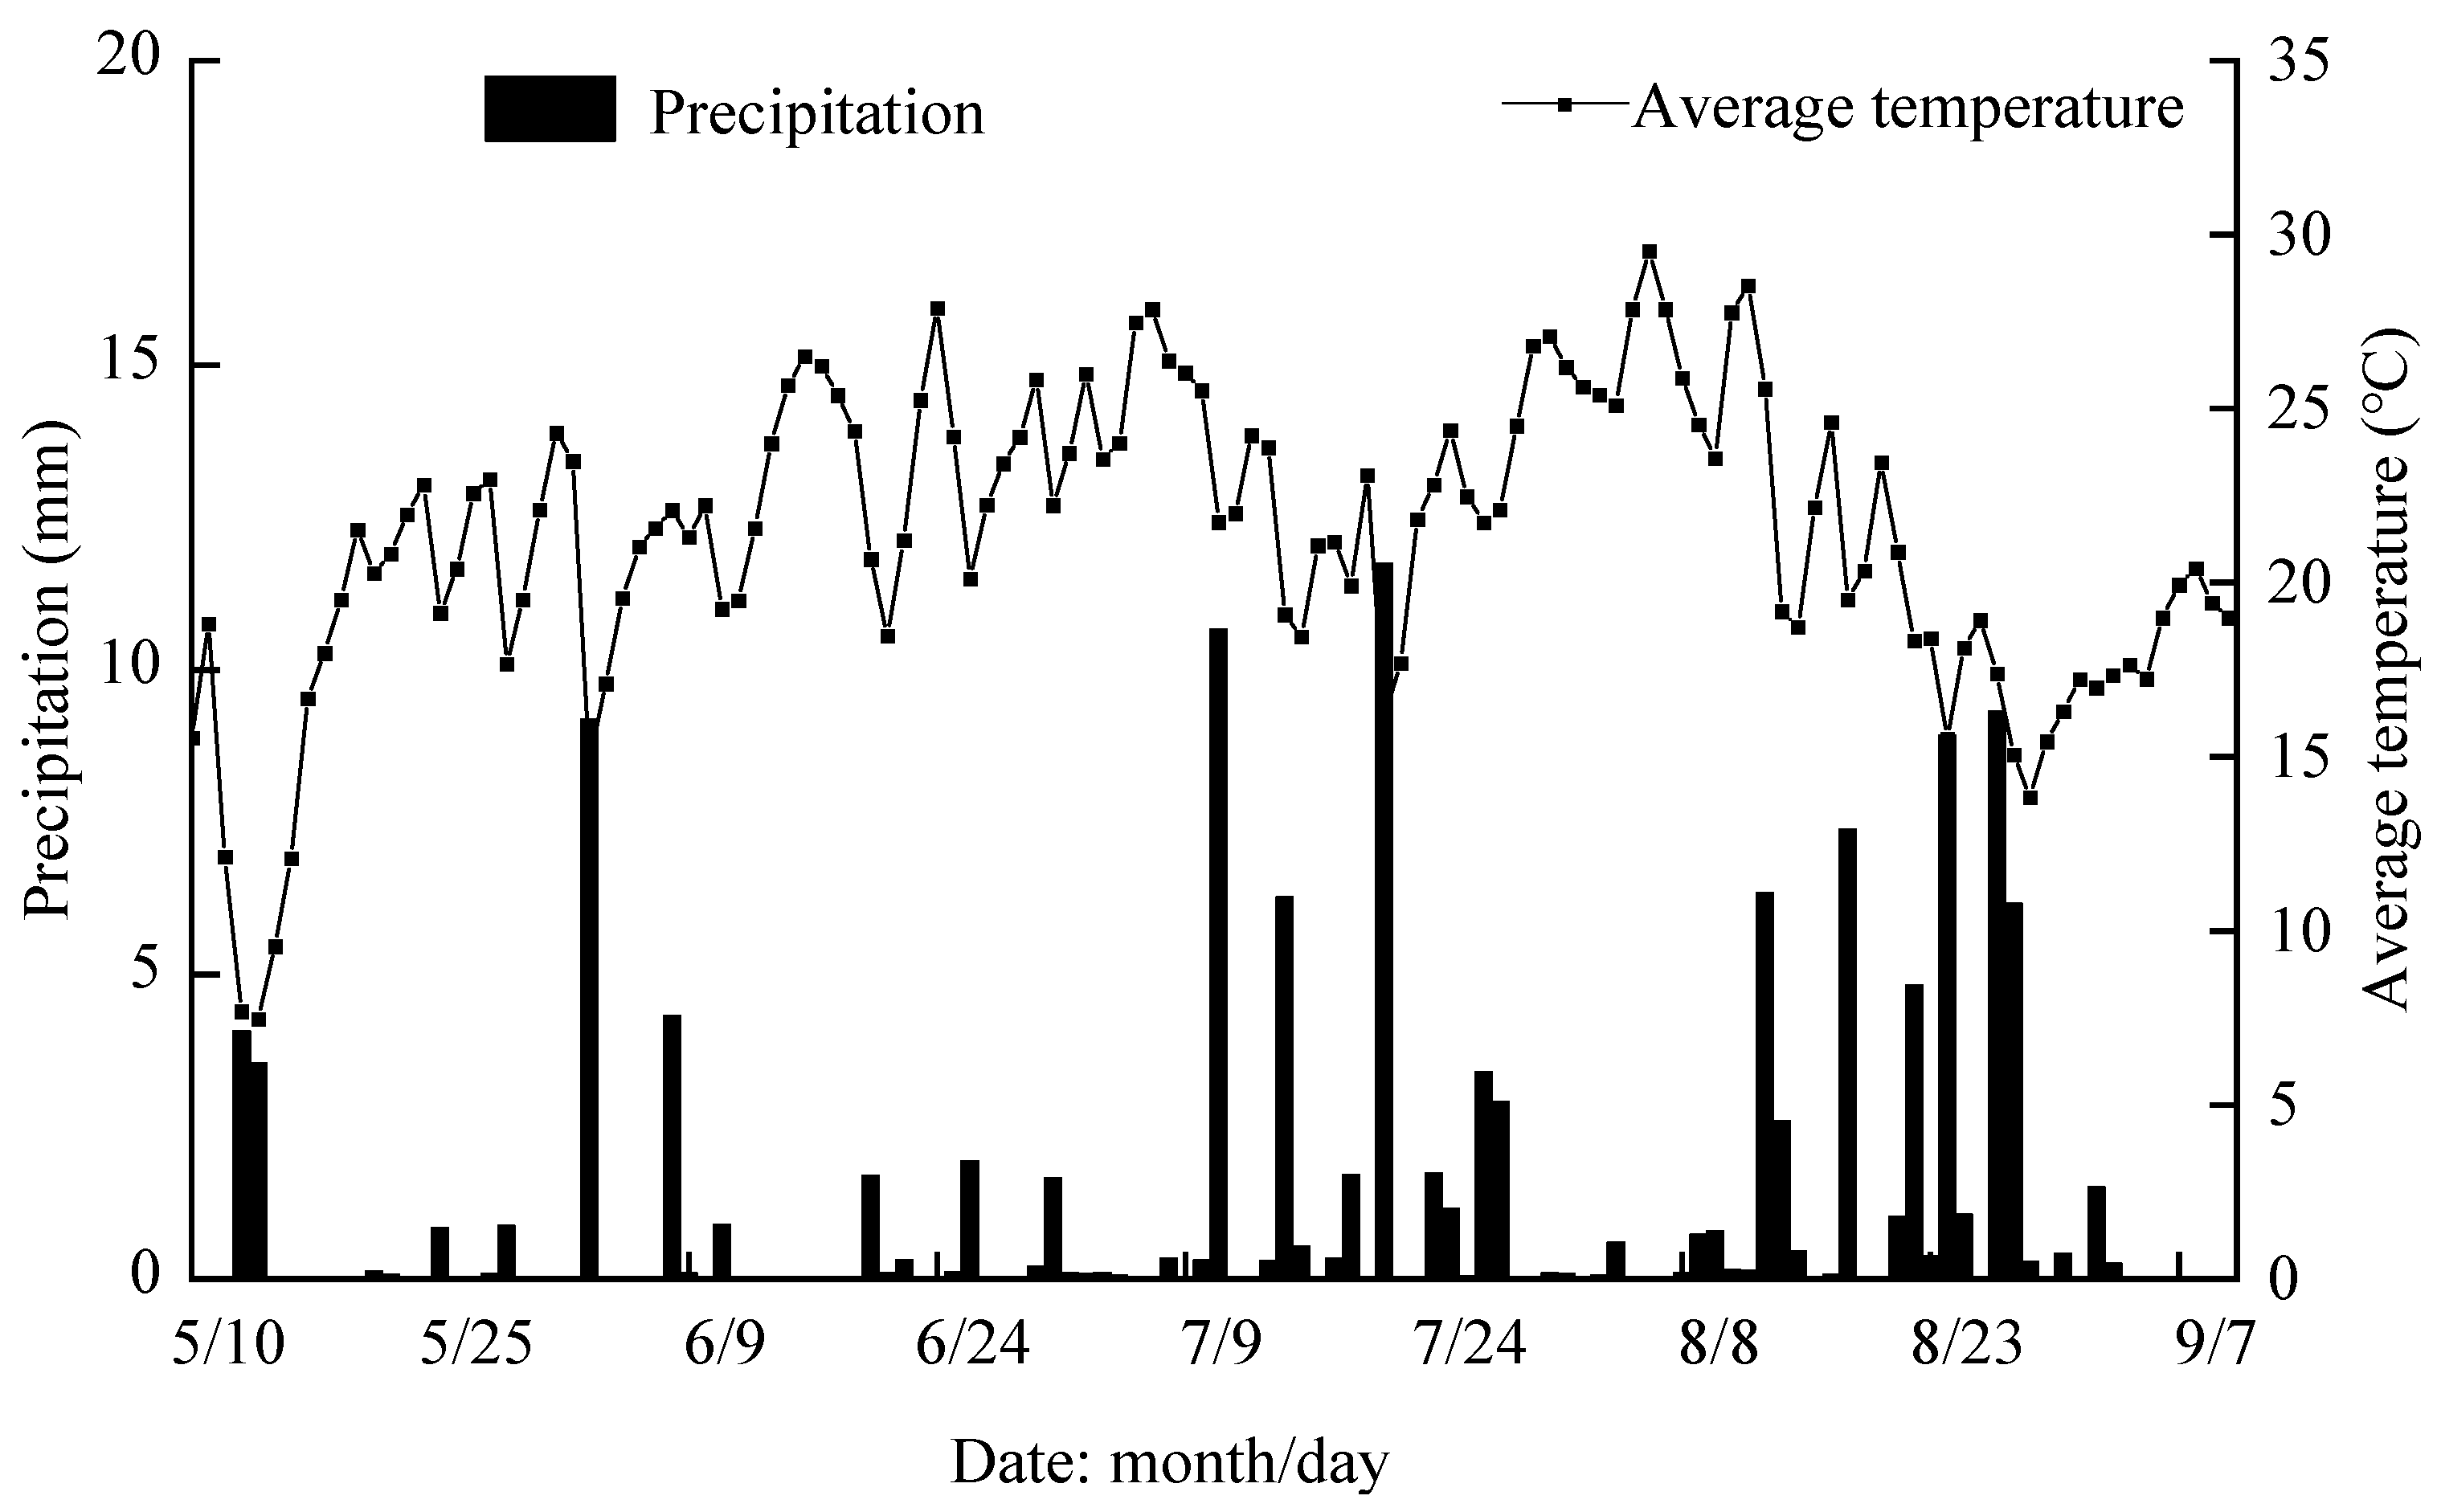
2.3.5. Environmental Factor

The water vapor pressure difference (Δe, kPa) and photosynthetically active radiation (PAR, μmol·m−2·s−1) were simultaneously monitored using the LI-6400XT portable photosynthetic measurement system during the peak of the summer fruit stage. Atmospheric temperature (Ta, °C) and relative humidity (RH, %) were measured at Davis, a small automatic weather station at the test base. All measurements were noted between 08:00 and 18:00 on a sunny day, every 2 h, for 3 days, and their average values were used for analyses.

2.3.6. Yield

From the end of July to the end of August 2022, wolfberries from each plot were picked every 7 days, dried naturally, and weighed, and their yield per unit area (Y, kg·ha−1) was recorded according to the plot area.

2.3.7. Water and Nitrogen-Use Efficiency [36]

The following formulas were used to calculate water-use efficiency (WUE) and nitrogen-use efficiency (NUE).
(1)
Irrigation WUE (IWUE, kg·ha−1·mm−1)
I W U E = Y / I
(2)
WUE (kg·ha−1·mm−1)
W U E = Y / E T
(3)
Partial factor productivity of nitrogen (PFPN, kg·kg−1)
P F P N = Y / N
where N is the nitrogen application rate (kg·ha−1).
(4)
Agronomic NUE (ANUE, kg·kg−1)
A N U E = ( Y N P K Y P K ) / N
where YNPK is the yield of the dried wolfberry fruit (kg·ha−1) in the plots exposed to nitrogen treatment, and YPK is the yield of dried wolfberry fruit (kg·ha−1) from plots not exposed to nitrogen application.

2.3.8. Qualities

According to “Wolfberry: Appendix B” (18672-2002.2002) [37], 50 g of evenly mixed, dried wolfberry fruit was randomly selected for pretreatment. The total sugar content was determined with reference to the titration method, and the polysaccharide content was determined with reference to the spectrophotometry [37]. The protein content was determined using the spectrophotometry, and the fat content was determined via Soxhlet extraction [38]. The total amount of free amino acids in plant tissues was determined by referring to the ninhydrin solution color method [39].

2.3.9. Economic Benefits

The net income was estimated as the difference between total revenue and total cost, and the input–output ratio was determined as the ratio of total revenue to the total cost, where total income was the product of dried wolfberry fruit production and market price, and the total cost included fertilizer, irrigation, field management, and labor costs (including rotary tillage, water and fertilizer irrigation, pruning branches, weeding, and picking fruits).

2.3.10. TOPSIS Method [40]

We first computed the following matrix Mij
M i j = X i j j = 1 n X i j 2
where Mij represents the normalized matrix of the original data; i = (1, 2, …, m, m = 16) and j = (1, 2, …, n, n = 13).
Then, we calculated the best set M i + , the worst set M i , the distance D i + and D i between different indicators, and the best and worst values according to Mij, M i + , and M i . Finally, we determined the relative proximity Ci from D i + and D i using the following formulas:
D i + = j = 1 n ( M i j M i + ) 2
D i = j = 1 n ( M i j M i ) 2
C i = D i D i + + D i
where M i + is the best advantage set; M i represents the worst set of points; D i + is the weighted distance between the ith treatment and the optimal scheme; D i is the weighted distance between the ith treatment and the worst solution; and Ci is the relative proximity.

2.4. Data Analysis Method

Microsoft Excel 2010 was used for data processing and technique for order performance by similarity to ideal solution (TOPSIS) comprehensive evaluation. Origin 2021 was used for generating graphics, and IBM SPSS Statistics 27 was used for variance analysis and determining the significance of differences (p < 0.05).

3. Results

3.1. Effects of Water and Nitrogen Regulation on the Growth of Wolfberry

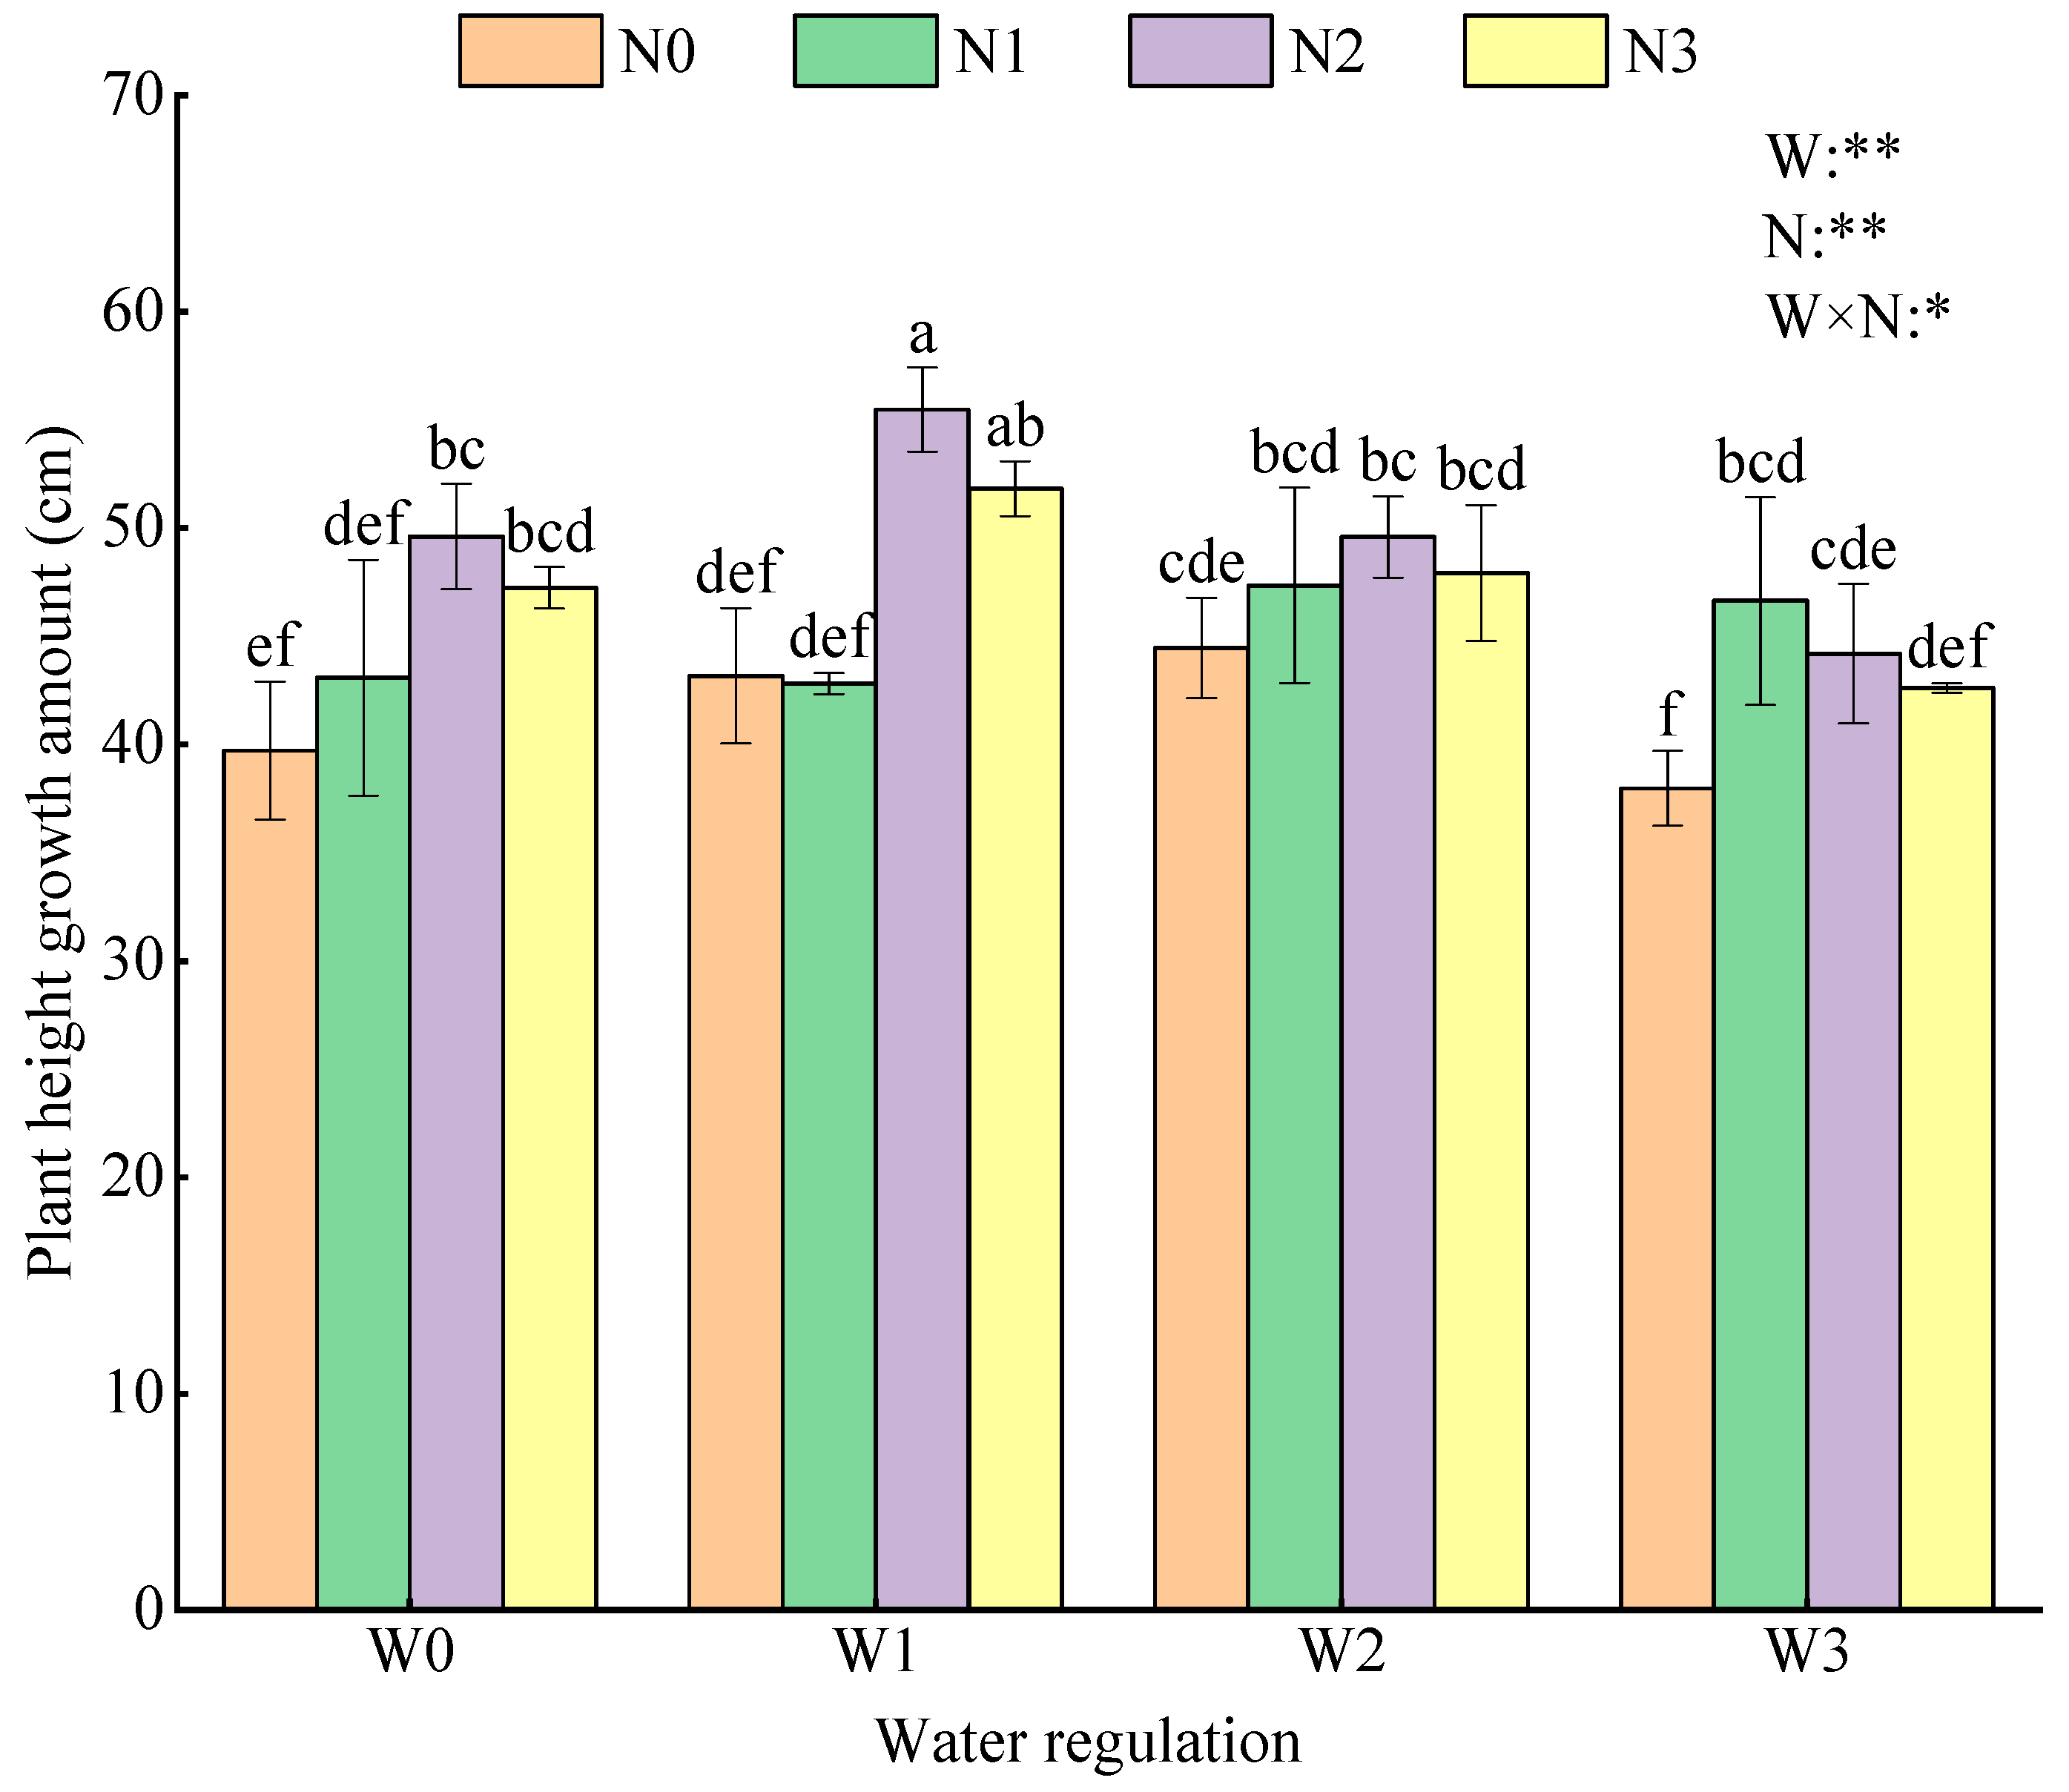
3.1.1. Plant Height Growth Amount

Water regulation, nitrogen application level, and their interaction significantly affected the plant height growth amount (p < 0.05, Figure 2). Under the conditions of W0 and W2, the plant height growth amount first increased and then decreased with increasing nitrogen levels (following the order N2 > N3 > N1 > N0), with a 7.41%, 17.81%, and 13.04% increase in height in plants exposed to the N1, N2, and N3 treatments, respectively, compared to plants exposed to N0. Under the condition of W1, the plant height growth amount first decreased, then increased, and then decreased with increasing nitrogen levels (following the order N2 > N3 > N0 > N1), with a 0.84%, 29.57%, and 21.04% average increase in height in plants exposed to the N0, N2, and N3 treatments, respectively, compared to plants exposed to N1. Under the condition of W3, the plant height growth amount first increased and then decreased with increasing nitrogen levels (following the order N1 > N2 > N3 > N0), with a 22.78%, 16.38%, and 12.22% increase in height in plants exposed to the N1, N2, and N3 treatments, respectively, compared to plants exposed to N0. Similarly, under the same nitrogen application level, plant height first increased and then decreased with an increasing degree of water deficit (following the order W1 > W2 > W0 > W3), with a 4.81%, 12.76%, and 10.45% average increase in height in plants exposed to the W0, W1, and W2 treatments, respectively, compared to plants exposed to W3. The height of wolfberry plants was 55.48 cm under the W1N2 treatment, which was 7.03–46.08% higher than that observed in plants exposed to other treatments.

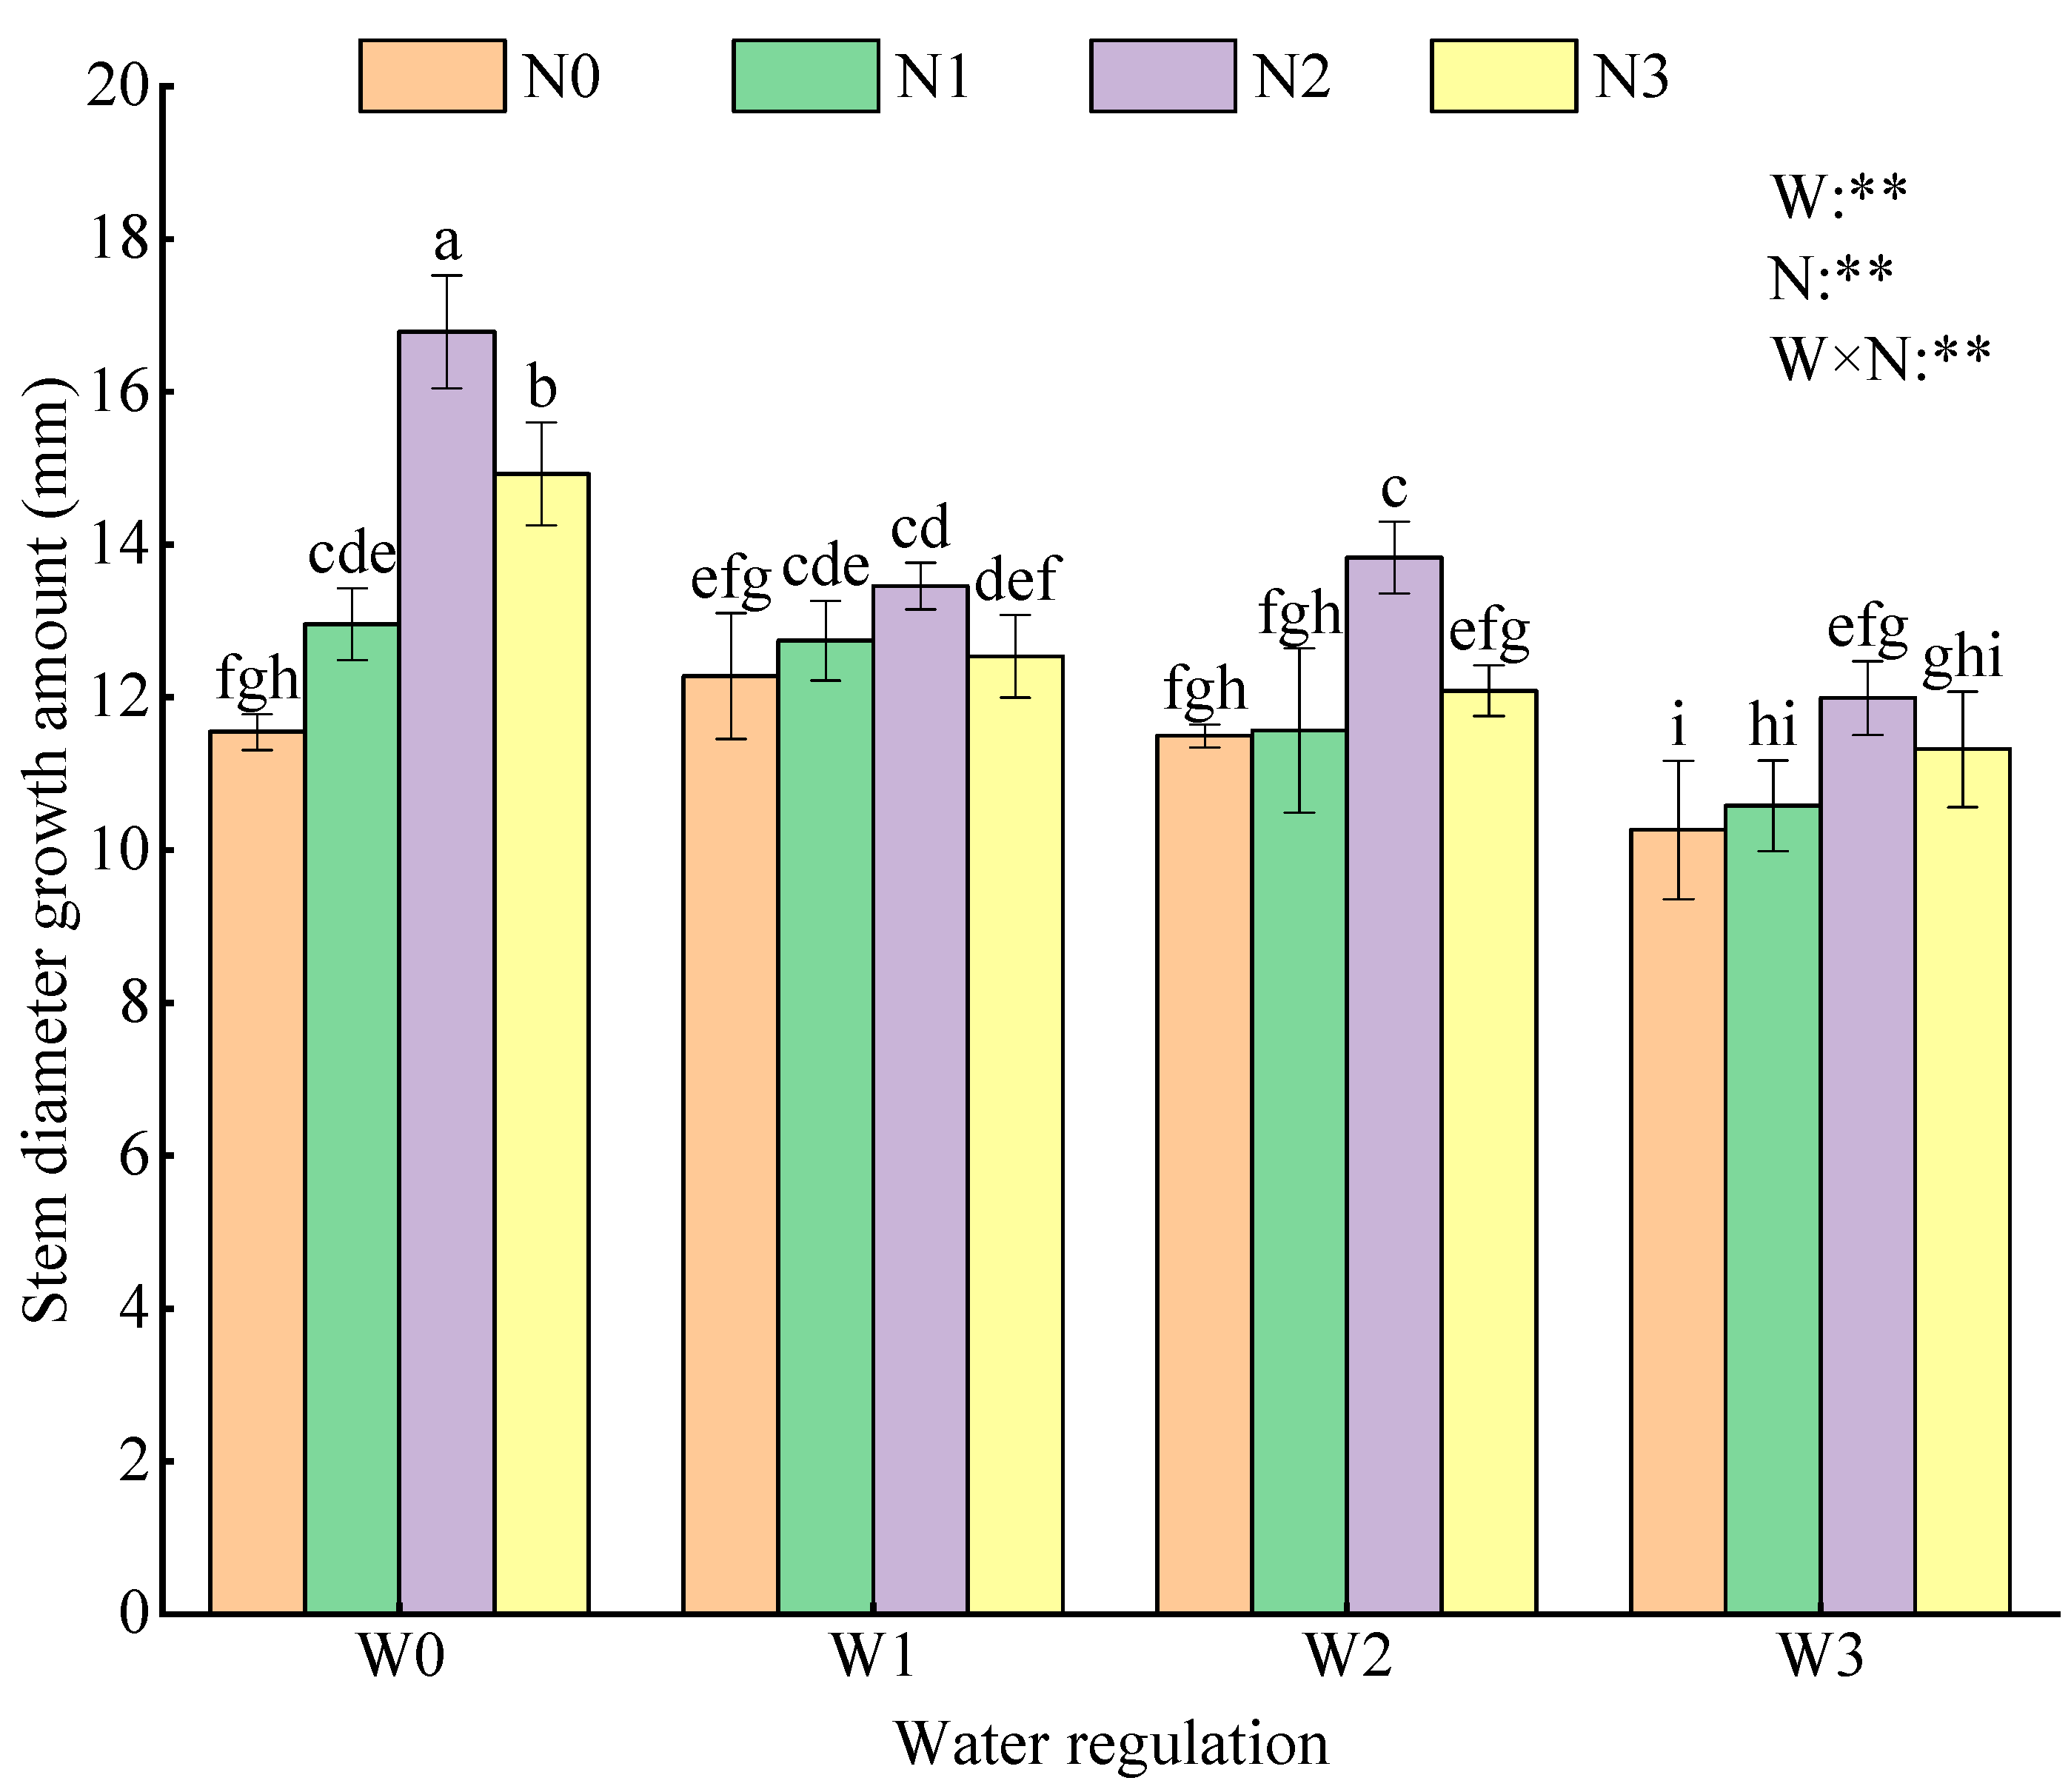
3.1.2. Stem Diameter Growth Amount

Water regulation, nitrogen application level, and their interaction significantly affected the stem diameter growth amount of wolfberry plants (p < 0.01, Figure 3). Under the same water control, the stem diameter growth amount of wolfberry plants showed an increasing trend, followed by a decreasing trend (following the order N2 > N3 > N1 > N0), with a 4.91%, 22.89%, and 11.58% average increase in plants exposed to the N1, N2, and N3 treatments, respectively, compared to the plants exposed to N0. However, under the same nitrogen application level, the stem diameter of wolfberry plants exhibited a decreasing trend with increasing water deficit (following the order W0 > W1 > W2 > W3), with a 27.26%, 15.49%, and 10.87% average increase in diameter in plants exposed to the W0, W1, and W2 treatments, respectively, compared to the plants exposed to W3. The stem diameter growth amount was the highest in plants exposed to the W0N2 treatment (16.79 mm), which was 12.46–63.59% higher compared to plants exposed to other treatments.

3.2. Effects of Water and Nitrogen Regulation on the Physiology of Wolfberry
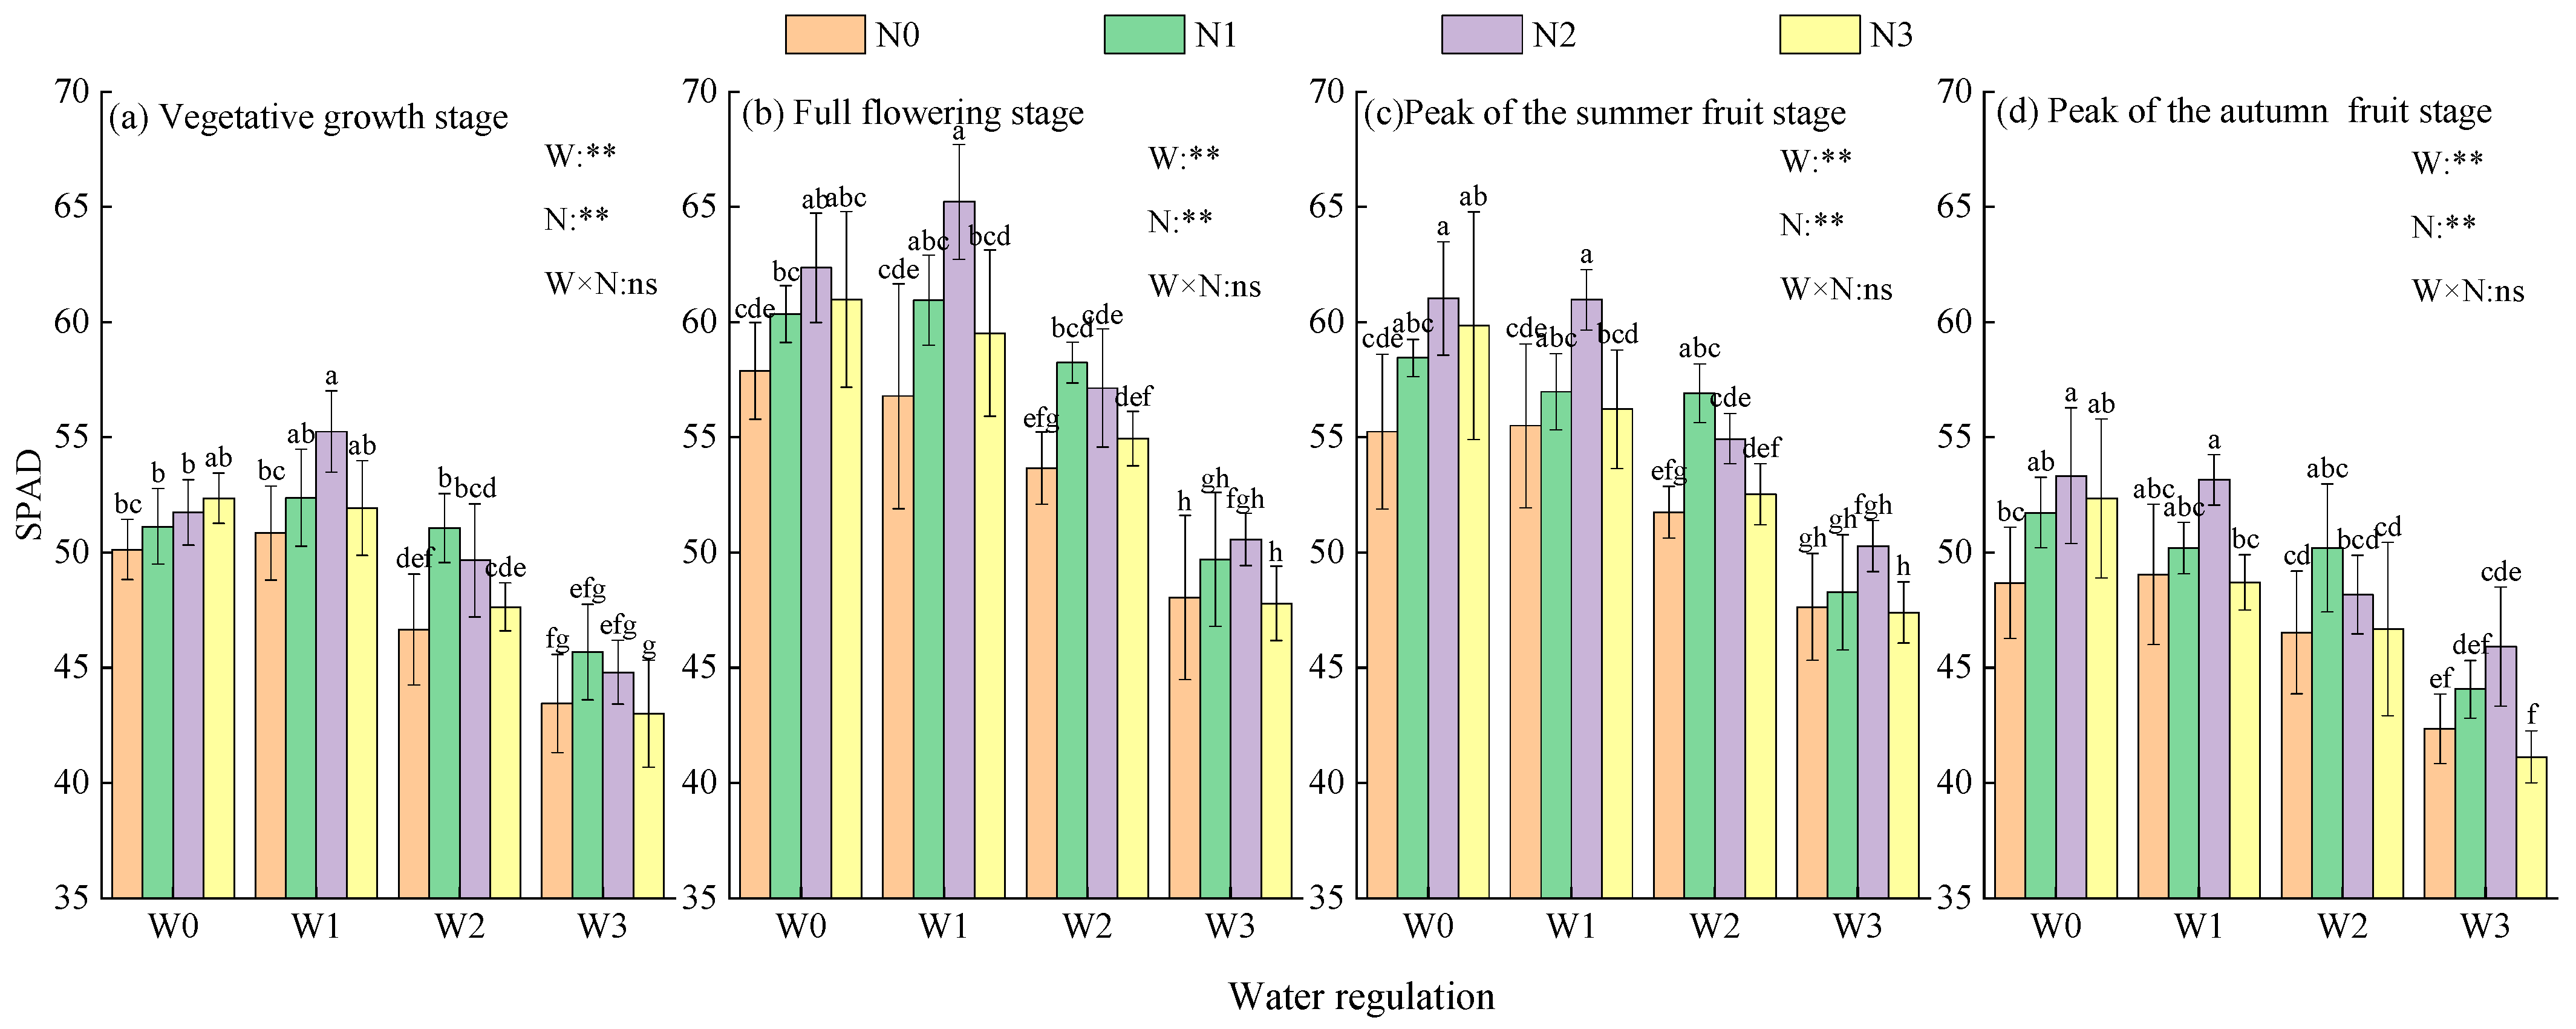
3.2.1. SPAD

Water regulation and nitrogen application levels significantly affected SPAD at different growth stages of wolfberry (p < 0.05, Figure 4). The leaf SPAD of wolfberry first increased and then decreased, following the order full flowering stage > peak of the summer fruit stage > vegetative growth stage > peak of the autumn fruit stage. Under the same water control, with increasing nitrogen application, SPAD values of wolfberry leaves first increased and then decreased. Compared with N0, plants exposed to the N1, N2, and N3 treatments exhibited 4.81–5.95%, 5.03–8.74%, and −2.03–3.18% higher SPAD values, respectively. Under the same nitrogen level, the SPAD value of wolfberry leaves first increased and then decreased with the increase in water deficit, and the SPAD values of leaves exposed to the W0, W1, and W2 treatments increased by 16.07–23.17%, 18.92–23.64%, and 10.24–14.22%, respectively, compared to the leaves exposed to W3.

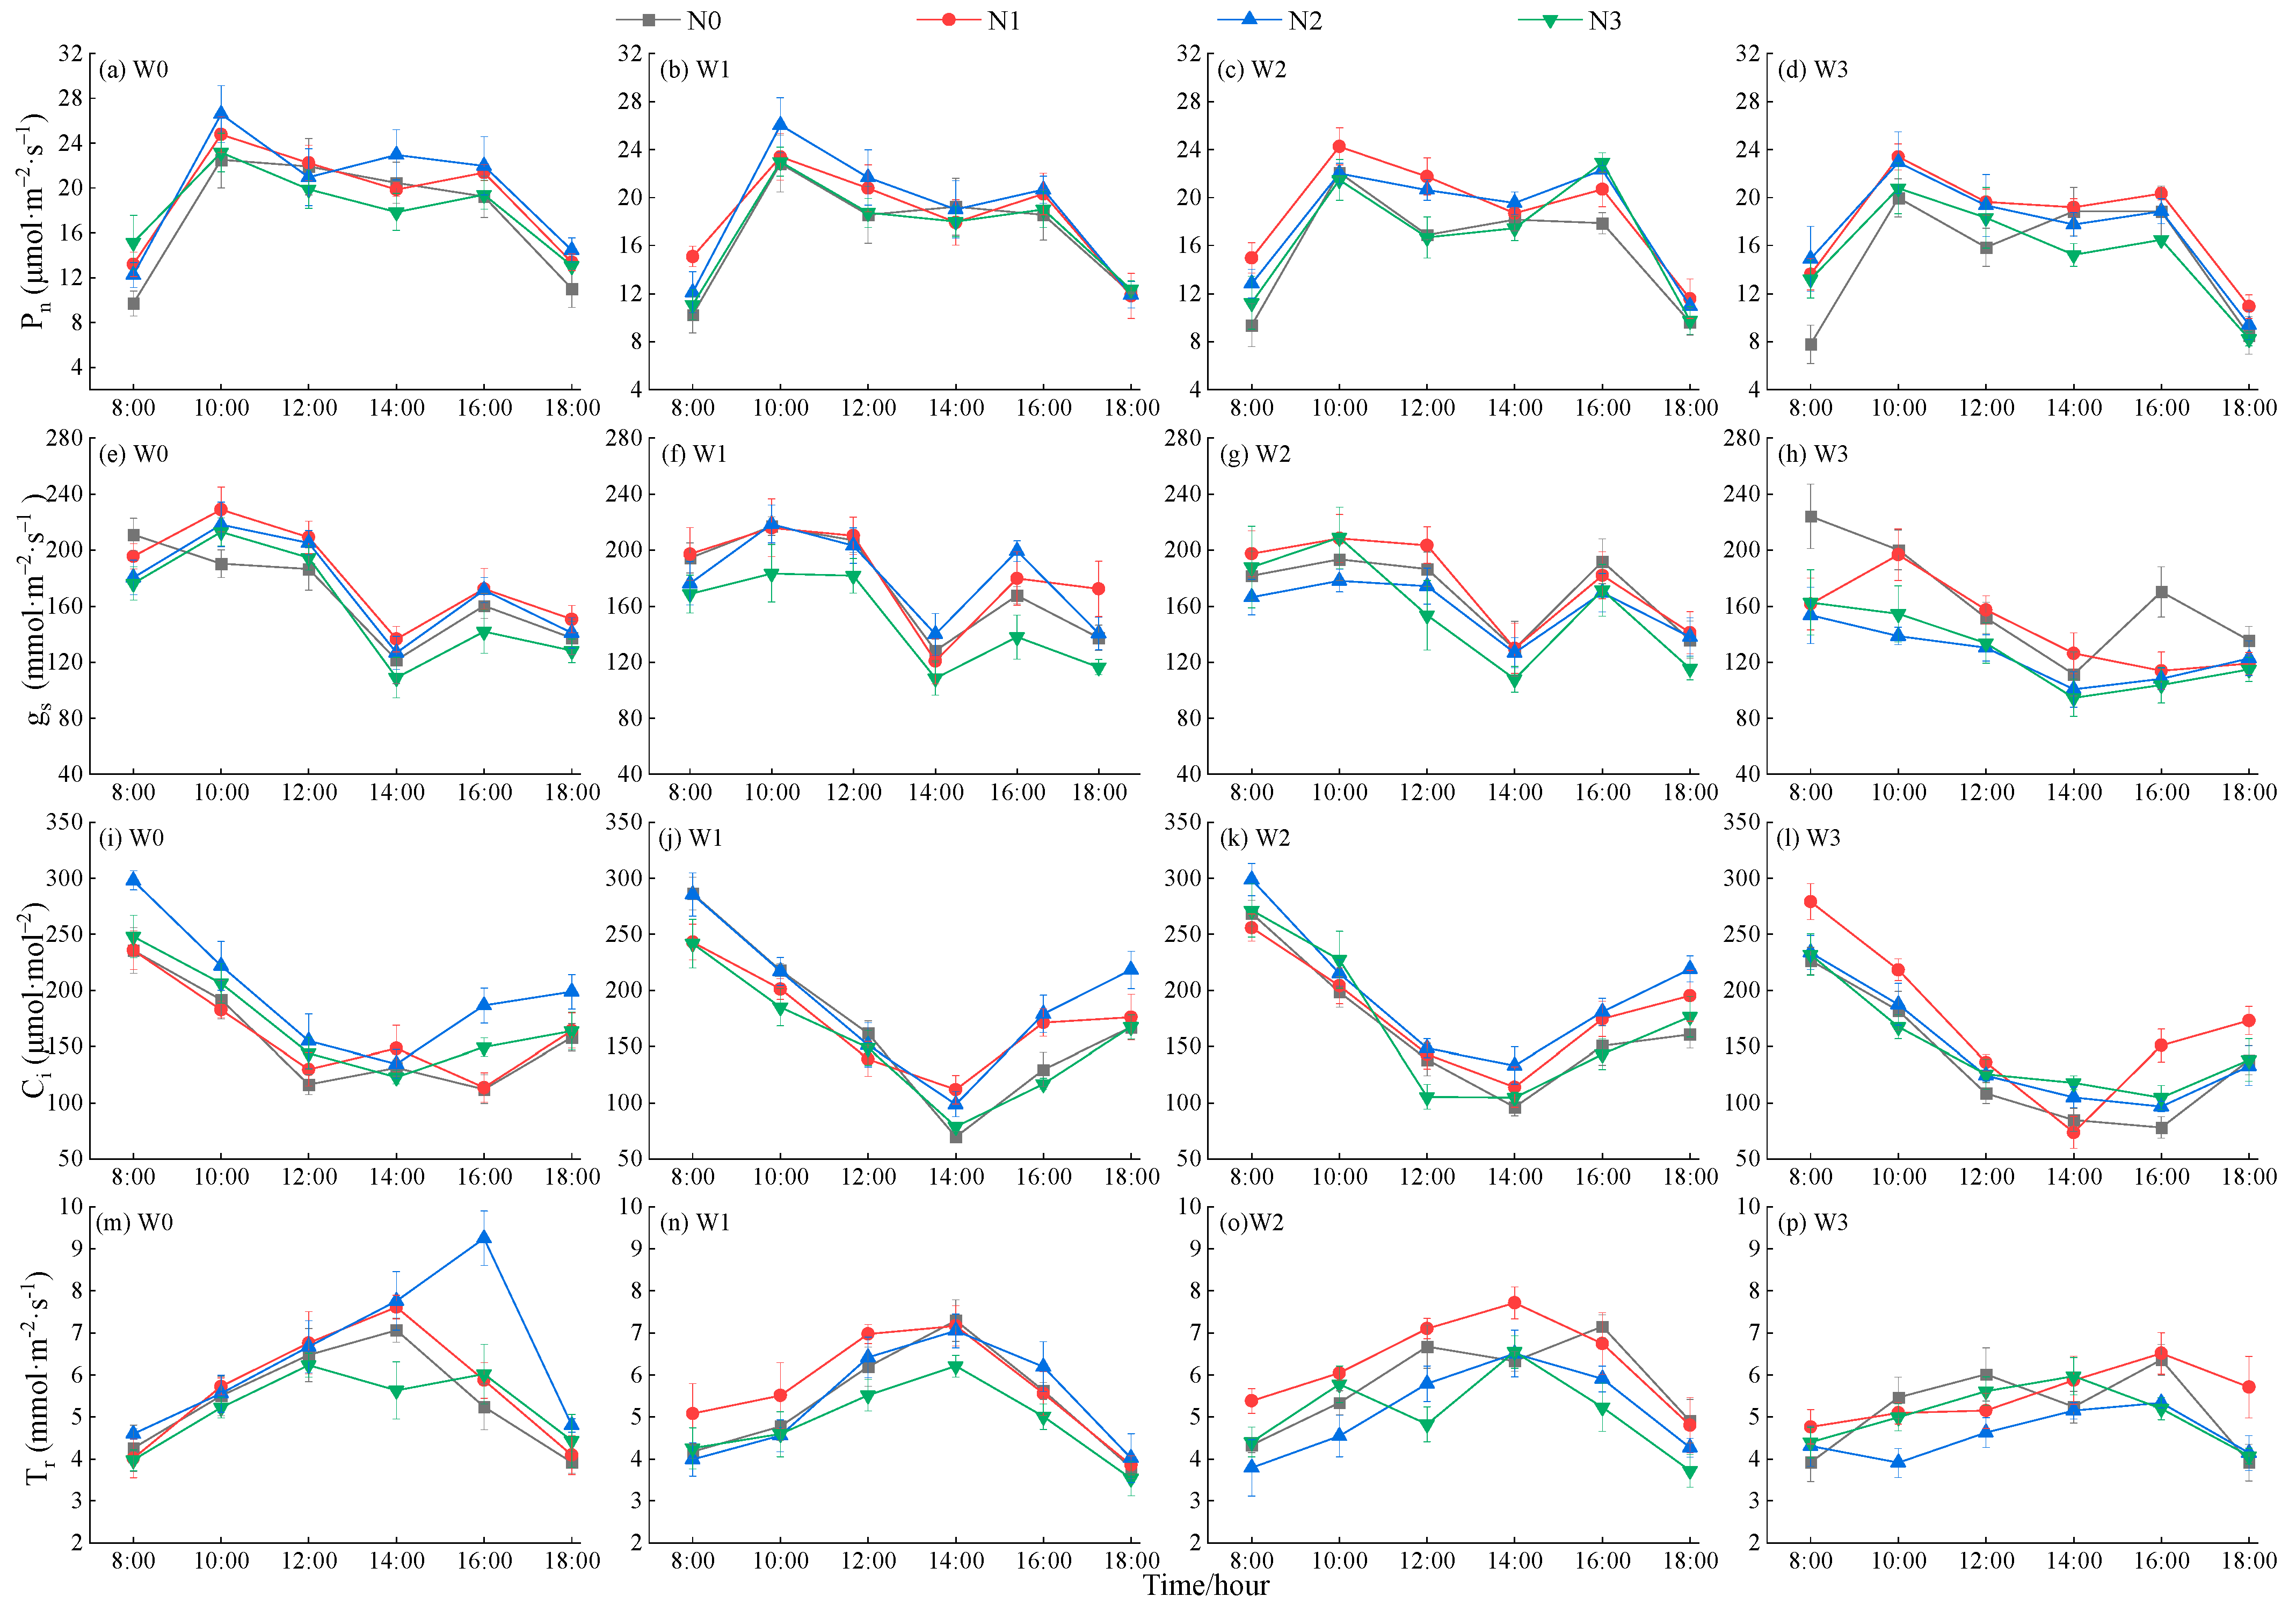
3.2.2. Photosynthetic Characteristics

Water and nitrogen are essential for various life activities in plants, with both directly affecting photosynthesis—the most important metabolic process in plants [41]. The daily variations in photosynthetic indexes of wolfberry plants under different water and nitrogen treatments are shown in Figure 5. The Pn of wolfberry leaves showed an M-shaped trend, and the peak value was recorded at 10:00 and 16:00. In contrast, gs peaked for the first time at 10:00, then decreased, followed by slightly increasing after 14:00, thereafter reaching the second peak at 16:00 and then decreasing again. Additionally, Ci showed a V-shaped trend during the day, and the lowest intraday value was recorded between 12:00 and 16:00. Furthermore, the Tr was both low and high during the day, with the maximum value noted at 12:00 or 14:00. The daily average Pn, gs, and Tr values decreased with the increase in water deficit, whereas the daily average Ci values first increased and then decreased with the increase in water deficit. Under the same water control, the daily average Pn, gs, Tr, and Ci values of wolfberry leaves first increased and then decreased with the increase in nitrogen application. The highest daily average Pn, gs, Ci, and Tr values were obtained for plants exposed to the W0N2 (19.86 μmol·m−2·s−1), W1N1 (182.65 mmol·m−2·s−1), W2N2 (218.86 μmol·mol−1), and W0N2 (6.44 μmol·m−2·s−1) treatments, which were 3.82–29.13%, 0.32–45.47%, 10.00–49.23%, and 2.22–40.61% higher, respectively, compared to other treatments. We also found that the maximum value of Pn at different time points was noted for plants exposed to the W0 treatment, indicating that water deficit inhibited Pn.

3.2.3. Analysis of Driving Factors of Photosynthetic Parameters Regulated by Water and Nitrogen

(1)
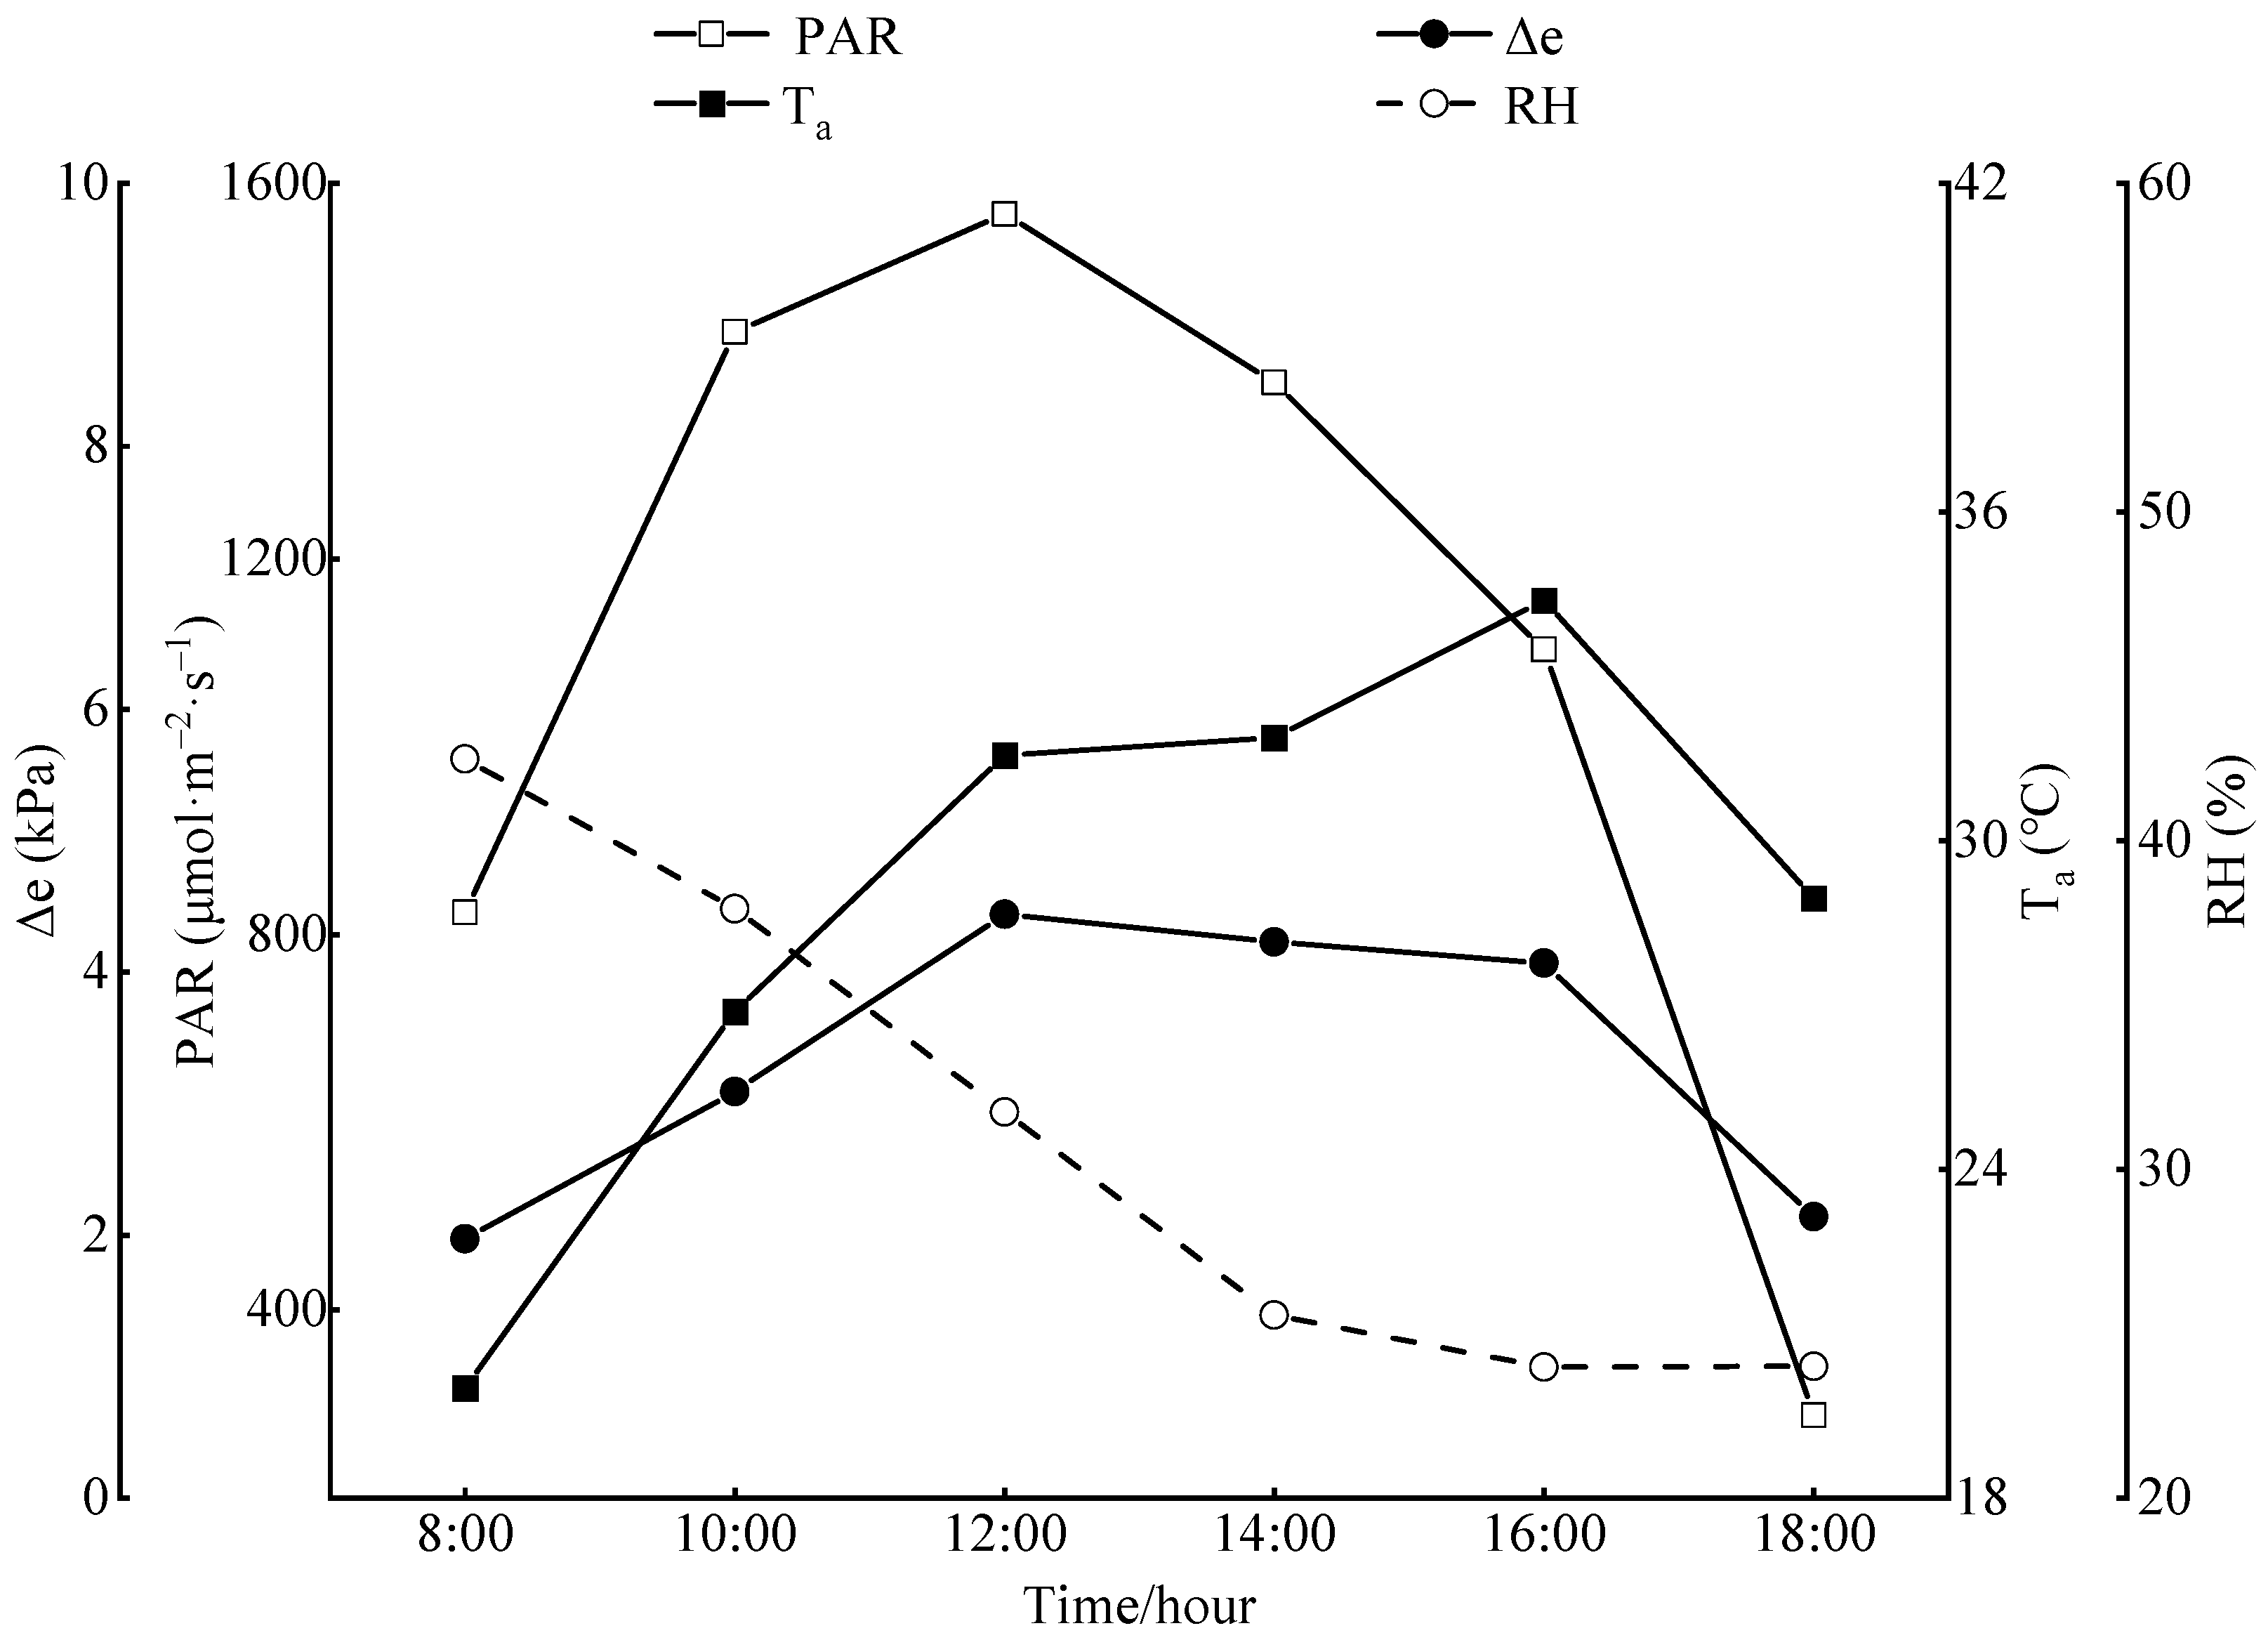
Environmental factors
The daily variation in environmental factors is shown in Figure 6. We noted that PAR, Ta, and Δe showed a unimodal trend, whereby they first increased and then decreased. The peak of PAR and Δe appeared at 12:00, and the daily peak of Ta was recorded at 16:00. The daily mean values of PAR, Δe, and Ta were 1103.69 μmol·m−2·s−1, 3.32 kPa, and 34.39 °C, respectively. The RH decreased within the day, with the maximum value noted at 08:00, which again increased after 16:00, with a daily average of 30.95%.
(2)
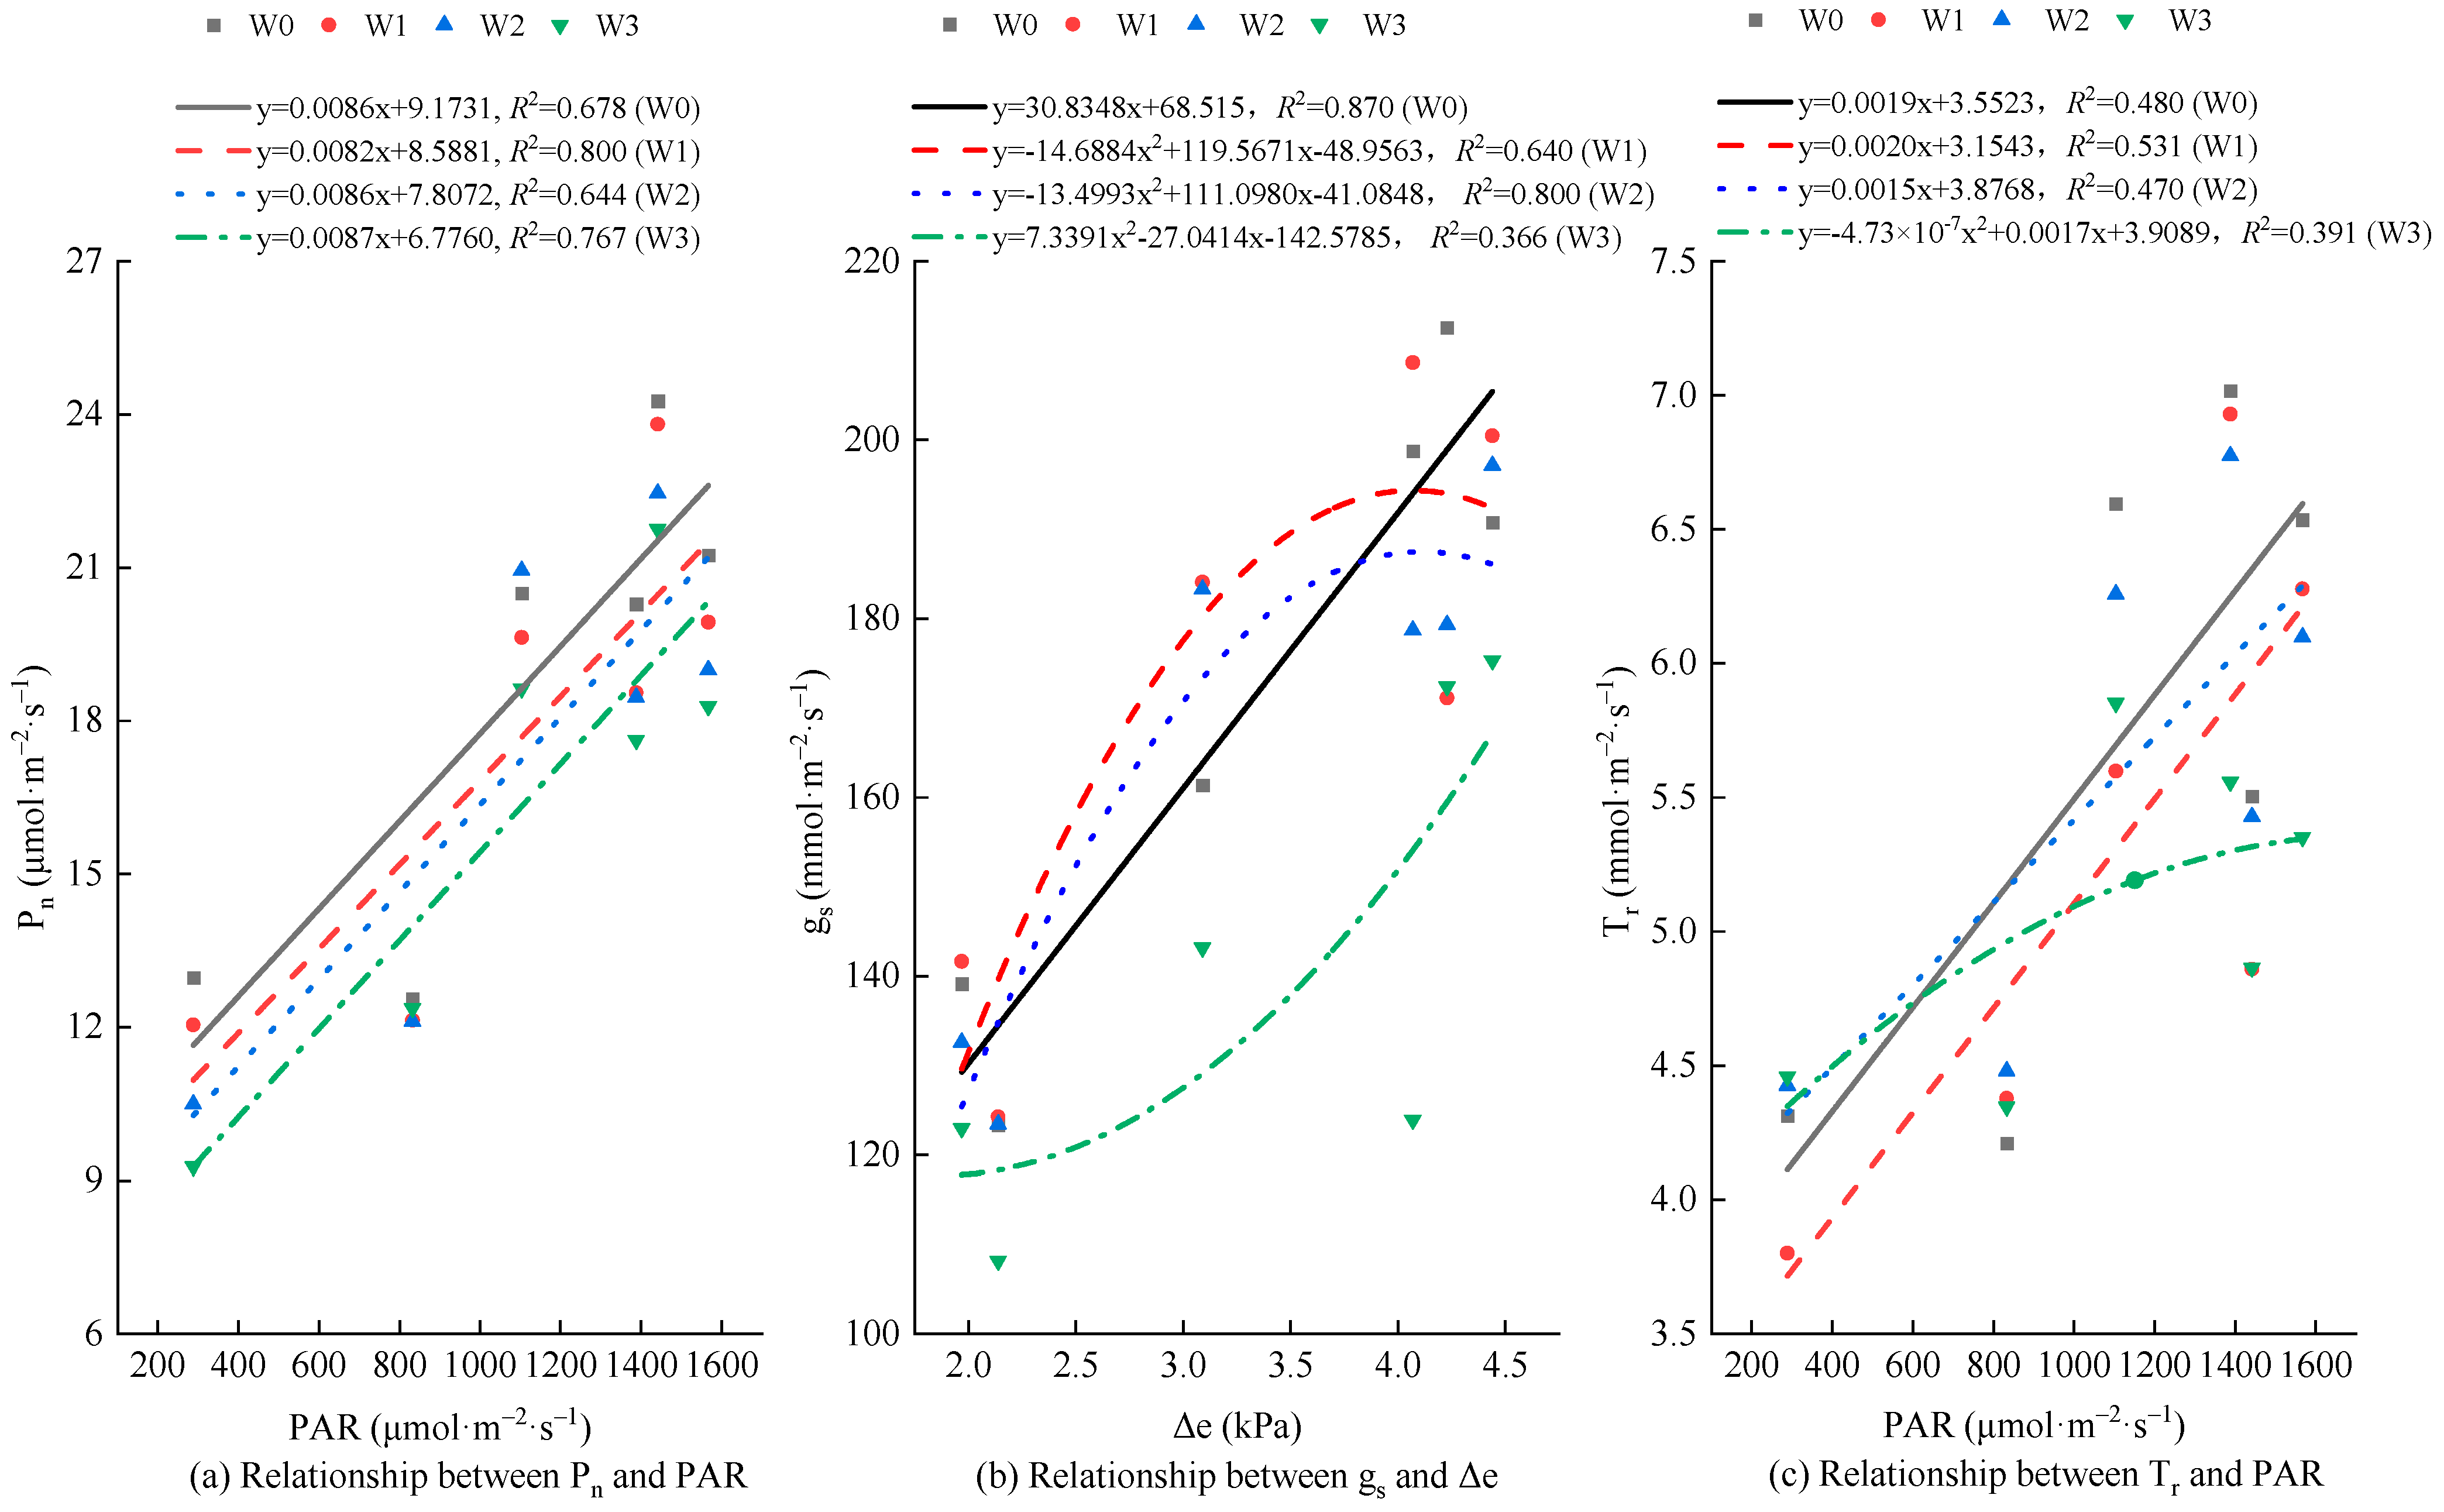
Driving factors analysis
We noted that the Pn of plant leaves was not only affected by physiological factors, such as gs and Ci, but also by the comprehensive influence of environmental factors, such as PAR, Ta, and Δe [42]. Thus, to further analyze the relationship between photosynthetic parameters and various environmental factors under different water treatment conditions, a common linear model was used to fit Pn-PAR, gs-Δe (W0), and Tr-PAR (W0, W1, and W2), and a common parabola model was used to fit the relationship between gs–Δe (W1, W2, and W3), and Tr-PAR (W3) (Figure 7). Under different water control treatments, Pn showed an increasing trend with an increase in PAR (R2: 0.644–0.800). The correlation between Pn and PAR was the strongest for plants exposed to the W1 treatment. Tr-PAR (R2: 0.391–0.625) and gs-Δe (R2: 0.366–0.828) also displayed adequate correlations. Moreover, the goodness-of-fit for Tr-PAR was the best for plants exposed to the W1 treatment. However, the goodness-of-fit for gs-Δe was the best for the plants exposed to the W0 treatment. The goodness-of-fit for Tr-PAR and gs-Δe were the weakest for plants exposed to the W3 treatment; this was related to the excess water deficit via the W3 treatment.

3.3. Effects of Water and Nitrogen Regulation on Wolfberry Production

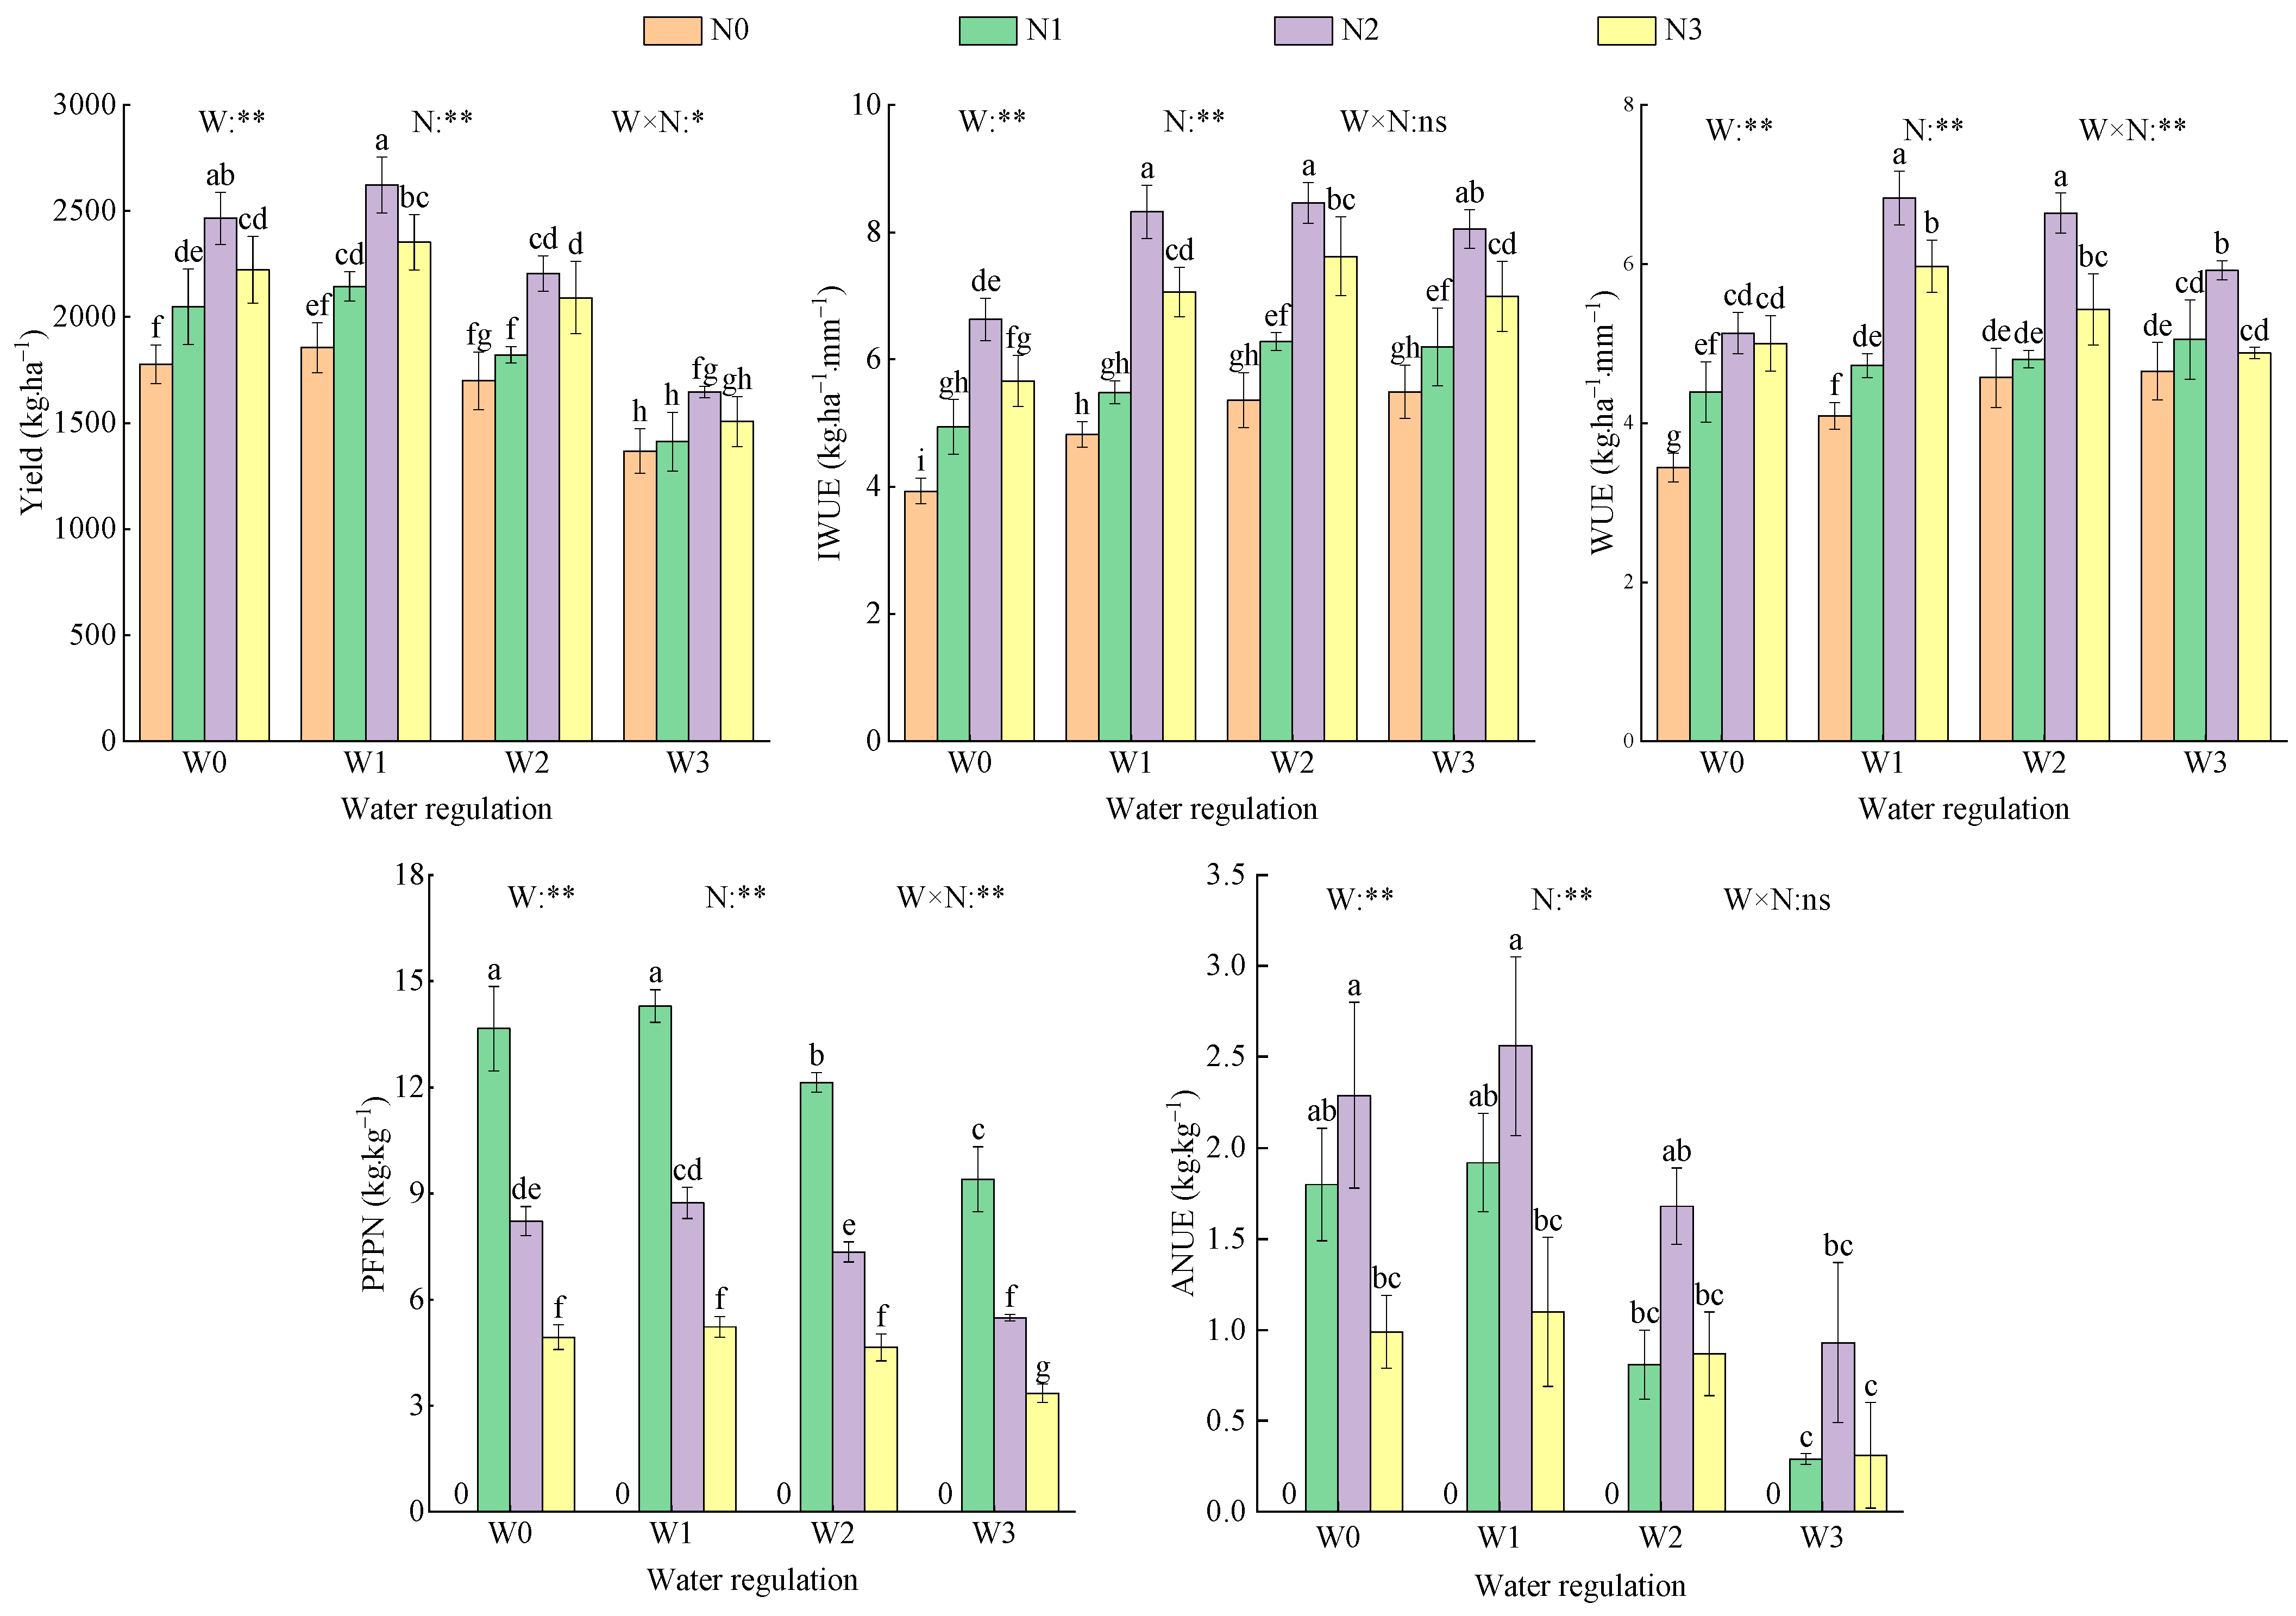
3.3.1. Yield, Water, and Nitrogen-Use Efficiency

Water regulation and nitrogen application levels significantly affected the yield, WUE, and NUE of wolfberry plants (p < 0.01), and their interaction significantly affected yield, WUE, and PFPN (p < 0.05, Figure 8). Under the same water control, the yield, IWUE, WUE, and ANUE first increased and then decreased with the increase in nitrogen application (following the order N2 > N3 > N1 > N0), whereas PFPN decreased with the increase in nitrogen levels. Under the same nitrogen application level, the yield, PFPN, and ANUE first increased and then decreased with the increase in water deficit (following the order W1 > W0 > W2 > W3). Under the N0 and N1 treatments, IWUE and WUE increased with the increase in water deficit and first increased and then decreased with the increase in water deficit in plants under the N2 and N3 treatments. Additionally, the yield, IWUE, WUE, PFPN, and ANUE of wolfberry plants reached the maximum values in plants exposed to the W1N2 (2623.09 kg·ha−1), W2N2 (8.46 kg·hm−2·mm−1), W1N2 (6.83 kg·hm−2·mm−1), W1N1 (14.29 kg·kg−1), and W1N2 (2.56 kg·kg−1) treatments, respectively, which were increased by 6.36–91.72%, 1.68–115.27%, 2.86–98.55%, 4.69–326.57%, and 11.79–782.76%, respectively, compared to plants exposed to other treatments.

3.3.2. Qualities

Water regulation significantly affected the contents of total sugar, polysaccharides, amino acids, proteins, and fats (p < 0.05). In contrast, nitrogen application levels significantly affected the contents of total sugar, polysaccharides, and proteins (p < 0.01), and their interaction significantly affected the contents of polysaccharides and proteins (Table 1). With the increase in nitrogen application, the contents of total sugar, polysaccharides, proteins, and fats first increased and then decreased; the contents of amino acids first increased and then decreased in plants exposed to the W0 and W3 treatments; and increased in plants exposed to the W1 and W2 treatments. However, with the increase in water deficit, the contents of total sugar, polysaccharides, amino acids, proteins, and fats first increased and then decreased, and protein content showed a decreasing trend. The contents of total sugar, polysaccharides, and fats in plants under the W1N2 treatment were the maximum, which was 52.63 g·100 g−1, 5.74 g·100 g−1, and 2.13 g·100 g−1, respectively, and increased by 3.32–16.93%, 7.49–54.72%, and 6.5–45.89% compared to those in plants exposed to other treatments, respectively. The maximum amino acid content in plants under the W2N3 treatment was 10.09%, which was 11.12–86.16% higher than that of plants exposed to other treatments. The maximum protein content in plants under the W0N2 treatment was 13.94 g·100 g−1, which was 7.15–71.67% higher than that of plants exposed to other treatments. The qualities of wolfberry were improved when mild water deficit was combined with medium nitrogen application, and the contents of total sugar, polysaccharides, and fats were significantly increased.

3.3.3. Economic Benefits

Water regulation, nitrogen application levels, and their interaction significantly affected wolfberry yield and economic benefits (p < 0.05, Table 2). We noted that the overall performance of net income and input–output ratio among different water regulations followed the order W1 > W0 > W2 > W3. Compared with W3, the net income of W0, W1, and W2 increased by 67.26%, 80.06%, and 49.70%, respectively, and the input–output ratio increased by 39.41%, 47.96%, and 30.48%, respectively. Under the conditions of W0, W1, and W2, the net income and input–output ratio first increased and then decreased with the increase in nitrogen application (following the order N2 > N3 > N1 > N0). Compared with N0, the net return of N1, N2, and N3 averagely increased by 17.34%, 51.35%, and 33.11%, respectively, and the input–output ratio increased by 10.43%, 31.90%, and 17.18%, respectively. However, under the condition of W3, the net income and input–output ratio increased with the increase in nitrogen application (following the order N3 > N2 > N1 > N0). Compared with N0, the net return of N1, N2, and N3 averagely increased by 3.65%, 13.95%, and 28.57%, respectively, and the input–output ratio increased by 0.78%, 5.45%, and 11.67%, respectively. The net benefit and the ratio of output to the investment of the W1N2 treatment reached the maximum values of 7.41 × 10⁴ CNY·ha−1 and CNY 4.64, respectively.

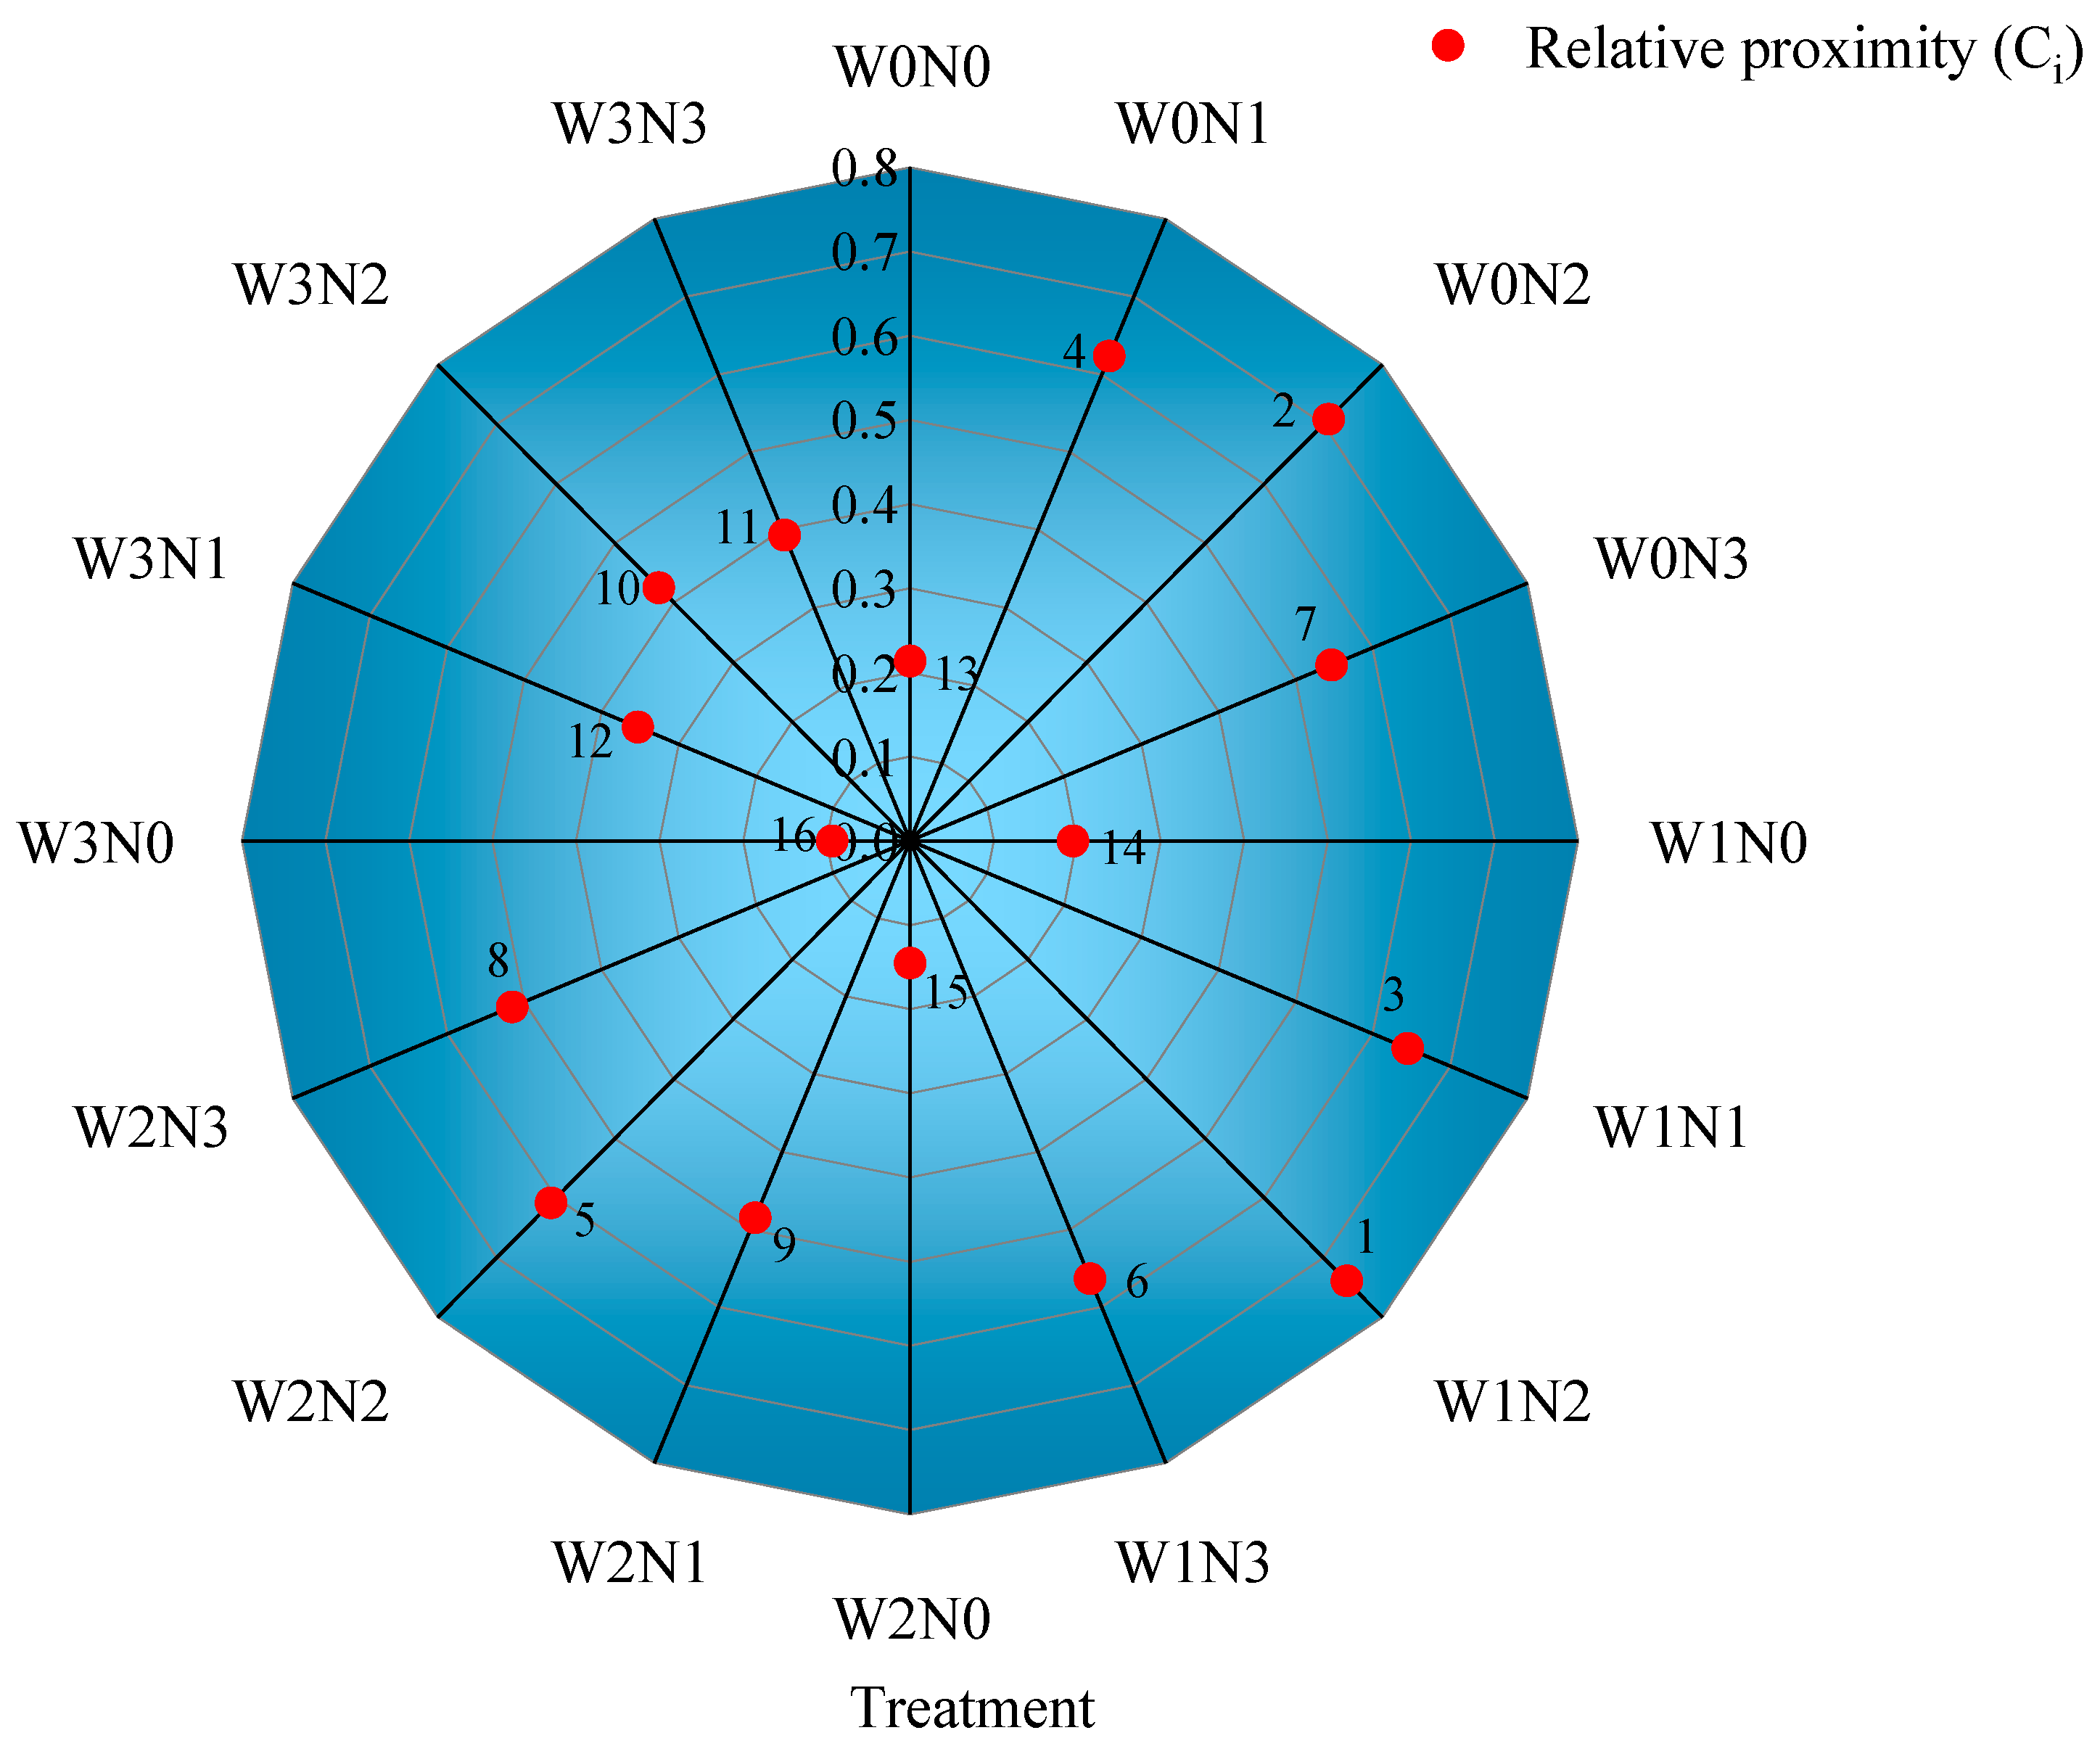
3.4. Comprehensive Evaluation of Water and Nitrogen Regulation of Wolfberry

The matrix of Mij was obtained using the dimensionless calculation of Equation (6) for the selected 13 evaluation indicators (Table 3). According to Figure 9, among all treatments, W1N2 ranked first, W0N2 ranked second, and W3N0 ranked last. In other words, wolfberry’s yield, quality, water and nitrogen-use efficiency, and economic benefits were better when mild water deficit W1 (65–75% θf) combined with medium nitrogen application rate N2 (300 kg·hm−2).

4. Discussion

4.1. Effects of Water and Nitrogen Regulation on the Growth and Physiology of Wolfberry

Plant height and stem diameter not only reflect the growth rate and potential of plants but are also basic indicators of their health status [43]. Under the same nitrogen application level, the plant height and stem diameter growth amount of wolfberry increased in the order W1 > W2 > W0 > W3 and W0 > W1 > W2 > W3, respectively. These findings are similar to those of Song et al. [44], who conducted a study in Qinghai, China, and Ma et al. [45], who conducted a study in Ningxia, China, on wolfberry, both indicating that appropriate water deficit and reduced nitrogen application are conducive to stress resistance, and too little or too much water and nitrogen inputs are not conducive to crop growth [46]. Similar to the findings of Zhang et al. [47], who conducted research on spinach in Shanghai, China, and Yang et al. [48], who conducted studies on potatoes in Ningxia, China, this study also concluded that the interaction of water regulation and nitrogen application levels significantly affected plant height and stem diameter growth amount in wolfberry. This was mainly because an adequate water and nitrogen ratio can provide a suitable moisture and nutrient-rich environment for crop growth and development [49,50].
The photosynthetic capacity of leaves is an important reflection of the strength of plant photosynthesis and directly determines the level of plant productivity [51]. Water and nitrogen affect photosynthesis through various factors, such as leaf pigments and SPAD values [52]. In this study, the SPAD value of leaves first showed an increasing and then a decreasing trend throughout the growth period, which was manifested in the following order: full flowering stage > peak of the summer fruit stage > vegetative growth stage > peak of the autumn fruit stage. This could be attributed to high temperatures and sufficient light exposure to plants in the blooming and summer fruit periods conducive to synthesizing chlorophylls. In Xinjiang, China, Ma et al. [53] reported that increasing irrigation amount enhanced Pn, Tr, and gs in cotton plants while decreasing Ci. Furthermore, at the same irrigation amount, Pn, Tr, and gs in cotton plants first increased and then decreased with an increase in nitrogen application. However, under the same irrigation amount, Ci exhibited an opposite trend, which was consistent with the results of the present study. This is because moderate and high irrigation amounts increased SPAD values, thereby improving crop photosynthetic capacity and enhancing crop Pn, Tr, and gs [54]. Nonetheless, under a reduced irrigation amount, insufficient water supply destroys chlorophyll structure, resulting in pigment decomposition, reduction in SPAD values, decline in carbon dioxide solubility in mesophyll cells, and thus, a decrease in the photosynthetic rate of crops [55]. However, high nitrogen levels forced the accumulation of nitrate salts in the soil, thus reducing the absorption capacity of roots, causing premature aging of leaves, blocking carbon dioxide in green leaves, and weakening the photosynthetic rate [56]. In this study, we found that the daily variation trend in leaf Pn was M-shaped, and the peak value was recorded at 12:00 and 16:00. Zheng et al. [57] also derived a similar conclusion through their study on wine grapes that was attributed to the phenomenon of “photosynthetic siesta” between 12:00 and 15:00 and the closure of plant stomata at noon owing to high temperatures and light intensity, to reduce water evaporation and thus the rate of photosynthesis. In addition, this study concluded that the intraday gs peaked for the first time at 10:00, then showed a declining trend, followed by a small upward trend after 14:00 that reached the second peak at 16:00 before exhibiting a downward trend again. This was due to the “self-protection” feature of leaves that prevents excessive loss of water. Nonetheless, Ci presented a V-shaped trend, with a decreasing trend from 08:00–12:00, and the lowest intraday values were noted between 12:00 and 14:00. This was primarily due to the increase in Pn between 08:00 and 12:00, which consumed a lot of carbon dioxide, and the closure of stomata between 12:00 and 14:00, which restricted the entry of carbon dioxide into the cells. Moreover, Tr tended to be both low and high during the day, with the maximum values noted at 12:00 or 14:00. This could be because of the low saturated water vapor pressure difference between 12:00 and 14:00, sufficient solar radiation, and high gs.

4.2. Effects of Water and Nitrogen Regulation on Yield and Economic Benefits of Wolfberry

Appropriate water and nitrogen regulation is the key to ensuring high crop yield, as rational allocation of water and nitrogen inputs at different growth stages of crops is conducive to promoting the absorption of nutrients and water [58,59]. In this study, we revealed that the yield and economic benefits of wolfberry first increased and then decreased with the increase in nitrogen levels and irrigation amount, which was similar to the findings of Fu et al. [60], who conducted a study on grapes in northeast China and found that the yield increased with the increase in water and nitrogen inputs when the irrigation amount was 224–358 mm and nitrogen level was 130–162.5 kg·ha−1. Afterward, the yield decreased with an increase in water and nitrogen inputs. Along similar lines, Zhang et al. [61] studied corn in the West Liaohe Plain of China and found that the yield and economic benefits of maize first increased and then decreased with the increase in irrigation amount and nitrogen levels. This could be because an appropriate water and nutrient environment is conducive to maintaining adequate moisture in the soil, enhancing the dissolution and ion exchange capacity of soil nitrogen, improving the root activity of plants, thereby increasing the synthesis of enzymes such as transketolase and carbonic anhydrase, accelerating gs and Pn, improving the accumulation capacity of dry matter, and finally obtaining a higher yield [62]. However, Liu et al. [63], who conducted a study in the Qaidam Basin of China, found that the yield and economic benefits of wolfberry first increased and then decreased with the decrease in irrigation amount and gradually decreased with a decrease in nitrogen levels; these findings are different from those of the present study. This could be attributed to the following two aspects. First, there were differences in the amount of nitrogen applied; in this study, the nitrogen application rate was 0–450 kg·ha−1, whereas, in the case of Liu et al., the rate was 207–345 kg·ha−1; and the lower nitrogen application rate may not have reached the nitrogen requirement threshold of wolfberry. Second, the primary nutrient status of the experimental sites was different; in this study, the nitrogen content was 1.62 g·kg−1, whereas the nitrogen content of the site studied by Liu et al. was 0.36 g·kg−1. Lower soil nitrogen content may lead to increased dependence on the intake of exogenous nitrogen for the growth of wolfberry, thus increasing the nitrogen threshold for the growth of wolfberry.

4.3. Effects of Water and Nitrogen Regulation on Water and Nitrogen-Use Efficiency of Wolfberry

WUE and NUE can directly reflect the response of crops to water and nitrogen inputs [64]. Insufficient nitrogen application through irrigation water leads to a decline in stress resistance and weakens the absorption and utilization of nitrogen by plants. In contrast, excessive nitrogen application through irrigation water results in reduced oxygen levels in the soil and the obstruction of root respiration, which is not conducive to improving WUE and NUE [65,66]. In the irrigation area of the Yellow River in Gansu Province, China, Zhao et al. [67] found that the WUE of wolfberry first increased and then decreased with the increase in water deficit, whereas Li et al. [68] found that WUE of wolfberry was the highest under moderate water deficit, which was consistent with the results of this study. This was mainly because excessive irrigation results in water accumulation in the soil, causing leakage and nutrient loss. However, inadequate irrigation leads to reduced nutrient uptake, limiting the expansion of plant cells, weakening photosynthesis, and reducing dry matter accumulation [69]. Similar to the findings of Li et al. [70] on tomatoes in Xinjiang, China, and Gao et al. [71] on corn in the irrigation area of Northern Henan, China, the present study also found that IWUE and WUE reached their maxima in plants exposed to the W2N2 and W1N2 treatments, respectively. This was because IWUE is the ratio of yield and irrigation water, and WUE is the ratio of yield and water consumption. The yield of wolfberry was higher when mild and moderate water deficit was combined with nitrogen application because, with a relatively low irrigation water amount and consumption, IWUE and WUE were increased. In addition, this study showed that the PFPN of wolfberry plants decreased with the increase in nitrogen levels and similar conclusions were obtained by Abdalhi et al. [72] for corn and cucumber in Jiangsu, China, and Hao et al. [73] for apple in Loess Plateau, China. This was mainly because PFPN is the ratio between yield and nitrogen application, and when the yield increase is lower than the increase in nitrogen levels, PFPN shows a decreasing trend. Consistent with the findings of Jiang et al. [74] on winter wheat in Henan Province, China, this study found that ANUE was the highest under mild water deficit and moderate nitrogen levels because the effects of nitrogen fertilizers depend on soil water conditions. Appropriate water and nitrogen stress can improve drought resistance and the water and fertilizer absorption capacity of plants [24], resulting in higher yield and ANUE when the irrigation amount and nitrogen levels are reduced.

4.4. Effects of Water and Nitrogen Regulation on Qualities of Wolfberry

The effects of water and nitrogen on crop nutrient quality are closely related to the amount of irrigation and nitrogen application. In Shaanxi, China, Lu et al. [75] found that moderate nitrogen levels increased soluble protein content in pepper. In Gansu, China, Song et al. [76] noted that under the same water conditions, starch and protein contents of potato tuber gradually increased with the increase in nitrogen application, but the quality of potato decreased when nitrogen application was extremely high. This was consistent with the results of the present study, which indicated an increase and then a decrease in protein and amino acid contents in wolfberry plants with an increase in nitrogen levels. This may be because appropriate nitrogen application can improve soil microbial activity, significantly increase the quality of underground plant parts, contribute to root growth, increase water absorption, and promote the absorption and transformation of nutrients by crop roots [77]. This study also showed that with the increase in irrigation amount, the content of total sugar and polysaccharides in wolfberry first increased and then decreased. This trend was similar to the one suggested by Ma et al. [78] in the central arid region of Ningxia, China, which suggested that the polysaccharide content in wolfberry was the highest when plants were irrigated with 225 m3·ha−1 of water, and the study conducted by Li et al. [79] in Beijing, China, which indicated that the content of total soluble sugar in cherries irrigated with a moderate amount of water significantly increased when treated with low water and high water levels. This indicated that too much or too little irrigation reduces total sugar and polysaccharide contents in fruits. Moreover, appropriate water stress adjusts the ratio of plant photosynthetic products between vegetative organs and reproductive organs, promotes the movement of photosynthetic products to reproductive organs, and creates conditions conducive to sugar accumulation [80]. In addition, this study reported that with the increase in nitrogen application levels and irrigation amount, the fat content in wolfberry leaves first showed an increasing and then a decreasing trend, primarily because excessive or insufficient nitrogen application through irrigation would inhibit photosynthetic capacity and cause more serious oxidative damage, which would not be conducive to the synthesis of free fatty acids, and ultimately reduce the fat content in leaves. This study showed that the qualities of wolfberry were improved when mild water deficit combined with a medium nitrogen application rate, and the contents of total sugar, protein, and fat were increased most significantly, which was mainly because the appropriate input of water and nitrogen would fully mobilize the absorption and adjustment ability of the plant, and effectively play the interaction effect of water and nitrogen, thereby improving the qualities [81].

5. Conclusions

Appropriate water and nitrogen application can improve the plant height, stem diameter, and SPAD of wolfberry. The average of Pn, gs, Ci, and Tr reached the highest in W0N2 (19.86 μmmol·m−2·s−1), W1N1 (182.65 mmol·m−2·s−1), W2N2 (218.86 μmol·mol−1), and W0N2 (6.44 mmol·m−2·s−1) treatment, respectively. The diurnal variation of leaf photosynthetic parameters (Pn, gs, and Tr) showed a good correlation with PAR and Δe. Water regulation, nitrogen application level, and their interaction significantly affected the yield, WUE, PFPN, net income, and input–output ratio of wolfberry. The total sugar, polysaccharide, fat, amino acid, and protein content was highest in the W1N2, W1N2, W1N2, W2N3, and W0N2 treatments. Then, the rest of the processing was increased by 3.32–16.93%, 7.49–54.72%, 6.5–45.89%, 11.12–86.16%, and 7.15–71.67%. The TOPSIS method showed that the yield, qualities, WUE, NUE, and economic benefits of wolfberry with mild water deficit W1 (65–75%θf) combined with medium nitrogen application N2 (300 kg·ha−1) were better, which was a suitable water and nitrogen control model for the production of wolfberry in the irrigation area of the Yellow River in Gansu Province and similar climate areas.

Author Contributions

Conceptualization, investigation, formal analysis, writing—review and editing, Y.G., J.W., Y.M., M.Y. and Q.J.; writing—original draft, Y.G., J.W., Y.M. and R.T.; funding acquisition, supervision, M.Y., G.Q., Y.K. and C.W.; project administration, Y.J. and H.L. All authors have read and agreed to the published version of the manuscript.

Funding

This study was funded by the National Natural Science Foundation Project, China (Grant Nos. 52069001 and 51969003); the Industrial Support Project of the Gansu Provincial Department of Education, China (Grant No. 2021CYZC-20); the Key Research and Development Project of Gansu Province (Grant No. 22YF7NA110); the Innovation Fund Project of higher Education in Gansu Province (2023A-054); the Lanzhou Science and Technology Project (Grant No. 2022-2-60); the Discipline Team Construction Project of Gansu Agricultural University; the Gansu Agricultural University Youth Mentor Support Fund Project (Grant Nos. GAU-QDFC-2023-12 and GAU-QDFC-2022-22); the “High-efficient Utilization and Innovation of Water and Soil Resources of Characteristic Crops in Northwest China” of Gansu Agricultural University (Grant No. GAU-XKTD-2022-09); the Agricultural smart water saving technology Innovation center of Gansu Province, Gansu Jingtai Wolfberry Science and Technology Academy, and Gansu Wolfberry Harmless Cultivation Engineering Research Center.

Data Availability Statement

Data are contained within the article.

Acknowledgments

The authors would like to thank all funds and lab facilities. We also gratefully acknowledge the anonymous reviewers for their constructive comments.

Conflicts of Interest

The authors declare no conflicts of interest.

References

  1. Sun, H.Z.; Xu, L.R.; Wang, J.; Fu, X. Remote sensing monitoring of spatial-temporal variation of soil salinization before and after irrigation in the Yellow River Delta. J. Coast. Res. 2021, 105, 56–60. [Google Scholar] [CrossRef]
  2. Wang, Y.F.; Qu, L.Q.; Li, J.M.; Li, L. Analysis of soil erosion control based on China soil and water conservation bulletin in the past two decades. J. Changjiang River Sci. Res. Inst. 2023, 40, 59–65. [Google Scholar] [CrossRef]
  3. Liu, R.H.; Feng, W.L. The technology of improving saline-alkali land with iron tailings compound modifier is successful. Gold 2016, 37, 55. [Google Scholar]
  4. Sun, T.; Feng, Z.M.; Yang, Y.Z.; Lin, Y.M.; Wu, Y.J. Research on land resource carrying capacity: Progress and prospects. J. Resour. Ecol. 2018, 9, 331–340. [Google Scholar] [CrossRef]
  5. Liu, Z. Introduction to Soil and Water Conservation in China; China Water Resources and Hydropower Press: Beijing, China, 2018. [Google Scholar]
  6. Yao, R.; Heinrich, M.; Weckerle, C.S. The genus Lycium as food and medicine: A botanical, ethnobotanical and historical review. J. Ethnopharmacol. 2018, 212, 50–66. [Google Scholar] [CrossRef]
  7. Khoo, H.E.; Azlan, A.; Tang, S.T.; Lim, S.M. Anthocyanidins and anthocyanins: Colored pigments as food, pharmaceutical ingredients, and the potential health benefits. Food Nutr. Res. 2017, 61, 1361779. [Google Scholar] [CrossRef]
  8. Muatasim, R.; Ma, H.L.; Yang, X. Effect of multimode ultrasound assisted extraction on the yield of crude polysaccharides from Lycium barbarum (Goji). Food Sci. Technol. 2018, 38, 160–166. [Google Scholar] [CrossRef]
  9. Wozniak, J.R.; Swannack, T.M.; Butzler, R.; Llewellyn, C.; Davis, S.E. River inflow, estuarine salinity, and Carolina wolfberry fruit abundance:linking abiotic drivers to Whooping Crane food. J. Coast. Conserv. 2012, 16, 345–354. [Google Scholar] [CrossRef]
  10. Kulczyński, B.; Gramza-Michałowska, A. Goji berry (Lycium barbarum): Composition and health effects-a review. Pol. J. Food Nutr. Sci. 2016, 66, 67–75. [Google Scholar] [CrossRef]
  11. Zhu, H.; Tian, J.C.; Yang, F.; Ma, B.; Yan, X.F.; Hao, X.F. Effects of water-fertilizer-air-heat coupling on yield and photosynthesis of wolfberry. J. Drain. Irrig. Machin. Eng. 2022, 40, 511–518. [Google Scholar] [CrossRef]
  12. Chen, Y.K.; Teng, Z.N.; Yuan, Y.Q.; Yi, Z.X.; Zheng, Q.; Yu, H.H.; Lv, J.H.; Wang, Y.X.; Duan, M.J.; Zhang, J.H.; et al. Excessive nitrogen in field-grown rice suppresses grain filling of inferior spikelets by reducing the accumulation of cytokinin and auxin. Field Crop Res. 2022, 283, 108542. [Google Scholar] [CrossRef]
  13. Li, J.P.; Zhang, Z.; Yao, C.S.; Liu, Y.; Wang, Z.M.; Fang, B.T.; Zhang, Y.H. Improving winter wheat grain yield and water-/nitrogen-use efficiency by optimizing the micro-sprinkling irrigation amount and nitrogen application rate. J. Integr. Agric. 2021, 20, 606–621. [Google Scholar] [CrossRef]
  14. Gheith, E.M.S.; El–Badry, O.Z.; Lamlom, S.F.; Ali, H.M.M.; Siddiqui, M.H.H.; Ghareeb, R.Y.Y.; El–Sheikh, M.H.H.; Jebril, J.; Abdelsalam, N.R.R.; Kandil, E.E.E. Maize (Zea mays L.) productivity and nitrogen-use efficiency in response to nitrogen application levels and time. Front. Plant Sci. 2022, 13, 941343. [Google Scholar] [CrossRef]
  15. Wu, J.N.; Wei, X.D.; Li, X.; Zhang, J.F.; Xie, Y.F. Research progress in nitrogen-use efficiency in plants. Plant Physiol. J. 2018, 54, 1401–1408. [Google Scholar] [CrossRef]
  16. Yang, Y.; Li, X.; Pan, C.; Hou, J.; Li, J.F.; Wu, Q.X.; Yang, J.; Qi, D.L. Research progresses on coupling effects of water and nitrogen on growth and grain yield of maize. Water Sav. Irrig. 2021, 5, 41–45. [Google Scholar]
  17. Wang, F.L.; Chai, C.W.; Zhao, P.; Tang, W.D.; Fu, G.Q.; Sun, T.; Xu, B.Y. Photosynthetic and chlorophyll fluorescence responses of three desert species to drought stress and evaluation of drought resistance. Acta Agric. Borea.-Occident. Sinica. 2021, 41, 1755–1765. [Google Scholar] [CrossRef]
  18. Ierna, A.; Pandino, G.; Lombardo, S.; Mauromicale, G. Tuber yield, water and fertilizer productivity in early potato as affected by a combination of irrigation and fertilization. Agric. Water Manag. 2011, 101, 35–41. [Google Scholar] [CrossRef]
  19. Si, Z.Y.; Zain, M.; Mehmood, F.; Wang, G.S.; Gao, Y.; Duan, A.W. Effects of nitrogen application rate and irrigation regime on growth, yield, and water-nitrogen-use efficiency of drip-irrigated winter wheat in the North China Plain. Agric. Water Manag. 2020, 231, 106002. [Google Scholar] [CrossRef]
  20. Miner, G.L.; Delgado, J.A.; Ippolito, K.A.; Barbarick, K.A.; Stewart, C.E.; Manter, D.K.; Del Grosso, S.J.; Halvorson, A.D.; Floyd, B.A.; D’Adamo, R.E. Influence of long-term nitrogen fertilization on crop and soil micronutrients in a no-till maize cropping system. Field Crop Res. 2018, 228, 170–182. [Google Scholar] [CrossRef]
  21. Liu, X.H.; Hao, K.; Han, Z.H.; Yu, N.; Yang, Q.L.; Liu, Y.W. Effect of water and nitrogen coupling on yield and quality of Arabica coffee in dry-hot area. Trans. Chin. Soc. Agric. Machin. 2016, 47, 143–150. [Google Scholar] [CrossRef]
  22. Fan, M.Y.; Qin, Y.H.; Jiang, X.L.; Cui, N.B.; Wang, Y.S.; Zhang, Y.X.; Zhao, L.; Jiang, S.Z. Proper deficit nitrogen application and irrigation of tomato can obtain a higher fruit quality and improve cultivation profit. Agronomy 2022, 12, 2578. [Google Scholar] [CrossRef]
  23. Deng, H.L.; Pan, X.F.; Zhang, H.J.; Xiao, Z.W.; Xiao, R.; Zhao, Z.X.; Chen, T. Comprehensive regulation of water-Nitrogen coupling in hybrid seed maize in the Hexi Oasis Irrigation Area based on the synergy of multiple indicators. Water 2023, 15, 3927. [Google Scholar] [CrossRef]
  24. Li, J.P.; Wang, Z.M.; Song, Y.H.; Li, J.C.; Zhang, Y.H. Effects of reducing nitrogen application rate under different irrigation methods on grain yield, water and nitrogen utilization in winter wheat. Agronomy 2022, 12, 1835. [Google Scholar] [CrossRef]
  25. Shrestha, B.; Darapuneni, M.; Stringam, B.L.; Lombard, K.; Djaman, K. Irrigation water and nitrogen fertilizer management in potato (Solanum tuberosum L.): A review. Agronomy 2023, 13, 2566. [Google Scholar] [CrossRef]
  26. Akkamis, M.; Caliskan, S. Responses of yield, quality and water-use efficiency of potato grown under different drip irrigation and nitrogen levels. Sci. Rep. 2023, 13, 9911. [Google Scholar] [CrossRef]
  27. Qi, D.L.; Hu, T.T.; Song, X. Effects of nitrogen application rates and irrigation regimes on grain yield and water-use efficiency of maize under alternate partial root-zone irrigation. J. Integr. Agric. 2020, 19, 2792–2806. [Google Scholar] [CrossRef]
  28. Saed-Moucheshi, A.; Pessarakli, M.; Mozafari, A.A.; Rezaizad, A.; Froozesh, P.; Tabarzad, A.; Alipour, H. Modeling and determining the best combination of nitrogen and irrigation levels for achieving high yield in sweet corn. J. Plant Nutr. 2022, 45, 2748–2757. [Google Scholar] [CrossRef]
  29. Kumar, R.; Pareek, N.K.; Kumar, U.; Javed, T.; Al-Huqail, A.A.; Rathore, V.S.; Nangia, V.; Choudhary, A.; Nanda, G.; Ali, H.M.; et al. Coupling effects of nitrogen and irrigation levels on growth attributes, nitrogen-use efficiency, and economics of cotton. Front. Plant Sci. 2022, 13, 890181. [Google Scholar] [CrossRef]
  30. Ali, S.; Hafeez, A.; Ma, X.L.; Tung, S.A.; Chattha, M.S.; Shah, A.N.; Luo, D.; Ahmad, S.; Liu, J.H.; Yang, G.Z. Equal potassium-nitrogen ratio regulated the nitrogen metabolism and yield of high-density late-planted cotton (Gossypium Hirsutum L.) in Yangtze River valley of China. Ind. Crop. Prod. 2019, 129, 231–241. [Google Scholar] [CrossRef]
  31. Ghannem, A.; Ben Aissa, I.; Majdoub, R. Effects of regulated deficit irrigation applied at different growth stages of greenhouse grown tomato on substrate moisture, yield, fruit quality, and physiological traits. Environ. Sci. Pollut. Res. 2021, 28, 46553–46564. [Google Scholar] [CrossRef] [PubMed]
  32. Wang, X.K.; Yun, J.; Shi, P.; Li, Z.B.; Li, P.; Xing, Y.Y. Root growth, fruit yield and water-use efficiency of greenhouse grown tomato under different irrigation regimes and nitrogen levels. J. Plant Growth Regul. 2019, 38, 400–415. [Google Scholar] [CrossRef]
  33. Wang, W.J.; Wang, L.J. The present situation and suggestion of product development of Lycium barbarum in Jingyuan county, Gansu province. Market Modern. 2018, 16, 11–12. [Google Scholar] [CrossRef]
  34. Wang, X.F.; Xia, J.B. Function of reducing soil salinity and soil improvement of different vegetation types in Yellow River Irrigation area of the Yellow River Delta. J. Soil Water Conserv. 2012, 26, 141–144. [Google Scholar] [CrossRef]
  35. Li, X.M.; Qi, G.P.; Kang, Y.X.; Wang, J.H.; Cai, L.H.; Zhao, M. Effects of Lycium barbarum intercropping with onobrychis viciaefolia on soil water, soil salt transport, and yield of L. barbarum in different salinized soils. Bull. Soil Water Conserv. 2020, 40, 51–57. [Google Scholar] [CrossRef]
  36. Bulut, S.; Çaglar, Ö.; Öztürk, A. Effects of sowing dates and seeding rates on nitrogen and water-use efficiency of facultative wheat. Gesunde Pflanz. 2022, 74, 291–301. [Google Scholar] [CrossRef]
  37. GB/T18672-2014; China National Standardization Administration (Wolfberry). Standards Press of China: Beijing, China, 2014.
  38. GB/T18672; National Standard of the People’s Republic of China (Wolfberry). General Administration of Quality Supervision, Inspection and Quarantine of the People’s Republic of China: Beijing, China, 2014.
  39. Li, H.S. Experimental Principles and Techniques of Plant Physiology and Biochemistry; Higher Education Press: Beijing, China, 2000. [Google Scholar]
  40. Zhao, S.T.; Shi, S.L.; Li, X.L.; Li, W.; Zhang, X.Y. Application of TOPSIS based on entropy weight to screen soil sustainable systems suitable for corn rotation in the Arid Region of Central Gansu. Acta. Agrestia. Sinica. 2019, 27, 997–1005. [Google Scholar] [CrossRef]
  41. Ma, J.; Luo, Z.Z.; Niu, Y.N. Effects of water and nitrogen levels on photosynthetic characteristics and water utilization of spring wheat. Crop Res. 2020, 34, 308–314. [Google Scholar] [CrossRef]
  42. Mao, H.P.; Jin, C.; Chen, Y. Research progress and prospect on control methods of greenhouse environment. Trans. Chin. Soci. Agric. Machin. 2018, 49, 1–13. [Google Scholar] [CrossRef]
  43. Gao, Y.L.; Qi, G.P.; Ma, Y.L.; Yin, M.H.; Wang, J.H.; Wang, C.; Tian, R.R.; Xiao, F.; Lu, Q.; Wang, J.J. Regulation effects of water and nitrogen on yield, water, and nitrogen-use efficiency of wolfberry. J. Arid Land 2024, 16, 29–45. [Google Scholar] [CrossRef]
  44. Song, Y.C.; Chen, X.L.; Ren, X.L.; Gao, X.D. Combined effects of regulated deficit irrigation and reduced nitrogen fertilization on yield and growth of Chinese wolfberry. Acta Agric. Borea.-Occident. Sin. 2019, 28, 1666–1673. [Google Scholar] [CrossRef]
  45. Ma, Z.H.; Yin, J.; Yang, Y.P.; Sun, F.B.; Yang, Z. Effect of water and nitrogen coupling regulation on the growth, physiology, yield, and quality attributes and comprehensive evaluation of wolfberry (Lycium barbarum L.). Front. Plant Sci. 2023, 14, 1130109. [Google Scholar] [CrossRef]
  46. Kamran, M.; Yan, Z.A.; Chang, S.H.; Ning, J.; Lou, S.N.; Ahmad, I.; Ghani, M.U.; Arif, M.; El Sabagh, A.; Hou, F.J. Interactive effects of reduced irrigation and nitrogen fertilization on resource use efficiency, forage nutritive quality, yield, and economic benefits of spring wheat in the arid region of Northwest China. Agric. Water Manag. 2023, 275, 108000. [Google Scholar] [CrossRef]
  47. Zhang, J.X.; Bei, Z.G.; Zhang, Y.; Cao, K. Growth characteristics, water and nitrogen use efficiencies of spinach in different water and nitrogen levels. Sains Malays. 2014, 43, 1665–1671. [Google Scholar]
  48. Yang, Y.P.; Yin, J.; Ma, Z.H.; Wei, X.D.; Sun, F.B.; Yang, Z. Water and nitrogen regulation effects and system optimization for potato (Solanum tuberosum L.) under film drip irrigation in the dry zone of Ningxia China. Agronomy 2023, 13, 308. [Google Scholar] [CrossRef]
  49. Stamatiadis, S.; Tsadilas, C.; Samaras, V.; Schepers, J.S.; Eskridge, K. Nitrogen uptake and N-use efficiency of mediterranean cotton under varied deficit irrigation and N fertilizer. Eur. J. Agron. 2016, 73, 144–151. [Google Scholar] [CrossRef]
  50. Li, X.X.; Liu, H.G.; He, X.L.; Gong, P.; Lin, E. Water-nitrogen coupling and multi-objective optimization of cotton under mulched drip irrigation in arid northwest China. Agronomy 2019, 9, 894. [Google Scholar] [CrossRef]
  51. Kong, Q.H.; Li, G.Y.; Wang, Y.H.; Huo, H.X. Bell pepper response to surface and subsurface drip irrigation under different fertigation levels. Irrig. Sci. 2012, 30, 233–245. [Google Scholar] [CrossRef]
  52. Wang, L.; Dong, S.T.; Liu, P.; Zhang, J.W.; Zhao, B. Effects of water and nitrogen interaction on physiological and photosynthetic characteristics and yield of winter wheat. J. Soil Water Conserv. 2018, 32, 301–308. [Google Scholar] [CrossRef]
  53. Ma, K.; Wang, Z.H.; Wang, T.Y.; Zong, R.; Wang, D.W. Effects of water and nitrogen coupling on photosynthetic characteristics and yield of film mulching cotton under brackish water drip irrigation. Acta Agric. Borea.-Occident. Sinica. 2022, 31, 559–568. [Google Scholar] [CrossRef]
  54. Gao, C.M.; Yang, Y.H.; He, F.; Han, W.F.; Wang, X.F.; Wu, J.C. Effects of water-nitrogen coupling on photosynthetic characteristics, irrigation water use characteristics and yield in winter wheat under different irrigation technologies. Acta Agric. Borea.-Occident. Sinica. 2020, 35, 72–80. [Google Scholar] [CrossRef]
  55. Hoffmann, B.; Varga, B.; Nagy, E.; Hoffmann, S.; Darkó, É.; Tajti, J.; Janda, T. Effects of nitrogen and water deficiency on agronomic properties, root characteristics and expression of related genes in soybean. Agronomy 2023, 11, 1329. [Google Scholar] [CrossRef]
  56. Marty, B.; Almayrac, M.; Barry, P.H.; Bekaert, D.V.; Broadley, M.W.; Byrne, D.J.; Ballentine, C.J.; Caracausi, A. An evaluation of the C/N ratio of the mantle from natural CO2-rich gas analysis: Geochemical and cosmochemical implications. Earth Planet. Sci. Lett. 2020, 551, 116574. [Google Scholar] [CrossRef]
  57. Zheng, R.; Kang, S.Z.; Hu, X.T.; Li, S.S. Effects of water and nitrogen conditions on the diurnal variation of photosynthesis characteristic and yield of grapevine in arid oasis region. Trans. Chin. Soc. Agric. Eng. 2013, 29, 133–141. [Google Scholar] [CrossRef]
  58. Dong, J.S.; Shen, X.J.; Li, Q.; Xue, Z.; Hou, X.F.; Miao, H.C.; Ning, H.F. Irrigation and fertilization scheduling for peanut cultivation under mulched drip irrigation in a desert-oasis area. Plants 2024, 13, 144. [Google Scholar] [CrossRef] [PubMed]
  59. Wang, H.D.; Wu, L.F.; Cheng, M.H.; Fan, J.L.; Zhang, F.C.; Zou, Y.F.; Chau, H.W.; Gao, Z.J.; Wang, X.K. Coupling effects of water and fertilizer on yield, water and fertilizer use efficiency of drip-fertigated cotton in northern Xinjiang, China. Field Crop. Res. 2018, 219, 169–179. [Google Scholar] [CrossRef]
  60. Fu, S.N.; Wei, X.G.; Zheng, S.Y.; Wu, L.L.; Li, B.; Wang, T.L. Effects of integrated management of water and fertilizer on the physiological characteristics and water-fertilizer use efficiency of grapes in greenhouse. Trans. Chin. Soc. Agric. Eng. 2021, 37, 61–72. [Google Scholar] [CrossRef]
  61. Zhang, Y.S.; Yang, H.S.; Ge, X.L.; Zhang, R.F.; Zhang, M.W.; Gao, X.; Li, Y.Y. Effects of water and nitrogen management on yield and benefit of maize under the shallow buried drip irrigation in Xiliaohe plain. J. North Agric. Sci. 2023, 48, 32–36. [Google Scholar] [CrossRef]
  62. Li, J.S.; Yang, Z.Q.; Wang, M.T.; Wei, T.T.; Zhao, H.L.; Jiang, M.Y.; Sun, Q.; Huang, Q.Q. Effect of water and nitrogen coupling on nitrogen metabolism enzyme activities in grapevine seedling leaves. Chin. J. Agrometeorol. 2019, 40, 369–379. [Google Scholar] [CrossRef]
  63. Liu, P.Z.; Li, M.H.; Song, Y.C.; Yang, D.; Gao, X.D.; Ren, X.L.; Chen, X.L. Effects of fertigation on yield, water and nitrogen utilization and economic productivity benefit of wolfberry (Lycium barbarum L.). Plant Nutr. Fert. Sci. 2021, 27, 1820–1828. [Google Scholar] [CrossRef]
  64. Liao, Q.; Ding, R.S.; Du, T.S.; Kang, S.Z.; Tong, L.; Li, S. Stomatal conductance drives variations of yield and water use of maize under water and nitrogen stress. Agric. Water Manag. 2022, 268, 107651. [Google Scholar] [CrossRef]
  65. Yan, W.K.; Fregeau-Reid, J.; Ma, B.L.; Pageau, D.; Vera, C. Nitrogen fertilizer complements breeding in improving yield and quality of milling oat. Crop Sci. 2017, 57, 3291–3302. [Google Scholar] [CrossRef]
  66. Wu, K.; Wang, S.S.; Song, W.Z.; Zhang, J.Q.; Wang, Y.; Liu, Q.; Yu, J.P.; Ye, Y.F.; Li, S.; Chen, J.F.; et al. Enhanced sustainable green revolution yield via nitrogen-responsive chromatin modulation in rice. Science 2020, 367, eaaz2046. [Google Scholar] [CrossRef]
  67. Zhao, M.; Qi, G.P.; Cai, L.H.; Lai, S.D.; Wang, J.J.; Wang, J.J. Effects of water regulation and planting patterns on growth and water-use efficiency of Lycium barbarum. Agric. Eng. 2021, 11, 75–81. [Google Scholar] [CrossRef]
  68. Li, X.M.; Qi, G.P.; Kang, Y.X.; Yin, M.H.; Wang, J.H.; Cai, L.H.; Zhao, M.; Lai, S.D. Effects of water deficit on water-use efficiency of red bean grass intercropped with Lycium barbarum. Water Resour. Plan. Des. 2020, 3, 135–140. [Google Scholar] [CrossRef]
  69. Zhang, Y.C.; Zhang, F.C.; Fan, J.L.; Hou, X.H.; Wang, H.D.; Liu, X.; He, P.R.; Xue, Z.Q. Effects of drip irrigation technical parameters on cotton growth, soil moisture and salinity in Southern Xinjiang. Trans. Chin. Soc. Agric. Eng. 2020, 36, 107–117. [Google Scholar] [CrossRef]
  70. Li, H.H.; Liu, H.; Gong, X.W.; Li, S.; Pang, J.; Chen, Z.F.; Sun, J.S. Optimizing irrigation and nitrogen management strategy to trade off yield, crop water productivity, nitrogen-use efficiency and fruit quality of greenhouse grown tomato. Agric. Water Manag. 2020, 245, 106570. [Google Scholar] [CrossRef]
  71. Gao, C.M.; Ding, J.L.; Zhang, J.M.; Jiang, Y.Q.; He, F.; Yang, Y.H.; Wu, J.C. The combined effects of irrigation and nitrogen fertilization on yield and water and nitrogen-use efficiency of summer maize. J. Irrig. Drainage 2022, 41, 44–51. [Google Scholar] [CrossRef]
  72. Abdalhi, M.A.M.; Cheng, J.; Feng, S.; Yi, G. Performance of drip irrigation and nitrogen fertilizer in irrigation water saving and nitrogen-use efficiency for waxy maize (Zea mays L.) and cucumber (Cucumis sativus L.) under solar greenhouse. Grassl. Sci. 2016, 62, 174–187. [Google Scholar] [CrossRef]
  73. Hao, K.; Fei, L.J.; Liu, L.H.; Jie, F.L.; Peng, Y.L.; Liu, X.G.; Khan, S.A.; Wang, D.; Wang, X.K. Comprehensive evaluation on the yield, quality, and water-nitrogen-use efficiency of mountain apple under surge-root irrigation in the Loess Plateau based on the improved TOPSIS method. Front. Plant Sci. 2022, 13, 853546. [Google Scholar] [CrossRef] [PubMed]
  74. Jiang, Y.M.; Li, L.; Cheng, M.Z.; Song, X.T.; Lu, Z.Y.; Sun, Q.; Yin, J. Investigation and analysis of the effect of water and nitrogen coupling on high yield and high efficiency in winter wheat Xinong 979. J. Henan Agric. Univ. 2014, 48, 263–268. [Google Scholar] [CrossRef]
  75. Yang, Z.; Fei, L.J.; Li, Z.; Peng, Y.L.; Hao, K.; Liu, T. Effects of water-nitrogen coupling under different irrigation techniques on yield and quality of mountain apples and water and fertilizer utilization. J. Soil Water Conserv. 2023, 37, 267–272. [Google Scholar] [CrossRef]
  76. Song, N.; Wang, F.X.; Yang, C.F.; Yang, K.J. Coupling effects of water and nitrogen on yield, quality and water use of potato with drip irrigation under plastic film mulch. Trans. Chin. Soc. Agric. Eng. 2013, 29, 98–105. [Google Scholar] [CrossRef]
  77. Kahsay, W.S. Effects of nitrogen and phosphorus on potatoes production in Ethiopia: A review. Cog. Food Agric. 2019, 5, 2–5. [Google Scholar] [CrossRef]
  78. Ma, B.; Huang, Y.; Tian, J.C. Optimization of irrigation scheduling based on yield-quality multi-index coupling at juvenile stage of Lycium barbarum L. in gravel-mulched field. Agric. Res. Arid Areas 2020, 38, 140–147. [Google Scholar] [CrossRef]
  79. Li, P.F.; Tan, H.; Wang, J.H.; Yang, P.L. Effect of water and fertilizer conditions under drip irrigation on yield, quality of cherry and physicochemical properties of soil. Trans. Chin. Soc. Agric. Machin. 2017, 48, 236–246. [Google Scholar] [CrossRef]
  80. Li, M.; Ma, L.; Han, Z.M.; Liu, S.Y.; Huang, Y.X.; Zheng, G.B. Effect of water stress in different growth stages on water consumption characteristics and fruit quality of wolfberry. North Horticult. 2022, 7, 106–113. [Google Scholar] [CrossRef]
  81. Li, S.B.; Zhou, L.L.; Wu, S.P.; Sun, M.; Ding, G.C.; Lin, S.Z. Effects of different nitrogen forms on nutrient uptake and distribution of Cunninghamia lanceolata plantlets under drought stress. Plant Nutr. Fert. Sci. 2020, 26, 152–162. [Google Scholar] [CrossRef]
Figure 1. Daily precipitation and average temperature during the growing season of wolfberry.
Agronomy 14 00607 g001
Figure 2. Effects of water and nitrogen regulation on plant height growth amount of wolfberry. Different lowercase letters indicate significant differences in plant height growth amount under different water and nitrogen treatments at p < 0.05. W, water treatment; N, nitrogen application treatment; W × N, interaction. ** indicates extremely significant difference at p < 0.01; * indicates significant difference at p < 0.05.
Agronomy 14 00607 g002
Figure 3. Effects of water and nitrogen regulation on stem diameter growth amount of wolfberry. Different lowercase letters indicate significant differences in stem diameter growth amount under different water and nitrogen treatments at p < 0.05. W, water treatment; N, nitrogen application treatment; W × N, interaction. ** indicates extremely significant difference at p < 0.01.
Agronomy 14 00607 g003
Figure 4. Effects of water and nitrogen regulation on SPAD of wolfberry. Different lowercase letters indicate significant differences in SPAD under different water and nitrogen treatments at p < 0.05. W, water treatment; N, nitrogen application treatment; W × N, interaction. ** indicates extremely significant difference at p < 0.01; ns indicates no significant difference.
Agronomy 14 00607 g004
Figure 5. Effects of water and nitrogen regulation on photosynthetic characteristics of wolfberry. W, water treatment; N, nitrogen application treatment. (ad) indicates Pn, (eh) indicates gs, (il) indicates Ci, (mp) indicates Tr. Pn, gs, Ci, and Tr were all diurnal variations.
Agronomy 14 00607 g005
Figure 6. Diurnal variation of environmental factors. PAR, Δe, Ta, and RH were all diurnal variations.
Agronomy 14 00607 g006
Figure 7. Relationship between photosynthetic parameters of wolfberry and environmental factors under different treatments of water and nitrogen.
Agronomy 14 00607 g007
Figure 8. Effects of water and nitrogen regulation on yield, water, and nitrogen-use efficiency of wolfberry. Different lowercase letters indicate significant differences in yield, water, and nitrogen-use efficiency under different water and nitrogen treatments at p < 0.05. W, water treatment; N, nitrogen application treatment; W × N, interaction. ** indicates extremely significant difference at p < 0.01; * indicates significant difference at p < 0.05; ns indicates no significant difference.
Agronomy 14 00607 g008
Figure 9. Relative proximity (Ci) and comprehensive ranking under different water and nitrogen regulations.
Agronomy 14 00607 g009
Table 1. Effects of water and nitrogen regulation on the quality of wolfberry.
TreatmentTotal Sugars
(g·100 g−1)
Polysaccharides (g·100 g−1)Amino Acids (%)Proteins (g·100 g−1)Fats (g·100 g−1)
W0N046.42 ± 1.20 efg4.69 ± 0.17 d6.65 ± 0.61 def10.45 ± 1.03 def1.93 ± 0.31 ab
W0N149.78 ± 1.23 bc5.04 ± 0.27 bcd7.93 ± 0.73 cde12.90 ± 1.17 ab1.79 ± 0.09 ab
W0N249.77 ± 1.85 bc5.11 ± 0.14 bcd9.08 ± 1.05 ab13.94 ± 0.68 a1.89 ± 0.18 ab
W0N348.89 ± 0.44 cd5.12 ± 0.43 bc8.65 ± 0.49 abc13.01 ± 1.13 ab1.94 ± 0.05 ab
W1N048.66 ± 1.20 de3.71 ± 0.22 f6.66 ± 1.08 def11.64 ± 0.47 bcd1.84 ± 0.40 ab
W1N150.94 ± 1.27 ab5.34 ± 0.20 b6.78 ± 1.00 def12.30 ± 1.17 bc2.00 ± 0.33 ab
W1N252.63 ± 0.84 a5.74 ± 0.20 a7.29 ± 1.02 cde12.78 ± 1.03 ab2.13 ± 0.09 a
W1N348.86 ± 0.67 cd4.26 ± 0.30 e8.22 ± 0.41 bcd10.77 ± 0.31 cde1.92 ± 0.11 ab
W2N045.26 ± 0.60 fg3.95 ± 0.09 ef5.42 ± 0.87 g9.54 ± 1.14 efg1.79 ± 0.76 ab
W2N147.17 ± 0.42 def4.93 ± 0.29 bcd6.60 ± 1.07 def11.56 ± 1.03 bcd1.95 ± 0.30 ab
W2N247.66 ± 0.92 de4.87 ± 0.17 cd8.18 ± 1.06 bcd10.48 ± 0.85 def1.90 ± 0.10 ab
W2N347.14 ± 1.33 defg4.09 ± 0.17 ef10.09 ± 1.10 a9.91 ± 0.33 ef1.89 ± 0.20 ab
W3N045.01 ± 1.11 g3.79 ± 0.19 f5.45 ± 0.93 g8.87 ± 0.90 fg1.46 ± 0.35 b
W3N145.94 ± 1.17 efg4.09 ± 0.15 ef6.23 ± 1.06 efg9.34 ± 0.78 efg1.68 ± 0.29 ab
W3N246.64 ± 0.92 efg4.05 ± 0.20 ef6.80 ± 0.01 def9.06 ± 0.65 fg1.59 ± 0.28 ab
W3N345.76 ± 1.59 efg3.71 ± 0.29 f5.89 ± 1.12 fg8.12 ± 0.70 g1.56 ± 0.09 ab
Analysis of variance
W********
N****ns**ns
W × Nns**ns*ns
Note: mean ± SD, n = 3; different lowercase letters indicate significant differences in quality under different water and nitrogen treatments at p < 0.05. W, water treatment; N, nitrogen application treatment; W × N, interaction. ** indicates extremely significant difference at p < 0.01; * indicates significant difference at p < 0.05; ns indicates no significant difference.
Table 2. Effects of water and nitrogen regulation on the benefit of wolfberry.
TreatmentTotal Income (×104 CNY·ha−1)Total Cost
(×104 CNY·ha−1)
Net Income (×104 CNY·ha−1)Input–Output Ratio
W0N06.40 ± 0.33 f1.98 ± 0.00 h4.42 ± 0.33 fg3.23 ± 0.17 fg
W0N17.37 ± 0.64 de2.02 ± 0.01 f5.35 ± 0.65 de3.65 ± 0.33 de
W0N28.88 ± 0.44 ab2.06 ± 0.01 d6.82 ± 0.44 ab4.32 ± 0.20 ab
W0N38.00 ± 0.56 cd2.11 ± 0.01 a5.89 ± 0.55 cd3.79 ± 0.25 cd
W1N06.68 ± 0.28 ef1.96 ± 0.00 i4.72 ± 0.28 ef3.41 ± 0.14 ef
W1N17.72 ± 0.25 cd2.01 ± 0.01 f5.70 ± 0.25 cd3.83 ± 0.13 cd
W1N29.44 ± 0.47 a2.04 ± 0.00 e7.41 ± 0.47 a4.64 ± 0.23 a
W1N38.47 ± 0.47 bc2.09 ± 0.00 b6.38 ± 0.47 bc4.05 ± 0.23 bc
W2N06.12 ± 0.49 fg1.94 ± 0.00 j4.18 ± 0.49 fg3.15 ± 0.25 fg
W2N16.56 ± 0.14 f1.98 ± 0.00 h4.58 ± 0.14 fg3.31 ± 0.07 ef
W2N27.94 ± 0.30 cd2.02 ± 0.00 f5.92 ± 0.30 cd3.93 ± 0.15 cd
W2N37.53 ± 0.62 d2.07 ± 0.00 c5.46 ± 0.62 de3.63 ± 0.30 de
W3N04.93 ± 0.38 h1.92 ± 0.00 k3.01 ± 0.38 i2.57 ± 0.20 h
W3N15.08 ± 0.50 h1.96 ± 0.00 i3.12 ± 0.50 hi2.59 ± 0.26 h
W3N25.43 ± 0.42 gh2.00 ± 0.00 g3.43 ± 0.43 hi2.71 ± 0.21 h
W3N35.93 ± 0.09 fg2.06 ± 0.01 c3.87 ± 0.10 gh2.87 ± 0.05 gh
Analysis of variance
W********
N********
W×N****
Note: mean ± SD, n = 3; different lowercase letters indicate significant differences in economic benefits under different water and nitrogen treatments at p < 0.05. W, water treatment; N, nitrogen application treatment; W × N, interaction. ** indicates extremely significant difference at p < 0.01; * indicates significant difference at p < 0.05. Urea is 3.25 CNY·kg−1, superphosphate is 1 CNY·kg−1, potassium chloride is 4 CNY·kg−1, irrigation water is 0.33 CNY·m−3, labor fee is 150 CNY per person per day, and the remaining cost of each treatment is calculated according to the actual situation. In 2022, the average price of dried Chinese wolfberry is 36 CNY·kg−1.
Table 3. Calculation matrix Mij for each evaluation indicator under different water and nitrogen regulation.
TreatmentIrrigation AmountNitrogen Application RateTotal Sugars Polysac-Charides Amino AcidsProteinsFatsYieldIWUEWUEPFPNANUENet Income
W0N00.3460.0000.2430.2560.2260.2370.2620.2240.1520.1660.0000.0000.213
W0N10.3170.1340.2600.2760.2690.2920.2440.2580.1910.2120.4450.3520.259
W0N20.2840.2670.2600.2790.3090.3160.2580.3100.2560.2480.2680.4470.330
W0N30.3000.4010.2560.2800.2940.2940.2640.2800.2190.2420.1610.1930.285
W1N00.2940.0000.2440.2030.2260.2640.2510.2340.1860.1980.0000.0000.228
W1N10.2990.1340.2660.2920.2300.2780.2730.2700.2120.2280.4660.3750.276
W1N20.2410.2670.2750.3140.2470.2890.2900.3300.3220.3300.2850.5000.358
W1N30.2550.4010.2550.2330.2790.2440.2610.2960.2730.2890.1710.2150.308
W2N00.2420.0000.2370.2160.1840.2160.2440.2140.2070.2210.0000.0000.202
W2N10.2220.1340.2470.2690.2240.2620.2650.2290.2430.2320.3960.1580.221
W2N20.1990.2670.2490.2660.2780.2370.2590.2780.3270.3210.2400.3280.286
W2N30.2100.4010.2460.2230.3430.2240.2580.2630.2950.2630.1520.1700.264
W3N00.1900.0000.2350.2070.1850.2010.1980.1720.2120.2250.0000.0000.145
W3N10.1740.1340.2400.2240.2110.2110.2280.1780.2400.2440.3070.0570.151
W3N20.1560.2670.2440.2210.2310.2050.2160.2070.3110.2860.1790.1820.166
W3N30.1650.4010.2390.2030.2000.1840.2120.1900.2700.2360.1090.0610.187
Disclaimer/Publisher’s Note: The statements, opinions and data contained in all publications are solely those of the individual author(s) and contributor(s) and not of MDPI and/or the editor(s). MDPI and/or the editor(s) disclaim responsibility for any injury to people or property resulting from any ideas, methods, instructions or products referred to in the content.

