Article

Analysis of Phenotypic and Physiological Characteristics of Plant Height Difference in Alfalfa

Pratacultural College, Gansu Agricultural University, Lanzhou 730070, China
*
Author to whom correspondence should be addressed.
Agronomy 2023, 13(7), 1744; https://doi.org/10.3390/agronomy13071744
Submission received: 27 May 2023 / Revised: 19 June 2023 / Accepted: 21 June 2023 / Published: 28 June 2023
(This article belongs to the Special Issue Frontier Studies in Legumes Genetic Breeding and Production)

Abstract

:
Cultivating new alfalfa (Medicago sativa L.) varieties with high yield and quality is of great significance for improving alfalfa yield and promoting the development of the grass and livestock industry. Plant height is an important indicator of alfalfa yield and is closely related to photosynthetic capacity, harvest index and yield. However, the underlying cause of the variation in height among alfalfa plants is not clear. In this paper, we measured the phenotypic traits, photosynthetic physiology and endogenous hormone content of tall- and short-stalked alfalfa materials and analyzed the important external and internal factors that caused the difference in plant height of alfalfa. We found that the phenotypic traits of tall- and short-stalked alfalfa materials showed significant differences, and dwarf alfalfa showed significant shortening of the main stem internode length. There were also some differences in light and physiological indicators and endogenous hormone contents between tall- and short-stalked alfalfa materials. Through correlation analysis, we found that the phenotypic traits and physiological indicators significantly correlated with alfalfa plant height were the number of internodes, stem diameter, average internode length, leaf–stem ratio, leaf area, Pn (net photosynthetic rate), Tr (transpiration rate), upper leaf SP (soluble protein), Suc (sucrose) content, middle stem Sta (starch) content, middle stem ZT (zeatin) and IAA (indole-3-acetic acid). Further analysis showed that Tr, IAA and LA played a direct role in plant height, with Tr contributing the most to plant height, followed by IAA. Finally, we found that the starch content of the middle stem had a significant impact on plant height through principal component analysis. These results provide new insights into the formation and genetic improvement of plant height traits in leguminous forages such as alfalfa.

1. Introduction

Alfalfa (Medicago sativa L.), as the “king of forage”, is an important feed source, its leaves contain a lot of vitamins, amino acids and proteins, which are rich in nutrition. Its well-developed deep root system not only has a nitrogen fixation effect, but also helps to promote water absorption, improve the structure of the soil and enhance microbial activity [1,2]. Alfalfa is planted in about 30 million hectares worldwide, of which more than 9 million hectares are planted in the United States and Argentina, while less than 5 million hectares are planted in China, and only 619 new varieties of alfalfa forage have been approved. This has caused a shortage of high-quality alfalfa forage varieties in China, so that a large amount of high-quality alfalfa depends on imports from countries such as the United States and Australia (data source: http://www.chinaoat.com/article.php, accessed on 11 January 2023). The shortage of alfalfa production has seriously restricted the rapid and healthy development of China’s grass-fed livestock industry. Therefore, cultivating new alfalfa varieties with high yield and quality and improving alfalfa production are the urgent needs for the current development of China’s grassland, livestock and dairy industries. In recent years, with the breakthrough of alfalfa genetic transformation technology and the publication of whole genome data [3,4,5,6], the use of modern biological technology for rapid genetic improvement of alfalfa is becoming a new research hotspot. The key to future high-yield alfalfa breeding is the discovery, creation and utilization of parental materials, and the study of yield traits in the process of variety selection has become a key direction of breeding.
As one of the important indicators for measuring the growth status of forage, plant height is closely related to photosynthetic capacity, harvest index and final yield traits [7,8]. The introduction of the “Green Revolution” semi-dwarf rice and dwarf wheat varieties illustrates the importance of plant height in regulating crop production [9]. The plant height of alfalfa grows in an “S” curve throughout the reproductive period, reaching a peak at the first flowering stage, after which growth almost stops [10]. The stem of dicotyledonous crops mainly depends on the cell division and elongation of the meristem at the top of the stem tip to increase the number of nodes and the elongation of internodes of the stem, which ultimately leads to the increase in the plant height [11]. Stem elongation is the decisive factor for plant heigh. The elongation of stems is influenced by a combination of external environmental and internal factors. External factors include light, temperature, moisture and fertilizers, etc., among which light is an important environmental factor affecting crop growth and development. The most direct effect of light on crops is photosynthesis, which is the foundation of dry matter accumulation and yield formation, and more than 95% of plant dry matter comes from the photosynthesis of leaves [12]. Plant height determines the ability of the plant to accumulate and store dry matter. Without changing the economic coefficient, an appropriate increase in plant height is conducive to improving the efficiency of light absorption by the leaves, increasing the accumulation of dry matter and improving the yield of the crop [13]. The growth of stems largely determines the ability of plants to compete for light, but the current research on the growth pattern of crop stems has not received sufficient attention. The intrinsic factors of stem elongation include hormones, genes and enzymes, etc. It has been shown that the elongation of plant stems is regulated by relevant genes, and most of the regulatory genes are related to hormone synthesis, metabolism and signaling [14]. Hormones are important factors in regulating plant height. Among the many hormones that regulate plant height, gibberellin (GA) is most closely related to plant height, and it can promote internode elongation in soybean (Glycine max), rapeseed (Brassica campestris), sugarcane (Saccharum officinarum) and other crops, and also promote internode elongation in dwarf plants to reach normal plant height [15]. In terms of promoting internode elongation, auxin (IAA) is mainly reflected in loosening the plant epidermal cell wall, regulating the expression of actin and upregulating the expression of expansin [16]. When a plant contains an IAA synthesis mutant in its body, it can directly promote stem elongation and indirectly promote plant height increase by the external application of IAA [17]. Plant hormones can not only independently regulate internode elongation, but their interactions can also directly or indirectly regulate internode elongation. For example, IAA can induce internode elongation by regulating the production of active GA3 in peas, while GA3 can regulate internode elongation by regulating the synthesis and transportation of IAA in Arabidopsis. IAA and GA3 ultimately control plant growth and development by regulating cell division, expansion, elongation and differentiation [18].
At present, the exploration of the mechanism of stem elongation is mainly focused on crops and some model plants, such as rice (Oryza sativa), mullein (Phyllostachys heterocycla), maize (Zea mays), sugarcane (Saccharum officinarum), and tomato (Solanum lycopersicum), etc. [19,20,21,22,23]. However, there are few reports in forage. As a typical representative of forage, alfalfa has mainly focused on the nutritional quality of the stem, and there is little research on the mechanism of stem elongation. The fundamental reasons for the differences in plant height of alfalfa are also unclear, and the genetic regulation mechanism still needs further research. Therefore, in this study, we analyzed the differences in phenotypic traits, photosynthetic physiology and hormone content of two tall- and two short-stalk alfalfa materials. The relationship between alfalfa plant height and phenotypic traits and physiological indicators was discussed, and the important external and internal factors that caused the difference of alfalfa plant height were analyzed. Overall, the findings of this study provide new ideas for genetic improvement of plant height traits in leguminous forage such as alfalfa.

2. Materials and Methods

2.1. Plant Material

The test materials were selected by measuring the plant height and related traits of 12 alfalfa varieties under the same cultivation conditions, and stable high stem and short stem materials with stable traits were selected (Figure 1). Two high stem materials were Medicago sativa L. “Gannong No.3” (G3) and “WL525HQ” (525), and two short stem materials were Medicago sativa L. “WL343HQ” (343) and “WL354HQ” (354). G3 was provided by the Key Laboratory of Grassland Ecosystem of the Ministry of Education, Grassland College, Gansu Agricultural University, while 343, 354 and 525 were purchased from Beijing Zhengdao Ecological Technology Co., Beijing City, China.

2.2. Growth Conditions and Treatments

All experiments were performed in June 2022 at the experimental base of Gansu Agricultural University (105°41′ E, 34°05′ N). The experiment was conducted using a potted method and sown in August 2021. The soil samples were mixed from field soil samples and nutrient soil at a mass ratio of 5:1. The field soil samples were taken from the 0–20 cm cultivated soil sample at the Grass Training Base of Gansu Agricultural University, and the soil was yellow cotton soil with uniform fertility. Nutritional soil was purchased from Gansu Shenghuawei Trading Co., Ltd. Before sowing, the soil samples were put into plastic pots with a diameter of 24 cm and a height of 24 cm. Then, 30 plump and uniformly sized alfalfa seeds were evenly sown per pot and randomly arranged in groups. This was repeated 9 times, and then the alfalfa was planted in the forage training base of Gansu Agricultural University. After planting, the plants were watered regularly, and no fertilizer was applied during the growth period. In June 2022, when the alfalfa reached the first flowering stage, all indexes were measured.

2.3. Measurement Indexes

2.3.1. Phenotypic Trait Indicators

Three plants of uniform plant size and neat flowering were randomly selected from each pot, and six replicates of each species were used to determine the phenotypic trait indexes of the plants [24]. The height from the base of the forage to the tip of the leaf or the top of the inflorescence was measured as plant height (PH) using a tape measure. The thickness of the first node at the base of the stem (SD) was measured with a vernier caliper, and the internode length (IL) was measured with a steel ruler. The fresh samples were brought back to the laboratory to count the number of leaves (NLP) and internodes (NI). After being killed at 105 °C for 20 min and dried at 80 °C to a constant weight, we weighed the dry weight of leaves per plant (LDWP) and the dry weight of the stems per plant (SDWP) and calculated the leaf–stem ratio (LSR). The third small leaf blade from the flag leaf downwards of a fixed alfalfa plant is taken and a known leaf area image is obtained using a digital camera. The pixel of the measured leaf in the image is extracted using digital image processing, and the leaf area is calculated. The inverted 4 leaves of the functional leaf of alfalfa were selected to measure the leaf shape index [25].
(i)
Leaf area (LA):
Leaf area (LA) = leaf pixel/reference pixel × Area of reference object
(ii)
Leaf shape index (LI):
Leaf shape index (LI) = leaf length/leaf width

2.3.2. Determination of Photosynthetic Parameters

The photosynthetic parameters were measured on a GFS-3000 portable gas exchange and fluorescence system (Heinz-Walz, Effel-trich, Germany) in sunny weather from 9:00 a.m. to 11:00 a.m. The test leaves were selected from the third fully unfolded small leaf blade of a fixed alfalfa plant from the flag leaf downwards. The measurement indicators included transpiration rate (Tr), net photosynthetic rate (Pn), intercellular CO2 concentration (Ci) and stomatal conductance (Gs) [26]. The CO2 concentration in the experimental site was 400 µmol·mol−1, and the light intensity was set at 12,000 µmol·m−2·s−1. Three leaves were selected from each pot and the procedure was repeated three times.

2.3.3. Determination of Photosynthetic Products

The 3rd to 5th leaves down from the top of the single plant were randomly selected as the upper leaves. The stems and leaves at the 7th internode in the middle of the stem were marked as the middle stem and middle leaves, respectively. After cutting them, they were placed in pre-prepared tin foil paper bags, quickly frozen in liquid nitrogen, and stored in an ultra-low temperature freezer at −80 °C for measuring photosynthetic physiological indicators. Sucrose (Suc) content was determined using a sucrose content assay kit (purchased from Suzhou Mengxi Biomedical Technology Co., Ltd.). Starch (Sta) content was determined by perchloric acid hydrolysis anthrone colorimetry [27]. The content of soluble sugar (SS) was determined using the anthrone colorimetric method [28]. The content of soluble protein (SP) was determined by Coomassie Brilliant Blue G-250 staining [29].

2.3.4. Determination of Endogenous Hormone Content

Plants of uniform growth were selected for this study. The upper internode of the stem was collected at the first flowering stage, which was the first internode in the upper part of the plant after the stem tip was removed. The middle stem was the seventh node of the stem, and the base of the stem was the first node at the base of the stem. Each material was divided into 3 equal parts after mixing in each plot at the first flowering stage. After quick-freezing in liquid nitrogen, the material was brought back to the laboratory and frozen at −80 °C in the refrigerator. The hormone extracts were prepared and analyzed by referring to the method of Liu Yan [30]. First of all, 0.5 g of fresh sample was weighed and ground into powder (liquid nitrogen was added throughout), after which 6 mL of pre-cooled extraction solution (n-propanol: water: HCL = 2:1:0.002) was added and then placed in a 4 °C refrigerator protected from light for overnight extraction (16 h). After 6~8 h of shaking at 4 °C, 3 mL of dichloromethane was added and shaken again for 30 min. After shaking, the extract was centrifuged at 1300× g for 5 min at 4 °C. A total of 2 mL of the supernatant was sucked into a 10 mL centrifuge tube and concentrated under reduced pressure at 40 °C in a vacuum centrifuge concentrator. After concentration, 1 mL of 50% methanol was added for redissolution and stored in the dark at 4 °C. The extract was filtered through a 0.22 µm microporous membrane, and the contents of endogenous hormones indole-3-acetic acid (IAA), gibberellin A3 (GA3), abscisic acid (ABA), zeatin (ZT) and salicylic acid (SA) in alfalfa were determined by ultra-fast liquid chromatography using Waters Arc quadruple gradient.
The chromatographic conditions were as follows: column: Eclipse Plus C18 (4.6 mm × 250 mm, 5 μm); column temperature: 30 °C; injection volume: 5 μL; variable wavelength detector (VWD) wavelength: 254 nm; flow rate: 1.0 mL·min−1; quantitative method: external standard peak area method; and the gradient of the mobile phase is shown in Table 1.

2.4. Statistical Analyses

Microsoft Excel 2010 software was used for data organization and calculation. Graphs were made using GraphPad 8.0.2 software. Correlation analysis heat maps and PCA plots were produced using OriginPro software. A one-way analysis and two-way analysis of variance followed by Duncan’s multiple range test were performed using SPSS 25.0 software. The graphs of the path analysis and correlation analysis were drawn using Microsoft PowerPoint 2010.
Path analysis reflects the linear relationship between multiple independent and dependent variables. In this study, we investigated the role of phenotypic traits and physiological indicators on plant height in alfalfa through path analysis. First, we used SPSS 25.0 software to perform regression analysis on each trait index to derive correlation coefficients and direct through-path coefficients and then calculated indirect effect coefficients and decision coefficients in Excel 2010 software using the following equations.
In the equation, rijPjy reflects the indirect impact of the independent variable xi on the dependent variable y through the independent variable xj. Rij is the simple correlation coefficient between xi and xj. Riy represents the simple correlation coefficient between the independent variable xi and the dependent variable y. Piy is the direct path coefficient, reflecting the direct impact of the independent variable xi on the dependent variable y. The decision coefficient is a positive number, indicating that xi has an enhancing effect on y, with the maximum being the main determining factor. If it is a negative number, it indicates that xi has a limiting effect on y and the minimum value is the main limiting factor [31].
(iii)
Path analysis:
Indirect path coefficient = rij × Pjy
Decision coefficient: R2 = 2Pijriy-P2iy

3. Results

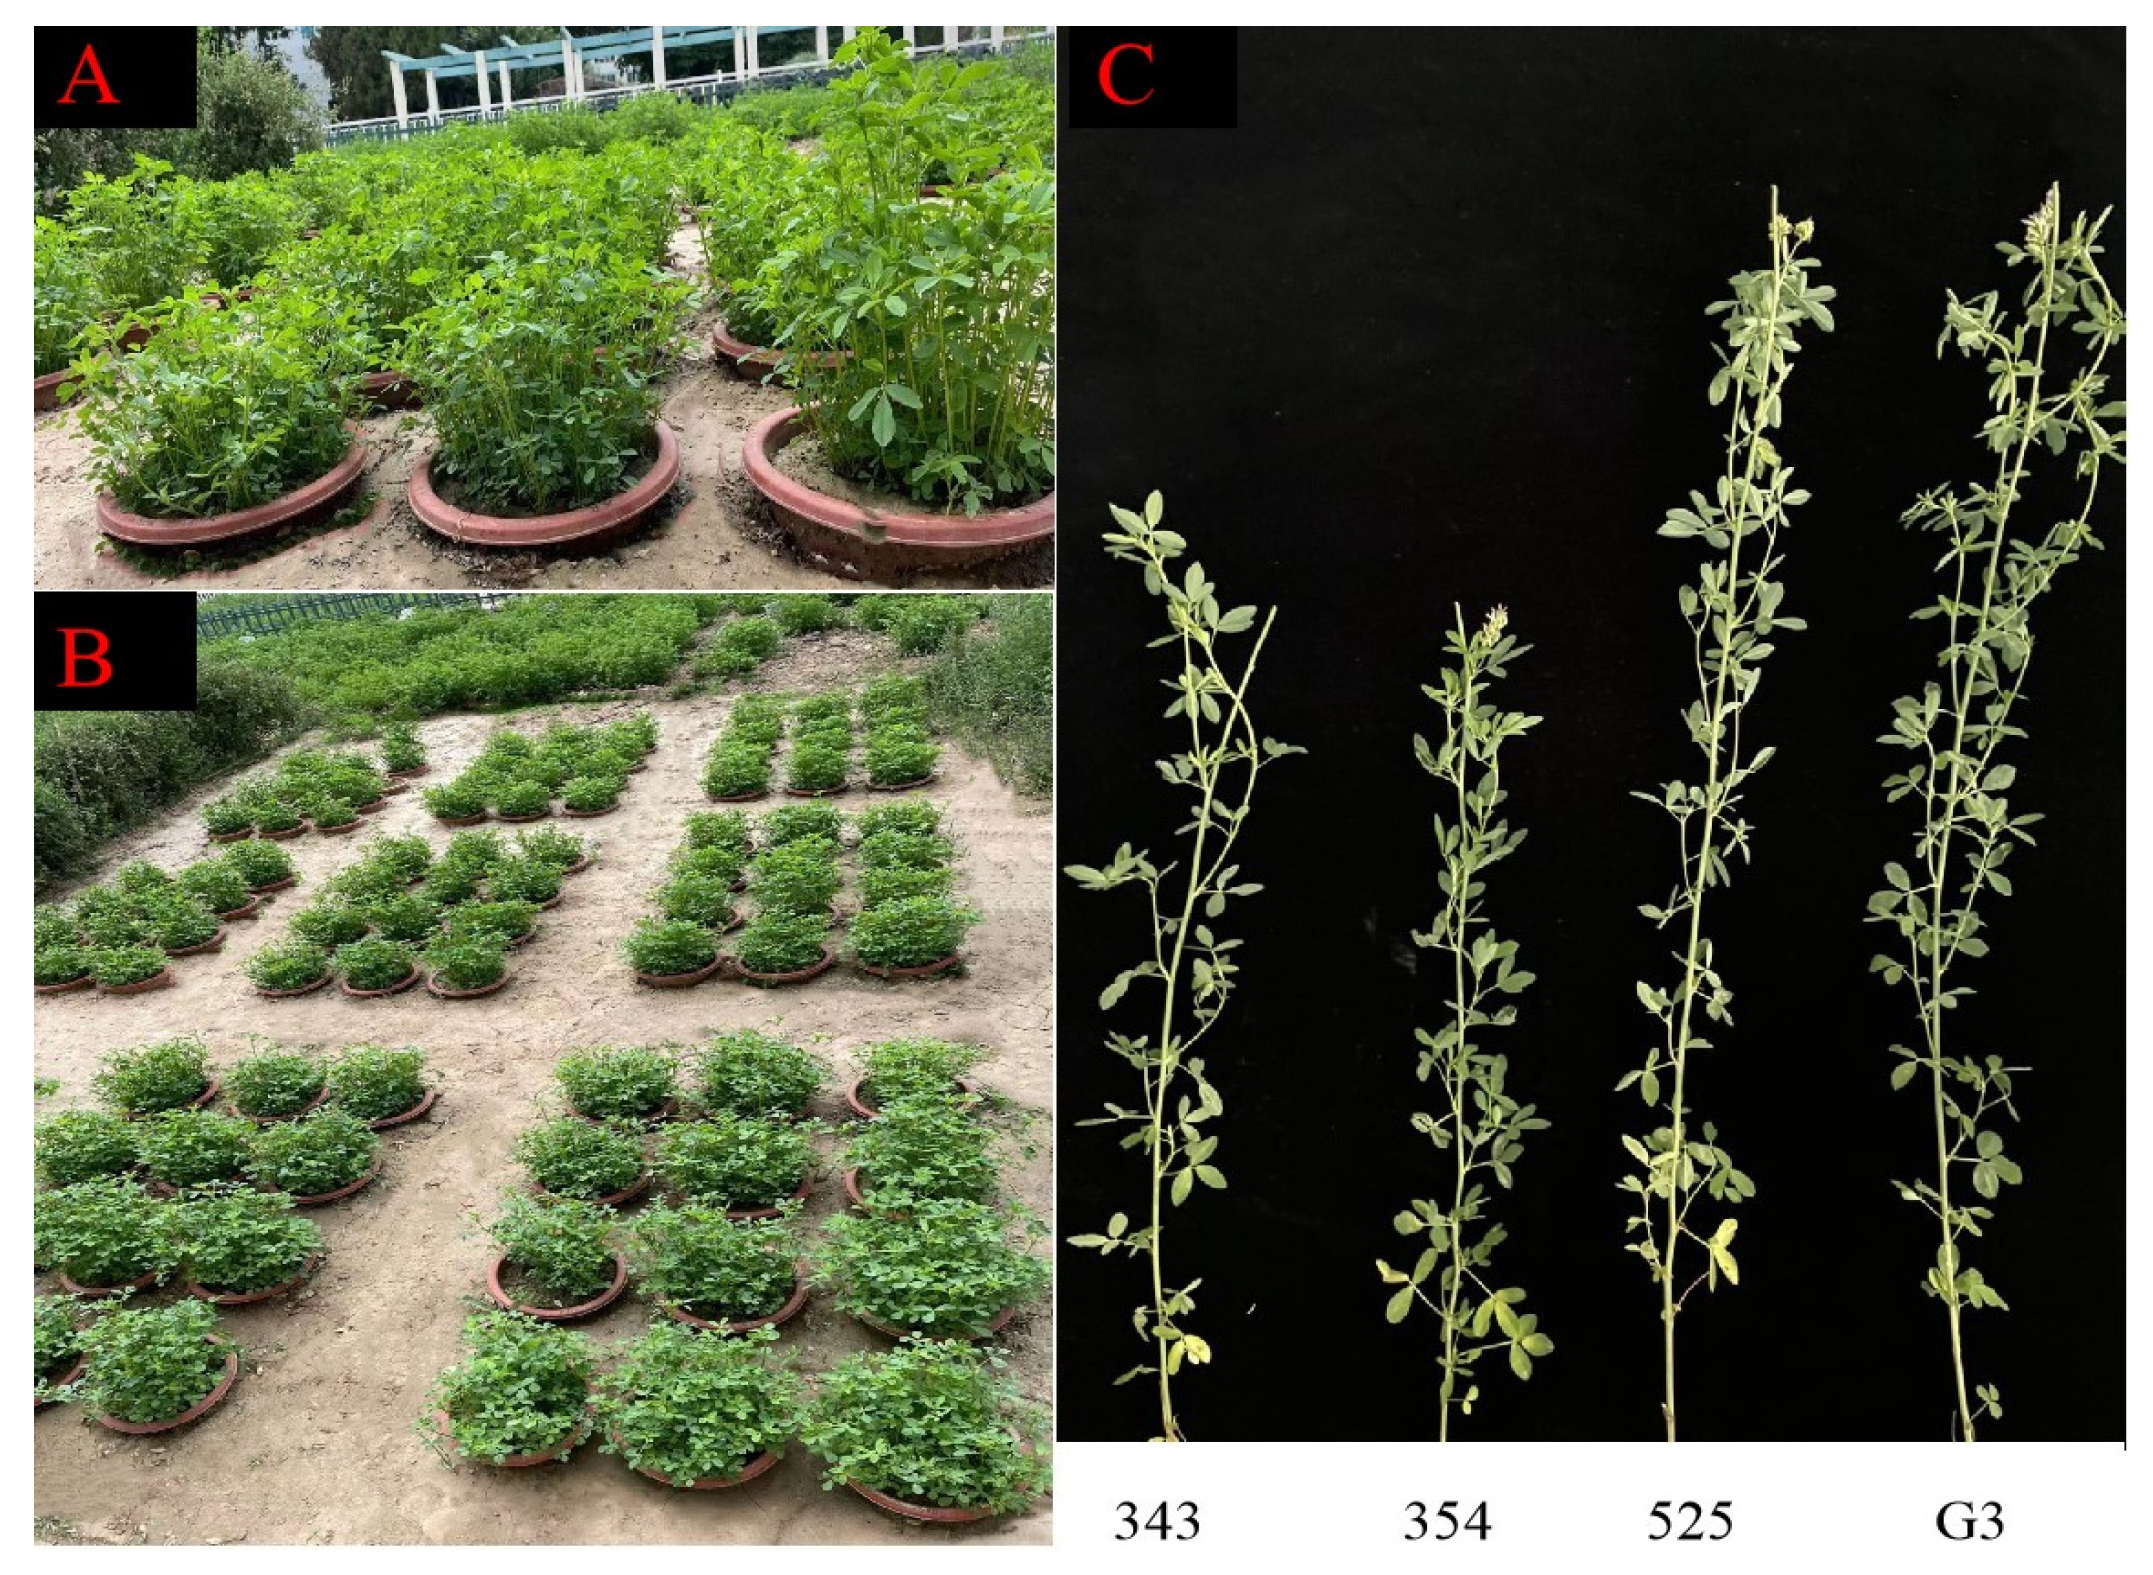
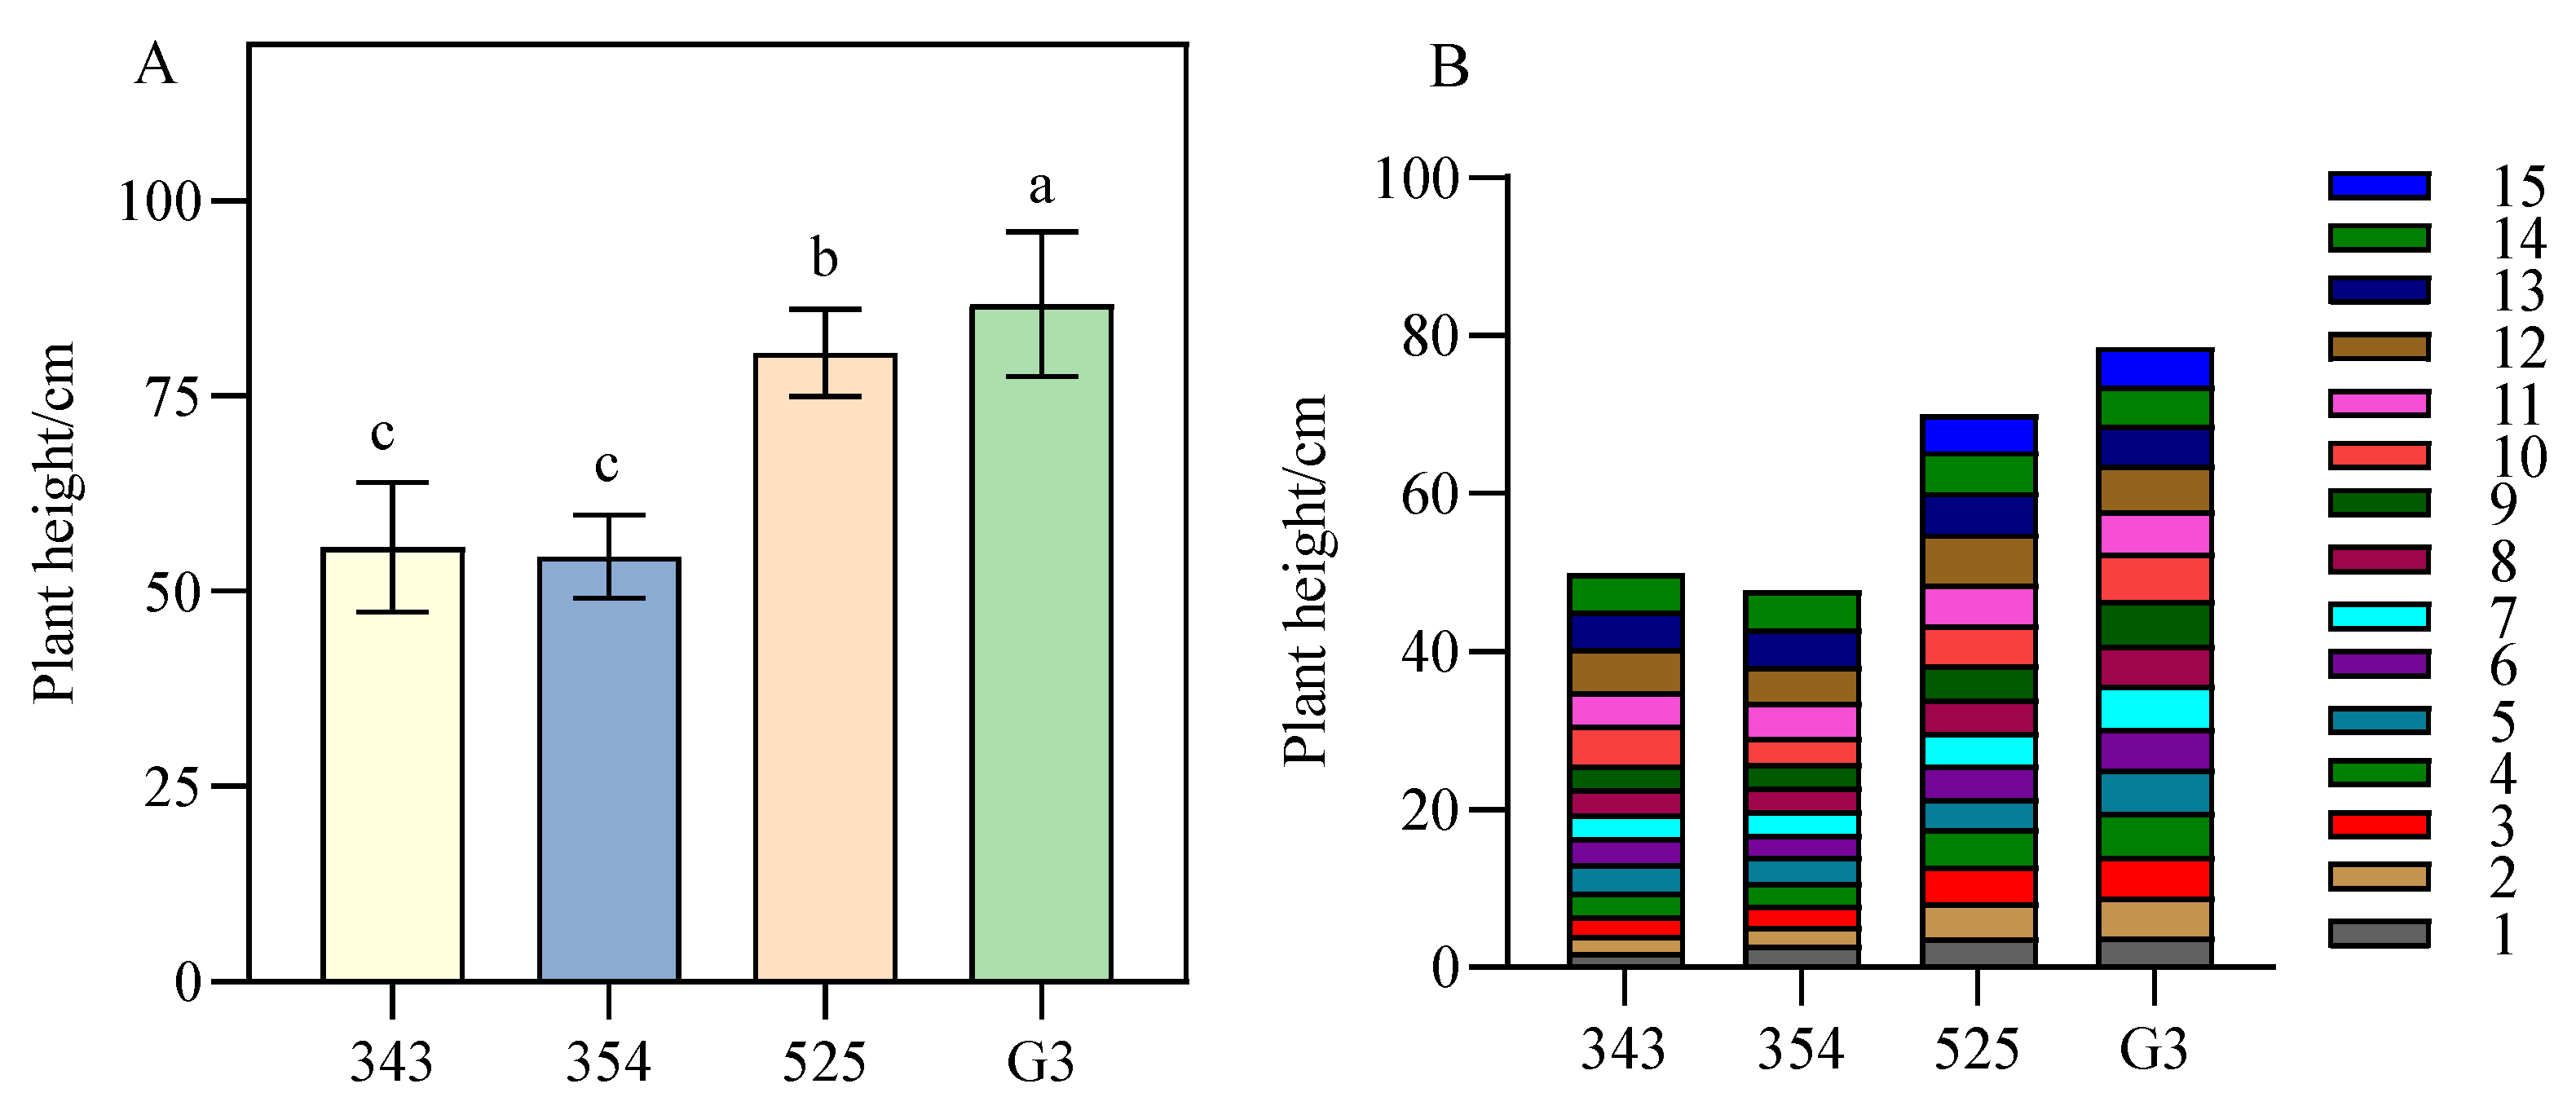
3.1. Differences in Plant Height between Tall- and Short-Stalk Alfalfa Materials

The plant height of the tall-stem alfalfa material was significantly higher than that of the dwarf, and the dwarf alfalfa exhibited a significantly shorter and more compact main stem internode length (Figure 2). The plant heights of tall alfalfa materials 525 and G3 were 80.58 cm and 86.77 cm, respectively, while the plant heights of dwarf materials 343 and 354 were 55.65 cm and 54.46 cm, respectively, and the mean value of tall alfalfa was 51.97% higher than that of the dwarf alfalfa.

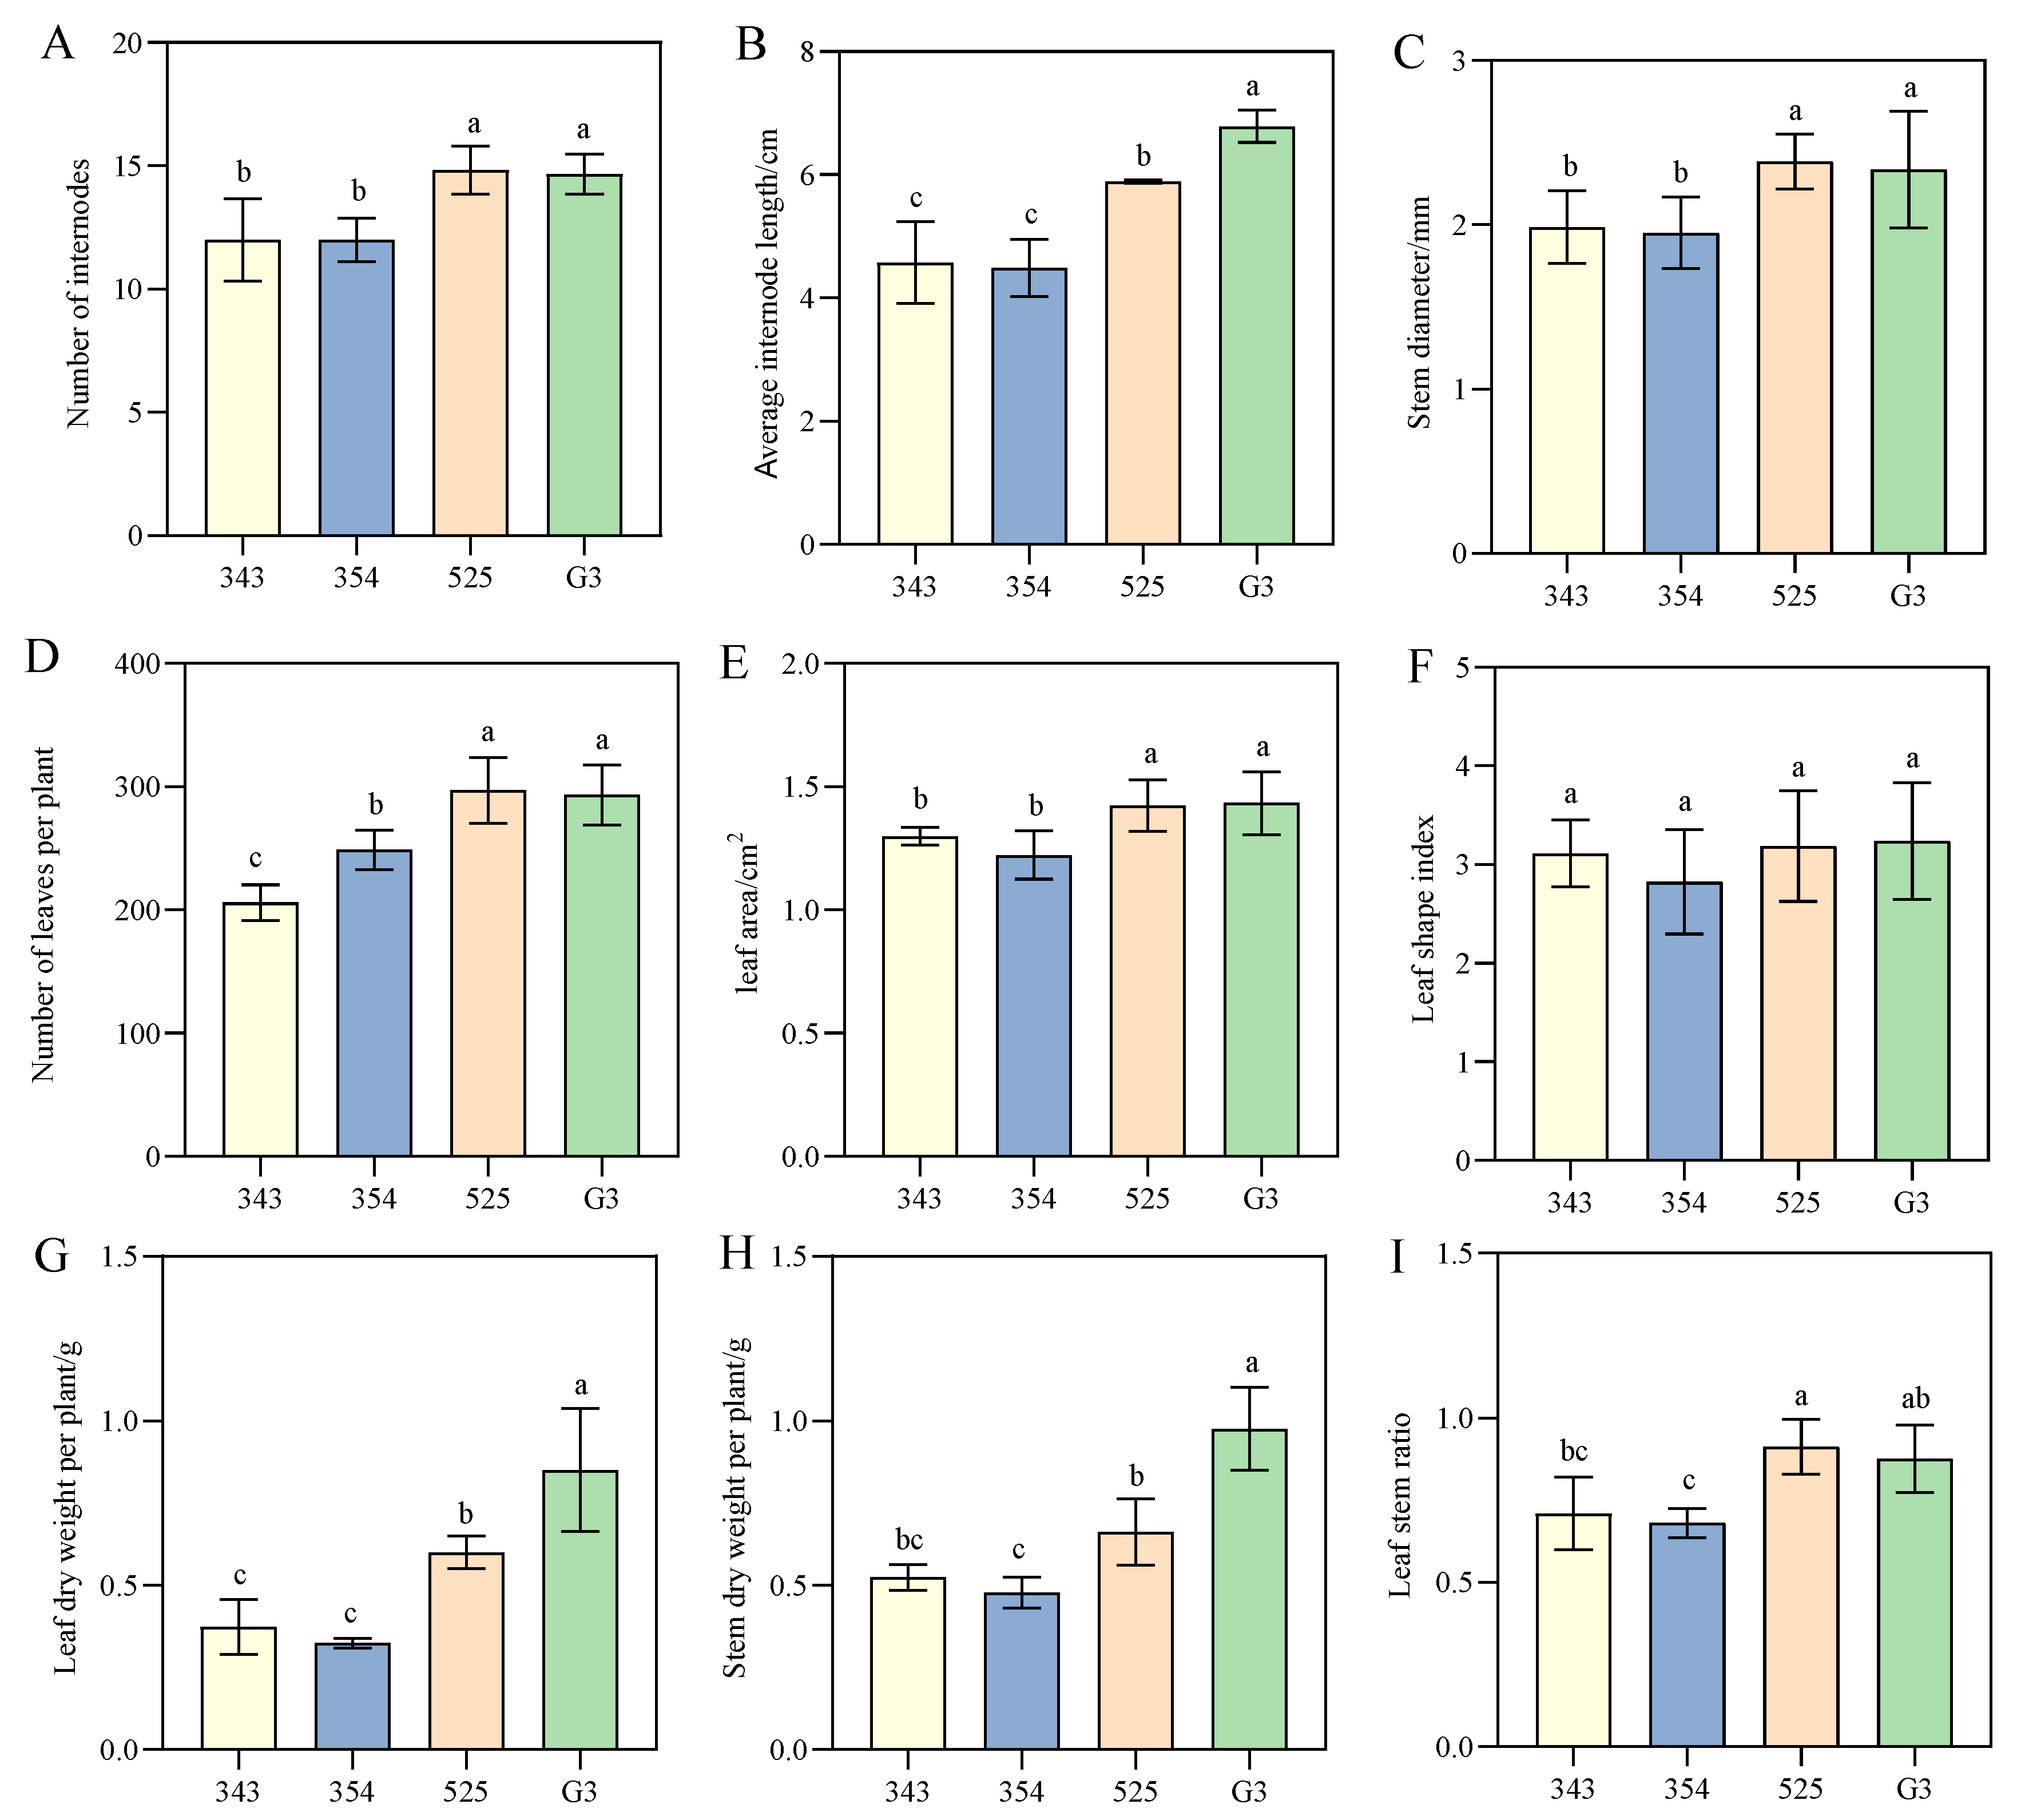
3.2. Differences in Phenotypic Traits between Tall- and Short-Stalk Alfalfa Materials

There were significant differences in the phenotypic trait indexes of tall- and short-stem alfalfa materials, among which stem diameter and average internode length of tall-stem materials were significantly higher than those of short-stem materials (Figure 3). However, there is no significant difference in the number of internodes between tall- and short-stem alfalfa materials. The average internode length and stem diameter of tall-stem materials were 39.80% and 19.89% higher than those of dwarf-stem materials, respectively.
The number of leaves per plant and leaf area of the tall material were significantly higher than those of the dwarf material, and the difference in leaf shape index was not significant. The number of leaves per plant of high-stem alfalfa materials 525 and G3 was 297.00 and 293.33, respectively, while the number of leaves per plant of dwarf-stem materials 343 and 354 was 206 and 248.67, respectively. The average value of high-stem materials was 29.84% higher than that of dwarf-stem materials. The mean leaf area was 1.43 cm2 for the tall material and 1.26 cm2 for the dwarf material, which was 13.26% higher for the tall than the dwarf.
The stem dry weight and leaf dry weight of the tall material were significantly higher than those of the dwarf material. Among the two high-stem materials, G3 had significantly higher stem and leaf dry weight per plant than 525, while the difference between the two short-stem materials was not significant. The leaf–stem ratio of 525 was significantly higher than that of dwarf materials, while the leaf–stem ratio of G3 was not significantly different from 343 but was significantly different from 354. The stem dry weight and leaf dry weight per plant of tall-stem materials were 63.53% and 107.81% higher than those of dwarf-stem materials, respectively. The average leaf–stem ratio of the tall material was 0.89 and that of the dwarf material was 0.70, which was 28.67% higher for tall than dwarf.

3.3. Differences in Photosynthetic Physiological Characteristics between Tall- and Short-Stalk Alfalfa Materials

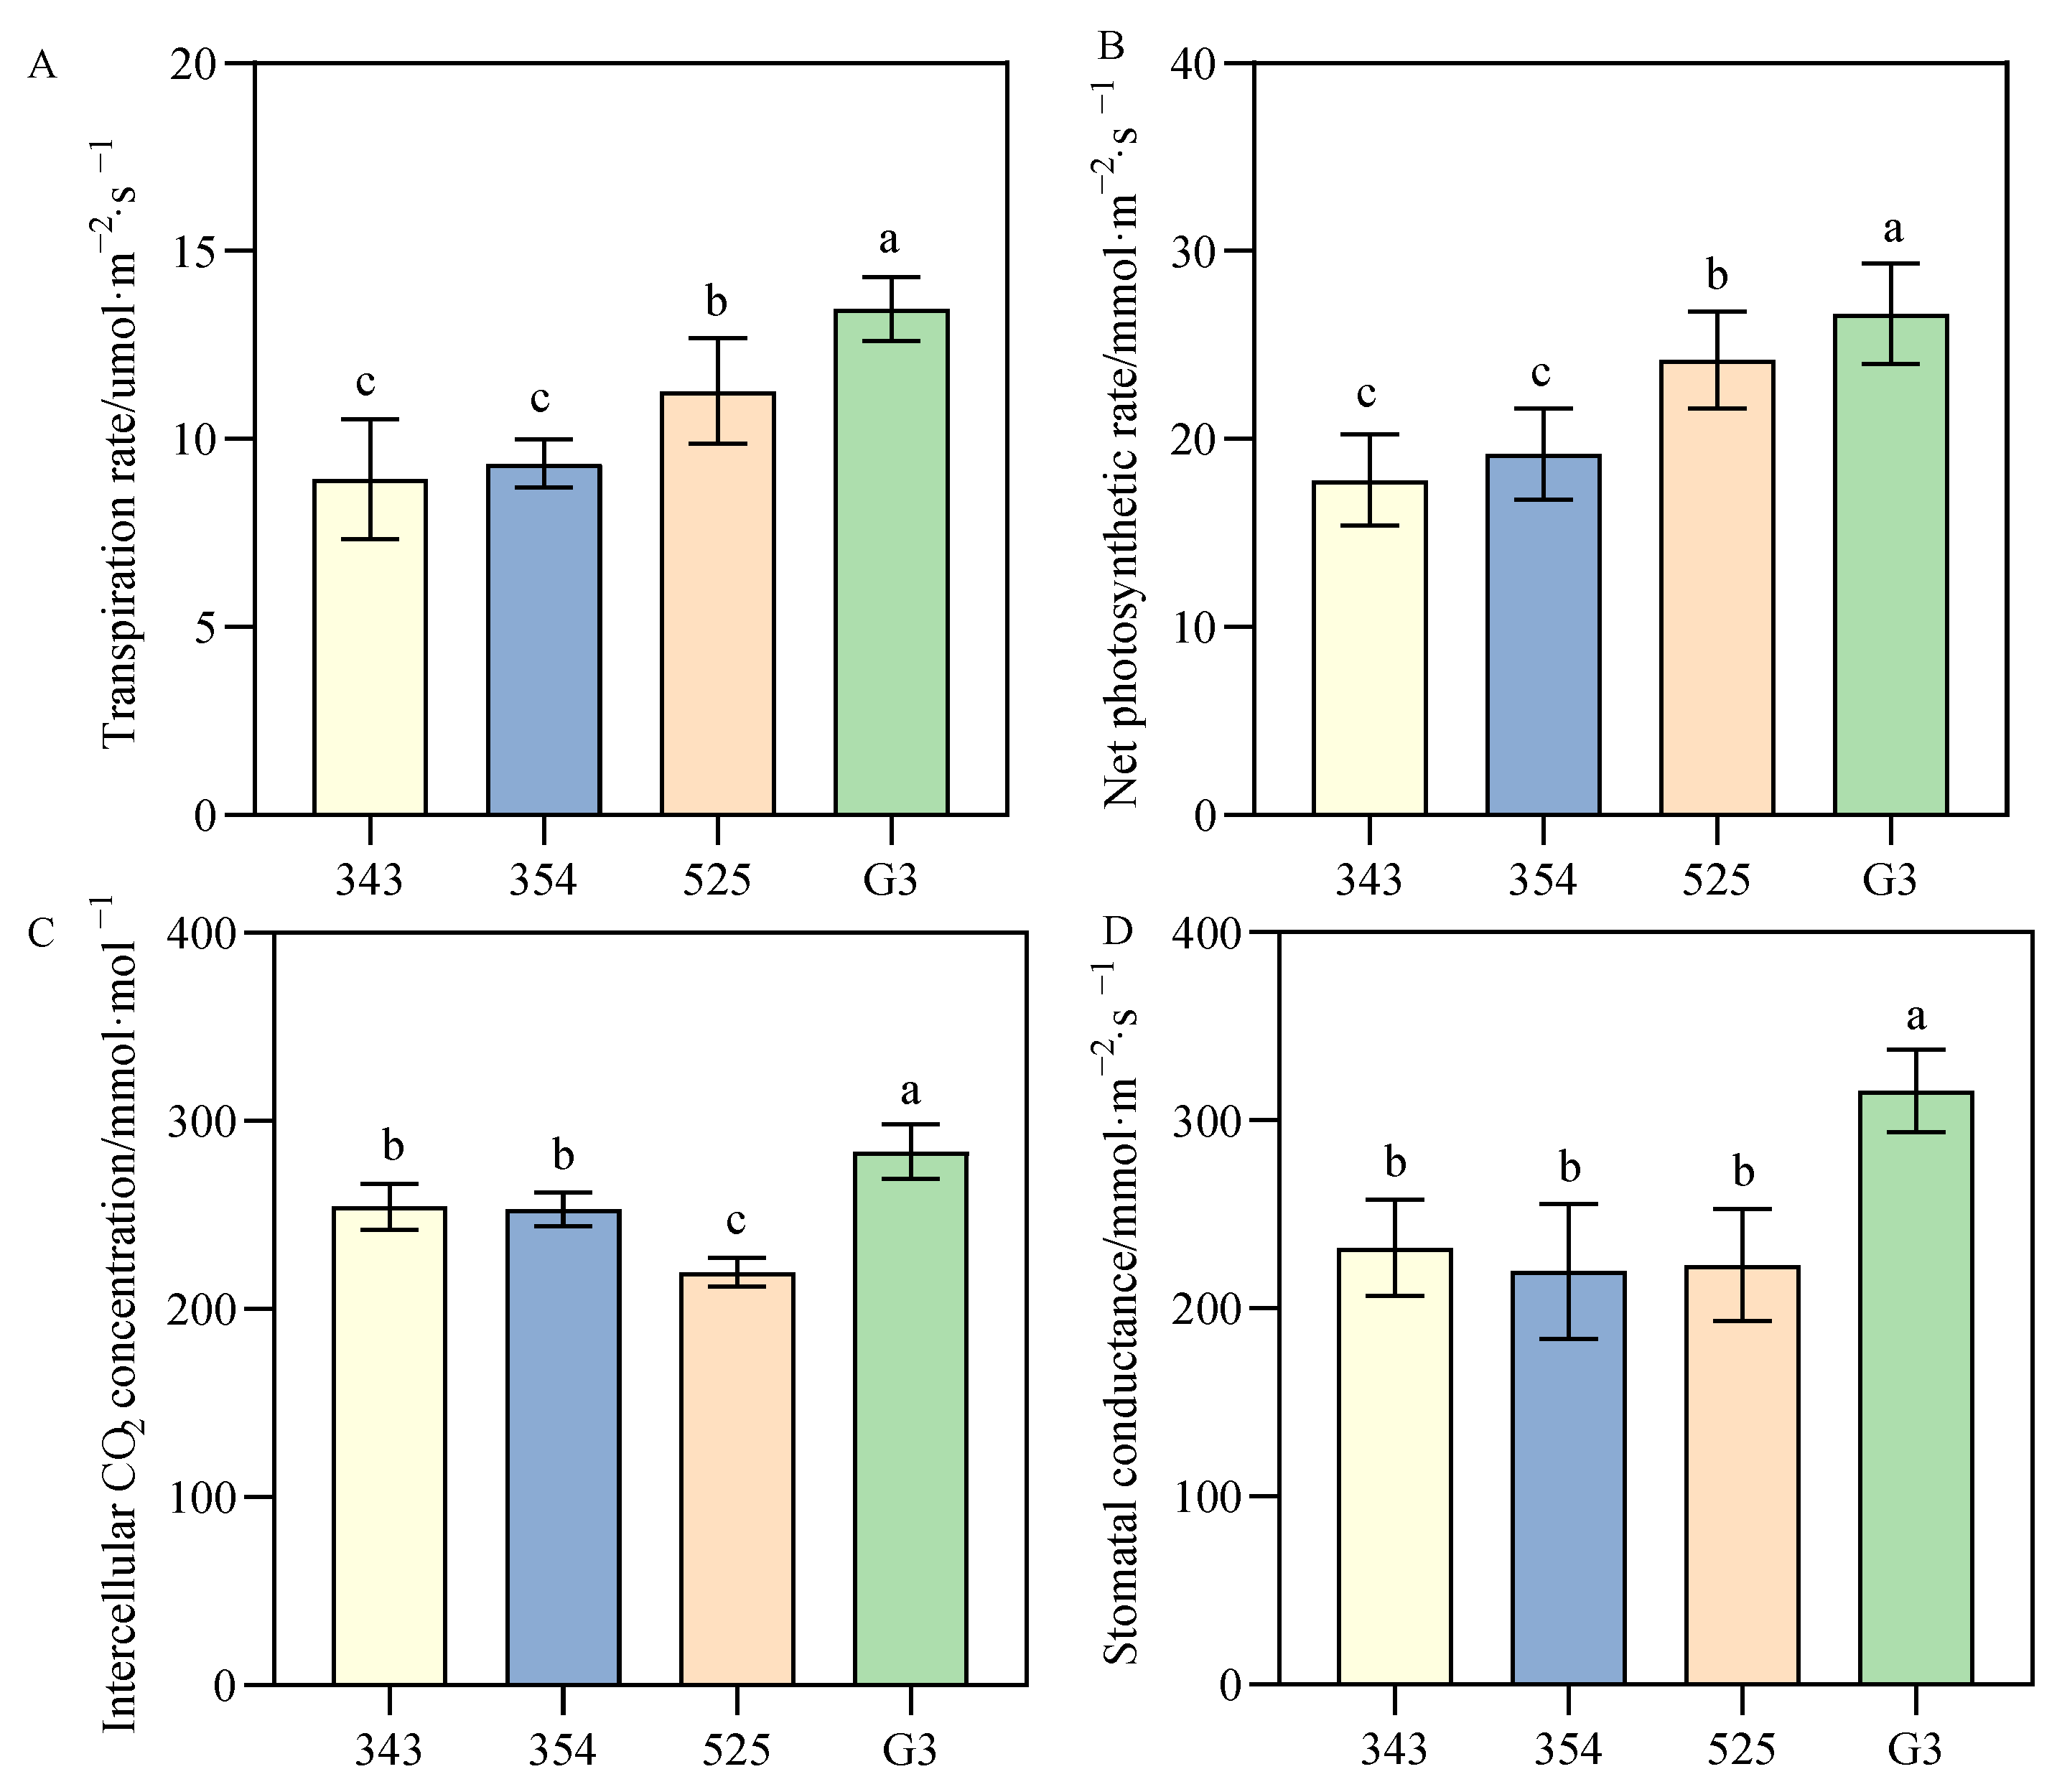
3.3.1. Differences in Photosynthetic Parameters between Tall- and Short-Stalk Alfalfa Materials

It can be seen that there were differences in the light and parameters of tall- and short-stem alfalfa materials (Figure 4). The average Tr, Pn, Ci and Gs of the two high-stem materials were 12.37 µmol·m−2·s−1, 25.44 mmol·m−2·s−1, 253.71 mmol·mol−1 and 269.47 mmol·m−2·s−1, respectively. While the photosynthetic parameter indicators of the two low-stem materials were 9.14 µmol·m−2·s−1, 18.52 mmol·m−2·s−1, 251.52 mmol·mol−1 and 225.93 mmol·m−2·s−1, respectively. The high-stem materials were 35.29%, 37.38%, −0.86% and 19.27% higher than the low-stem materials. Among them, G3 was 47.22%, 43.99%, 11.76% and 39.78% higher than the average dwarf photosynthetic parameter index. The Tr and Pn of tall-stem materials were significantly higher than those of short-stem materials. The Ci and Gs of G3 in tall-stem materials were significantly higher than those of other varieties, and the photosynthetic parameters of the two dwarf culm materials were not significantly different.

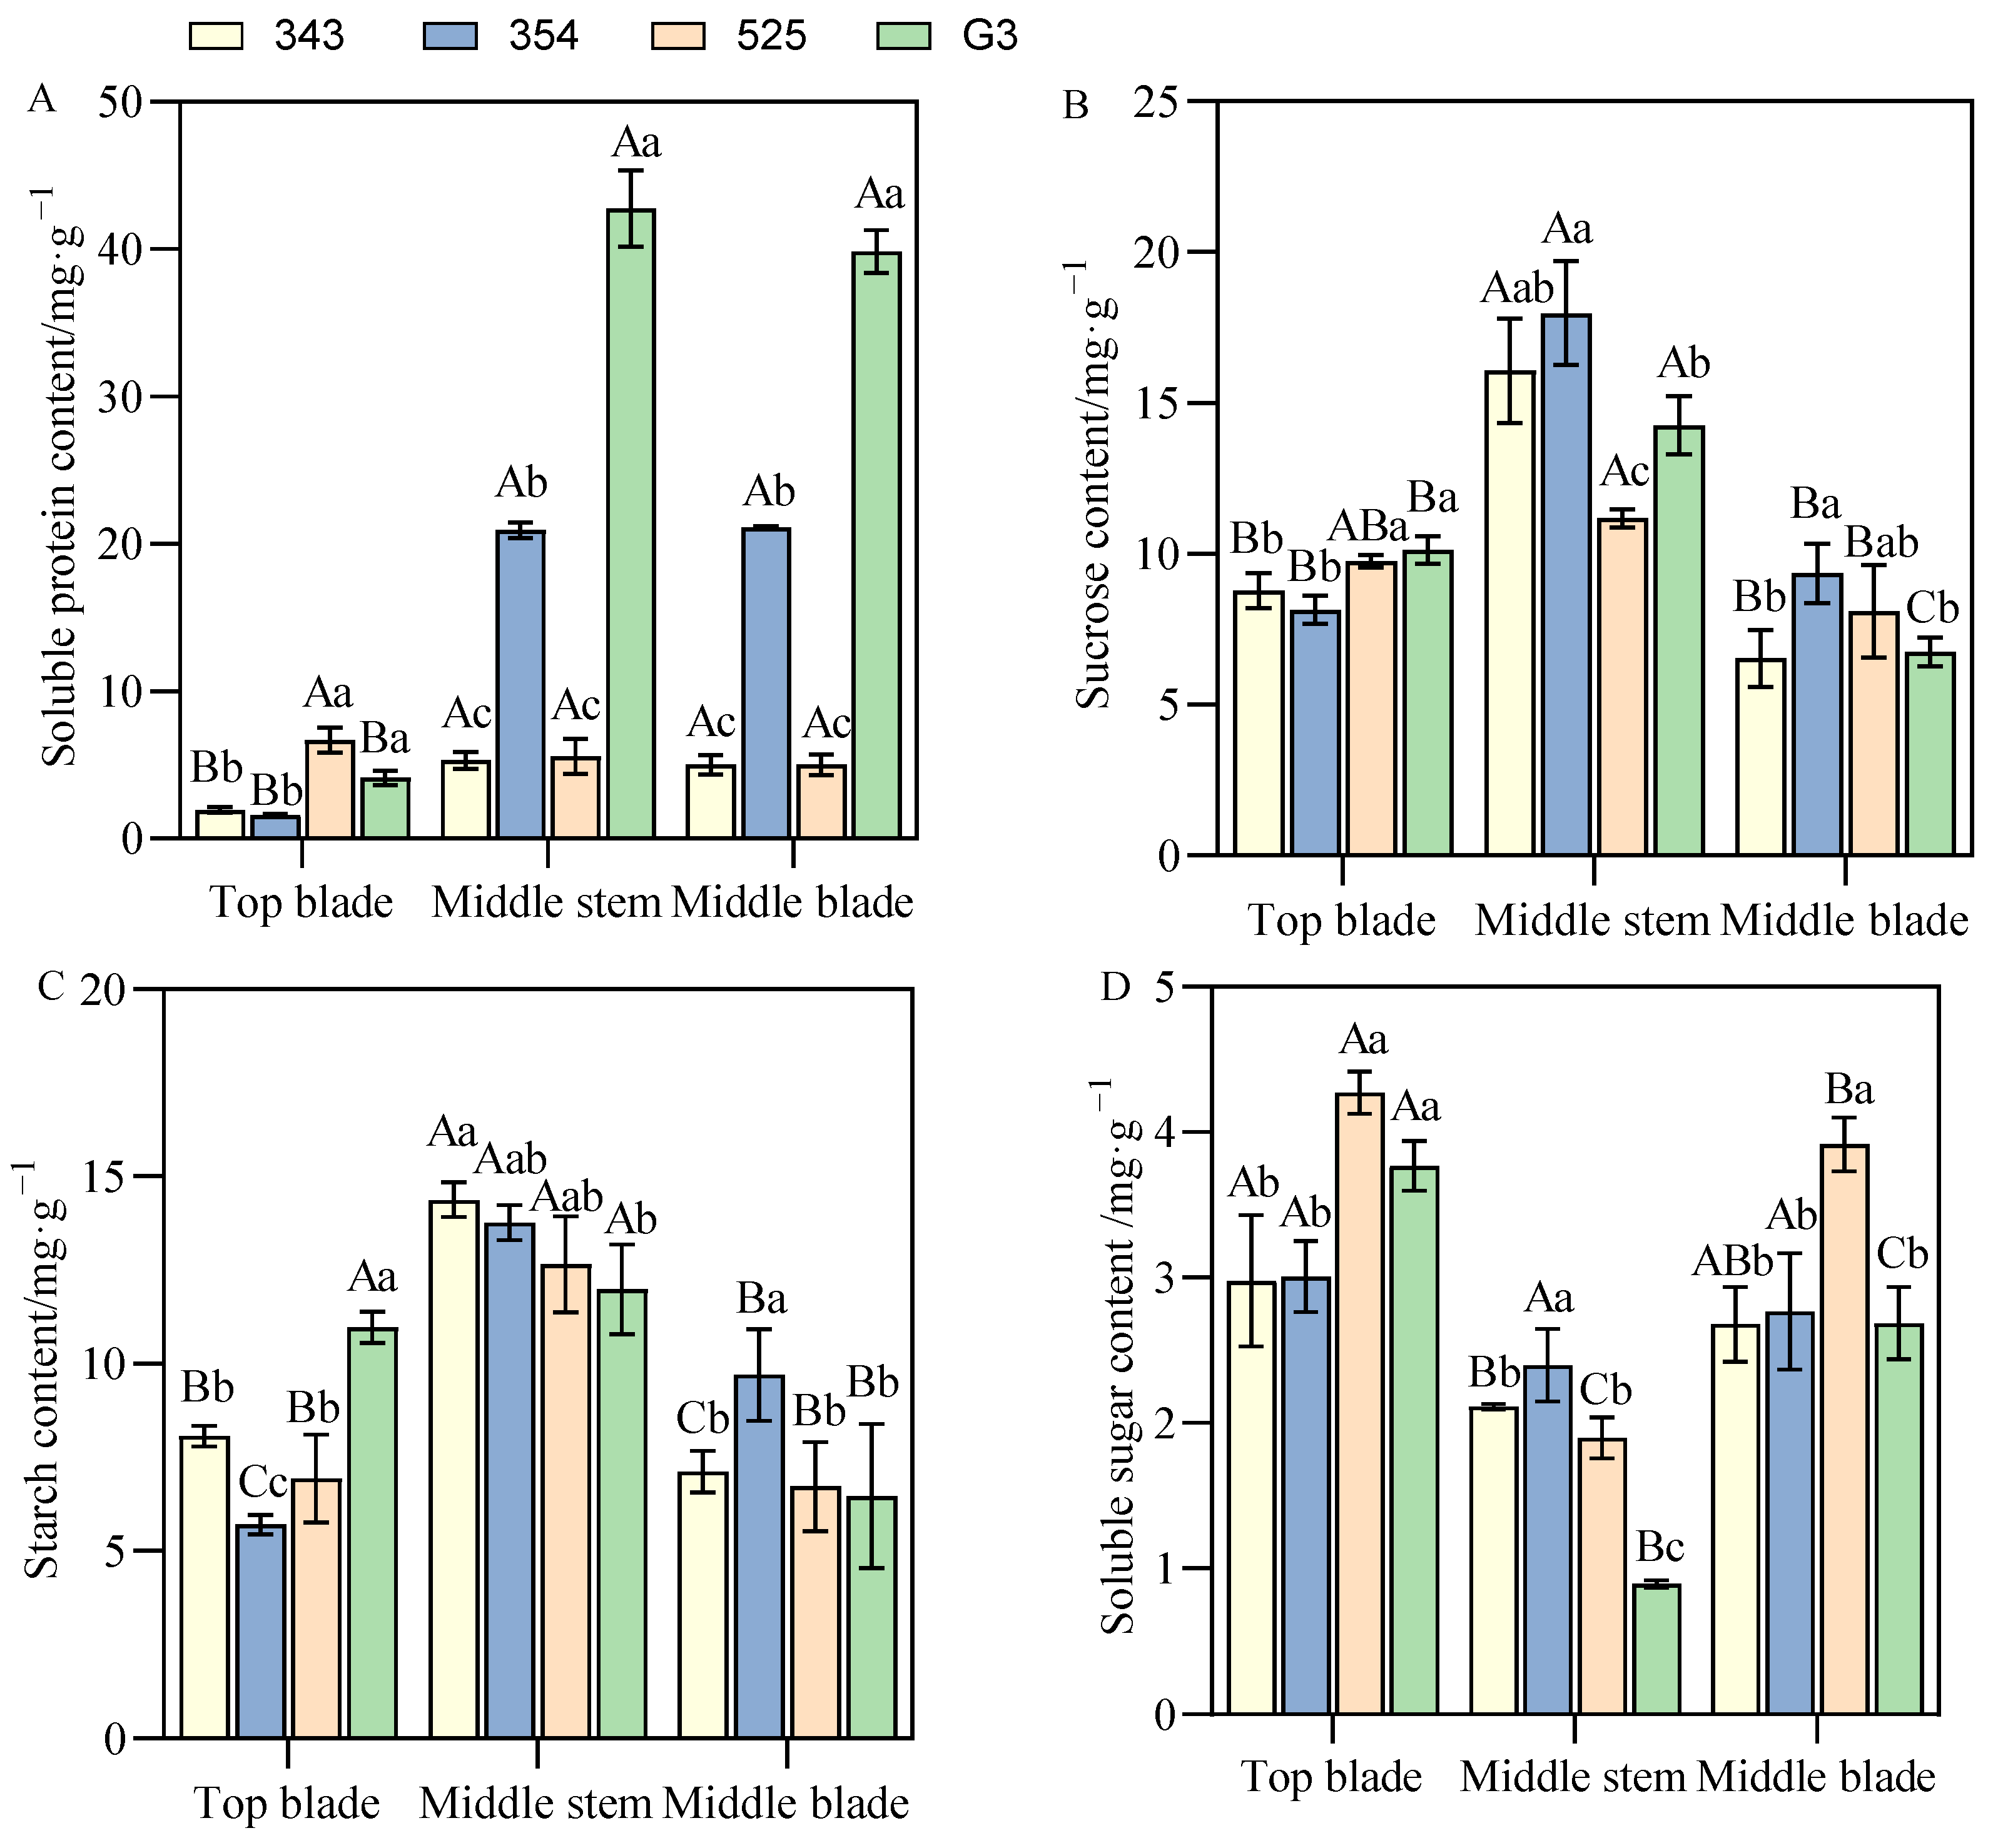
3.3.2. Differences in Photosynthetic Product Content between Tall- and Short-Stalk Alfalfa Materials

As can be seen from Figure 5, photosynthetic products of different parts of tall- and short-straw alfalfa materials were different. Upper leaves: The SP, Suc and SS contents of tall-stem alfalfa materials were significantly higher than those of short-stem materials, and the Sta content of G3 in tall-stem materials was significantly higher than that in short-stem materials. The average contents of SP, Suc, Sta and SS in the upper leaves of tall-stem materials were 6.68 mg·g−1, 9.95 mg·g−1, 8.96 mg·g−1 and 4.02 mg·g−1, respectively, while those of short-stem materials were 1.77 mg·g−1, 8.46 mg·g−1, 8.07 mg·g−1 and 2.99 mg·g−1, respectively. High-stem materials were 276.93%, 17.59%, 11.01% and 34.32% higher than short-stem materials.
Middle stem: the SP content of G3 was significantly higher than other materials, and the Suc, Sta and SS content of the middle stem of the dwarf material was 33.85%, 14.20% and 61.63% higher than that of the higher-stem material, respectively.
Middle leaves: The SP content of G3 was significantly higher than other varieties, followed by 354. The content of Suc and Sta in 354 was higher than other varieties. The SS content of 525 was significantly higher than other varieties.

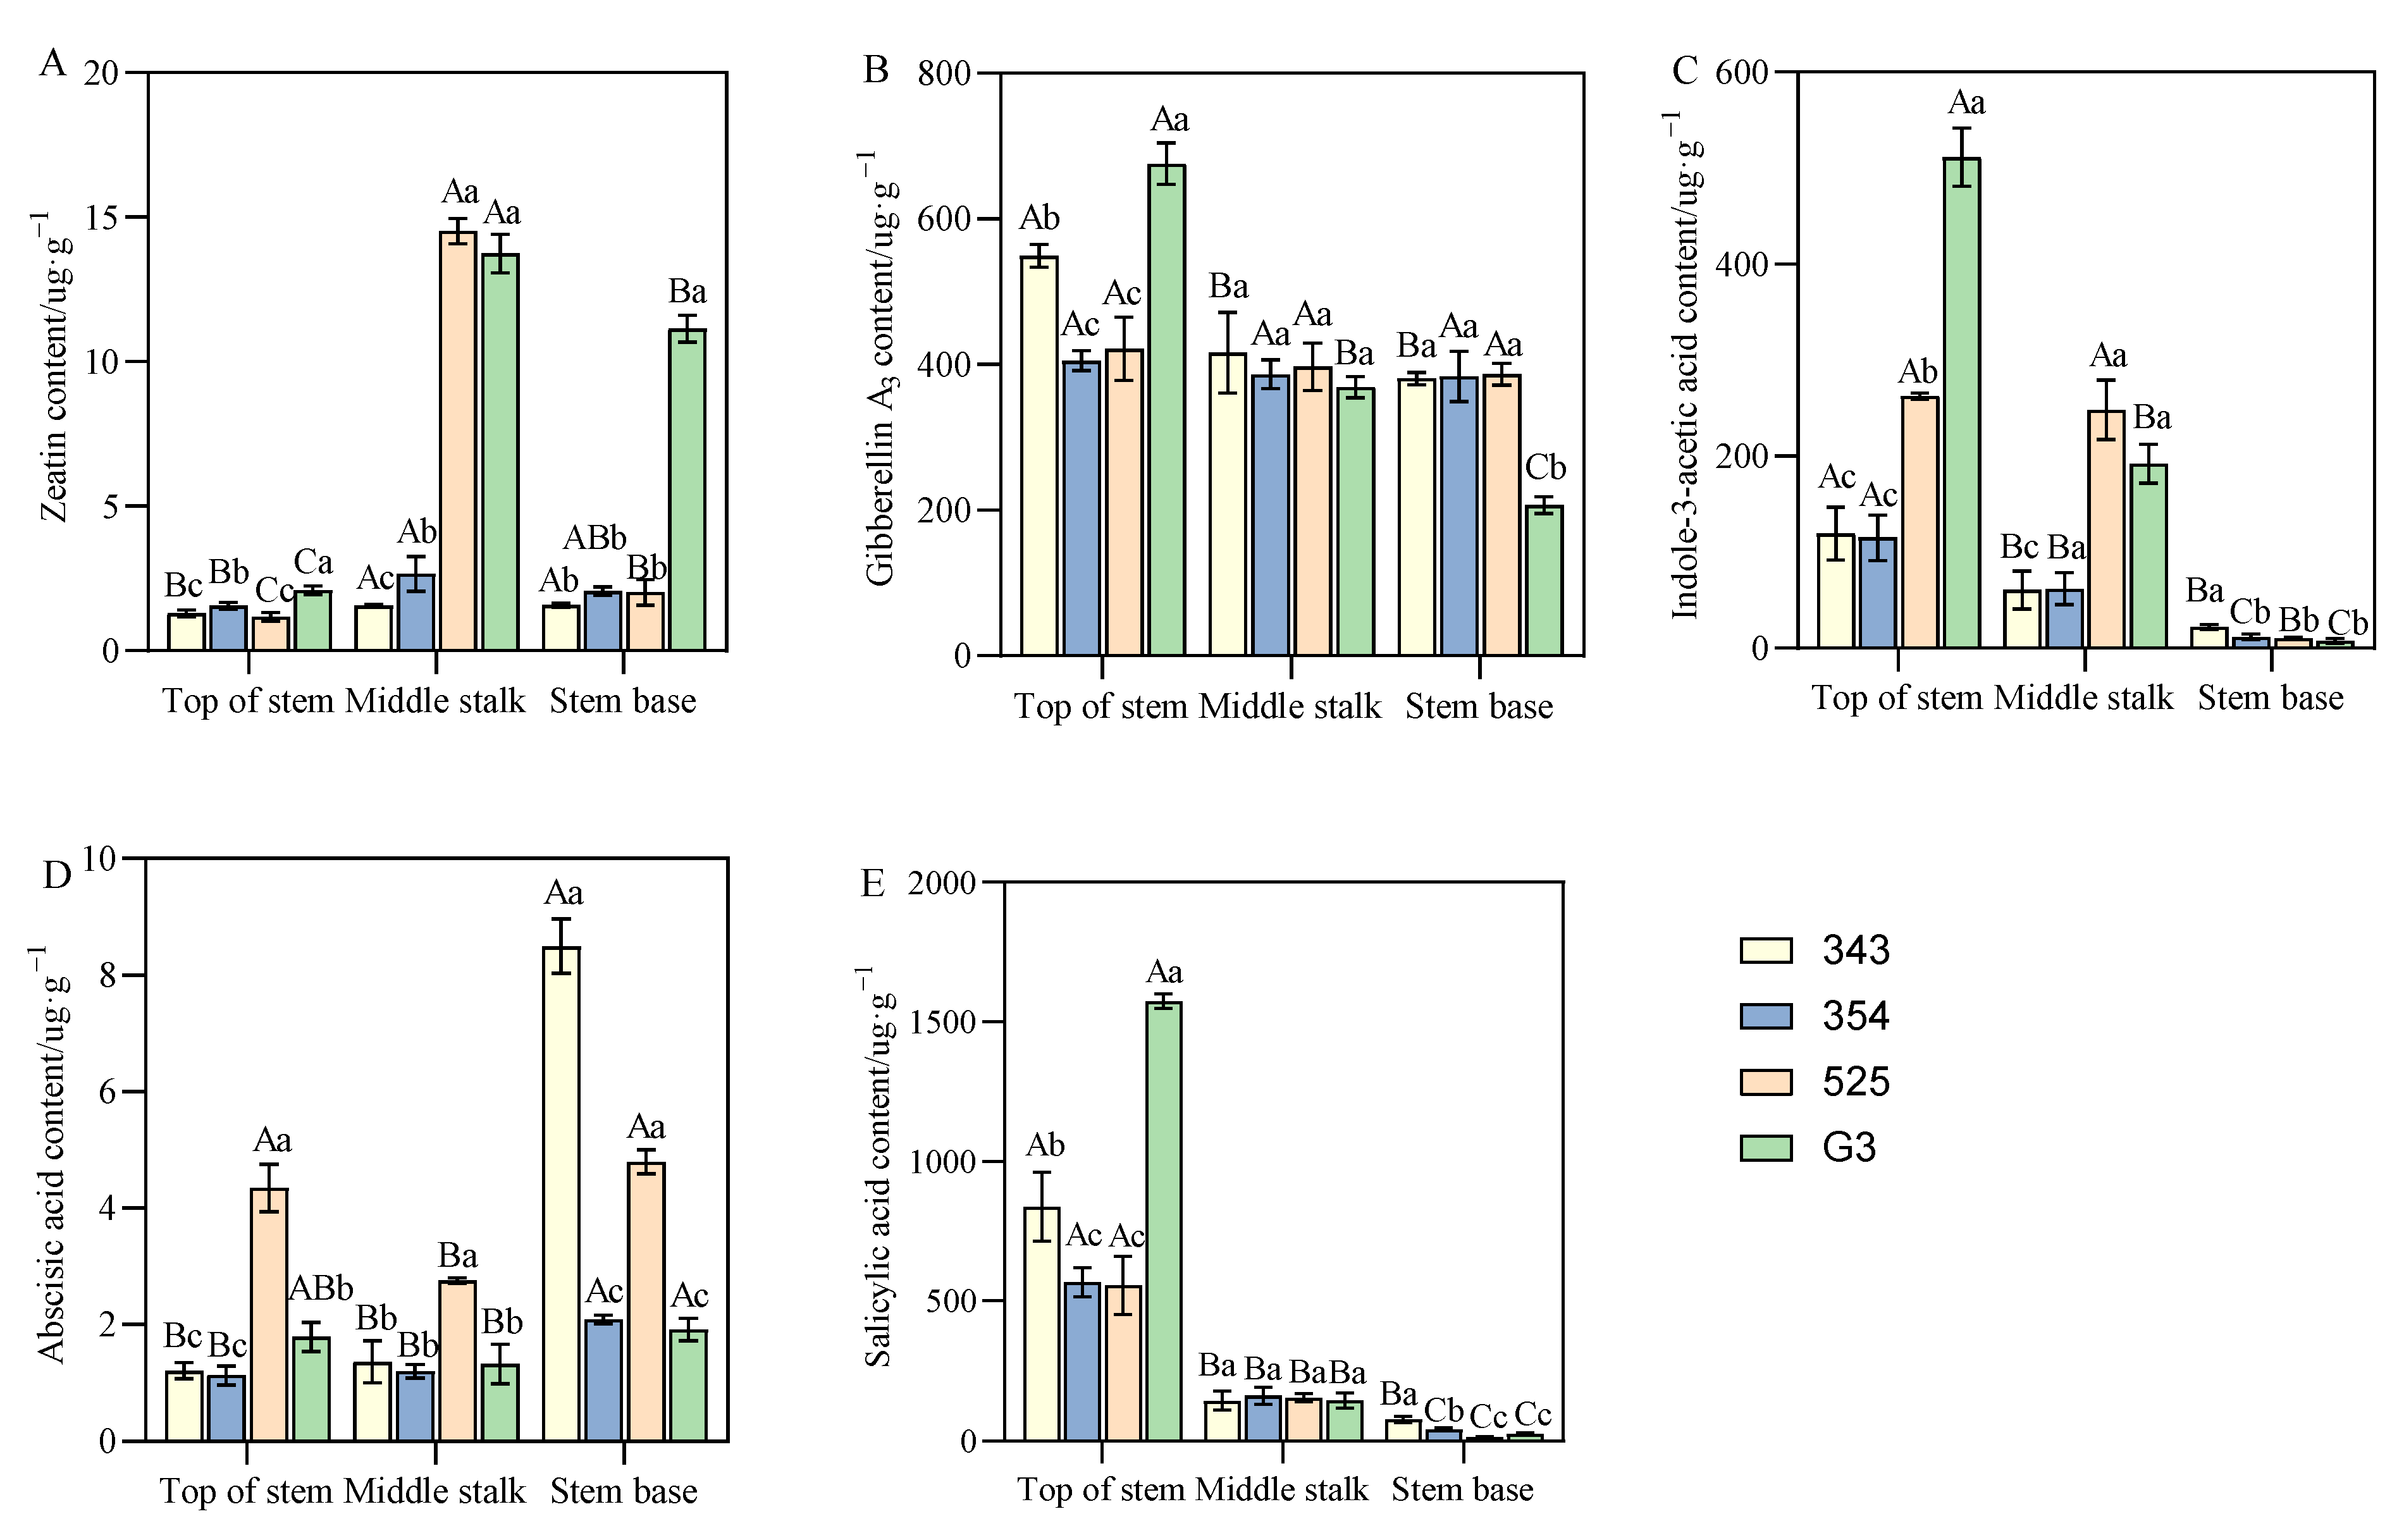
3.4. Differences in Endogenous Hormone Content between Tall- and Short-Stalk Alfalfa Materials

There were some differences in the endogenous hormone contents of different parts of the tall- and short-stalked alfalfa materials (Figure 6). Upper stalk hormone content: The ZT, GA3, IAA and SA content of the high-stem purple alfalfa material G3 were significantly higher than other varieties. The average IAA and ABA content of the two high-stem materials were 386.99 µg·g−1 and 3.07 µg·g−1, respectively, and the high-stem material was 230.22% and 162.63% higher than the short-stem material.
Hormone contents in the middle stalks: The average ZT and IAA contents of the two tall-stem materials were 14.13 µg·g−1 and 220.12 µg·g−1, respectively, and the average ZT and IAA contents of the two short-stem materials were 2.11 µg·g−1 and 61.25 µg·g−1, respectively. The ZT and IAA contents of the two tall-stem materials were significantly higher than the short-stem materials, with an increase of 570.83% and 259.40%, respectively. The GA3 and SA contents of tall-culm material and dwarf-culm were not significantly different, and the ABA content of 525 was higher than other varieties.
Endogenous hormones in the basal stem: The ZT content of G3 was significantly higher than other materials, while the IAA, ABA and SA content of 343 was higher than other varieties. The average GA3, IAA and SA contents of the two tall-stem materials were 296.98 µg·g−1, 17.00 µg·g−1 and 19.83 µg·g−1, respectively, and the average GA3, IAA and SA contents of the two short-stem materials were 382.31 µg·g−1, 9.16 µg·g−1 and 59.74 µg·g−1, respectively. The higher stems of the short-stem materials were 28.73%, 85.69% and 201.27% higher, respectively.

3.5. Correlation Analysis of Alfalfa Plant Height with Phenotypic and Physiological Indicators

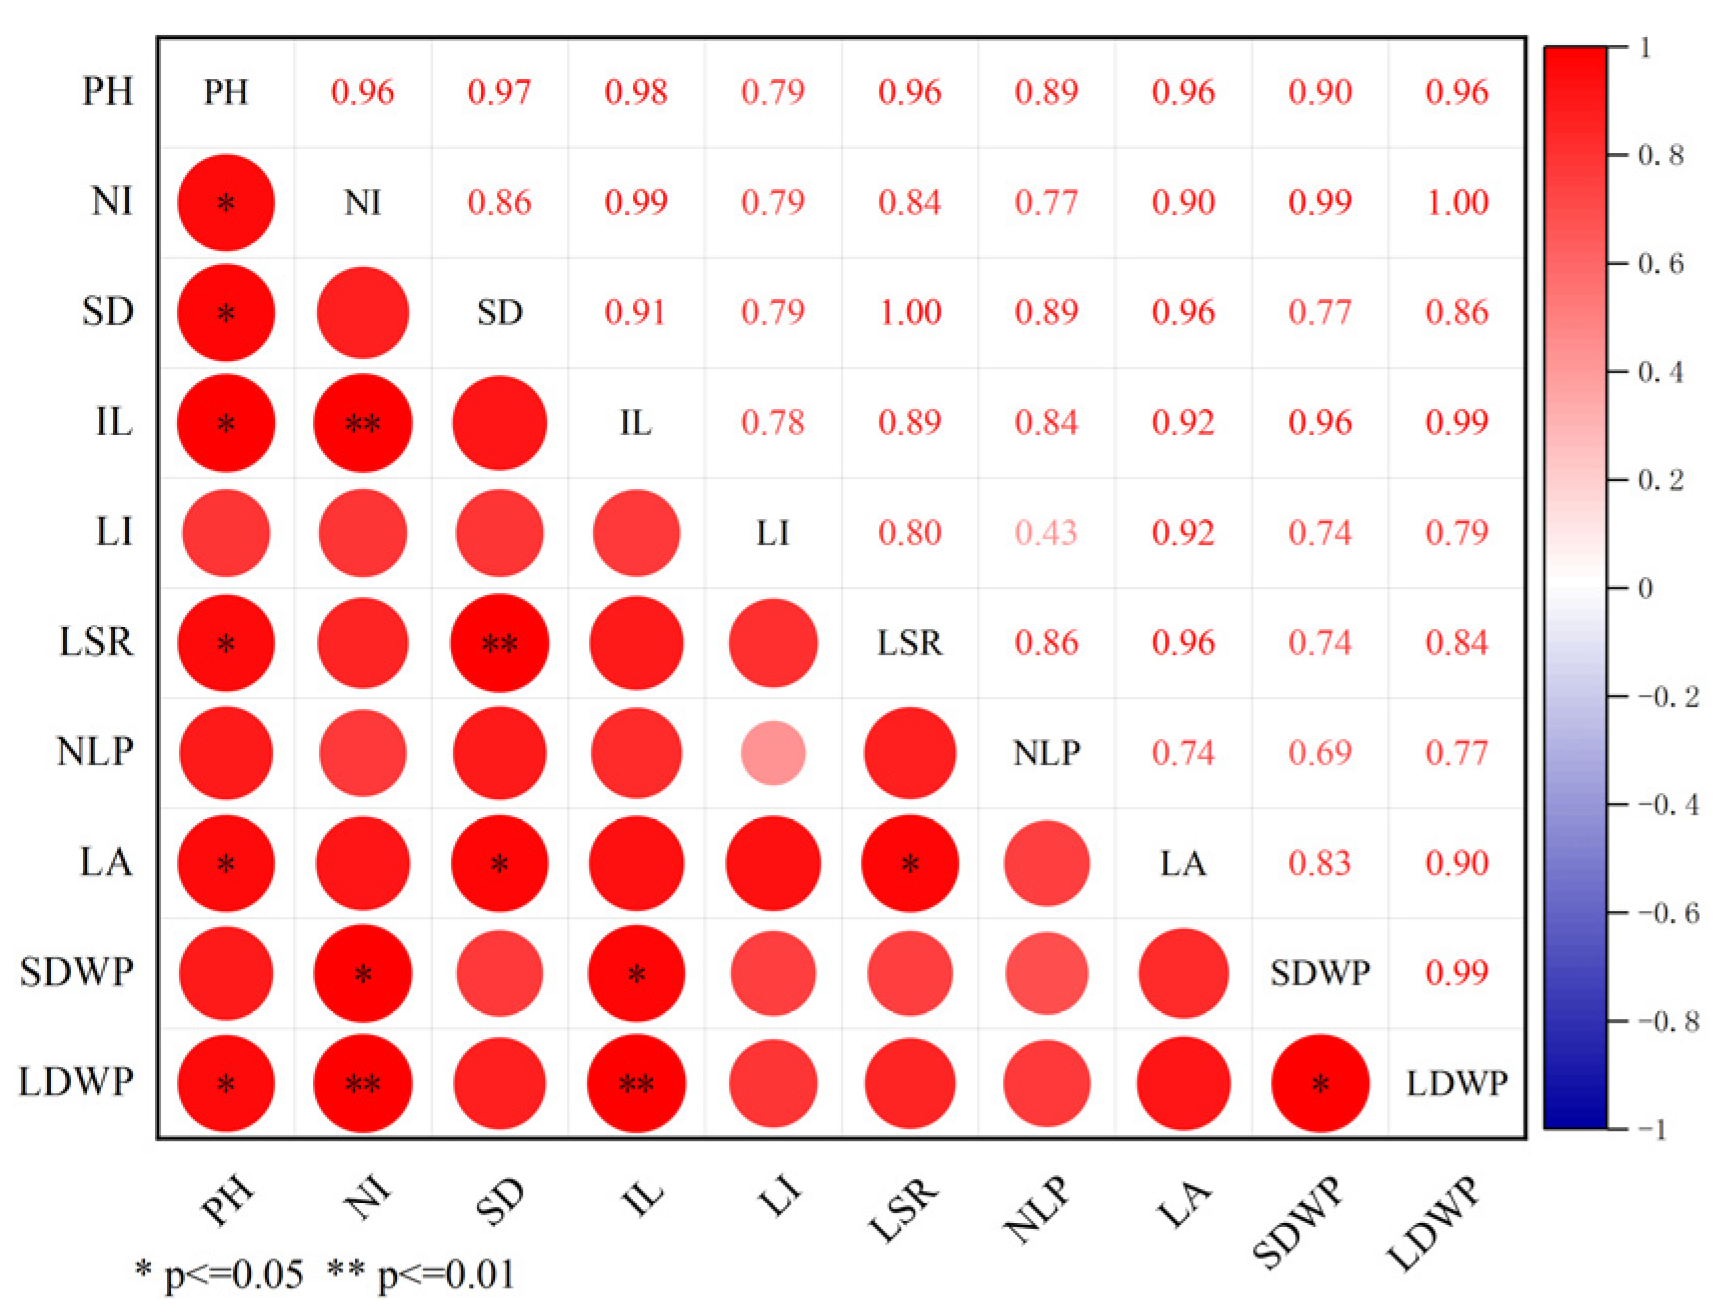
3.5.1. Correlation Analysis of Alfalfa Plant Height and Phenotypic Indexes

The correlation analysis between plant height and phenotypic indicators of tall- and short-straw alfalfa materials showed (Figure 7) that there was a significant and positive correlation between plant height and internode number, stem diameter, average internode length, leaf–stem ratio, leaf area and single plant leaf dry weight. The correlation was, in descending order: average internode length > stem diameter > leaf–stem ratio > internode number = single plant leaf dry weight > leaf area. The number of internodes and internode length were two important factors affecting plant height. Among which, the number of internodes was significantly positively correlated with the average internode length and single plant leaf dry weight, and there was a significant positive correlation with individual stem dry weight. The average internode length was highly significantly and positively correlated with the dry weight of leaves per plant, and there was a significant and positive correlation with the dry weight of stems per plant.

3.5.2. Correlation Analysis of Alfalfa Plant Height with Light and Physiological Indicators

The correlation analysis results of agronomic trait indicators (including internode number, stem diameter, average internode length, leaf–stem ratio, leaf area and single plant leaf dry weight) and light and physiological indicators that were significantly positively correlated with plant height are shown in Table 2. The plant height was highly significantly positively correlated with Pn and SP content in the upper leaves, significantly positively correlated with Tr and Suc content in the upper leaves, and significantly negatively correlated with Sta content in the middle stem. The order of correlation from large to small was upper leaves SP > Pn > upper leaves Suc > middle stem Sta > Tr. The number of internodes and the length of internodes were important indicators that affected plant height. Among them, the number of internodes was highly significantly positively correlated with Tr, significantly positively correlated with Pn, SP and Suc content in the upper leaves, and significantly negatively correlated with Sta and SS content in the middle stem. The average internode length was highly significantly positively correlated with Tr, significantly positively correlated with Pn and Suc content in the upper leaves, and significantly negatively correlated with Sta and SS content in the middle stem.

3.5.3. Correlation Analysis between Alfalfa Plant Height and Endogenous Hormone Content

The correlation analysis results between important agronomic traits and endogenous hormone content of high dwarf alfalfa varieties are shown in Table 3. There was a significant positive correlation between plant height and the content of ZT and IAA in the middle of the stem. The average internode length was significantly and positively correlated with ZT in the upper part of the stalk.

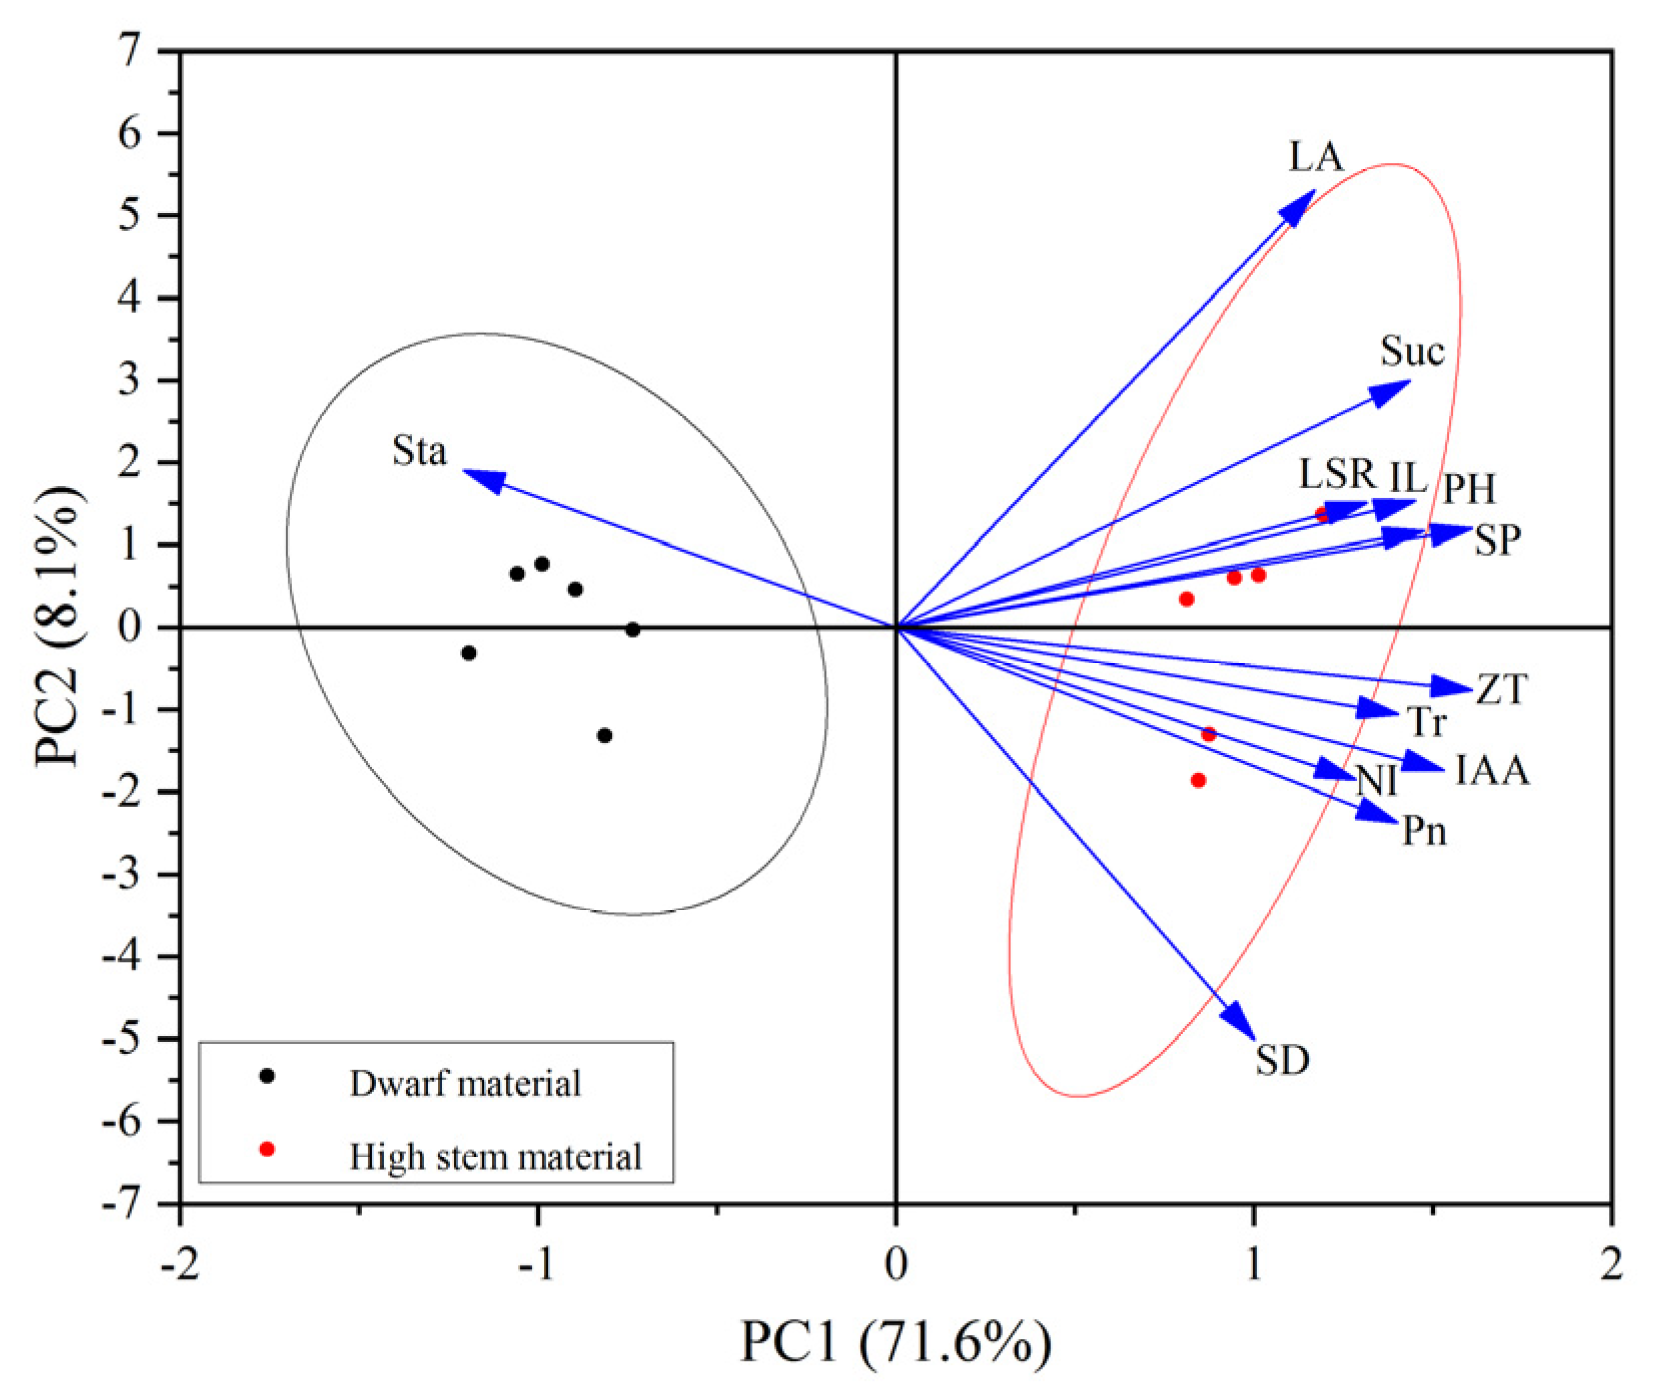
3.6. Principal Component Analysis of Alfalfa Plant Height and Phenotypic Traits and Physiological Indicators

The trait indicators that were significantly correlated with alfalfa plant height were screened by correlation analysis, including phenotypic traits (internode number, stem diameter, average internode length, leaf–stem ratio and leaf area), photosynthetic physiological indicators (Pn, Tr, upper leaf SP, Suc content and middle stem Sta content), and hormone content (middle stem ZT and IAA) (Figure 8). The PCA plots are based on the principal component analysis of plant height, phenotypic traits and physiological indicators. The first and second principal components explained 71.6% and 8.1% of the total variables, respectively. With a clear distinction between tall- and short-stalked materials and a large degree of dispersion that did not affect each other, indicating that there were significant differences in the traits affecting alfalfa plant height. Among them, the middle stalk Sta content had a greater influence on the dwarf material, while the tall material was closely related to the upper leaf Suc content, leaf–stem ratio, mean internode length, plant height, upper leaf SP content, middle stalk ZT, Tr, middle stalk IAA, number of internodes, Pn and stem thickness.

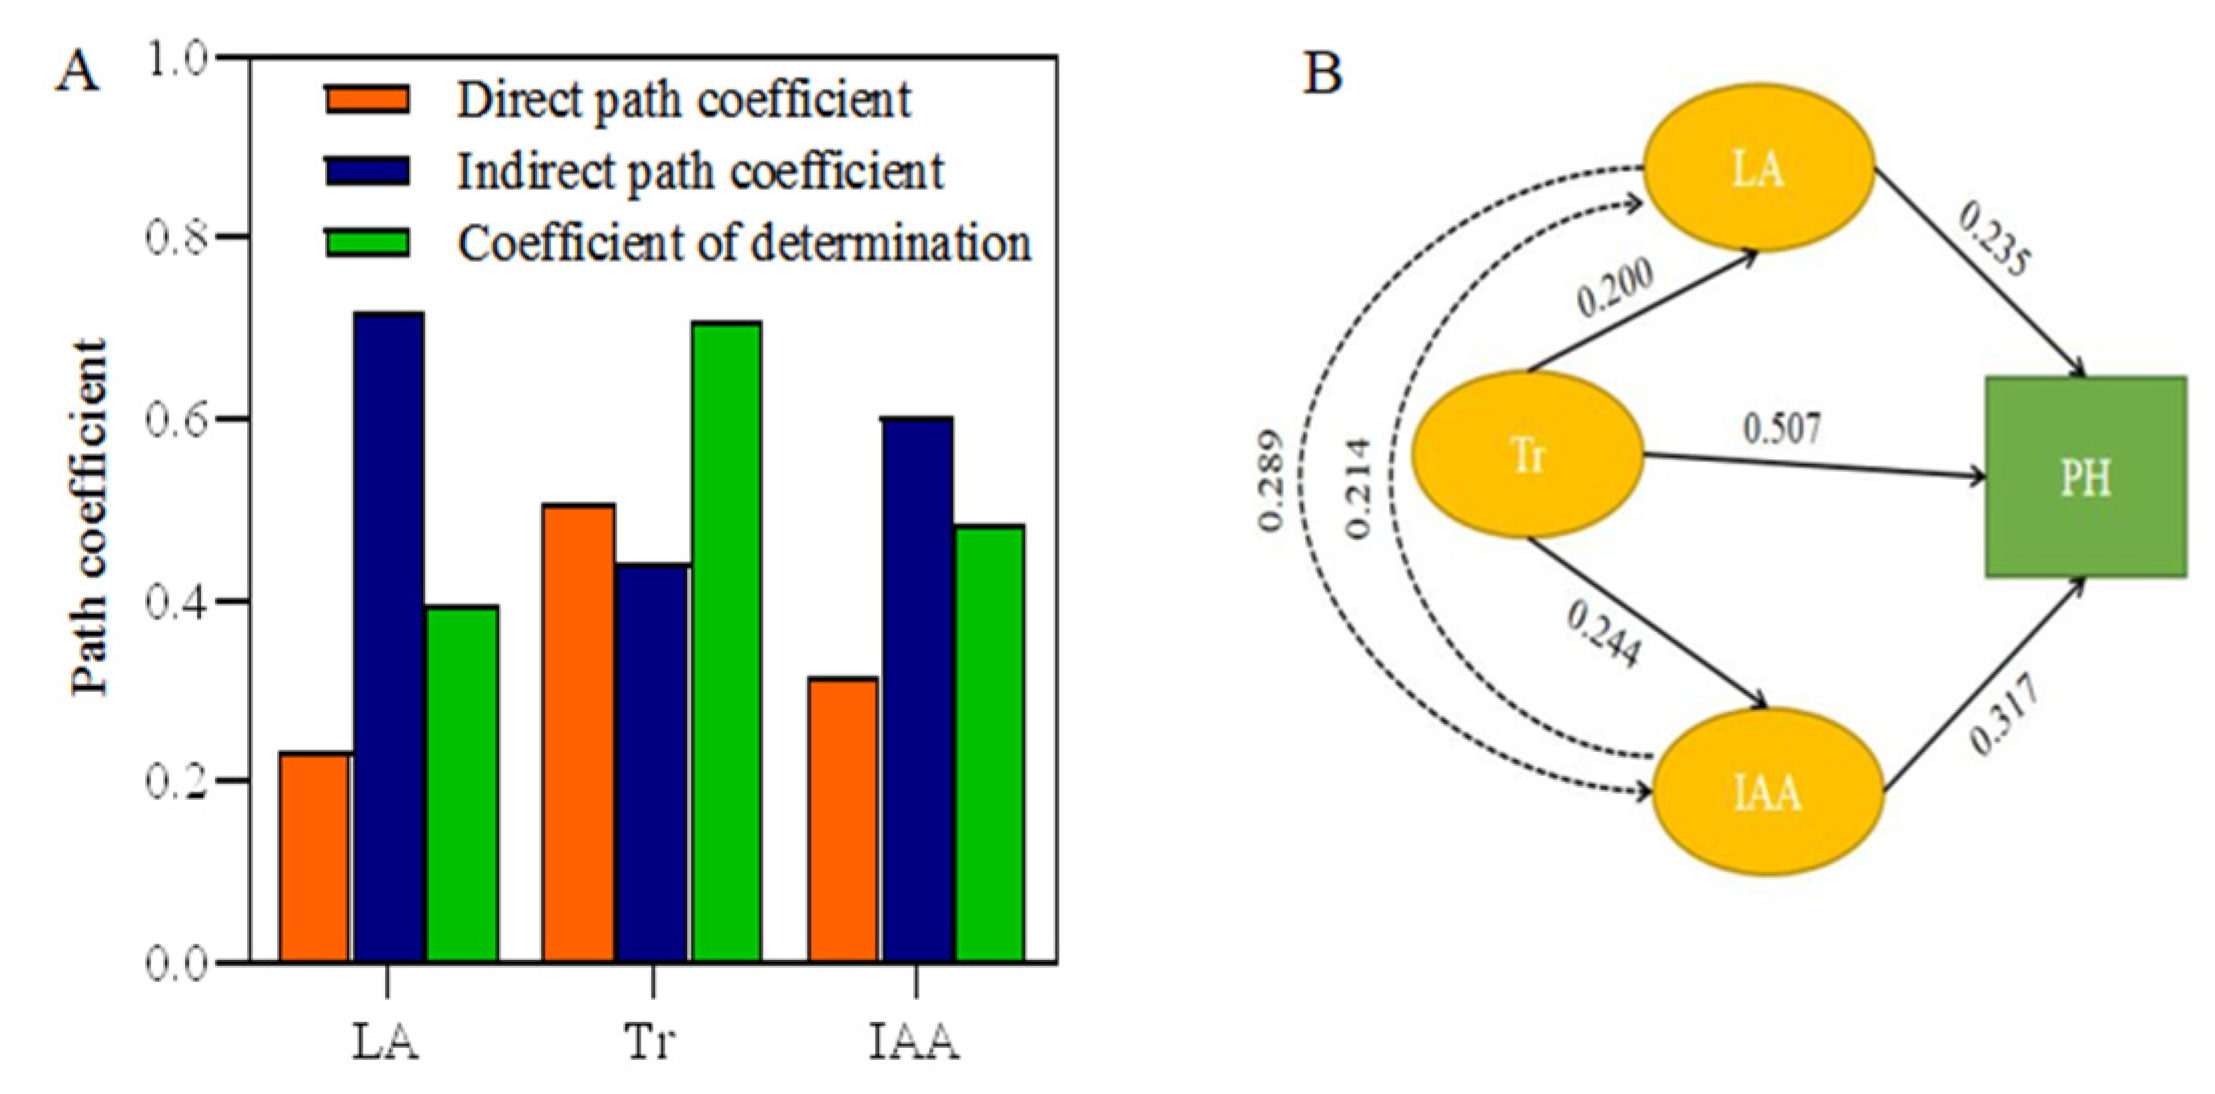
3.7. The Role of Phenotypic Traits and Physiological Indicators on Plant Height in Alfalfa

The path analysis results based on plant height, phenotypic traits and physiological indicators are shown in Figure 9. The results of the path analysis excluded the influence of nine indicators, and the degree of influence of the other three indicators on plant height was, in descending order (absolute value of direct path coefficient), Tr > IAA > LA. The decision coefficients of the three indicators in descending order were Tr > IAA > LA, in which the direct path coefficient and decision coefficient of Tr were the largest, indicating its greatest contribution to plant height, followed by IAA. The indirect effects of the three indicators in response to alfalfa plant height through other indicators were in the order of LA > IAA > Tr. Among them, LA had a significant indirect positive effect on plant height through IAA, with an indirect path coefficient of 0.289.

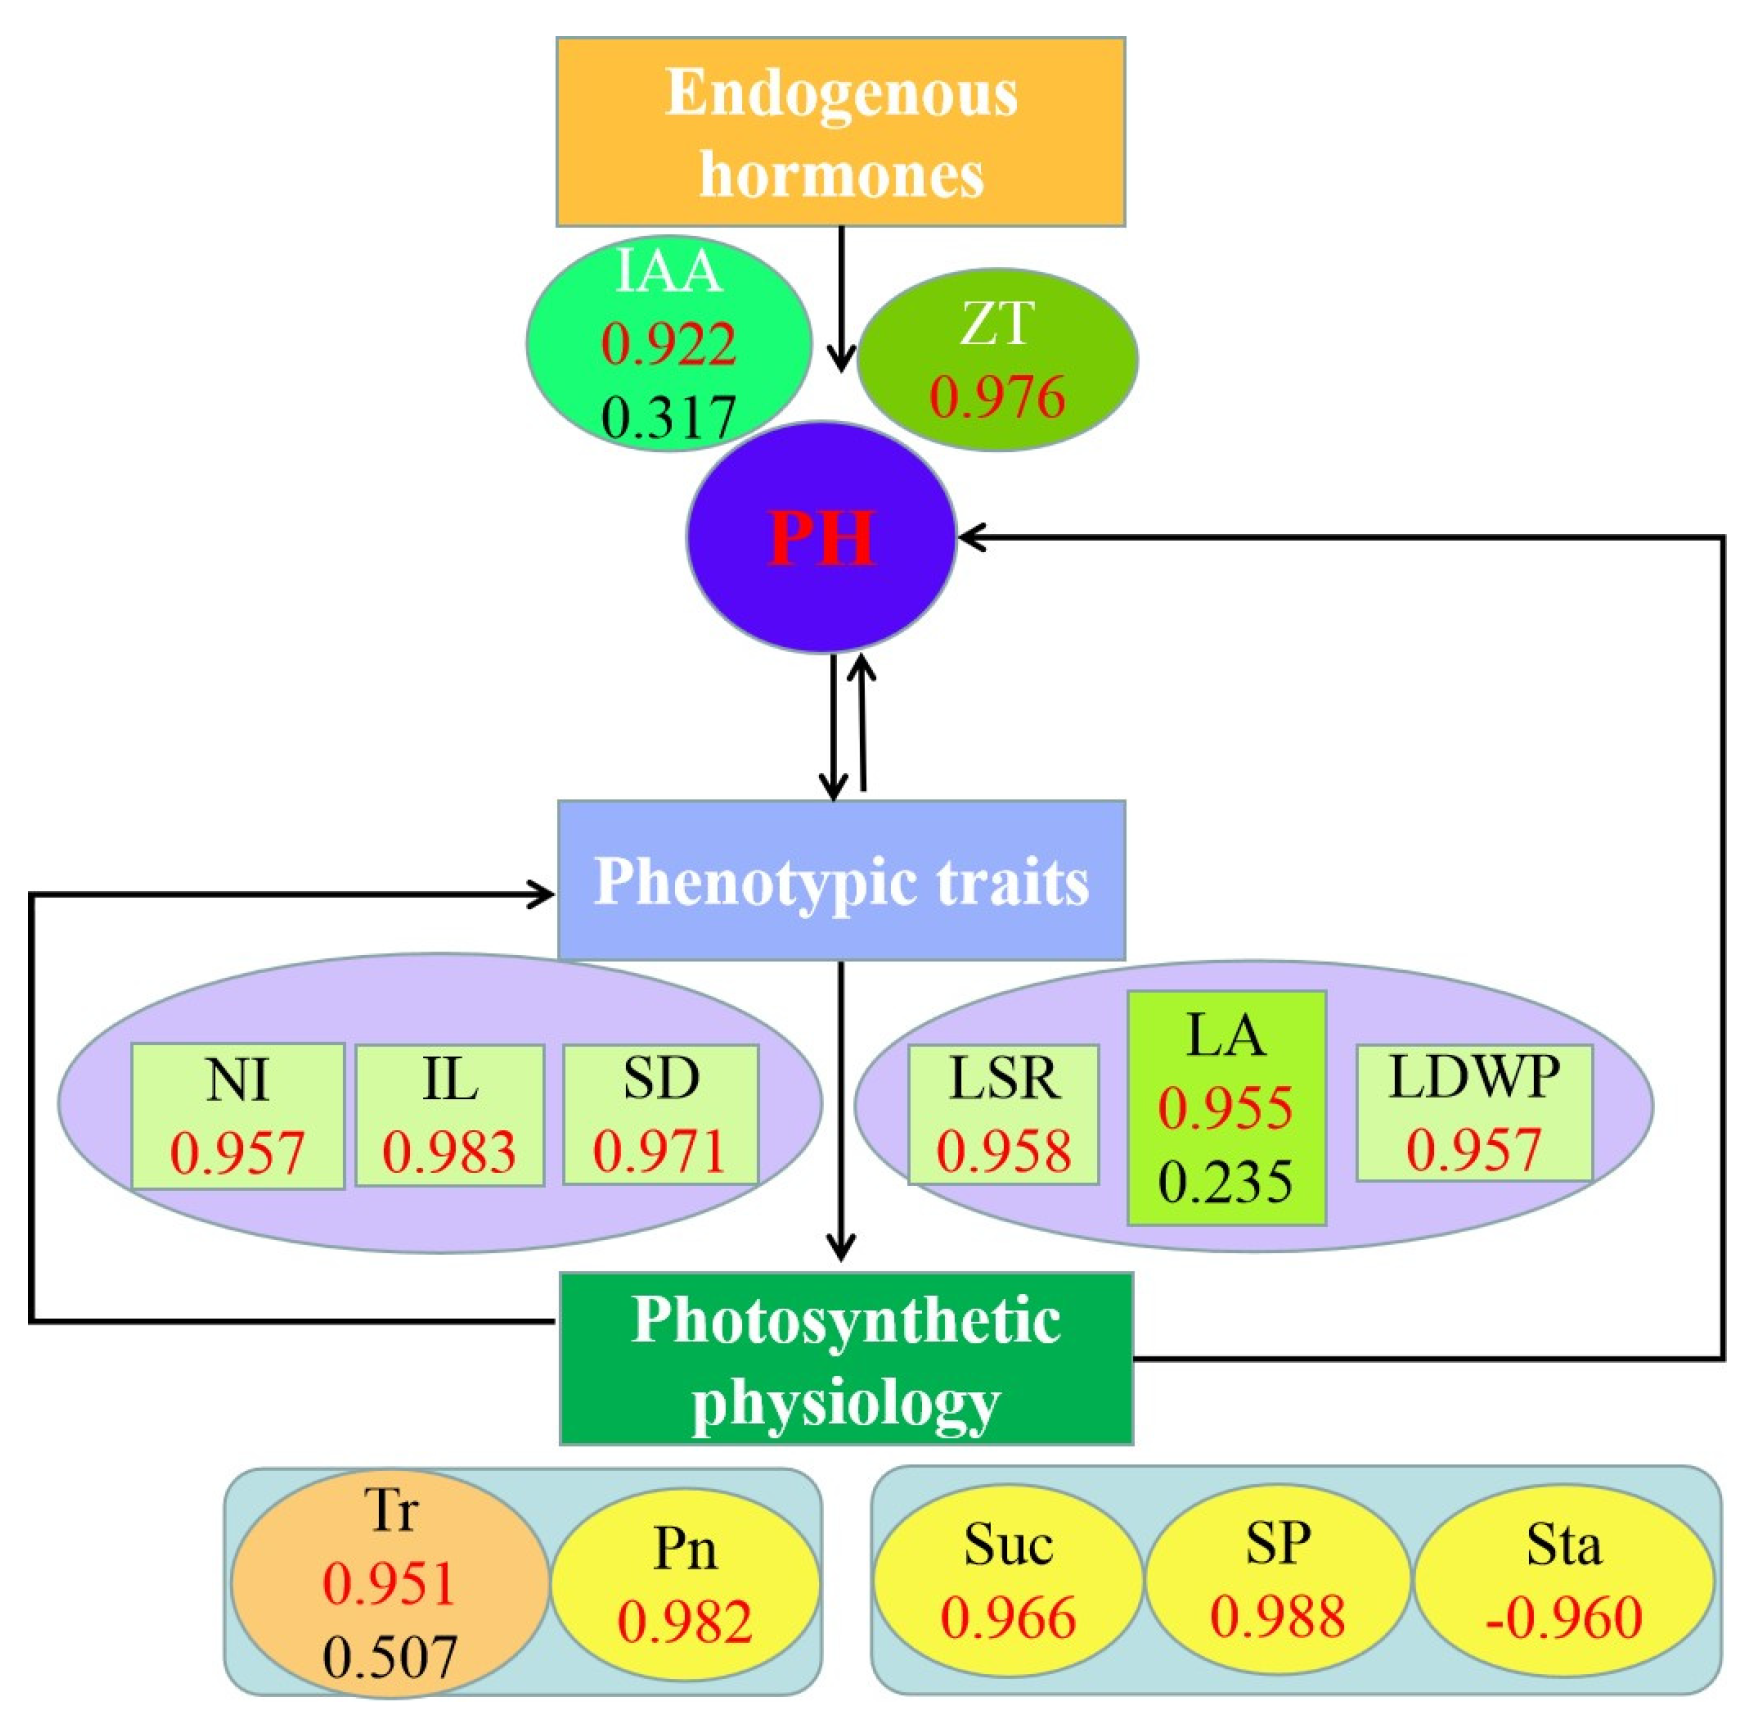
3.8. Comprehensive Analysis of Plant Height, Phenotypic Traits and Physiological Indicators of Alfalfa

The correlation graph analyzed the comprehensive correlation between alfalfa PH and phenotypic traits and physiological indicators (Figure 10). The endogenous hormones regulated alfalfa PH through signal transduction, among which IAA and ZT had the strongest correlation with PH, with correlation coefficients of 0.922 and 0.976, respectively. Among the two hormones, IAA played a direct regulatory role on PH, with a direct pathway coefficient of 0.317. There was mutual influence and interaction between PH and phenotypic traits, with NI, IL and SD being the main determining factors of PH, with correlation coefficients of 0.957, 0.983 and 0.971, respectively. Among them, IL had the strongest correlation with PH. LSR, LA and LDWP were used as leaf characteristic indicators, and the correlation coefficient (0.958) between LSR and PH was the highest. LA had a direct effect on plant height, with a direct path coefficient of 0.235. Plant phenotypic traits influenced plant height through photosynthetic physiology, where the photosynthetic parameter indicators Tr and Pn were strongly correlated with plant height with correlation coefficients of 0.951 and 0.982. Tr had a direct effect on PH, and the direct path coefficient (0.507) was the largest. Among photosynthetic products, Suc and SP were positively correlated with PH, with correlation coefficients of 0.966 and 0.988, respectively, and Sta was negatively correlated with PH, with a correlation coefficient of −0.960.

4. Discussion

4.1. Phenotypic Trait Indicators Affecting Plant Height of Alfalfa

The number of main stem nodes and internode length are the main factors determining plant height, and this study found that plant height was significantly and positively correlated with the number of internodes and the average internode length. In the study of crop height, there were three main forms of internode number and internode length. In the first one, the number of internodes remained unchanged, but the length of internodes changed. For example, compared to the dwarf maize parent Zong 3 and the tall maize parent SL 15, the number of internodes in the plant was the same, but the length of internodes in each node became shorter [32]. In the second one, both the number and length of internodes changed, such as the rice dwarf parent Zhenshan had significantly shorter internodes than the tall parent, except for the first internode [33]. The third, significant change in the length of a particular internode, such as with the rice recessive high-stem mutant eui, which exhibited a significant increase in the length of the uppermost internode, while the other internodes and the length of the rice spike changed only slightly [34]. In this study, there was no significant difference in the number of internodes between the tall-stem alfalfa material and the short-stem material, but the average internode length of tall-stem alfalfa material was significantly higher than the short-stem material. Compared with the dwarf material, the tall-stem material belonged to the type with the same number of internodes but a change in internode length. The length of internodes was the main factor affecting crop height and biomass, and for plants such as rice, wheat and rapeseed, the longer the internode length the higher the plant height. This study showed that the average internode length of tall-stem materials was significantly higher than that of short-stem materials, and dwarf alfalfa exhibited significant shortening and compaction of the internode length of the main stem, which was basically consistent with previous research results. In subsequent experiments, we will use tall- and short-stem alfalfa varieties with significant differences in internode length and constant internode numbers as experimental materials to further analyze the elongation patterns of alfalfa internodes from multiple perspectives such as phenotype, cytology and molecular biology, and elucidate the mechanism of alfalfa plant height development.
In forage production aimed at harvesting nutrients, leaves are an important genetic trait indicator affecting forage crop yield, quality and population canopy structure [35]. As one of the important agronomic traits affecting forage yield, an appropriate increase in leaf number can increase the effective photosynthetic leaf area, improve photosynthetic utilization, and facilitate the accumulation of dry matter in alfalfa. Leaf area, as an important indicator for evaluating plant growth and development, generally has the characteristic of higher yield with larger leaf area. The increase in leaf area expands the photosynthetic field of crops, improves the photosynthetic efficiency of plants and increases the accumulation of organic matter [36,37]. In this study, leaf area had a direct impact on plant height, and the indirect effect of leaf area on plant height through IAA was the greatest, indicating that leaf area had a significant impact on the development of plant height. The number of leaves per plant, leaf area and dry weight per plant of tall-stem alfalfa materials were significantly higher than those of short-stem materials, and the leaf–stem ratio of tall-stem materials was also higher than that of short stems. There was a significant positive correlation between plant height and leaf–stem ratio, leaf area and single plant leaf dry weight. In summary, this study showed that plant height and leaf area, as important trait indicators of alfalfa conformation, interacted and influenced each other. Leaves provide the energy basis for stem growth and development through photosynthesis. The increase in stem height increases the number of leaves per plant, increases the leaf–stem ratio, affects leaf characteristic indicators and ultimately affects the plant’s photosynthetic capacity.

4.2. Photosynthetic Physiological Indicators Affecting Alfalfa Plant Height

Photosynthesis is the foundation of plant growth and development and yield formation, and Pn, Tr, Ci and Gs, as important indicators of physiological activities affecting plant photosynthesis, influence crop growth and development [38]. Pn is an important indicator for evaluating the photosynthetic capacity of plants, and a higher Pn indicates a stronger ability of plants to carry out photosynthesis. Tr reflects the plant’s ability to regulate water balance and indirectly regulates photosynthesis. Higher Tr and Gs are conducive to the exchange of water vapor in the external environment with plant bodies, thereby promoting CO2 participation in plant leaf photosynthesis, accumulating photosynthetic products and improving crop yield [39]. It has been shown that increasing plant height appropriately can improve the light absorption rate of leaves without changing the economic coefficient. A low plant height will weaken the permeability of the plant population, reduce the absorption rate of light energy by leaves, affect the transportation of photosynthetic products and reduce biomass [40]. This study showed that the Tr and Pn of tall-stem alfalfa materials were significantly higher than those of short-stem alfalfa materials. Among the tall-stem materials, G3 had significantly higher Ci and Gs than other materials, and there was no significant difference in photosynthetic parameters between the two short-stem materials. Correlation analysis showed that plant height was highly significantly positively correlated with Pn and significantly positively correlated with Tr. The direct path coefficient and decision coefficient of Tr were both the highest, indicating that they had the highest contribution rate to plant height. This comprehensive study showed that taller alfalfa materials had higher photosynthetic capacity than shorter ones, which was consistent with previous findings that taller plant varieties were conducive to improved canopy light distribution and suitable for high-yielding population construction [41]. Suitable plant height is the foundation of a good plant strain, and a good plant strain can efficiently utilize its growth advantages and achieve the expected ideal economic benefits. By improving the wheat strain, the shading and light avoidance of wheat can be improved so that the wheat can make full use of sunlight throughout the reproductive period and eventually increase the yield [42]. One of the important means to obtain a high yield in rice was to apply the ideal strain type rationally in the actual breeding work [43]. Suitable plant traits were inseparable from high maize yields [44].
The accumulation and distribution of photosynthetic products in plants are the basis for ensuring normal growth and development. In this study, the upper leaves and middle leaves and middle stalks of alfalfa were selected as test materials to study the accumulation and distribution of photosynthetic products in different parts of tall- and short-culm materials. This study showed that the SP, Suc and SS contents of the upper leaves were significantly higher than those of the dwarf culms, and the SS contents of the upper leaves of the two tall-culm materials were significantly higher than those of the middle leaves. However, the differences between the SS contents of the upper and middle leaves of the two dwarf culm materials were not significant. The reason for the difference in the accumulation of photosynthetic products in different parts of leaves of tall- and short-stem materials may be that the stem nodes of tall-stem materials were relatively long, the vertical distribution of leaves was uniform and the upper and middle leaves receive sufficient light. Therefore, the content of SP, Suc and SS in the upper leaves were higher than that of short-stem varieties. However, dwarf varieties had relatively dense leaf layers and the middle and lower leaves died out later, so the difference in SS content produced by photosynthesis between the upper and middle leaves was not significant [41]. The stem serves as the energy transmission tissue. In this study, the average Suc, Sta and SS contents in the middle stem of the dwarf material were higher than those in the stem material. This may be due to the depletion of SS and Suc accumulated in the tall stem for the construction of rapidly growing plants. The decrease in Sta content should be converted into transportable sugars for the growth of plant leaves and plants, which also contributed to the rapid growth of plants [45]. When Zhang studied the dwarfing physiology of castor plants, they found that leaf SP content during the nutritional growth period of contempt hemp was positively correlated with plant heigh [46]. Zheng studied the characteristics of early maturing semi dwarf rice mutants and found that the SP, SS content and amylase activity of the dwarf mutant were lower than those of the wild type [47]. This study showed that plant height was highly and significantly positively correlated with SP as well as Suc content in the upper leaves. There was a significant negative correlation with the Sta content of the middle stalk. The principal component analysis (PCA) plot based on plant height, phenotypic traits and physiological indicators showed that the starch content in the middle stem had a significant impact on dwarf materials. A possible reason for the low content of Sta in the middle stem of high materials is that the photosynthetic products of most higher plants, such as cotton, tobacco, soybeans, etc. When the plant’s own demand for SS is low, SS will be converted into Sta and stored in the plant body. When its demand is greater than its own content, the stored Sta will be consumed. The Sta content of high-stem varieties is mainly used for rapid plant growth, so it is lower than that of short-stem varieties.

4.3. Endogenous Hormones Affecting Plant Height of Alfalfa

Plant height is a complex agronomic trait regulated by genetics and environment. With the deepening of molecular biology research, more and more genes related to internode elongation and plant height have been cloned and functionally identified. So far, multiple genes related to plant height have been cloned in plants such as Arabidopsis, rice and corn. These genes are mostly related to the metabolism or signal transduction of hormones such as GA3, IAA, CTK and brassinolide (BR), and plant hormones play a dominant role in plant height regulation [48]. Chen found that the content of auxin in the internode tissue of tall castor was significantly higher than that of short-stem castor [49]. It can be inferred that the internode length of tall castor was mainly regulated by auxin, and the tall plant showed a longer cell length and internode length. In this study, there was a significant positive correlation between the plant height of alfalfa and the ZT and IAA contents in the middle stem. The average ZT and IAA contents in the middle stem of the two tall-stem materials were significantly higher than those in the short-stem materials, indicating that the ZT and IAA contents in the middle stem were the main hormones regulating the plant height of alfalfa. Path analysis showed that the direct path coefficient and decision coefficient of IAA were second only to Tr, indicating that IAA had the highest contribution rate to plant height among the two hormones. In normal healthy plants, the endogenous hormone content in the elongation zone is most suitable for plant growth; therefore, the correlation between hormone content in the middle stem and plant height is stronger than in other parts. This study also found that the IAA content in different parts of the stem showed a pattern of upper part > middle part > base, which may be due to the fact that the biosynthesis of IAA mainly occurs in rapidly dividing and growing tissues. Although all plant tissues may produce IAA, the stem tip meristem and young leaves are the main sites for auxin synthesis [50]. The auxin in plants mainly comes from the top of the stem and is transported from the top to the base, so the IAA content in the stem gradually decreases from the top to the base tissue. Auxin regulates plant height mainly by regulating cell division, elongation and differentiation [51]. According to the acid growth theory, auxin can induce proton efflux in cells, which can reduce the pH value of the cell wall area. Under acidification conditions, cell wall expanding can relax the cell wall and promote the effect of cell extension by weakening the hydrogen bond between polysaccharide molecules such as cell wall cellulose, hemicellulose and lignin [52].
Cytokinins are widely involved in the physiological and metabolic activities of plants and are essential key hormones in the plant body. The primary function of cytokinin is to promote cell division and volume expansion, and it is a positive regulator of stem meristem activity. Cytokinins play a crucial role in stem development [53,54]. In plants, each plant hormone does not act independently; therefore, their functions in plant growth cannot be viewed in isolation. Antagonistic or synergistic relationships between cytokinin and auxin have been found in many biological processes. Cheng found that auxin response factor (ARF3) can interact with the promoter of the cytokinin synthase gene (AtIPT5 in Arabidopsis thaliana) to inhibit the expression of the promoter, thereby inhibiting the biosynthesis of cytokinin [55]. Ioio found that cytokinin can cause redistribution of auxin and promote cell differentiation, while auxin can affect the growth of root meristem by regulating the degradation of SHY2 protein [56]. Cytokinin and auxin have antagonism at low to medium concentrations of the two hormones, and only have an auxiliary effect at high concentrations.

5. Conclusions

The number of main stem nodes and internode length are the main factors determining plant height. In this study, we found the average internode length of tall-stem alfalfa materials was significantly higher than that of short-stem materials, while the difference in internode numbers was not significant, indicating that the plant height differences of the test materials are mainly caused by internode length. Plant height and leaves as important structural traits of alfalfa interact with each other. Leaves provide the energy basis for the growth and development of stems through photosynthesis. The increase in stem height increases the number of leaves per plant, improves the leaf–stem ratio, affects leaf characteristic indicators and ultimately affects the plant’s photosynthetic capacity. In this study, we found that the photosynthetic capacity of tall alfalfa materials was stronger than that of short-stems, and the increase in plant height was conducive to improving canopy light distribution and suitable for high-yield population construction. The stem serves as the energy transmission tissue. In this study, the average Suc, Sta and SS content of the middle stem of the dwarf material was higher than that of the stem material. The principal component analysis (PCA) diagram showed that the starch content of the middle stem had a significant impact on the dwarf material. Hormones are an important factor in regulating plant height. In this study, plant height of alfalfa was significantly and positively correlated with the ZT and IAA content in the middle stem, indicating that ZT and IAA in the middle stem were the main hormones regulating the plant height of alfalfa. The path analysis showed that IAA contributed the most to plant height. In summary, this study analyzed the plant height development of alfalfa from the aspects of phenotypic traits, photosynthetic physiology and hormone content, which provided a phenotypic and physiological basis for the genetic improvement of alfalfa and other leguminous forage.

Author Contributions

Conceptualization, F.J. and S.S.; methodology, F.J.; software, F.J.; validation, F.J.; formal analysis, F.J. and S.S.; investigation, Y.A., J.G., B.L., B.W., W.W., R.M. and P.N.; resources, S.S.; data curation, F.J. and S.S.; writing—original draft preparation, F.J.; writing—review and editing, F.J. and S.S.; visualization, S.S.; supervision, S.S.; project administration, S.S.; funding acquisition, S.S. All authors have read and agreed to the published version of the manuscript.

Funding

This research was funded by the National Pastoral Industry Technology System (No. CARS-34). Gansu Province Excellent Graduate Student "Innovation Star" Project (No. 2022CXZXB-009).

Data Availability Statement

The data presented in this study are available upon request from the corresponding author.

Acknowledgments

The authors thank Wenjuan Kang and Guoli Yin of Gansu Agricultural University for all their help during the experiment.

Conflicts of Interest

The authors declare no conflict of interest.

Abbreviations

Plant height (PH); stem diameter (SD); average internode length (IL); number of leaves per plant (NLP); number of internodes (NI); leaf dry weight per plant (LDWP); stem dry weight per plant (SDWP); leaf–stem ratio (LSR); leaf area (LA); leaf shape index (LI); transpiration rate (Tr); net photosynthetic rate (Pn); intercellular CO2 concentration (Ci); stomatal conductance (Gs); sucrose (Suc); starch (Sta); soluble sugar (SS); soluble protein (SP); indole-3-acetic acid (IAA); gibberellin (GA3); abscisic acid (ABA); zeatin (ZT); and salicylic acid (SA).

References

  1. Schnurr, J.A.; Jung, H.G.; Samac, D.A. A comparative study of alfalfa and Medicago truncatula stem traits: Morphology, chemical composition, and ruminal digestibility. Crop Sci. 2007, 47, 1672–1680. [Google Scholar] [CrossRef] [Green Version]
  2. Annicchiarico, P.; Piano, E. Use of artificial environments to reproduce and exploit genotype x location interaction for lucerne in northern Italy. Theor. Appl. Genet. 2005, 110, 219–227. [Google Scholar] [CrossRef] [PubMed]
  3. Fu, C.; Hernandez, T.; Zhou, C.; Wang, Z.Y. Alfalfa (Medicago sativa L.). Methods Mol. Biol. 2015, 1223, 213–221. [Google Scholar] [CrossRef] [PubMed]
  4. Chen, H.T.; Zeng, Y.; Yang, Y.Z.; Huang, L.L.; Tang, B.; Zhang, H.; Hao, F.; Liu, W.; Li, Y.H.; Liu, Y.B.; et al. Allele-aware chromosome-level genome assembly and efficient transgene-free genome editing for the autotetraploid cultivated alfalfa. Nat. Commun. 2020, 11, 2494. [Google Scholar] [CrossRef]
  5. Long, R.C.; Zhang, F.; Zhang, Z.W.; Li, M.N.; Chen, L.; Wang, X.; Liu, W.W.; Zhang, T.J.; Yu, L.X.; He, F.; et al. Genome assembly of alfalfa cultivar zhongmu-4 and identification of SNPs associated with agronomic traits. Genom. Proteom. Bioinform. 2022, 20, 14–28. [Google Scholar] [CrossRef]
  6. Shen, C.; Du, H.L.; Chen, Z.; Lu, H.W.; Zhu, F.G.; Chen, H.; Meng, X.Z.; Liu, Q.W.; Liu, P.; Zheng, L.H.; et al. The Chromosome-Level Genome Sequence of the Autotetraploid Alfalfa and Resequencing of Core Germplasms Provide Genomic Resources for Alfalfa Research. Mol. Plant 2020, 13, 1250–1261. [Google Scholar] [CrossRef]
  7. Ku, L.X.; Zhang, L.K.; Tian, Z.Q.; Guo, S.L.; Su, H.H.; Ren, Z.Z.; Wang, Z.Y.; Li, G.H.; Wang, X.B.; Zhu, Y.G.; et al. Dissection of the genetic architecture underlying the plant density response by mapping plant height-related traits in maize (Zea mays L.). Mol. Genet. Genom. 2015, 4, 1223–1233. [Google Scholar] [CrossRef]
  8. Wang, W.X.; Guo, W.J.; Le, L.; Yu, J.; Wu, Y.; Li, D.W.; Wang, Y.F.; Wang, H.; Lu, X.D.; Qiao, H.; et al. Integration of high-throughput phenotyping, GWAS, and predictive models reveals the genetic architecture of plant height in maize. Mol. Plant 2023, 16, 354–373. [Google Scholar] [CrossRef]
  9. Zhang, T.J.; Yang, Q.C.; Kang, J.M.; Sun, Y.; Guo, W.S. Advances in Genetic Basic Research of Alfalfa Breeding for yield. Chin. J. Grassl. 2011, 33, 102–106. [Google Scholar]
  10. Yin, D. Biomass dynamics of every stubble of spring-sowed alfalfa in the loess plateau of LongDong. Agric. Res. Arid. Areas 2009, 37, 178–183. [Google Scholar]
  11. Wang, H.S.; Gu, L.J.; Zhang, X.G.; Liu, M.L.; Jiang, H.Y.; Cai, R.H.; Zhao, Y.; Cheng, B.J. Global transcriptome and weighted gene co-expression network analyses reveal hybrid-specific modules and candidate genes related to plant height development in maize. Plant Mol. Biol. 2018, 98, 187–203. [Google Scholar] [CrossRef]
  12. He, H.F.; Yan, C.L.; Wu, N.; Liu, J.L.; Jia, Y.H. Effects of different nitrogen levels on photosynthetic characteristics and drought resistance of switch-grass (Panicum virgatum). Acta Prataculturae Sin. 2021, 30, 107–115. [Google Scholar] [CrossRef]
  13. Cai, X.X.; Zhang, S.; Wang, H.; Lv, R.L.; Li, X.H.; Zhou, Q. The present research situation and application prospects of rice plant type genes. Mol. Plant Breed. 2017, 15, 2809–2814. [Google Scholar] [CrossRef]
  14. Chen, X.; Lu, S.C.; Wang, Y.F.; Zhang, X.; Lu, B.; Luo, L.Q.; Xi, D.D.; Shen, J.B.; Ma, H.; Ming, F. Os NAC2 encoding a NAC transcription factor that affects plant height through mediating the gibberellic acid pathway in rice. Plant J. 2015, 82, 302–314. [Google Scholar] [CrossRef]
  15. Wang, Y.J.; Zhao, J.; Lu, W.J.; Deng, D.X. Gibberellin in plant height control: Old player, new story. Plant Cell Rep. 2017, 36, 391–398. [Google Scholar] [CrossRef]
  16. Fendrych, M.; Leung, J.; Friml, J. TIR1/AFB-Aux/IAA auxin perception mediates rapid cell wall acidification and growth of Arabidopsis hypocotyls. Elife 2016, 5, e19048. [Google Scholar] [CrossRef]
  17. Kutschera, U.; Niklas, K.J. The epidermal-growth-control theory of stem elongation: An old and a new perspective. J. Plant Physiol. 2007, 164, 1395–1409. [Google Scholar] [CrossRef]
  18. Velasquez, S.M.; Barbez, E.; Kleine-Vehn, J.; Estevez, J.M. Auxin and cellular elongation. Plant Physiol. 2016, 170, 1206–1215. [Google Scholar] [CrossRef] [Green Version]
  19. Liu, F.; Wang, P.D.; Zhang, X.B.; Li, X.F.; Yan, X.H.; Fu, D.H.; Wu, G. The genetic and molecular basis of crop height based on a rice model. Planta 2018, 247, 1–26. [Google Scholar] [CrossRef]
  20. Wang, K.L.; Zhang, Y.Y.; Zhang, H.M.; Lin, X.C.; Xia, R.; Song, L.L.; Wu, A.M. MicroRNAs play important roles in regulating the rapid growth of the Phyllostachys edulis culm internode. New Phytol. 2021, 231, 2215–2230. [Google Scholar] [CrossRef]
  21. Wang, F.X.; Yu, Z.P.; Zhang, M.L.; Wang, M.L.; Lu, X.D.; Liu, X.; Li, Y.B.; Zhang, X.S.; Tan, B.C.; Li, C.L.; et al. ZmTE1 promotes plant height by regulating intercalary meristem formation and internode cell elongation in maize. Plant Biotechnol. J. 2022, 20, 526–537. [Google Scholar] [CrossRef] [PubMed]
  22. Chen, R.F.; Fan, Y.G.; Yan, H.F.; Zhou, H.W.; Zhou, Z.F.; Weng, M.L.; Huang, X.; Lakshmanan, P.; Li, Y.; Qiu, L.H.; et al. Enhanced Activity of Genes Associated With Photosynthesis, Phytohormone Metabolism and Cell Wall Synthesis Is Involved in Gibberellin-Mediated Sugarcane Internode Growth. Front. Genet. 2020, 11, 570094. [Google Scholar] [CrossRef] [PubMed]
  23. Amanda, S.L.; Natalie, N.G.; Upendra, K.D.; Esther, C.; Isabel, L.D.; Miguel, A.B.; Julin, N.M. The role of a class III gibberellin 2-oxidase in tomato internode elongation. Plant J. 2019, 97, 603–615. [Google Scholar] [CrossRef] [Green Version]
  24. Qi, J.J.; Yu, X.; Wang, X.Z.; Zhang, F.F.; Ma, C.H. Differentially expressed genes related to plant height and yield in two alfalfa cultivars based on RNA-seq. PeerJ 2022, 10, e14096. [Google Scholar] [CrossRef]
  25. Zhang, H.H.; Shi, S.L.; Wu, B.; Li, Z.L.; Li, X.L. A study of yield interactions in mixed sowings of alfalfa and three perennial grasses. Acta Prataculturae Sin. 2022, 31, 159–170. [Google Scholar] [CrossRef]
  26. Von Caemmerer, S.; Farquhar, G.D. Some relationships between the biochemistry of photosynthesis and the gas exchange of leaves. Planta 1981, 153, 376–387. [Google Scholar] [CrossRef]
  27. Bach Knudsen, K.E. Carbohydrate and lignin contents of plant materials used in animal feeding. Anim. Feed Sci. Technol. 1997, 67, 319–338. [Google Scholar] [CrossRef]
  28. Buysse, J.; Merckx, R. An improved colorimetric method to quantify sugar content of plant tissue. J. Exp. Bot. 1993, 44, 1627–1629. [Google Scholar] [CrossRef]
  29. Bradford, M.M. A rapid and sensitive method for the quantitation of microgram quantities of protein utilizing the principle of protein-dye binding. Anal. Biochem. 1976, 72, 248–254. [Google Scholar] [CrossRef]
  30. Liu, Y.; Yu, M.L.; Zhang, R.; Niu, K.J.; Li, Y.Z.; Zhang, J.Q.; Ma, H.L. The relationship between endogenous hormone content and apomixis rate of wild Kentucky bluegrass in Gansu province. J. Grassl. Ind. 2020, 29, 99–111. [Google Scholar] [CrossRef]
  31. Shi, S.; Zhang, J.; Li, X.; Jing, F.; Zhang, H.; Ma, R. Photosynthetic Physiological Basis of Forage Mass Stability in a Progeny of Rhizome-Rooted ‘Qingshui’ Medicago sativa L. Agronomy 2023, 13, 685. [Google Scholar] [CrossRef]
  32. Tsuda, K.; Abraham-Juarez, M.J.; Maeno, A.; Dong, Z.; Aromdee, D.; Meeley, R.; Shiroishi, T.; Nonomura, K.I.; Hake, S. KNOTTED1 cofactors, BLH12 and BLH14,regulate internode patterning and vein anastomosis in maize. Plant Cell 2017, 29, 1105–1118. [Google Scholar] [CrossRef] [Green Version]
  33. Kovi, M.R.; Zhang, Y.S.; Yu, S.B.; Yang, G.Y.; Yan, W.H.; Xing, Y.Z. Candidacy of a chitin-inducible gibberellin-responsive gene for a major locus affecting plant height in rice that is closely linked to green revolution gene sd1. Theor. Appl. Genet. 2011, 123, 705–714. [Google Scholar] [CrossRef]
  34. Zhu, Y.Y.; Nomura, T.; Xu, Y.H.; Zhang, Y.Y.; Peng, Y.; Mao, B.Z.; Hanada, A.; Zhou, H.C.; Wang, R.X.; Li, P.J.; et al. ELONGATED UPPERMOST INTERNODE encodes a cytochrome P450 monooxygenase that epoxidizes gibberellins in a novel deactivation reaction in rice. Plant Cell 2006, 18, 442–456. [Google Scholar] [CrossRef] [Green Version]
  35. Wang, J.; Liu, X.J.; Cheng, T.T.; Tong, C.C.; Wang, X. Study on leaf characteristics and yield effects of alfalfa with different nitrogen efficiency. Acta Agrestia Sin. 2021, 29, 1941–1949. [Google Scholar] [CrossRef]
  36. Sun, Z.Q.; Xu, F.; Zhang, Y.Q.; Hai, G.; Yang, C.Y.; Wu, Z.; Wang, B.; Yu, Z. Comparison and correlation of agronomic characteristics and fermentation quality of different types of hybrid corn. Acta Agrestia Sin. 2019, 27, 250–256. [Google Scholar] [CrossRef]
  37. Zhang, J.S.; Jia, Y.H.; Sun, P.; Liu, C.; Wang, H.; Luo, S.W.; Shi, S.B. Effects of uniform pattern and N application rate on colony, photosynthesis and dry matter accumulation of winter wheat. J. China Agric. Univ. 2021, 26, 12–24. [Google Scholar] [CrossRef]
  38. Yu, G.R.; Wang, Q.F. Ecophysiological of Plant Photosynthesis, Transpiration, and Water Use; Science Press: Beijing, China, 2010. [Google Scholar]
  39. Lin, K.Q.; Han, Z.L.; Song, Q.F.; Liang, S.H.; Zhou, Y.F. Photosynthetic physiological features and leaf functional traits of 15 tea cultivars (lines). Southwest China J. Agric. Sci. 2021, 34, 2370–2377. [Google Scholar] [CrossRef]
  40. Lan, J.H.; Chu, D. Study on the genetic basis of plant height and ear height in maize(Zea mays L.) by QTL dissection. Hereditas 2005, 27, 925–934. [Google Scholar]
  41. Li, L.L.; Zhang, J.W.; Dong, S.T.; Liu, P.; Zhao, B.; Yang, J.S. Characteristics of Accumulation, transportation and distribution of assimilates in summer maize varieties with different plant heights. Acta Agrestia Sin. 2012, 38, 1080–1087. [Google Scholar] [CrossRef]
  42. Lu, X.L.; Yu, Z.E.; Zhang, Y.L.; Shi, Y. Light energy utilization and distribution characteristics of 13C assimilates in different spike-type wheat varieties and their response to supplementary irrigation. Chin. J. Appl. Ecol. 2019, 30, 3745–3752. [Google Scholar] [CrossRef]
  43. Xu, M.L.; Ding, L.P.; Luo, J.; Xu, T.T.; Wu, H.Z. Research progress of photosynthetic mechanisms of super high yield-grain-yield rice. Front. Plant Sci. 2021, 25, 385–392. [Google Scholar] [CrossRef]
  44. Wang, X.H.; Zhang, L.; Liu, S.L.; Cao, Y.J.; Wei, W.W.; Liu, C.G.; Wang, Y.J.; Bian, S.F.; Wang, L.C. Grain Filling Characteristics of Maize Hybrids Differing Maturities. Sci. Agric. Sin. 2014, 47, 3557–3565. [Google Scholar] [CrossRef]
  45. Richardson, A.D.; Carbone, M.S.; Keenan, T.F.; Czimczik, C.I.; Hollinger, D.Y.; Murakami, P.; Schaberg, P.G.; Xu, X.M. Seasonal dynamics and age of stemwood nonstructural carbohydrates in temperate forest trees. New Phytol. 2013, 197, 850–861. [Google Scholar] [CrossRef] [Green Version]
  46. Zhang, D.Z.; Li, G.L.; Zhang, S.Y. The Preliminary analysis on relationship between carbon and nitrogen metabolism and plant height in castor. Chin. J. Oil Crop Sci. 2006, 28, 342–346. [Google Scholar]
  47. Zheng, Y.; Hong, M.X.; Fan, Y.Q.; Wang, X.S.; Li, D.H. Physiological and biochemical performance of rice semi dwarf mutant B1-24. Chin. J. Trop. Crop. 2009, 30, 1057–1061. [Google Scholar]
  48. Kebrom, T.H.; McKinley, B.; Mullet, J.E. Dynamics of gene expression during development and expansion of vegetative stem internodes of bioenergy sorghum. Biotechnol. Biofuels 2017, 10, 159. [Google Scholar] [CrossRef]
  49. Chen, Y.J. Transcriptomic and Metabolomic Integrative Analysis to Identify Key Genes Invoved in the Regulation Castor Plant Height Development; Zhejiang University: Hangzhou, China, 2021; pp. 55–56. [Google Scholar] [CrossRef]
  50. Ljung, K.; Bhalerao, R.P.; Sandberg, G. Sites and homeostatic control of auxin biosynthesis in Arabidopsis during vegetative growth. Plant J. 2001, 28, 465–474. [Google Scholar] [CrossRef]
  51. Stepanova, A.N.; Robertson-Hoyt, J.; Yun, J.; Benavente, L.M.; Xie, D.Y.; Dolezal, k.; Schlereth, A.; Jürgens, G.; Alonso, J.M. TAA1-mediated auxin biosynthesis is essential for hormone crosstalk and plant development. Cell 2008, 133, 177–191. [Google Scholar] [CrossRef] [Green Version]
  52. Ni, D.; Xu, Z.H. Auxin biosynthesis, metabolism, receptors and polar transport. Commun. Plant Physiol. 2001, 346–352. [Google Scholar] [CrossRef]
  53. Li, S.M.; Zheng, H.X.; Zhang, X.S.; Sui, N. Cytokinins as central regulators during plant growth and stress response. Plant Cell Rep. 2021, 40, 271–282. [Google Scholar] [CrossRef]
  54. Su, Y.H.; Liu, Y.B.; Bai, B.; Zhang, X.S. Establishment of embryonic shoot–root axis is involved in auxin and cytokinin response during Arabidopsis somatic embryogenesis. Front. Plant Sci. 2015, 5, 792. [Google Scholar] [CrossRef] [Green Version]
  55. Cheng, Z.J.; Wang, L.; Sun, W.; Zhang, Y.; Zhou, C.; Su, Y.H.; Li, W.; Sun, T.T.; Zhao, X.Y.; Li, X.G.; et al. Pattern of auxin and cytokinin responses for shoot meristem induction results from the regulation of cytokinin biosynthesis by AUXIN RESPONSE FACTOR3. Plant Physiol. 2013, 161, 240–251. [Google Scholar] [CrossRef] [Green Version]
  56. Ioio, R.D.; Nakamura, K.; Moubayidin, L.; Perilli, S.; Taniguchi, M.; Morita, M.T.; Aoyama, T.; Costantino, P.; Sabatini, S. A genetic frame-work for the control of cell division and differentiation in the root meristem. Science 2008, 322, 1380–1384. [Google Scholar] [CrossRef] [Green Version]
Figure 1. Alfalfa material for testing. (A) The varieties with significant differences in seedling stage. (B) The field layout. (C) Two tall-stem and two short-stem test materials with significant differences were selected from 12 alfalfa varieties.
Agronomy 13 01744 g001
Figure 2. Plant height of different alfalfa materials. The lower-case letters in different columns show significant differences between varieties at the 0.05 level. (A) Plant height of tall and dwarf alfalfa materials. Yellow, blue, orange and green in the figure represent 343, 354, 525 and G3 alfalfa varieties, respectively. (B) The cumulative plant height of each internode length for tall- and short-stem materials, with 1–15 different colors representing 1–15 internode lengths.
Agronomy 13 01744 g002
Figure 3. Phenotypic Characteristics of different alfalfa materials. (A) number of internodes, (B) average internode length, (C) stem diameter, (D) number of leaves per plant, (E) leaf area, (F) leaf shape index, (G) leaf dry weight per plant, (H) stem dry weight per plant, and (I) leaf–stem ratio. The lower-case letters in different columns showed significant difference between varieties at the 0.05 level. Yellow, blue, orange and green in the figure represent 343, 354, 525 and G3 alfalfa varieties, respectively.
Agronomy 13 01744 g003
Figure 4. Photosynthetic parameters of different alfalfa materials. (A) Transpiration rate, (B) net photosynthetic rate, (C) intercellular CO2 concentration, (D) stomatal conductance. The lower-case letters in different columns show significant difference between varieties at the 0.05 level. Yellow, blue, orange and green in the figure represent 343, 354, 525 and G3 alfalfa varieties, respectively.
Agronomy 13 01744 g004
Figure 5. Photosynthetic products of different alfalfa materials. (A) Soluble protein content, (B) sucrose content, (C) starch content, (D) soluble sugar content. Different lower-case letters in the figure indicate significant differences among different alfalfa varieties (p < 0.05). Different capital letters indicate significant differences between different parts of the same alfalfa variety (p < 0.05). Yellow, blue, orange and green in the figure represent 343, 354, 525 and G3 alfalfa varieties, respectively.
Agronomy 13 01744 g005
Figure 6. Hormone content of different alfalfa materials. (A) Zeatin content, (B) gibberellin A3 content, (C) indole-3-acetic acid content, (D) abscisic acid content, (E) salicylic acid content. Different lower-case letters in the figure indicate significant differences among different alfalfa varieties (p < 0.05). Different capital letters indicate significant differences between different parts of the same alfalfa variety (p < 0.05). Yellow, blue, orange and green in the figure represent 343, 354, 525 and G3 alfalfa varieties, respectively.
Agronomy 13 01744 g006
Figure 7. Correlation analysis between plant height and phenotypic traits. (**) Indicates a highly significant correlation at the 0.01 level, (*) indicates a significant correlation at the 0.05 level.
Agronomy 13 01744 g007
Figure 8. The PCA analysis chart of plant height and phenotypic traits and physiological indicators, with black and red representing dwarf and tall materials, respectively.
Agronomy 13 01744 g008
Figure 9. Path analysis of plant height, phenotypic traits and physiological indicators. (A) Path coefficient. Red, blue and green represent direct path coefficient, indirect path coefficient and decision coefficient, respectively. (B) The size of the effect of each trait on plant height, with dashed lines representing indirect effects and solid lines representing direct effects.
Agronomy 13 01744 g009
Figure 10. Comprehensive analysis chart of plant height, phenotypic traits and physiological indicators, with black arrows indicating interactions, black letters indicating various trait indicators, red numbers indicating correlation coefficients and black numbers indicating direct path coefficients.
Agronomy 13 01744 g010
Table 1. Proportion of Mobile Phase Conditions.
Time(min)13581214
Methanol (%)455565751010
0.1% Phosphate (%)554535259090
Table 2. Correlation analysis of phenotypic traits with light and physiological indicators.
CorrelationPHNISDILLSRLALDWP
Tr0.951 *0.986 **0.8510.988 **0.8240.8490.986 **
Pn0.982 **0.957 *0.926 *0.982 **0.903 *0.8830.957 *
Ci0.1040.384−0.1340.287−0.1720.0030.384
Gs0.6720.8570.4810.7970.4490.5920.857
SPUpper blade0.988 **0.904 *0.996 **0.943 *0.991 **0.966 *0.904 *
Middle stem0.4770.6610.2610.6140.2100.2700.661
Middle blade0.4410.6260.2240.5800.1720.2260.626
SucUpper blade0.966 *0.945 *0.942 *0.954 *0.940 *0.992 **0.945 *
Middle stem−0.790−0.610−0.909*−0.673−0.930 *−0.881−0.610
Middle blade−0.319−0.463−0.249−0.387−0.266−0.506−0.463
StaUpper blade0.4380.6740.2110.5970.1710.3230.674
Middle stem−0.960 *−0.934 *−0.897−0.962 *−0.870−0.833−0.934 *
Middle blade−0.727−0.724−0.738−0.710−0.758−0.888−0.724
SSUpper blade0.8830.7100.967 *0.7810.972 *0.8790.710
Middle stem−0.850−0.965 *−0.711−0.929*−0.687−0.803−0.965 *
Middle blade0.4180.1390.6180.2430.6450.4720.139
Notes: (**) Indicates a highly significant correlation at the 0.01 level, (*) indicates a significant correlation at the 0.05 level.
Table 3. Correlation analysis between phenotypic traits and endogenous hormone content.
CorrelationPHNISDILLSRLALDWP
ZTUpper stem0.4320.6420.2060.583 *0.1570.2480.642
Middle stem0.976 *0.8730.991 **0.9230.982 **0.927 *0.873
Basal stem0.7070.8730.5170.8250.4790.5850.873
GA3Upper stem0.4610.6840.2830.5960.2660.4880.684
Middle stem−0.603−0.679−0.447−0.680−0.396−0.350−0.679
Basal stem−0.677−0.857−0.482−0.801−0.446−0.570−0.857
IAAUpper stem−0.2680.023−0.482−0.086−0.509−0.3180.023
Middle stem0.922 *0.7710.985 **0.8350.987 **0.911 *0.771
Basal stem−0.724−0.667−0.668−0.718−0.630−0.497−0.667
ABAUpper stem0.6120.3600.7820.4550.8040.6670.360
Middle stem0.4730.2070.6700.3020.7010.5630.207
Basal stem−0.392−0.418−0.274−0.442−0.222−0.103−0.418
SAUpper stem0.5700.7840.3730.7080.3450.5230.784
Middle stem−0.289−0.454−0.203−0.372−0.216−0.464−0.454
Basal stem−0.776−0.623−0.807−0.703−0.787−0.620−0.623
Notes: (**) Indicates a highly significant correlation at the 0.01 level, (*) indicates a significant correlation at the 0.05 level.
Disclaimer/Publisher’s Note: The statements, opinions and data contained in all publications are solely those of the individual author(s) and contributor(s) and not of MDPI and/or the editor(s). MDPI and/or the editor(s) disclaim responsibility for any injury to people or property resulting from any ideas, methods, instructions or products referred to in the content.

