Article

Assessment of Yield Stability of Bambara Groundnut (Vigna subterranea (L.) Verdc.) Using Genotype and Genotype–Environment Interaction Biplot Analysis

by
Rita Adaeze Linus
1,2,
Oluwaseyi Samuel Olanrewaju
1,3,
Olaniyi Oyatomi
1,
Emmanuel Ohiosinmuan Idehen
2 and
Michael Abberton
1,*
1
Genetic Resources Center, International Institute of Tropical Agriculture (IITA), Ibadan 200001, Oyo State, Nigeria
2
Department of Plant Breeding and Seed Technology, Federal University of Agriculture Abeokuta, Abeokuta 110001, Ogun State, Nigeria
3
Unit for Environmental Sciences and Management, Potchefstroom Campus, North-West University, Potchefstroom 2520, South Africa
*
Author to whom correspondence should be addressed.
Agronomy 2023, 13(10), 2558; https://doi.org/10.3390/agronomy13102558
Submission received: 14 July 2023 / Revised: 4 September 2023 / Accepted: 7 September 2023 / Published: 4 October 2023
(This article belongs to the Special Issue Frontier Studies in Legumes Genetic Breeding and Production)

Abstract

:
Biplot analysis has emerged as a crucial statistical method in plant breeding and agricultural research. The objective of this research was to identify the best-performing genotype(s) for the environments in three distinct regions of Nigeria while also examining the characteristics and magnitude of genotype–environment interaction (GEI) effects on the yield of Bambara groundnut (BGN). The study was conducted in Ibadan, Ikenne, and Mokwa, utilizing a sample of 30 accessions. The yield of BGN was found to be significantly affected by accessions, environment, and their interaction through a combined analysis of variance, with a p-value < 0.001. Biplots were utilized to demonstrate the pattern of interaction components, specifically the genotype’s main effect and genotype–environment interaction (GEI). The initial two principal components elucidated the complete variance of the GGE model, encompassing both genetic and genotype-by-environment interaction effects (PC1 = 87.81%, PC2 = 12.19%). The accessions that exhibited superior performance in each respective environment, as determined by the “which-won-where” polygon, were identified as TVSu-2223, TVSu-2236, TVSu-2240, and TVSu-2249 in Mokwa; TVSu-2214 in Ikenne; and TVSu-2188 in Ibadan. The accessions TVSu-2207 and TVSu-2199 exhibited stability in all environments, whereas the accessions TVSu-2226, TVSu-2249, TVSu-2209, TVSu-2184, TVSu-2204, and TVSu-2236 demonstrated adaptability. In addition, the accessions TVSu-2240 and TVSu-2283 were stable and adaptable in all environments. The accessions that were chosen have been suggested as suitable parental lines for breeding programs aimed at enhancing grain yield in the agro-ecological zones that were evaluated. This study’s findings identify BGN accessions with adaptability and stability across selected environments in Nigeria, suggesting specific accessions that can serve as suitable parental lines in breeding programs to enhance grain yield, thereby holding promise for improving food security.

1. Introduction

Vigna subterranea (L.) Verdc., commonly known as Bambara groundnut (BGN), is a leguminous crop mainly cultivated in semi-arid regions of Africa to ensure food and nutritional security. According to the FAO, 58,900 metric tons (Mt) of BGN are currently being grown, and it was expected to be over 100,000 Mt in 2008 [1]. The crop contains various nutrient and anti-nutrient contents [2,3,4,5]. These crops provide an essential source of food for humans and cattle [6], and recent investigations have suggested that they may be used to cure illnesses like diarrhea [3]. The seeds of these crops are also rich in protein, carbohydrates, fat, minerals, and fiber [2,4,5]. The crop is recognized for its capacity to withstand drought conditions and generate satisfactory crop yields even in the presence of drought-induced stress [4,6]. According to various reported studies, BGN exhibits significant genetic diversity [3,5,7,8,9]. In addition, indigenous rhizobia populations are responsible for nodulating the crop, and their molecular diversity and phylogeny have been evaluated in soils from Ghana and South Africa [10]. As a legume, it has the capacity to fix nitrogen, hence its importance in mixed cropping systems [11]. The studies on BGN have concentrated on enhancing agricultural practices and post-harvest techniques, creating contemporary genotypes that exhibit increased productivity and nutritional value, augmenting value through processing, and facilitating entry into the marketplace [12]. In one of such studies, a comparison was made between the nutritional, physicochemical, and functional properties of protein concentrate and isolate derived from newly developed BGN genotypes and those of market samples [13]. Another study investigated the impact of soaking and boiling on the levels of the anti-nutritional factors, oligosaccharide contents, and protein digestibility of recently developed BGN cultivars [14]. The evaluation of consumer awareness and acceptance of BGN as a protein source for incorporation into complementary foods in rural regions has also been reported [15]. BGN is a significant crop that is crucial in ensuring food and nutrition security in semi-arid regions of Africa.
BGN is still widely cultivated as a landrace because research on developing improved varieties of the crop is still very much limited when compared with major crops. The cultivation of Bambara groundnut is not limited to its center of origin in West Africa but has also been expanded to other regions such as South America, Asia, and Oceania [16]. However, there is still a lack of proper seed systems and widely shared best agronomic practices for this crop [17]. Research and development efforts are needed to establish modern crop management techniques and value chains to maximize the economic gains from Bambara groundnut production [12]. The crop is typically grown in regions with a dry or semi-arid climate [18,19]. It grows in a wide range of soil types, including sandy, loamy, and clay soils. However, well-drained sandy or loamy soils are generally preferred, allowing for better root penetration and water infiltration [18]. It can be planted directly in the field or in containers for later transplanting. The seeds are sown at a depth of about 3–5 cm, with 30–40 cm spacing between rows and 10–15 cm between plants [20]. The recommended planting density may vary depending on the specific variety and local conditions.
A crop variety must have a high yield and adapt to the environment to be successfully grown there. However, stability and adaptability are influenced by environmental conditions, which can lead to the genotype–environment interaction (GEI) phenomenon. This makes crop trait variability in various situations higher. Plant breeders are becoming increasingly interested in GEI studies to find long-term answers to factors affecting plant growth and development and to produce stable and adaptable varieties. In contrast, phenotypic analysis does not provide as strong a case for the genotype as does the influence of the environment on traits, either alone or in conjunction with genotype [21]. Consequently, assessing the crop’s stability is essential, which is why a plant breeder must conduct GEI research to validate stable and superior varieties.
The study of genotype–environment interaction is commonly conducted using two primary techniques: additive main effects and multiplicative interaction (AMMI) and a genotype plus genotype–environment interaction (GGE) biplot. Two techniques are employed to produce a basic graphical depiction of a complicated genotype, involving a two-way table of the environment and principal component analysis [22]. The disparity between the two techniques can be attributed to handling average values preceding the application of Singular Value Decomposition (SVD). The Singular Value Decomposition (SVD) technique is utilized on the data pertaining to additive main effects and multiplicative interaction (AMMI), with the exclusion of both genotype and environmental means, as stated in reference [23]. In this study, we will be using the GGE biplot method.
The GGE biplot methodology employs a graphical representation known as a biplot to exhibit the two prominent factors, namely genotype and genotype–environment interaction, responsible for generating variation. The GGE biplot is the most suitable method for assessing genotype performance regarding mean versus stability, discriminating power versus representativeness of the test environment, and multi-environment analysis, including the “which-won-where” pattern [24,25]. Since its introduction, several multi-environment analysis applications utilizing the GGE biplot approach have been documented. The yield stability of 95 accessions of BGN in four environments in Nigeria was analyzed by Olanrewaju, Oyatomi, Babalola, and Abberton [21] using the GGE biplot, while Mndolwa et al. [26] reported on the GGE biplot analysis of yield stability for Andean dry bean accessions grown in Tanzania under various abiotic stress regimes. Dalló et al. [27] also reported on soybean performance and stability in a multi-environment trial utilizing GGE biplot analysis. Furthermore, GGE biplot analysis has been implemented to study the stability of various crops, including wheat [28,29,30], soybean [27,31], maize [32], sorghum [33], sweet potato [34], lemon grass [35], barley [36], cowpea [37], and rice [38].
The aim of this study is to assess the stability of yield among thirty distinct BGN accessions. The results from this study will enable breeders to advise farmers appropriately on which accession to use where, provided that the various accessions meet the end-user quality preferences.

2. Materials and Methods

2.1. Plant Materials

The study involved 30 BGN accessions, as indicated in Table 1. The study locations comprised the varied geographic regions of Ibadan, Ikenne, and Mokwa, which are within the confines of the International Institute of Tropical Agriculture (IITA) Ibadan in Nigeria. The experiment included 30 BGN accessions meticulously chosen from a recent assemblage of BGN accessions that originated in Cameroon. The accessions were obtained and subsequently conserved at the IITA GenBank, a specialized facility specifically designed to contribute to the preservation and management of genetic resources.

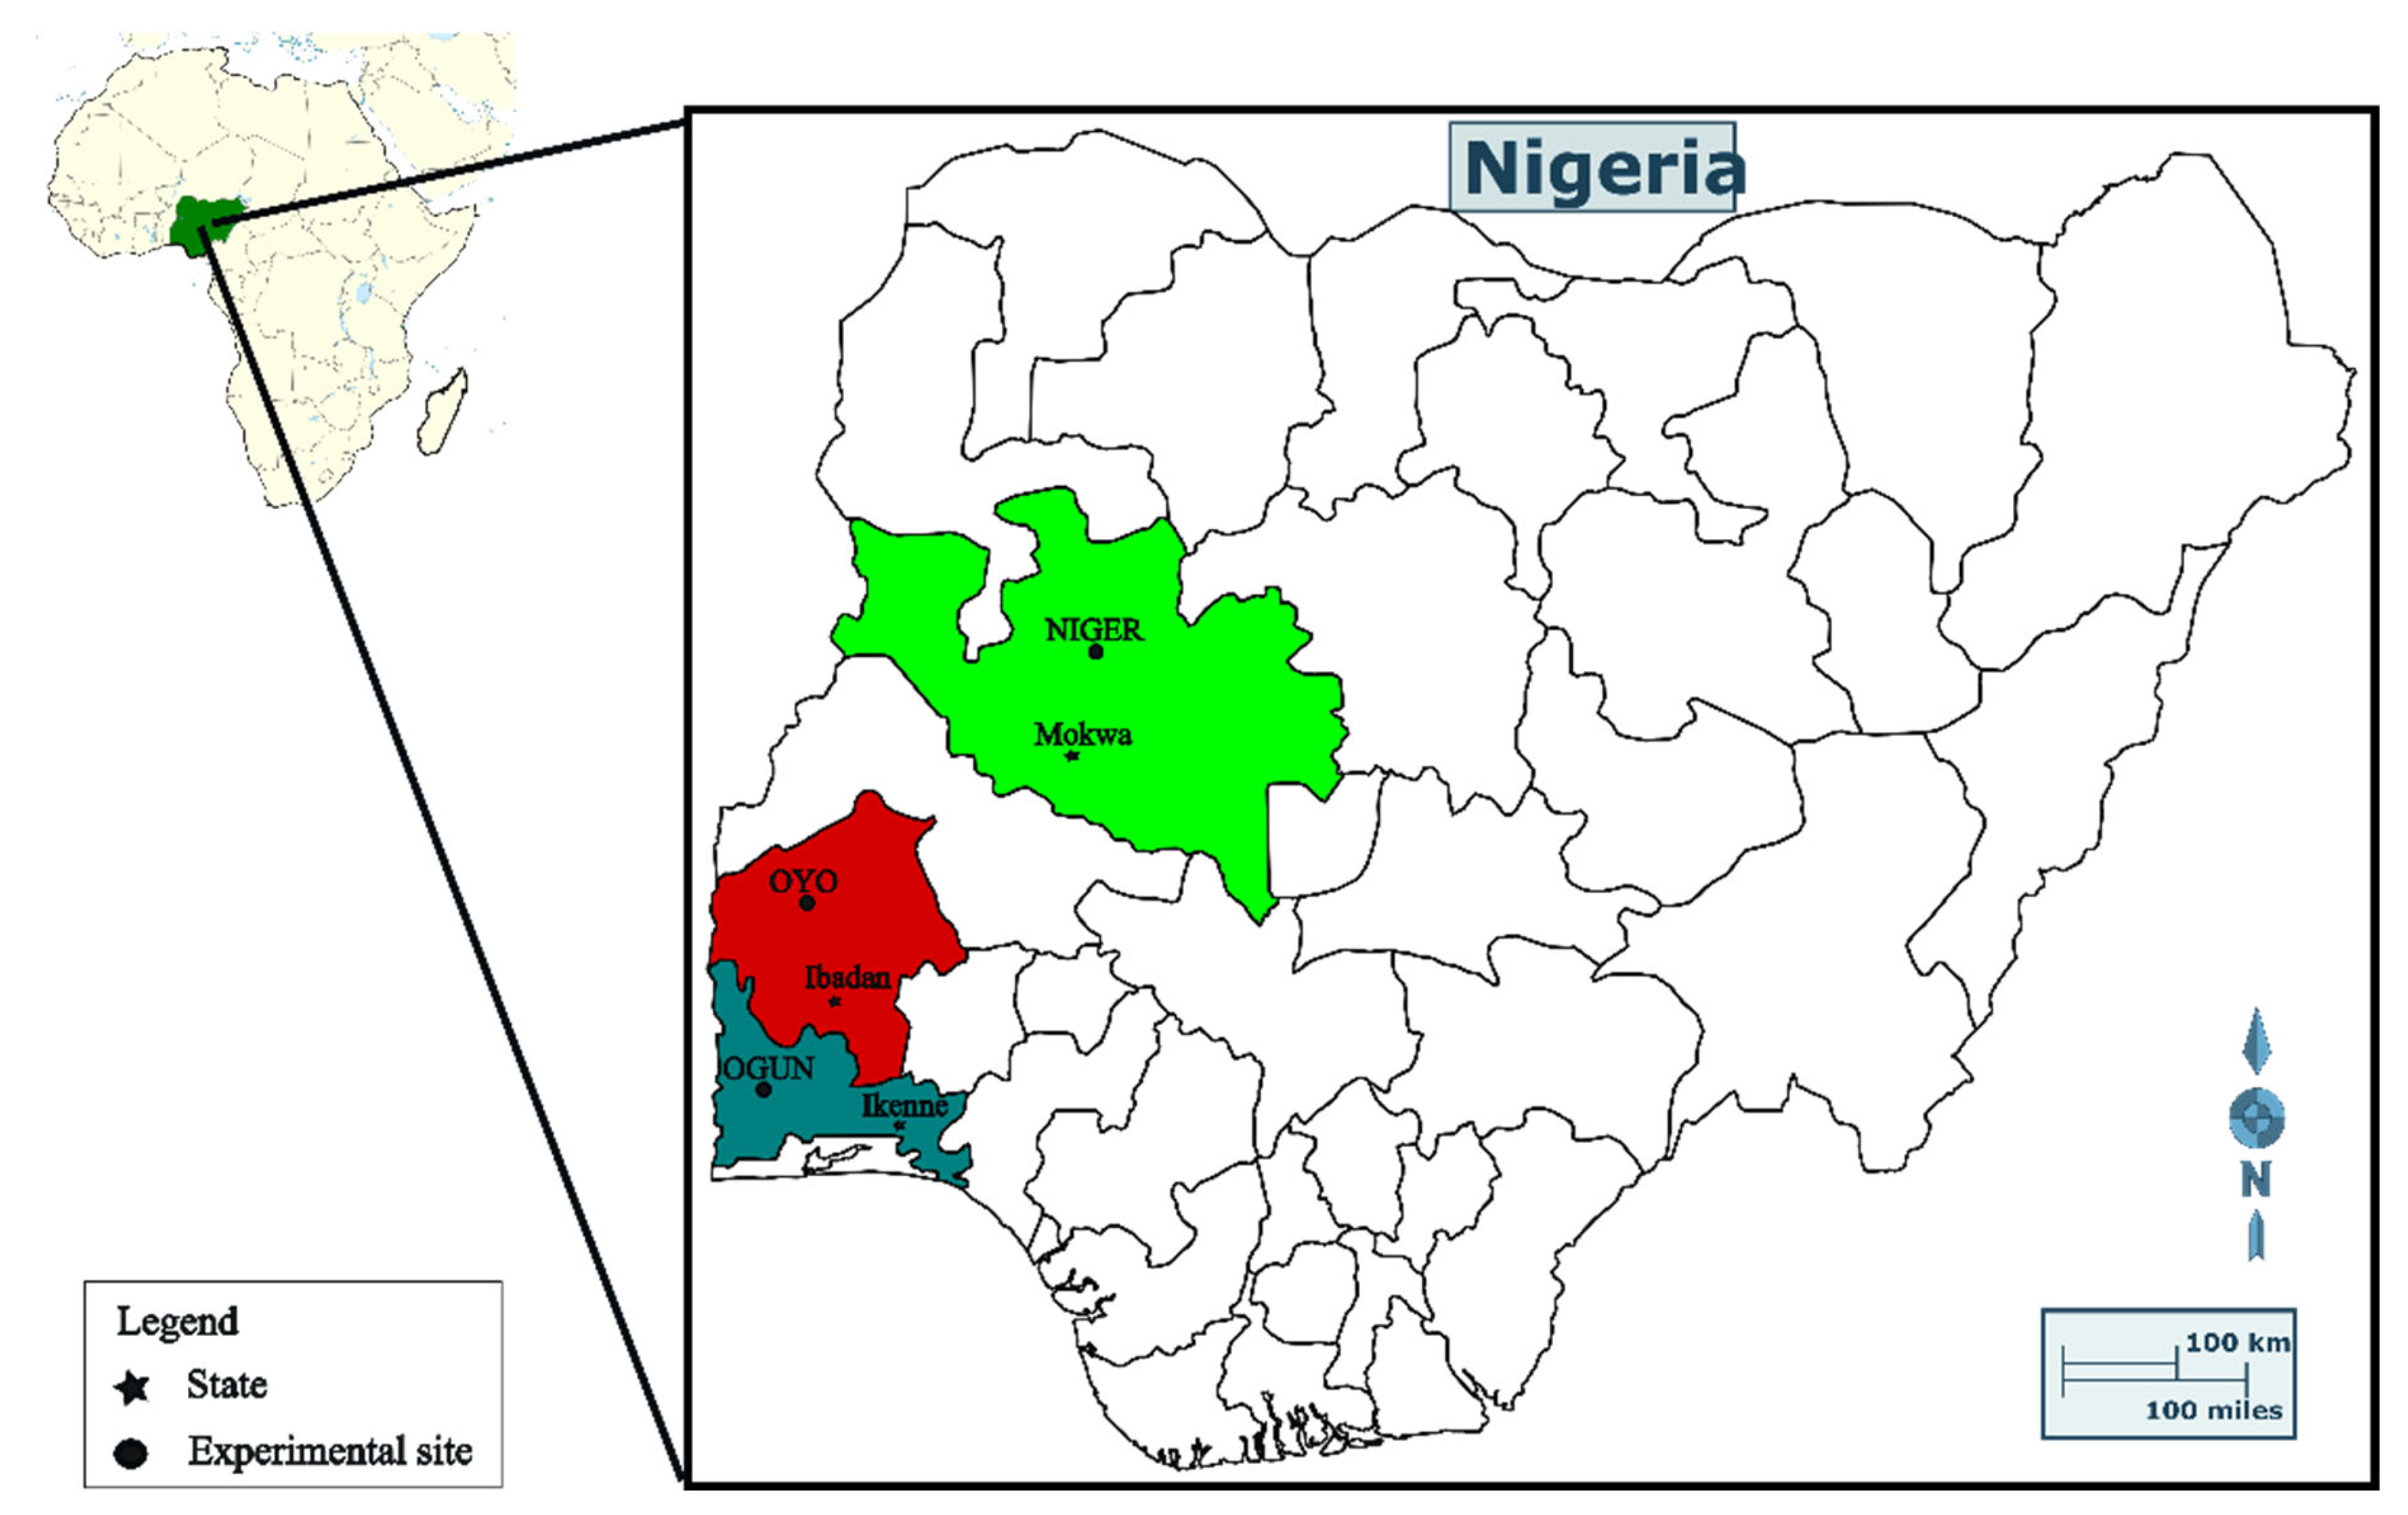
2.2. Study Site Description

The study was carried out in three distinct agro-ecological zones, namely Ibadan, Mokwa, and Ikenne (Figure 1). The geographical coordinates 7°40′19.62 N, 3°91′73.13 E correspond to Ibadan, which has been categorized as a derived savannah. Similarly, Mokwa, located at 9°12′16.98 N, 5°20′61.09 E, has been classified as a Guinea savannah, while Ikenne, situated at 6°51′00.873 N, 3°41′48.528 E, falls under the rainforest region. The study utilized the field stations established by the International Institute of Tropical Agriculture (IITA) in Ibadan, Mokwa, and Ikenne. Valuable data were collected during the 2020 planting season as part of the study. The precipitation levels were meticulously observed throughout the specified time frame, and the average precipitation measurements were documented as 75.26 mm, 26.4 mm, and 5.74 mm in Ibadan, Mokwa, and Ikenne, respectively. In addition, the research presents data regarding the lowest and highest recorded temperatures at the three sites. Ibadan experienced a range of temperatures, with the lowest recorded temperature being 22.61 °C and the highest temperature reaching 31.73 °C. The recorded temperature range in Mokwa was between 23.01 °C and 30.07 °C. Finally, it was observed that in Ikenne, the minimum temperature registered was 24.01 °C, whereas the maximum temperature attained was 28.91 °C. The choice to conduct the research across multiple locations, namely Ibadan, Ikenne, and Mokwa, facilitated the evaluation of the selected BGN accessions under various agro-climatic conditions.

2.3. Soil Sampling and Analysis

Topsoil samples were obtained from 0 to 15 cm over the entire plot using the soil auger and put together to obtain a composite sample before establishing the experiment. The soil sample was dried under shade and passed through a 2 mm sieve for subsequent chemical analyses (sand, clay, silt, pH, organic carbon (OC), total N (nitrogen), exchangeable Ca (calcium), Mg (magnesium), K (potassium), available P (phosphorus), Na (sodium), Mn (manganese), Cu (copper), Fe (iron), and Zn (zinc)) and particle size distribution at the onset of the experiment.

2.4. Field Trials and Yield Data

A randomized complete block design was used in the trials to analyze the various accessions. Thirty mancozeb-treated seeds were included in each accession and were planted in the 2020 growing season. The accessions were cultivated in triplicate to guarantee accuracy, leading to a cumulative count of three replicates. Ten plants were chosen from every accession in each replicate and assigned to a specific plot. The dimensions of the plots were made uniform, with a length of 22 m. Each plant within a plot was separated by 2.2 m, and there was a gap of 2 m between each adjacent plot. A solitary block was established within each replicate to improve experimental precision and account for potential variability. The planting activities were initiated on predetermined dates for each research site. The commencement of planting in Mokwa was initiated on 15 July 2020. The planting dates for Ikenne and Ibadan were recorded as 29 August and 13 August, respectively. Before implementing a weekly irrigation schedule, the plants depended solely on precipitation to fulfill their water requirements. The crops depended on precipitation until rainfall cessation, at which time an irrigation regimen was instituted. This methodology aimed to replicate authentic environmental circumstances and facilitate the proliferation and maturation of the accessions in conventional rainfed and irrigated settings. The formula following formula was used to convert the weight of the seeds into a yield of the grain:
Yield   kg / ha = plot   yield   ×   10,000 plot   area . This was then converted to hectares. An electronic balance was used to attain a triplicate of each accession’s total seed weight. Weeding was carried out manually as required using hoes and uprooting.

2.5. Statistical Analysis

Field data collection was performed using a field book [39], and data entry was carried out using Microsoft Excel 2016. For stability analysis in this study, the well-known regression model jointly developed by Eberhart and Russell [40] was applied. Eberhart and Russell’s model utilizes a joint linear regression approach, where the environmental indices are regressed against the yield of each genotype. The model characterized the genotype’s behavior using the equation Yij = μi + βiIj + δij. Here, Yij represents the average performance of genotype I in environment j, μi denotes the overall average performance of genotype i across all environments, βi represents the regression coefficient capturing the response of genotype i to the environmental index, Ij is the environmental index calculated as the difference between the average of each environment and the overall average, and δij represents the deviation of genotype i from its regression in environment j.
The GGE biplot approach was employed for analyzing genotype–environment interactions and determining yield stability in cases of significant differences. The biplot was generated from the first two principal components (PC1 and PC2) using the environment-focused yield [41]. GEA-R version 4.1 [42] was used for the analysis. The fitting of the model involved applying singular value decomposition (SVD) to PC1 and PC2 [43], resulting in the following equation:
Yij = µ + βj + λ1ξi1η1j + λ2ξi2η2j + εij.
Yij represents the average trait value for genotype i in environment j, µ represents the overall mean, βj represents the main effect of environment j, and µ + βj represents the average yield across all genotypes in that environment. The singular values for PC1 and PC2 are denoted as λ1 and λ2, respectively. The eigenvectors of genotype i for PC1 and PC2 are ξi1 and ξi2, while the eigenvectors of environment j for PC1 and PC2 are η1j and η2j, respectively. The notation εij represents the residual associated with genotype i in that environment j.
The GGE-biplot analysis was employed to generate graphs for various purposes, including (i) analyzing mean performance and stability, (ii) identifying the “which-won-where” pattern, (iii) exploring the relationship among test environments, (iv) assessing ranking discrimination, and (v) evaluating the representativeness of test environments. The correlation between the two environments was evaluated by measuring the angles between the position vectors within the GGE biplot [44].

3. Results and Discussion

The assessment of variances on GEI has the capacity to function as a stability estimator within breeding programs. The occurrence of GEI has been recorded in various crops, including wheat, cotton, and sugarcane [45,46,47]. Furthermore, applying precise statistical methodologies, such as the GGE biplot, is a widely used practice in assessing GEI in plant breeding initiatives [21,25,26,48,49]. In addition, cultivating crops with high productivity that are well suited to a given environment requires adherence to specific expectations, including but not limited to efficient nutrient absorption, resistance to weed infestation, and increased yield.
In contrast to the AMMI model, the GGE biplot method represents the genotypic main effect as a multiplicative effect with respect to the genotype–environment interaction. The uniformity of signs observed in the PC1 scores across all locations indicates the presence of a non-crossover genotype–environment interaction in PC1. The genotypic PC1 scores are often significantly correlated with the genotype’s main effects, rendering them a practical substitute for the latter. However, it is essential to note that the two concepts are fundamentally distinct. The genotypic main effect is characterized as a consistent genotypic impact across all environments. However, the anticipated yield projections from PC1 in the GGE biplot for a specific genotype exhibit variability. The degree of variation of the observed phenomenon is directly proportional to the PC1 scores of the corresponding environment. The notion that the yield response of genotypes is proportional is deemed more reasonable and biologically tenable compared to the concept of additive main effects.
Furthermore, a distinctive characteristic of this concept is that it identifies locations that enable the identification of genotypes with a higher main effect. The GGE biplot exhibits a notable advantage in distinguishing between genotype responses that are proportionate and disproportionate. This differentiation holds significant implications for both crossover and non-crossover genotype–environment interactions. The comprehension of the interactions can be attained by correlating PC1 and PC2 scores with genotypic and/or environmental covariates.
Therefore, this study aimed to evaluate the stability and productivity of 30 accessions of BGN across three distinct locations, thus creating three unique environments in Nigeria. This was achieved through a multi-environmental trial. The study commenced with a combined analysis of variance (ANOVA) on aggregated data to assess the extent to which genotype and environment contribute to variance and evaluate GEI’s statistical significance. Subsequently, a stability analysis was performed using GGE biplot analysis. This was achieved by visually examining the connections between the assessed genotypes and environments, identifying potential mega-environments within the investigated region, and assigning a ranking to both the genotypes and environments based on their yield.
The substantial differences and high coefficient of variation (94%) in the study’s findings show significant variability in yield within the chosen population. This variability can be harnessed to enhance breeding programs. According to earlier studies [50,51], the availability of traits facilitates choosing the best lines for enhancement through trait-assisted selection. Yan and Kang [44] have posited that the extent of environmental variation depends on the number of genotypes and environments. Furthermore, Aremu et al. [52] asserted that the environment constitutes the primary source of diversity in plants. As such, it is imperative to consider it in the context of plant breeding.

3.1. Soil Analysis

The soil nutrient composition and properties were lowest pH in Ikenne, followed by Mokwa and Ibadan, while phosphorous was lowest in Mokwa and highest in Ikenne (Table 2). Carbon and nitrogen were highest in Ikenne. For the soil properties, Mokwa contained the highest amount of sand and the lowest amount of clay compared to the other two locations. At the same time, for the mineral contents, Ibadan had more calcium, magnesium, potassium, sodium, zinc, and manganese than the other two locations. Meanwhile, Ikenne had the highest amount of copper, and Mokwa had the highest iron content.
Extensive research highlights the crucial role of soil and climate in influencing crop yield [53,54,55,56,57]. Various soil types yield different responses from crops. Sandy soil supports the successful production of BGN despite hindering crop emergence [18]. Its permeable composition and abundant pores facilitate plant growth. When dry, sandy soil develops narrow cracks that benefit crops in regions with erratic rainfall [58,59]. Conversely, clay soil retains water but expands and contracts, stressing plant roots. Understanding these soil–climate interactions aids in optimizing agricultural productivity, particularly in semi-arid areas with unpredictable precipitation patterns.

3.2. Pooled Analysis of Variance

A pooled analysis of variance was conducted to determine the significance of the GEI (Table 2). However, the large impact of GEI on yield poses a great challenge to identifying the best genotypes in relation to yield. Hence, breeders should consider quantifying GEI when developing strategies for complex traits like yield [21]. In addition, to produce reliable results, genotype and environmental factors should be prioritized in selection processes. In this study, accessions, environments, and interaction effects were all significant sources of variation at p < 0.001 (Table 3). This implies that the yield of the accessions in each environment varies significantly, which agrees with the reports of Olanrewaju, Oyatomi, Babalola, and Abberton [21] and Chibarabada, Modi, and Mabhaudhi [60], who found significant interactions between accessions and environments in response to yield. Specifically, in this study, the reported climate in each location was different, as reported earlier. With respect to this, the most significant variation observed in this study can be attributed to the environment (Table 3) which is influenced by the various climatic conditions in each environment. The climatic condition is an important factor in crop production and yield. For instance, BGN thrives well in moderate rain and temperature because high amounts of rainfall affect the pods, which are under the ground [6]. A similar result was obtained on the grain yield of corn in the studies of Hudson et al. [61] and Azrai et al. [62]. Their findings attributed the majority of the variations observed to the effect of the environment. On the contrary, Esan et al. [63] ascribed a larger portion of observed variation in their study to the BGN genotypes.
This study reports a significant contribution of GEI (p < 0.001) to the yield of BGN accessions, hence justifying the need for further analysis.

3.3. GGE Biplot Analysis

The analysis of MET’s adaptation and stability using the GGE biplot is effective [64]. It enables the evaluation of the environment centered on the GGE view’s capacity for discrimination and representativeness [48]. This gives it an edge over the AMMI biplot analysis [65]. Furthermore, the biplot displays a polygon that encompasses all genotypes within its area, with its vertices representing the genotypes situated at the greatest distance from the origin. The biplot is partitioned into sectors by perpendicular lines that intersect each side of the polygon. The vertex genotypes exhibit superior performance in the mega-environment, while they are considered inferior genotypes for all tested environments when placed in a sector lacking suitable environments [47]. In this study, the relationship among the test environments was modeled based on environment-centered (centering, 2) and environment-metric-preserving (SVP, 2) without the scaling option in the GEA-R software. The results suggested that the environments could be classified into three mega-environments. The biplot described all the observed variations, with PC1 (axis 1) explaining 87.81% and PC2 (axis 2) explaining 12.19% (Figure 2). From the biplot, all the accessions and environments were mostly loading on the first component. Similar findings were reported by Olanrewaju, Oyatomi, Babalola, and Abberton [21]; Esan, Oke, Ogunbode, and Obisesan [63]; and most biplot analyses.

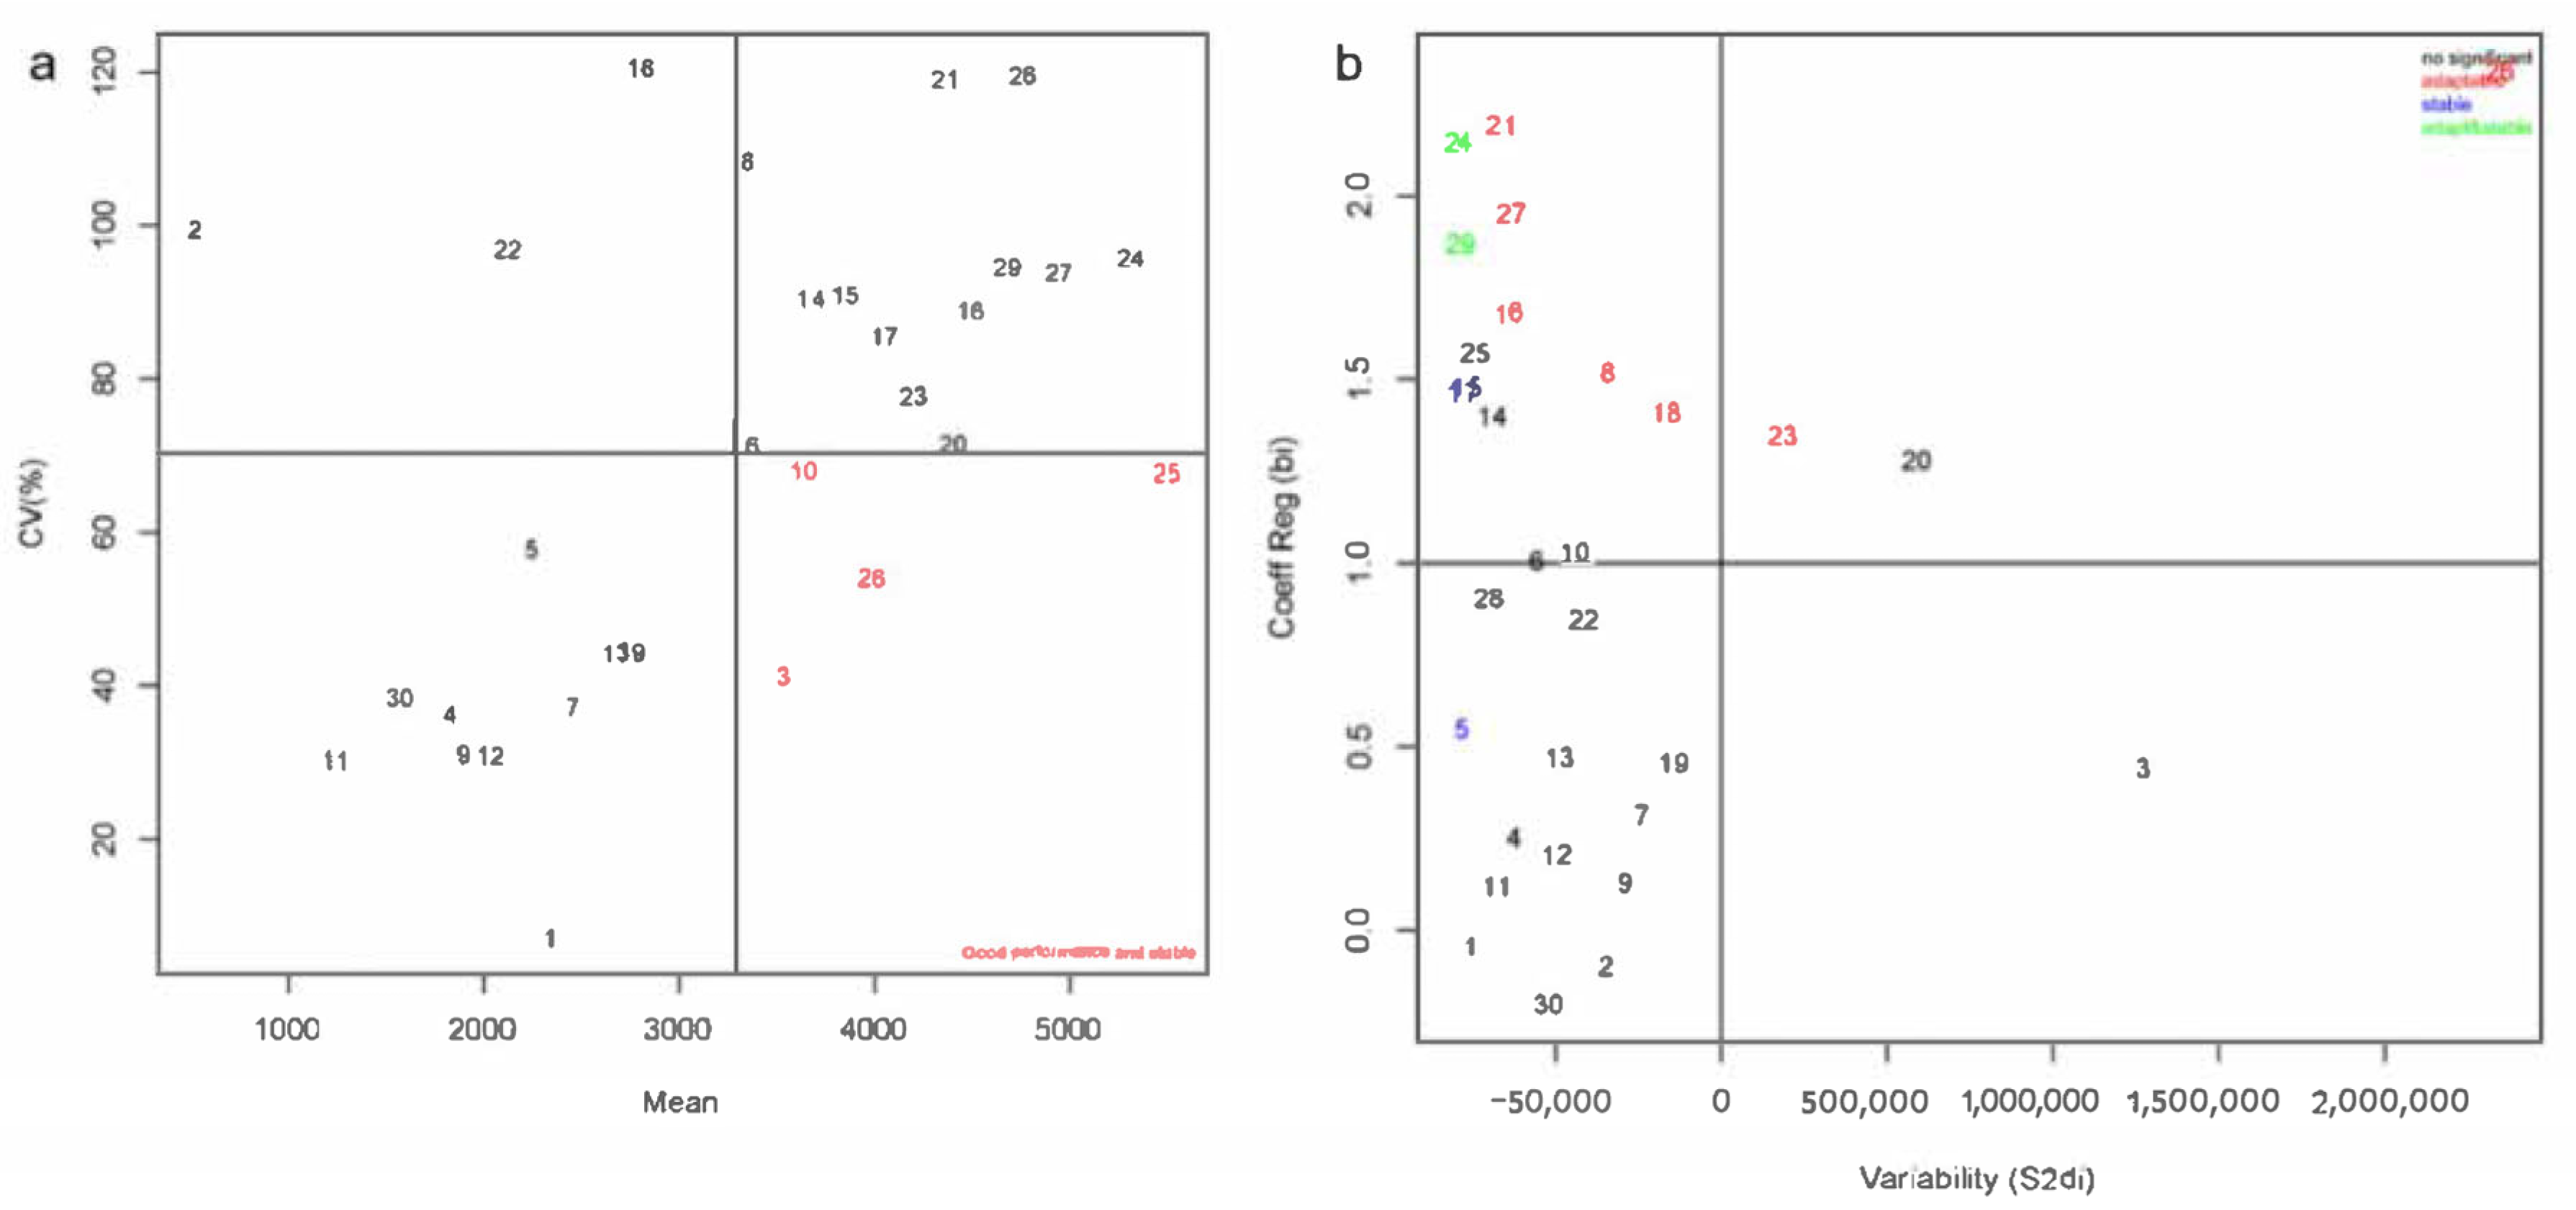
3.4. Stability Analysis

Plant breeders select genotypes based on yield stability and adaptation. Yield stability is a cultivar’s ability to provide steady yields in different agro-climatic conditions, while adaptability is its ability to thrive in specific environmental conditions. A stable, high-yielding cultivar maintains yields in harsh situations, ensuring food security and reducing the farmer’s risk. Adaptability is essential for a genotype/accession to function well in a specific environment or soil type. Farmers need adaptable crop varieties to maximize their harvests. Therefore, breeders must consider adaptation and production stability while choosing genotypes/accessions. Yield stability and adaptation can be contrasting, making it difficult to achieve both. An adaptable genotype/accession in one environment may not be stable in other environments. Hence, stability and adaptability affect plant varieties’ production efficiency. An accession can be beneficial if it has a high grain output and can improve productivity in various environments [66].
Consequently, evaluating adaptability and stability is essential for enhancing crop production. In addition, stability analysis allows breeders to evaluate and assess the genotype’s/accession’s productive potentials and limitations in each environment [67]. Stability analysis helps identify genotypes that consistently perform well across a range of environments, ensuring that the genotypes/accessions are reliable and adaptable [67]. The GGE biplot is helpful in analyzing the stability and adaptability of MET [64]. This methodology has the capability to ascertain optimal genotypes/accessions that are suitable for a particular environment. According to the Eberhart coefficient analysis in Figure 2, accessions TVSu-2207 and TVSu-2199 were stable across all environments, while accessions TVSu-2226, TVSu-2249, TVSu-2209, TVSu-2184, TVSu-2204, and TVSu-2236 were adaptable, and accessions TVSu-2240 and TVSu-2283 were both stable and adaptable. However, accessions TVSu-2193, TVSu-2181, TVSu-2241, and TVSu-2254 were stable and performed well according to the CV-mean analysis (Figure 3). Multi-environment trials are crucial in plant breeding to assess the impact of GEI on different genotypes/cultivars. It is essential to consider the average performance of traits and the stability of genotypes when selecting desired genotypes. This is important to minimize potential commercial losses for farmers. Among the accessions evaluated in this study, accessions TVSu-2240 and TVSu-2283 exhibited adaptability and stability across the three locations, making them the most desirable among the studied accessions. Similar to our result, various crop accessions/genotypes suitable for improved breeding programs based on their yield stability have been identified by various studies [21,22,26,28,29,32,35,36,37,38,62,63,64,66,68].

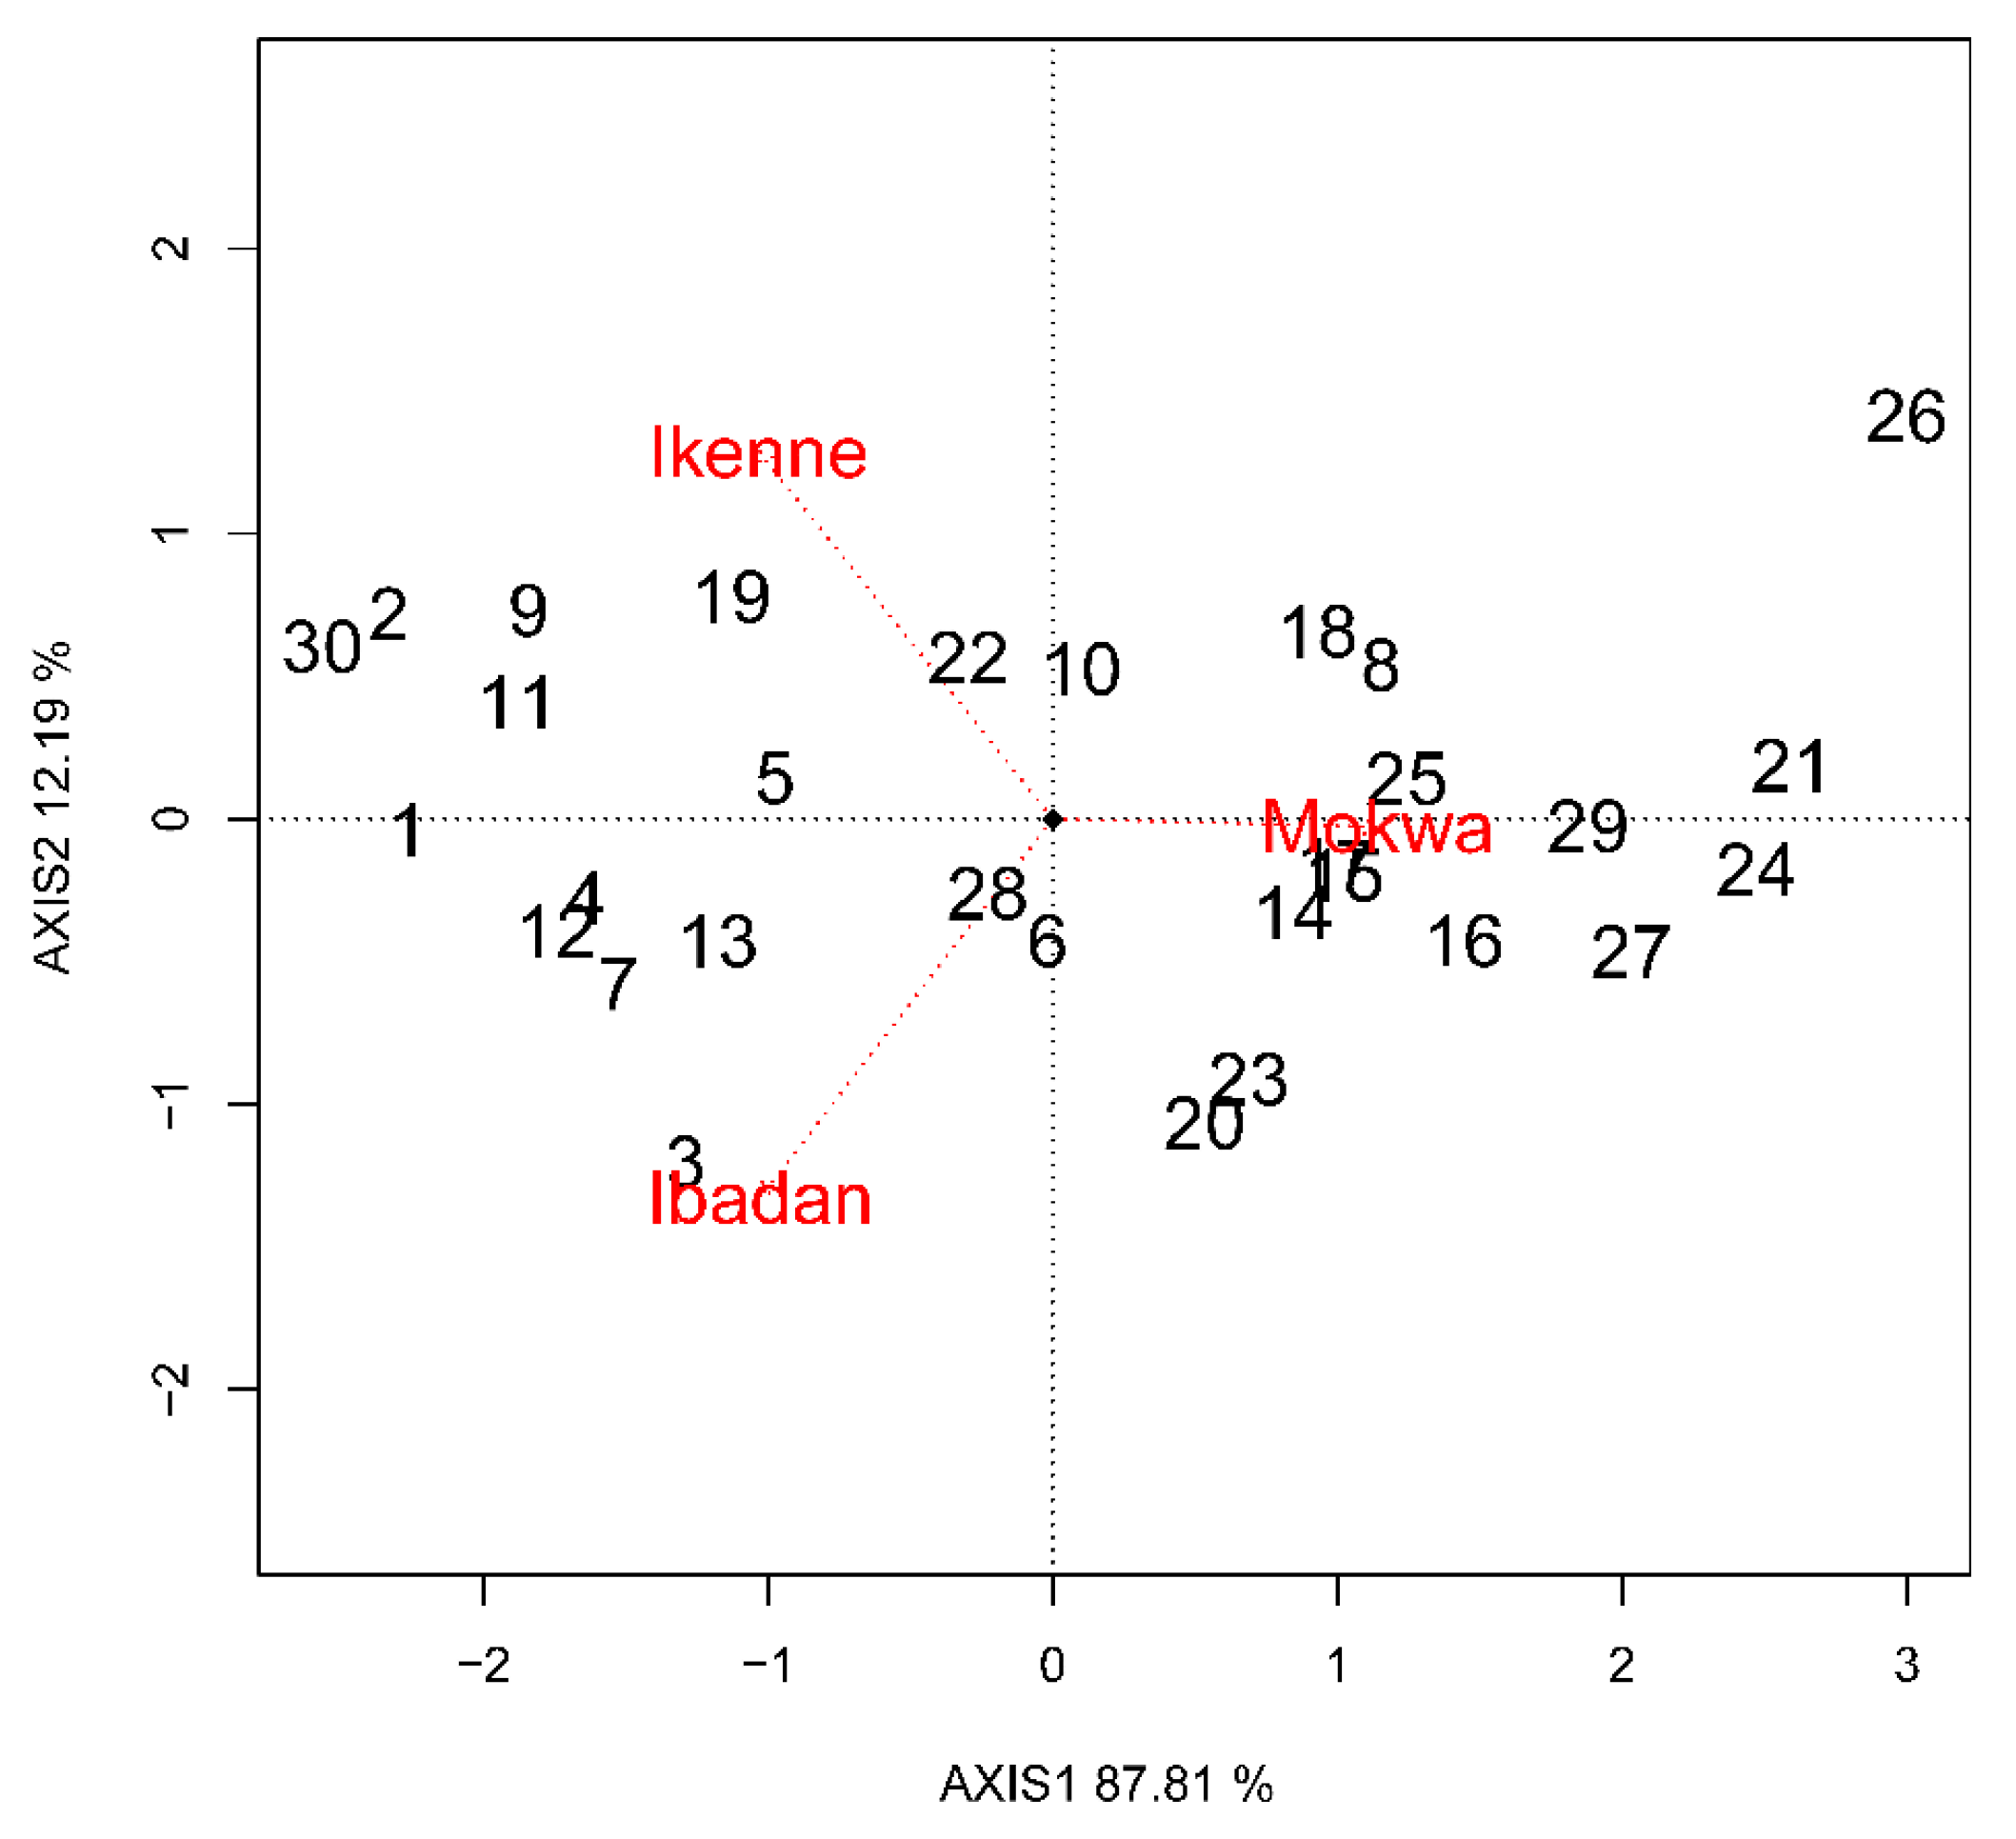
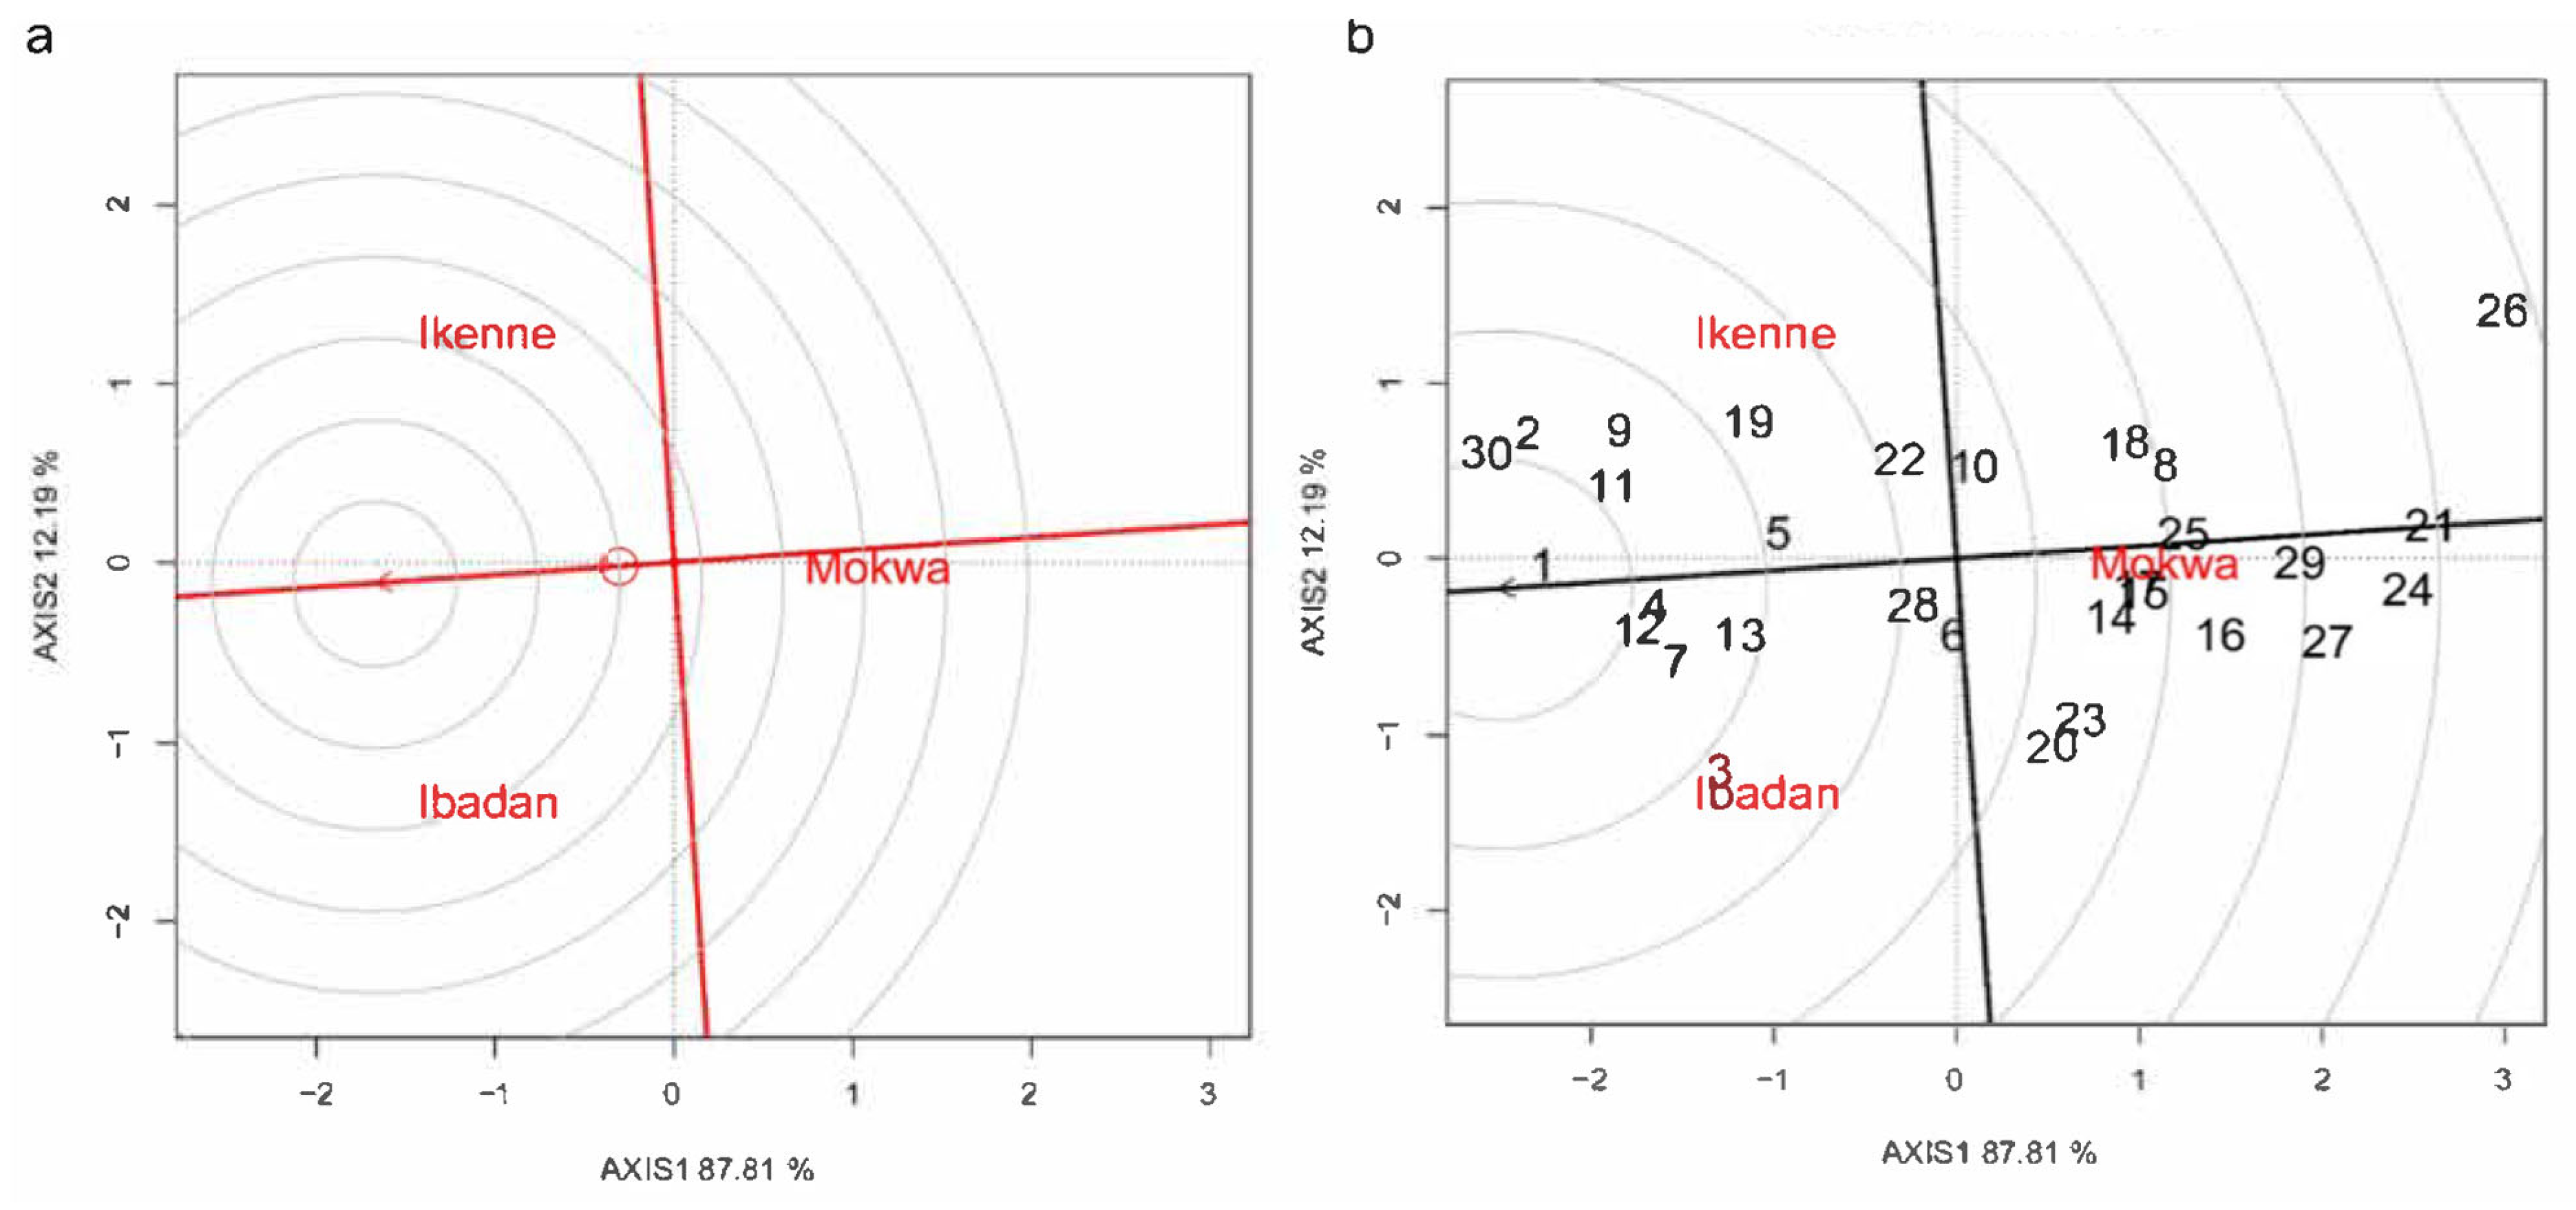
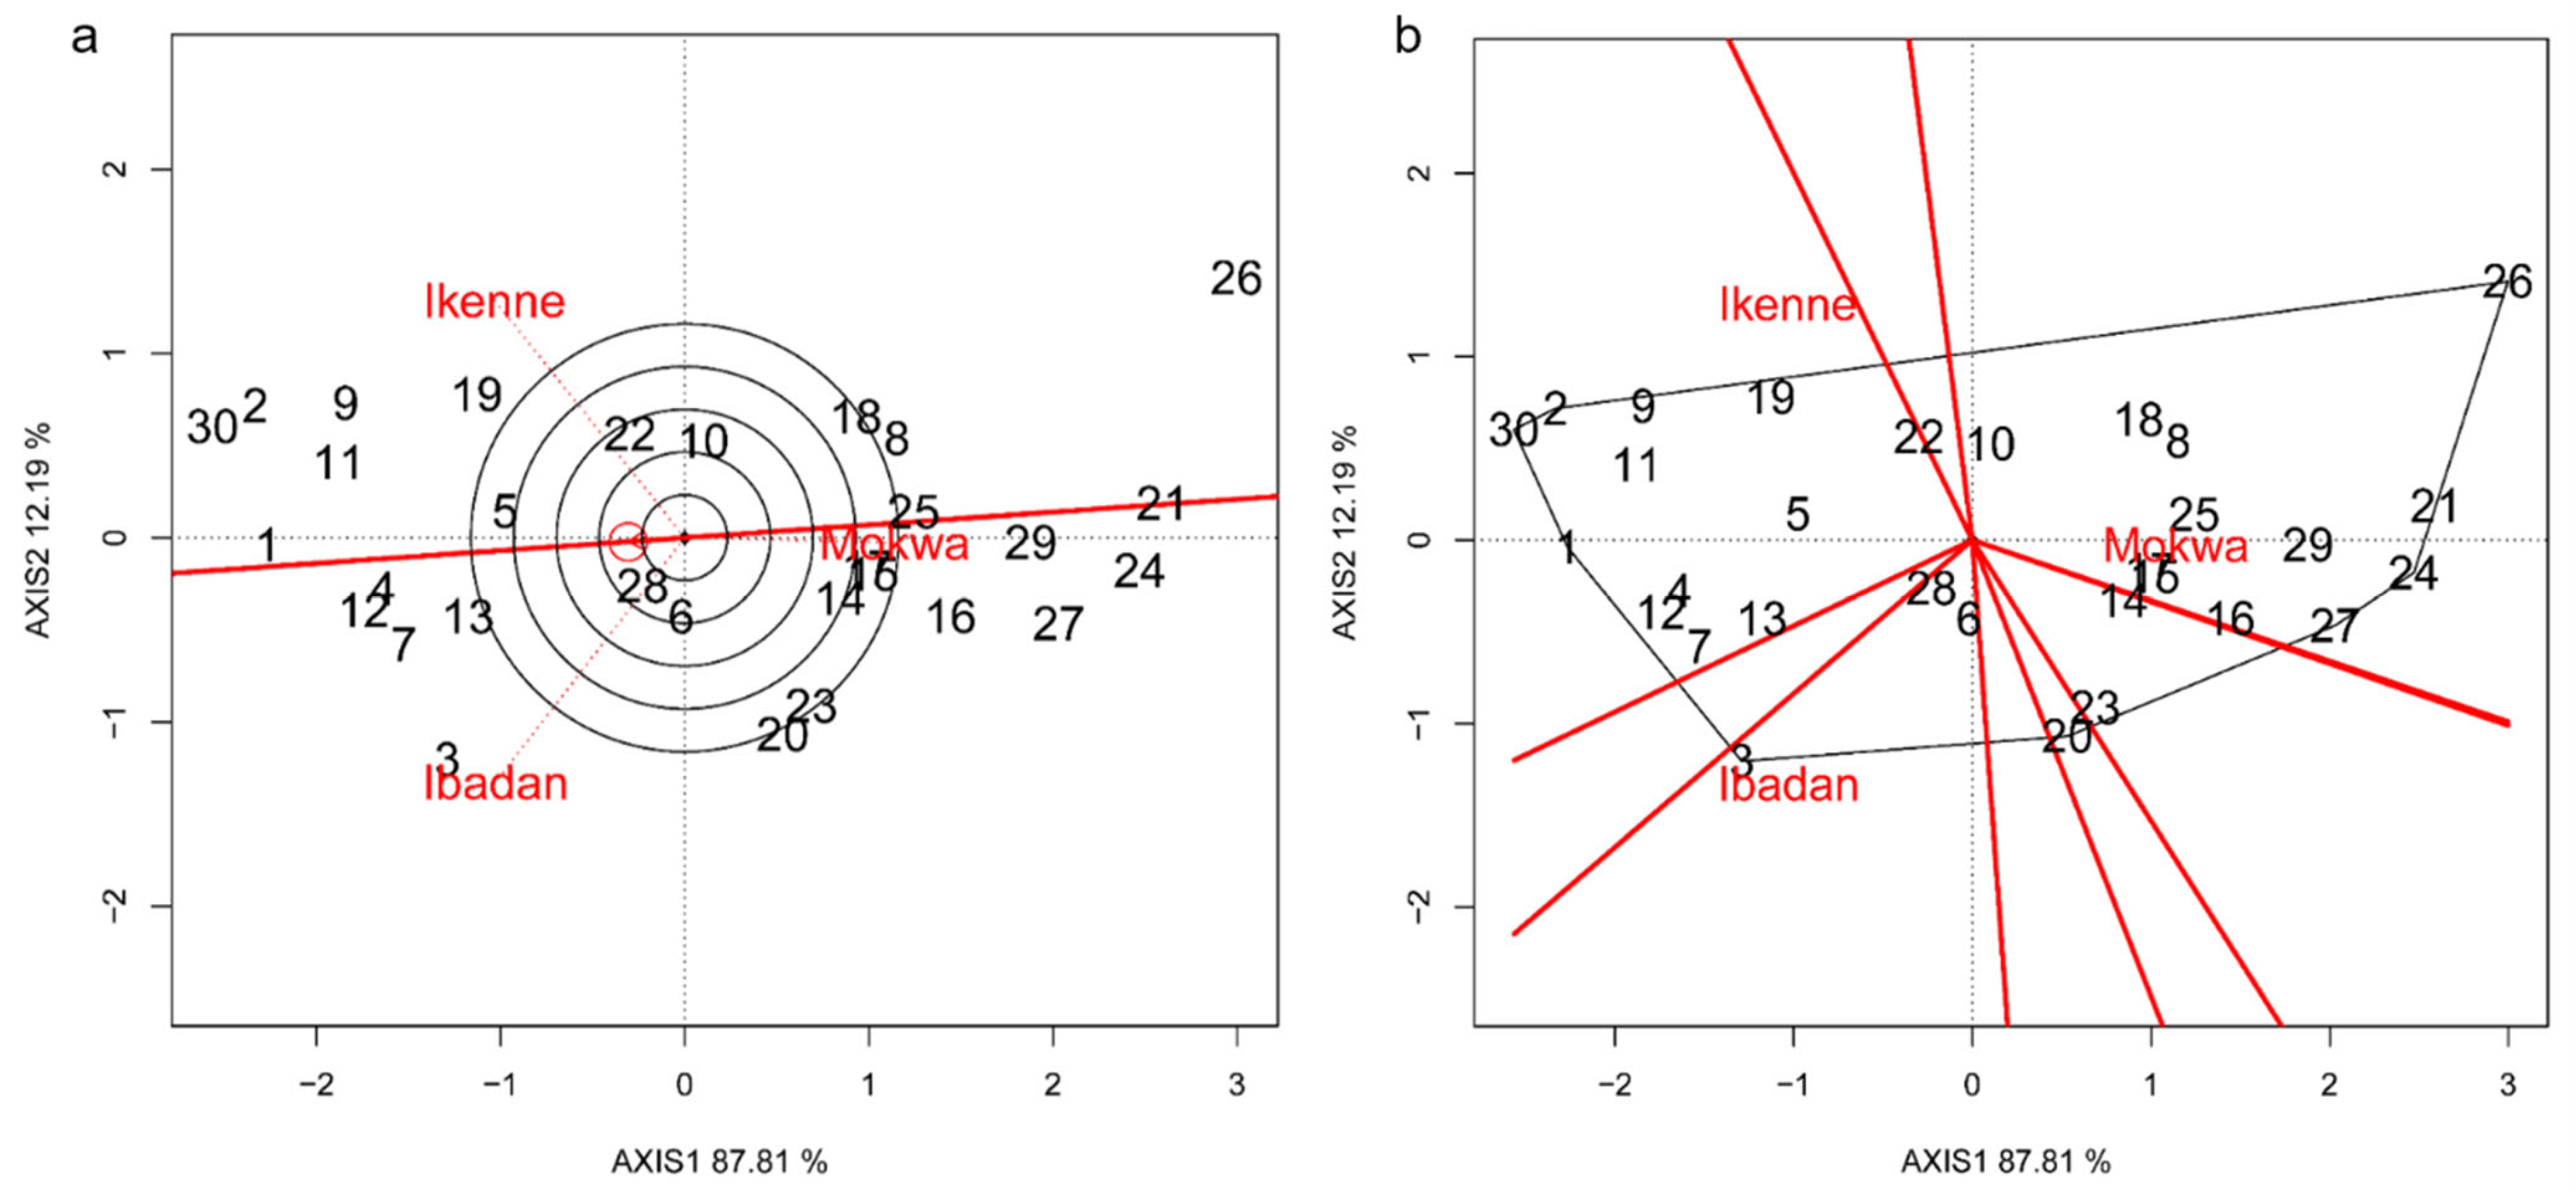
3.5. Environment and Genotype Ranking Analysis and Relationship among Environments

The distance between each environment and the center of the axis determines the performance of the environment [21]. Hence, Mokwa is the best-ranked environment among the three environments studied (Figure 4a). It is characterized by moderate rainfall and temperature. However, the ideal environment is represented by a small circle with an arrow pointing to it [21]. The best-ranked accessions are those closer to the inner circle, which are TVSu-2188 (the most ideal) followed by TVSu-2254, TVSu-2199, and TVSu-2200 (Figure 4b). These accessions are the stable accessions. Among the environments, it was observed that there was a significant variation in the yield of the accessions. Similar results were reported by Esan, Oke, Ogunbode, and Obisesan [63] and Oladosu, Rafii, Abdullah, Magaji, Miah, Hussin, and Ramli [22] on the yield of BGN and rice, respectively.

3.6. Discriminating and Representativeness and “Which-Won-Where” Analysis

Assessing an ideal environment is crucial in identifying superior genetic types that are well suited for a particular environment. GGE biplots are utilized to evaluate the discriminatory effect of an environment in terms of genotype differentiation and its ability to encompass all other assessed environments [21,68]. The theoretical framework of the average environment coordination perspective relies on applying singular-value partitioning with a focus on the interplay between genotype and environment. The magnitude of the environmental vector is directly proportional to the standard deviation of the average genotype across various environmental conditions, as reported by Yan, Kang, Ma, Woods, and Cornelius [24]. Thus, the discriminatory capacity of a specific environment is determined by the size of its corresponding vector.
The ability to distinguish due to genetic variances and the capacity to represent target environments should be considered while selecting test environments [31,49]. Ibadan has the longest vector and the smallest angle with an ideal environment in the current study, identifying it as a perfect test environment in terms of discrimination and representativeness. However, accession TVSu-2209 is the most discriminating among the accessions studied (Figure 5a). The angle between accession and the average-accession axis represents the representativeness of the accession: the larger the angle, the less representative the accession. Hence, TVSu-2209 is the least representative.
The utilization of the polygonal representation of the “which-won-where” biplot constitutes a fundamental element of the genotype and environment interaction (GGE) methodology. This approach facilitates the visualization of the interaction patterns between genotypes and environments, thereby enabling the identification of crossover GEI, mega-environment differentiation, and specific adaptation [69]. Identifying mega-environments for the yield enables us to pinpoint exceptional accessions that excel in specific environments. Particularly, the accessions located at the corners of the polygons in the biplot represent the best-performing accessions in that environment. These accessions exhibit superior performance and adaptability within the environment. Their prominence suggests that they are highly responsive and exceptional regarding their potential yield within their respective environments [63]. In determining which accession performed best at which location, accessions TVSu-2223, TVSu-2236, TVSu-2240, and TVSu-2249 performed very well in Mokwa. In contrast, accession TVSu-2214 performed best in Ikenne (Figure 5b). Accession TVSu-2193 performed best in Ibadan, while accession TVSu-2188 performed similarly in Ibadan and Ikenne. Accessions at the corners of the polygons in a “which-won-where” polygon are the outstanding accessions in that environment [69]. Similar results were reported in various studies, including those by Esan, Oke, Ogunbode, and Obisesan [63] and Nehe et al. [70].
Building on these findings, we now discuss suggestions for further enhancing the utilization of biplot analysis in plant breeding and agricultural research, mainly focusing on BGN and related crops.
To strengthen the generalizability of our findings, future research endeavors should encompass a broader spectrum of agro-ecological zones. We can learn more about how genotype and environment work together by including regions with different environmental conditions. This will help us find genotypes that can adapt to a broader range of developmental conditions.
Furthermore, expanding the scope of our study to incorporate other significant agronomic traits beyond grain yield is recommended. Disease resistance, drought tolerance, and nutritional quality are just some traits that should be considered. By evaluating a broader range of traits, breeders can develop enhanced genotypes that exhibit elevated yield potential and desirable characteristics for end-users and consumers.
To account for environmental fluctuations and ensure the consistency of our genotypes, it is necessary to conduct multi-environment trials spanning several seasons. By evaluating genotypes under varying environmental conditions and over multiple years, we can gain a more comprehensive understanding of their efficacy and consistency. This approach will enhance the dependability of our genotype suggestions and further strengthen the reliability of our research and breeding initiatives.
Finally, we can fully use the power of biplot analysis to speed up the development and use of better genotypes by incorporating these ideas into future research and breeding projects. This will contribute to the sustainable progress of crop production and food security, not only in Nigeria but also in other regions. The benefits of biplot analysis in plant breeding and agricultural research will be maximized by widening the scope of research, including more agronomic traits, and adding multi-environment trials. This will lead to better genotypes that can deal with the many problems that arise in agricultural systems.

4. Conclusions

This research utilized biplot analysis to evaluate the impact of genotype–environment interaction (GEI) and recognize high-performing genotypes of Bambara groundnut (BGN) in three regions of Nigeria. Ultimately, the findings of this study suggest the potential for utilizing biplot analysis as a valuable tool in crop breeding programs. The findings underscore the significance of utilizing biplot analysis in plant breeding and agricultural research. The recommended parental lines for breeding programs to improve BGN grain yield based on stability and adaptability in the evaluated agro-ecological zones are TVSu-2240 and TVSu-2283. These accessions have been selected based on their performance and characteristics. The results obtained from this investigation offer valuable perspectives for the enhancement of cultivars and the maximization of agricultural output across the varied agro-ecological zones in Nigeria. Subsequent research endeavors may utilize these findings to improve the productivity and resilience of BGN through precise breeding and cultivation techniques.
To establish delineated mega-environments, gathering data from multiple locations over cropping seasons is imperative. It is imperative for studies to incorporate a substantial amount of historical data spanning multiple years. To gain a more comprehensive understanding of the factors influencing the GEI, obtaining soil and meteorological data is imperative.

Author Contributions

Conceptualization, R.A.L., O.S.O., O.O., E.O.I. and M.A.; data curation, R.A.L., O.S.O., O.O., E.O.I. and M.A.; formal analysis, R.A.L. and O.S.O.; funding acquisition, O.O. and M.A.; investigation, R.A.L., O.S.O. and O.O.; methodology, R.A.L. and O.S.O.; project administration, O.O. and M.A.; resources, O.O. and M.A.; supervision, O.O., E.O.I. and M.A.; validation, R.A.L. and O.S.O.; visualization, R.A.L. and O.S.O.; writing—original draft, R.A.L.; writing—review and editing, O.S.O., O.O., E.O.I. and M.A. All authors have read and agreed to the published version of the manuscript.

Funding

The work of GRC was funded by the Global Crop Diversity Trust and CGIAR.

Data Availability Statement

This manuscript has no associated data.

Acknowledgments

The assistance rendered by the staff of the Genetic Resources Center, IITA, is greatly appreciated.

Conflicts of Interest

The authors declare no conflict of interest.

References

  1. FAO. World Food and Agriculture—Statistical Yearbook; FAO: Rome, Italy, 2020; p. 366. [Google Scholar]
  2. Atoyebi, O.J.; Osilesi, O.; Adebawo, O.; Abberton, M. Evaluation of nutrient parameters of selected African accessions of Bambara groundnut (Vigna subterranea (L.) Verdc.). Am. J. Food Nutr. 2017, 5, 83–89. [Google Scholar] [CrossRef]
  3. Harris, T.; Jideani, V.; Le Roes-Hill, M. Flavonoids and tannin composition of Bambara groundnut (Vigna subterranea) of Mpumalanga, South Africa. Heliyon 2018, 4, e00833. [Google Scholar] [CrossRef] [PubMed]
  4. Halimi, R.A.; Barkla, B.J.; Mayes, S.; King, G.J. The potential of the underutilized pulse Bambara groundnut (Vigna subterranea (L.) Verdc.) for nutritional food security. J. Food Compos. Anal. 2019, 77, 47–59. [Google Scholar] [CrossRef]
  5. Olanrewaju, O.S.; Oyatomi, O.; Abberton, M.; Babalola, O.O. Variations of Nutrient and Antinutrient Components of Bambara Groundnut (Vigna subterranea (L.) Verdc.) Seeds. J. Food Qual. 2022, 2022, 2772362. [Google Scholar] [CrossRef]
  6. Olanrewaju, O.S.; Oyatomi, O.; Babalola, O.O.; Abberton, M. Breeding potentials of Bambara groundnut for food and nutrition security in the face of climate change. Front. Plant Sci. 2022, 12, 3186. [Google Scholar] [CrossRef] [PubMed]
  7. Olanrewaju, O.S.; Oyatomi, O.; Babalola, O.O.; Abberton, M. Genetic Diversity and Environmental Influence on Growth and Yield Parameters of Bambara Groundnut. Front. Plant Sci. 2021, 12, 796352. [Google Scholar] [CrossRef]
  8. Pasquet, R.S.; Schwedes, S.; Gepts, P. Isozyme diversity in Bambara groundnut. Crop Sci. 1999, 39, 1228–1236. [Google Scholar] [CrossRef]
  9. Aliyu, S.; Massawe, F.; Mayes, S. Genetic diversity and population structure of Bambara groundnut (Vigna subterranea (L.) Verdc.): Synopsis of the past two decades of analysis and implications for crop improvement programmes. Genet. Resour. Crop Evol. 2016, 63, 925–943. [Google Scholar] [CrossRef]
  10. Puozaa, D.K.; Jaiswal, S.K.; Dakora, F.D. African origin of Bradyrhizobium populations nodulating Bambara groundnut (Vigna subterranea L. Verdc) in Ghanaian and South African soils. PLoS ONE 2017, 12, e0184943. [Google Scholar] [CrossRef]
  11. Babalola, O.O.; Olanrewaju, O.S.; Dias, T.; Ajilogba, C.F.; Kutu, F.R.; Cruz, C. Biological Nitrogen Fixation: The Role of Underutilized Leguminous Plants. In Microorganisms for Green Revolution: Volume 1: Microbes for Sustainable Crop Production; Panpatte, D.G., Jhala, Y.K., Vyas, R.V., Shelat, H.N., Eds.; Springer: Singapore, 2017; pp. 431–443. [Google Scholar] [CrossRef]
  12. Majola, N.G.; Gerrano, A.S.; Shimelis, H. Bambara groundnut (Vigna subterranea [L.] Verdc.) production, utilisation and genetic improvement in Sub-Saharan Africa. Agronomy 2021, 11, 1345. [Google Scholar] [CrossRef]
  13. Adeleke, O.R.; Adiamo, O.Q.; Fawale, O.S. Nutritional, physicochemical, and functional properties of protein concentrate and isolate of newly-developed Bambara groundnut (Vigna subterrenea L.) cultivars. Food Sci. Nutr. 2018, 6, 229–242. [Google Scholar] [CrossRef] [PubMed]
  14. Adeleke, O.; Adiamo, O.Q.; Fawale, O.S.; Olamiti, G. Effect of soaking and boiling on anti-nutritional factors, oligosaccharide contents and protein digestibility of newly developed bambara groundnut cultivars. Turk. J. Agric.-Food Sci. Technol. 2017, 5, 1006–1014. [Google Scholar] [CrossRef]
  15. Oyeyinka, A.T.; Pillay, K.; Siwela, M. Consumer awareness and acceptability of Bambara groundnut as a protein source for use in complementary foods in rural KwaZulu-Natal. S. Afr. J. Clin. Nutr. 2017, 30, 87–92. [Google Scholar] [CrossRef]
  16. Khan, M.M.H.; Rafii, M.Y.; Ramlee, S.I.; Jusoh, M.; Mamun, A. Genetic Variability, Heritability, and Clustering Pattern Exploration of Bambara Groundnut (Vigna subterranea L. Verdc) Accessions for the Perfection of Yield and Yield-Related Traits. BioMed Res. Int. 2020, 2020, 2195797. [Google Scholar] [CrossRef] [PubMed]
  17. Mayes, S.; Ho, W.K.; Chai, H.H.; Gao, X.; Kundy, A.C.; Mateva, K.I.; Zahrulakmal, M.; Hahiree, M.K.I.M.; Kendabie, P.; Licea, L.C.S.; et al. Bambara groundnut: An exemplar underutilised legume for resilience under climate change. Planta 2019, 250, 803–820. [Google Scholar] [CrossRef] [PubMed]
  18. Khan, M.M.; Rafii, M.Y.; Ramlee, S.I.; Jusoh, M.; Al-Mamun, M. Bambara Groundnut (Vigna subterranea L. Verdc): A Crop for the New Millennium, Its Genetic Diversity, and Improvements to Mitigate Future Food and Nutritional Challenges. Sustainability 2021, 13, 5530. [Google Scholar] [CrossRef]
  19. Olanrewaju, O.S.; Babalola, O.O. Plant growth-promoting rhizobacteria for orphan legume production: Focus on yield and disease resistance in Bambara groundnut. Front. Sustain. Food Syst. 2022, 6, 922156. [Google Scholar] [CrossRef]
  20. Bendu, N.J.M.; Mansaray, N.A.; Bah, N.A.M.; Momoh, N.E.J.J. Effect of Planting Method and Spacing on the Growth Parameters of Three Bambara Groundnut Cultivars in Two Agro-Climatic Zones of Sierra Leone. World J. Biol. Pharm. Health Sci. 2023, 13, 111–121. [Google Scholar] [CrossRef]
  21. Olanrewaju, O.S.; Oyatomi, O.; Babalola, O.O.; Abberton, M. GGE biplot analysis of genotype × environment interaction and yield stability in Bambara groundnut. Agronomy 2021, 11, 1839. [Google Scholar] [CrossRef]
  22. Oladosu, Y.; Rafii, M.Y.; Abdullah, N.; Magaji, U.; Miah, G.; Hussin, G.; Ramli, A. Genotype × Environment interaction and stability analyses of yield and yield components of established and mutant rice genotypes tested in multiple locations in Malaysia. Acta Agric. Scand. Sect. B—Soil Plant Sci. 2017, 67, 590–606. [Google Scholar] [CrossRef]
  23. Frutos, E.; Galindo, M.P.; Leiva, V. An interactive biplot implementation in R for modeling genotype-by-environment interaction. Stoch. Environ. Res. Risk Assess. 2014, 28, 1629–1641. [Google Scholar] [CrossRef]
  24. Yan, W.; Kang, M.S.; Ma, B.; Woods, S.; Cornelius, P.L. GGE biplot vs. AMMI analysis of genotype-by-environment data. Crop Sci. 2007, 47, 643–653. [Google Scholar] [CrossRef]
  25. Angelini, J.; Faviere, G.S.; Bortolotto, E.B.; Arroyo, L.; Valentini, G.H.; Domingo Lucio Cervigni, G. Biplot pattern interaction analysis and statistical test for crossover and non-crossover genotype-by-environment interaction in peach. Sci. Hortic. 2019, 252, 298–309. [Google Scholar] [CrossRef]
  26. Mndolwa, E.; Msolla, S.; Porch, T.; Miklas, P. GGE biplot analysis of yield stability for Andean dry bean accessions grown under different abiotic stress regimes in Tanzania. Afr. Crop Sci. J. 2019, 27, 413–425. [Google Scholar] [CrossRef]
  27. Dalló, S.C.; Zdziarski, A.D.; Woyann, L.G.; Milioli, A.S.; Zanella, R.; Conte, J.; Benin, G. Across year and year-by-year GGE biplot analysis to evaluate Soybean performance and stability in multi-environment trials. Euphytica 2019, 215, 113. [Google Scholar] [CrossRef]
  28. Woyann, L.G.; Zdziarski, A.D.; Baretta, D.; Meira, D.; Dallacorte, L.V.; Benin, G. Selection of high-yielding, adapted and stable wheat lines in preliminary trials. Crop Breed. Appl. Biotechnol. 2019, 19, 412–419. [Google Scholar] [CrossRef]
  29. Saeidnia, F.; Taherian, M.; Nazeri, S.M. Graphical analysis of multi-environmental trials for wheat grain yield based on GGE-biplot analysis under diverse sowing dates. BMC Plant Biol. 2023, 23, 198. [Google Scholar] [CrossRef]
  30. Singh, C.; Gupta, A.; Gupta, V.; Kumar, P.; Sendhil, R.; Tyagi, B.S.; Singh, G.; Chatrath, R.; Singh, G.P. Genotype × environment interaction analysis of multi-environment wheat trials in India using AMMI and GGE biplot models. Crop Breed. Appl. Biotechnol. 2019, 19, 309–318. [Google Scholar] [CrossRef]
  31. Bhartiya, A.; Aditya, J.P.; Singh, K.; Pushpendra, P.; Purwar, J.P.; Agarwal, A. AMMI and GGE biplot analysis of multi environment yield trial of Soybean in North Western Himalayan state Uttarakhand of India. Legume Res. Int. J. 2016, 40, 306–312. [Google Scholar] [CrossRef]
  32. Rezende, W.S.; Beyene, Y.; Mugo, S.; Ndou, E.; Gowda, M.; Sserumaga, J.P.; Asea, G.; Ngolinda, I.; Jumbo, M.; Oikeh, S.O.; et al. Performance and yield stability of maize hybrids in stress-prone environments in eastern Africa. Crop J. 2020, 8, 107–118. [Google Scholar] [CrossRef]
  33. Enyew, M.; Feyissa, T.; Geleta, M.; Tesfaye, K.; Hammenhag, C.; Carlsson, A.S. Genotype by environment interaction, correlation, AMMI, GGE biplot and cluster analysis for grain yield and other agronomic traits in sorghum (Sorghum bicolor L. Moench). PLoS ONE 2021, 16, e0258211. [Google Scholar] [CrossRef] [PubMed]
  34. Ngailo, S.; Shimelis, H.; Sibiya, J.; Mtunda, K.; Mashilo, J. Genotype-by-environment interaction of newly-developed sweet potato genotypes for storage root yield, yield-related traits and resistance to sweet potato virus disease. Heliyon 2019, 5, e01448. [Google Scholar] [CrossRef] [PubMed]
  35. Kumar, A.; Jnanesha, A.C.; Kumar, V.M.; Lal, R.K. GGE biplot vs. AMMI analysis of genotype-by-environment data on essential oil yield in lemongrass [Cymbopogon flexuosus (nees ex. Steud) wats.] grown in semi-arid tropical regions of southern India under different agro-climatic conditions. Biochem. Syst. Ecol. 2022, 103, 104439. [Google Scholar] [CrossRef]
  36. Fekadu, W.; Mekbib, F.; Lakew, B.; Haussmann, B.I.G. Genotype × environment interaction and yield stability in barley (Hordeum vulgare L.) genotypes in the central highland of Ethiopia. J. Crop Sci. Biotechnol. 2023, 26, 119–133. [Google Scholar] [CrossRef]
  37. Gerrano, A.S.; Jansen van Rensburg, W.S.; Mathew, I.; Shayanowako, A.I.; Bairu, M.W.; Venter, S.L.; Swart, W.; Mofokeng, A.; Mellem, J.; Labuschagne, M. Genotype and genotype × environment interaction effects on the grain yield performance of cowpea genotypes in dryland farming system in South Africa. Euphytica 2020, 216, 80. [Google Scholar] [CrossRef]
  38. Senguttuvel, P.; Sravanraju, N.; Jaldhani, V.; Divya, B.; Beulah, P.; Nagaraju, P.; Manasa, Y.; Prasad, A.H.; Brajendra, P.; Gireesh, C. Evaluation of genotype by environment interaction and adaptability in lowland irrigated rice hybrids for grain yield under high temperature. Sci. Rep. 2021, 11, 15825. [Google Scholar] [CrossRef] [PubMed]
  39. Rife, T.W.; Poland, J.A. Field book: An open-source application for field data collection on android. Crop Sci. 2014, 54, 1624–1627. [Google Scholar] [CrossRef]
  40. Eberhart, S.A.; Russell, W. Stability parameters for comparing varieties 1. Crop Sci. 1966, 6, 36–40. [Google Scholar] [CrossRef]
  41. Camacho, C.; Coulouris, G.; Avagyan, V.; Ma, N.; Papadopoulos, J.; Bealer, K.; Madden, T.L. BLAST+: Architecture and applications. BMC Bioinform. 2009, 10, 421. [Google Scholar] [CrossRef]
  42. Pacheco, A.; Vargas, M.; Alvarado, G.; Rodríguez, F.; Crossa, J.; Burgueño, J. GEA-R (Genotype × Environment Analysis with R for Windows) Version 4.0; CIMMYT: Mexico City, Mexico, 2015. [Google Scholar]
  43. Yan, W. Singular-value partitioning in biplot analysis of multienvironment trial data. Agron. J. 2002, 94, 990–996. [Google Scholar] [CrossRef]
  44. Yan, W.; Kang, M.S. GGE Biplot Analysis: A Graphical Tool for Breeders, Geneticists and Agronomists; CRC: Boca Raton, FL, USA, 2003; pp. 1–263. [Google Scholar] [CrossRef]
  45. Riaz, M.; Farooq, J.; Ahmed, S.; Amin, M.; Chattha, W.S.; Ayoub, M.; Kainth, R.A. Stability analysis of different cotton genotypes under normal and water-deficit conditions. J. Integr. Agric. 2019, 18, 1257–1265. [Google Scholar] [CrossRef]
  46. Popović, V.; Ljubičić, N.; Kostić, M.; Radulović, M.; Blagojević, D.; Ugrenović, V.; Popović, D.; Ivošević, B. Genotype× environment interaction for wheat yield traits suitable for selection in different seed priming conditions. Plants 2020, 9, 1804. [Google Scholar] [CrossRef]
  47. Tena, E.; Goshu, F.; Mohamad, H.; Tesfa, M.; Tesfaye, D.; Seife, A. Genotype × environment interaction by AMMI and GGE-biplot analysis for sugar yield in three crop cycles of sugarcane (Saccharum officinirum L.) clones in Ethiopia. Cogent Food Agric. 2019, 5, 1651925. [Google Scholar] [CrossRef]
  48. Sharma, S.P.; Leskovar, D.I.; Crosby, K.M.; Ibrahim, A. GGE biplot analysis of genotype-by-environment interactions for melon fruit yield and quality traits. Hortic. Sci. 2020, 55, 533–542. [Google Scholar] [CrossRef]
  49. Aruna, C.; Rakshit, S.; Shrotria, P.K.; Pahuja, S.K.; Jain, S.K.; Siva Kumar, S.; Modi, N.D.; Deshmukh, D.T.; Kapoor, R.; Patil, J.V. Assessing genotype-by-environment interactions and trait associations in forage Sorghum using GGE biplot analysis. J. Agric. Sci. 2016, 154, 73–86. [Google Scholar] [CrossRef]
  50. Moradi, Y.; Khadivi, A.; Salehi-Arjmand, H. Morphological and pomological characterizations of cornelian cherry (Cornus mas L.) to select the superior accessions. Sci. Hortic. 2019, 249, 208–218. [Google Scholar] [CrossRef]
  51. Dewi, N.; Nugroho, K.; Terryana, R.T.; Lestari, P. Evaluation of SSR and important agronomical characters of promising mutant lines of Soybean. Biodiversitas J. Biol. Divers. 2020, 21, 299–310. [Google Scholar] [CrossRef]
  52. Aremu, C.O.; Ojuederie, O.B.; Ayo-Vaughan, F.; Dahunsi, O.; Adekiya, A.O.; Olayanju, A.; Adebiyi, O.T.; Sunday, I.; Inegbedion, H.; Asaleye, A.J.; et al. Morphometric analysis and characterization of the nutritional quality in African yam bean accessions. Plant Physiol. Rep. 2019, 24, 446–459. [Google Scholar] [CrossRef]
  53. Qiao, L.; Wang, X.; Smith, P.; Fan, J.; Lu, Y.; Emmett, B.; Li, R.; Dorling, S.; Chen, H.; Liu, S. Soil quality both increases crop production and improves resilience to climate change. Nat. Clim. Chang. 2022, 12, 574–580. [Google Scholar] [CrossRef]
  54. Soane, B.; Van Ouwerkerk, C. Implications of soil compaction in crop production for the quality of the environment. Soil Tillage Res. 1995, 35, 5–22. [Google Scholar] [CrossRef]
  55. Sun, W.; Canadell, J.G.; Yu, L.; Yu, L.; Zhang, W.; Smith, P.; Fischer, T.; Huang, Y. Climate drives global soil carbon sequestration and crop yield changes under conservation agriculture. Glob. Chang. Biol. 2020, 26, 3325–3335. [Google Scholar] [CrossRef] [PubMed]
  56. Corwin, D.L. Climate change impacts on soil salinity in agricultural areas. Eur. J. Soil Sci. 2021, 72, 842–862. [Google Scholar] [CrossRef]
  57. Oldfield, E.E.; Bradford, M.A.; Wood, S.A. Global meta-analysis of the relationship between soil organic matter and crop yields. Soil 2019, 5, 15–32. [Google Scholar] [CrossRef]
  58. Bedane, H.R.; Beketie, K.T.; Fantahun, E.E.; Feyisa, G.L.; Anose, F.A. The impact of rainfall variability and crop production on vertisols in the central highlands of Ethiopia. Environ. Syst. Res. 2022, 11, 26. [Google Scholar] [CrossRef]
  59. Helliwell, J.R.; Sturrock, C.J.; Miller, A.J.; Whalley, W.R.; Mooney, S.J. The role of plant species and soil condition in the structural development of the rhizosphere. Plant Cell Environ. 2019, 42, 1974–1986. [Google Scholar] [CrossRef] [PubMed]
  60. Chibarabada, T.P.; Modi, A.T.; Mabhaudhi, T. Adaptation and Productivity of Selected Grain Legumes in Contrasting Environments of Kwazulu-Natal, South Africa. Int. J. Plant Prod. 2018, 12, 169–180. [Google Scholar] [CrossRef]
  61. Hudson, A.I.; Odell, S.G.; Dubreuil, P.; Tixier, M.-H.; Praud, S.; Runcie, D.E.; Ross-Ibarra, J. Analysis of genotype-by-environment interactions in a maize mapping population. G3 Genes Genomes Genet. 2022, 12, jkac013. [Google Scholar] [CrossRef]
  62. Azrai, M.; Efendi, R.; Muliadi, A.; Aqil, M.; Suwarti; Zainuddin, B.; Syam, A.; Junaedi; Syah, U.T.; Dermail, A.; et al. Genotype by Environment Interaction on Tropical Maize Hybrids Under Normal Irrigation and Waterlogging Conditions. Front. Sustain. Food Syst. 2022, 6, 913211. [Google Scholar] [CrossRef]
  63. Esan, V.I.; Oke, G.O.; Ogunbode, T.O.; Obisesan, I.A. AMMI and GGE Biplot Analyses of Bambara Groundnut [Vigna subterranea (L.) Verdc.] for Agronomic Performances Under Three Environmental Conditions. Front. Plant Sci. 2023, 13, 997429. [Google Scholar] [CrossRef]
  64. Ullah, H.; Khalil, I.H.; Durrishahwar; Iltafullah; Khalil, I.A.; Fayaz, M.; Yan, J.; Ali, F. Selecting high yielding and stable mungbean [Vigna radiata (L.) Wilczek] genotypes using GGE biplot techniques. Can. J. Plant Sci. 2012, 92, 951–960. [Google Scholar] [CrossRef]
  65. Aktaş, H. Tracing highly adapted stable yielding bread Wheat (Triticum aestivum L.) genotypes for greatly variable South-Eastern Turkey. Appl. Ecol. Environ. Res. 2016, 14, 159–176. [Google Scholar] [CrossRef]
  66. Zhang, P.-P.; Song, H.; Ke, X.-W.; Jin, X.-J.; Yin, L.-H.; Liu, Y.; Qu, Y.; Su, W.; Feng, N.-J.; Zheng, D.-F.; et al. GGE biplot analysis of yield stability and test location representativeness in proso millet (Panicum miliaceum L.) genotypes. J. Integr. Agric. 2016, 15, 1218–1227. [Google Scholar] [CrossRef]
  67. Viera, W.; Brito, B.; Zambrano, E.; Ron, L.; Merino, J.; Campaña, D.; Álvarez, H. Genotype × Environment interaction in the yield and fruit quality of passion fruit germplasm grown in the Ecuadorian Littoral. Int. J. Fruit Sci. 2020, 20, S1829–S1844. [Google Scholar] [CrossRef]
  68. Khan, M.M.H.; Rafii, M.Y.; Ramlee, S.I.; Jusoh, M.; Al Mamun, M. AMMI and GGE biplot analysis for yield performance and stability assessment of selected Bambara groundnut (Vigna subterranea L. Verdc.) genotypes under the multi-environmental trials (METs). Sci. Rep. 2021, 11, 22791. [Google Scholar] [CrossRef] [PubMed]
  69. Yan, W.; Tinker, N.A. Biplot analysis of multi-environment trial data: Principles and applications. Can. J. Plant Sci. 2006, 86, 623–645. [Google Scholar] [CrossRef]
  70. Nehe, A.; Akin, B.; Sanal, T.; Evlice, A.K.; Ünsal, R.; Dinçer, N.; Demir, L.; Geren, H.; Sevim, I.; Orhan, Ş.; et al. Genotype × environment interaction and genetic gain for grain yield and grain quality traits in Turkish spring wheat released between 1964 and 2010. PLoS ONE 2019, 14, e0219432. [Google Scholar] [CrossRef]
Figure 1. Map showing the geographical locations of the experimental sites.
Agronomy 13 02558 g001
Figure 2. GGE biplot graphical representation of the 30 Bambara groundnut accessions in the three locations.
Agronomy 13 02558 g002
Figure 3. Yield stability analysis of the accessions in the environments using the Eberhart and Russell (bi, S2di) model. (a) Francis (CV) vs. (b) mean biplot for grain yield.
Agronomy 13 02558 g003
Figure 4. Ranking of the best (a) environment (b) accession in each environment. Red color represents environments while black color represents accessions.
Agronomy 13 02558 g004
Figure 5. (a) Discriminativeness and representativeness of the accessions with the environments. (b) “Which-won-where” analysis to identify the most suitable accessions for each test environment. Red color represents environments while black color represents accessions.
Agronomy 13 02558 g005
Table 1. The accessions used and their corresponding serial number.
S/NAccessionsS/NAccessions
1TVSu-218816TVSu-2209
2TVSu-219017TVSu-2207
3TVSu-219318TVSu-2204
4TVSu-219419TVSu-2206
5TVSu-219920TVSu-2223
6TVSu-220021TVSu-2226
7TVSu-220122TVSu-2235
8TVSu-218423TVSu-2236
9TVSu-220224TVSu-2240
10TVSu-218125TVSu-2241
11TVSu-228526TVSu-2244
12TVSu-228427TVSu-2249
13TVSu-225628TVSu-2254
14TVSu-222129TVSu-2283
15TVSu-221830TVSu-2214
Table 2. Soil analysis result of the three experimental locations (Mokwa, Ibadan, and Ikenne).
LocationspH
(1:1)
bray P
(mg/kg)
%
OC
%
N
%
SAND
%
CLAY
%
SILT
Ca
(cmol/kg)
Mg
(cmol/kg)
K
(cmol/kg)
Na
(cmol/kg)
ppm
Zn
ppm
Cu
ppm
Mn
ppm
Fe
Mokwa5.511.730.050.0183.0010.676.330.910.270.020.022.490.4341.241303.16
Ibadan6.3013.900.200.1080.6713.675.672.690.800.540.104.350.34128.2983.34
Ikenne4.9122.460.300.1276.3320.003.671.510.400.240.081.202.05116.7188.29
Table 3. Variance analysis of yield data collected from BGN trials conducted in Ibadan, Ikenne, and Mokwa.
Source of VariationsDfSum Sq.Mean Sq.F valueP r (>F)
Rep256,702,05628,351,02810.11426.912 × 10−5 ***
Env213,354,504506,677,252180.757<2.2 × 10⁻¹⁶ ***
Accns29427,984,89614,758,1005.26491.043 × 10−12 ***
Env:Accns58590,078,48910,173,7673.62952.547 × 10−11 ***
Residuals178498,949,2692,803,086
Coefficient of variation = 0.94. DF = degree of freedom. Sum sq. = sum of squares. Mean sq. = mean square. *** Significant at p < 0.001.
Disclaimer/Publisher’s Note: The statements, opinions and data contained in all publications are solely those of the individual author(s) and contributor(s) and not of MDPI and/or the editor(s). MDPI and/or the editor(s) disclaim responsibility for any injury to people or property resulting from any ideas, methods, instructions or products referred to in the content.

