Article

Blueberry Ripeness Detection Model Based on Enhanced Detail Feature and Content-Aware Reassembly

School of Software, Jiangxi Agricultural University, Nanchang 330045, China
*
Author to whom correspondence should be addressed.
Agronomy 2023, 13(6), 1613; https://doi.org/10.3390/agronomy13061613
Submission received: 23 May 2023 / Revised: 9 June 2023 / Accepted: 12 June 2023 / Published: 15 June 2023

Abstract

:
Blueberries have high nutritional and economic value and are easy to cultivate, so they are common fruit crops in China. There is a high demand for blueberry in domestic and foreign markets, and various technologies have been used to extend the supply cycle of blueberry to about 7 months. However, blueberry grows in clusters, and a cluster of fruits generally contains fruits of different degrees of maturity, which leads to low efficiency in manually picking mature fruits, and at the same time wastes a lot of manpower and material resources. Therefore, in order to improve picking efficiency, it is necessary to adopt an automated harvesting mode. However, an accurate maturity detection model can provide a prerequisite for automated harvesting technology. Therefore, this paper proposes a blueberry ripeness detection model based on enhanced detail feature and content-aware reassembly. First of all, this paper designs an EDFM (Enhanced Detail Feature Module) that improves the ability of detail feature extraction so that the model focuses on important features such as blueberry color and texture, which improves the model’s ability to extract blueberry features. Second, by adding the RFB (Receptive Field Block) module to the model, the lack of the model in terms of receptive field can be improved, and the calculation amount of the model can be reduced at the same time. Then, by using the Space-to-depth operation to redesign the MP (MaxPool) module, a new MP-S (MaxPool–Space to depth) module is obtained, which can effectively learn more feature information. Finally, an efficient upsampling method, the CARAFE (Content-Aware Reassembly of Features) module, is used, which can aggregate contextual information within a larger receptive field to improve the detection performance of the model. In order to verify the effectiveness of the method proposed in this paper, experiments were carried out on the self-made dataset “Blueberry—Five Datasets” which consists of data on five different maturity levels of blueberry with a total of 10,000 images. Experimental results show that the mAP (mean average precision) of the proposed network reaches 80.7%, which is 3.2% higher than that of the original network, and has better performance than other existing target detection network models. The proposed model can meet the needs of automatic blueberry picking.

1. Introduction

Blueberries are native to North America; they are a common fruit and also a high-value economic crop. There are various reasons why blueberries are liked by humans. First of all, blueberry is rich in nutrients, and its nutritional worth has been recognized worldwide. The Food and Agriculture Organization of the United Nations has named it as one of the five health foods for human beings. Blueberry is rich in anthocyanins, pectin, vitamins, etc., which have the functions of anti-cancer, cardiovascular disease prevention, and vision protection [1,2,3,4]. In addition, blueberry is highly valuable economically. The unit price of blueberry is relatively high. Ordinary blueberries cost nearly USD 14 a catty, and high-quality blueberry range from USD 14 to USD 42 in price. Therefore, planting blueberry can bring huge economic benefits. Finally, blueberry trees are easier to plant and maintain compared with other perennial fruit crops because of their strong resistance to arthropod pests and simple plant processes [5]. China began to grow blueberry on a large scale in the early 21st century. By 2022, China’s blueberry production and planting area have ranked first in the world, far ahead of other countries, which makes China the main blueberry planting place in the Asia–Pacific region. With the increase in blueberry production year by year, manual picking of blueberry cannot meet the huge labor and labor costs required. At the same time, blueberries are usually sold as fresh berry, so the standard for fruit picking must reach the specified maturity; the fruit should be in good condition before the fruit picking operation can be carried out. Because the blueberry development period is about three to six weeks, blueberry trees usually contain fruits of different maturity levels at the same time. If the ripe fruit is not picked in time, it may cause problems such as overripe fruit, fruit wrinkling and loss of taste, fruit rot, and fruit drop. In summary, a high-performance blueberry ripeness detection model can help blueberry farmers more accurately and quickly detect the ripeness of blueberries, enabling them to determine the optimal harvest time and improve the quality and yield of their fruits. At the same time, it can reduce labor costs, as traditional blueberry ripeness detection requires a lot of time and manpower; on the contrary, the blueberry ripeness detection model can quickly determine the maturity and make judgments without the need for manual detection.
Our contributions are:
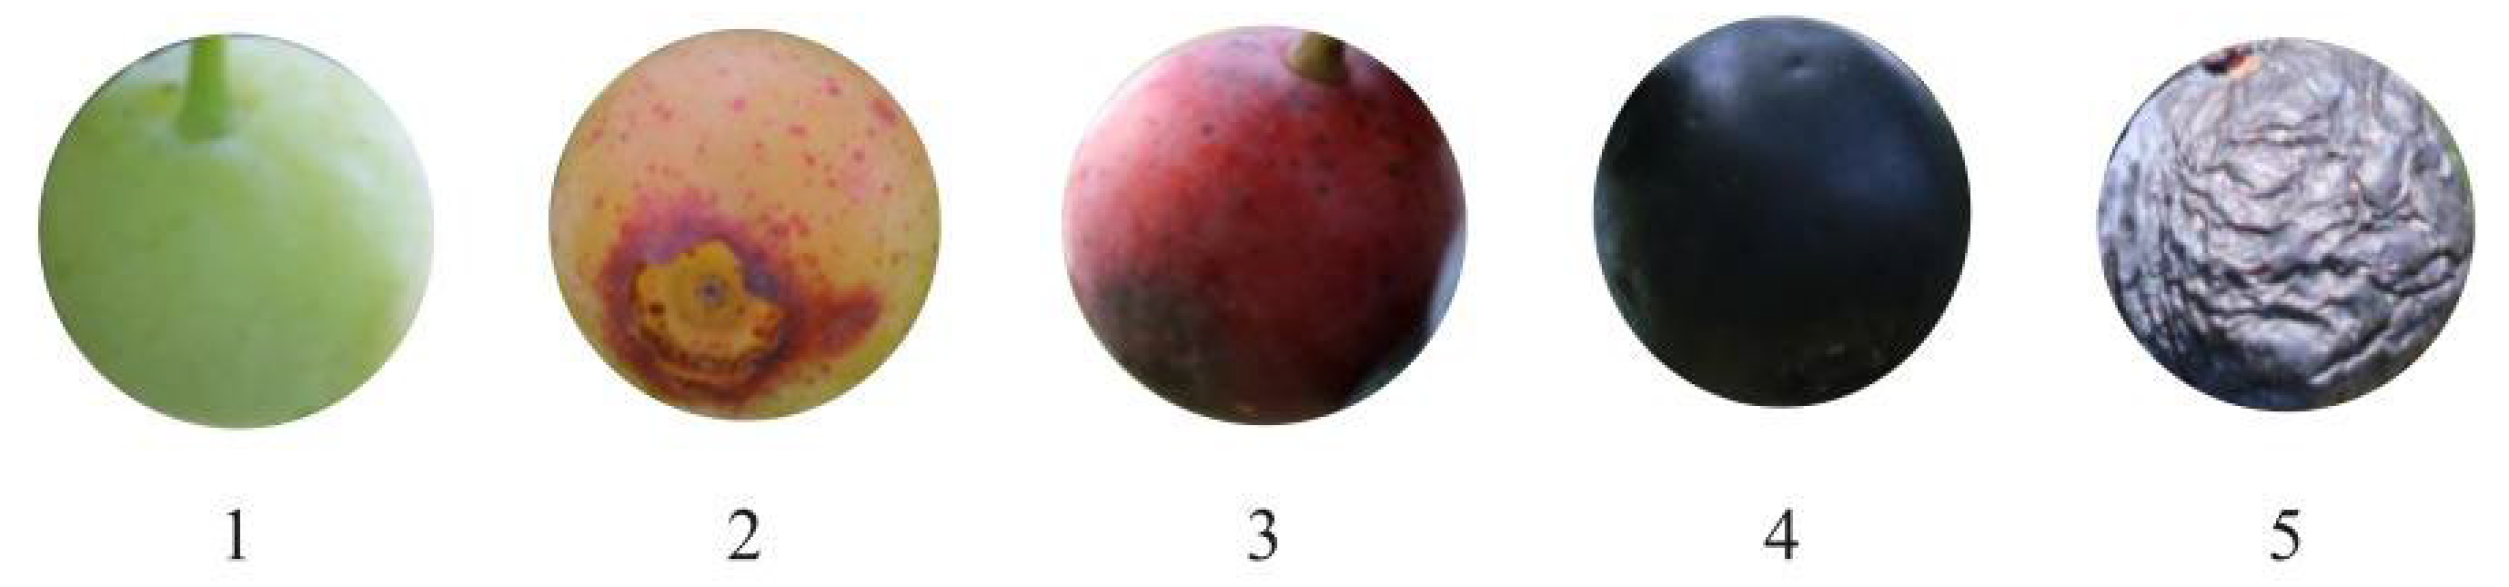
  • A blueberry dataset containing five different maturity levels is constructed. To expand the original dataset, data augmentation techniques are used, and then it is named “Blueberry—Five Datasets”.
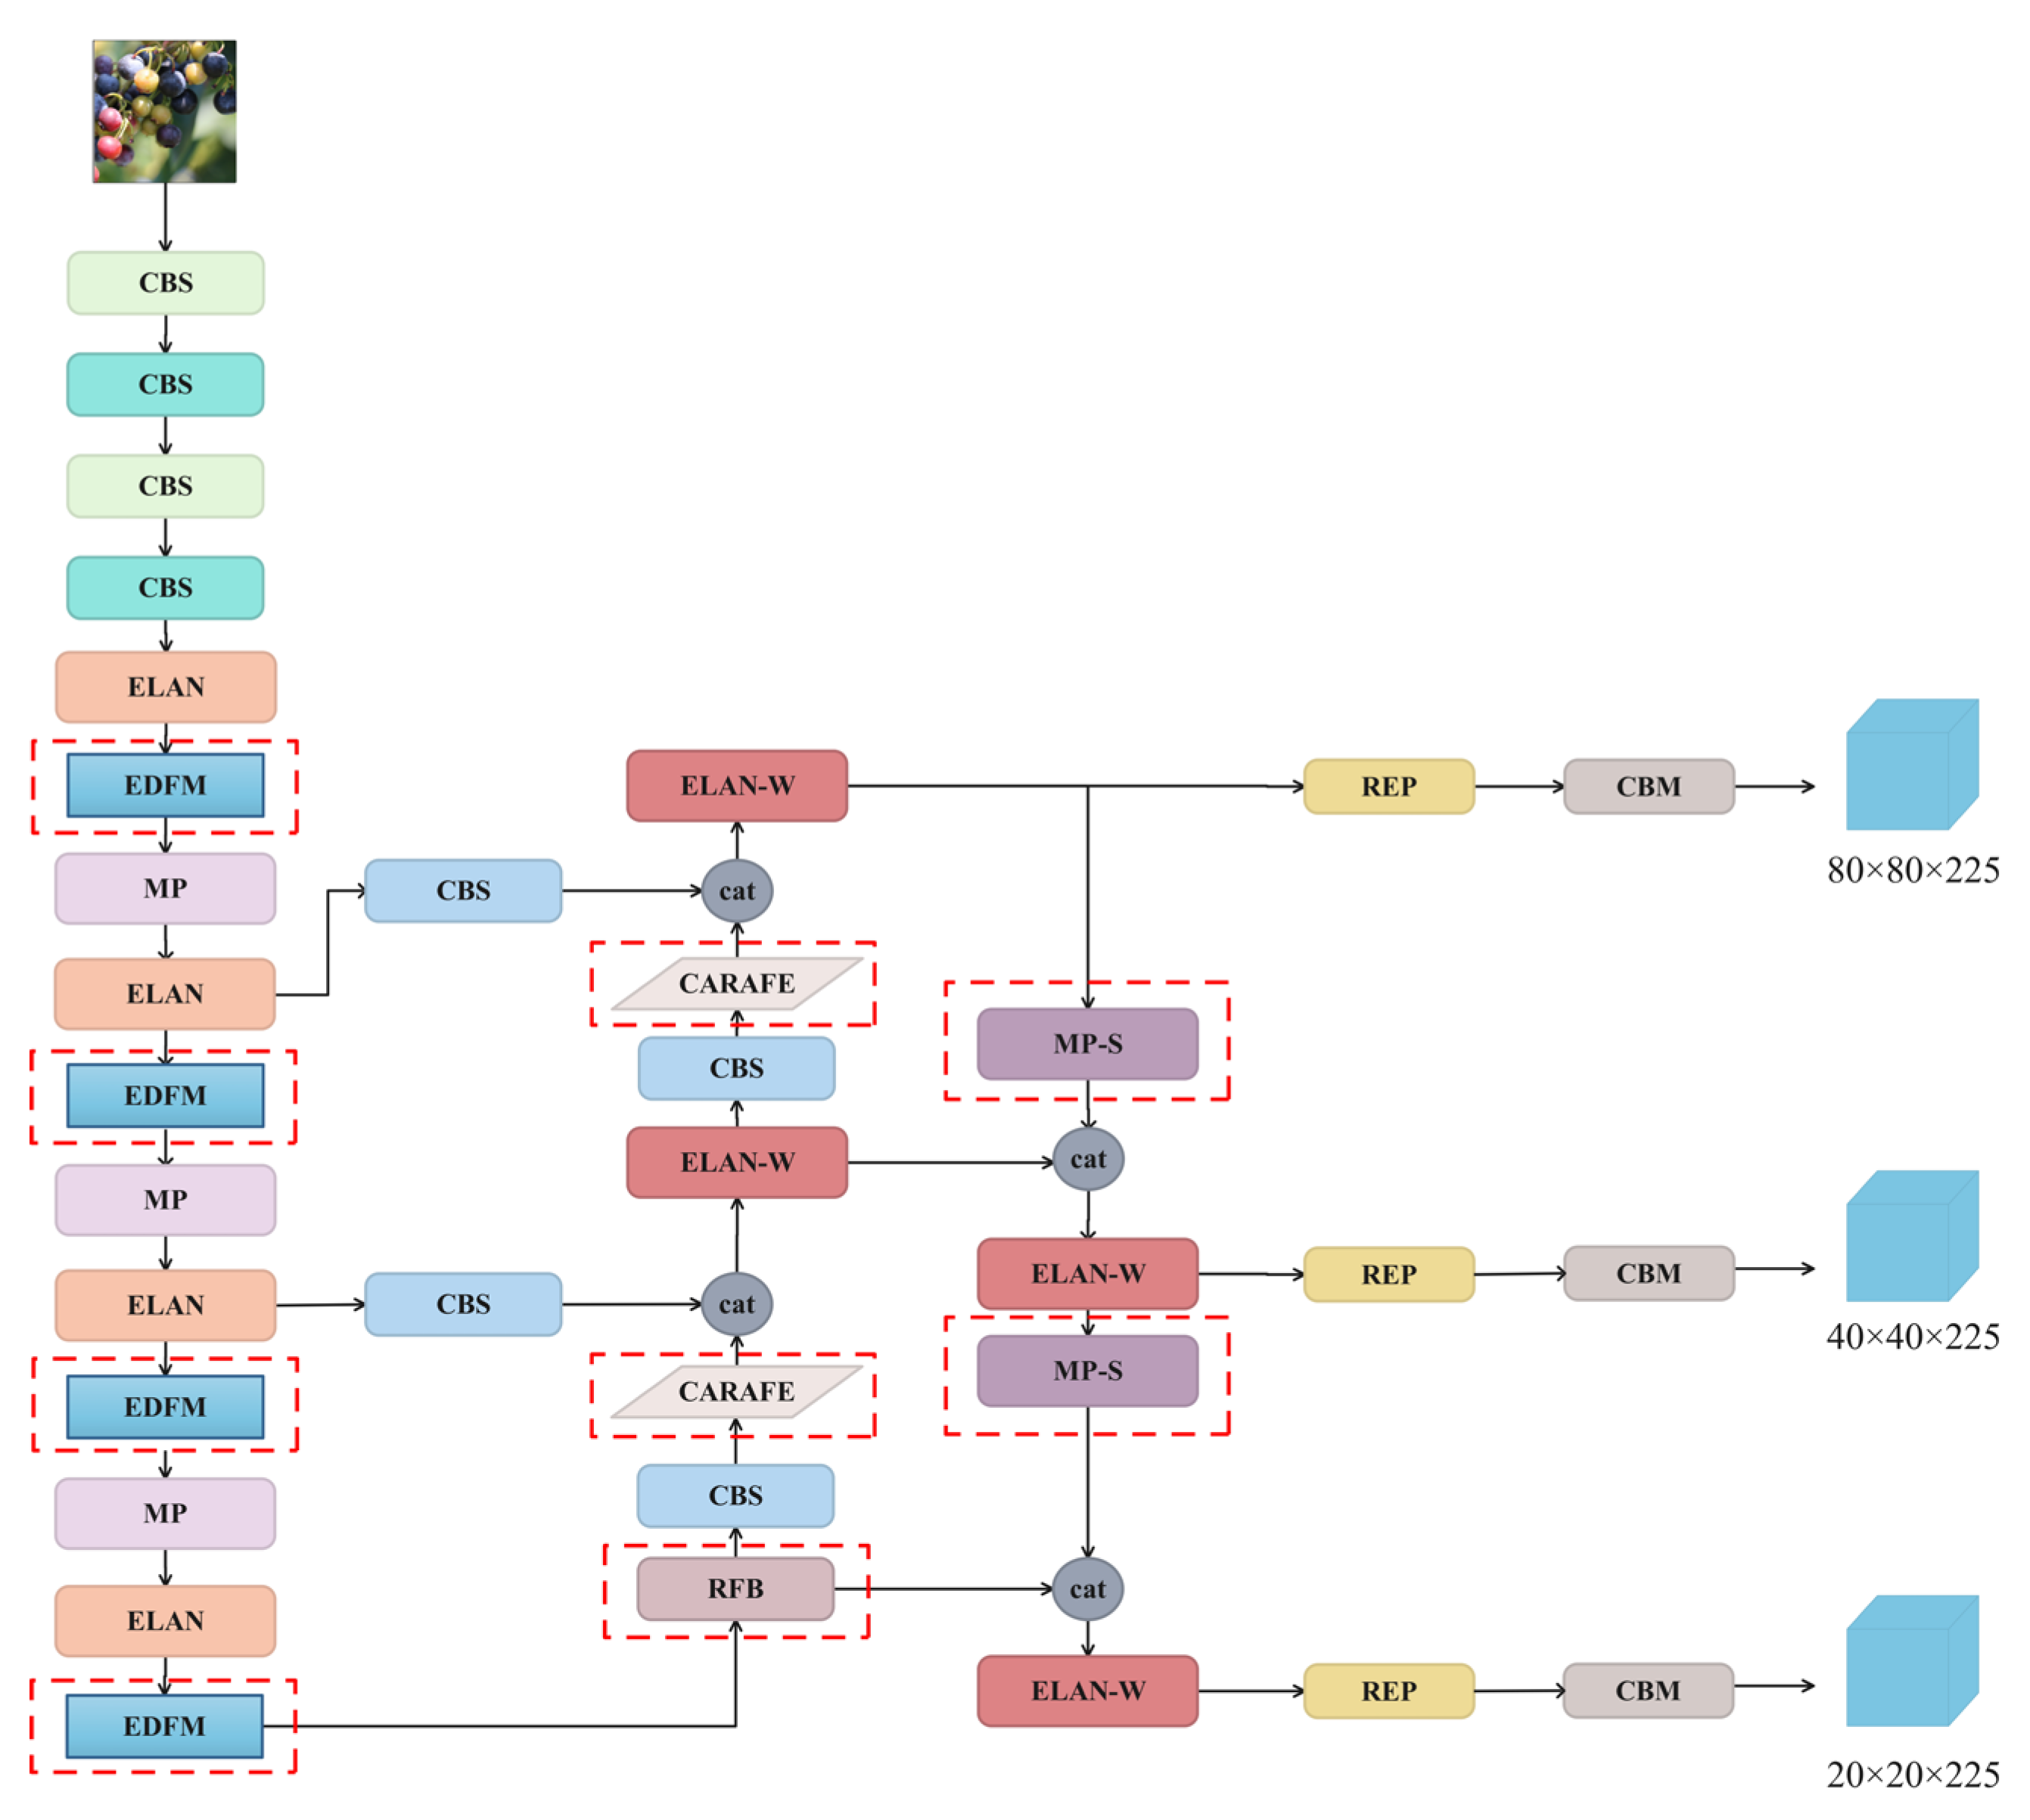
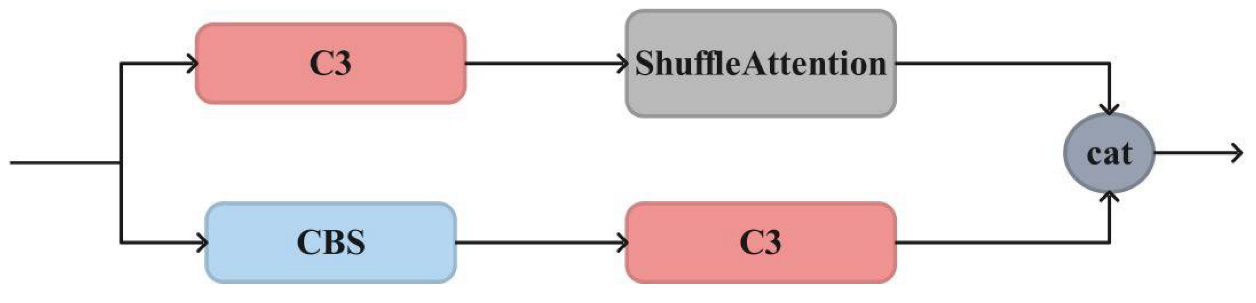
  • An EDFM that enhances detail feature extraction is designed and proposed. By focusing on the two dimensions of space and channel to improve the ability of blueberry detail feature extraction, the experiment proves that this module can effectively improve the detection performance of the network model.
  • By using the Space-to-depth operation to redesign the MP module, a new module, MP-S, is obtained, which eliminates the loss of fine-grained information due to the use of convolution step size and can effectively learn more information on the characteristics of blueberry.
  • By integrating EDFM, MP-S, RFB (Receptive Field Block), and CARAFE (Content-Aware ReAssembly of FEatures), a new blueberry ripeness detection model based on EDFM and content-aware reassembly is proposed, which provides a premise and method for the realization of automatic picking technology in the future.

2. Related Work

Artificial intelligence in agriculture is also known as “Agricultural Intelligence”, which is gradually becoming part of the technological revolution in the agricultural industry. In recent years, computer vision has made great progress and has been well developed in the field of agriculture, such as agricultural robots, unmanned tractors, variable rate seeding, etc. [6,7,8,9]. Fruit maturity detection methods based on traditional machine learning generally identify fruit maturity by extracting shallow features such as color and texture from the target fruit, and then combining support vector machines and K-means clustering technologies. Although traditional machine learning methods can identify fruit maturity, it requires a lot of time to manually select appropriate fruit features and has poor robustness. However, with the development of computer vision, deep learning technology has been applied to many classification and detection tasks [10,11,12,13,14,15,16,17,18], among which it is also widely used in detecting the maturity of fruits. Tian et al. [10] proposed an improved Yolov3 (You only look once version 3) algorithm for detecting apples at different growth stages in orchards with fluctuating light, complex backgrounds, overlapping apples, overlapping branches, and overlapping leaves. The average detection time of the model is 0.304 s per frame, which can realize real-time detection of apples in the orchard. Wang et al. [11] proposed a blueberry maturity identification method based on improved YOLOv4-Tiny, where the mAP reaches 97.30%, meaning it can effectively identify blueberry and detect fruit maturity. In order to distinguish the ripeness of olive in natural environment for realizing the automatic picking mode of olive, Chen et al. [12] proposed a method for detecting the ripeness of olive based on improved EfficientDet. Experiments prove that the Precision, Recall and mAP reached 92.89%, 93.59% and 94.60%, respectively. Parvathi et al. [13] used the Faster R-CNN (Region-based Convolution Neural Network) model to detect the maturity of coconuts in complex backgrounds with a mAP of 89.4%. In order to accurately classify different types of fruits, Gulzar [14] proposed a fruit image classification model based on MobileNetV2 and deep transfer learning techniques which can effectively classify different types of fruits with high prediction performance. Albarrak et al. [15] proposed a deep learning-based date fruit classification model to accurately classify date fruits, which can overcome the shortcomings of manual expertise and perform better than AlexNet, VGG16, InceptionV3, ResNet, and MobileNetV2 in terms of accuracy. Mamat et al. [16] proposed a deep learning-based image classification model for classifying the maturity of oil palm fruits. The model can identify multiple types of fruits and provide image annotation. Experimental results show that this method helps farmers strengthen fruit classification and improve yield. In summary, although deep learning technology has made some achievements in fruit maturity detection, there are few ways to detect the ripeness of blueberry. Therefore, in order to make the blueberry industry keep up with the pace of modernization, this paper uses deep learning technology to design a blueberry ripeness detection model based on EDFM and content-aware reassembly to distinguish the maturity of blueberry.
Existing target detection networks are roughly divided into two categories: the two-stage network Faster R-CNN mentioned in the above research content, and the single-stage network YOLO [19,20,21] series. The two-stage network has a large number of parameters [22,23] and is time-consuming, which makes it difficult to meet the needs of real-time detection in real scenes. Therefore, in this paper, YOLOv7 was chosen for use, which is a single-stage target detection network with fast speed and excellent performance. The network inherits the advantages of the previous network architecture, integrates more advanced network architecture and training strategies, and has higher detection accuracy. However, the blueberry targets to be detected are small and easily occluded by branches, leaves, and other structures, which makes it particularly difficult to detect blueberries from images. Therefore, it is a challenging task to accurately classify the ripeness of blueberry. In order to further improve the detection performance of the model, this paper improves the YOLOv7 network. In addition, the attention mechanism can play a role in making the model focus on important features, and most of the current improved methods add attention mechanisms to the original network structure. Jiang et al. [24] proposed a real-time monitoring of hemp duck based on the improved YOLOv7 target detection algorithm, in which three CBAM (Convolutional Block Attention Module) attention modules are placed in the Backbone to improve the ability to extract features of ducks. The experiments have proved that the improved algorithm can solve the problems of low efficiency and high cost in hemp duck breeding industry due to manual counting. Chen et al. [25] added CBAM attention mechanism, small object detection layer, and lightweight convolution to YOLOv7 for constructing a multi-scale lightweight network model Citrus-YOLOv7, which outperforms current state-of-the-art network models. Therefore, the proposed model helps automate citrus picking. Zhao et al. [26] applied the improved model YOLOv7-sea to maritime search and rescue missions, finding attention regions in the scene by adding SimAM (Simple, Parameter-Free Attention Module). In addition, a micro-scale detection layer was added to detect small objects, and an about 7% higher efficiency than that of the original algorithm mAP was gained. Pham et al. [27] added CA (Coordinate Attention) to YOLOv7 for improving road damage detection, which is superior to the existing algorithms. In summary, adding the attention mechanism can play a role in improving the accuracy of model detection. Therefore, this paper also integrates the attention mechanism into the designed module to make the model pay more attention to the characteristics of blueberry.

3. Blueberry Dataset Construction

3.1. Blueberry Image Collection

In Nanchang City, Jiangxi Province, the ripening period of blueberry is between mid-June and early July every year. Shooting during the ripening period can simulate the real situation of automatic picking. Therefore, this article chooses to take blueberry images in the blueberry garden in Nanchang City, Jiangxi Province during this period. In order to simulate the lighting conditions in different time periods, we shot from 9 a.m to 2 p.m. At the same time, considering the impact of shooting distance, we shot blueberry from close and long distances. In the end, we captured a total of 1000 blueberry images using a Canon high-definition digital camera. As shown in Figure 1, there are some hard-to-detect situations in the blueberry image, such as occlusion of branches and leaves, occlusion between dense fruits, a complex background, blueberry of different maturity in a single cluster of fruits, etc.

3.2. Data Preprocessing

Considering the blueberry maturity classification standard, the field inspection of blueberry and the suggestions of relevant agricultural experts, the blueberries are divided into five maturity levels, which are levels 1–5. Unripe blueberries (level 1) are green in color; the blueberries (level 2) that have just begun to mature begin to turn red; semi-ripe blueberries (level 3) are red; fully ripe blueberries (level 4) are smooth and blue–purple in appearance; and overripe blueberries (level 5) have wrinkled surfaces, as shown in Figure 2 for details.
Labeling the data is a time-consuming and labor-intensive process, and it is necessary to manually label the real bounding box of each blueberry [7]. In this paper, the data labeling software Labelimg [28] is used to mark the data according to the maturity classification standard proposed. Labelimg automatically generates a marked xml tag file. In order to avoid omissions and mistakes in the marking process, the team members divided the labor to check for omissions and make up for omissions. After the marking work is completed, the marked dataset is divided according to the requirements of train, verification, and test. Our division ratio is 6:2:2. The train set has 600 pictures, the verification set has 200 pictures, and the test set has 200 pictures.

3.3. Data Augmentation

The input end of YOLOv7 comes with data augmentation of Mosaic [29]. The principle of Mosaic is shown in Figure 3. In addition, in order to avoid the model overfitting phenomenon caused by too little training data, this paper performed a series of data enhancement operations on the original dataset, mainly including color transformation and geometric operations. The color transformation includes changing brightness and increasing noise, and geometric operations include mirroring, rotation, translation, shearing, and flipping. Finally, the dataset was expanded to 10,000 images. The number of labels for each category after data enhancement is shown in Table 1. The number of blueberry labels for levels 1–5 is 70,050, 7120, 7530, 91,210, 3340, respectively, with a total of 179,250. The number of blueberry images for levels 1–5 is 8670, 3900, 4450, 10,000, 1610, respectively.

4. The Proposed Method

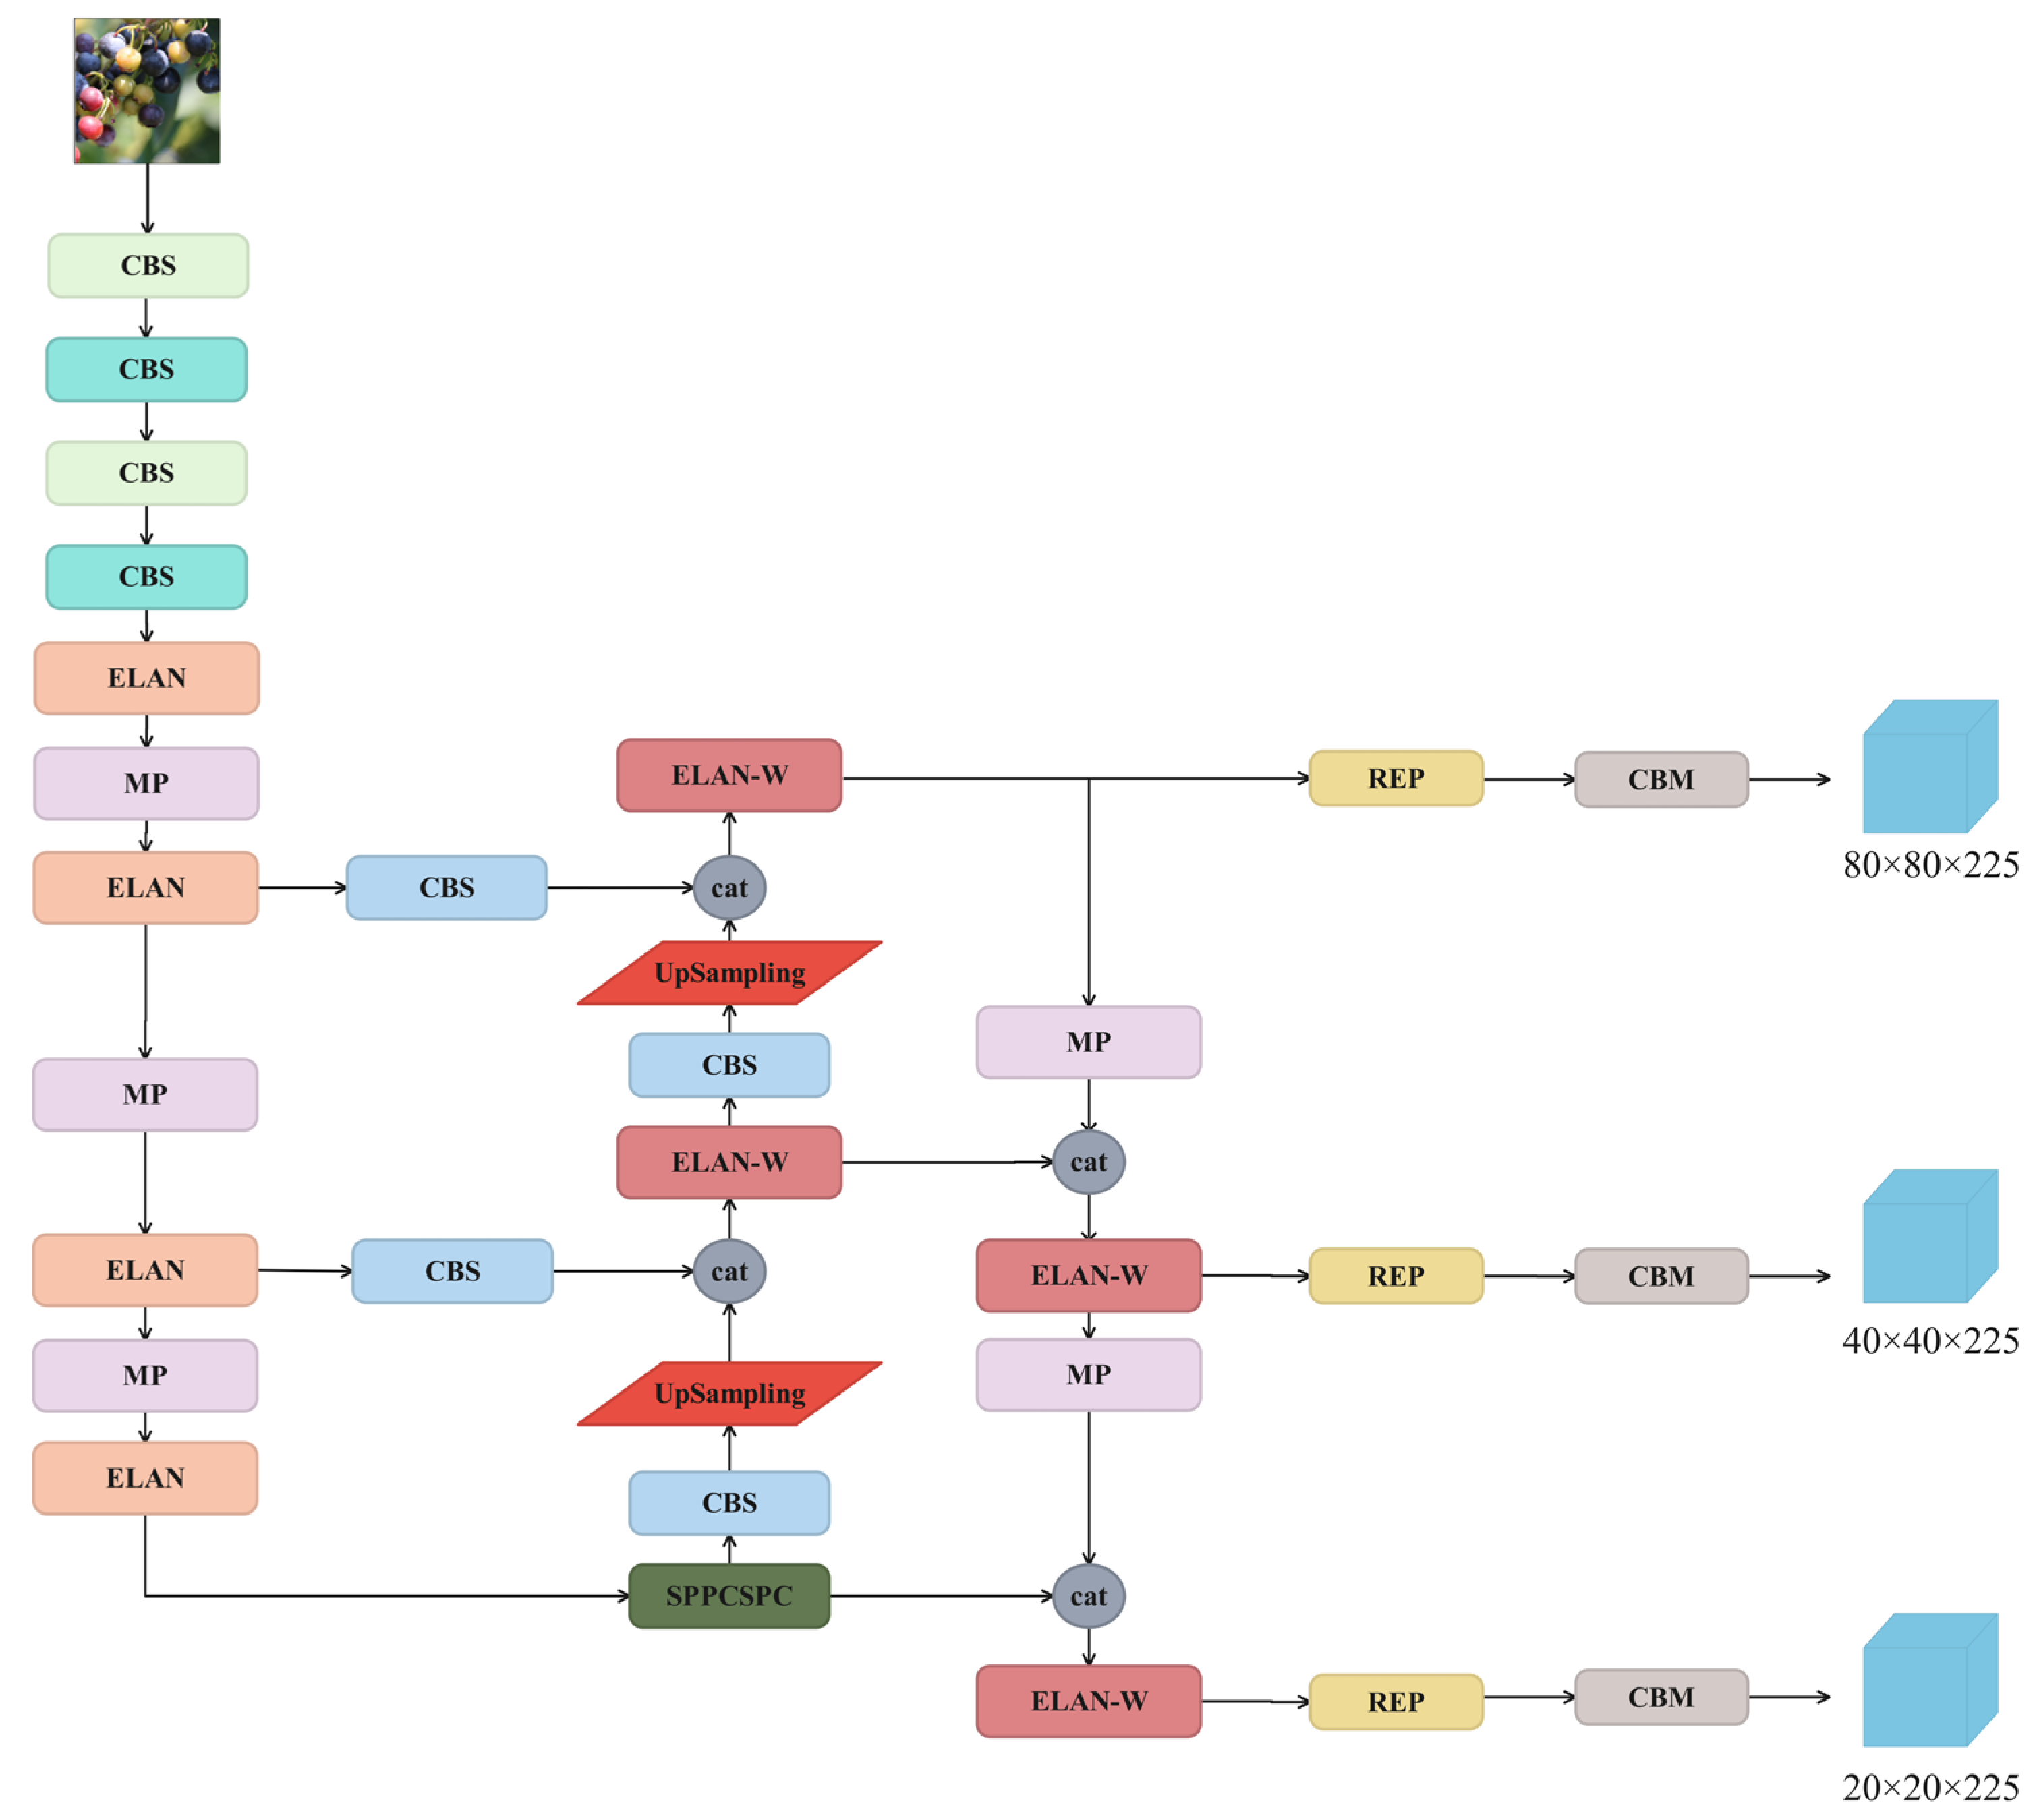
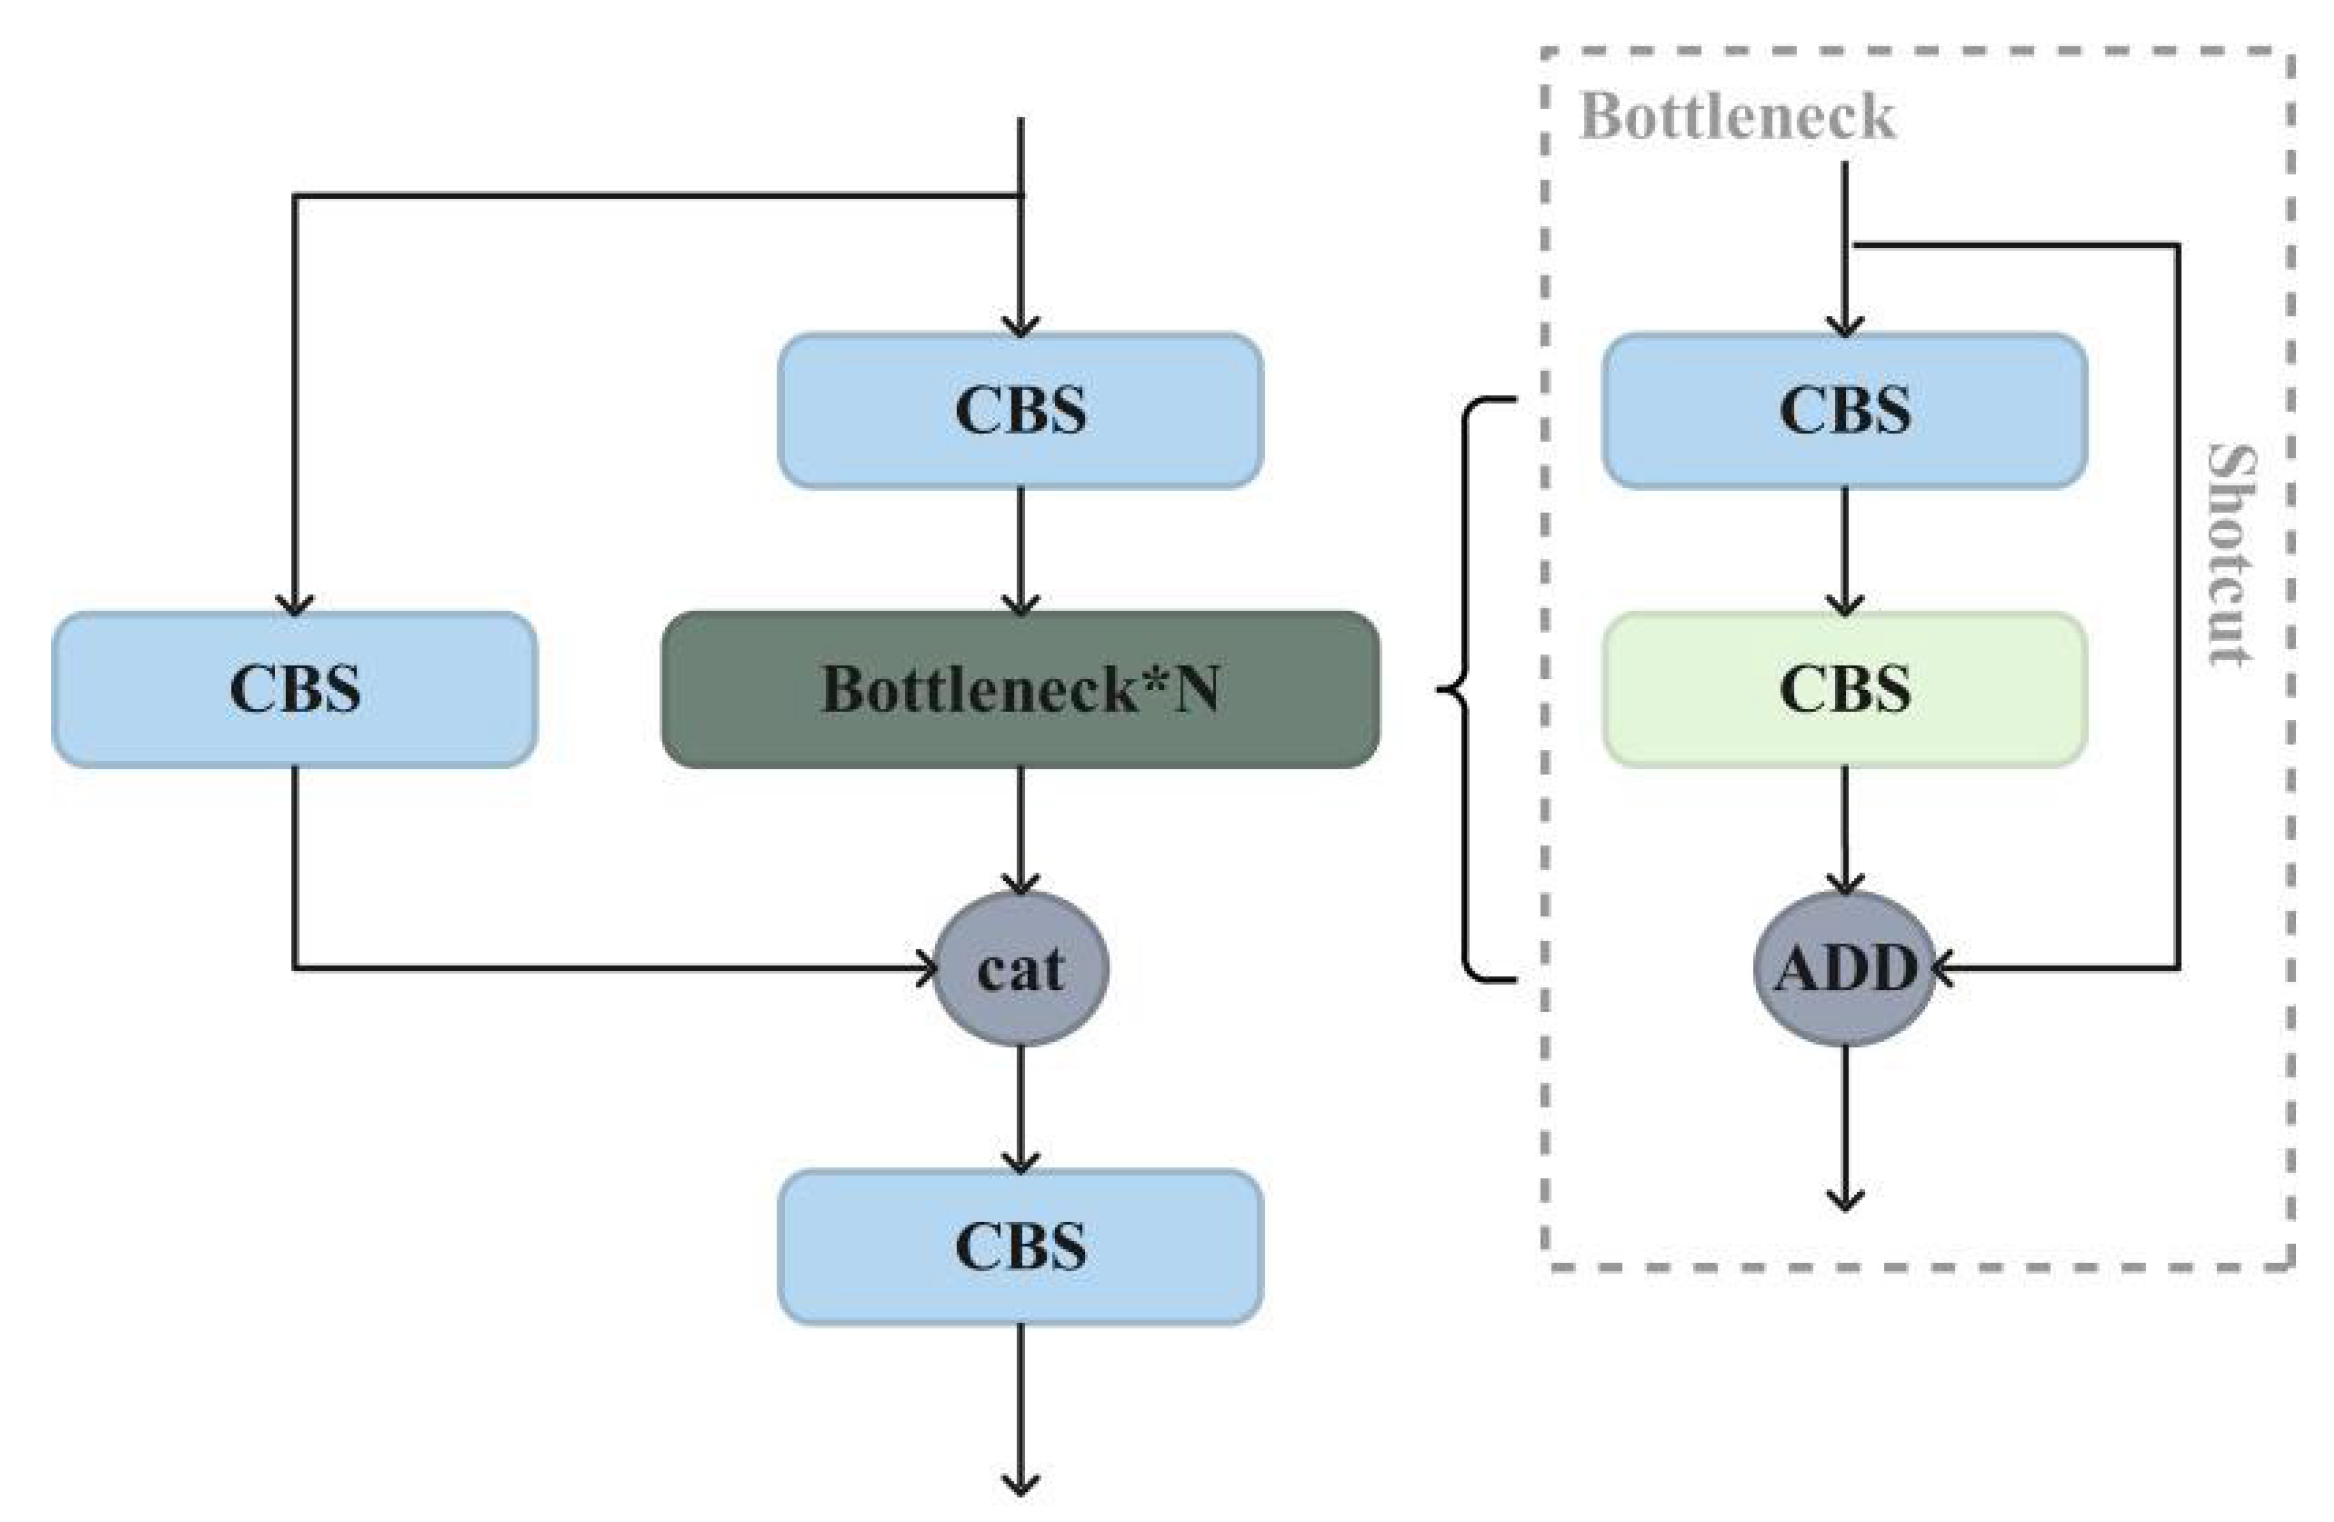
4.1. YOLOv7 Original Network Structure

YOLOv7 improves the accuracy of detection without increasing the amount of calculation and reasoning required. Figure 4 shows the YOLOv7 network architecture. This network consists of four parts: Input, Backbone, Neck and Prediction. First, the input image is subjected to Mosaic, adaptive anchor box calculation, adaptive image scaling and other operations and further resized to 640 × 640 × 3. Second, features are extracted through the Backbone, which is composed of four CBS (Conv + Batch Normalization + Silu) composite modules, alternating MP (MaxPooling) modules, and ELAN (Efficient Layer Aggregation Network) modules. Third, the SPPCSPC module of the Neck is employed to increase the receptive field of the network. Fourth, the features of different scales are fused in the PANet (Path Aggregation Network) through combining the ELAN-W module with up and down sampling. Finally, the new fused feature map output by the Neck is input to the Prediction part, which first uses the reparametrized convolution RepConv to adjust the number of output channels, and then sends the features processed by the CBM module to the detection head; then, the final result is obtained.
The loss function of this network is the same as that of YOLOv5, as shown in Equation (1), which is composed of localization loss, confidence loss, and classification loss:
L o s s o b j e c t = L o s s l o c + L o s s c o n f + L o s s c l a s s .
The coordinate loss function uses CIOU whose calculation process is shown in Equation (2). CIOU adds an impact factor “αν” to the penalty item of DIOU. This impact factor takes into account the aspect ratio of the predicted frame to fit the aspect ratio of the real frame, making the predicted frame more in line with the actual situation.
L C I O U = 1 I O U + ρ 2 b , b g t c 2 + α v .

4.2. Our Proposed Network

Due to the small area of the blueberries in the image, as well as the dense growth, complex backgrounds, and susceptibility to occlusion by branches and leaves, the noise and background can interfere with feature extraction and classification. Therefore, it is very difficult for the original YOLOv7 network to detect blueberries of different maturity levels. In response to the above problems, this paper makes some improvements to the YOLOv7 network to improve detection accuracy, thereby meeting the basic requirements of automatic picking work for detection performance.
First of all, this paper proposes a module that enhances detail feature extraction capabilities, and names it EDFM (Enhanced Detail Feature Module), which is placed behind each ELAN module of the Backbone to solve the problem of insufficient detail feature extraction capabilities of the Backbone for blueberry. Second, a more efficient RFB module with fewer parameters is introduced to increase the receptive field of the original network model. Then, all the MP modules in the Neck are replaced with the redesigned MP-S module to eliminate the loss of fine-grained information caused by the use of convolution step size, which can effectively learn more feature information about blueberries. Finally, the CARAFE module is added to the Neck network in the original network, which can aggregate context information for upsampling operations. Our proposed network architecture is shown in Figure 5.

4.2.1. Enhanced Detail Feature Module

In order to solve the problem of insufficient detail feature extraction ability of the original Backbone for blueberry, this paper proposes a module to enhance detail feature extraction capabilities and names it EDFM (Enhanced Detail Feature Module). The EDFM module consists of the C3 module, CBS, and Shuffle Attention [30]. As shown in Figure 6, the input feature map passes through two branches. One branch first passes through a C3 module, and then passes through a Shuffle Attention. The purpose of this design is to first use the C3 module with excellent performance to extract more blueberry detail features. After that, Shuffle Attention can focus on blueberry features from space and channels. The features output by this branch contain richer, more detailed information. The other branch consists of CBS and C3 of 1 × 1 convolution. Finally, the features extracted by the two branches are fused. The EDFM can enhance the model’s ability to extract blueberry features and suppress the interference of complex backgrounds and negative samples in blueberry images. In this paper, the EDFM module is placed behind each ELAN module in the Backbone of the proposed network model, which can improve the ability of the Backbone to extract blueberry texture, color, and other detailed features, thereby solving the problem of insufficient blueberry detail feature extraction by the Backbone and ultimately improving the model detection performance.
As shown in Figure 7, the C3 module includes three standard convolutional layers and N bottleneck modules which are the main modules for learning residual features. Because of its excellent feature extraction ability, it is used in the design of the proposed EDFM module and mainly plays the role of extracting blueberry features.
The attention mechanism can play a role in focusing on important features while suppressing unnecessary features. Therefore, we add Shuffle Attention to the designed EDFM module. Shuffle Attention uses Shuffle Unit to effectively combine space and channel attention, which can reduce the overhead of computing costs. As shown in Figure 8, the input features first group the channel dimension into multiple sub-features, and each sub-feature passes through two branches. One branch generates channel attention maps by exploiting channel interrelationships while the other branch generates spatial attention maps by exploiting inter-spatial relationships between features. After that, all sub-features are aggregated, and the “channel shuffle” operator is used to realize the information communication between different sub-features which can effectively increase the expression ability of target features in space and channel dimensions.

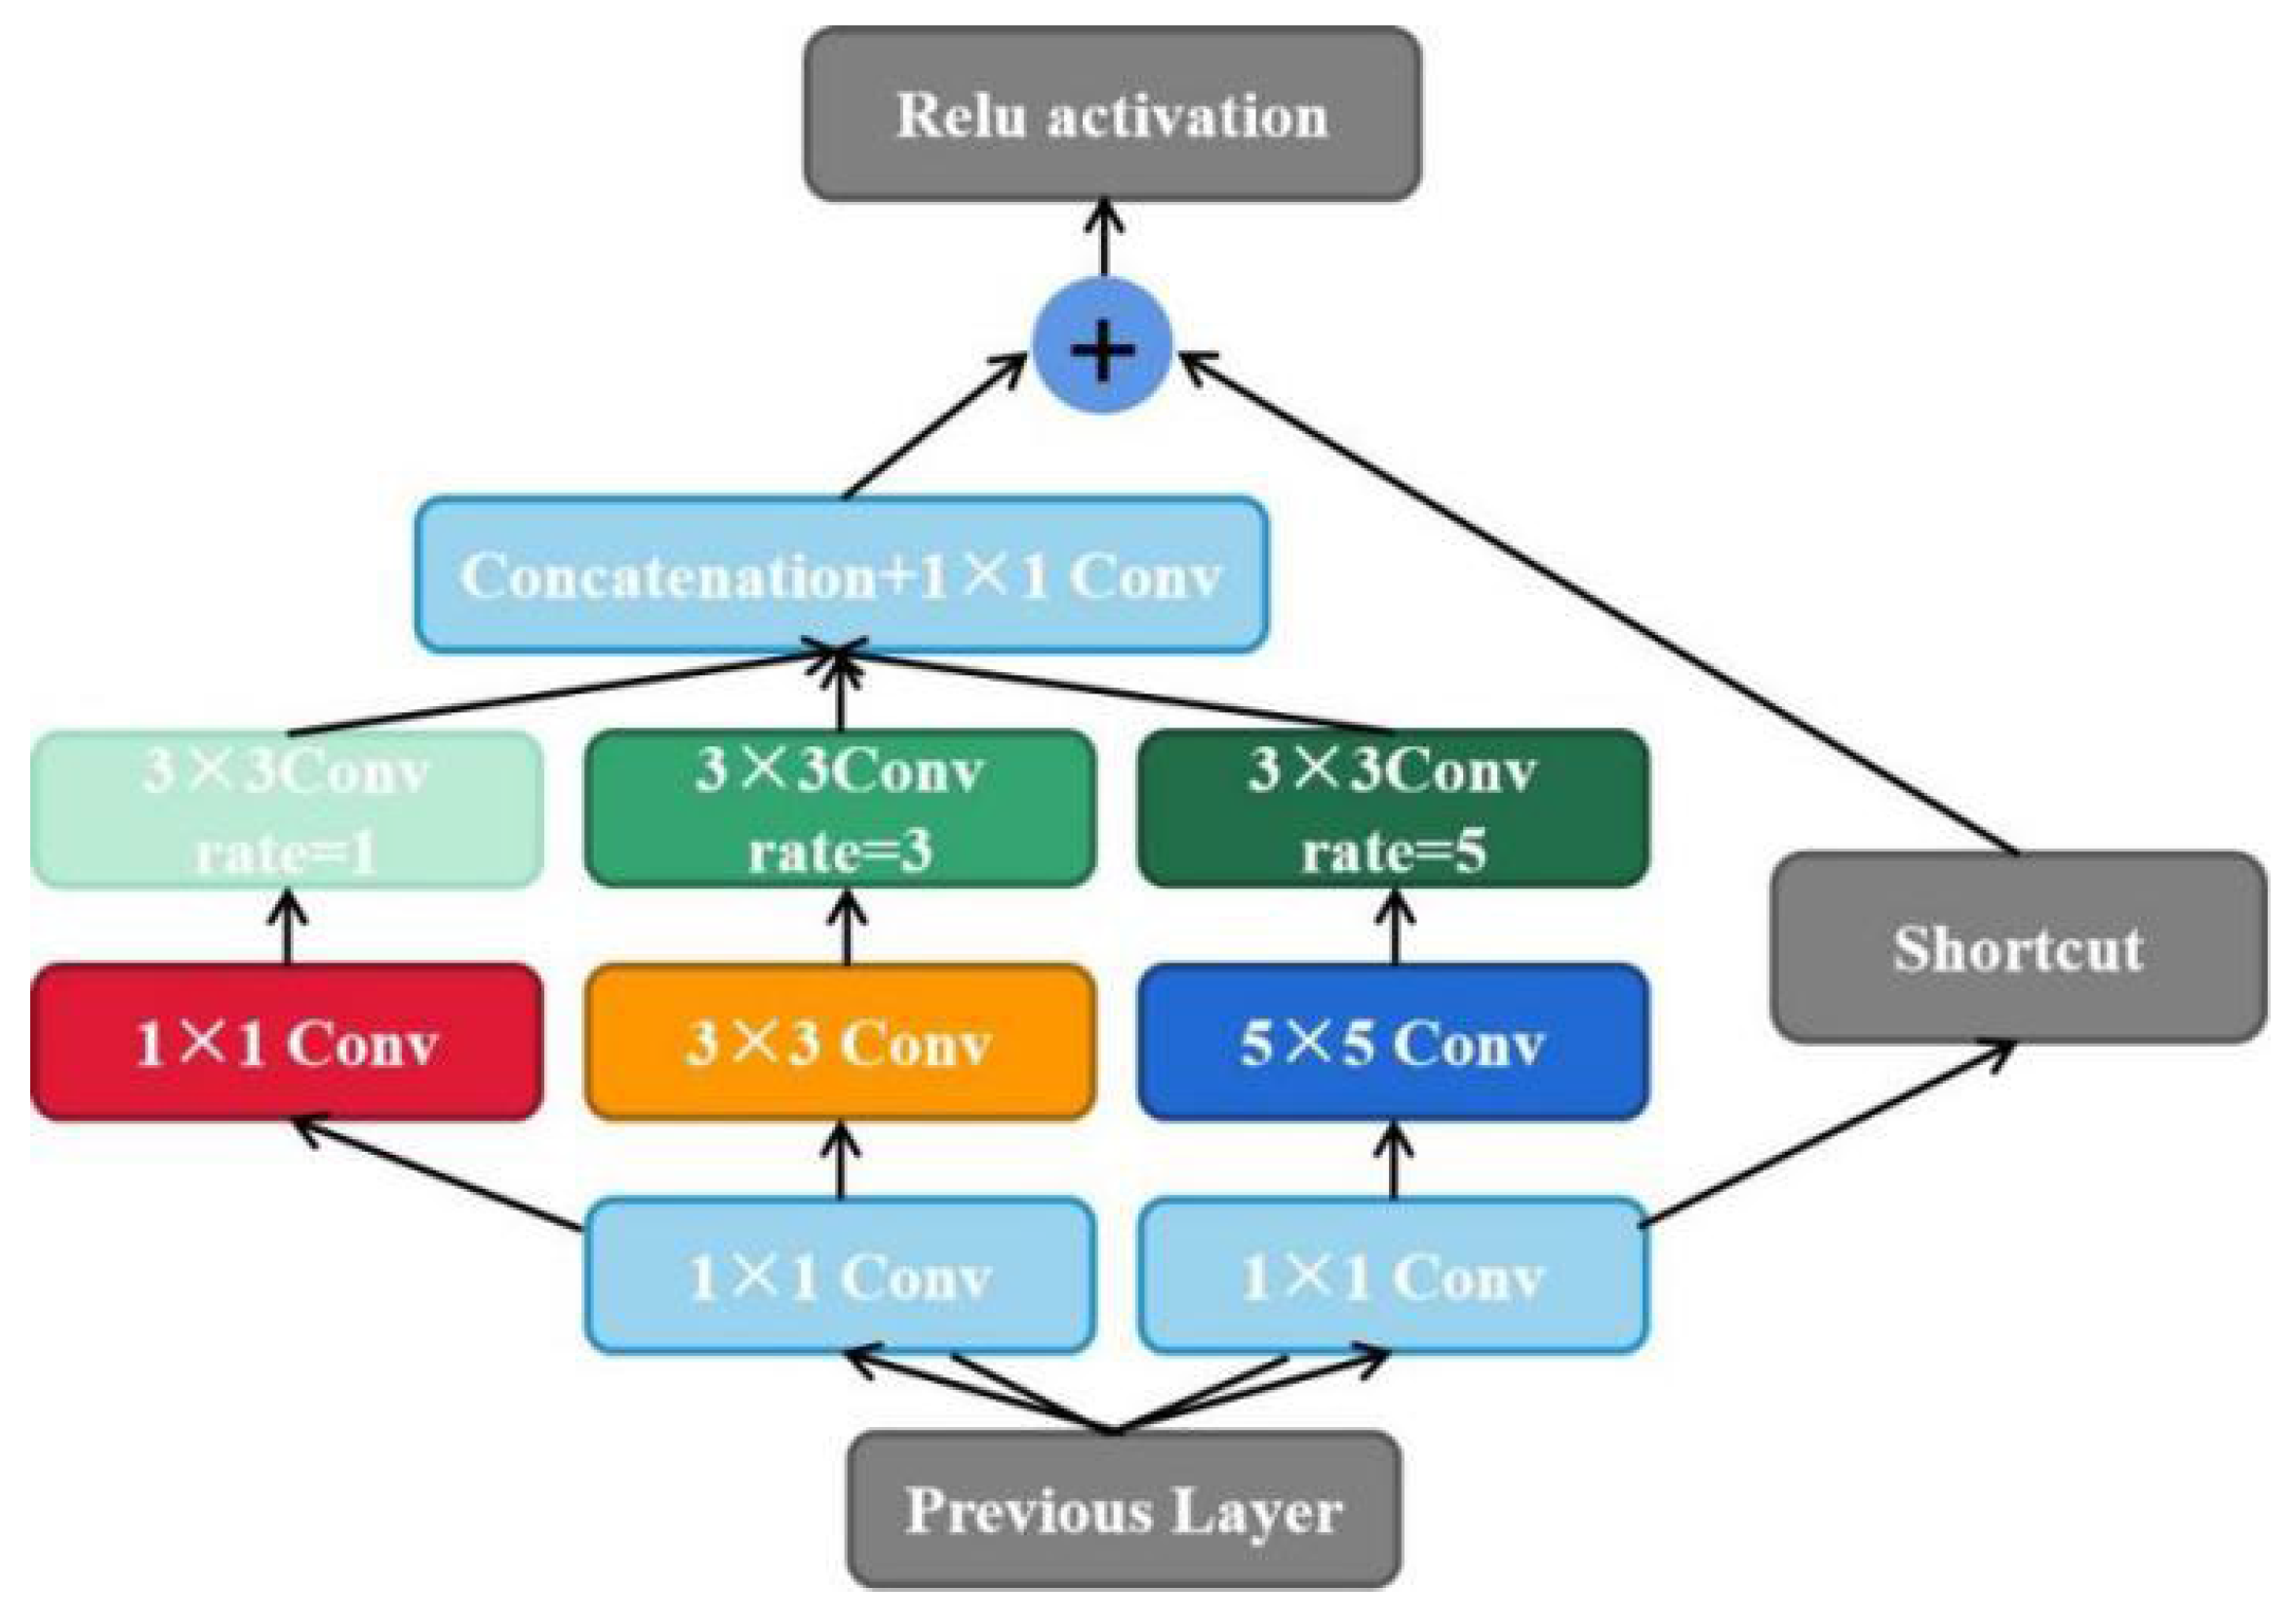
4.2.2. Receptive Field Block

The RFB (Receptive Field Block) module [31] draws on the central idea of the Inception module and adds a dilated convolution based on it, which can enhance the discriminability and robustness of features and improve the performance of network detection without requiring too much calculation.
As shown in Figure 9, the RFB structure has four branches. One of the branches first uses a 1 × 1 convolution to change the number of channels and is then directly connected to the shortcut. The remaining branches also first use a 1 × 1 convolution to change the number of channels, which can reduce the amount of calculation of the network, and then obtain different receptive fields by setting convolution kernels of different sizes. Finally, the dilated convolution is placed to capture information in a larger area while maintaining the same number of parameters. After dilated convolution processing, the 3 branches are concatenated in the channel dimension and then processed by a 1 × 1 convolution, thereby being merged with the shortcut branch and finally output by the Relu activation layer.
In general, lightweight models are well-received for real-time detection. However, it is generally not superior to other models in terms of accuracy. The emergence of RFB module broke traditional thinking and reduced the number of parameters of the model while improving detection accuracy with its excellent design concept. Therefore, in this paper, it replaces the SPPCSPC structure with the RFB module in the original network model, which is used to increase the receptive field of the model to enhance the feature extraction capability of the network and make the model more lightweight, thereby providing a feasible method for later deployment to the mobile terminal.

4.2.3. Design of MP-S Module

The role of the MP module is to down-sample the input feature map. As shown in Figure 10, the original MP structure is composed of two branches: one branch is composed of the maximum pooling MaxPool module and a 1 × 1 convolution, and MaxPool starts. The function is subsampled. The other branch consists of a 1 × 1 convolution and a 3 × 3 convolution with a step size of 2. The function of the second convolution is also subsampled. However, when performing subsampled operations using this convolution, it results in a loss of fine-grained information and the learning of less effective feature representations. Therefore, in order to solve this problem, this paper improves the original MP structure; specifically, it first replaces the 3 × 3 convolution with a stride of 2 with a 1 × 1 convolution, and then adds the space-to-depth operation. The specific implementation steps of the space-to-depth operation are shown in Figure 11. First, the input features of size S×S×C1 are separated into 4 features of S/2×S/2×C1, and then spliced on the channel to obtain the features of S/2×S/2×4C1. Finally, this feature is processed by a 1 × 1 convolution to obtain the feature of S/2×S/2×4C2. The space-to-depth operation replaces the convolution step size, which eliminates the loss of fine-grained information caused by the use of the convolution step size, so the improved MP module can effectively learn more feature information. We named the improved MP module MP-S, and the structure of MP-S is shown in Figure 12.

4.2.4. Content-Aware Reassembly of Features Module

In convolutional neural networks, the purpose of upsampling features is to enlarge the image and increase its resolution. However, the upsampling methods proposed in the past have certain disadvantages; for example, the captured semantic information is not rich enough; a large number of parameters leads to a large amount of calculation; and so on. In order to solve the challenges brought by the above problems, this paper uses a lightweight upsampling operator—CARAFE (Content-Aware Reassembly of Features) [32]. Compared with traditional upsampling methods, CARAFE can gather contextual information in a large receptive field, dynamically generate an adaptive kernel, reduce the number of model parameters, and increase the calculation speed.
As shown in Figure 13, CARAFE consists of a kernel prediction module and a content-aware reassembly module. The kernel prediction module compresses the feature map inputted to the module by channel compressor which can reduce computational cost, then generates reassembly kernels through the content encoder, and finally uses the kernel normalizer to normalize the reassembly kernel in space with the softmax function. The content-aware reassembly module uses the predicted kernels to reorganize features, and the new feature semantic information obtained is richer than the previous feature semantic information. In this paper, the upsampling operator CARAFE is added to the feature pyramid network to enrich the semantic information of blueberry.

5. Results and Analysis

5.1. Model Evaluation Metrics

To evaluate the detection performance of the proposed model, we select the following evaluation indicators in the field of target detection: Parameters, GFLOPS, P (Precision), R (Recall), AP (Average Precision), mAP (mean average precision).
Parameter quantity is used to measure the number of parameters contained in the model.
GFLOPS is one billion (=109) floating point operations per second.
Precision indicates how many blueberries of 1–5 levels are predicted to be positive samples in our Blueberry—Five datasets. The calculation equation is Equation (3).
P r e c i s i o n = T P T P + F P .
Recall indicates how many positive samples in the original sample were predicted correctly. The calculation equation is Equation (4).
R e c a l l = T P T P + F N .
According to P and R data, the Precision Recall (PR) curve can be drawn. The horizontal axis is R, and the vertical axis is the maximum P value corresponding to each R.
The AP refers to the area under the PR curve of a certain category in all predicted pictures, which is calculated separately for each category. The calculation equation is shown in Equation (5).
A P = 1 11 0,0.1 . . . 1.0 P s m o o t h .
The mAP is the average of blueberry AP values on a level of 1–5. The calculation equation is shown in Equation (6):
m A P = 1 N A P N .
In order to understand the evaluation indicators more intuitively, the meanings of TP (True Positive), FP (False Positive), TN (True Negative), and FN (False Negative) are shown in Table 2, where 1 represents a positive sample and 0 represents a negative sample. TP means that both the predicted result and the actual result are positive samples, indicating that blueberry was correctly predicted. FP indicates that the actual result is a negative sample, but it is detected as a positive sample, that is, the number of blueberries that were wrongly detected in this paper; FN indicates that the actual result is a positive sample, but it is predicted as a negative sample; TN means that the actual result is a negative sample, and it is predicted as a negative sample; FN and TN represent the number of wrongly detected blueberries.

5.2. Lab Environment

The experiments in this paper were conducted on the Windows system, and the Pytorch deep learning framework, Python programming language, Intel Core i7-9700K CPU @ 3.60 GHz, NVIDIA RTX 2080 Ti graphics card were employed. The parameter settings are shown in Table 3.

5.3. Experimental Results and Analysis

5.3.1. Model Selection

In order to select the version of the network model that is most suitable for the research in this paper, this paper conducts comparative experiments on three official versions: YOLOv7-Tiny, YOLOv7, and YOLOv7x. YOLOv7-Tiny is a lightweight version of YOLOv7 that reduces model complexity by reducing the number of layers and channels, thereby improving detection speed. Compared to YOLOv7, YOLOv7 Tiny has a faster detection speed but slightly lower accuracy. YOLOv7 is the standard version of the YOLOv7 series. YOLOv7x is an enhanced version of YOLOv7, which has more network layers and more parameters, but the detection speed is relatively slow. From the experimental data in Table 4, it can be seen that although the parameter amount of YOLOv7-Tiny is the lowest, the mAP of YOLOv7-Tiny is 2.1% and 4.6% lower than that of YOLOv7 and YOLOv7x, respectively. Therefore, YOLOv7-Tiny is not considered as the object of this research. In addition, the mAP of YOLOv7x is 2.5% higher than that of YOLOv7, but YOLOv7x is 48.4% higher than YOLOv7 in terms of parameter volume. Blueberry maturity detection needs to be deployed on corresponding hardware devices in practical applications; therefore, a model with a small number of parameters and a fast detection speed is required. At the same time, in order to ensure the effectiveness of blueberry maturity detection, the detection performance of the model needs to achieve a certain accuracy. Therefore, considering the efficiency and performance of the model, this paper finally selected YOLOv7 as the basic network structure and improved it.

5.3.2. Comparison of Model Performance before and after Data Augmentation

In deep learning, if the data volume is too small, which makes the model not have enough data to support it, there is no way to detect the features in it. This leads to underfitting of the model, that is, poor detection ability. Therefore, when the amount of data in the dataset is insufficient, data enhancement operations can be performed on the dataset. In this paper, the number of images in the dataset before and after enhancement is shown in Table 5. The augmented datasets are 10 times larger than the original datasets. To verify the impact of data augmentation operations on model performance, the research tested the datasets before and after data enhancement based on the YOLOv7 network model. The test results are shown in Table 6. After using data enhancement technology, the overall mAP increased by 15.8%. The recognition performance of blueberries in levels 1–5 has all been improved; for instance, level 2 blueberries displayed the most improvement since their mAP increased by 29.3%, and level 1 blueberries, which displayed the least improvement, also resulted a 3.8% higher value than that of the original result. Therefore, the experiment in this section proves the feasibility of using data augmentation technology.

5.3.3. The Impact of EDFM Module on Network Performance

In order to verify the impact of the enhanced feature fusion module EDFM proposed in this paper on the overall performance of the model, this paper conducted experiments on Blueberry—Five Datasets. The experimental results are shown in Table 7. After adding the EDFM module to the Backbone, the mAP of the model increased by 1.0%, which proves the effectiveness of our designed module.

5.3.4. Comparison of Performance of Different Enhanced Receptive Field Modules

From YOLOv4 to YOLOv5-5.0, the spatial pyramid pooling structure (Spatial Pyramid Pooling, SPP) module is used to achieve output adaptive size. In the YOLOv5-6.0 version, the SPP is changed to the advanced version of SPPF. The structure for SPPF (SPP-Fast) and SPP is slightly different. The amount of calculation of the SPPF model was reduced a lot, and the speed of the model was improved. SimSPPF (Simplified SPPF) is a module proposed in YOLOv6 [33]. Compared with SPPF, SimSPPF employs the ReLU activation function instead of the SiLU activation function, and its detection speed was also improved. The ASPP (Atrous Spatial Pyramid Pooling) borrowed from the design idea of SPP and was proposed in DeepLabv2. ASPP samples the input feature map in parallel with dilated convolutions at different sampling rates, which can increase the receptive field and capture multi-scale context information. The RFB is designed to simulate the human visual receptive field; refer to Inception [32] to design and add dilated convolution, which can effectively increase the receptive field.
This paper replaces the above different modules in the same position in the YOLOv7 network structure to test their impact on network performance. The experimental results are shown in Table 8. Among them, the RFB module performed the best in terms of average precision. After adding the RFB module, the mAP of the model is 78.8%, and the number of parameters is 33237428. Compared with the original network, the parameter amount is reduced by 9%, and the mAP is increased by 1.3%. Therefore, this paper replaces the original SPPCSPC module with the RFB module.

5.3.5. Replacement Position of MP-S

In the original network, the MP module was used in both the Backbone and the Neck. Therefore, in order to explore where the MP-S designed in this paper replaces the MP module, the detection performance of the overall network is the most suitable. In this section, three sets of experiments are designed to replace the MP modules of Backbone, Neck, and Backbone + Neck, respectively.
According to the experimental results given in Table 9, the mAPs of replacing Backbone, Neck and performing all replacements are 78.1%, 78.5%, and 78.2%, respectively, and the detection performance of the original network is improved. The most significant improvement is observed when only replacing the Neck. In the MP, the mAP is increased by 1.0%. Therefore, the MP-S module designed in this paper replaces all the MP modules in the Neck.

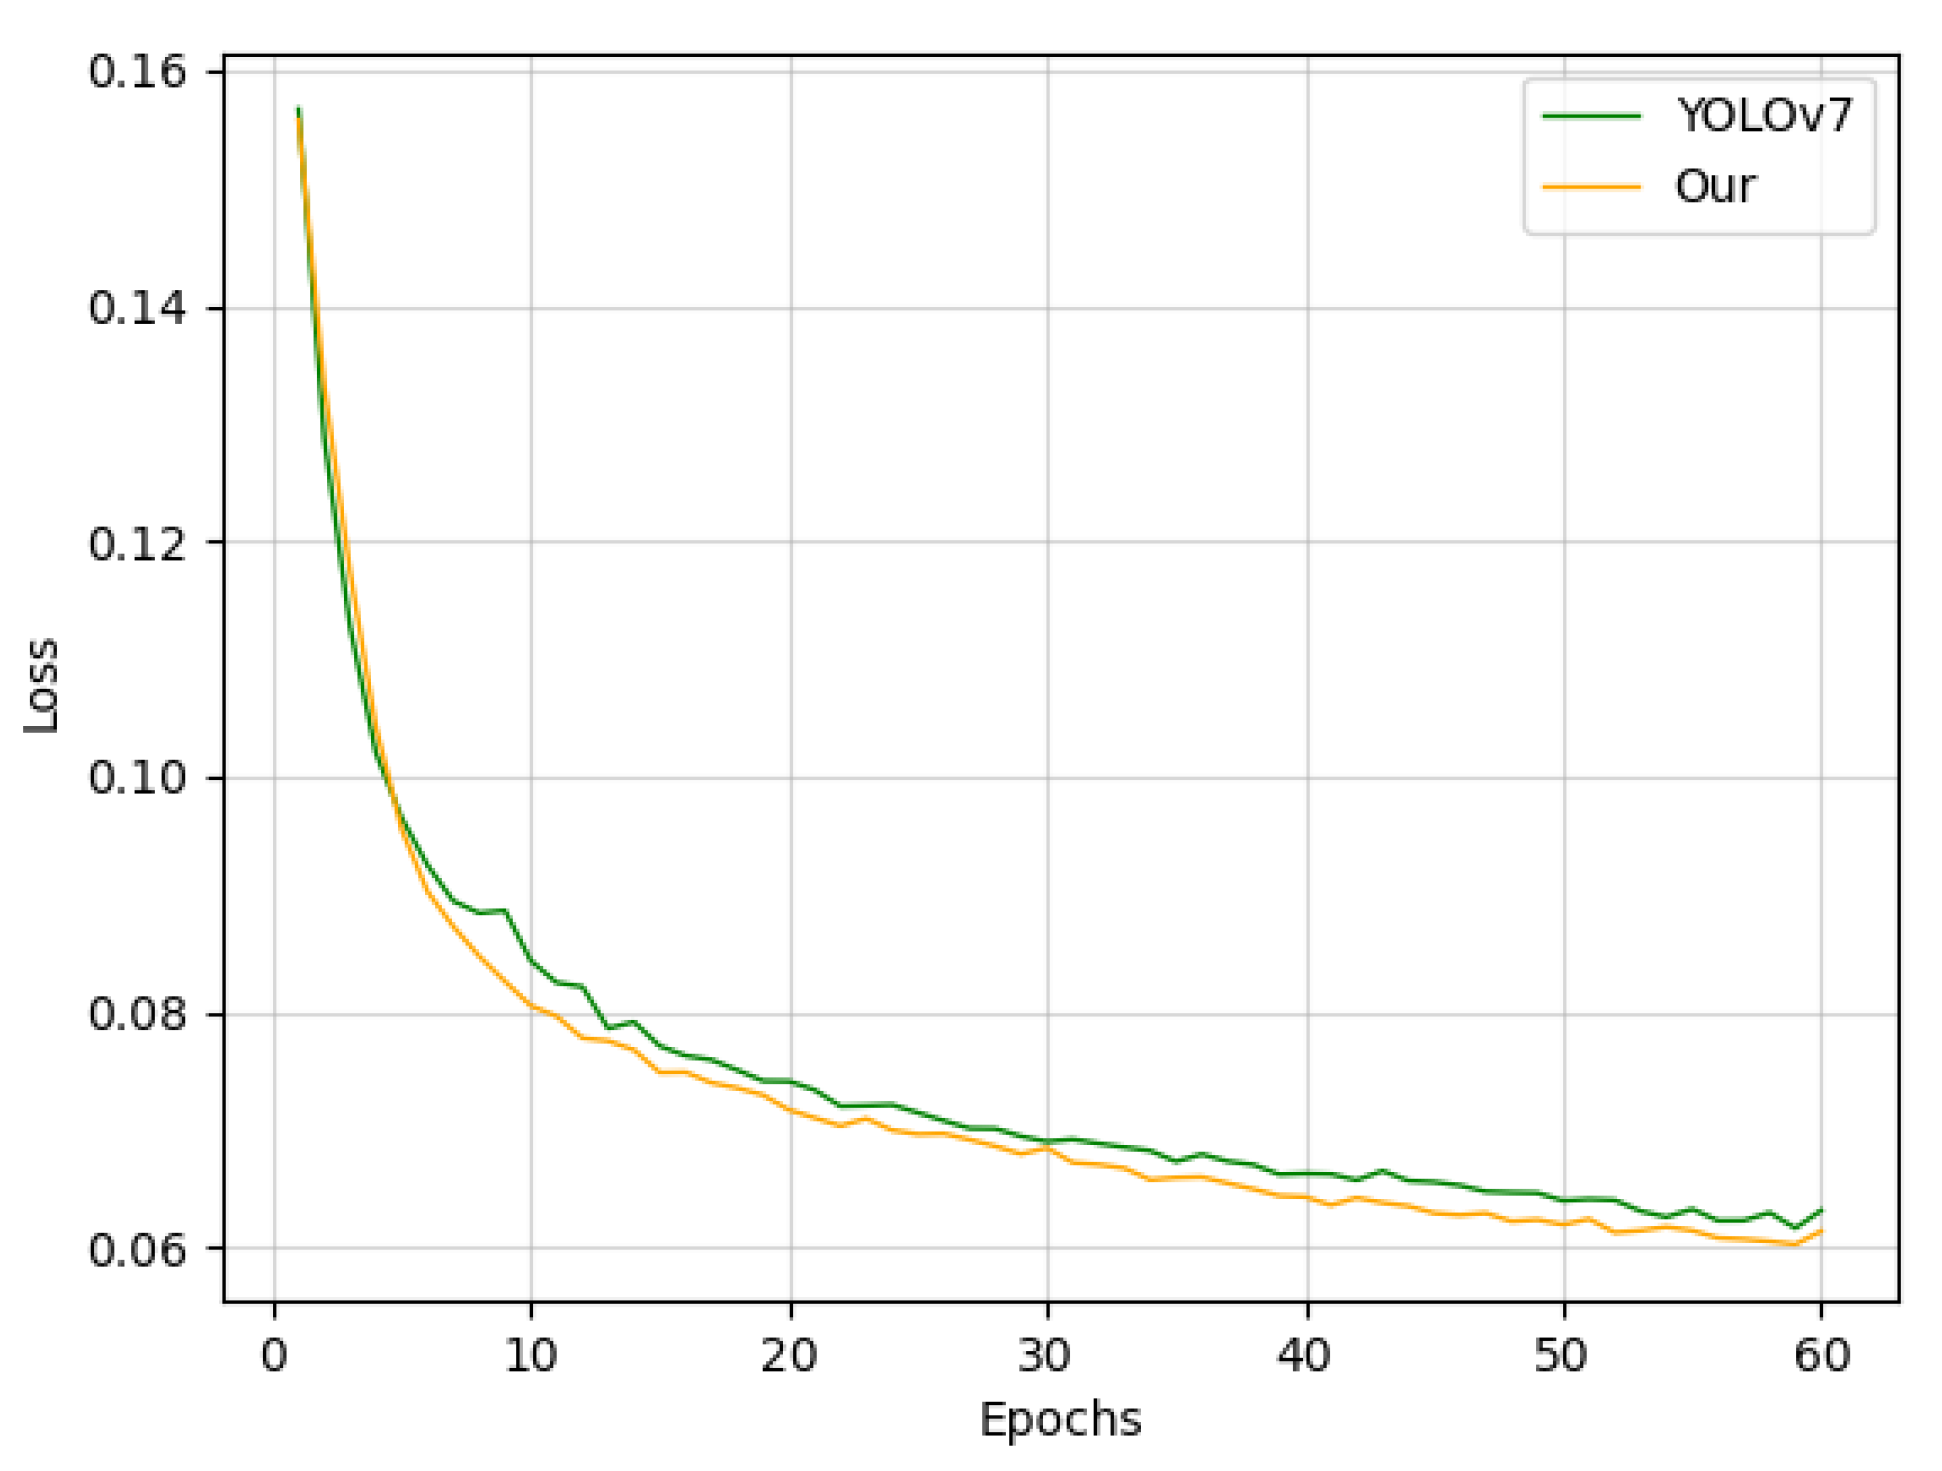
5.3.6. Ablation Experiment

In order to verify the effectiveness of the improved method in this paper, ablation experiments were conducted on Blueberry—Five Datasets. The experimental data are shown in Table 10. Because the final evaluation is the detection accuracy of the model and the number of parameters of the model, mAP and parameters were selected as the evaluation criteria for this experiment. A total of five sets of experiments were designed. In order to reduce the weight of the model, the SPPCSPC was replaced by the RFB module. According to the results of the second set of experiments, the mAP was increased by 1.3%, and the number of model parameters decreased by 9%, which proves the effectiveness of RFB module in improving the model accuracy and reducing the number of model parameters. After adding the EDFM module, the mAP of the model reached 79.6%, which can prove that the module designed in this paper enhances the detail feature extraction ability of blueberry. Then, the MP module in the Neck was replaced with the redesigned MP-S, and the mAP reached 80.4%. Finally, when the upsampling method was replaced with CARAFE, the mAP of the final model reached 80.7%. The mAP was 3.2% higher than that of the original network, which proves the effectiveness of the proposed method in this paper, and can meet the needs of automatic picking. In addition, it can further help blueberry farmers improve the quality and yield of blueberries, reducing economic losses caused by manual operations. The mAP training process diagram of the ablation experiment is shown in Figure 14. The comparison of training loss before and after model improvement is provided in Figure 15.
As shown in Figure 16, we compared the heat map output by the proposed network model with the heat map output by the original network. Column b is the output heat map of the original network model, and column c is the heat map output of our proposed network model. From Figure 16, it can be seen that the red area of the c column image is significantly larger than that of the b column image. Moreover, the proposed network model predicts data for more fruits than the original network. Therefore, it can be proved that our proposed model pays more attention to the characteristics of blueberries than the original model.

5.3.7. Comparison with Other Methods

In this paper, the proposed model is also compared with other mainstream target detection algorithms, such as YOLOv5, YOLOX [34], EfficientDet [35], Faster RCNN [36], YOLOv7-GhostNet [37], YOLOv7-MobileNetV3 [38]. The mAPs of the proposed model are 10.7%, 10.5%, 13.3%, 25.4%, 5.5%, and 5% higher, respectively. From the experimental results in Table 11, it can be seen that the detection accuracy of the proposed algorithm is higher than that of the existing network model, and the overall mAP is 3.2% higher than that of the original YOLOv7 network structure, which proves the effectiveness of our proposed model.

6. Conclusions

This paper uses deep learning technology to develop a blueberry ripeness detection model based on enhanced detail feature and content-aware reassembly for detecting and dividing blueberry maturity in real time, which is improved on the original network structure of YOLOv7. This paper first designs a module for EDFM that enhances detail feature extraction capabilities and places it in the Backbone to enhance the model’s ability to extract blueberry features. Second, the lightweight module RFB is added to the network to solve the problem of the insufficient receptive field of the original network model. Then, by using the Space-to-depth operation to redesign the MP module, a new MP-S module is obtained, and MP-S can effectively learn more feature information. Finally, the efficient upsampling module CARAFE is used to enrich the semantic information of blueberry. The mAP of the proposed model reached 80.7%, 3.2% higher than that of the original network model. The model has better performance than the existing target detection models. Therefore, the network model proposed in this paper is helpful to improve the ability to identify the ripeness of blueberry and provides a new method for the automation of subsequent harvest management. It can not only reduce the large amount of manpower and material resources consumed by the traditional picking method, but also prevent the waste of resources caused by picking too early or too late, which has great significance for improving the blueberry output. This paper also carries out lightweight work with the purpose of reducing the model size and speeding up the calculation speed of the model. In the future, we will continue to focus on improving the accuracy of the model and reducing the number of model parameters, which is a prerequisite for the deployment of the model on the mobile end. Deploying the model on the mobile end can make it more convenient and efficient for blueberry farmers to use the blueberry maturity detection model.

Author Contributions

X.M. conceived the paper, designed and conducted experiments, and wrote the paper. W.Y. provided guidance for thesis innovation and guides thesis revision. H.A. provided software. X.M. provided constructive comments on the research and revised the paper. All authors have read and agreed to the published version of the manuscript.

Funding

This research was funded by the Natural Science Foundation of Jiangxi Province, grant number (20212BAB212005, 20224BAB202015); the National Natural Science Foundation of China, grant number 61462038; Open Project of State Key Laboratory of Zhejiang University, grant number A2029.

Data Availability Statement

Dataset can be obtained at https://github.com/mxx0118/Blueberry-Five (accessed on 11 June 2023).

Acknowledgments

The authors would like to thank the anonymous reviewers for their critical comments and suggestions for improving the manuscript.

Conflicts of Interest

The authors declare no conflict of interest.

References

  1. Krishna, P.; Pandey, G.; Thomas, R.; Parks, S. Improving Blueberry Fruit Nutritional Quality through Physiological and Genetic Interventions: A Review of Current Research and Future Directions. Antioxidants 2023, 12, 810. [Google Scholar] [CrossRef] [PubMed]
  2. Herrera-Balandrano, D.D.; Chai, Z.; Beta, T.; Feng, J.; Huang, W. Blueberry anthocyanins: An updated review on approaches to enhancing their bioavailability. Trends Food Sci. Technol. 2021, 118, 808–821. [Google Scholar] [CrossRef]
  3. Kuang, L.; Wang, Z.; Zhang, J.; Li, H.; Xu, G.; Li, J. Factor analysis and cluster analysis of mineral elements contents in different blueberry cultivars. J. Food Compos. Anal. 2022, 109, 104507. [Google Scholar] [CrossRef]
  4. Yang, W.; Guo, Y.; Liu, M.; Chen, X.; Xiao, X.; Wang, S.; Gong, P.; Ma, Y.; Chen, F. Structure and function of blueberry anthocyanins: A review of recent advances. J. Funct. Foods 2022, 88, 104864. [Google Scholar] [CrossRef]
  5. Rodriguez-Saona, C.; Vincent, C.; Isaacs, R. Blueberry IPM: Past Successes and Future Challenges. Annu. Rev. Entomology 2019, 64, 95–114. [Google Scholar] [CrossRef] [PubMed]
  6. Wang, T.; Chen, B.; Zhang, Z.; Li, H.; Zhang, M. Applications of machine vision in agricultural robot navigation: A review. Comput. Electron. Agric. 2022, 198, 107085. [Google Scholar] [CrossRef]
  7. Xie, D.; Chen, L.; Liu, L.; Chen, L.; Wang, H. Actuators and sensors for application in agricultural robots: A review. Machines 2022, 10, 913. [Google Scholar] [CrossRef]
  8. Oliveira, L.F.P.; Moreira, A.P.; Silva, M.F. Advances in agriculture robotics: A state-of-the-art review and challenges ahead. Robotics 2021, 10, 52. [Google Scholar] [CrossRef]
  9. Fountas, S.; Malounas, I.; Athanasakos, L.; Avgoustakis, I.; Espejo-Garcia, B. AI-Assisted Vision for Agricultural Robots. Agriengineering 2022, 4, 674–694. [Google Scholar] [CrossRef]
  10. Tian, Y.; Yang, G.; Wang, Z.; Wang, H.; Li, E.; Liang, Z. Apple detection during different growth stages in orchards using the improved YOLO-V3 model. Comput. Electron. Agric. 2019, 157, 417–426. [Google Scholar] [CrossRef]
  11. Wang, L.; Qin, M.; Lei, J.; Wang, X. Blueberry maturity recognition method based on improved YOLOv4-Tiny. Trans. Chin. Soc. Agric. Eng. (Trans. CSAE) 2021, 37, 170–178. [Google Scholar]
  12. Chen, F.; Zhang, X.; Zhu, X.; Li, Z.; Lin, J. Detection of the olive fruit maturity based on improved EfficientDet. Trans. Chin. Soc. Agric. Eng. (Trans. CSAE) 2022, 38, 158–166. [Google Scholar]
  13. Parvathi, S.; Selvi, S.T. Detection of maturity stages of coconuts in complex background using Faster R-CNN model. Biosyst. Eng. 2021, 202, 119–132. [Google Scholar] [CrossRef]
  14. Gulzar, Y. Fruit Image Classification Model Based on MobileNetV2 with Deep Transfer Learning Technique. Sustainability 2023, 15, 1906. [Google Scholar] [CrossRef]
  15. Albarrak, K.; Gulzar, Y.; Hamid, Y.; Mehmood, A.; Soomro, A.B. A deep learning-based model for date fruit classification. Sustainability 2022, 14, 6339. [Google Scholar] [CrossRef]
  16. Mamat, N.; Othman, M.F.; Abdulghafor, R.; Alwan, A.A.; Gulzar, Y. Enhancing Image Annotation Technique of Fruit Classification Using a Deep Learning Approach. Sustainability 2023, 15, 901. [Google Scholar] [CrossRef]
  17. Aggarwal, S.; Gupta, S.; Gupta, D.; Gulzar, Y.; Juneja, S.; Alwan, A.A.; Nauman, A. An Artificial Intelligence-Based Stacked Ensemble Approach for Prediction of Protein Subcellular Localization in Confocal Microscopy Images. Sustainability 2023, 15, 1695. [Google Scholar] [CrossRef]
  18. Gulzar, Y.; Hamid, Y.; Soomro, A.B.; Alwan, A.A.; Journaux, L. A convolution neural network-based seed classification system. Symmetry 2020, 12, 2018. [Google Scholar] [CrossRef]
  19. Redmon, J.; Divvala, S.; Girshick, R.; Farhadi, A. You Only Look Once: Unified, Real-Time Object Detection. In Proceedings of the IEEE Conference on Computer Vision and Pattern Recognition, Las Vegas, NV, USA, 27–30 June 2016. [Google Scholar]
  20. Redmon, J.; Farhadi, A. Yolov3: An incremental improvement. arXiv 2018, arXiv:1804.02767. [Google Scholar]
  21. Bochkovskiy, A.; Wang, C.Y.; Liao, H.Y.M. Yolov4: Optimal speed and accuracy of object detection. arXiv 2020, arXiv:2004.10934. [Google Scholar]
  22. Girshick, R.; Donahue, J.; Darrell, T. Rich feature hierarchies for accurate object detection and semantic segmentation. In Proceedings of the IEEE Conference on Computer Vision and Pattern Recognition, Columbus, OH, USA, 23–28 June 2014; pp. 580–587. [Google Scholar]
  23. Girshick, R. Fast r-cnn. In Proceedings of the IEEE International Conference on Computer Vision, Santiago, Chile, 7–13 December 2015; pp. 1440–1448. [Google Scholar]
  24. Jiang, K.; Xie, T.; Yan, R.; Wen, X.; Li, D.; Jiang, H.; Jiang, N.; Feng, L.; Duan, X.; Wang, J. An Attention Mechanism-Improved YOLOv7 Object Detection Algorithm for Hemp Duck Count Estimation. Agriculture 2022, 12, 1659. [Google Scholar] [CrossRef]
  25. Chen, J.; Liu, H.; Zhang, Y.; Zhang, D.; Ouyang, H.; Chen, X. A Multiscale Lightweight and Efficient Model Based on YOLOv7: Applied to Citrus Orchard. Plants 2022, 11, 3260. [Google Scholar] [CrossRef] [PubMed]
  26. Zhao, H.; Zhang, H.; Zhao, Y. Yolov7-sea: Object detection of maritime uav images based on improved yolov7. In Proceedings of the IEEE/CVF Winter Conference on Applications of Computer Vision, Waikoloa, HI, USA, 3–7 January 2023; pp. 233–238. [Google Scholar]
  27. Pham, V.; Nguyen, D.; Donan, C. Road Damage Detection and Classification with YOLOv7. arXiv 2022, arXiv:2211.00091. [Google Scholar]
  28. Tzutalin, D. LabelImg.Git Code. 2015. Available online: https://github.com/tzutalin/labelImg (accessed on 20 November 2022).
  29. Hao, W.; Zhili, S. Improved Mosaic: Algorithms for more Complex Images. J. Phys. Conf. Ser. 2020, 1684, 012094. [Google Scholar] [CrossRef]
  30. Zhang, Q.L.; Yang, Y.B. Sa-net: Shuffle attention for deep convolutional neural networks. In Proceedings of the ICASSP 2021–2021 IEEE International Conference on Acoustics, Speech and Signal Processing (ICASSP), Toronto, Canada, 2–12 June 2021; IEEE: Piscataway, NJ, USA, 2021; pp. 2235–2239. [Google Scholar]
  31. Liu, S.; Huang, D. Receptive field block net for accurate and fast object detection. In Proceedings of the European Conference on Computer Vision (ECCV), Munich, Germany, 8–14 September 2018; pp. 385–400. [Google Scholar]
  32. Wang, J.; Chen, K.; Xu, R.; Liu, Z.; Loy, C.C.; Lin, D. Carafe: Content-aware reassembly of features. In Proceedings of the IEEE/CVF International Conference on Computer Vision, Seoul, South Korea, 27 October–2 November 2019; pp. 3007–3016. [Google Scholar]
  33. Li, C.; Li, L.; Jiang, H.; Weng, K.; Geng, Y.; Li, L.; Ke, Z.; Li, Q.; Cheng, M.; Nie, W.; et al. YOLOv6: A single-stage object detection framework for industrial applications. arXiv 2022, arXiv:2209.02976. [Google Scholar]
  34. Ge, Z.; Liu, S.; Wang, F.; Li, Z.; Sun, J. Yolox: Exceeding yolo series in 2021. arXiv 2021, arXiv:2107.08430, 2021. [Google Scholar]
  35. Tan, M.; Pang, R.; Le, Q.V. Efficientdet: Scalable and efficient object detection. In Proceedings of the IEEE/CVF Conference on Computer Vision and Pattern Recognition, Seattle, WA, USA, 14–19 June 2020; pp. 10781–10790. [Google Scholar]
  36. Ren, S.; He, K.; Girshick, R.; Sun, J. Faster R-CNN: Towards real-time object detection with region proposal networks. IEEE Trans. Pattern Anal. Mach. Intell. 2017, 39, 1137–1149. [Google Scholar] [CrossRef] [PubMed] [Green Version]
  37. Han, K.; Wang, Y.; Tian, Q.; Guo, J.; Xu, C.; Xu, C. Ghostnet: More features from cheap operations. In Proceedings of the IEEE/CVF Conference on Computer Vision and Pattern Recognition, Seattle, WA, USA, 13–19 June 2020; pp. 1580–1589. [Google Scholar]
  38. Howard, A.; Sandler, M.; Chu, G.; Chen, L.-C.; Tan, M.; Wang, W.; Zhu, Y.; Pang, R.; Vasudevan, V.; Le, Q.V.; et al. Searching for mobilenetv3. In Proceedings of the IEEE/CVF international conference on computer vision, Seoul, South Korea, 27 October–2 November 2019; pp. 1314–1324. [Google Scholar]
Figure 1. A series of images of blueberries that are difficult to identify (a) foliage occlusion; (b) dense fruit occlusion between fruits; (c) complex background; (d) blueberry with different ripeness in a single cluster of fruits).
Agronomy 13 01613 g001
Figure 2. Level 1–5 blueberry.
Agronomy 13 01613 g002
Figure 3. The principle of Mosaic.
Agronomy 13 01613 g003
Figure 4. YOLOv7 network structure.
Agronomy 13 01613 g004
Figure 5. The Proposed Network Architecture (the red dashed box is the improved module proposed in this paper).
Agronomy 13 01613 g005
Figure 6. The structure of EDFM.
Agronomy 13 01613 g006
Figure 7. The structure of C3.
Agronomy 13 01613 g007
Figure 8. The structure of Shuffle Attention.
Agronomy 13 01613 g008
Figure 9. The structure of RFB.
Agronomy 13 01613 g009
Figure 10. The structure of MP.
Agronomy 13 01613 g010
Figure 11. Space-to-depth operation.
Agronomy 13 01613 g011
Figure 12. The structure of MP-S.
Agronomy 13 01613 g012
Figure 13. The structure of CARAFE.
Agronomy 13 01613 g013
Figure 14. The change in mAP during the training process.
Agronomy 13 01613 g014
Figure 15. Training loss.
Agronomy 13 01613 g015
Figure 16. Heat map comparison between the original network and the proposed network model. (a1a4) represent the original image, (b1b4) represent the heat map output by the original network model, (c1c4) the heat map output by the proposed network model.
Agronomy 13 01613 g016
Table 1. The number of blueberry tags for levels 1–5.
PercentageBlueberry RipenessNumber of LabelsNumber of Images
train set60%level 141,2105120
level 244402320
level 340002490
level 454,3206000
level 52090970
val set20%level 113,7301770
level 21360800
level 31810990
level 417,2402000
level 5630290
test set20%level 115,1101780
level 21320780
level 31720970
level 419,6502000
level 5620350
Table 2. TP, FP, TN, FN.
Actual Results
10
Predicted results1TPFP
0FNTN
Table 3. Parameter settings.
NameValue
Learning Rate0.01
Image Size640 × 640
Batch Size4
Table 4. Performance comparison of different versions of YOLOv7.
P (%)R (%)mAP (%)ParametersGFLOPS
YOLOv7-Tiny70.871.975.46,018,42013.1
YOLOv771.775.177.536,503,348103.4
YOLOv7x71.778.980.070,809,396188.3
Table 5. Number of samples.
DatasetsTrainValTest
Original600200200
Data Augmentation600020002000
Table 6. Comparison of model performance before and after dataset enhancement.
DatasetsLevel 1AP (%)Level 2AP (%)Level 3AP (%)Level 4AP (%)Level 5AP (%)mAP (%)
Original84.743.062.284.134.561.7
Data Augmentation88.572.381.289.955.977.5
Improvement3.829.319.05.821.415.8
Table 7. Effectiveness of EDFM module.
P (%)R (%)mAP (%)
YOLOv771.775.177.5
YOLOv7 + EDFM72.675.278.5
Table 8. Comparison of the effects of different modules.
P (%)R (%)mAP (%)Parametersms
SPPCPPC71.775.177.536,503,34811.2
SPP72.774.277.830,471,47611.0
SPPF73.873.778.630,471,47610.9
SimSPPF72.276.478.330,472,50010.9
ASPP71.575.578.345,415,73212.9
RFB73.975.178.833,237,42811.0
Table 9. Comparison of the effects of different modules.
mAP (%)
Original77.5
Backbone78.1
Neck78.5
Backbone + Neck78.2
Table 10. Comparison of the effects of different modules.
RFBEDFMMP-SCARAFEmAP (%)Parameters
1 77.536,503,348
2 78.833,237,428
3 79.670,052,692
4 80.469,643,092
580.770,514,428
Table 11. Performance comparison with other models.
Level 1AP (%)Level 2AP (%)Level 3AP (%)Level 4AP (%)Level 5AP (%)mAP (%)
YOLOv583.268.076.283.539.270.0
YOLOX83.067.275.285.140.470.2
EfficientDet79.065.074.778.739.767.4
Faster RCNN53.855.960.466.839.655.3
YOLOv7-GhostNet84.771.781.387.950.375.2
YOLOv7-MobileNetV385.370.380.787.854.575.7
YOLOv788.572.381.289.955.977.5
Ours89.174.482.390.667.380.7
Disclaimer/Publisher’s Note: The statements, opinions and data contained in all publications are solely those of the individual author(s) and contributor(s) and not of MDPI and/or the editor(s). MDPI and/or the editor(s) disclaim responsibility for any injury to people or property resulting from any ideas, methods, instructions or products referred to in the content.

