Article

A Refined Apple Binocular Positioning Method with Segmentation-Based Deep Learning for Robotic Picking

1
College of Environmental Resources, Chongqing Technology and Business University, Chongqing 400067, China
2
Chongqing Engineering Research Center for Processing, Storage and Transportation of Characterized Agro-Products, Chongqing 400067, China
3
College of Mechanical and Electronic Engineering, Northwest A&F University, Yangling 712100, China
*
Authors to whom correspondence should be addressed.
Agronomy 2023, 13(6), 1469; https://doi.org/10.3390/agronomy13061469
Submission received: 11 April 2023 / Revised: 9 May 2023 / Accepted: 23 May 2023 / Published: 25 May 2023

Abstract

:
An apple-picking robot is now the most widely accepted method in the substitution of low-efficiency and high-cost labor-intensive apple harvesting. Although most current research on apple-picking robots works well in the laboratory, most of them are unworkable in an orchard environment due to unsatisfied apple positioning performance. In general, an accurate, fast, and widely used apple positioning method for an apple-picking robot remains lacking. Some positioning methods with detection-based deep learning reached an acceptable performance in some orchards. However, apples occluded by apples, leaves, and branches are ignored in these methods with detection-based deep learning. Therefore, an apple binocular positioning method based on a Mask Region Convolutional Neural Network (Mask R-CNN, an instance segmentation network) was developed to achieve better apple positioning. A binocular camera (Bumblebee XB3) was adapted to capture binocular images of apples. After that, a Mask R-CNN was applied to implement instance segmentation of apple binocular images. Then, template matching with a parallel polar line constraint was applied for the stereo matching of apples. Finally, four feature point pairs of apples from binocular images were selected to calculate disparity and depth. The trained Mask R-CNN reached a detection and segmentation intersection over union (IoU) of 80.11% and 84.39%, respectively. The coefficient of variation (CoV) and positioning accuracy (PA) of binocular positioning were 5.28 mm and 99.49%, respectively. The research developed a new method to fulfill binocular positioning with a segmentation-based neural network.

1. Introduction

As one of the most common fruits, apples are widely accepted and consumed around the world and are nutritious and tasty. In 2020, apple production reached 1.27 × 10⁸ tons, which accounted for 10% of the world’s production of fruits [1]. However, high-cost and ineffective manual picking is very common in apple harvesting, which has an adverse impact on the economic effects of apple production. Thus, it is highly desirable to investigate apple-picking robots to achieve high-efficiency and low-cost apple picking as a substitute for labor-intensive apple picking. Robotics for apple picking requires the integration of machine vision systems to guide manipulators and end effectors. For machine vision systems, accurate detection, positioning, and accessibility are essential [2].
Machine vision systems significantly improve the efficiency and accuracy of detection and positioning of apple-picking robots, which have been implemented in a number of ways. Zhao et al. used a charge-coupled device (CCD) monocular color camera to position the original color image of apples, which reported an apple-picking success rate of 77% [3]. Zhang et al. developed a deep learning-based apple detection and localization system with a red-, green-, blue-depth (RGB-D) camera, which cost 0.3 s to detect and position all fruits in one image [4]. Gené-Mola et al. used a mobile terrestrial laser scanner to generate a 3D point cloud of the scene and proposed a fruit detection algorithm based on apparent reflectance parameters, which reported an F1-score of 0.86 [5]. Karkee et al. applied a time-of-flight (ToF) camera to build a three-dimensional architecture of an apple tree, which reached a branch identification accuracy of 77% on average [6]. The above-mentioned studies have certain feasibility.
The binocular positioning method is a relatively common positioning method, which has the lowest hardware cost and the highest software complexity compared to other vision-based positioning methods [7]. In recent years, binocular vision has also been widely used in machine vision systems. The binocular positioning method is highly dependent on feature matching, and to a certain extent will be affected by conditions such as no texture [8]. However, the above-mentioned effects rarely occur and can be ignored since general agricultural picking robots work under natural light conditions. Binocular vision owns the advantages of high efficiency, accuracy, and simple system structure, which are very suitable for target recognition and positioning [9]. Therefore, using the binocular positioning method as part of the agricultural robot information perception system is a rational choice for agricultural robots working outdoors. Williams et al. designed a four-arm kiwifruit-picking robot based on binocular vision, which reached a visual recognition success rate of 76.3–89.6% [10]. Additionally, Wang et al., Luo et al., Si et al., and Zhao et al. used the binocular positioning method to obtain the three-dimensional coordinates of fruit, indicating that the binocular positioning method is applicable for agricultural picking robots [11,12,13,14].
Recognition of an apple from an image is required to determine the apple’s position in the binocular positioning of the apple. Object detection, semantic segmentation, and instance segmentation are the most common methods to separate apples and backgrounds in recent years. The traditional object detection and segmentation research was not robust enough to separate the apple and background in most scenes. Si et al. proposed a threshold segmentation method for segmenting apple pixels based on the difference and ratio of pixel RGB values [13]. Fu et al. developed an image processing algorithm based on the color and shape of kiwifruit and calyx to separate linearly clustered kiwifruits [15]. Mizushima and Lu proposed a segmentation method based on a support vector machine and Otsu’s method [16,17,18]. Traditional image processing algorithms are easy to implement. However, when fruit or foliage color, illumination, camera viewing angle, and the distance between the camera and the fruit change; they will affect the detection and segmentation accuracy to a certain extent [19]. Different characteristics of fruits in an orchard and complex background changes put forward higher requirements on image detection and segmentation technology.
Compared to traditional object detection and segmentation algorithms, a convolutional neural network (CNN) achieves a more robust and accurate performance due to its strong feature extraction ability and autonomous learning mechanism [20,21]. In recent years, there are some researchers applying various networks to detect or segment various objects from images in agricultural scenarios [21,22,23,24,25,26,27]. However, semantic segmentation can only segment images into different classes while lacking the capability of segmenting each object within the class [28]. Therefore, instance segmentation networks are developed to segment different objects of the same class into individual instances. Gené-Mola et al. used a Mask Region CNN (Mask R-CNN) for Fuji apple detection and segmentation in acquired 2D RGB images, which obtained an accuracy precision of 0.86 and an F1-score of 0.86 [29]. Wang et al. proposed an automatic apple detection method based on an instance segmentation model of DeepSnake, which reported a comprehensive detection accuracy of 95.66% [30]. In addition, instance segmentation is better than semantic segmentation as it can provide abundant information about each object, especially for those overlapped fruits. This shows that the performance of the instance segmentation network is more prominent for the apple’s positioning.
In this study, an apple binocular positioning method based on the Mask R-CNN is proposed. The Mask R-CNN was applied to detect and segment areas where apples exist in the image. After that, template matching based on parallel polar line constraints was used to match apples in the left image and right image to reach a stereo match and build relations for the output of the Mask R-CNN. The binocular positioning method is adopted to obtain three-dimensional coordinates of feature points on apples. An average value of the four feature points’ three-dimensional coordinates was used as the final positioning coordinates. The apple detection and segmentation intersection over union (IoU) of the Mask R-CNN were calculated. The coefficient of variation (CoV) and positioning accuracy (PA) were calculated to evaluate the positioning effect of apples. This research provides a reference for the design of a machine vision system of apple-picking robots with good robustness.

2. Materials and Methods

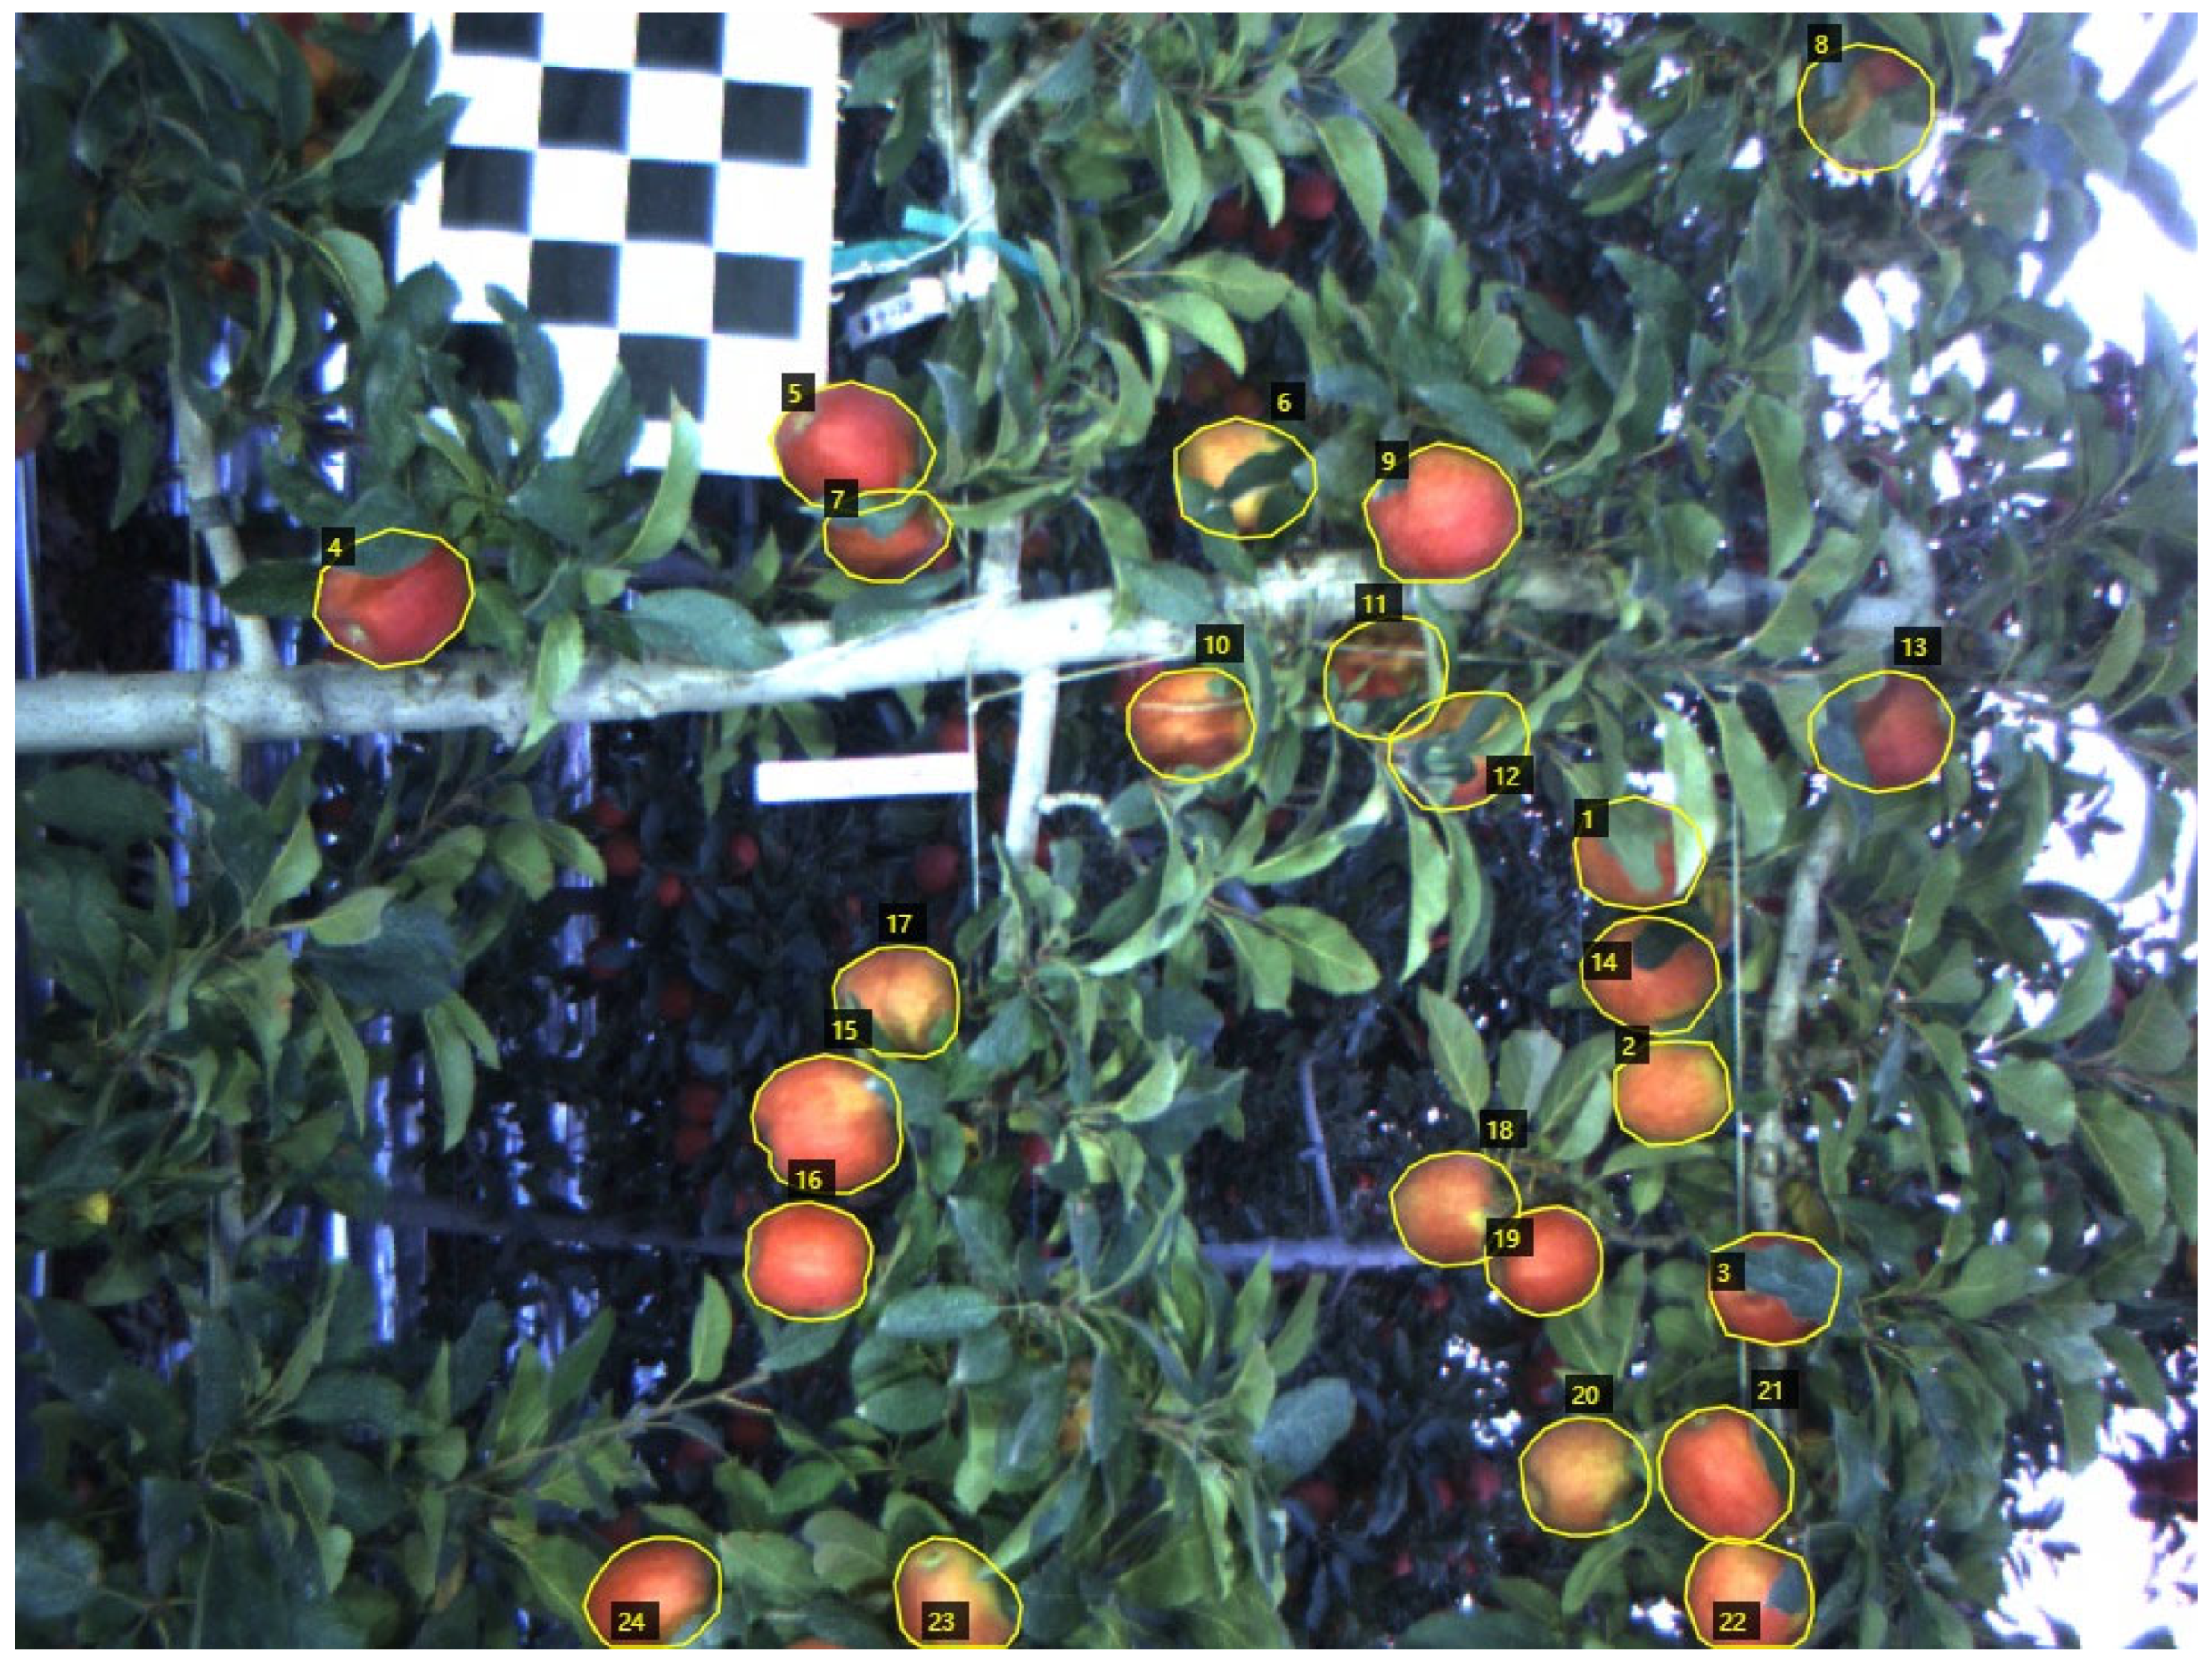
2.1. Dataset Acquisition

Image data were collected with a binocular camera, BumblebeeXB3 (FLIR Systems, Wilsonville, OR, USA), during harvest season (2017) in a commercial orchard in Prosser, WA, USA. The BumblebeeXB3 has three sensors (Figure 1). Adjust the pixel aggregation network (PAN) register to specify two lenses with a shorter baseline distance to capture images. The camera parameters were read from the camera, which were summarized in Table 1.
After the binocular image was captured, ground truth apple targets were manually annotated in RGB images with a resolution of 1280 × 960 pixels using polygon annotations (yellow contours in Figure 2). Leaf-occluded apples, branch/wire-occluded apples, non-occluded apples, and apple-occluded apples were all marked in the same class (apple). The apple’s images were labeled to generate json format label files by using VGG Image Annotator (VIA) (University of Oxford, Oxford, UK). In total, the whole image dataset consists of 800 images. We randomly selected 560 images, 240 of them for the training dataset and test dataset, respectively. Training images were randomly obtained from an independent and uniform sampling of the whole dataset. All images were mutually exclusive, ensuring reliability.

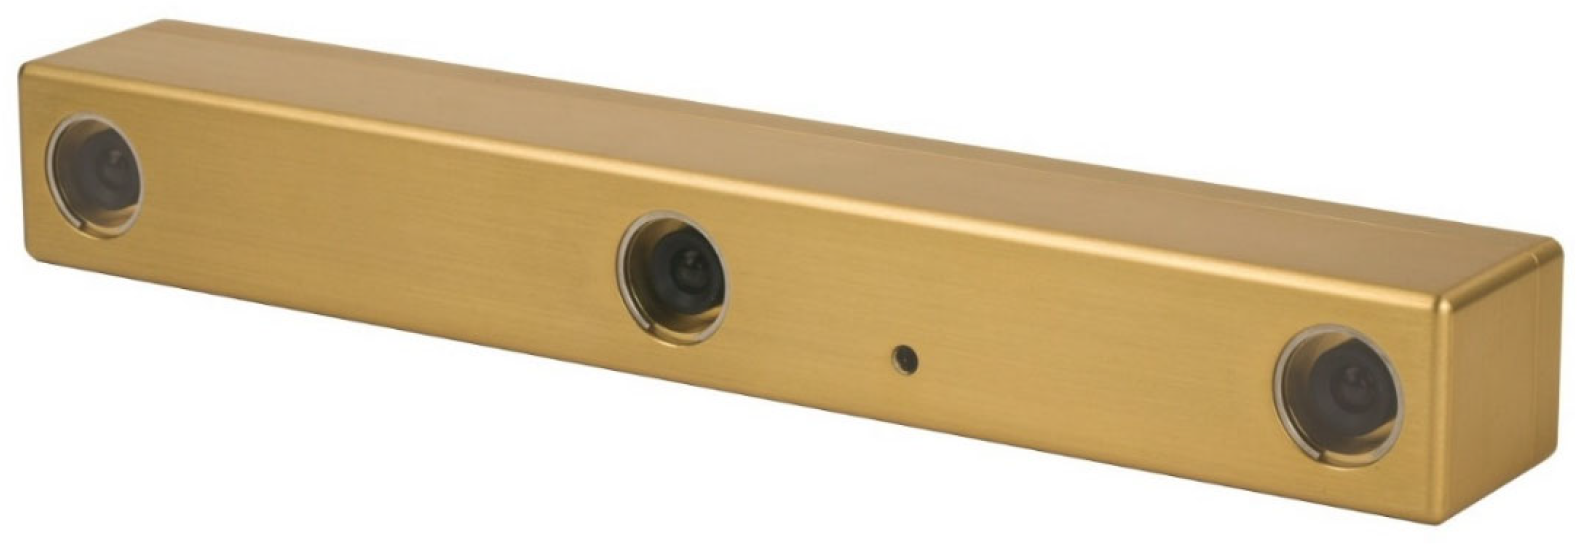
2.2. Training Platform

The training platform included a desktop computer with an Intel Core i7-8750H (2.20 GHz) quad-core CPU, a GeForce GTX m1060 6 GB GPU, and 16 GB of memory, running on a Windows 10 64-bit system. Software tools used included CUDA 9.0.176, CUDNN 7.6.5, Python 3.6.1, and Numpy 1.18.3. The experiments were implemented in the TensorFlow framework. Detection speed was measured with the same computer hardware.

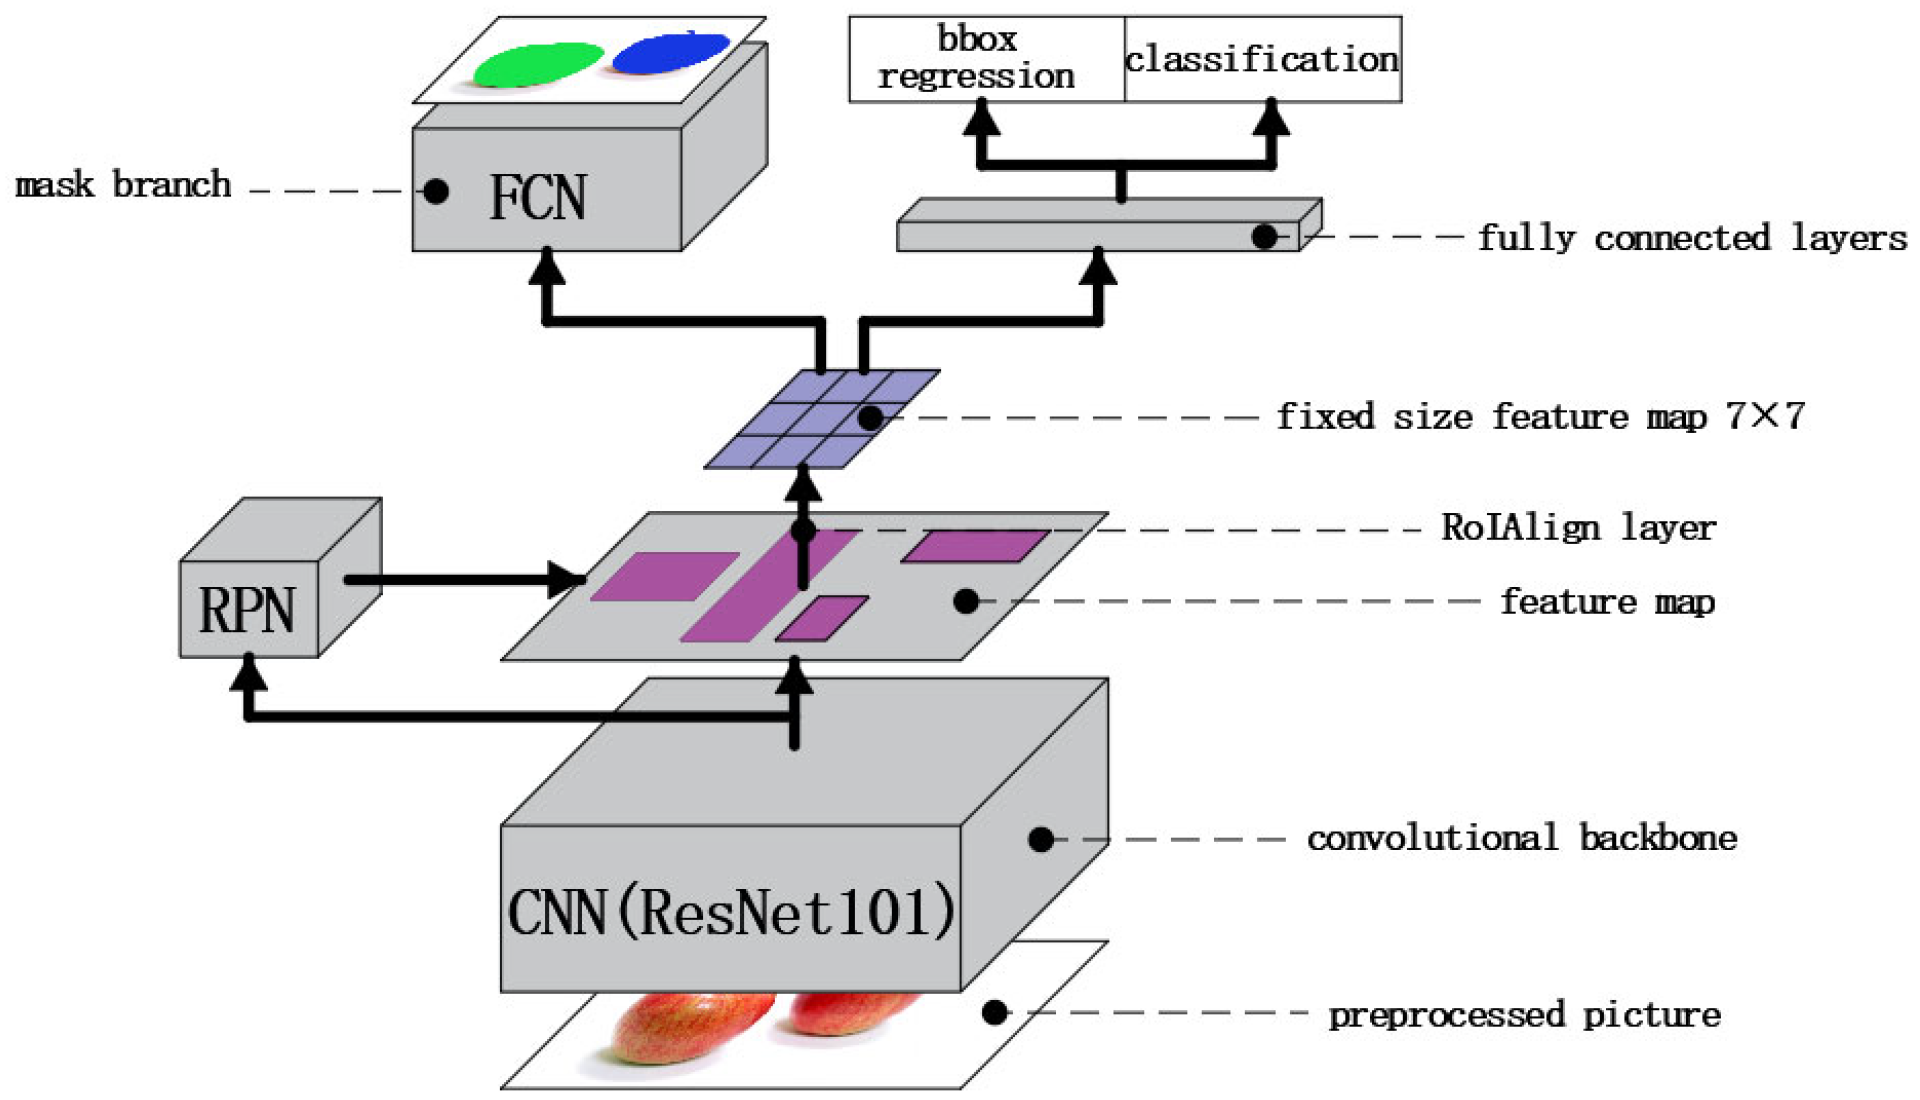
2.3. Deep Learning Model

The Mask R-CNN is an instance segmentation network [31], which adds a fully convolutional network (FCN) based on a Faster R-CNN for segmentation tasks, as is shown in Figure 3 [32]. First, the input of the network is a pair of rectified binocular images. Afterward, the image is extracted by a convolutional backbone (this research uses ResNet101) to obtain a feature map. After that, regions of interest (RoI) in the feature map are subjected to binary classification (distinguishing foreground and background) and a bounding box (BBox) regression through a Region Proposal Network (RPN). Then, after the RoI-Align standardization operation, a small feature map (for example, 7 × 7) is extracted from each RoI. Finally, these RoIs are classified as (N category classification) BBox regression and mask generation (FCN operation is performed in each RoI).
The Mask R-CNN can directly perform instance segmentation on an image (determined by the class of the detected target at the pixel level and distinguished by different instances). The output result is the position and class of the detected object, associated confidence scores, and the corresponding pixel level (mask) of the detected object, which are demonstrated in Figure 4. Relying on a neural network, it detects the existing area of apple fruit and divides pixels belonging to the apple in the area at the pixel level.

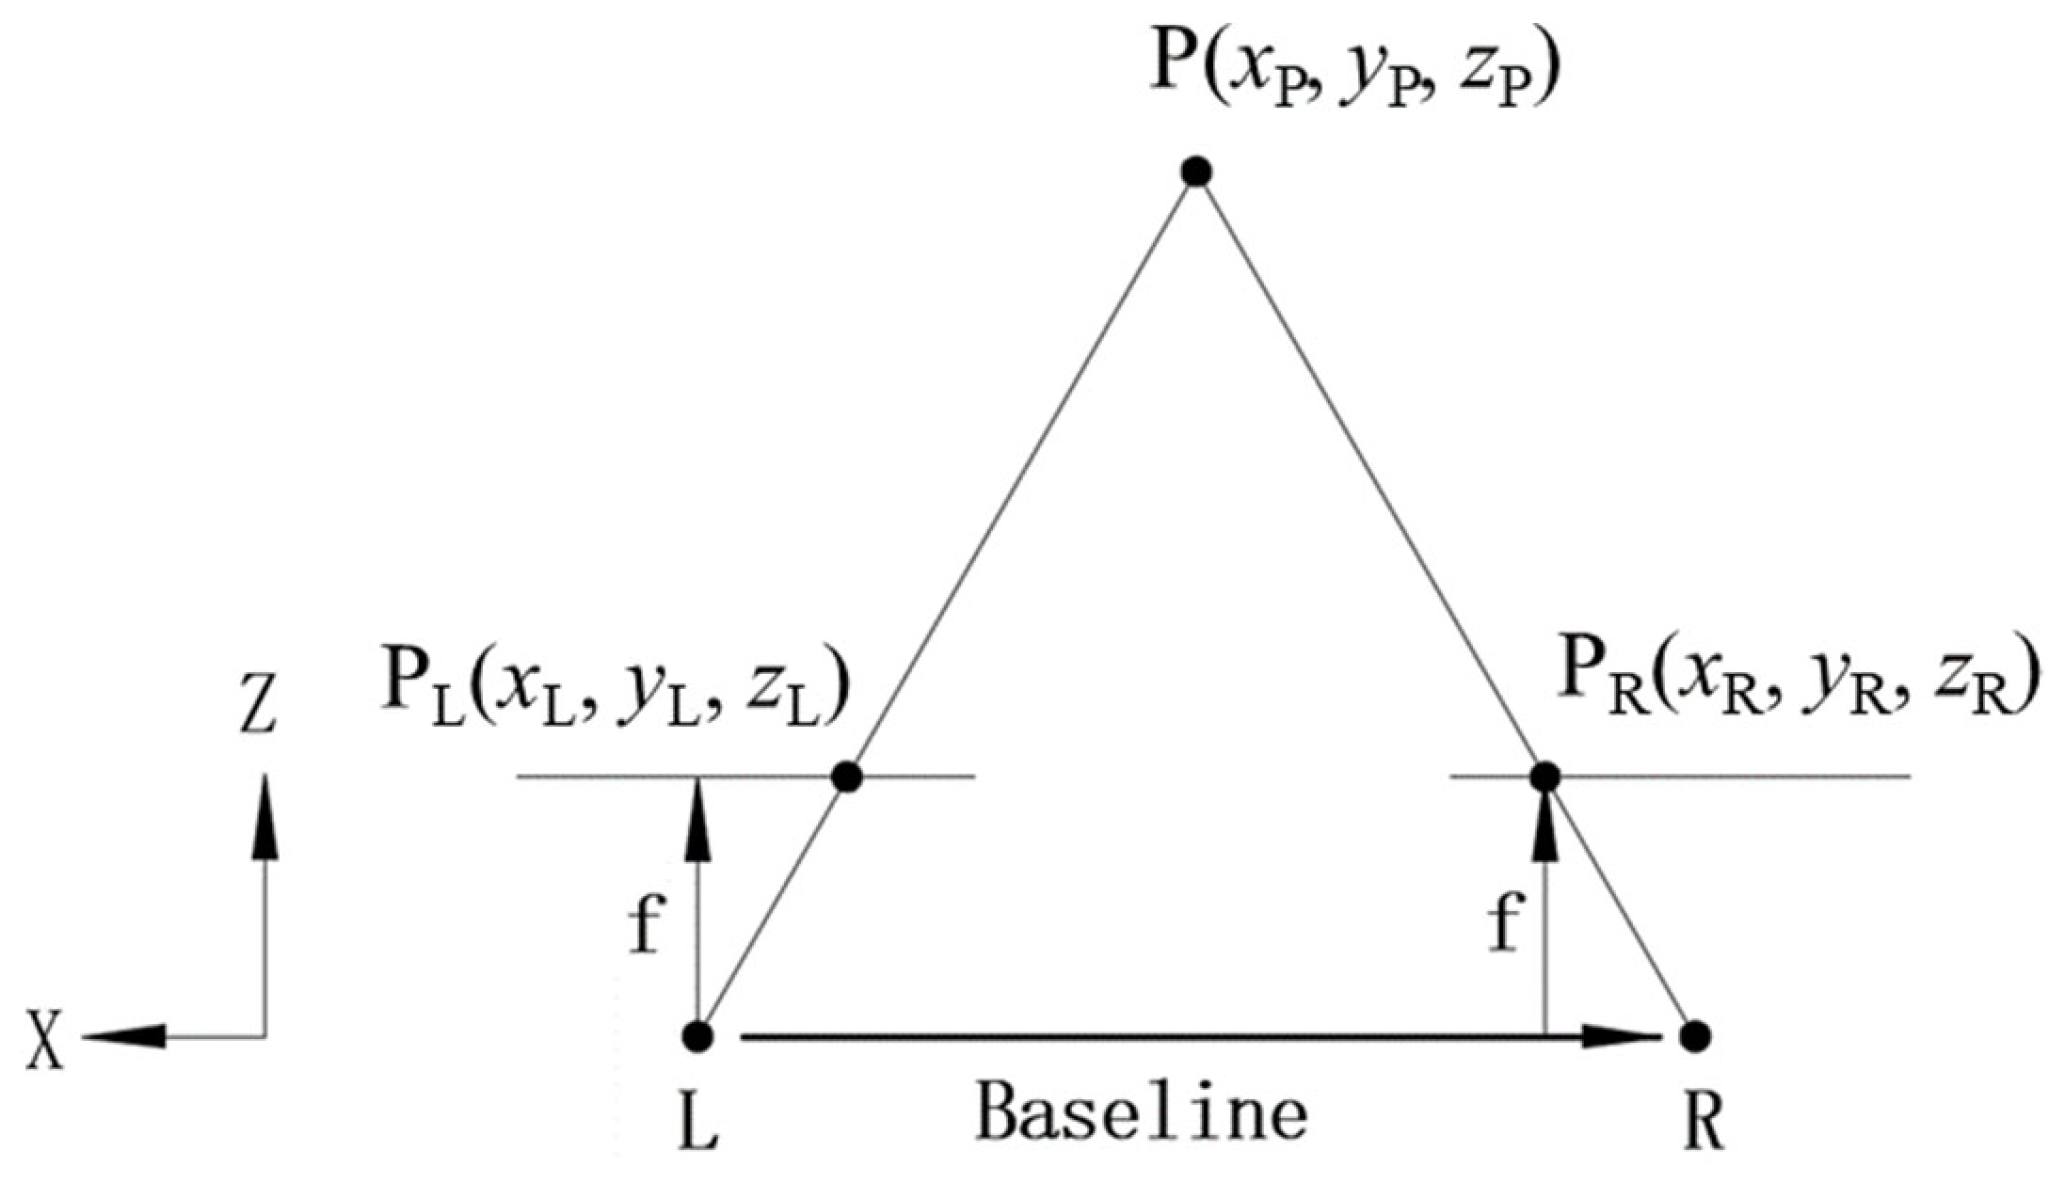
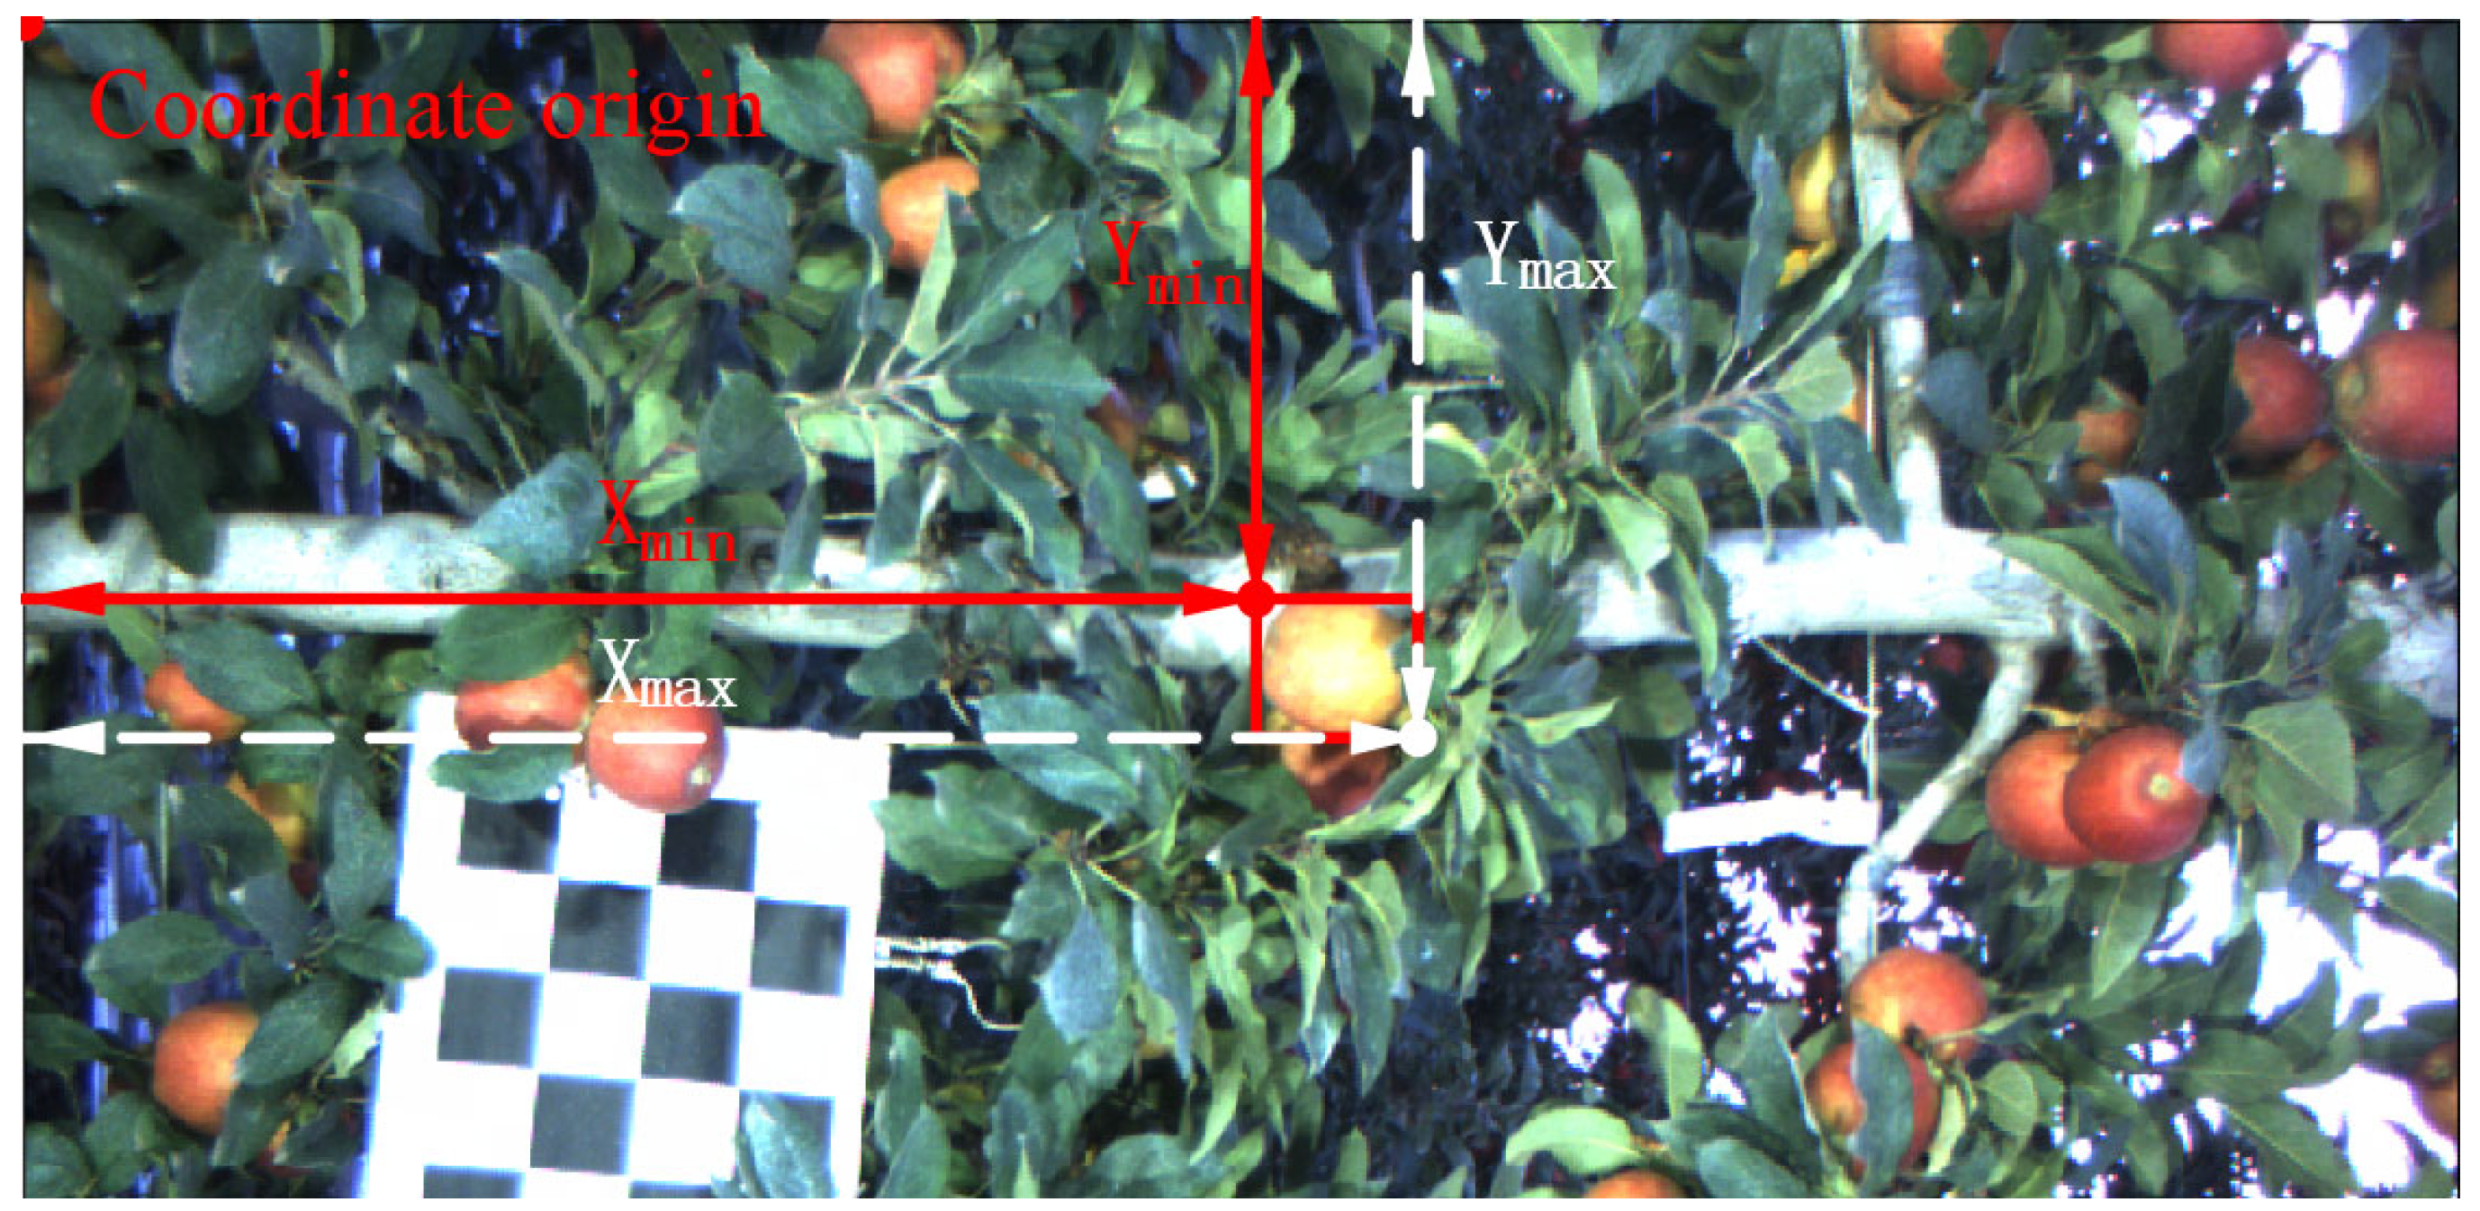
2.4. The Binocular Calibration and Binocular Positioning Principle

Binocular positioning first needs to calibrate the camera to obtain corrected images because of the distortion of binocular images (Figure 5a). This study uses a single-plane black-and-white checkerboard camera calibration method [33]. By detecting feature points on the checkerboard in the image, the internal intrinsic matrix and extrinsic matrix of the camera were obtained. Then, the image distortion of the binocular camera is corrected by algorithms. After correction, the position of the apple in the left and right images is at the same height (Figure 5b).
The parallel optical axis model is the primary premise of binocular vision. In the process of binocular positioning, two lenses with parallel optical axes are on the same plane. In the top view of the plane, the binocular positioning principle is shown in Figure 6. In Figure 6, L is the left camera; R is the right camera; the baseline is the physical distance between cameras; f is the focal length of the camera; P (xP, yP, zP) is the actual three-dimensional coordinates of the feature point in the real world; PL (xL, yL) is the pixel coordinates of the feature point in the left image; and PR (xR, yR) is the pixel coordinates of the feature point in the right image. The difference between xR and xL was known as disparity. According to the triangle similarity principle in plane geometry, the depth value xP of feature point P was defined in Equation (1). The abscissa and ordinate of feature point P were defined in Equations (2) and (3), respectively.
z P = f × Baseline d i s p a r i t y = f × Baseline x R x L
x P = Baseline d i s p a r i t y × x L = Baseline x R x L × x L
y P = Baseline d i s p a r i t y × y L = Baseline y R y L × y L
To further calculate the three-dimensional coordinates of P, variables such as f, baseline, and disparity should be determined. Baseline and f can be straightly read from the camera. However, the disparity can only be determined by pixel coordinates of feature points in binocular images, which were obtained by stereo matching of feature points.

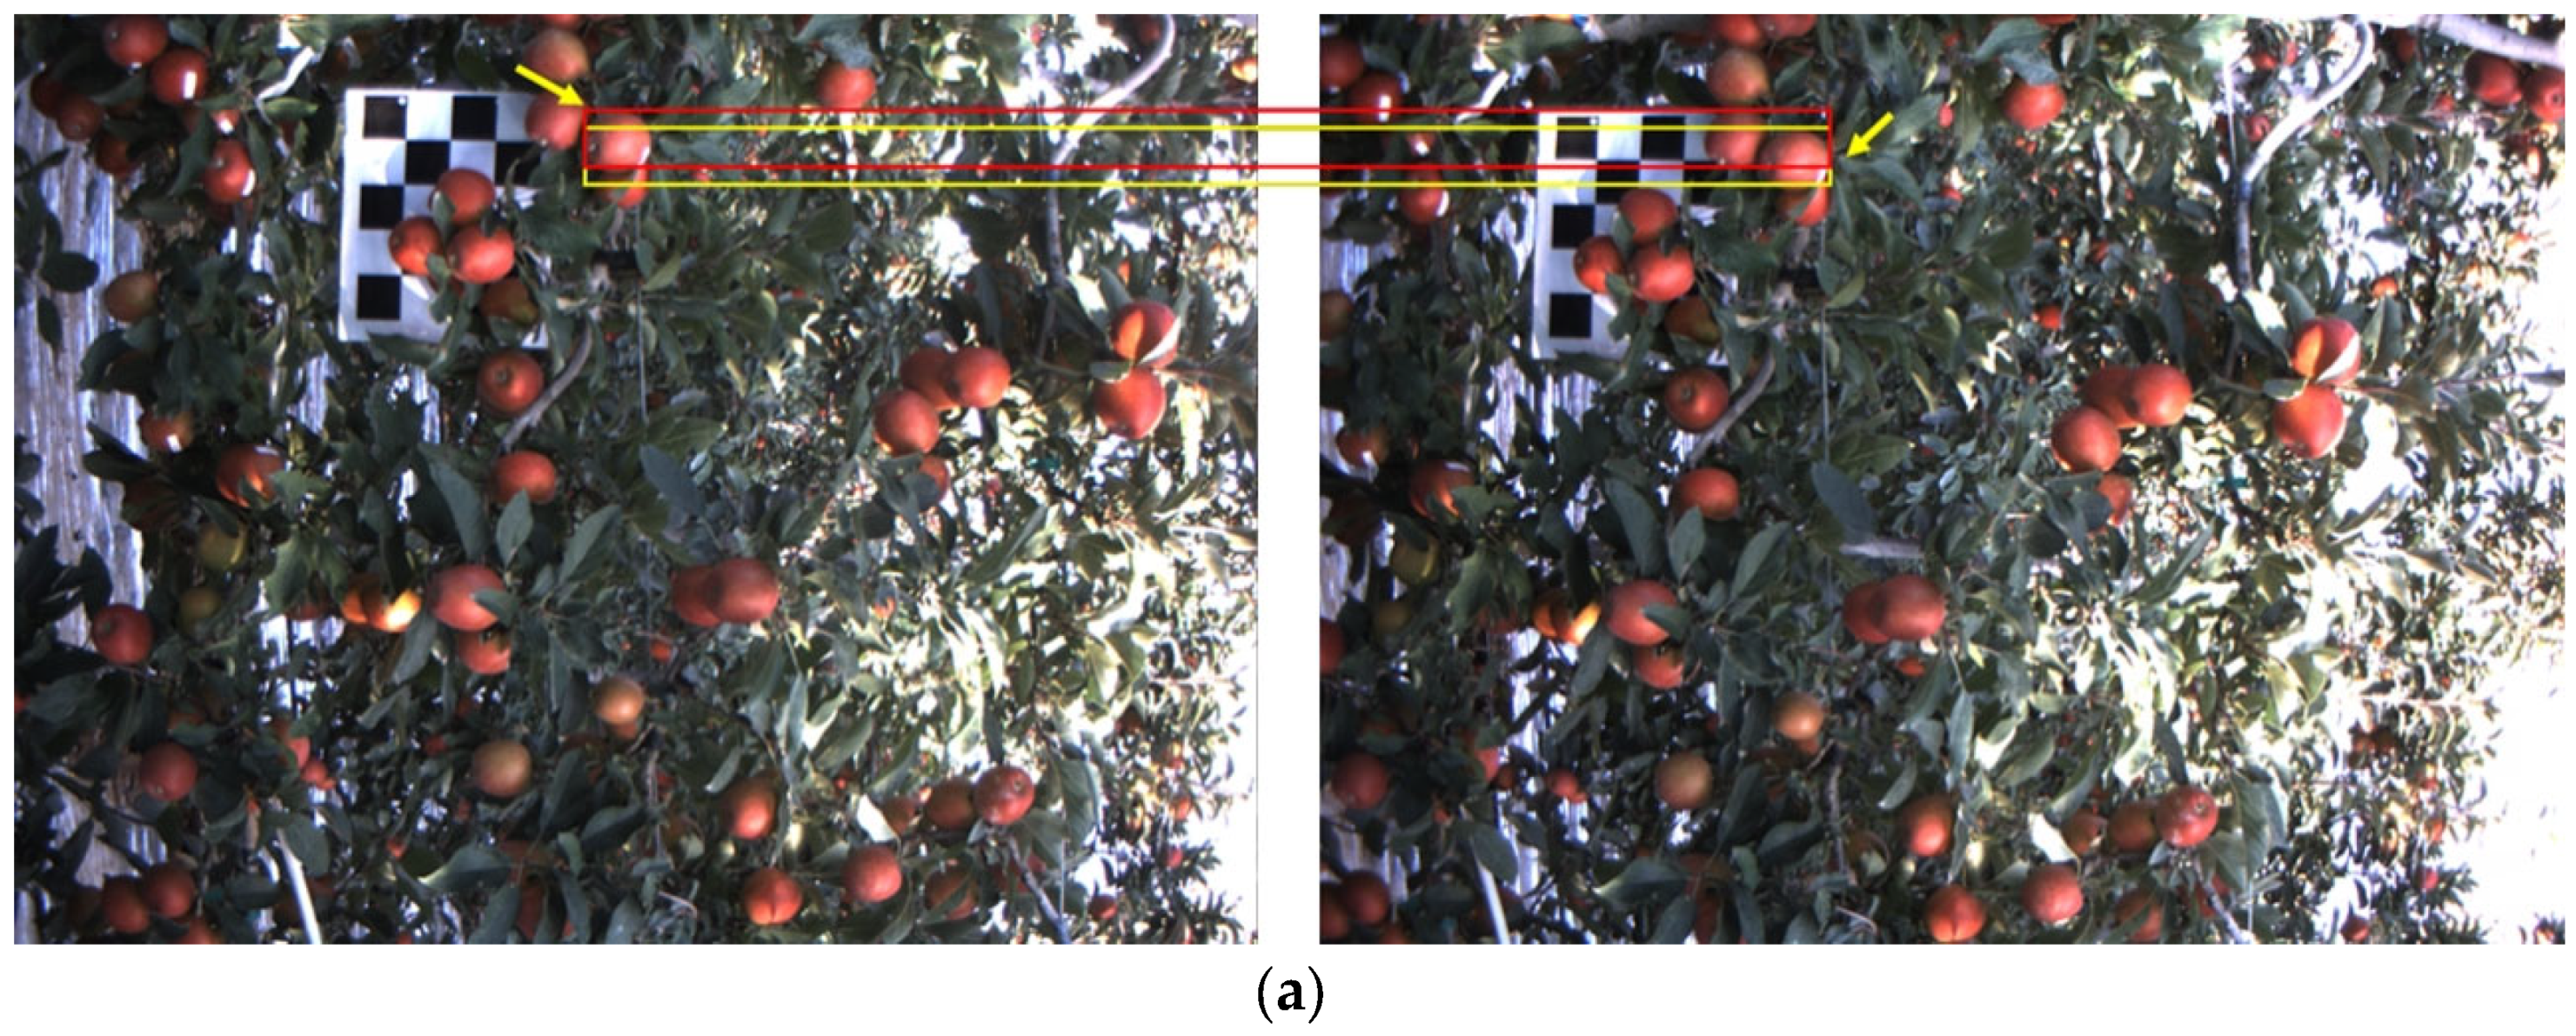
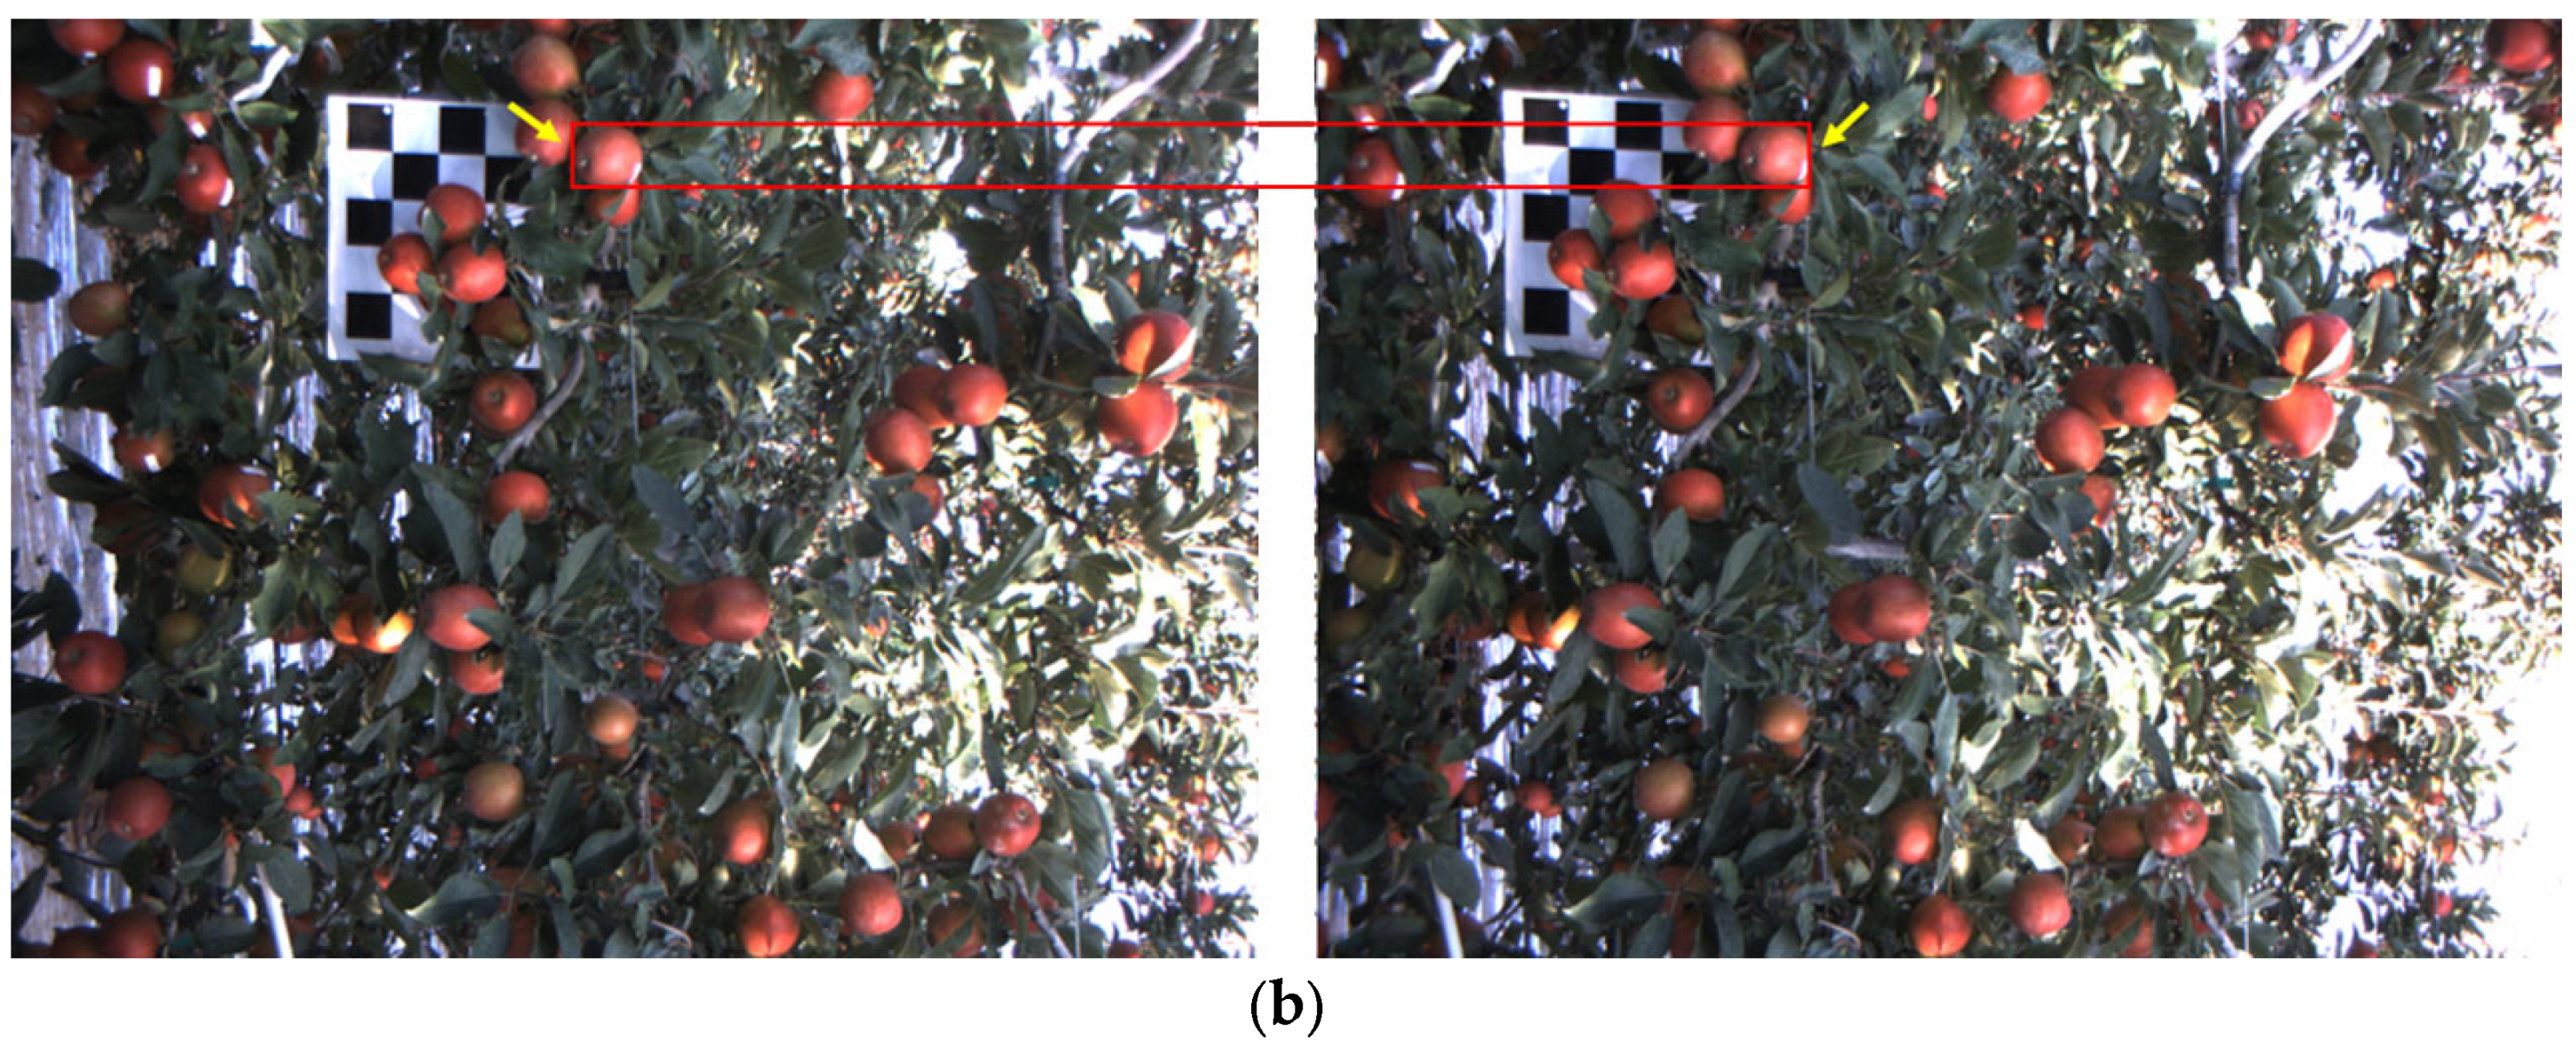
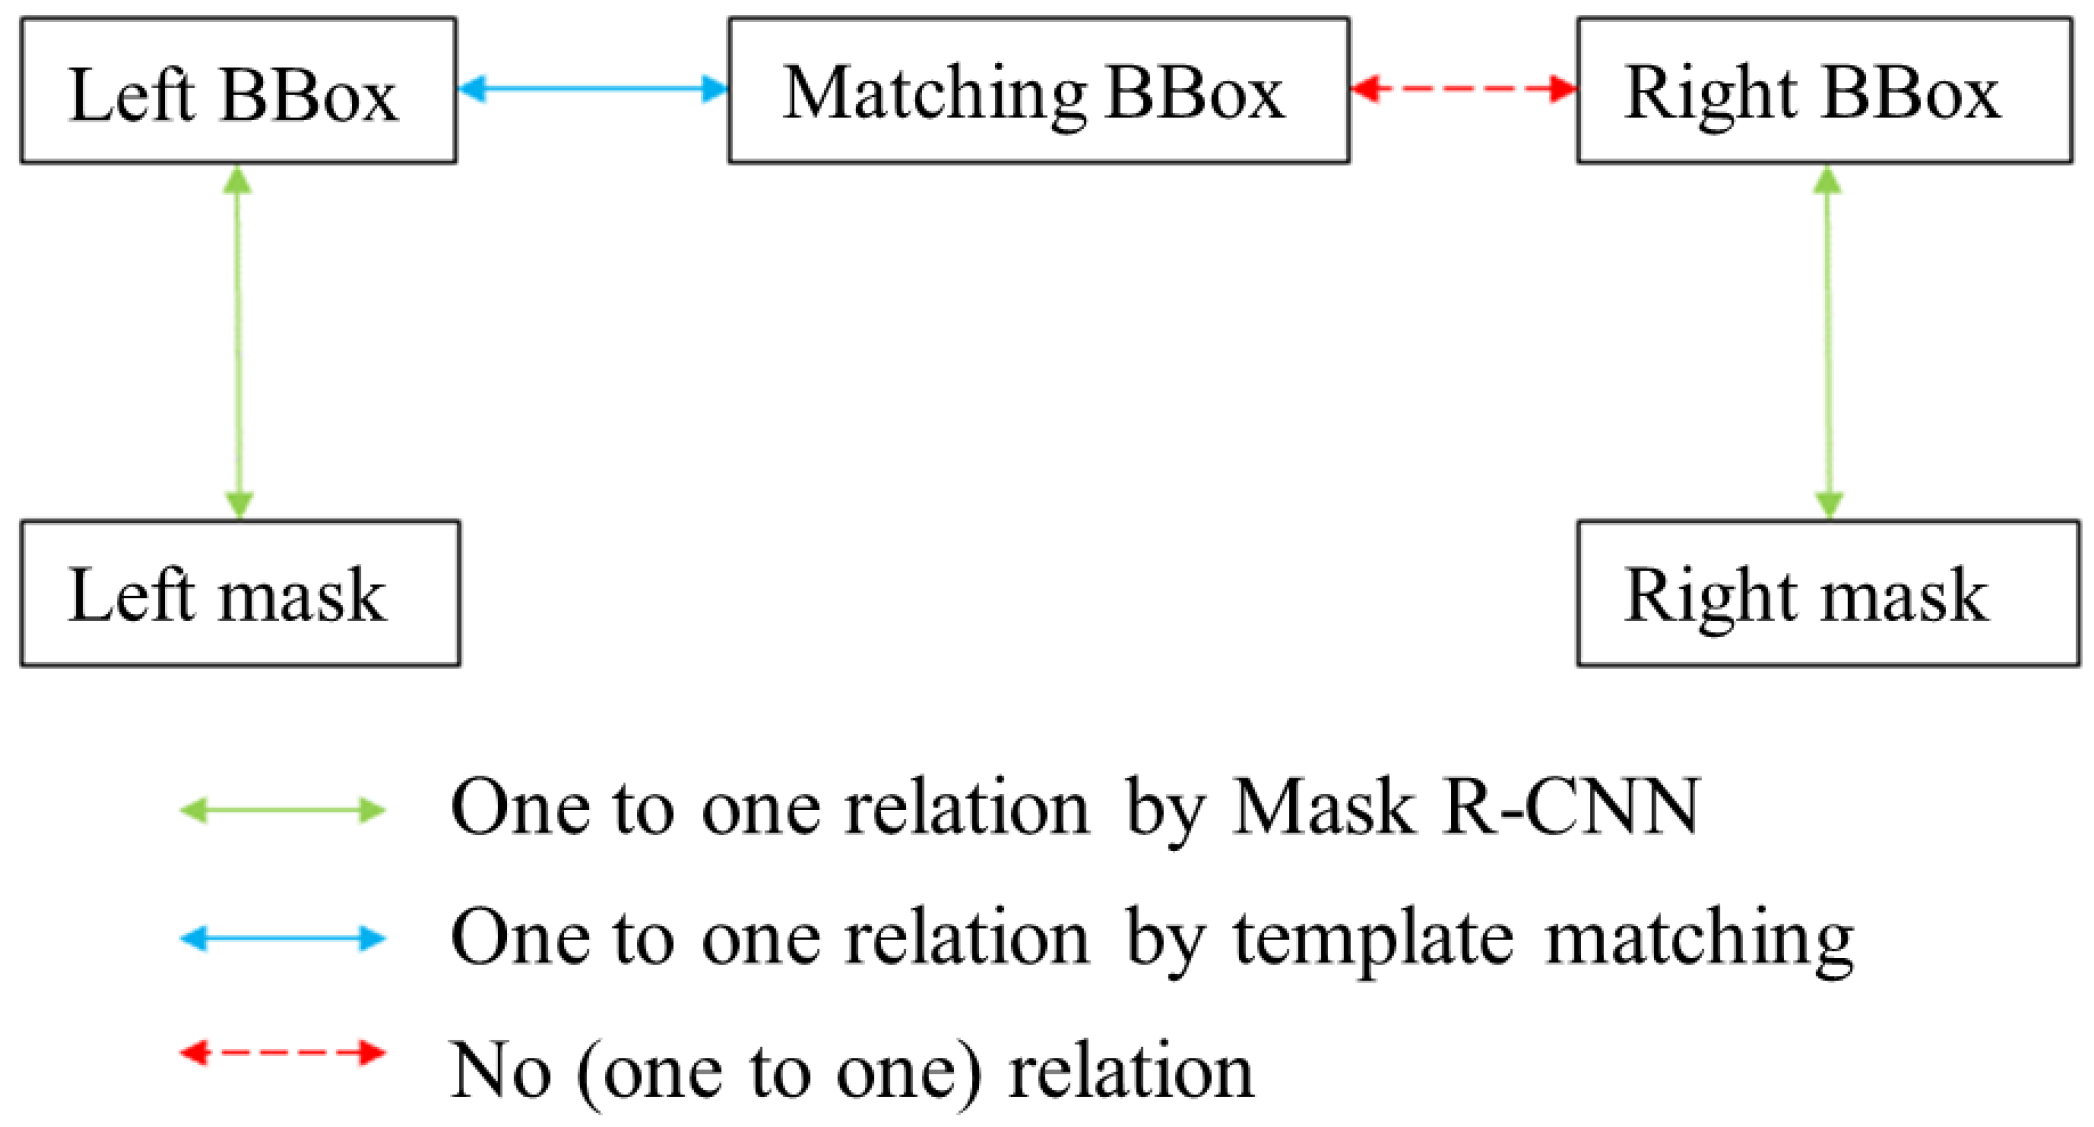
2.5. Apple Stereo Matching

Stereo matching of apple feature points in the left and right images was applied to fulfill binocular positioning. The role of stereo matching is to correspond coordinates of feature points on the left and right images one by one, so as to obtain the disparity and depth of feature points. There are many stereo matching methods, such as semi-global block matching, block matching, and methods based on scale-invariant feature transform (SIFT) and sped-up robust features (SURF) [34,35]. This research uses a template matching method to achieve stereo matching of only apples.
Template matching is sliding the template pixel by pixel on the target image to search for the most similar region to the template in the target image. It calculates the matching cost of the template image at each position while sliding, forming a matrix storing matching costs. The position of the extreme value in the matching cost matrix was where the matched apple was located. OpenCV uses six template matching methods (for calculating matching cost), namely squared difference matching, correlation matching, correlation coefficient matching, and normalized squared difference matching, normalized correlation matching, and normalized correlation coefficient matching. After experimental verification, the normalized squared difference matching has the best matching performance in this study.
The matching cost of the normalized square difference matching method was the square of the difference between the pixel value of the template image and the corresponding pixel value of the target image, which was defined in Equation (4).
C x , y = T x , y I x + x , y + y 2
where C(x′, y′) represents the matching cost of the square difference matching method; T(x′, y′) represents the pixel value of the template; and I(x′, y′) represents the pixel value of the target image.
The normalized square difference matching method is based on the square difference matching method, while normalizing C(x′, y′) is used as the matching cost of normalized square difference matching, which was defined in Equation (5).
C x , y = C x , y T x , y 2 × I x + x , y + y 2
where C′(x′, y′) represents the matching cost calculated by the normalized square difference matching method.
For the normalized square difference matching method, the best match is obtained at the position where C′(x′, y′) is minimal (range of C′(x′, y′) is between 0 and 1). The best matching will be obtained at the position with a C′(x′, y′) close to 0. On the contrary, if it is too close to 1, the matching result is not good, and no matching object can be found. If the template cannot find a matching object, it means that the apple in the template is obscured in another image or does not exist in another image. This type of apple cannot find the corresponding apple image in the other view, so it cannot be positioned and should be removed directly.
Further, the parallel epipolar line constraint was applied to the limited range of template matching. Generally speaking, the abscissa of the point in the left image should be larger than the abscissa of the corresponding point in the right image. Assuming that the coordinate range of the matching template in the original image is ([X1, X2], [Y1, Y2]), the template matching with the parallel epipolar line constraint is performed within the range of ([0, X2], [Y1, Y2]) rather than the whole image, which greatly reduces matching range. The probability of mismatching apples is greatly reduced to a certain extent since the meaningless part of the matching range is excluded. An example of the matching range limitation based on the parallel epipolar line is shown in Figure 7.
The output of the Mask R-CNN includes the BBox and the mask of every apple. The BBox and mask have a corresponding relation since they are generated by the Mask R-CNN. The BBox for each apple is represented by the coordinates of the upper left (Xmin, Ymin) and bottom right (Xmax, Ymax). The visualization of values in the BBox is shown in Figure 8.
After performing template matching with the parallel polar line constraint, the BBox of the left image did not correspond to the BBox in the right image. Masks and BBoxes have a relationship shown in Figure 9.
Since the template matching result and the Mask R-CNN output result for the right image cannot be exactly the same in the form of pixel coordinates, the relations between the matching BBox and the right BBox are not clear. Additionally, there are no relations between network output for the left image and right image, because the left BBox and left mask can only correspond to the result of template matching (matching BBox). Therefore, it is essential to use the matching BBox and right BBox to match again to associate the matching BBox and right BBox, to further determine the relations between the left BBox, left mask, and right BBox, right mask. Additionally, in this process, the following three types of apple data (their BBox and mask) will be removed:
(1)
Apples in the left BBox but not the matching BBox. Such apples are detected in the left image but cannot be matched in the right image. This kind of apple exists in the left image but does not exist in the right image because of leaf occlusion, apple occlusion, branch/wire occlusion, or an out-of-camera view.
(2)
Apples in the right Bbox but not the matching BBox. Such apples are detected in the right image but cannot be matched in the right image. This kind of apple exists in the right image but does not exist in the left image because of leaf occlusion, apple occlusion, branch/wire occlusion, or an out-of-camera view.
(3)
Apples in the matching Bbox but not the right BBox. Such apples are matched in the right image but there is no corresponding right BBox in the right image. This kind of apple exists in both the left and right images but is not detected in the right image.
The specific matching method of matching the BBox and right BBox was to traverse the matching BBox and right BBox and calculate IoU between these BBoxes for every matching BBox. Then, the right Bbox, which has the largest IoU, will be determined as the corresponding BBox of the matching BBox. After this, relations between the left mask, left Bbox, and right BBox, right mask, are confirmed.

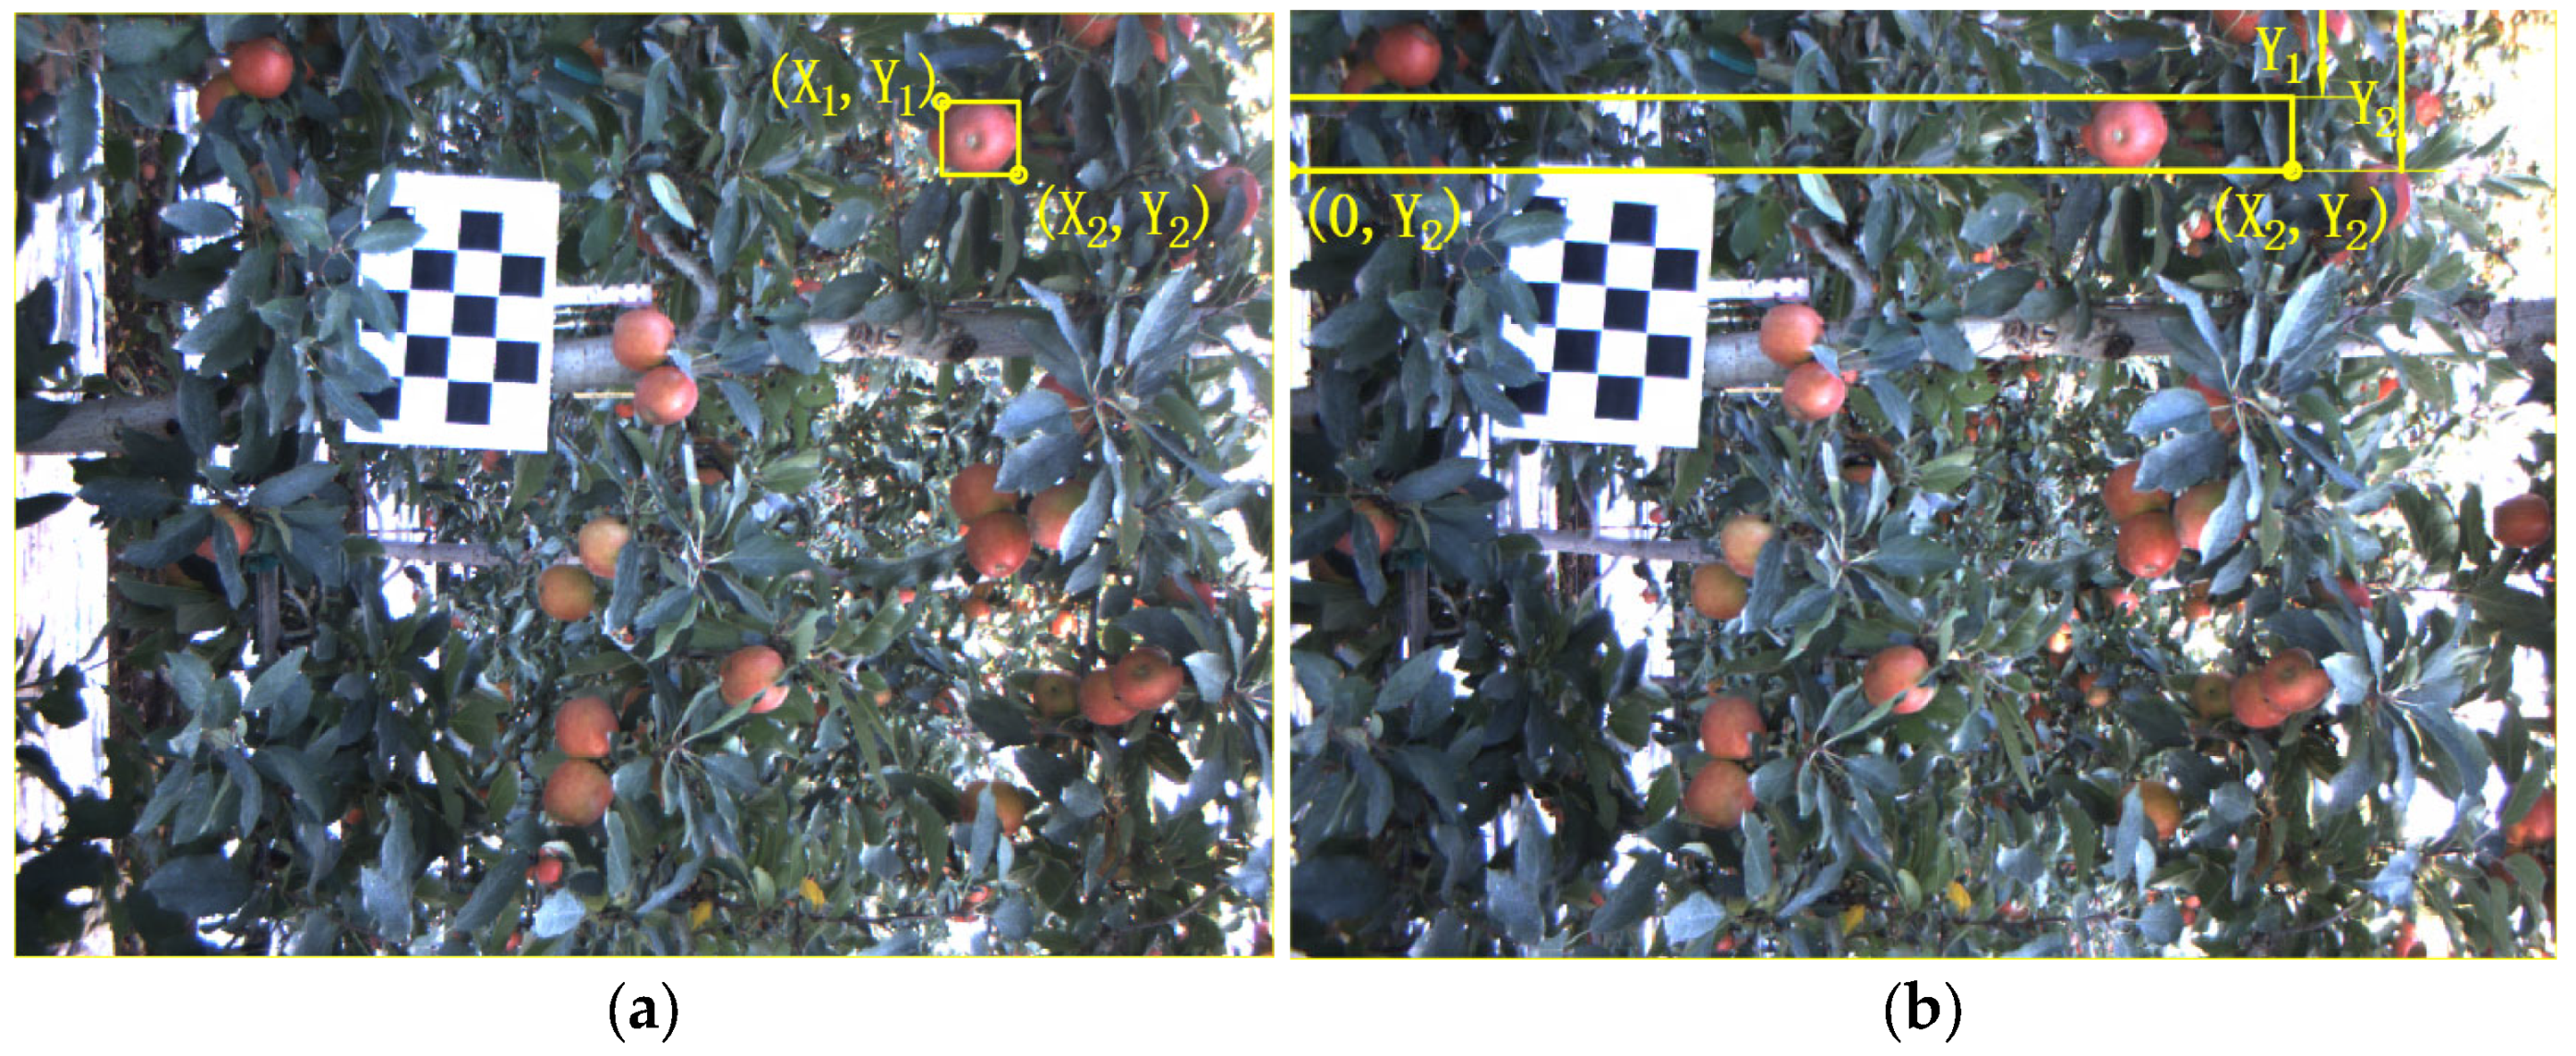
2.6. Apple Positioning

After completing the stereo matching of the apple, four representative feature points within the BBox of the apple were selected for positioning, so as to obtain three-dimensional coordinates of the apple. The point selection method of four feature points is shown in Figure 10. In Figure 10, the first traversal was performed in the direction of the red arrow to find two feature points with the smallest and the largest pixel ordinate within the BBox. After that, the second traversal was performed in the direction of the yellow arrow to find another two feature points with the smallest and the largest pixel abscissa within the BBox. In the other view, according to the result of stereo matching, four feature points that meet the conditions are taken at the same height and same traverse direction of the corresponding point in the left image. In order to reduce the influence of positioning error on the final positioning result of the apple, the average of the four feature points is taken as the final positioning result of the apple. The whole positioning procedure is described in Algorithm 1.
Algorithm 1: Binocular positioning with the Mask R-CNN
INPUT: leftimg, rightimg
OUTPUT: coordinates
START:
1:leftapples, rightapples = segmentByMaskRCNN(leftimg, rightimg)
2: FOR each leftapple in leftapples DO
3:matching_box searches the most similar region in the right image that has the same height and smaller abscissa as leftapple by using matchTemplate();
4:rightapple searches apple in the rightapples with maximal IoU between it and the matching_box;
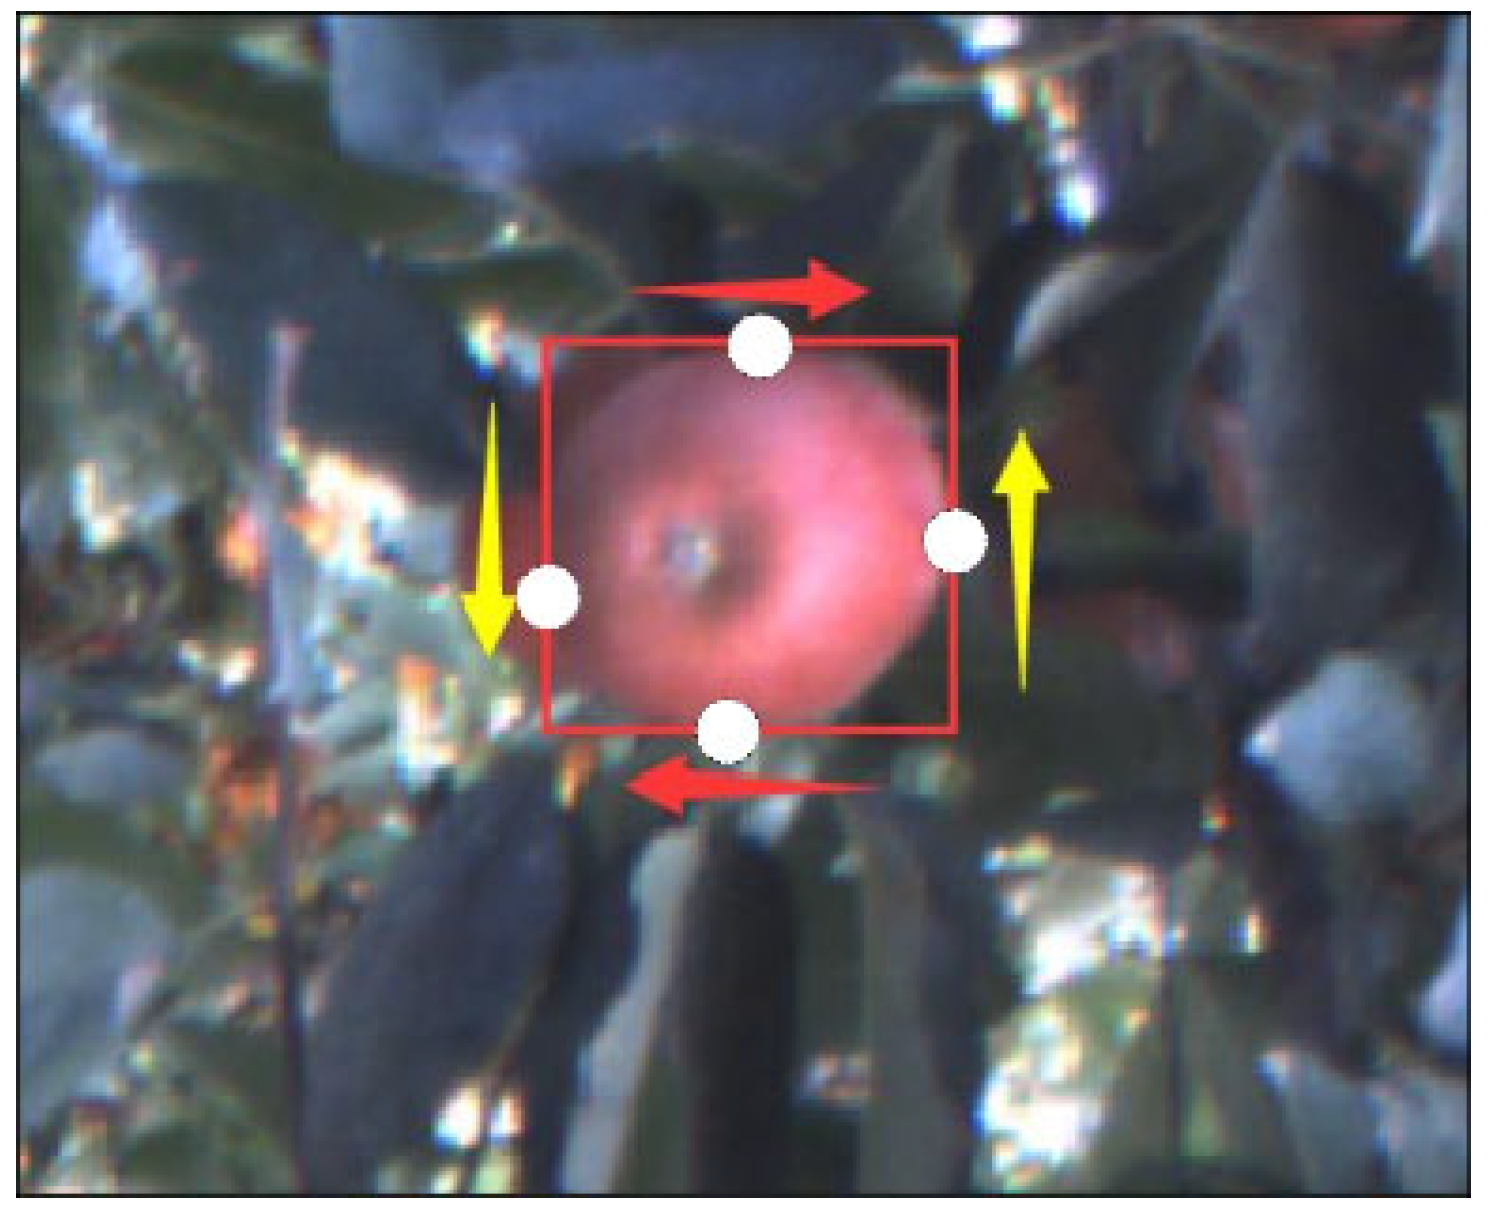
5:disparitys are consist of four pairs of feature points on the apple mask, four feature points are defined as the points with xmax, xmin, ymax, ymin on the apple mask from two view;
6:FOR each disp in disparitys DO
7:  coordinates.append(calculateCoordinate(focal, baseline, disp))
8: return coordinates
9:END

2.7. Evaluation Criteria of the Mask R-CNN

In this study, IoU and AP (average precision) were used to evaluate the detection and segmentation performance of the Mask R-CNN, which were defined in Equations (6) and (7), respectively.
I o U = I U = O u t p u t G T O u t p u t G T
where Output is the output of the Mask R-CNN, namely, the mask or BBox generated by the Mask R-CNN. GT is the ground truth of the apple dataset, which is a manually annotated polygon and rectangle label of the apple. AP is the average precision of object detection or segmentation. P (precision) and R (recall) are defined in Equations (8) and (9), respectively.
P = T P T P + F P
R = T P T P + F N
where TP, FP, and FN are three types of detected or segmented objects generated by comparing the output of the Mask R-CNN and ground truth data: true positive, false positive, and false negative. The IoU threshold is 0.5 during the calculation of AP, P, and R.

2.8. Evaluation Criteria of Apple Binocular Positioning

In this study, CoV and PA were used to evaluate positioning performance. CoV and PA were defined in Equations (10) and (11), respectively.
C o V = S P Z ¯
P A = 1 max P z max P z ¯ , P z min P z ¯ P z ¯
where S is the standard deviation of the four feature points of each apple and P Z ¯ is the average depth value of the four feature points of each apple. P z max and P z min are the maximum and minimum depth values of the four feature points of each apple, respectively. The max() indicates the maximum between values (separated by ‘,’) inside the brackets.

3. Result and Discussion

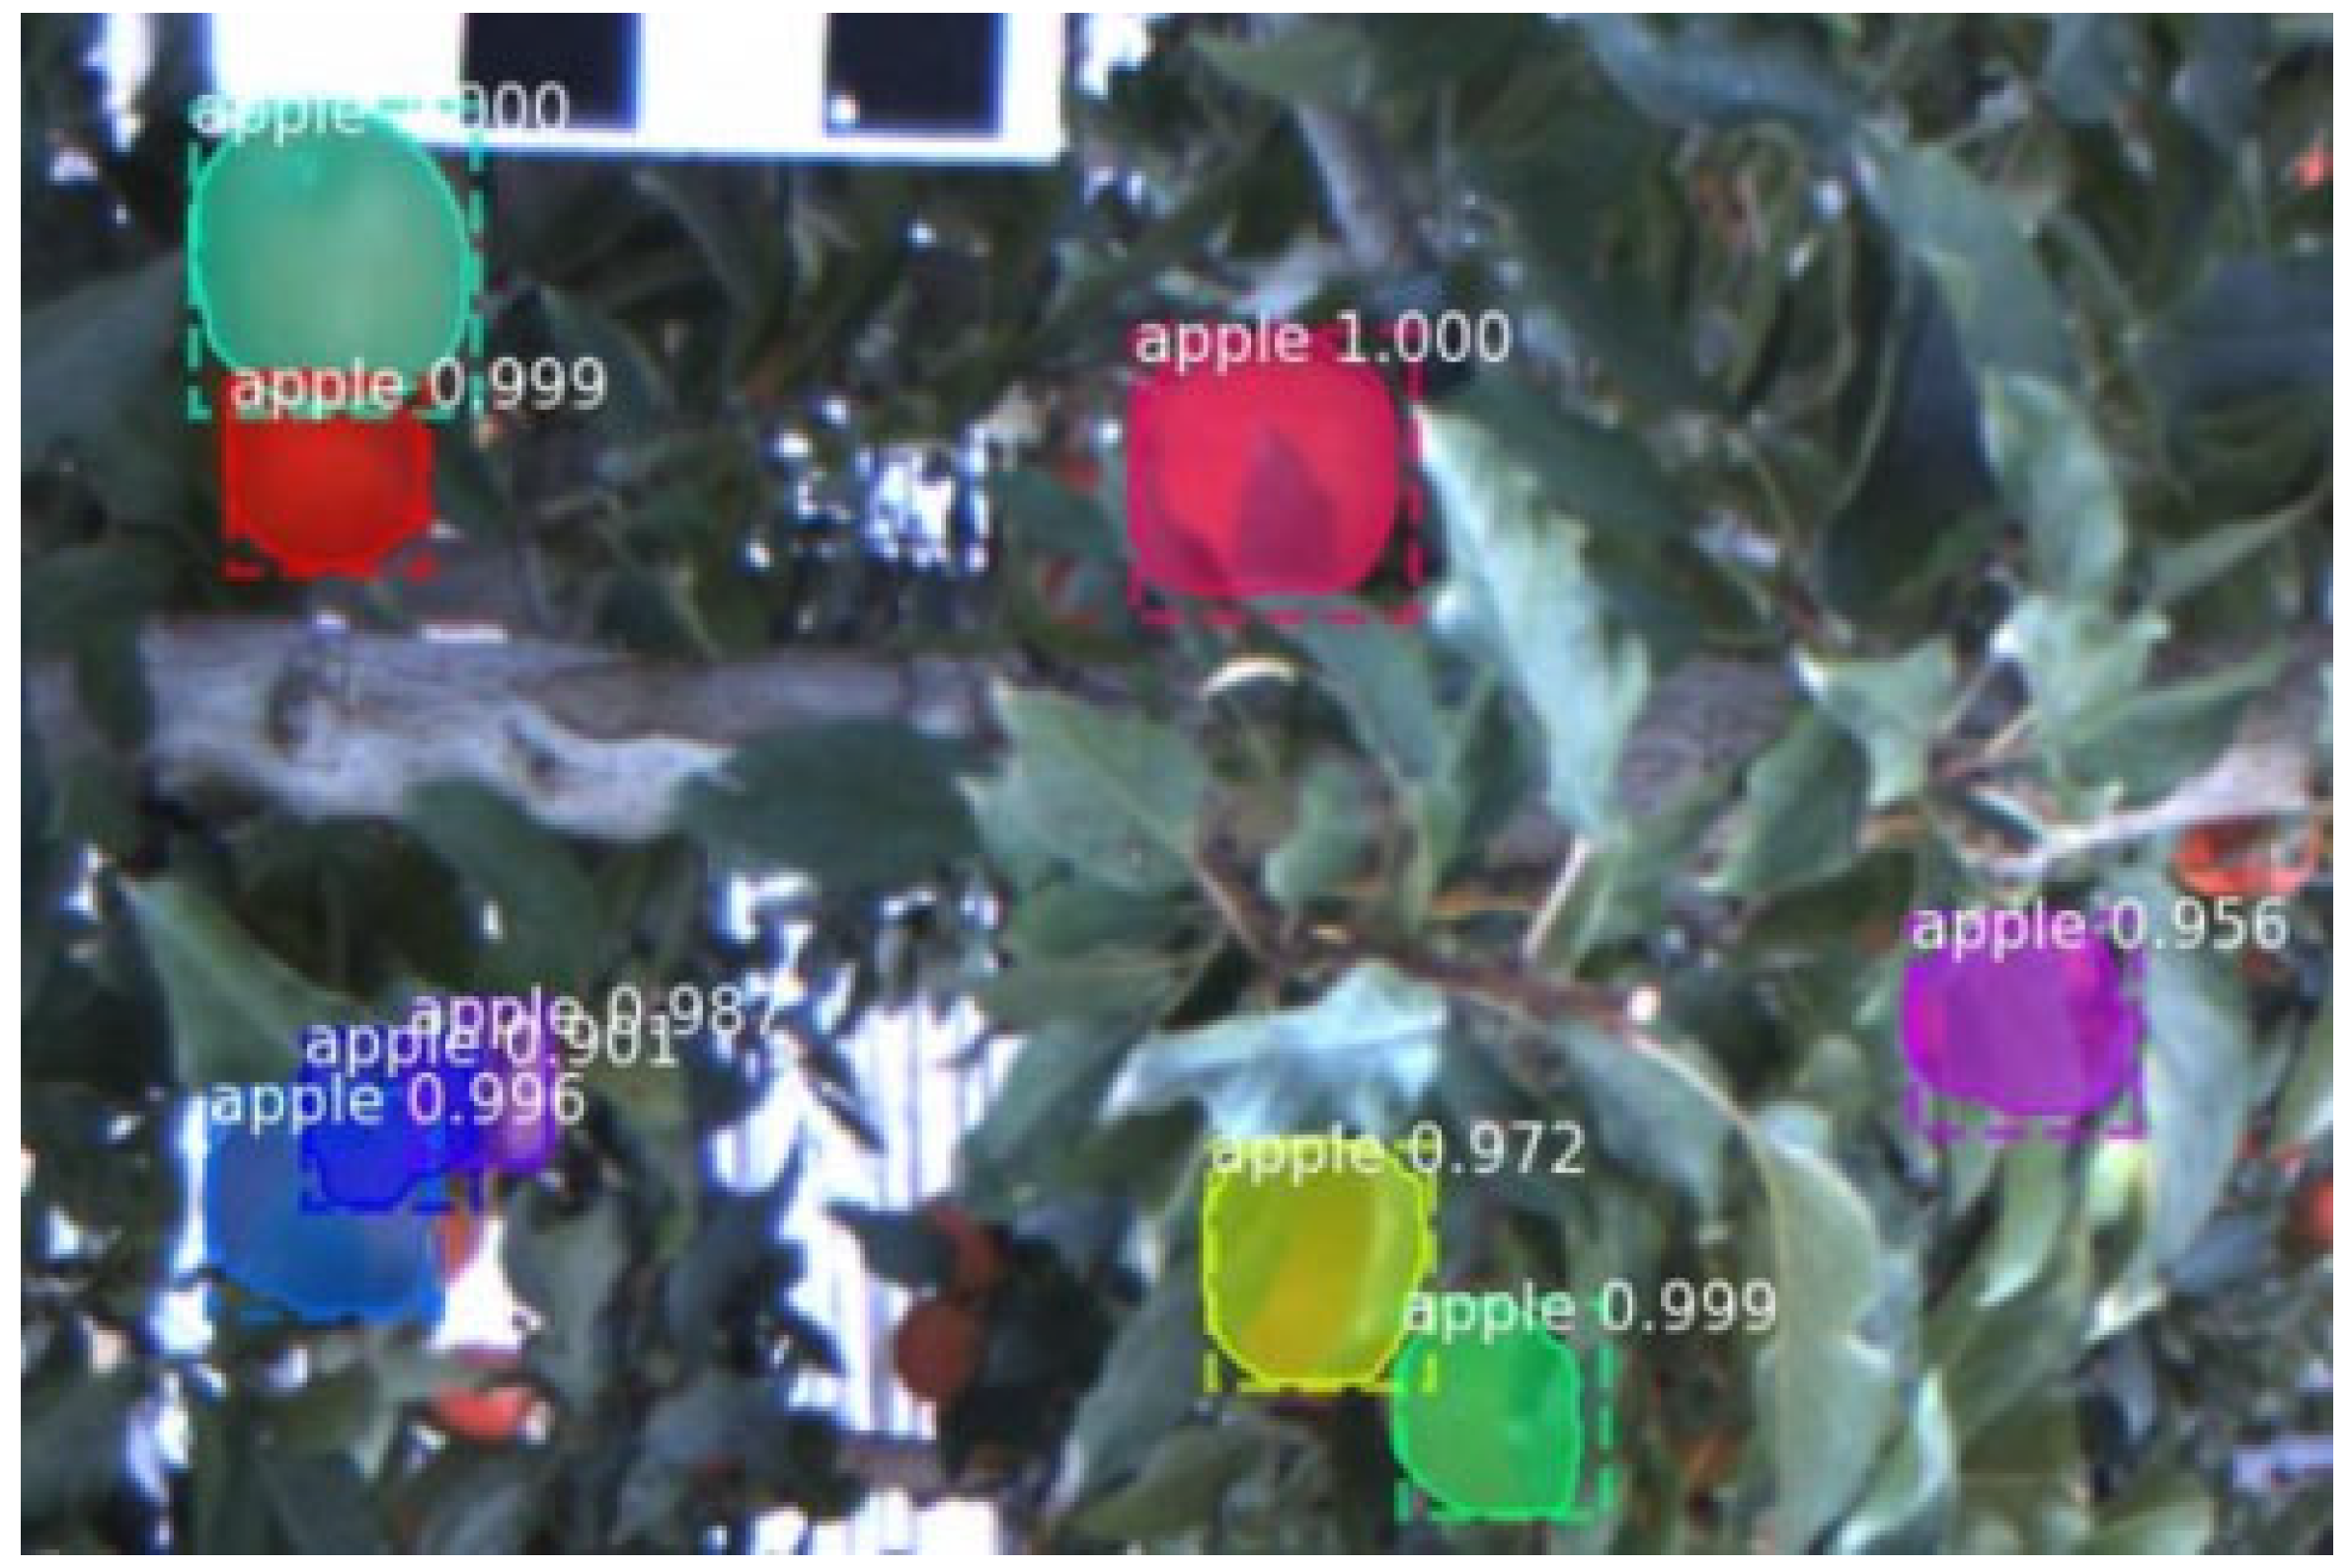
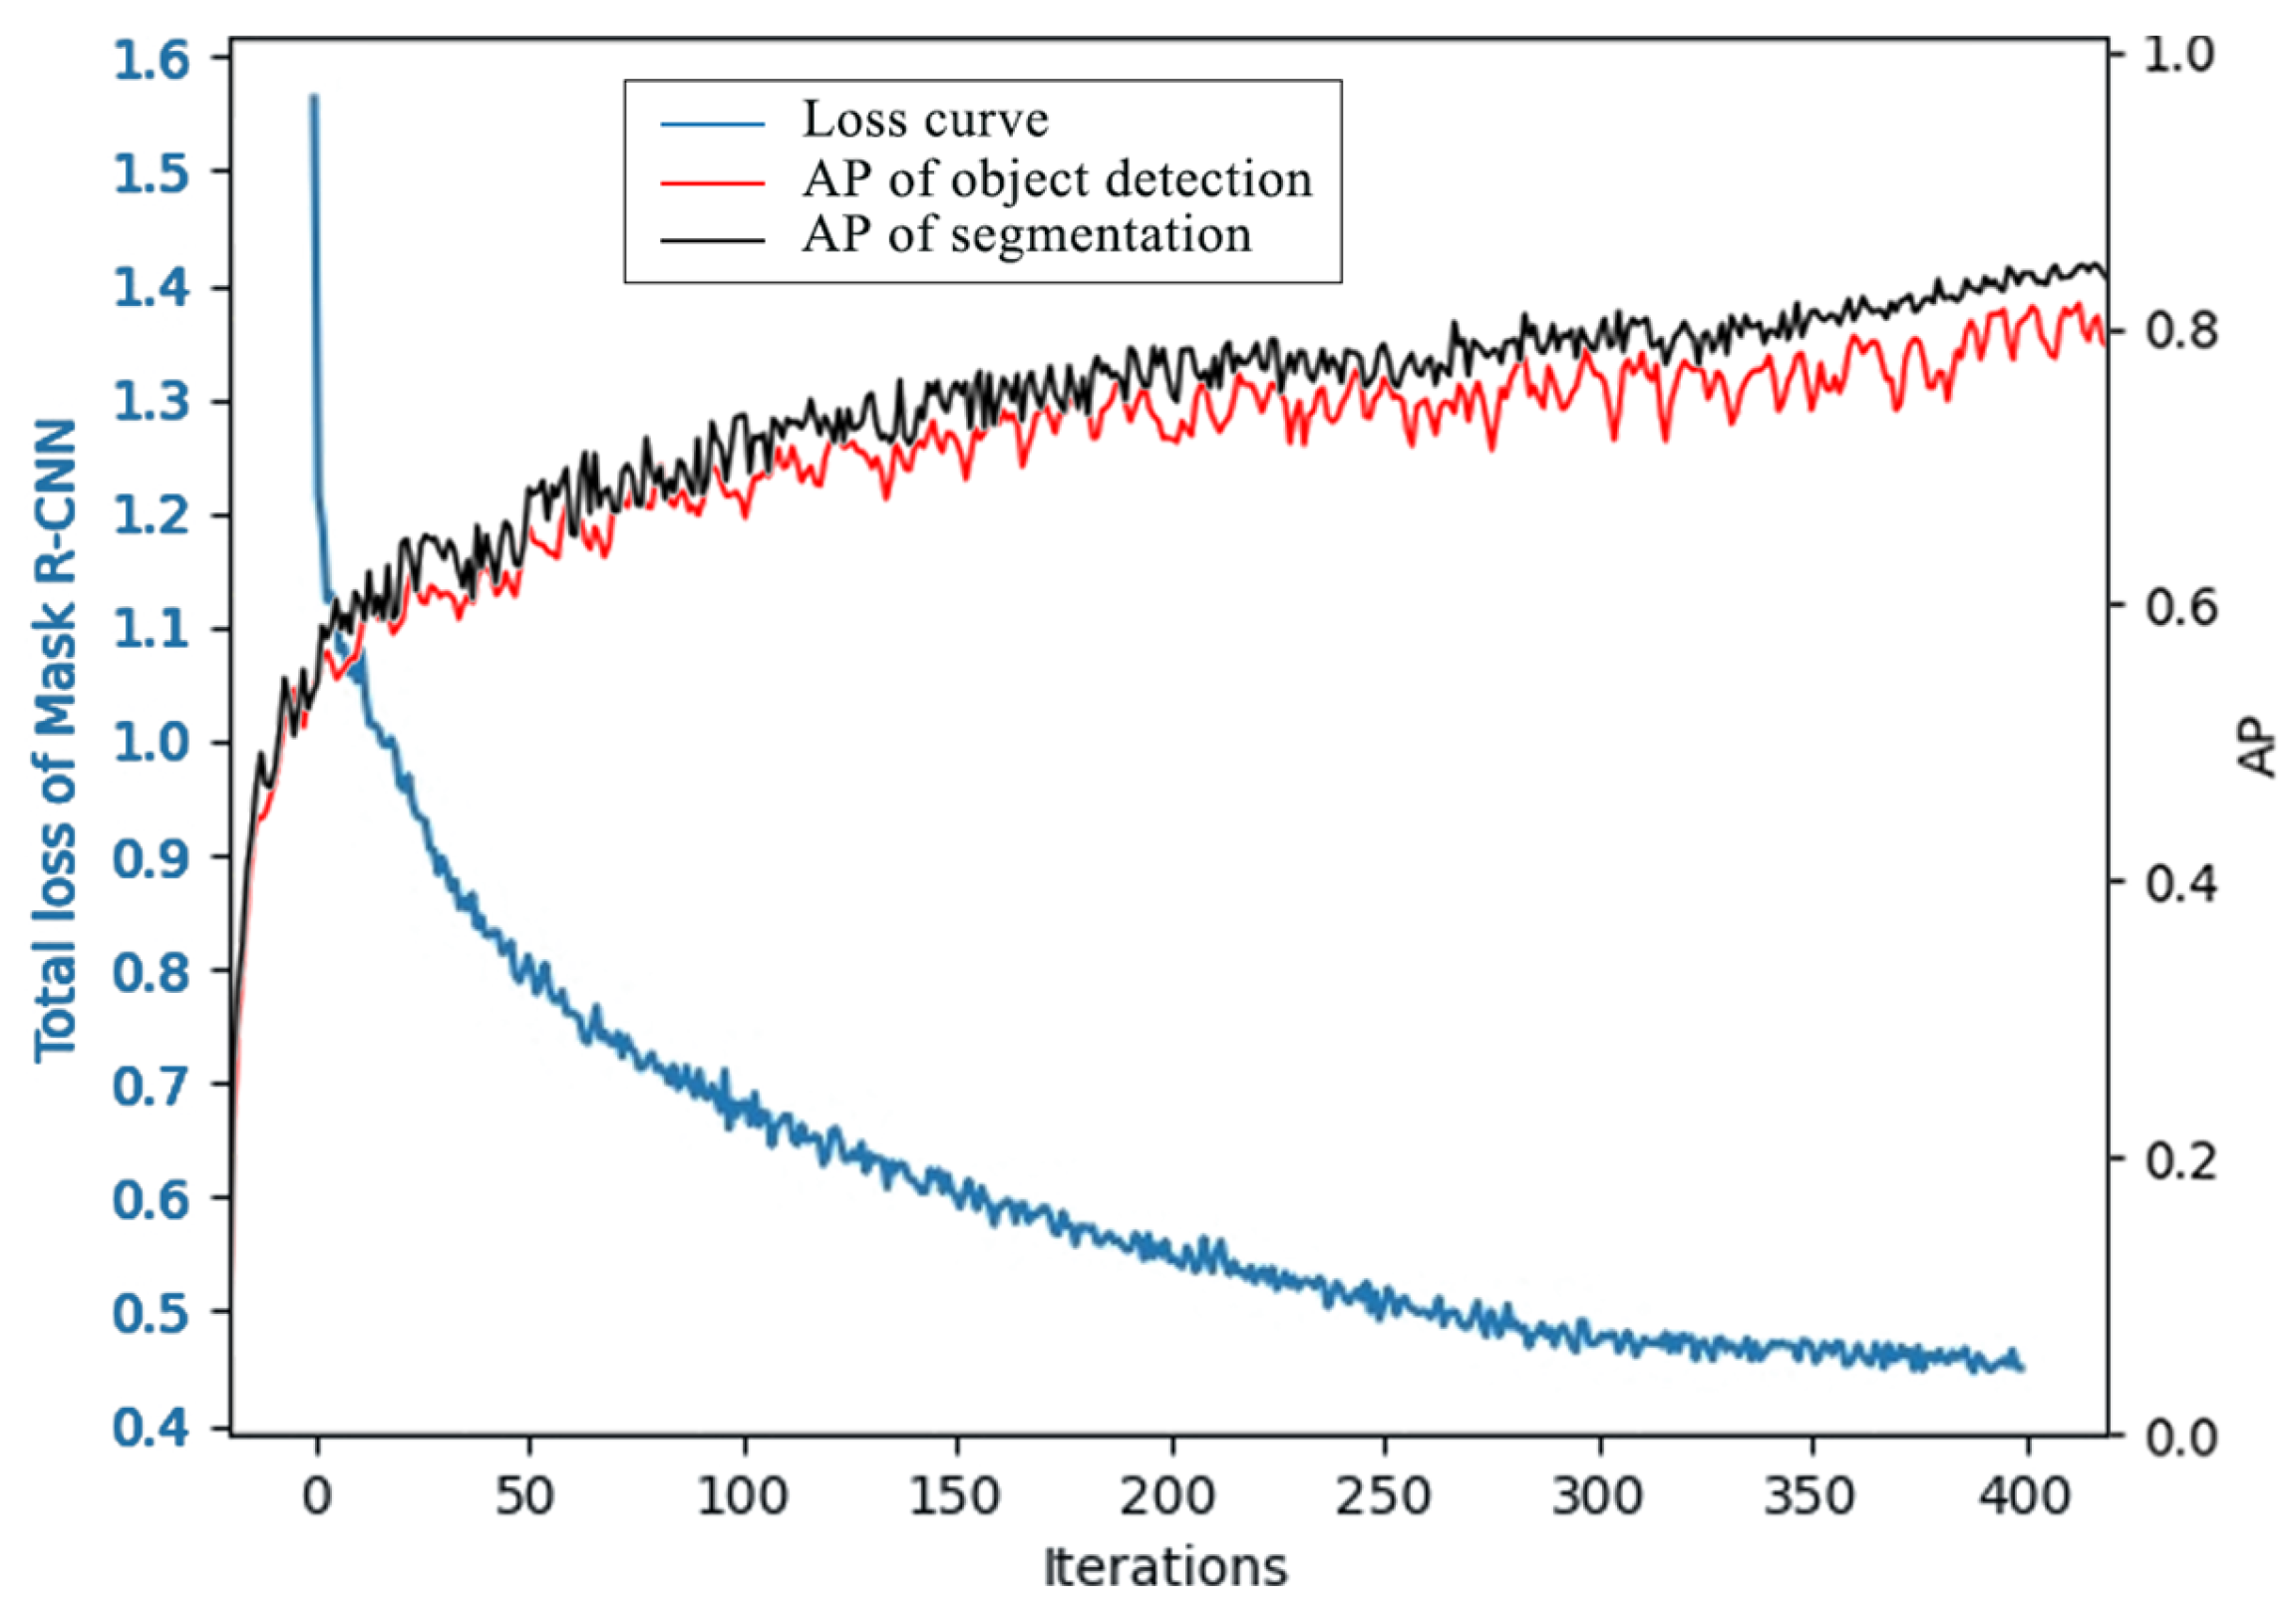
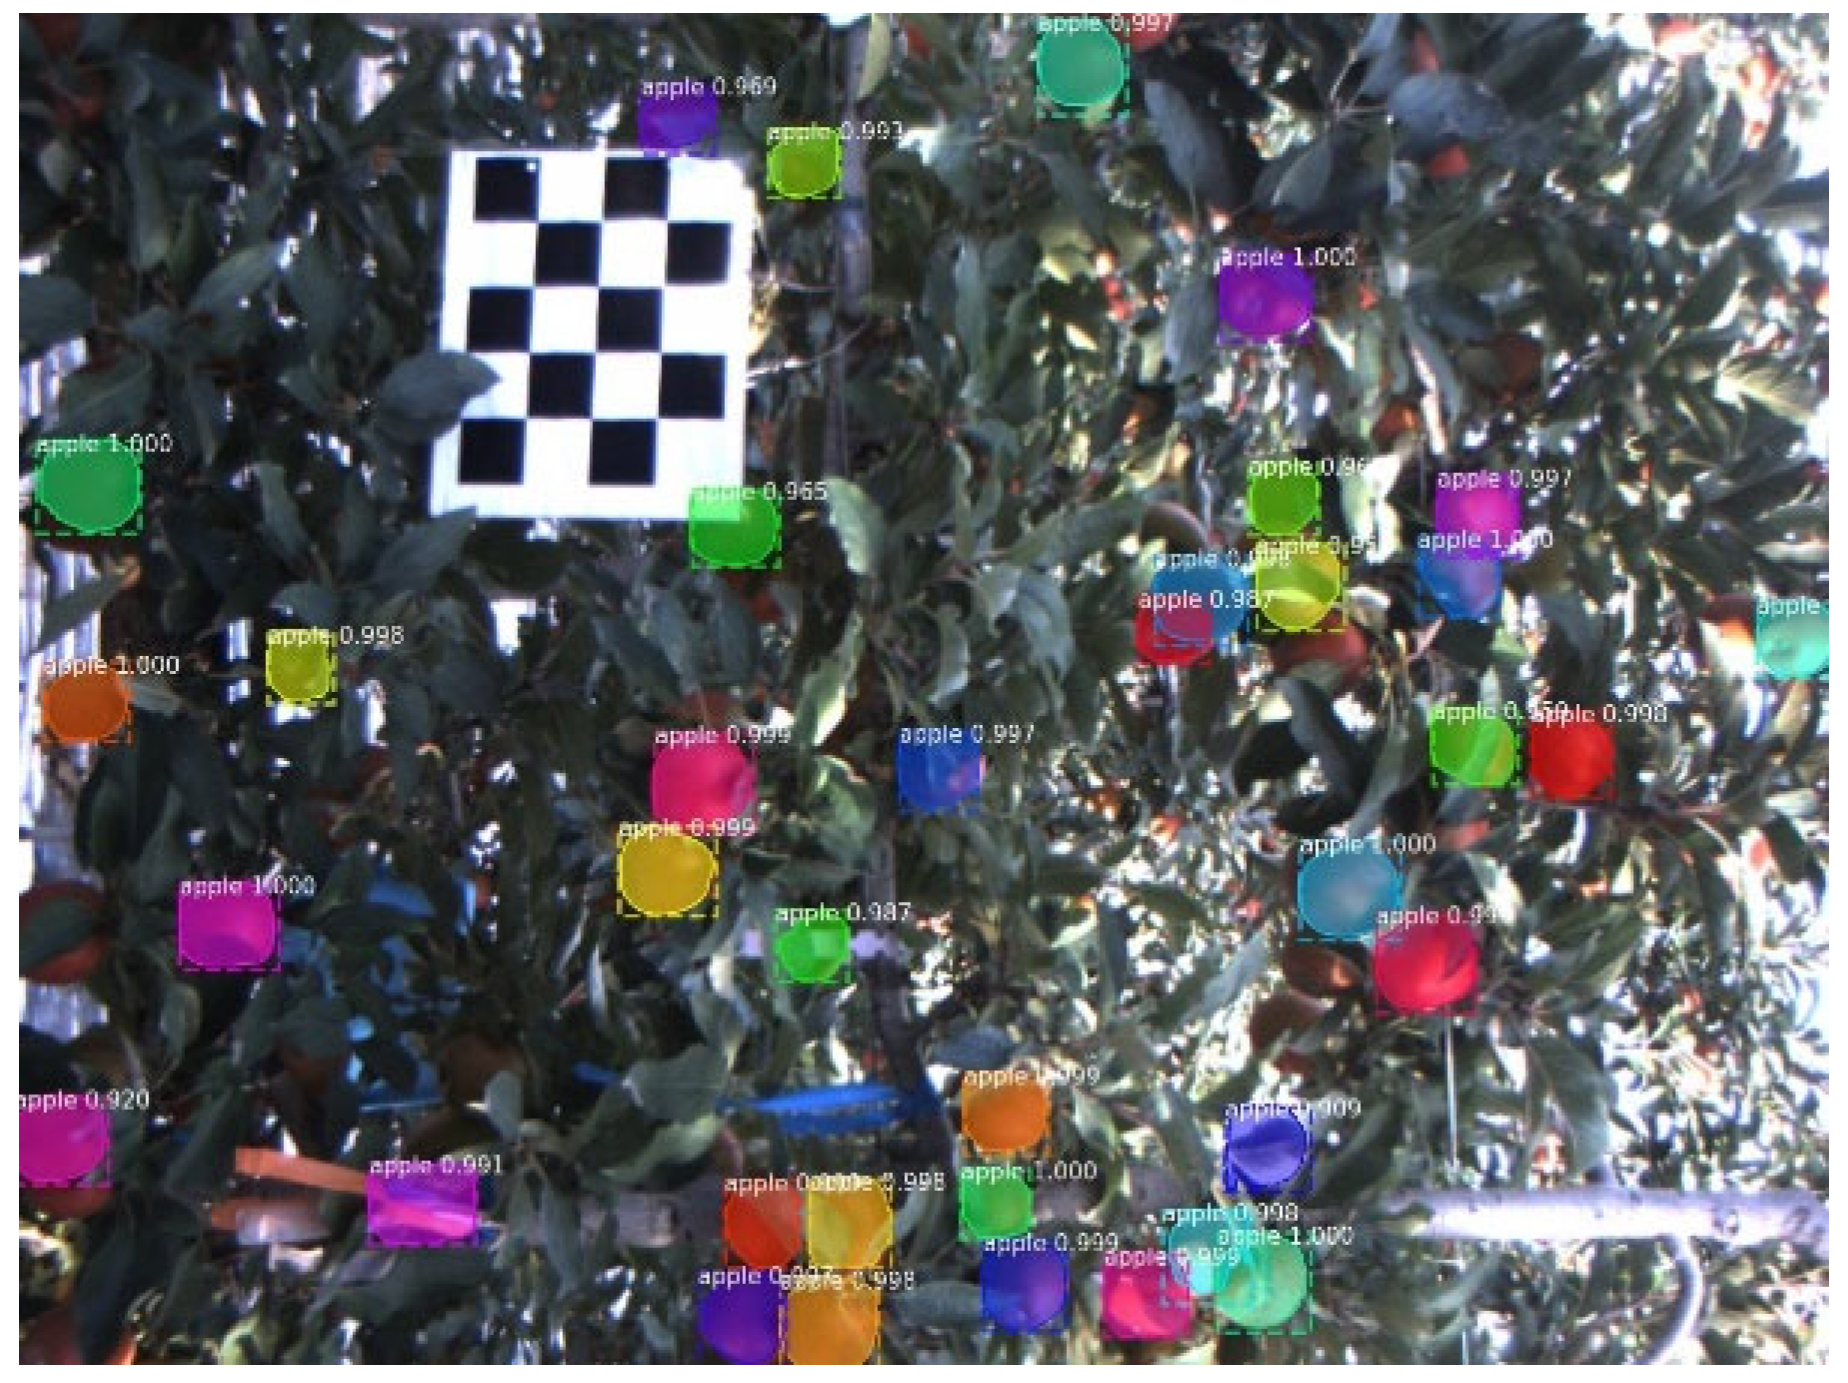
3.1. Training Assessment and Performance of the Mask R-CNN

Start training for 400 iterations (each iteration includes 100 steps) with an initial learning rate of 0.001, a momentum factor of 0.9, and a decay factor of 0.0001 until convergence. The training loss curve (by every iteration) is shown in Figure 11. The loss value decreases as the number of iterations increases. When the number of iterations reaches 400, the loss value is basically stable and gradually approaches a minimum value of about 0.5.
The model basically converges according to the loss function of the Mask R-CNN. APs for object detection and segmentation of the Mask R-CNN are 82.61% and 79.22%, respectively. Randomly select a group of binocular images of apples in the validation dataset for testing. The model test results are shown in Figure 12.
Additionally, the Mask R-CNN was evaluated on the test set and reached IoUs of 80.11% and 84.39% of segmentation IoU and detection IoU in this study, respectively.

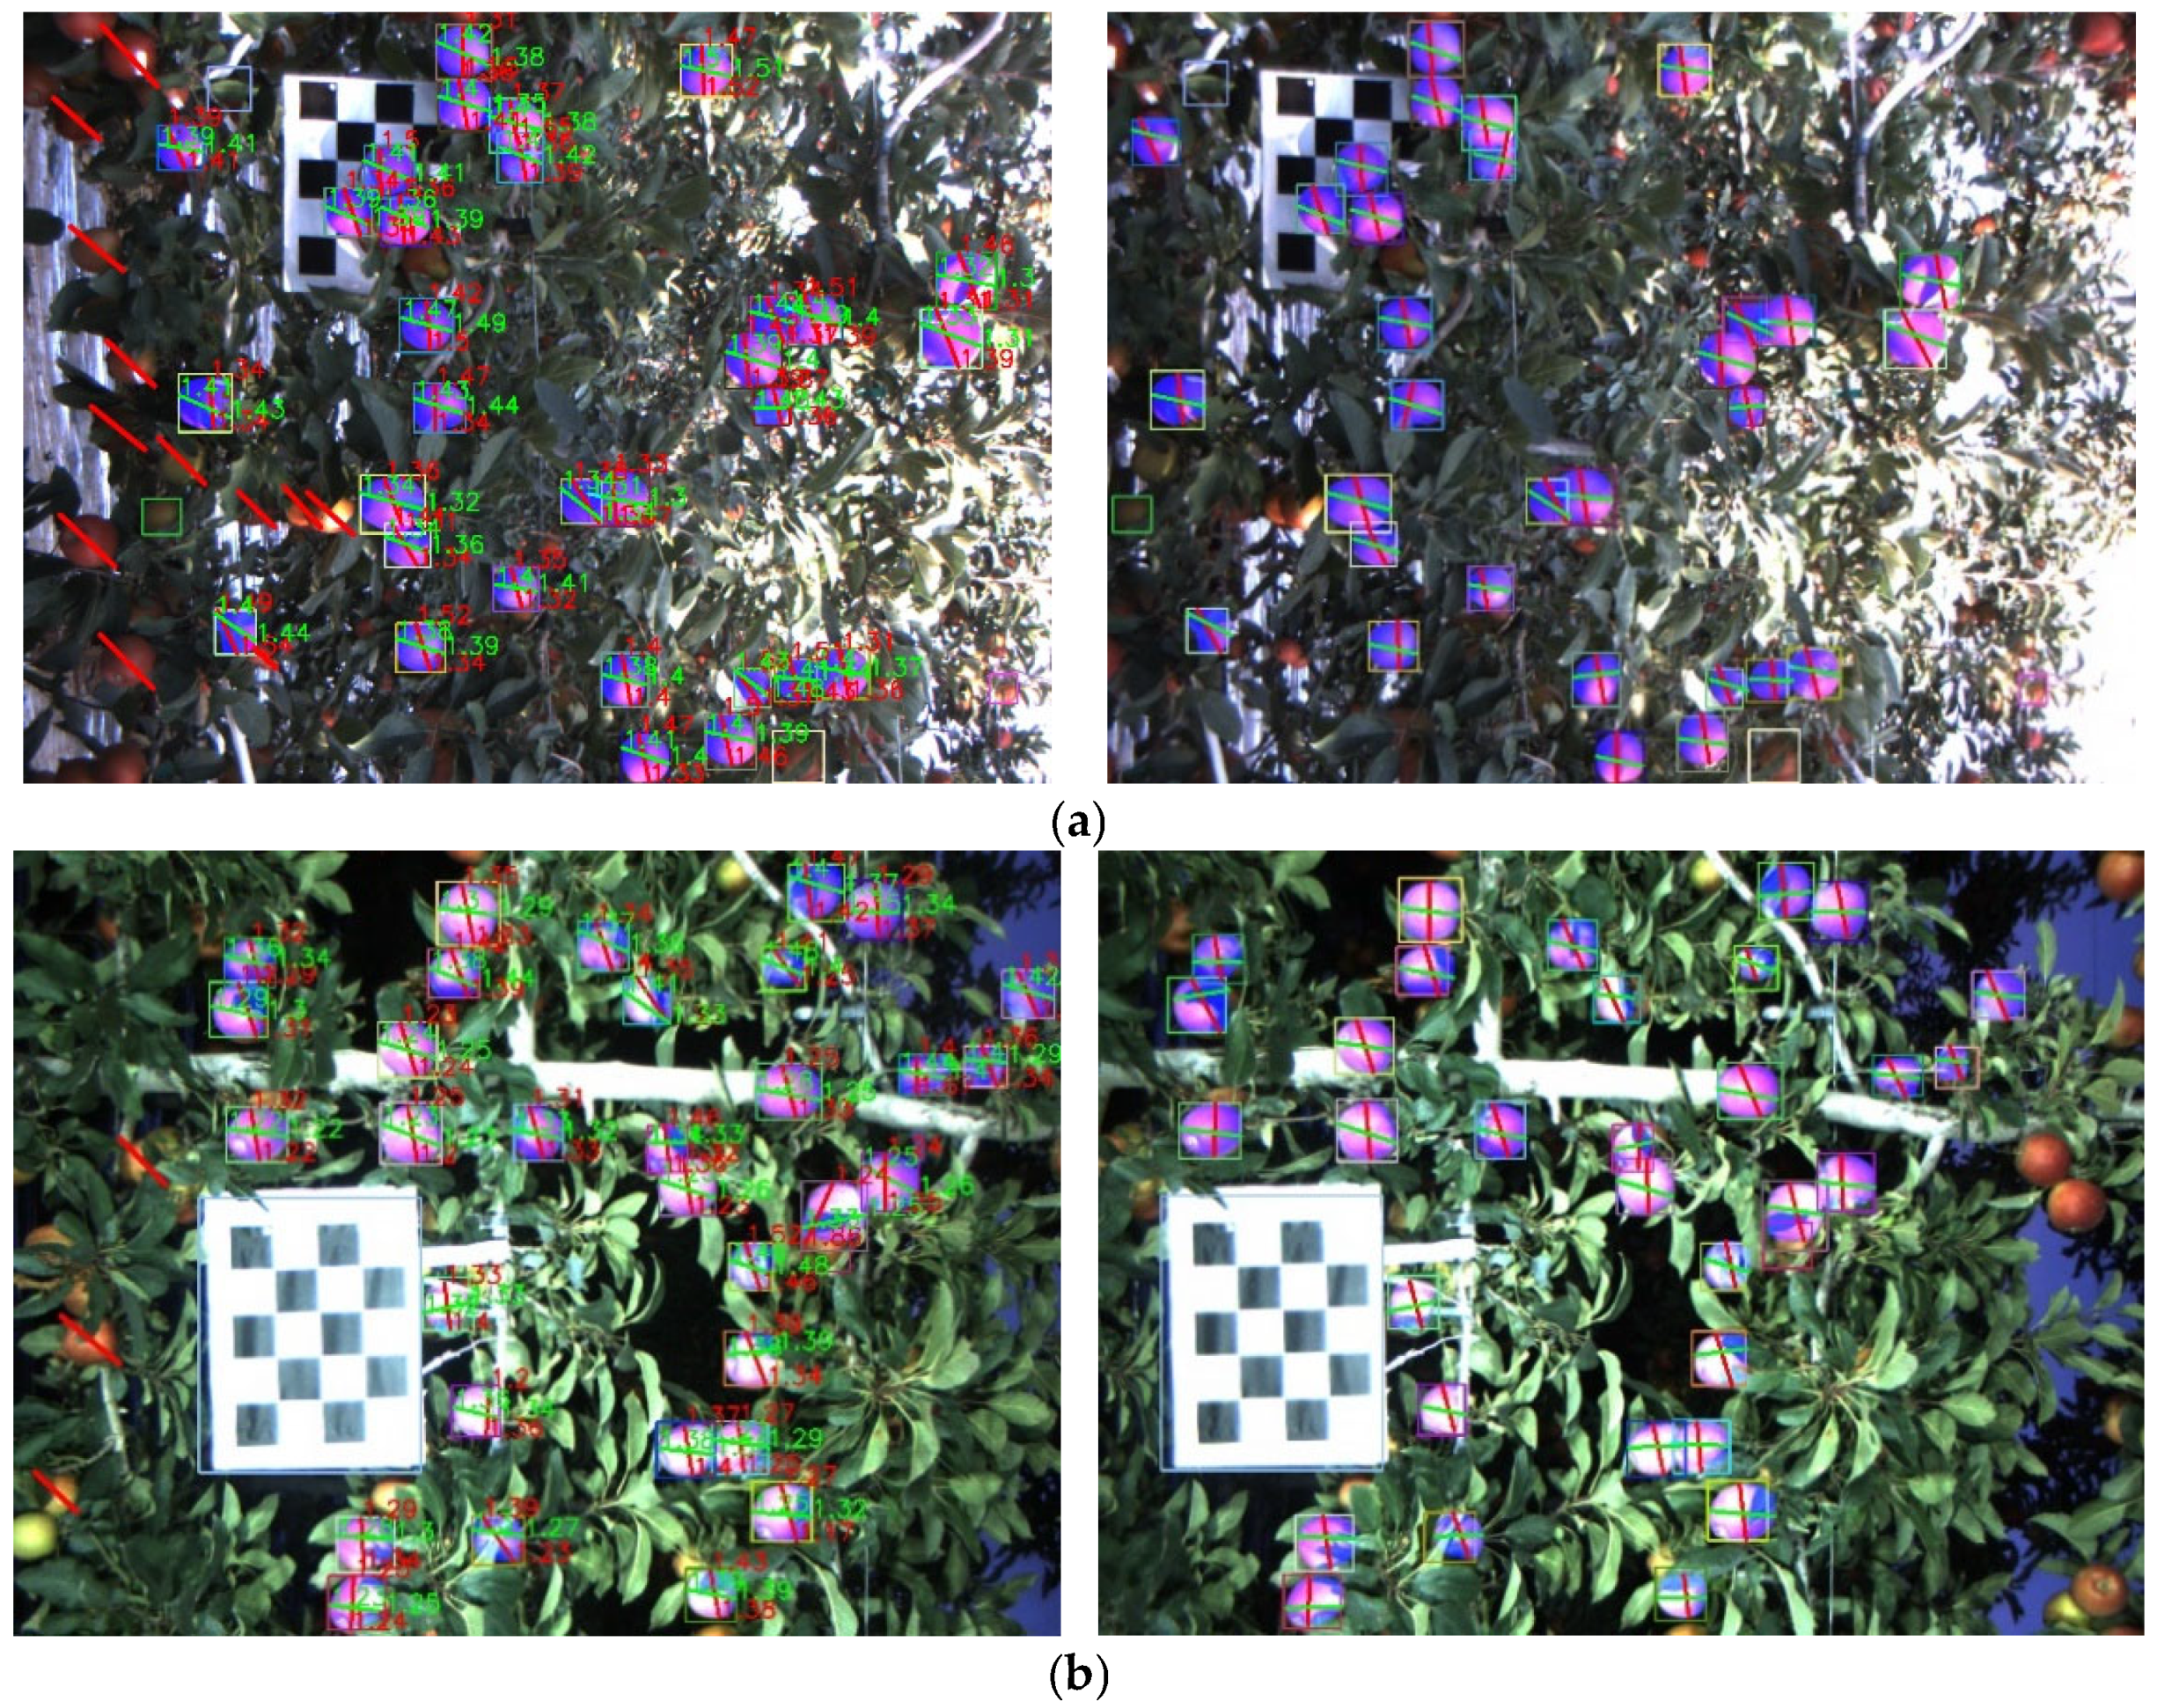
3.2. Performance Evaluation of Binocular Positioning

The final visualization effect of using the Mask R-CNN to detect and segment the binocular image for positioning in daytime and night is shown in Figure 13 (only depth was visualized). The red line connects the top and bottom feature points of the BBox, while the green line connects the left and right feature points of the BBox. The apples marked with a lean red straight line on the left image in Figure 13 indicate that these apples have no matching apples in the right image. In addition, there are a small number of unmarked apples in the right image that are ignored in binocular positioning, because they disappear in the left image. It is worth noting that for the fruits that overlap or are blocked by branches or leaves, they can still be detected and segmented. Under the conditions of natural light in the evening and night artificial light, the positioning effect of apples is shown in Figure 13b. Most apples have little difference in the depth values of the four points. It can be concluded that the positioning depth of different feature points of the same apple is within the error acceptance range.
For the same apple, the distance difference between the four feature points on the edge of the apple should not be too large for its shape. Therefore, the CoV of the four feature points of each apple is applied to initially evaluate positioning results. In order to eliminate the difference caused by the inconsistency of units, CoV is introduced to better reflect the degree of dispersion of feature points’ depth values. A bigger CoV and smaller PA indicate that the positioning results of multiple feature points of the same apple are quite different, and the positioning effect is not good. On the contrary, a smaller CoV and bigger PA indicate that positioning results of multiple feature points of the same apple have small differences, and the positioning effect is good.
This paper counted the CoV and PA of 60 images of data in the dataset, as shown in Figure 14. All datasets used to calculate CoV and PA do not include training datasets. The average CoV and PA of the 60 datasets is 5.25 mm and 99.49%, respectively. These positioning results basically meet the needs of the positioning system of an apple-picking robot. The apple-picking robot determines the working point of the end effector according to the average of the three-dimensional coordinates of the four feature points.

3.3. Results from Other Studies

Deep learning technology can significantly improve PA for binocular positioning of apple fruits and realize accurate picking of apple fruits; it also has better performance. In general, different deep learning models might result in different performances, as shown in Table 2 [36]. According to Table 2, it can be seen that the Mask R-CNN (R101-FPN) reaches the highest IoU among several models. Although the Mask R-CNN (R101-FPN) has the slowest inference speed, the detection only accounts for a small part of the time cost of the whole fruit-picking procedure. Thus, it was applied to obtain the best positioning performance.
However, research that combines segmentation-based deep learning with binocular positioning of fruit remains lacking. Li et al. [37] proposed an apple binocular positioning method based on a Faster R-CNN, template matching, and traditional apple segmentation method, which reached a standard deviation of 0.51 cm and positioning precision of 99.64%. However, the traditional segmentation method is not robust enough to segment apples in various types of weather and illuminations, and a full contour of apples is hard to segment. Additionally, occulted apples are ignored, resulting in the incomplete positioning of apples in the binocular images. Xiong et al. [38] proposed a binocular positioning method for litchi clusters, which reached a depth error between 0.4 cm and 5.8 cm. Additionally, as mentioned, Si et al. [13] achieved a binocular positioning method with a traditional image processing algorithm for apples with a distance estimation error of 20 mm in the range of 400–1500 mm. Hu et al. [39] designed an apple object detection and localization method based on improved YOLOX and RGB-D images, which achieved a depth error of less than 5 mm. These methods achieved satisfactory performance in binocular positioning, but they are still not robust enough for various occulted situations, illuminations, and distances. Compared with the above binocular positioning method, the apple binocular positioning method proposed in this paper made some improvements. With the support of a large number of datasets, it can be adapted to various lighting conditions, fruit sizes, and shapes to detect and segment apples, and then positioned according to binocular positioning. By using the Mask R-CNN, the contour of occulted apples can be well-segmented. The meaningless background was ignored by the straight process output of the Mask R-CNN instead of taking SIFT features or generating depth maps by using a semi-global block matching algorithm and other stereo matching algorithms. It can complete binocular positioning of apples in various complex environments. Details of these methods were demonstrated in Table 3.
However, it took a long time to use the Mask R-CNN network for positioning. When testing the speed of the Mask R-CNN, it takes 0.91 s to detect and segment a single image with an average desktop stage graphic card. On the premise of ensuring PA, work to improve positioning efficiency will be carried out in the future.
Additionally, apples in the natural environment have different occlusion situations, but all the networks in this article are only single-class networks. According to the occlusion situation, it can be divided into no occlusion, half occlusion, and so on. Picking an occulted apple will sometimes damage the apple-picking robot. Therefore, research with a multi-class network is needed to further recognize apples by occlusion situation to avoid potential damage by occulted apples.

4. Conclusions

In this study, the Mask R-CNN is used to detect and segment binocular images of apples. After that, a template matching method based on the constraint of parallel polar lines was adopted to initially match apples in the binocular images. After removing the three types of apples, the network detection result and template matching result were matched again to build relations between the BBox and masks in the binocular images. Finally, three-dimensional coordinates (x-coordinate, y-coordinate, and depth value) of four feature points of apples were calculated. The positioning effect was evaluated on 60 datasets, which achieved an average CoV of 5.25 mm and an average PA of 99.49% was obtained. The experimental results showed that the apple positioning method based on the Mask R-CNN and binocular vision can better reflect the actual positioning of apples in binocular images. Future research will be focused on recognizing apples by occlusion situations in binocular positioning and improving positioning speed. This research provides a reliable low-cost apple binocular positioning method for apple-picking robots.

Author Contributions

H.Z.: methodology, software, validation, data acquisition, investigation, writing—original draft, and writing—review and editing. C.T.: validation, conceptualization, data acquisition, methodology, and writing—review and editing. X.S.: software, validation, and data acquisition. L.F.: methodology, investigation, writing—review and editing, conceptualization, and supervision. All authors have read and agreed to the published version of the manuscript.

Funding

This work was supported by the Natural Science Foundation for Chongqing (No. cstc2020jscx-lygg0001) and the National Foreign Expert Project, Ministry of Science and Technology, China (QN2022172006L).

Data Availability Statement

Data will be made available upon request.

Conflicts of Interest

The authors declare no conflict of interest.

References

  1. UN Food & Agriculture Organization. Production of Apple (Fruit) by Countries. 2021. Available online: http://www.fao.org/faostat/en/#data/QCL (accessed on 10 April 2021).
  2. Silwal, A.; Karkee, M.; Zhang, Q. A hierarchical approach to apple identification for robotic harvesting. Trans. ASABE 2016, 59, 1079–1086. [Google Scholar] [CrossRef]
  3. Zhao, D.; Lv, J.; Ji, W.; Zhang, Y.; Chen, Y. Design and control of an apple harvesting robot. Biosyst. Eng. 2011, 110, 112–122. [Google Scholar] [CrossRef]
  4. Zhang, K.; Lammers, K.; Chu, P.; Li, Z.; Lu, R. System design and control of an apple harvesting robot. Mechatronics 2021, 79, 102644. [Google Scholar] [CrossRef]
  5. Gené-Mola, J.; Gregorio, E.; Guevara, J.; Auat, F.; Sanz-Cortiella, R.; Escolà, A.; Llorens, J.; Morros, J.-R.; Ruiz-Hidalgo, J.; Vilaplana, V.; et al. Fruit detection in an apple orchard using a mobile terrestrial laser scanner. Biosyst. Eng. 2019, 187, 171–184. [Google Scholar] [CrossRef]
  6. Karkee, M.; Adhikari, B.; Amatya, S.; Zhang, Q. Identification of pruning branches in tall spindle apple trees for automated pruning. Comput. Electron. Agric. 2014, 103, 127–135. [Google Scholar] [CrossRef]
  7. Howard, I.P.; Rogers, B.J. Binocular Vision and Stereopsis. Trends Neurosci. 1996, 19, 407–408. [Google Scholar] [CrossRef]
  8. Tang, Y.; Chen, M.; Wang, C.; Luo, L.; Li, J.; Lian, G.; Zou, X. Recognition and Localization Methods for Vision-Based Fruit Picking Robots: A Review. Front. Plant Sci. 2020, 11, 510. [Google Scholar] [CrossRef]
  9. Wang, F.; Chen, X.; Tan, C.; Li, J.; Zhang, Y. Hexagon-Shaped Screw Recognition and Positioning System Based on Binocular Vision. In Proceedings of the Chinese Control Conference, Wuhan, China, 25–27 July 2018; pp. 5481–5486. [Google Scholar] [CrossRef]
  10. Williams, H.; Ting, C.; Nejati, M.; Jones, M.H.; Penhall, N.; Lim, J.Y.; Seabright, M.; Bell, J.; Ahn, H.S.; Scarfe, A.; et al. Improvements to and large-scale evaluation of a robotic kiwifruit harvester. J. Field Robot. 2020, 37, 187–201. [Google Scholar] [CrossRef]
  11. Wang, C.; Zou, X.; Tang, Y.; Luo, L.; Feng, W. Localisation of litchi in an unstructured environment using binocular stereo vision. Biosyst. Eng. 2016, 145, 39–51. [Google Scholar] [CrossRef]
  12. Luo, L.; Tang, Y.; Zou, X.; Ye, M.; Feng, W.; Li, G. Vision-based extraction of spatial information in grape clusters for harvesting robots. Biosyst. Eng. 2016, 151, 90–104. [Google Scholar] [CrossRef]
  13. Si, Y.; Liu, G.; Feng, J. Location of apples in trees using stereoscopic vision. Comput. Electron. Agric. 2015, 112, 68–74. [Google Scholar] [CrossRef]
  14. Zhao, G.; Yang, R.; Jing, X.; Zhang, H.; Wu, Z.; Sun, X.; Jiang, H.; Li, R.; Wei, X.; Fountas, S.; et al. Phenotyping of individual apple tree in modern orchard with novel smartphone-based heterogeneous binocular vision and YOLOv5s. Comput. Electron. Agric. 2023, 209, 107814. [Google Scholar] [CrossRef]
  15. Fu, L.; Tola, E.; Al-Mallahi, A.; Li, R.; Cui, Y. A novel image processing algorithm to separate linearly clustered kiwifruits. Biosyst. Eng. 2019, 183, 184–195. [Google Scholar] [CrossRef]
  16. Mizushima, A.; Lu, R. An image segmentation method for apple sorting and grading using support vector machine and Otsu’s method. Comput. Electron. Agric. 2013, 94, 29–37. [Google Scholar] [CrossRef]
  17. Chapelle, O.; Haffner, P.; Vapnik, V.N. Support Vector Machines for Histogram-Based Image Classificatio. IEEE Trans. Neural Netw. 1999, 10, 1055–1064. [Google Scholar] [CrossRef]
  18. Otsu, N. A Threshold Selection Method from Gray-Level Histograms. IEEE Trans. Syst. Man Cybern. 1979, 9, 62–66. [Google Scholar] [CrossRef]
  19. Koirala, A.; Walsh, K.B.; Wang, Z.; McCarthy, C. Deep learning-Method overview and review of use for fruit detection and yield estimation. Comput. Electron. Agric. 2019, 162, 219–234. [Google Scholar] [CrossRef]
  20. Gheisari, M.; Wang, G.; Bhuiyan, M.Z.A. A Survey on Deep Learning in Big Data. In Proceedings of the 2017 IEEE International Conference on Computational Science and Engineering (CSE) and IEEE International Conference on Embedded and Ubiquitous Computing, (EUC), Guangzhou, China, 21–24 July 2017; Volume 2, pp. 173–180. [Google Scholar] [CrossRef]
  21. Garcia-Garcia, A.; Orts-Escolano, S.; Oprea, S.; Villena-Martinez, V.; Garcia-Rodriguez, J. A Review on Deep Learning Techniques Applied to Semantic Segmentation. arXiv, 2017; arXiv:1704.06857. [Google Scholar]
  22. Suo, R.; Fu, L.; He, L.; Li, G.; Majeed, Y.; Liu, X.; Zhao, G.; Yang, R.; Li, R. A novel labeling strategy to improve apple seedling segmentation using BlendMask for online grading. Comput. Electron. Agric. 2022, 201, 107333. [Google Scholar] [CrossRef]
  23. Gao, F.; Fu, L.; Zhang, X.; Majeed, Y.; Li, R.; Karkee, M.; Zhang, Q. Multi-class fruit-on-plant detection for apple in SNAP system using Faster RCNN. Comput. Electron. Agric. 2020, 176, 105634. [Google Scholar] [CrossRef]
  24. Sun, X.; Fang, W.; Gao, C.; Fu, L.; Majeed, Y.; Liu, X.; Gao, F.; Yang, R.; Li, R. Remote estimation of grafted apple tree trunk diameter in modern orchard with RGB and point cloud based on SOLOv2. Comput. Electron. Agric. 2022, 199, 107209. [Google Scholar] [CrossRef]
  25. Sun, K.; Wang, X.; Liu, S.; Liu, C.H. Apple, peach, and pear flower detection using semantic segmentation network and shape constraint level set. Comput. Electron. Agric. 2021, 185, 106150. [Google Scholar] [CrossRef]
  26. Chen, Z.; Ting, D.; Newbury, R.; Chen, C. Semantic segmentation for partially occluded apple trees based on deep learning. Comput. Electron. Agric. 2021, 181, 105952. [Google Scholar] [CrossRef]
  27. Dias, P.A.; Tabb, A.; Medeiros, H. Multispecies Fruit Flower Detection Using a Refined Semantic Segmentation Network. IEEE Robot. Autom. Lett. 2018, 3, 3003–3010. [Google Scholar] [CrossRef]
  28. Kang, H.; Chen, C. Fruit detection, segmentation and 3D visualisation of environments in apple orchards. Comput. Electron. Agric. 2020, 171, 105302. [Google Scholar] [CrossRef]
  29. Gené-Mola, J.; Sanz-Cortiella, R.; Rosell-Polo, J.R.; Morros, J.R.; Ruiz-Hidalgo, J.; Vilaplana, V.; Gregorio, E. Fruit detection and 3D location using instance segmentation neural networks and structure-from-motion photogrammetry. Comput. Electron. Agric. 2020, 169, 105165. [Google Scholar] [CrossRef]
  30. Wang, J.; Wang, L.; Han, Y.; Zhang, Y.; Zhou, R. On combining deepsnake and global saliency for detection of orchard apples. Appl. Sci. 2021, 11, 6269. [Google Scholar] [CrossRef]
  31. He, K.; Gkioxari, G.; Dollár, P.; Girshick, R. Mask R-CNN. IEEE Trans. Pattern Anal. Mach. Intell. 2020, 42, 386–397. [Google Scholar] [CrossRef]
  32. Long, J.; Shelhamer, E.; Darrell, T. Fully Convolutional Networks for Semantic Segmentation. IEEE Trans. Pattern Anal. Mach. Intell. 2015, 39, 640–651. [Google Scholar] [CrossRef]
  33. Zhang, Z.; Member, S. A Flexible New Technique for Camera Calibration. IEEE Trans. Pattern Anal. Mach. Intell. 2000, 22, 1330–1334. [Google Scholar] [CrossRef]
  34. Lowe, D.G. Distinctive image features from scale-invariant keypoints. Int. J. Comput. Vis. 2004, 60, 91–110. [Google Scholar] [CrossRef]
  35. Bay, H.; Tuytelaars, T.; Gool, L.V. SURF: Speeded Up Robust Features. Comput. Vis.-ECCV 2006, 3951, 404–417. [Google Scholar]
  36. Wang, X.; Kang, H.W.; Zhou, H.Y.; Au, W.; Chen, C. Geometry-aware fruit grasping estimation for robotic harvesting in apple orchards. Comput. Electron. Agric. 2022, 193, 106716. [Google Scholar] [CrossRef]
  37. Li, T.; Fang, W.; Zhao, G.; Gao, F.; Wu, Z.; Li, R.; Fu, L.; Dhupia, J. An improved binocular localization method for apple based on fruit detection using deep learning. Inf. Process. Agric. 2021, 10, 276–281. [Google Scholar] [CrossRef]
  38. Xiong, J.; He, Z.; Lin, R.; Liu, Z.; Bu, R.; Yang, Z.; Peng, H.; Zou, X. Visual positioning technology of picking robots for dynamic litchi clusters with disturbance. Comput. Electron. Agric. 2018, 151, 226–237. [Google Scholar] [CrossRef]
  39. Hu, T.; Wang, W.; Gu, J.; Xia, Z.; Zhang, J.; Wang, B. Research on Apple Object Detection and Localization Method Based on Improved YOLOX and RGB-D Images. 2023. Available online: https://ssrn.com/abstract=4348694 (accessed on 5 January 2020).
Figure 1. A BumblebeeXB3 binocular camera.
Agronomy 13 01469 g001
Figure 2. Apple images annotated with polygon annotations.
Agronomy 13 01469 g002
Figure 3. The Mask R-CNN network architecture.
Agronomy 13 01469 g003
Figure 4. An example display of output produced by the Mask R-CNN. It includes the class label ‘apple’, which is associated with confidence scores for apples, and a rectangle box indicates the position of apples and segmentation masks.
Agronomy 13 01469 g004
Figure 5. A comparison of an apple (highlighted by a yellow arrow) in binocular images before and after correction. (a) The uncorrected binocular image, red rectangle, and yellow rectangle indicate the different height of apples in the left image and right image, respectively. (b) The corrected binocular image, which fits epipolar constraints (apples in the binocular image are at the same height).
Agronomy 13 01469 g005aAgronomy 13 01469 g005b
Figure 6. Binocular positioning principle.
Agronomy 13 01469 g006
Figure 7. The matching range is limited by the parallel epipolar line constraint. (a) The left image is the template apple (labeled by the yellow rectangle). (b) The matching range is limited by the parallel epipolar line constraint (yellow rectangle).
Agronomy 13 01469 g007
Figure 8. The visualization of values in the BBox. Xmin and Ymin represent the distance from the top left corner of the rectangle to the left edge and top edge of the image, respectively. Xmax and Ymax represent the distance from the bottom right corner of the rectangle to the left edge and top edge of the image, respectively.
Agronomy 13 01469 g008
Figure 9. Relations after template matching. Different arrows indicate different relations between BBoxes and masks.
Agronomy 13 01469 g009
Figure 10. Feature point selection of the apple BBox. Arrows displayed the traverse direction of point selection, while a white solid circle indicated four selected points of the apple.
Agronomy 13 01469 g010
Figure 11. Loss curve and AP curve of the Mask R-CNN in every iteration during training.
Agronomy 13 01469 g011
Figure 12. Instance segmentation result of the binocular apple image by the Mask R-CNN.
Agronomy 13 01469 g012
Figure 13. Visualization of the Mask R-CNN instance segmentation results and four feature points selection results. (a) Instance segmentation results for binocular images captured in the daytime. (b) Instance segmentation results for binocular images captured at night.
Agronomy 13 01469 g013
Figure 14. CoV and PA of the 60 images of the test dataset.
Agronomy 13 01469 g014
Table 1. BumblebeeXB3 camera parameters.
ProjectParameter
Baseline11.99 cm
Focal length3.8 mm/6.4 mm
Maximum resolution1280 × 960 pixels
Table 2. A comparison of the performance among A3N, YOLO-v4, and Mask R-CNN with different architectures.
ModelBackboneTime/msTime(TX2)/msF1IoUmask
YOLO-V4-416CSPD53-PANet785920.864N/A
YOLO-V4-480CSPD53-PANet1068270.886N/A
Mask R-CNN-640R50-FPN1229200.8570.887
Mask R-CNN-640R101-FPN15712850.8770.895
A3N-416MN-PANet241740.8730.851
A3N-416 *R50-PANet352820.8900.873
A3N-480R101-PANet755980.9230.891
A3N-640R101-PANet977820.9230.893
Note: From ‘Geometry-aware fruit grasping estimation for robotic harvesting in apple orchards’ by Wang X, et al. [36]. Copyright 2022 by Monash University.
Table 3. Results from other studies on fruit positioning.
ReferenceHardwareModel/MethodCriteria
Li et al. [37]Binocular cameraFaster R-CNNPrecision: 99.64%
Xiong et al. [38]Binocular cameraFuzzy clusteringDepth error: 1.96 cm
Si et al. [13]Binocular cameraTraditional image processingDepth error: 0.013–5%
Hu et al. [39]RGB-D cameraYOLOXDepth error: less than 5 mm
Our methodBinocular cameraMask R-CNNPA: 99.49%
Disclaimer/Publisher’s Note: The statements, opinions and data contained in all publications are solely those of the individual author(s) and contributor(s) and not of MDPI and/or the editor(s). MDPI and/or the editor(s) disclaim responsibility for any injury to people or property resulting from any ideas, methods, instructions or products referred to in the content.

