Article

Nitrogen Application Effect on Maize Yield, NH3, and N2O Emissions in Northeast China by Meta-Analysis

1
College of Resource and Environmental Science, Jilin Agricultural University, Changchun 130118, China
2
Key Laboratory of Straw Comprehensive Utilization and Black Soil Conservation, Ministry of Education, Jilin Agricultural University, Changchun 130118, China
*
Authors to whom correspondence should be addressed.
Agronomy 2023, 13(6), 1479; https://doi.org/10.3390/agronomy13061479
Submission received: 20 April 2023 / Revised: 23 May 2023 / Accepted: 24 May 2023 / Published: 26 May 2023
(This article belongs to the Special Issue Integration of Agronomic Practices for Sustainable Crop Production)

Abstract

:
Ammonia volatilization (NH3) and nitrous oxide (N2O) emission are the main underliers of nitrogen loss in farmlands, which can decrease nitrogen use efficiency and trigger environmental problems regarding greenhouse effects. Previous studies have regional limitations and lack universal guiding significance, as they are primarily based on individual experiments related to the effects of applying nitrogen fertilizer on maize. In this study, we performed a meta-analysis on a regional scale to investigate the overall impact of nitrogen fertilizer application on maize yield, N2O, and NH3 in Northeast China. The database included 85 studies and 1147 pairs of experimental data that were analyzed. The results showed that applying nitrogen fertilizer significantly increased maize yield, N2O emissions, and NH3 volatilization effects, and the growth rates (E) were 50.64%, 64.39%, and 69.25%, respectively. In Northeast China, the average emission factors of N2O and NH3 were 0.72% and 8.21%, respectively. The optimum nitrogen application rate for maize in Northeast China was 205 kg ha−1, resulting in 8.37% nitrogen loss (through N2O and NH3). Soil texture, alkaline nitrogen (AN) content in the soil, mean annual precipitation (MAP), nitrogen application rate, and fertilizer type were the key influential factors affecting changes in maize yield and N loss (N2O and NH3). Yield-scaled N2O and NH3 were found to be the significant emission reduction parameters that ensured maize yield. However, there was a remarkable ‘seesaw effect’ between yield-scaled N2O and NH3 under the same natural conditions (MAP and soil texture). Therefore, human activities such as reducing N surplus in soil, and N fertilizer application rate, along with selecting suitable fertilizer types should be given more attention to reduce yield-scaled N2O and NH3. Moreover, minimizing NH3 and N2O dual emission should be the main objective for green agriculture in Northeast China, rather than over-emphasizing on single emission reduction.

1. Introduction

Northeast China is situated in the “Golden Maize Belt” of the world [1], and comprises Liaoning Province, Jilin Province, Heilongjiang Province, and five league cities in the east of the Inner Mongolia Autonomous Region (which is composed of Hulunbuir City, Tongliao City, Chifeng City, Xing’an League, and Xilingol League). It is a substantial grain production base with excellent agricultural production conditions in China. The maize planting area is 13.26 million hectares, accounting for 38% of the maize planting area, with 84.45 million tons yield, accounting for 41% of maize yield in China [2]. In Northeast China, as the most significant food crop, maize has a crucial strategic position in ensuring China’s food security. Its demand shows an increasing trend due to diversification in its purposes. For this reason, applying nitrogen fertilizer as an effective measure to increase production is the most important factor [3,4]. Its consumption in China is the largest globally, but its utilization efficiency is only 30–35%. A study has shown that between 2002 and 2015, the excessive-fertilization degree of maize in China was 32.76%, while in Northeast China it reached 38.62%, which has since become an excessive fertilization region in order to pursue higher yield [5]. Although nitrogen fertilizer application helps meet human food demand, it can also bring some negative environmental impacts. In particular, N is lost to the environment in the form of nitrous oxide (N2O) which is a greenhouse gas, ammonia (NH3) which causes air pollution, and N runoff and leaching, which causes groundwater pollution and eutrophication [6,7,8]. However, the topography of the northeast region is dominated by plains, while N runoff and leaching losses are relatively low [9]. Consequently, it is not the primary focus of this study.
Fertilization can significantly increase maize yield. Nonetheless, farmers have generally applied excessive nitrogen fertilizers since the 1990s to achieve high yields [10] resulting in soil nitrogen enrichment, which has led to the decrease of the yield-increasing effect in recent years. Yang et al. (2017) recommended that the nitrogen application rate for maize should be 180–200 kg ha−1 [11]. It has been observed that when the nitrogen fertilizer application rate exceeds 240 kg ha−1, the yield tends to decrease, while nitrogen utilization efficiency also decreases to 14.4% [12]. Chen et al. (2014) found that the NH3 and N2O emissions in the maize field showed linear and exponential growth trends with increasing nitrogen application rate [13]. Moreover, another study found that a threshold exists between the nitrogen application rate and the N2O emissions. When the nitrogen application rate was lower than this threshold, N2O emissions increased slowly. Conversely, when it exceeded the threshold, N2O emissions intensified, and exponential growth with the nitrogen application increased [14]. Therefore, the rational application of nitrogen fertilizer is of great significance for improving the nitrogen utilization efficiency and reducing the emissions of NH3 and N2O, while simultaneously achieving a high maize yield [15,16]. In cases of heavy precipitation occurring after nitrogen fertilizer application, not only do significantly higher N2O emissions arise as a result [17], an increased resistance to ammonia emission also occurs, resulting in NH3 reduction [18]. Furthermore, it has also been shown to produce lower N2O emissions in coarse-textured soils than in fine-textured soils [19]. However, the NH3 in fine-textured soils is less than that in coarse-textured soils [20].
The meta-analysis is a statistical method that quantitatively analyzes the statistical results of several independent studies. Additionally, it can comprehensively evaluate the statistical results and analyze the influencing factors [21]. Concerning the same field, meta-analyzes can quantitatively merge the results of multiple independent studies, analyze the differences between these studies, and obtain the comprehensive results of the research [22]. Recently, this method has been used to evaluate the effects of the driving factors underlying agricultural management practice on crop yield and gas emission. For example, Rusinamhodzi et al. (2011) conducted a meta-analysis and found that conservation agriculture practices require high inputs, especially N for improved yields [23]. Eagle et al. (2017) and Zhang et al. (2019) conducted a meta-analysis to assess the impacts of fertilizer application on soil N2O emissions and maize yield [24,25]. Wu et al. (2021) conducted a global meta-analysis to quantify the responses of NH3 volatilization to N fertilizer [26]. Hu et al. (2019) found that N fertilizer application significantly stimulated soil N2O emissions following residue returning through conducting their meta-analysis [27]. All of these studies are single studies exploring the effects of fertilizer application on maize yield or gas emissions, and they are all extensive in their scope, and were either conducted on a national or global scale. However, there are relatively few studies that performed a meta-analysis to identify the effects of nitrogen fertilizer application on overall maize yield and gas emissions in Northeast China. At the same time, the effect of nitrogen fertilizer is highly dependent on management and environmental factors. Therefore, in this study, we performed a meta-analysis to explore the effects of diverse nitrogen application measures under different climatic conditions and human activities on increasing yield and nitrogen emission reduction (NH3 and N2O) towards enhancing nitrogen utilization efficiency and reducing environmental pollution.

2. Materials and Methods

2.1. Data Source

This research conducted a search on Chinese and English databases including CNKI, Google Scholar, and Web of Science, respectively. Using “maize yield”, “maize + nitrogen”, and “maize + nitrous oxide/ammonia volatilization” as search keywords, studies published from 1980 to 2021 were collected and screened. In order to reduce literature screening bias, the following criteria were applied as follows: (1) Experimental site was confined to Northeast China; (2) Experiments must be conducted in the field; (3) Experimental treatments must simultaneously include the nitrogen application intervention and control intervention (no nitrogen application). After applying these criteria, we extracted 1147 paired observations from 85 studies (Figure 1, Tables S1–S4).
We extracted the information that was closely related to the experimental research in the article: experimental background information (such as experiment region, climatic conditions, and soil physical and chemical properties), experimental design-related information (including the cultivation mode, nitrogen fertilizer application method, and application amount and type), and analysis indicators (including the mean, number of repetitions, standard deviation or standard error of the yield, or nitrogen loss of the experimental group and control group). The data displayed with the text and table in the articles were directly extracted, and the data displayed in the figures were extracted with the GetData (version 2.26) Graph Digitize software. In the case that the data provided in the literature was the standard error corresponding to each mean, the standard deviation was calculated as follows:
S D = S E × n
where SD is the standard deviation, SE is the standard error, and n is the number of observations. In the case where no standard deviations or any standard errors were presented in these studies, we estimated the missing standard deviation according to the method of Bracken et al. (1992) [28].

2.2. Data Classification

The effect of yield and nitrogen gas loss by nitrogen fertilizer application may be affected by other factors. Therefore, the relevant experimental information extracted from the literature was summarized and grouped accordingly (Table 1), and the following influencing factors were sorted out as follows: experiment region; mean annual precipitation; mean annual temperature; soil texture (determined by the USDA (source: http://www.nrcs.usda.gov/ (accessed on 5 May 2021))); soil acidity and alkalinity; soil organic matter content; soil total nitrogen and alkali hydrolyzable nitrogen content; tillage method; straw returning method; nitrogen application rate, fertilizer type (traditional solid fertilizer: urea, ammonium sulfate, ammonium nitrate, ammonium bicarbonate, and compound fertilizer; liquid fertilizer: urea ammonium nitrate solution; slow/controlled release fertilizer: coated fertilizer and addition of NBPT/DMPP; and organic fertilizer: commercial organic fertilizers and manure), and fertilization method. The degree of influence of each factor on the yield and N2O and NH3 emission effects was examined with the meta-analysis.

2.3. Data Calculation and Analysis

The N2O/NH3 emission factor (EF) represented the net N2O/NH3 emission per unit N fertilizer. They were calculated using Equation (2):
E F = E t E c N × 100 %
where Et is the total emissions of N2O/NH3 (kg ha−1) from fertilized treatments, Ec is the control emission of N2O/NH3 (kg ha−1) without N fertilizer application, and N refers to the applied fertilizer N rate (kg ha−1).
Yield-scaled N2O and NH3 emissions (kg kg−1) as indicators for evaluating N2O and NH3 emission reductions had the advantage of considering the crop yield [29]. The equation for this was as follows:
I = F N Y N
where FN is cumulative N2O emissions/NH3 volatilization (kg ha−1), and YN is maize yield (kg ha−1).
Response Ratios (RR) were used in this paper as a statistical indicator [30] and took the natural logarithm of the response ratio as the effect size lnR. The equation was as follows:
l n R = l n X t / X c = l n X t X c
where the subscript of Xt and Xc represents the mean value of maize yield (incorporating N2O emissions and NH3 volatilization) in the treatment and control groups, respectively.
The meta-analysis, for the purposes of this study, was a weighted calculation of the effect values of each independent study to obtain the overall average effect size lnR++. It was therefore necessary to calculate the variance (vi) and weight (wi) of each independent study. The specific equations were follows:
v i = S D t 2 N t X t + S D c 2 N c X c   ,
w i = 1 v i   ,
l n R + + = l n R i × w i w i   .
where Nt and Nc are the sample sizes for the treatment and control groups, while St and Sc are the standard deviations for the treatment and control groups, respectively.
To reflect the variation of these effect values, this study calculated the 95% confidence interval (95% CI) of the weighted comprehensive effect size lnR++, and its calculation was based on the equation:
S l n R + + = 1 w i   ,
95 %   C I = l n R + + ± 1.96 S l n R + +   .
To better describe the impact of the experimental treatment group on a certain index, this study converted the lnR++ of the index into a percentage change (E, %), as according to Equation (10):
E = ( e l n R + + 1 ) × 100 %
Generally, the analysis model utilized is determined by the result obtained from the heterogeneity test. If the data analysis result was determined to be not significant (PQ-val > 0.05), this indicates that there were no significant differences found between the test results in the database, and the fixed effect model would be selected. Conversely, if PQ-val < 0.05, this proves that there were significant differences present, and thus the random effects model would be employed. The statistical results of this study revealed that there is indeed significant heterogeneity between the different experimental results (Table 2). Therefore, the mean effect sizes were estimated with the random effect model. The 95% CI for each mean effect size were calculated using bootstrapping with 4999 iterations [31]. Treatment effects were considered not significant if the 95% CI overlapped with the line lnR = 0. If the 95% CI did not overlap with the line lnR = 0 and was greater than (or less than) 0, treatment effects were considered significant, and the treatment group increased (or decreased) the value of this indicator. Meta-analysis was performed using R and MetaWin2.1 software.
The relative contributions of the explanatory variables, including the environmental factors and management practices, to the maize yield-increasing and gas emission effects of the nitrogen fertilizer was predicted based on a random forest model using the “random forest” package in the R software version 4.0.0 [32].

3. Results

3.1. The Effects of N Fertilizer Application on Maize Yield, N2O, and NH3

3.1.1. Natural Factors

Experiment Region and Climatic Factors

Several variances were observed in the effects of nitrogen application on maize yield, NH3 volatilization, and N2O emissions in different provinces and cities in Northeast China. Specifically, the yield-increasing effect on maize was higher in Inner Mongolia (E = 78.53%) than in the other three provinces (Figure 2a(i)). The maximum growth rate of N2O emission and NH3 volatilization appeared in the Jilin Province (E = 70.91%, 73.76%) (Figure 2a(ii,ⅲ)).
The effects of nitrogen application on maize yield, NH3 volatilization, and N2O emission varied with the different climatic conditions. When the mean annual precipitation rose, the yield-increasing effect revealed a trend of initial growth followed by decline (Figure 2b(i)). When the precipitation exceeded 400 mm, the yield-increasing effect was found to have significantly increased. However, it then initiated a slight reduction after exceeding 800 mm. The growth rate of N2O emission gradually increased as the mean annual precipitation also increased (Figure 2b(ii)). The growth rate increased from 53.08% to 99.41%; the largest increase appeared when the mean annual precipitation exceeded 800 mm. The change rule of the NH3 volatilization was opposite to the N2O emission (Figure 2b(ⅲ)), and the NH3 volatilization effect gradually decreased with the increase of the mean annual precipitation. As the mean annual temperature increased, the yield-increasing effect exhibited a trend of initially increasing and then decreasing (Figure 2c(i)). Nitrogen application was found to have the highest yield-increasing effect at 4–8 °C (E = 55.81%). However, this effect then dropped sharply after exceeding 8 °C. Additionally, there was a positive correlation found between nitrogen loss and nitrogen fertilizer application (Figure 2c(ii,ⅲ)), indicating that as the temperature increased, the resulting nitrogen loss effect also increased.

Soil Factors

The impact of soil texture on maize yield increase and nitrogen gas loss were found to have significant differences (Figure 3a(i), p < 0.01; Figure 3a(ii), p < 0.05; and Figure 3a(ⅲ), p < 0.05, respectively). Fertilization had a remarkable yield-increasing effect on medium-textured soil (E = 39.25%), while on coarse-textured soil, nitrogen application had the lowest effect on N2O emissions (E = 38.51%). However, the NH3 volatilization losses (E = 64.1%) were found to be the lowest on fine soil.
The effects of nitrogen fertilizer on maize yield increase and nitrogen loss in different soil pH were found to have significant differences (Figure 3b(i), p < 0.01; Figure 3b(ii), p < 0.01; and Figure 3b(ⅲ), p < 0.05, respectively). The yield-increasing effects were found to be significantly higher in neutral soil (E = 77.22%) and alkaline soil (E = 72.2%) than that in acidic soil (E = 39.14%). N2O emission and NH3 volatilization effects were also found to be positively correlated with the soil pH, and the lowest emission effects appeared on acidic soils (E = 36.59%, E = 49.09%). The maximal yield-increasing effect (E = 75.05%, 74.21%) was observed at lower levels of total nitrogen and alkali-hydrolyzable nitrogen in the soil (≤1g kg−1 and ≤90mg kg−1, respectively) (Figure 3c,d(i)). However, when they were at the highest level (>1.5g kg−1 and >120mg kg−1, respectively), the emission effects of N2O and NH3 were also at their highest, and their change rate were 85.1%, 88.14%, 84.21%, and 73.1%, respectively (Figure 3c,d(ii,ⅲ)). Significant differences were also observed in the effects of maize yield increasing under different soil organic matter contents (Figure 3e(i); p < 0.01). The yield-increasing effect was at its highest when the soil organic matter content was at a lower level (≤10 g kg−1) (E = 59.42%). However, the effects of the different soil organic matter contents on NH3 and N2O emissions are still unclear due to the limited existing data currently available (Figure 3e(ii), p = 0.50907; Figure 3e(ⅲ), p = 0.96813).

3.1.2. Human Management Factors

Nitrogen Fertilizer Management

The second-degree quadratic polynomial function was used through regression analysis to significantly fit the relationship between the nitrogen application rate and the maize yield (Figure 4a). The curve of the fitting equation was y = −0.0921x2 + 37.782x + 7253.9. The maximum yield (11,128.7 kg ha−1) was observed at the application rate of 205 kg ha−1. The relationship between the nitrogen application rate and N2O emission and NH3 volatilization was fitted with the exponential model (Figure 4b,c), and the results were both found to be significant (p < 0.01). With increasing the nitrogen application rate, both the N2O emission and NH3 volatilization exhibited an exponential growth trend. The curves of the fitting equation were y = e0.005x and y = e0.013x, respectively. As the maize yield reached its maximum, the corresponding N2O emission and NH3 volatilization were found to be 2.78 and 14.37 kg ha−1, respectively. Furthermore, the nitrogen loss rate at this point was 8.37%. In Northeast China, the average emission factors of N2O and NH3 were calculated to be 0.72% and 8.21%, respectively, based on our data.
Figure 4a and Figure 5a both indicate that the excessive application of N fertilizer not only reduced the yield, but also caused significant nitrogen gas emissions. Furthermore, both one-time and split applications were found to increase the maize yield (Figure 5b(i)). However, by comparison, the yield-increasing effect of split application (E = 57.48%) was found to be slightly higher than that of one-time application (E = 50.41%), which mitigated soil N2O emissions (E = 72.6%) and NH3 volatilization (E = 82.65%) (Figure 5b(ii,ⅲ)). For different kinds of nitrogen fertilizers, combining organic and inorganic fertilizers was found to be the best way to increase the yield effect (Figure 5c(i)). The slow and controlled release fertilizer delivered a slow and gradual release of nutrients, which can significantly reduce the emission of N2O (E = 44.6%) and NH3 (E = 65.78%), thereby making the emission effect the lowest (Figure 5c(ii,ⅲ)).

Tillage Management

The yield-increasing effect was found to be significant under the different tillage methods (Figure 6b, p < 0.01). After applying nitrogen fertilizer, the subsoiling exhibited a comparatively greater yield-increasing effect (E = 64%) compared to conventional (E = 32.14%) and rotary tillage (E = 41.67%). The N2O (E = 65.15%) and the NH3 volatilization effects (E = 70.93%) were both found to be at their highest in traditional tillage. Comparing the two measures of straw returning and no straw returning, the effects on maize yield increase and nitrogen loss were found to have significant differences (Figure 6a). After applying nitrogen fertilizer, the maximum yield-increasing effect (E = 68.4%), and the minimum N2O (E = 57.3%), and NH3 volatilization effects (E = 55.61%) were all achieved by returning the straw to the field.

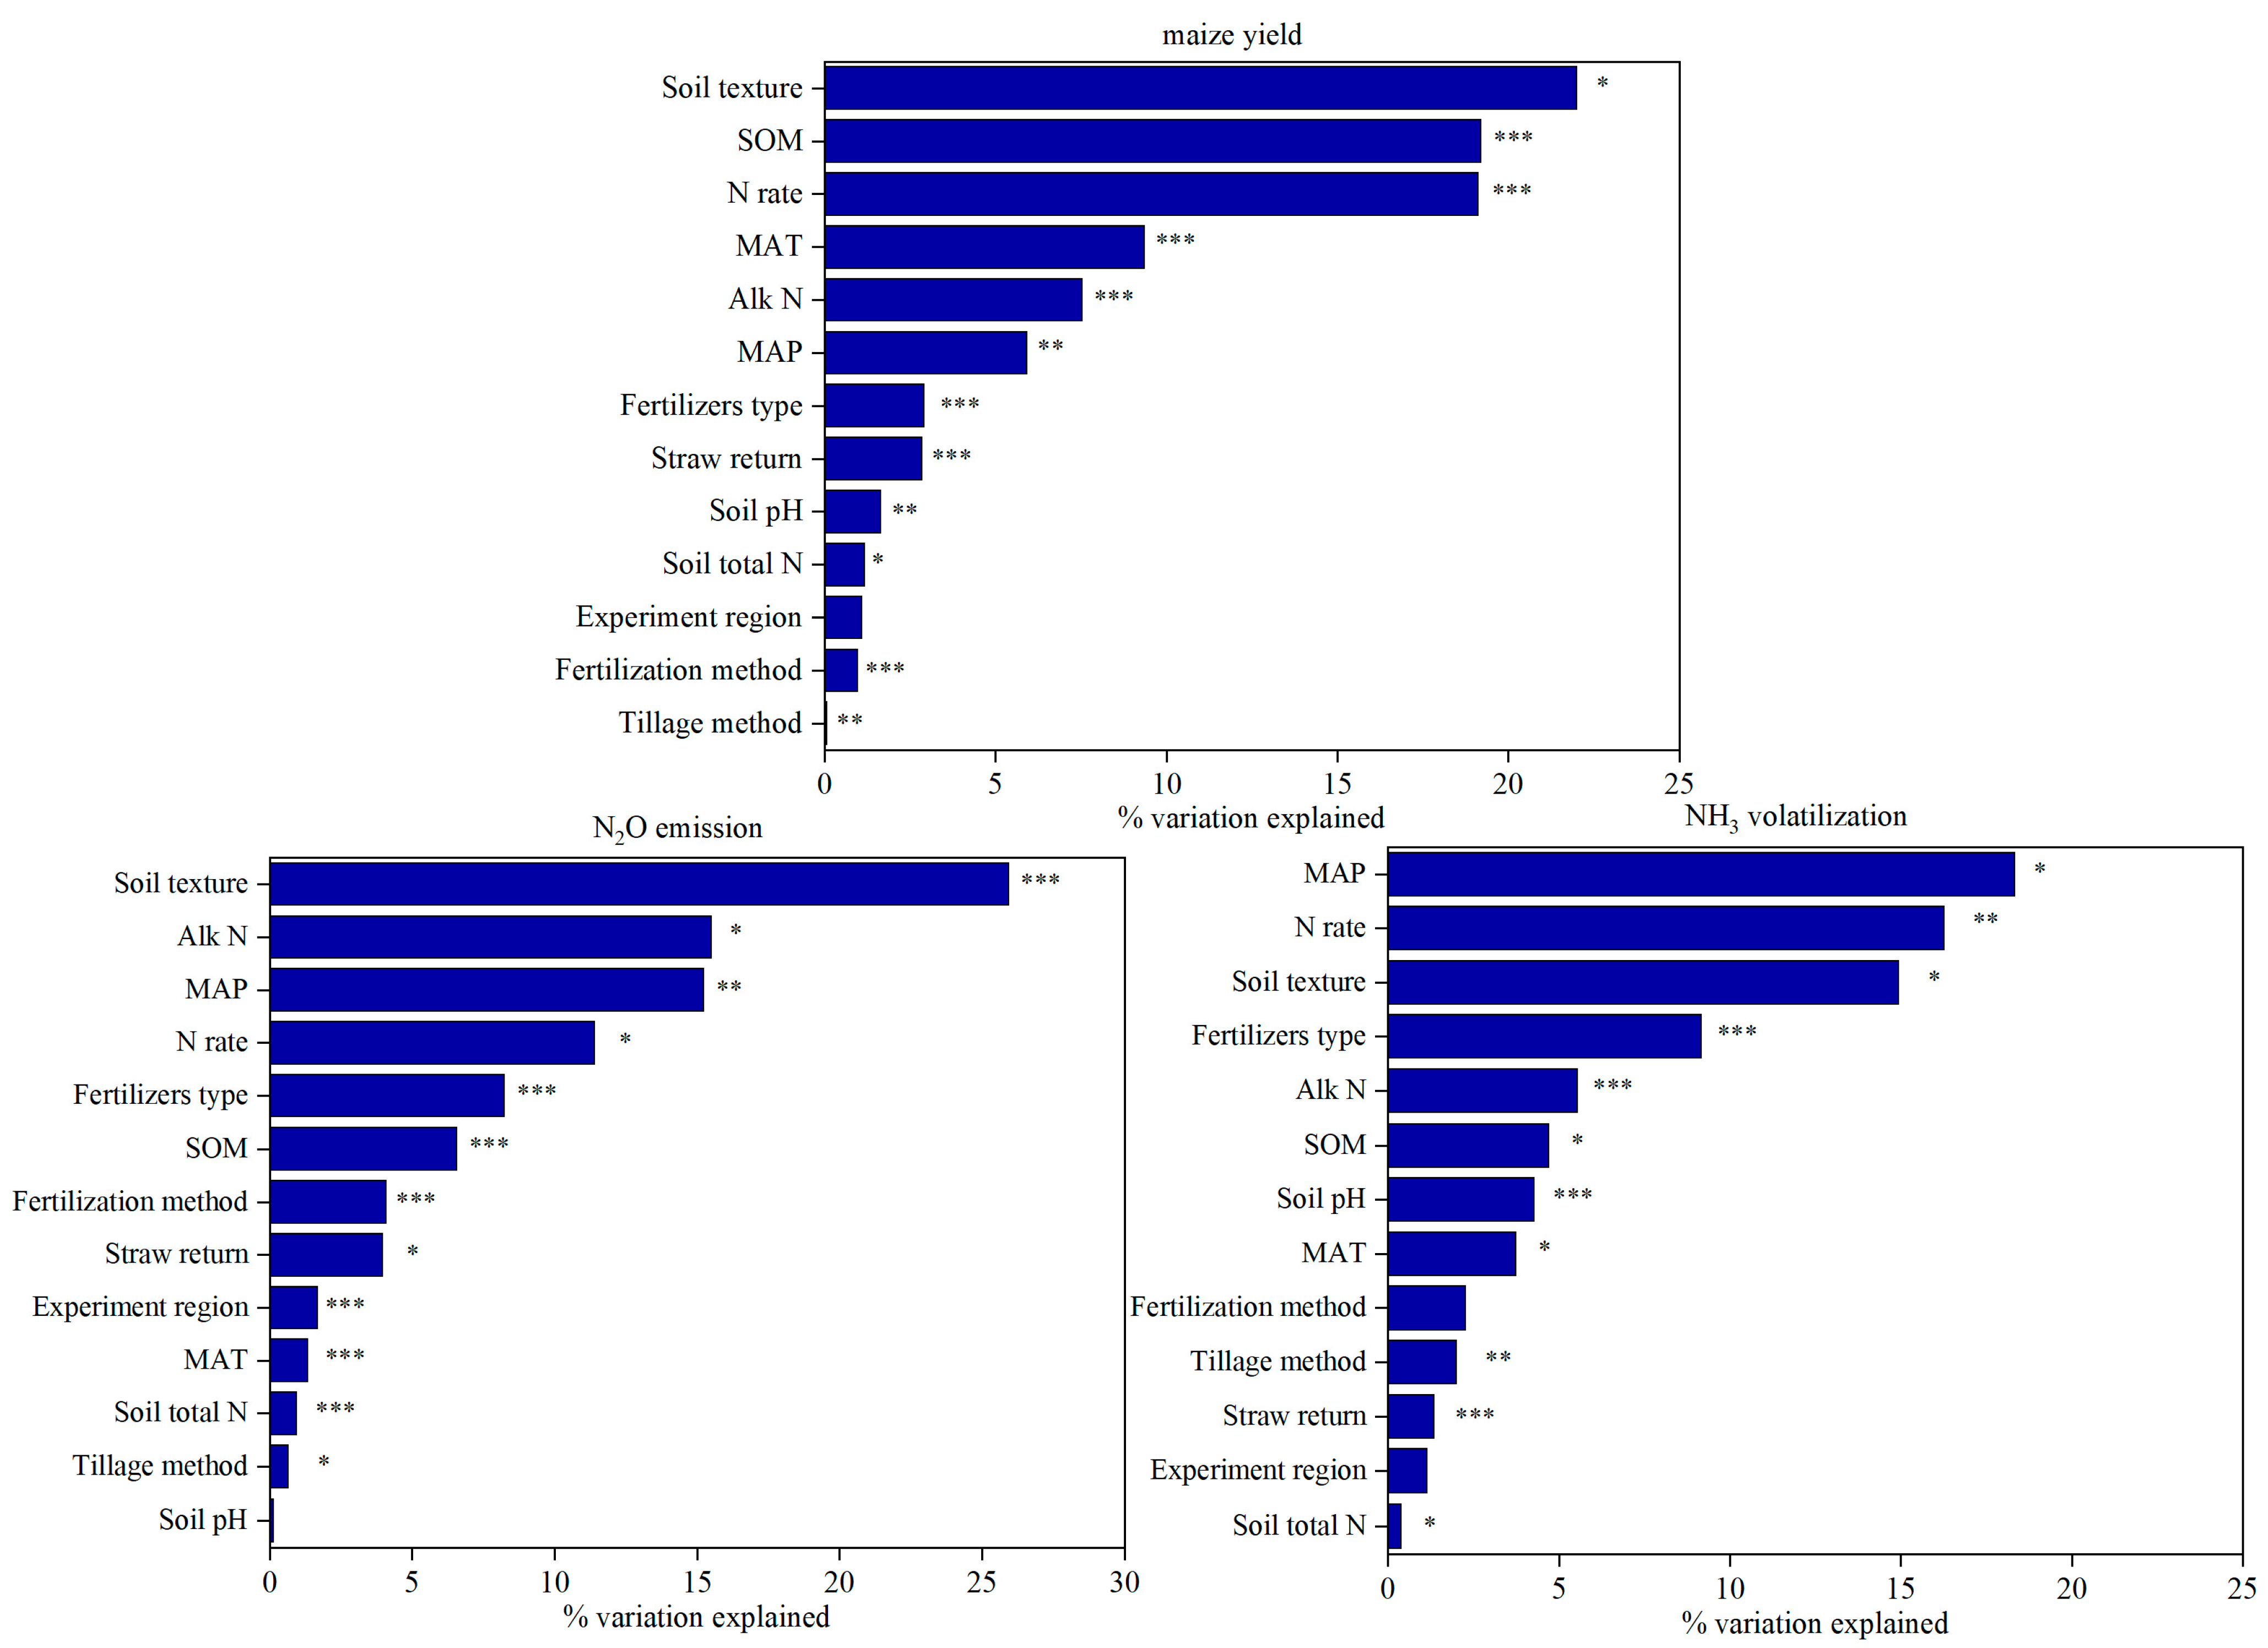
3.1.3. Analysis of Explanatory Variables on Maize Yield and Nitrogen Loss

Overall, 93.78% of the variations in maize yield could be attributed to the thirteen factors. Of these factors, the soil texture, organic matter content, nitrogen application rate, mean annual temperature, and soil alkaline nitrogen content were the key influential factors, which explained 22%, 19.2%, 19.11%, 9.35%, and 7.54% of the maize yield variations, respectively. Regarding effects on nitrogen gas losses, 95.58% of the variations in N2O emission could be explained by the thirteen factors. The soil texture, soil organic matter content, mean annual precipitation, nitrogen application rate, and fertilizer type were the key influential factors, which explained 25.92%, 15.49%, 15.22%, 11.4%, and 8.24% of the variations in N2O emission, respectively. Additionally, these thirteen factors could also explain 84.07% of the variations in NH3 volatilization, with the same key influencers affecting NH3 volatilization as N2O emission, namely soil texture, soil organic matter content, mean annual precipitation, nitrogen application rate, and fertilizer type, which respectively contributed to 9.17%, 5.54%, 18.33%, 16.26%, and 14.92% of the variation, respectively (Figure 7).

3.2. Driving Factors and the Relationships between Yield-Scaled N2O and NH3

In order to depict the relationship between the maize yield and nitrogen gas losses with greater precision, we should pay more attention to yield-scaled N2O emissions and NH3 volatilization. Therefore, we selected the five most influential factors on N2O and NH3 with nitrogen fertilizer application and divided them into two classifications: natural factors (mean annual precipitation and soil texture) and human management factors (nitrogen application rate, soil alkaline nitrogen content, and fertilizer type).

3.2.1. Natural Factors

Yield-scaled N2O and NH3 emissions were fitted separately to the natural factors affecting their variation. Both of them displayed an exponential relationship with the mean annual precipitation, with the difference being that while the yield-scaled N2O emission showed a positive correlation with the mean annual precipitation, yield-scaled NH3 displayed a negative correlation (Figure 8a). Consequently, we observed a “seesaw effect”, meaning that increasing mean annual precipitation led to an increase in the yield-scaled N2O emissions, while simultaneously causing a gradual reduction in the yield-scaled NH3 emissions. The effects of different soil textures on yield-scaled N2O emission and NH3 followed the same trend when yield-scaled N2O emission was increased (or decreased) and yield-scaled NH3 volatilization was decreased (or increased) after applying the nitrogen fertilizer in the same soil texture (Figure 8b,c).

3.2.2. Human Management Factors

Yield-scaled N2O and NH3 emissions revealed an exponential relationship with the nitrogen application rates (Figure 9a) and were linearly correlated with the soil alkaline nitrogen content (Figure 9b), and all fits were found to be positively correlated. The results revealed that both yield-scaled N2O emission and NH3 volatilization were below the average level under the application of slow/controlled release fertilizers and the combination of organic and inorganic fertilizers (Figure 9c,d).

4. Discussion

4.1. Natural Factors

Moisture and temperature are integral factors affecting the effects of nitrogen fertilizer application [33]. Yield-scaled N2O (NH3) emissions are closely related to maize yield and cumulative N2O (NH3) emissions. When the precipitation is too high, the soil moisture content increases, which leads to poor soil aeration, and as the soil is prone to an anaerobic environment, this will promote denitrification, thus increasing N2O emissions from the farmland [34]. Simultaneously, excessive precipitation will cause nitrogen to enter into the deep soil under water infiltration, and NH4+ produced by the hydrolysis of nitrogen fertilizer will be retained in the deep soil layer following the nitrification reaction. It cannot rise easily to the soil surface, which is more favorable to be absorbed by the maize root system [35]. It has been shown that there is a significant positive correlation between temperature and soil NH3 volatilization [36]. Under excessive temperatures, the NH4+-N in the soil will be improved by speeding up the hydrolysis of the nitrogen fertilizer, while urease activity increases the ratio of NH3; and at the same time, the solubility of NH3 in the soil will be reduced and promoting NH3 volatilization from the soil surface [37]. Under conditions of high temperature, soil microbial activity is enhanced, which promotes the circulation and turnover of soil nutrients, and enhances nitrification, denitrification, and nitrogen mineralization in the soil [38].
Applying nitrogen fertilizer on different soil textures can increase yields, but the most significant yield-increasing effects observed were on medium texture. It can be seen from Figure 8 how the reduction of one gas emission was followed by an increase of another gas emission after applying N fertilizer in the same soil texture, where neither yield-scaled N2O emission nor NH3 volatilization were reduced. The soil with fine texture (clay soil) has poor aeration and a strong water retention capacity, and its soil moisture content is higher than that of coarse texture soils. Similarly, due to the slow decomposition rate of organic matter which results in a higher microbial activity, denitrification is prone to occur, which thereby enhances N2O emission [39,40]. Clay particles also have an adsorption effect on NH4+, which can effectively reduce the concentration of NH4+, meaning the effect of NH3 volatilization with fine texture is less than that of coarse texture. In addition, the high clay grain content is less porous, which is not conducive to NH3 diffusion to the soil surface [41]. Soil pH is one of the most important factors affecting soil nitrification, soil nutrient conversion, and microbial community structure. Soil pH also affects the dynamic balance of the NH4+-N and NH3 conversion. The higher the soil pH, the higher the NH4+-N content in the liquid phase of the soil, which increases the rate of NH3 conversion and thus accelerates soil ammonia emission [42]. Soil pH significantly affects the rate of the denitrification process and product composition. Nitrogen fertilizer is quickly converted into ammonium nitrogen after being applied to alkaline soil, and then into nitrate nitrogen, which is converted into N2O by denitrifying microorganisms and subsequently discharged into the atmosphere. The optimum pH range of the denitrification rate is 7–8 [43]. This is consistent with the results of this study, where N2O emissions are higher in neutral and alkaline soils than in acidic soils.
In summary, it can be observed that under the same mean annual precipitation or soil texture conditions, a ‘seesaw effect’ of yield-scaled N2O emission and NH3 volatilization occurs, and the simultaneous reduction of both gas emissions cannot be achieved. Therefore, it has been recommended that in the future, considering the significant differences in the soil conditions and climate in China, we cannot overly focus on single gas emission (N2O/NH3) reduction from natural factors, but rather should focus on the impact of human factors as we continue to explore the best measures to increase yield and reduce emissions in Northeast China.

4.2. Human Factors

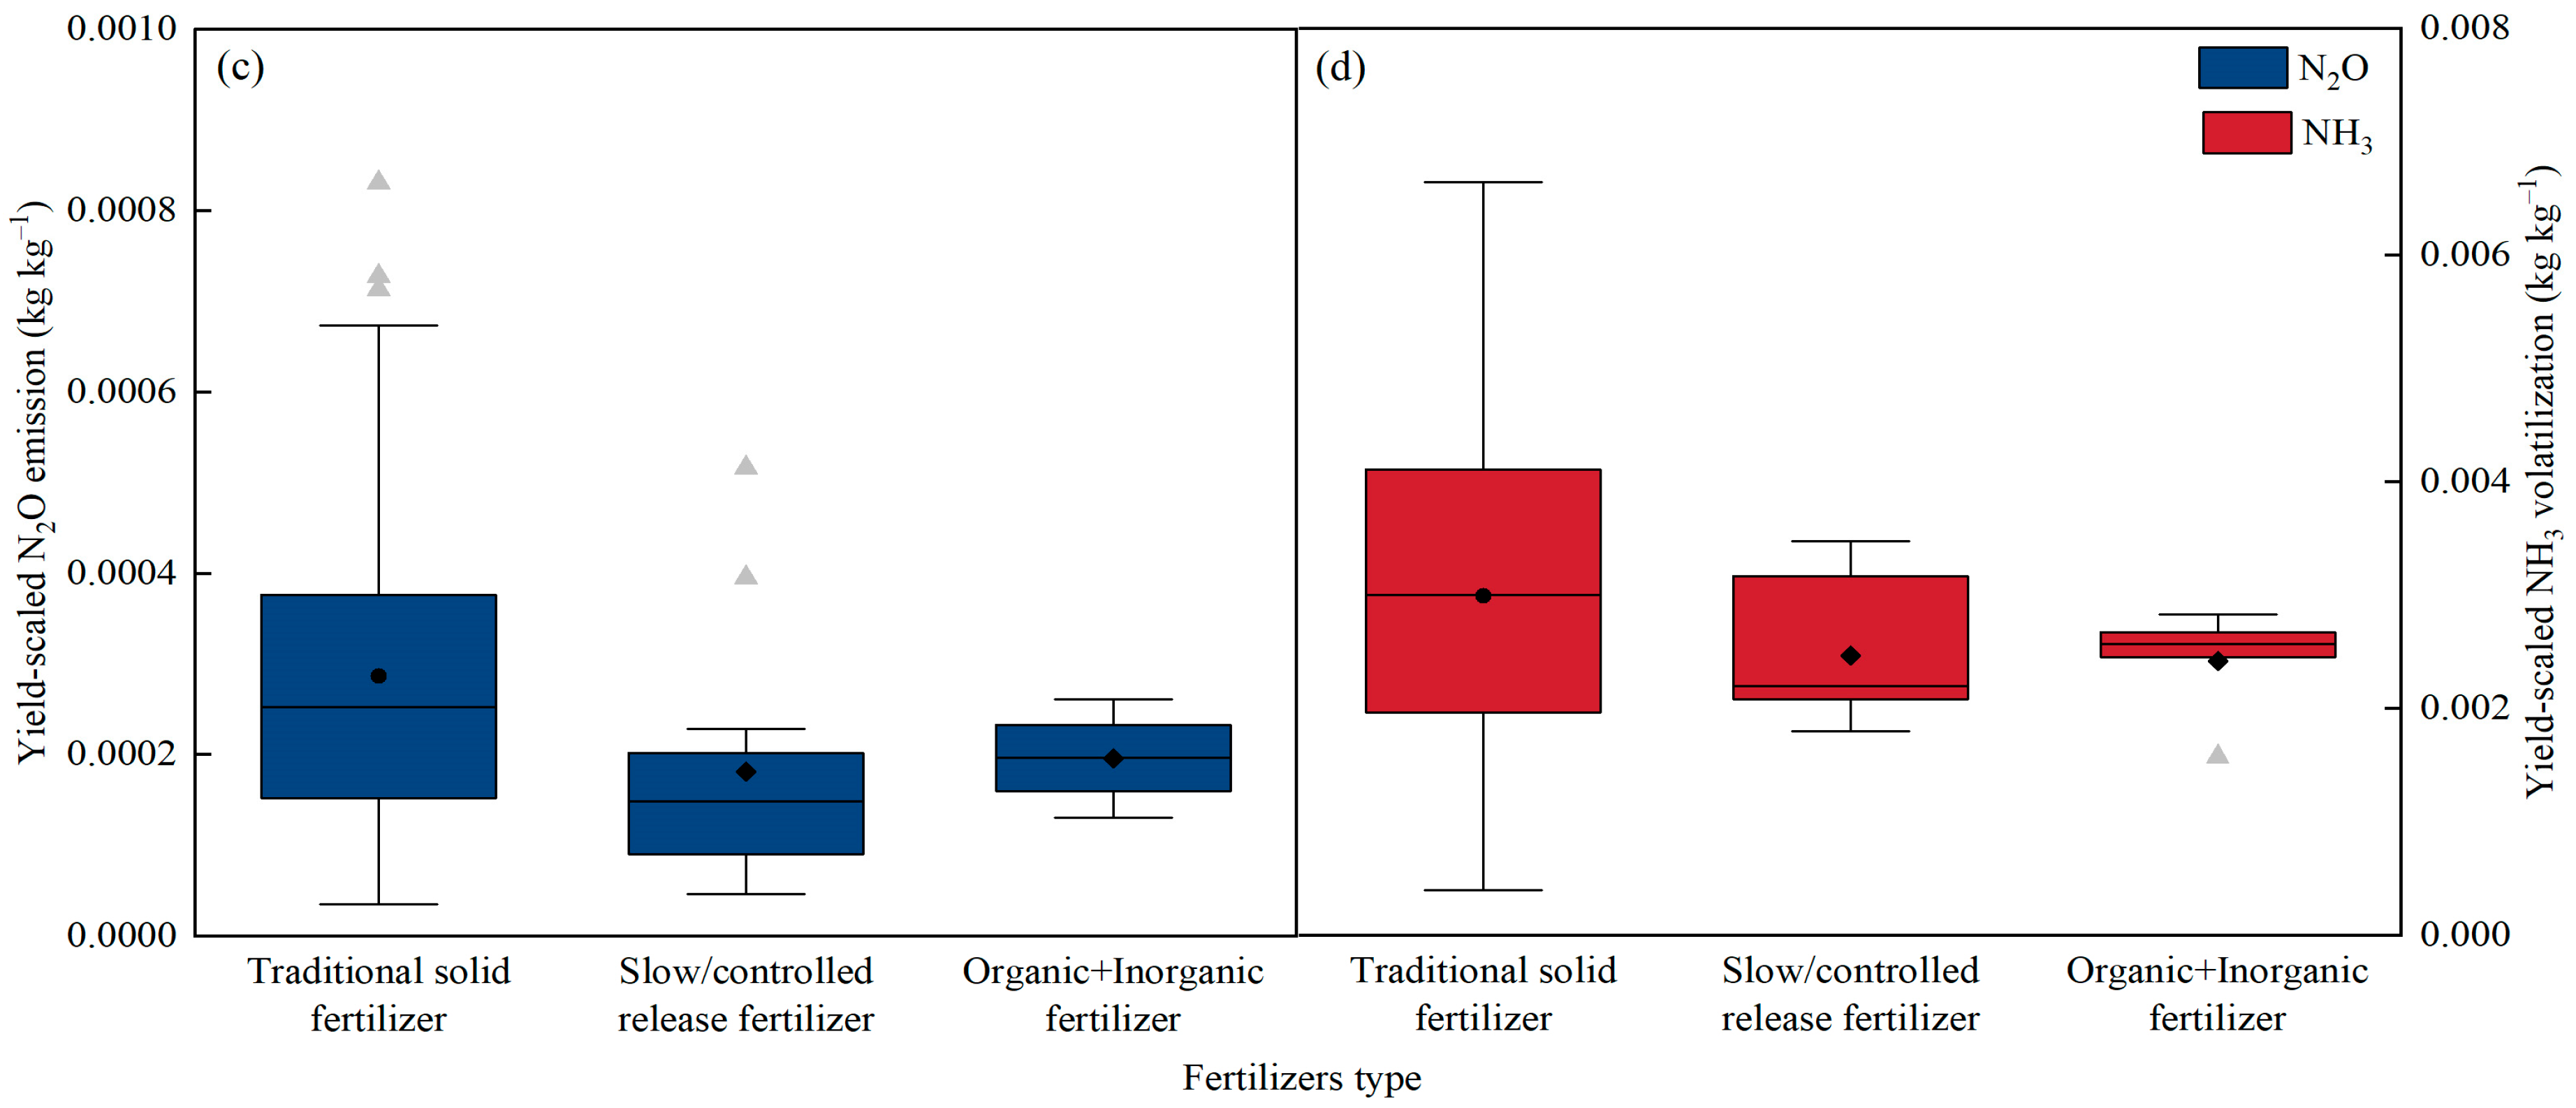
4.2.1. Nitrogen Fertilizer Type

The type of nitrogen fertilizer affects the impacts of nitrogen fertilizer application [44,45]. In this study, combining organic fertilizers and inorganic fertilizers has the highest yield-increasing effect on maize, followed by slow/controlled release fertilizers (Figure 5c). Yield-scaled N2O emission and NH3 volatilization, with the application of slow/controlled release fertilizers and the combined application of organic and inorganic fertilizers, are less than those of traditional solid fertilizers, and also less than the average of all data (Figure 9b,c). Applying slow/controlled release fertilizers can simultaneously increase the maize yield while mitigating N2O emissions and NH3 volatilization, resulting in lower yield-scaled N2O and NH3 emissions. The main reason is that slow/controlled release fertilizers increase the maize yield and reduce gas emissions probably involving NUE. Slow/controlled release fertilizers match the N requirement of maize over the growing season [46]. More specifically, it can minimize early season N availability when the maize uptake is low, thereby reducing the early season loss of N [47].
There is controversy over the emission reduction effect of organic fertilizers. In this study, the combined application of organic and inorganic fertilizers reduced yield-scaled N2O emission and NH3 volatilization, while maintaining maize yield. These results were consistent with the results published by Lv et al. (2020) and Akiyama et al. (2004) [48,49]. Conversely, Thangarajan et al. (2013) found that organic fertilizers could increase N2O emissions. This may be attributed to carbon input promoting the consumption of oxygen by microorganisms, which is conducive to the formation of anaerobic conditions and aggravates denitrification [50]. The C/N ratios of the different types of organic fertilizers vary considerably, and the different application methods can also cause significant differences in gas emissions [51]. The C/N ratios of pig manure and chicken manure is 35.18 and 11.67, respectively, while the N2O emissions are 1.52 kg ha−1 and 2.56 kg ha−1, respectively, meaning there is an inverse ratio between the C/N ratios and gas emissions [52]. As such, there is still uncertainty regarding the impact of applying organic fertilizers on gas emissions, and further research is therefore needed.

4.2.2. Nitrogen Fertilizer Rate and N Surplus

Excessive nitrogen application and redundant soil nitrogen surplus have resulted in a significant N2O and NH3 loss. Fitted curves showed that with the increase of the nitrogen application rate, maize yield first demonstrated an increasing trend, and then after reaching its maximum point gradually declined. At the same time, N2O and NH3 kept showing an increasing trend (Figure 4). The present agricultural development trend emphasizes increasing yield while simultaneously minimizing emissions, and it is therefore necessary to configure an optimal nitrogen application rate. Therefore, from conducting a quadratic polynomial function, we found that the maize yield was the largest when the nitrogen application rate was 205 kg ha−1. This is comparable with the currently recommended nitrogen rate of 150–240 kg ha−1 for maize in Northeast China [53]. Previous research data have indicated that over-application would result in an 18% N fertilizer loss through N2O emissions and NH3 volatilization [54,55], and therefore it is not surprising that the contribution of nitrogen application rates to yield-scaled N2O and NH3 changes were more significant. However, the nitrogen loss rate (N2O and NH3) calculated in this article was only 8.37%, with the optimal nitrogen application rate of 205 kg ha−1. At present, the average emission factors of N2O and NH3 in China are about 14.84% [56,57], meaning that the N2O and NH3 emission factors in Northeast China uncovered in this study were much smaller than at the national level.
Nitrogen surplus is the most effective indicator of judging nitrogen inputs, environmental impacts, and soil fertility changes. To some extent, it reflects the nitrogen use efficiency [58]. Therefore, clarifying the N surplus in an agricultural system is critical for controlling N losses [59]. It has been shown that a positive correlation does exist between nitrogen surplus and soil alkaline nitrogen content [60], indicating that the higher the alkaline nitrogen content, the higher the soil nitrogen surplus, along with a correspondingly increased potential risk of surface source pollution. In this study, soil alkaline N content was found to be significantly and positively correlated with yield-scaled N2O and NH3. Additionally, it is crucial to consider nitrogen surplus as an essential indicator when analyzing strategies pertaining to nitrogen fertilizer application and emission reduction measures [61].

4.2.3. Tillage Management

The tillage method and the addition of organic materials significantly affect yield-increasing and mitigate gas emissions. The subsoiling mitigates the disturbance to the soil, and makes it loosen in the deep soil without destroying the original structure, which effectively breaks the plow pan, adds the soil porosity, increases the water infiltration rate, and promotes the absorption of water and nutrients by the maize root system. At the same time, returning straw to the field also significantly impacts yield-increasing and gas emission reduction. After straw has been returned to the field, it will be humified and mineralized to release nutrients, increase the soil organic matter content, enhance soil aggregates and porosity, and improve the soil moisture retention capacity to ultimately grow and develop a maize root and improve the yield-increasing effect. Moreover, after applying nitrogen, a large amount of NH4+ can be adsorbed by soil organic matter and aggregate through nitrogen fixation and remineralization, consequently reducing NH3 volatilization and N2O emission [62].

5. Conclusions

Applying nitrogen fertilizer significantly increased the maize yield by 50.64%, N2O emissions by 64.39%, and NH3 volatilizations by 69.25%, respectively. There was a ‘seesaw effect’ observed between yield-scaled N2O and NH3 under the same natural conditions (mean annual precipitation and soil texture), and therefore it was deemed to be particularly necessary to consider the effects of human factors in this context. Overall, the alkaline nitrogen content, nitrogen application rate, and fertilizer type were found to be the key influential factors affecting the N2O and NH3 emission changes. In Northeast China, the average emission factors for N2O and NH3 were 0.72% and 8.21%, respectively, and the optimum nitrogen application rate for maize was 205 kg ha−1 through regression analysis, with the nitrogen loss (N2O and NH3) rate accounting for 8.37%, respectively. Overall, applying slow/controlled release fertilizers could obtain a higher yield-increasing rate and lower N2O and NH3 emissions.
Therefore, precise fertilization based on the specific soil fertility level of each region, choosing the appropriate nitrogen fertilizer types, and reduction of N surplus are deemed important strategies to increase maize yield and reduce emission in Northeast China.

Supplementary Materials

The following supporting information can be downloaded at: https://www.mdpi.com/article/10.3390/agronomy13061479/s1, Table S1: Data related to maize yield; Table S2: Data related to N2O emission; Table S3: Data related to NH3 volatilization. Table S4: References cited in the data.

Author Contributions

Funding acquisition, Conceptualization, and writing—review and editing, Q.G. and L.Y.; data collection, data curation, methodology, and writing—original draft, L.Z. methodology and data curation, X.Z. All authors have read and agreed to the published version of the manuscript.

Funding

This research was funded by the National Natural Science Foundation of China (project U19A2035), and the Northeast China Plain Agricultural Green Low Carbon Key Laboratory in Ministry of Agriculture and Rural Affairs China (LCGANE11).

Data Availability Statement

The data presented in this study are available on request from the corresponding author.

Acknowledgments

We thank the anonymous reviewers and editors for their constructive comments on this manuscript.

Conflicts of Interest

The authors declare no conflict of interest.

References

  1. Lu, X.; Li, Z.; Bu, Q.; Cheng, D.; Duan, W.; Sun, Z. Effects of rainfall harvesting and mulching on corn yield and water use in the corn belt of Northeast China. Agron. J. 2014, 106, 2175–2184. [Google Scholar] [CrossRef]
  2. NBSC (National Bureau of Statistics of China). China Statistical Yearbook, 2012–2019; Statistical Publishing House: Beijing, China, 2012; pp. 16–18.
  3. Pan, J.X.; Zhang, L.; He, X.M.; Chen, X.P.; Cui, Z.L. Long-term optimization of crop yield while concurrently improving soil quality. Land. Degrad. Dev. 2019, 30, 897–909. [Google Scholar] [CrossRef]
  4. Xu, X.P.; He, P.; Pampolino, M.F.; Johnston, A.M.; Qiu, S.J.; Zhao, S.C.; Chuan, L.M.; Zhou, W. Fertilizer recommendation for maize in China based on yield response and agronomic efficiency. Field Crops Res. 2014, 157, 27–34. [Google Scholar] [CrossRef]
  5. Kong, F.B.; Guo, Q.L.; Pan, D. Evaluation on overfertilization and its spatial-temporal difference about major grain crops in China. Econ. Geo. 2018, 38, 201–210. [Google Scholar] [CrossRef]
  6. Galloway, J.N.; Townsend, A.R.; Erisman, J.W.; Bekunda, M.; Cai, Z.; Freney, J.R.; Martinelli, L.A.; Seitzinger, S.P.; Sutton, M.A. Transformation of the nitrogen cycle: Recent trends, questions, and potential solutions. Science 2008, 320, 889–892. [Google Scholar] [CrossRef]
  7. Griffis, T.J.; Lee, X.; Baker, J.M.; Russelle, M.P.; Zhang, X.; Venterea, R.; Millet, D.B. Reconciling the differences between top-down and bottom-up estimates of nitrous oxide emission for the U.S. Corn Belt. Glob. Biogeochem. Cycles 2013, 27, 746–754. [Google Scholar] [CrossRef]
  8. He, F.; Jiang, R.; Chen, Q.; Zhang, F.; Su, F. Nitrous oxide emission from an intensively managed greenhouse vegetable cropping system in Northern China. Environ. Pollut. 2009, 157, 1666–1672. [Google Scholar] [CrossRef]
  9. Zhang, W.; Li, S.; Han, S.; Zheng, X.; Xie, H.; Lu, C.; Sui, Y.; Wang, R.; Liu, C.; Yao, Z.; et al. Less intensive nitrate leaching from Phaeozems cultivated with maize generally occurs in northeastern China. Agric. Ecosyst. Environ. 2021, 310, 107303. [Google Scholar] [CrossRef]
  10. Zhang, W.F.; Dou, Z.X.; He, P.; Ju, X.T.; David, P.; Dave, C.; David, N.; Lu, Y.L.; Zhang, Y.; Wu, L.; et al. New technologies reduce greenhouse gas emissions from nitrogenous fertilizer in China. Proc. Natl. Acad. Sci. USA 2013, 110, 8375–8380. [Google Scholar] [CrossRef]
  11. Yang, X.L.; Lu, Y.L.; Ding, Y.; Yin, X.F.; Raza, S.; Tong, Y.A. Optimising nitrogen fertilization: A key to improving nitrogen-use efficiency and minimising nitrate leaching losses in an intensive wheat/maize rotation. Field Crops Res. 2017, 206, 1–10. [Google Scholar] [CrossRef]
  12. Zhang, F.S.; Wang, J.Q.; Zhang, W.F.; Cui, Z.L.; Ma, W.Q.; Chen, X.Q.; Jiang, F.R. Nutrient use efficiencies of major cereal crops in China and measures for improvement. Acta Pedol. Sin. 2008, 45, 915–924. [Google Scholar]
  13. Chen, X.; Cui, Z.; Fan, M.; Vitousek, P.; Zhao, M.; Ma, W.; Wang, Z.; Zhang, W.; Yan, X.; Yang, J.; et al. Producing more grain with lower environmental costs. Nature 2014, 514, 486–489. [Google Scholar] [CrossRef] [PubMed]
  14. Hoben, J.P.; Gehl, R.J.; Millar, N.; Grace, P.R.; Robertson, G.P. Nonlinear nitrous oxide (N2O) response to nitrogen fertilizer in on-farm corn crops of the US Midwest. Glob. Chang. Biol. 2011, 17, 1140–1152. [Google Scholar] [CrossRef]
  15. Wang, D.; Li, G.Y.; Mo, Y.; Cai, M.K.; Bian, X.Y. Evaluation of optimal nitrogen rate for corn production under mulched drip fertigation and economic benefits. Field Crops Res. 2018, 216, 225–233. [Google Scholar] [CrossRef]
  16. Zhang, X.; Meng, F.Q.; Li, H.; Wang, L.G.; Wu, S.X.; Xiao, G.M.; Wu, W.L. Optimized fertigation maintains high yield and mitigates N2O and NO emissions in an intensified wheat–maize cropping system. Agric. Water Manag. 2019, 211, 26–36. [Google Scholar] [CrossRef]
  17. Ruser, R.; Flessa, H.; Russow, R. Emission of N2O, N2 and CO2 from soil fertilized with nitrate: Effect of compaction, soil moisture and rewetting. Soil Boil. Biochem. 2005, 38, 263–274. [Google Scholar] [CrossRef]
  18. Nicholson, F.A.; Bhogal, A.; Chadwick, D.; Gill, E.; Gooday, R.D.; Lord, E.; Misselbrook, T.; Rollett, A.J.; Sagoo, E.; Smith, K.A.; et al. An enhanced software tool to support better use of manure nutrients: Manner-NPK. Soil Use Manag. 2013, 29, 473–484. [Google Scholar] [CrossRef]
  19. Van Groenigen, J.W.; Kasper, G.J.; Velthof, G.L.; Dasselaar, A.V.D.P.; Kuikman, P.J. Nitrous oxide emissions from silage maize fields under different mineral nitrogen fertilizer and slurry applications. Plant Soil 2004, 263, 101–111. [Google Scholar] [CrossRef]
  20. Fan, H.; Jiang, S.S.; Wei, Y.; Jiang, J.Y. Assessment of gaseous nitrogen (NH3 and N2O) mitigation after the application of a range of new nitrogen fertilizers in summer maize cultivation. Environ. Sci. 2016, 37, 2906–2913. [Google Scholar] [CrossRef]
  21. Bender, D.J.; Contreras, T.A.; Fahrig, L. Habitat loss and population decline: A meta-analysis of the patch size effect. Ecology 1998, 79, 517–533. [Google Scholar] [CrossRef]
  22. Ellenberg, S.S. Meta-analysis: The quantitative approach to research review. Semin. Oncol. 1988, 5, 472. [Google Scholar]
  23. Rusinamhodzi, L.; Corbeels, M.; Van Wijk, M.T.; Rufino, M.C.; Nyamangara, J.; Giller, K.E. A meta-analysis of long-term effects of conservation agriculture on maize grain yield under rain-fed conditions. Agron. Sustain. Dev. 2011, 31, 657–673. [Google Scholar] [CrossRef]
  24. Eagle, A.J.; Olander, L.P.; Locklier, K.L.; Heffernan, J.B.; Bernhardt, E.S. Fertilizer management and environmental factors drive N2O and NO3 losses in corn: A Meta-analysis. Soil Sci. Soc. Am. J. 2017, 81, 1191. [Google Scholar] [CrossRef]
  25. Zhang, W.S.; Liang, Z.Y.; He, X.M.; Wang, W.Z.; Shi, X.J.; Zou, C.Q.; Chen, X.P. The effects of controlled release urea on maize productivity and reactive nitrogen losses: A meta-analysis. Environ. Pollut. 2019, 246, 559–565. [Google Scholar] [CrossRef]
  26. Wu, D.; Zhang, Y.X.; Dong, G.; Du, Z.L.; Wu, W.L.; Chadwick, D.; Bol, R. The importance of ammonia volatilization in estimating the efficacy of nitrification inhibitors to reduce N2O emissions: A global meta-analysis. Environ. Pollut. 2020, 271, 116365. [Google Scholar] [CrossRef]
  27. Hu, N.; Chen, Q.; Zhu, L. The Responses of Soil N2O Emissions to residue returning systems: A Meta-analysis. Sustainability 2019, 11, 748. [Google Scholar] [CrossRef]
  28. Bracken, M.B. Effective Care of the Newborn Infant. Arch. Dis. Child. 1992, 11, 1415–1416. [Google Scholar]
  29. Van Groenigen, J.W.; Velthof, G.L.; Oenema, O.; Van Groenigen, K.J.; Van Kessel, C. Towards an agronomic assessment of N2O emissions: A case study for arable crops. Eur. J. Soil Sci. 2010, 61, 903–913. [Google Scholar] [CrossRef]
  30. Hedges, L.V.; Gurevitch, J.; Curtis, P.S. The Meta-analysis of response ratios in experimental ecology. Ecology 1999, 80, 1150–1156. [Google Scholar] [CrossRef]
  31. Rosenberg, M.S.; Adams, D.C.; Gurevitch, J. Metawin: Statistical Software for Meta-Analysis, Version 2.1; Sinauer Associates: Sunderland, MA, USA, 2000; pp. 7–11. [Google Scholar]
  32. Zhang, Y.; Zhang, F.; Abalos, D.; Luo, Y.; Hui, D.; Hungate, B.A.; Chen, J. Stimulation of ammonia oxidizer and denitrifier abundances by nitrogen loading: Poor predictability for increased soil N2O emission. Glob. Chang. Biol. 2022, 28, 2158. [Google Scholar] [CrossRef]
  33. Chen, C.Q.; Lei, C.X.; Deng, A.X.; Qian, C.R.; Hoogmoed, W.; Zhang, W.J. Will higher minimum temperatures increase corn production in Northeast China? An analysis of historical data over 1965–2008. Agric. For. Meteorol. 2011, 151, 1580–1588. [Google Scholar] [CrossRef]
  34. Kool, D.M.; Dolfing, J.; Wrage, N.; Groenigen, J.W.V. Nitrifier denitrification as a distinct and significant source of Nitrous Oxide from Soil. Soil Biol. Biochem. 2011, 43, 174–178. [Google Scholar] [CrossRef]
  35. Zhang, Y.M.; Chen, D.L.; Zhang, J.B.; Edis, R.; Hu, C.S.; Zhu, A.N. Ammonia volatilization and denitrification losses form an irrigated maize-wheat rotation field in the north China plain. Pedosphere 2004, 14, 533–540. [Google Scholar] [CrossRef]
  36. Sha, Z.; Li, Q.; Lv, T.; Misselbrook, T.; Liu, X. Response of ammonia volatilization to biochar addition: A meta-analysis. Sci. Total Environ. 2019, 655, 1387–1396. [Google Scholar] [CrossRef] [PubMed]
  37. Sherlock, R.R.; Goh, K.M. Dynamics of ammonia volatilization from simulated urine patches and aqueous urea applied to pasture.3. filed verification of a simplified model. Fertil. Res. 1985, 6, 23–36. [Google Scholar] [CrossRef]
  38. Robinson, C.H.; Saunders, P.W.; Madan, N.J.; Janie Pryce-Miller, E.; Pentecost, A. Does nitrogen deposition affect soil microfungal diversity and soil N and P dynamics in a high Arctic ecosystem? Glob. Chang. Biol. 2004, 10, 1065–1079. [Google Scholar] [CrossRef]
  39. Gentile, R.; Vanlauwe, B.; Chivenge, P.; Six, J. Interactive effects form combining fertilizer and organic Residue inputs on nitrogen transfomations. Soil Biol. Biochem. 2008, 40, 2375–2384. [Google Scholar] [CrossRef]
  40. Gu, J.X.; Nicoulaud, B.; Rochette, P.; Grossel, A.; Hénault, C.; Cellier, P.; Richard, G. A regional experiment suggest that soil texture is a major control of N2O emissions form tile drained winter wheat fields during the fertilization period. Soil Biol. Biochem. 2013, 60, 134–141. [Google Scholar] [CrossRef]
  41. Fan, X.H.; Li, Y.C.; Alva, A.K. Effects of temperature and soil type on ammonia volatilization from slow-release nitrogen fertilizers. Commun. Soil Sci. Plan. 2011, 42, 1111–1122. [Google Scholar] [CrossRef]
  42. Laegreid, M.; Bockman, O.C.; Kaarstad, O. Agriculture Fertilizers and the Environment; CABI Publishing in Association with Norsk Hydro ASA: New York, NY, USA, 1999; pp. 5–13. [Google Scholar]
  43. Struwe, S.; Kjller, A. Potential for production from beech (Fagus silvaticus) forest soils with varying pH. Soil Biol. Biochem. 1994, 26, 1003–1009. [Google Scholar] [CrossRef]
  44. Liu, S.W.; Lin, F.; Wu, S.; Ji, C.; Sun, Y.; Jin, Y.G.; Li, S.Q.; Li, Z.F.; Zou, J.W. A meta-analysis of fertilizer-induced soil NO and combined NO+N2O emissions. Glob. Chang. Biol. 2017, 23, 2520–2532. [Google Scholar] [CrossRef] [PubMed]
  45. Vinzent, B.; Fuß, R.; Maidl, F.X.; Hülsbergen, K.J. N2O emissions and nitrogen dynamics of winter rapeseed fertilized with different N forms and a nitrification inhibitor. Agric. Ecosyst. Environ. 2018, 259, 86–97. [Google Scholar] [CrossRef]
  46. Geng, J.; Chen, J.; Sun, Y.; Zheng, W.; Tian, X.; Yang, Y.; Li, C.; Zhang, M. Controlled release urea improved nitrogen use efficiency and yield of wheat and corn. Agron. J. 2016, 108, 1666–1673. [Google Scholar] [CrossRef]
  47. Akiyama, H.; Yan, X.Y.; Yagi, K. Evaluation of effectiveness of enhanced-efficiency fertilizers as mitigation option for N2O and NO Emission form agricultural soils: Meta-analysis. Glob. Chang. Biol. 2010, 19, 1837–1846. [Google Scholar] [CrossRef]
  48. Lv, F.L.; Yang, X.Y.; Xu, H.H.; Khan, A.; Zhang, S.L.; Sun, B.H.; Gu, J.X. Effect of organic amendments on yield-scaled N2O emissions from winter wheat-summer maize cropping systems in Northwest China. Environ. Sci. Pollut. R. 2020, 27, 31933–31945. [Google Scholar] [CrossRef]
  49. Akiyama, H.; Mctaggart, I.P.; Ball, B.C.; Scott, A. N2O, NO, and NH3 emissions from soil after the application of organic fertilizers, urea and water. Water Air Soil Pollt. 2004, 156, 113–129. [Google Scholar] [CrossRef]
  50. Thangarajan, R.; Bolan, N.S.; Tian, G.L.; Naidu, R.; Kunhikrishnan, A. Role of organic amendment application on greenhouse gas emission form soil. Sci. Total Environ. 2013, 465, 72–96. [Google Scholar] [CrossRef]
  51. Chadwick, D.R.; Pain, B.F.; Brookman, S.K. Nitrous oxide and methane emissions following application of animal manures to grassland. J. Environ. Qual. 2000, 9, 277–287. [Google Scholar] [CrossRef]
  52. Li, X.; Yan, X.Y.; Xing, G.X.; Xiong, Z.Q.; Shi, T.J.; Shen, G.Y.; Zeng, X. Crop utilization of N from different animal excreta and its contribution to N2O emissions. Soils 2008, 40, 548–553. [Google Scholar] [CrossRef]
  53. Wu, L.Q.; Wu, L.; Cui, Z.L.; Chen, X.P.; Zhang, F.S. Basic NPK fertilizer recommendation and fertilizer formula for maize production regions in China. Acta Pedol. Sin. 2015, 52, 802–817. [Google Scholar] [CrossRef]
  54. IPCC. Special Report on Emissions Scenarios, Working Group III, Intergovernmental Panel on Climate Change; Cambridge University Press: Cambridge, UK, 2000; pp. 5–16. [Google Scholar]
  55. Bouwman, A.F.; Boumans, L.; Batjes, N.H. Estimation of global NH3 volatilization loss from synthetic fertilizers and animal manure applied to arable lands and grasslands. Glob. Biogeochem. Cycles 2002, 16, 53–60. [Google Scholar] [CrossRef]
  56. Zheng, X.H.; Han, S.H.; Huang, Y.; Wang, Y.S.; Wang, M.X. Re-quantifying the emission factors based on field measurements and estimating the direct N2O emission from Chinese croplands. Glob. Biogeochem. Cycles 2018, 18, GB2018. [Google Scholar] [CrossRef]
  57. Ma, R.Y.; Zou, J.W.; Han, Z.Q.; Yu, K.; Wu, S.; Li, Z.F.; Liu, S.W.; Niu, S.L.; Horwath, W.R.; Zhu-Barker, X. Global soil-derived ammonia emissions from agricultural nitrogen fertilizer application: A refinement based on regional and crop-specific emission factors. Glob. Chang. Biol. 2021, 27, 855–867. [Google Scholar] [CrossRef] [PubMed]
  58. Oenema, O.; Kros, H.; Vries, W.D. Approaches and uncertainties in nutrient budgets: Implications for nutrient management and environmental policies. Eur. J. Agron. 2003, 20, 3–16. [Google Scholar] [CrossRef]
  59. Zhu, X.; Zhou, P.; Miao, P.; Wang, H.Y.; Bai, X.L.; Chen, Z.J.; Zhou, J.B. Nitrogen use and management in orchards and vegetable fields in China: Challenges and solutions. Front. Agric. Sci. Eng. 2022, 9, 386–395. [Google Scholar] [CrossRef]
  60. Song, H.J.; Hu, D.D.; Wu, L.; Du, J.; Hu, Z.; Zhang, W.; Li, D.; Yu, H.; Liu, K. Dynamics of nitrogen use efficiency of maize and alkali-hydrolyzable nitrogen content of red soil under long-term application of organic and inorganic fertilizers. J. Plant Nutri. Fert. 2022, 28, 2030–2040. Available online: http://www.plantnutrifert.org (accessed on 11 March 2023).
  61. Liu, J.; Li, J.; Ma, Y.; Wang, E.; Liang, Q.; Jia, Y.; Li, T.; Wang, G. Crop productivity and nitrogen balance as influenced by nitrogen deposition and fertilizer application in North China. Sustainability 2019, 11, 1347. [Google Scholar] [CrossRef]
  62. Huang, D.D.; Cao, G.J.; Geng, Y.H.; Wang, L.C.; Liang, A.Z. Impact of agricultural waste return on soil greenhouse gas emissions. Appl. Ecol. Env. Res. 2019, 17, 1321–1335. [Google Scholar] [CrossRef]
Figure 1. Distribution of the locations of the studies included in the meta-analysis. The map was generated using ArcGIS 10.2.
Agronomy 13 01479 g001
Figure 2. Impact of (a) experiment region, (b) mean annual precipitation, and (c) mean annual temperature on (i) yield, (ii) N2O emission, and (iii) NH3 volatilization from agricultural soils. Symbols represent the mean effect sizes with 95% confidence intervals. Sample sizes are presented in parentheses.
Agronomy 13 01479 g002
Figure 3. Impact of (a) soil texture, (b) soil pH, (c) alkali-hydrolyzable nitrogen content, (d) total nitrogen content, and (e) soil organic matter content on the (i) yield, (ii) N2O emission, and (iii) NH3 volatilization from agricultural soils. Symbols represent the mean effect sizes with 95% confidence intervals. Sample sizes are presented in parentheses.
Agronomy 13 01479 g003
Figure 4. Relationship between the nitrogen application rate and (a) the yield, (b) N2O emission, and (c) NH3 volatilization. ** Significant at p < 0.01.
Agronomy 13 01479 g004
Figure 5. Impact of (a) nitrogen application rate, (b) fertilization method, and (c) nitrogen fertilizer type on the (i) yield, (ii) N2O emission, and (iii) NH3 volatilization from agricultural soils. Symbols represent the mean effect sizes with 95% confidence intervals. Sample sizes are presented in parentheses.
Agronomy 13 01479 g005
Figure 6. Impact of (a) straw return and (b) tillage method on (i) yield, (ii) N2O emission, and (iii) NH3 volatilization. Symbols represent the mean effect sizes with 95% confidence intervals. Sample sizes are presented in parentheses.
Agronomy 13 01479 g006
Figure 7. Significance of the explanatory variables on the response of the maize yield, N2O, and NH3 to N fertilizer application. Abbreviations: SOM, soil organic matter content; MAT, mean annual temperature; MAP, mean annual precipitation; and Alk N, alkaline nitrogen content. * Significant at p < 0.05; ** Significant at p < 0.01; *** Significant at p < 0.001.
Agronomy 13 01479 g007
Figure 8. Fitted plots of the contrary variation among the best explanatory variables for yield-scaled N2O emission under N fertilizer application. Where (a) is mean annual precipitation, (b,c) are soil texture. The gray points in (b,c) are outliers. ** Significant at p < 0.01.
Agronomy 13 01479 g008
Figure 9. Fitted plots of the same variation among the best explanatory variables for yield-scaled NH3 volatilization under N fertilizer application. Where (a) is nitrogen application rate, (b) is the alkaline nitrogen content, (c,d) are nitrogen fertilizer type. The gray points in (b,c) are outliers. * Significant at p < 0.05; ** Significant at p < 0.01.
Agronomy 13 01479 g009aAgronomy 13 01479 g009b
Table 1. Data grouping situation.
Influence Factor Subgroup Analysis
Experiment region Hei Longjiang; Liaoning; Jilin; and Inner Mongolia (Hulun Buir; Tongliao; Chifeng; Hinggan League; and Xilingol League)
Mean annual precipitation (mm) ≤400; 400–800; >800
Mean annual temperature (°C)≤4; 4–8; >8
Soil textureCoarse; Medium; Fine
Soil pHpH ≤ 6.5; 6.5 < pH ≤ 7.5; pH > 7.5
Soil organic matter (g kg−1)SOM ≤ 10; 10 < SOM ≤ 30; SOM > 30
Soil total N (g kg−1)Total N ≤ 1.0; 1.0 < Total N ≤ 1.5; Total N > 1.5
Alk N (mg kg−1)Alk N ≤ 90; 90 < Alk N ≤ 120; Alk N > 120
Tillage method Conventional tillage; subsoiling; rotary tillage
Straw return to the fieldStraw return; no straw return
Nitrogen application rate (kg ha−1)<180; 180–240; >240
Nitrogen fertilizer typeTraditional solid fertilizer; liquid fertilizer; slow/controlled release fertilizer; organic fertilizer; organic+ inorganic fertilizer
Fertilization methodSingle; split
Table 2. Descriptive statistics of the sample size.
NMeanQ-valdfPQ-valI2
Yield9930.409783,654.3622992<0.000198.91%
N2O1000.49711948.346899<0.000197.04%
NH3540.5262140,006.832953<0.000199.96%
Abbreviations: Q-val, statistic of heterogeneity; df, degree of freedom; PQ-val, significance test; and I2, the ratio of the variance between the studies to the total variance.
Disclaimer/Publisher’s Note: The statements, opinions and data contained in all publications are solely those of the individual author(s) and contributor(s) and not of MDPI and/or the editor(s). MDPI and/or the editor(s) disclaim responsibility for any injury to people or property resulting from any ideas, methods, instructions or products referred to in the content.

