Article

Genome-Wide Association Study (GWAS) of the Agronomic Traits and Phenolic Content in Sorghum (Sorghum bicolor L.) Genotypes

1
Advanced Radiation Technology Institute, Korea Atomic Energy Research Institute, Jeongeup-si 56212, Republic of Korea
2
Department of Plant Production Sciences, Graduate School, Sunchon National University, Suncheon 57922, Republic of Korea
3
Department of Applied Plant Science, Chonam National University, Gwangju 61186, Republic of Korea
*
Authors to whom correspondence should be addressed.
Agronomy 2023, 13(6), 1449; https://doi.org/10.3390/agronomy13061449
Submission received: 26 April 2023 / Revised: 19 May 2023 / Accepted: 22 May 2023 / Published: 24 May 2023
(This article belongs to the Special Issue Advances in Plant Genetic Breeding and Molecular Biology)

Abstract

:
Sorghum (Sorghum bicolor L.) is a promising biomass crop with high yields of cellulose, hemicellulose, and lignin. Sorghum biomass has emerged as an eco-friendly industrial material useful for producing biofuels and bioplastics. This study conducted genotyping-by-sequencing (GBS)-based genome-wide association studies (GWAS) to establish the genetic basis of traits associated with biomass. Specifically, the researchers evaluated agronomic traits and phenolic compounds using 96 sorghum genotypes. Six phenolic compounds, luteolinidin diglucoside, luteolin glucoside, apigeninidin glucoside, luteolinidin, apigeninidin, and 5-O-Me luteolinidin, were found to be the major phenolic compounds in all genotypes. Out of our six detected phenolic compounds (luteolinidin diglucoside, luteolin glucoside, apigeninidin glucoside, luteolinidin, apigeninidin, and 5-O-Me luteolinidin), luteolinidin was the major phenolic compound in all genotypes. Next, a GWAS analysis was performed to confirm significant associations between 192,040 filtered single-nucleotide polymorphisms (SNPs) and biomass-related traits. The study identified 40 SNPs on 10 chromosomes that were significantly associated with heading date (4 SNPs), plant height (3 SNPs), dry yield (2 SNPs), and phenolic compounds (31 SNPs). The GWAS analysis showed that SbRio.10G099600 (FUT1) was associated with heading date, SbRio.09G149200 with plant height, SbRio.06G211400 (MAFB) with dry yield, SbRio.04G259800 (PDHA1) with total phenolic content and luteolinidin diglucoside, and SbRio.02G343600 (LeETR4) with total phenolic content and luteolinidin, suggesting that these genes could play key roles in sorghum. These findings demonstrate the potential value of sorghum as a biomass resource and the potential for selecting sorghum genotypes with reduced phenolic contents for use in the bioindustry.

1. Introduction

Sorghum (Sorghum bicolor L.) is the fifth-most important cereal crop in the world. It is a new-generation crop with a highly efficient photosynthetic system (C4) that makes it ideal for producing industrial materials, such as alcohol, fuel, and bioplastics [1]. Sorghum can also serve as a source of lignocellulosic biomass for the production of bio-based chemicals and bioplastic materials [2]. Since biomass yield is a quantitative trait with generally low heritability, indirect selection has been reported to have similar efficiencies when selecting closely related traits with high heritability [3]. The primary and most essential components of sorghum biomass are heading date [4], height [5,6,7], dry yield [7,8], and juiciness [4]. Additionally, sorghum sugar is an important ingredient for the food, biofuel, bioplastic, and pharmaceutical industries. Increasing the biomass and sugar yield potential of sorghum is one of the most important targets of breeding programs [2,3]. However, despite its high importance to the bioindustry, sorghum variety development has been biased toward improving seed yield and nutrient value [9]. Hence, there is a need for research focused on biomass traits and the development of sorghum varieties suitable for utilization as a bio-industrial material.
Mutation breeding techniques increase the probability of a mutation occurring in nature. Natural mutations occur at a very low rate (10−5 to 10−8), whereas ionizing radiation can increase the mutation rate by approximately 1000 to 1 million times compared to natural mutations [10,11,12]. Ionizing radiation is a simple, economical, eco-friendly, and convenient process that can be used under safe, well-defined, and controlled operating parameters [13,14]. The advantage of mutation breeding is that only a subset of the original traits can be modified, and it is particularly effective for changes in chemical compound compositions [15]. To date, radiation breeding has resulted in the development of over 210 species and around 3402 varieties, including 20 sorghum varieties [16]. This approach is widely employed in breeding programs due to its ability to rapidly enhance crops and increase genetic diversity.
Sorghum is known for containing high amounts of diverse phenolic compounds, such as flavonoids, condensed tannins, and phenolic acids, in its grains, stems, and leaves [17,18]. Lignocellulosic biomass, which is composed of hydrophilic carbohydrates, has been utilized as a raw material for biomass-based production or as a source of sugar through a hydrolysis process [19]. Sorghum is a versatile crop that can be used for various purposes, including the production of bioplastics [20]. The fermentation of polyhydroxyalkanoates (PHA) is a process used to produce biodegradable plastics that are environmentally friendly [21]. PHA can be produced by fermenting various carbon sources with bacteria, but phenolic compounds in the fermentation process can lead to decreased PHA yield and productivity [21]. Although phenolic compounds have beneficial effects on human health, such as antioxidant and anticancer activities, they can make it difficult to utilize lignocellulosic biomass as a material for biomass production [22].
Advances in next-generation sequencing (NGS) technology have made DNA sequencing cost-effective to the extent that genotyping-by-sequencing (GBS) is now feasible for large-genome species with high genetic diversity [23]. Since GBS conducts SNP discovery and genotyping simultaneously, prior genomic knowledge of the species is not required [24]. Genome-wide association studies (GWAS) have been adopted as a useful approach for identifying the candidate genes underlying quantitative and qualitative traits [25]. The single-nucleotide polymorphisms (SNPs) identified by GBS allow the analysis of genetic diversity and integration with GWAS into a single research project [26]. The basic principle of GWAS is to integrate genotype and phenotype data through general linear models or mixed linear models (MLM) [27]. Currently, GWAS have been successfully used with mutants in various crops of interest, including for causal SNPs for agronomic and phytochemical traits in Sorghum bicolor, Brassica napus, and Glycine max [28,29,30].
The aim of this study is to investigate the genetic variability of sorghum using high-density SNP data from a sorghum population consisting of 59 radiation-induced mutant lines and 37 sorghum genetic resources and to detect candidate genes for key bioindustry-related traits that may affect biomass yield and chemical treatment through GWAS analysis.

2. Materials and Methods

2.1. Plant Materials and DNA Extraction

The genetic resources comprised 96 sorghum genotypes, including 37 selected genotypes from the Rural Development Association GenBank (RDA) and International Crop Research Institute for Semi-Arid Tropics (ICRSAT). These selected genotypes were evaluated for seed production feasibility and a wide range of agronomic and phenolic characteristics for three years at the Advanced Radiation Technology Institute of the Korea Atomic Energy Research Institute (KAERI) in Jeongeup, Jeollabuk, Republic of Korea (35.5699° N 126.9722° E). Fifty-nine mutant lines of sorghum were induced by treating the original cultivar seeds with various doses of gamma rays (60Co) and proton beam irradiation at KAERI. Eighteen mutant lines from Banwoldang (Republic of Korea), twelve mutant lines from Dansusu2 (Republic of Korea), five mutant lines from KLSo79125 (Republic of Korea), six mutant lines from HDW501 (Indonesia), four mutant lines from IS5718 (India), three mutant lines from IS645 (USA), three mutant lines from DINE-A-MITE (unknown), two mutant lines from Moktak (Republic of Korea), one mutant line from Chalsusu1 (Republic of Korea), one mutant line from High-land-sweet (unknown), one mutant line from IS2868 (South Africa), one mutant line from Mesusu (Republic of Korea), and two mutant lines from IS2864 (South Africa) were used in this study (Table 1). Briefly, the treated seeds were sown to obtain the M1 seeds from one plant, and the main spikes of each M1 plant were harvested. In the M2 generation, all the individuals were investigated for agronomic mutations from the original cultivar. Sorghum mutants were selected based on their agronomic characteristics and phenolic compound contents, which were obtained from the M3 and M4 generations. The self-fertilization procedure was continued until the M5 generations. Finally, fifty-nine mutants that varied in agronomic characteristics and phenolic compound content and that exhibited stable inheritance of the mutated characteristics from M5 generations were selected. Genomic DNA was extracted from the young leaves of each individual using the DNeasy Plant Mini Kit (Qiagen, Hilden, Germany) and quantified using a NanoDrop ND-1000 spectrophotometer (Thermo Fisher Scientific, MA, USA). The DNA concentrations were adjusted to 50–100 ng/µL (total of 30–50 µL per sample) for the GBS analysis.

2.2. Evaluation of Agronomic Traits and Soluble Solids Content

Agronomic traits, such as heading date (HD), plant height (PH), fresh yield (FY), dry yield (DY), and soluble solids content (SC), were measured. The heading date was scored as the number of days between sowing and 50% heading. The plant height, soluble solids content, and fresh yield were measured at the seed harvest dates of each genotype. The soluble solids content (brix°) was determined using a hand-held refractometer (OPT-I, Bellingham & Stanley Ltd., London, UK) measured from the juice of the main stem at 15 cm above the ground. The fresh weight of the whole plant, except for the panicle, was measured for each individual. Fresh yield was then determined by multiplying the fresh weight yield per linear meter (6 m2) by the total linear meters grown per hectare. Subsequently, the dry yield was calculated mechanically by multiplying the fresh yield by the average percentage of dry matter. Dry yield was surveyed on 96 genotypes during two generations. Fertilizer (N:P:K 4:2:2 w/w/w) was applied to 500 kg∙ha−1 at pre-sowing and the plants were not fertilized after sowing.

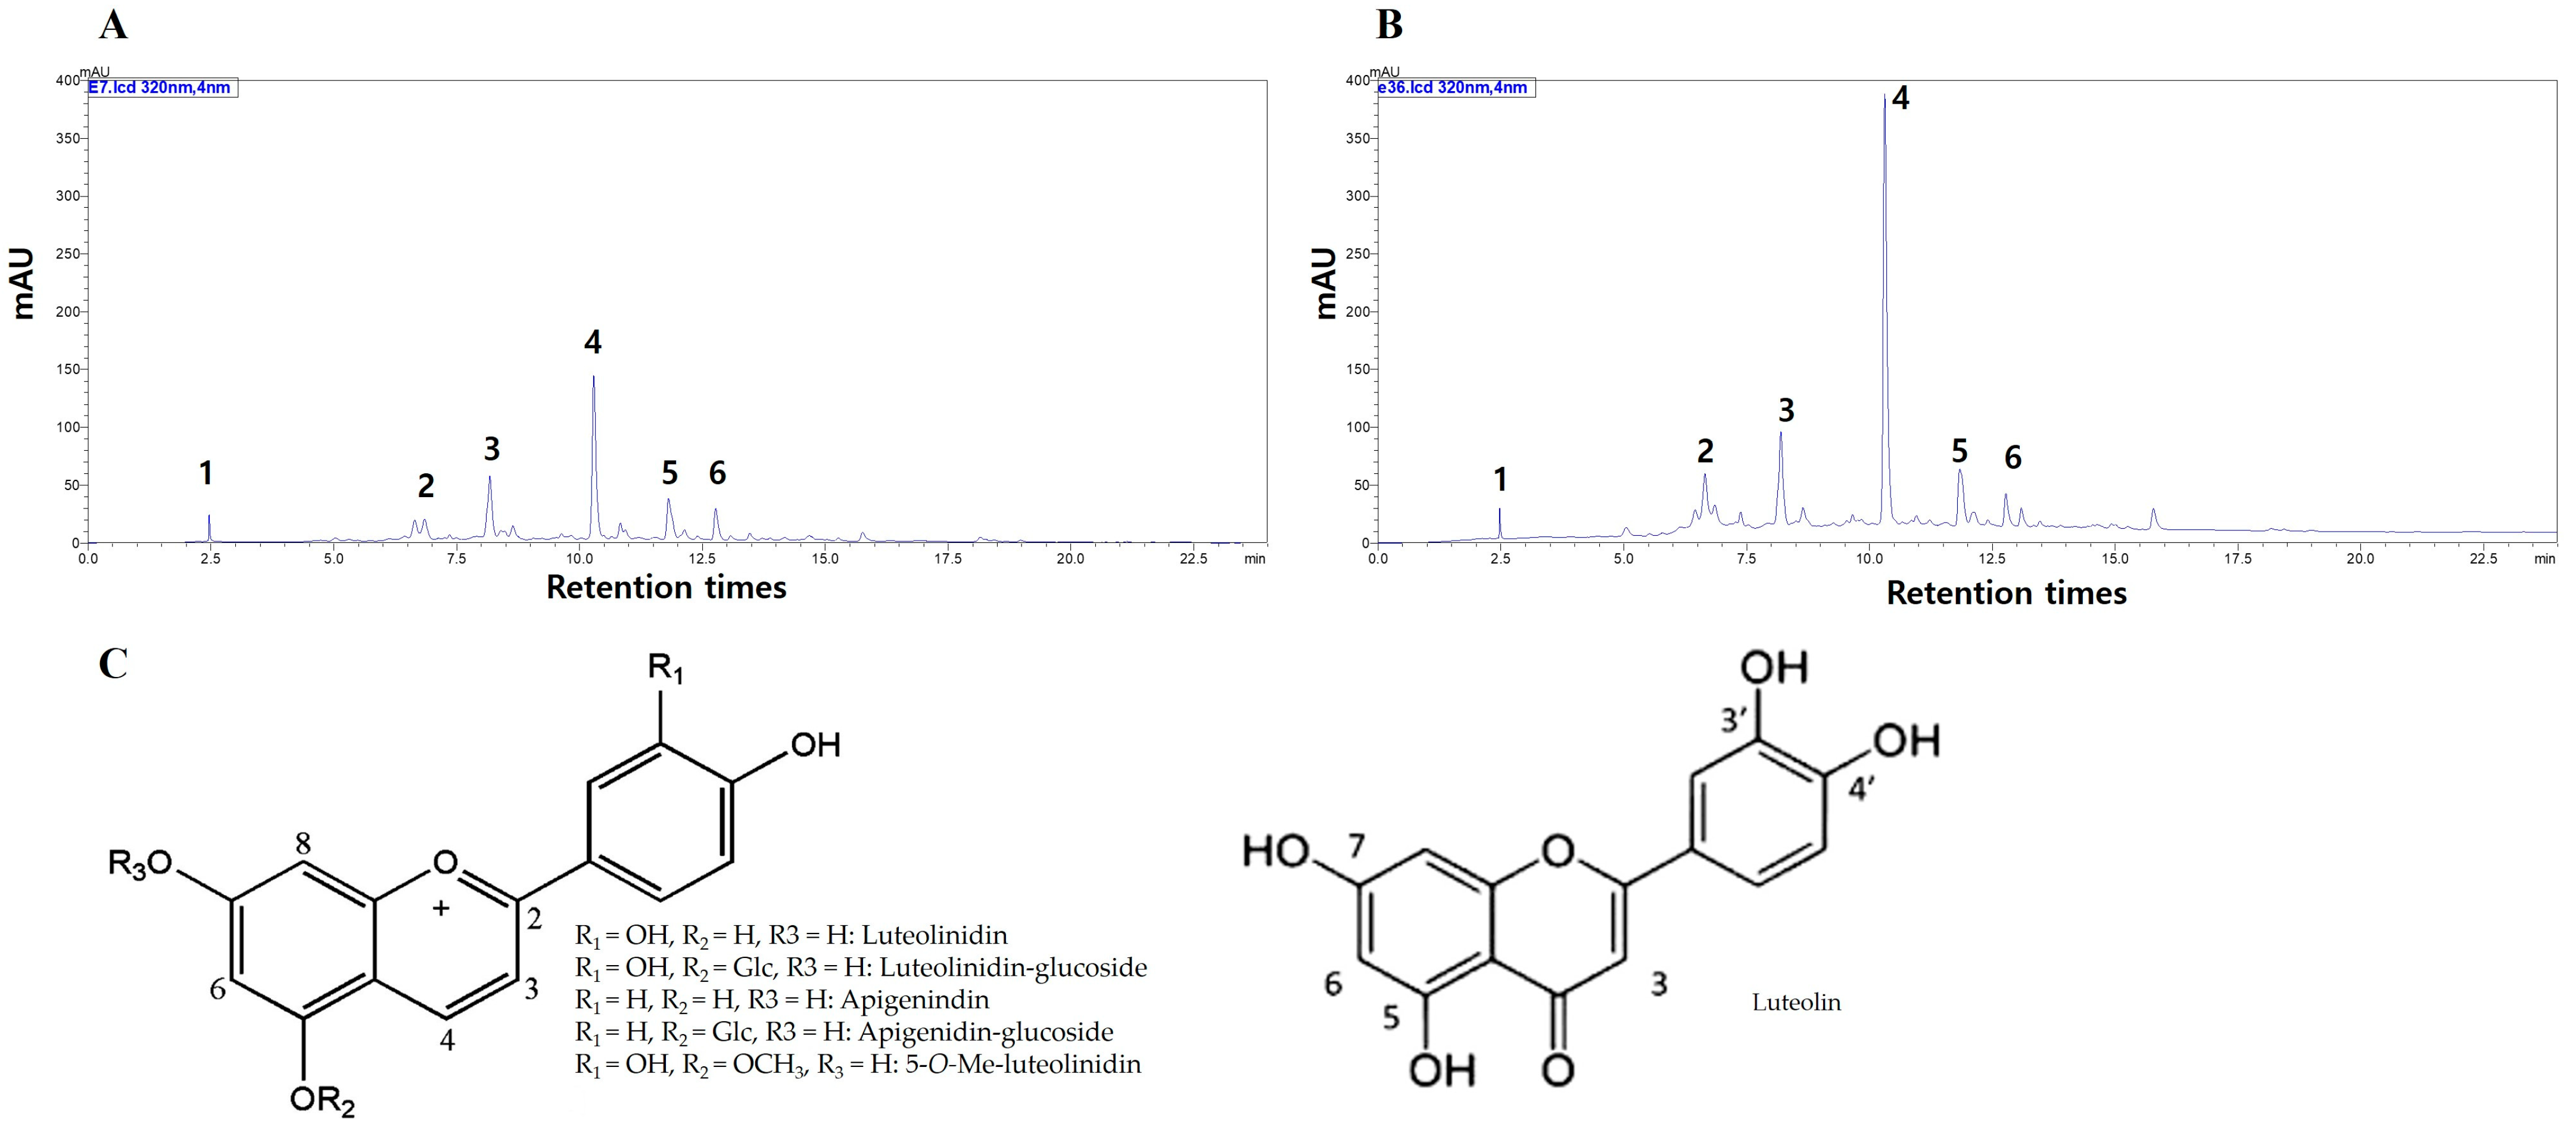
2.3. Ultra-High-Performance Liquid Chromatography (UPLC) Analysis

At seed harvest dates, whole-plant samples (excluding panicles) were collected from 96 sorghum genotypes. Fifty grams of fresh samples were placed into a 1000 mL glass container with 100% ethanol and incubated at room temperature for 24 h. The extracts were then filtered through a 0.45 μm membrane filter using a syringe filter. The filtered samples were analyzed using a UPLC and a photodiode array detector (DAD; Agilent 1260 series; Agilent Technologies, Santa Clara, CA, USA) and a quadrupole liquid chromatograph/mass spectrometer (Agilent 6130; Agilent Technologies, Santa Clara, CA, USA) equipped with an XR-ODS column (3.0 × 100 mm, 1.8 μm, Shimadzu, Japan) and a compatible C18 guard column (4 × 3 mm id.; 3 µM particle size; Phenomenex, Torrance, CA, USA). The mobile phase was composed of water (solvent A, containing 0.05% formic acid) and acetonitrile (solvent B, containing 0.05% formic acid). The gradient program was 0–3 min, 95% A and 5% B; 3–8 min, 100% B; and 18–24 min, 100% A. The flow rate of the mobile phase was adjusted to 0.5 mL/min and the column temperature was set to 40 °C. The injection volume was 10 µL. The optimal atmospheric pressure ionization–electrospray ionization parameters were set. The detection of total phenolic content was performed at 320 nm. For the quantification of total phenolic content, a standard compound (luteolinidin; Sigma Aldrich Co., St Louis, MO, USA) was dissolved in 80% ethanol (v/v). Luteolinidin diglucoside, luteolin glucoside, apigeninidin glucoside, luteolinidin, apigeninidin, and 5-O-Me-luteolinidin were identified using the method described in a previous study [31].

2.4. Genotyping-by-Sequencing Analysis

Genotypic data from all 96 samples were obtained using a genotyping-by-sequencing (GBS) strategy. GBS libraries were constructed using the restriction enzyme Apek I, and barcoded adapters were ligated to the digested fragments. Supplementary Table S1 lists the 96 barcode sequences used to tag the samples. The appropriate adapter concentration was determined and used to construct the library according to the GBS protocol, with minor modifications [23]. The GBS library was sequenced using the Illumina HiSeq X Ten platform by SEEDERS Co. (Daejeon, Republic of Korea). Demultiplexing was performed using the barcode sequences, and adapter sequences were removed. Low-quality sequences were trimmed using cut adapt (version 1.8.3) for adapter trimming and DynamicTrim and LengthSort of SolexaQA (version 1.13) for sequence quality trimming [32,33]. The retained clean reads for each sample were aligned to the Sorghum bicolor Rio_v2.1 reference genome using BWA software (version 0.7.17-r1188), and the alignment files were converted to BAM files using SAMtools software (version 0.1.16) [34,35,36]. Before raw SNP detection, SNP validation was performed using an in-house script developed by SEEDERS [37]. The SNPs were functionally and structurally annotated using the SnpEff tool (version 4.3) and the annotated sorghum genome available in the Phytozome database (https://phytozome-next.jgi.doe.gov/, accessed on 16 January 2023) [38]. The SNP positions were classified as either intergenic or genic regions based on the position information of the reference genome. The genic regions were further classified into CDS or intron regions. Common SNPs from the reference sequence were selected to separate genotypes in the SNP matrix, and polymorphic SNPs were selected by comparing the common SNPs with the base sequence of each Sorghum bicolor Rio_v2.1 genotype.

2.5. Genome-Wide Association Study (GWAS) with Agronomic Traits and Phenolic Compounds

For the GWAS analysis, a total of 192,040 filtered SNPs with a minor allele frequency greater than 5% and missing data lower than 30% were used. BLINK, Farm CPU, MLMM, and MLM were used to perform GWAS analysis, with all parameters set to default values in the genomic association and prediction integrated tool (GAPIT) R package [39]. The type I error significance threshold p-value was set to 0.0001 for this study [40]. Significant SNPs were classified based on their p-values using the quantile-quantile plot and Manhattan plot. Among these, important SNPs located in genic regions were reselected, excluding intergenic regions. Genomic position and candidate gene information were obtained from the NCBI database (https://www.ncbi.nlm.nih.gov, accessed on 16 January 2023) using the reference genomes Sorghum bicolor Rio_v2.1 and OZ sorghum (https://aussorgm.org.au, accessed on 16 January 2023).

3. Results

3.1. Subsection Agronomic Traits in Sorghum Genotypes

Descriptive statistics were conducted on four agronomic traits (HD, PH, SC, and DY) in 96 sorghum genotypes (Table 1). HD ranged from a minimum of 58.0 days (Banwoldang-7) to a maximum of 115.0 days (Pioneer-931), with an average of 87.8 days. PH varied from a minimum of 89.0 cm (Dansusu 2-8) to a maximum of 465.0 cm (DINE-A-MITE-1), with an average of 282.0 cm. SC ranged from a minimum of 5.0 brix° (IS5718 and Dansusu 2-8) to a maximum of 18.8 brix° (Dansusu1 and Dansusu4), with an average of 13.4 brix°. DY ranged from a minimum of 2.4 tons/ha (Dansusu 2-8) to a maximum of 26.1 tons/ha (IS645-3 and Moktak-2), with an average of 13.0 tons/ha. The four agronomic traits had continuous variation according to their kurtosis and skewness values (Table 2).

3.2. UPLC Analysis in Sorghum Genotypes

The total phenolic content (TPC) of the sorghum lines is shown in Table 1. Detailed information on the six phenolic compounds is presented in Table S2. The UPLC chromatograms revealed the presence of six peaks (Figure 1). Six phenolic contents—luteolinidin diglucoside, luteolin glucoside, apigeninidin glucoside, luteolinidin, apigeninidin, and 5-O-Me-luteolinidin—were isolated. The six types of phenolic contents were as follows: luteolinidin diglucoside, ranging from 0.09 (Ikumba) to 0.46 mg/100 g (Banwoldang), with an average of 0.23 mg/100 g. Luteolin glucosides varied from 0.00 (Sorghum-medovoe, etc.) to 1.24 mg/100 g (Pahat-5), with an average of 0.30 mg/100 g. The range of apigeninidin glucoside was from 0.02 (Dansusu2-10) to 1.18 mg/100 g (Bitjaru), with an average of 0.40 mg/100 g. Luteolinidin varied from 0.06 (Pahat-4, Figure 2A) to 5.20 mg/100 g (High-land-sweet, Figure 2B), with an average of 1.64 mg/100 g. The range of apigeninidin was from 0.00 (Dansusu2-12) to 0.75 mg (Bitjaru), with an average of 0.32 mg/100 g. The 5-O-Me-luteolinidin varied from 0.01 (Dansusu2-12) to 0.43 mg/100 g (High-land-sweet), with an average of 0.21 mg/100 g. Total phenolic content ranged from 1.92 (Pahat-4) to 13.10 mg/100 g (IS645-2, Figure 1B), with an average of 6.37 mg/100 g. IS645-2 increased TPC by 6.43 mg/100 g compared to the original cultivar (Figure 1B). Luteolinidin accounted for the largest proportion (26.8%) of TPC. The phenolic compounds showed continuous variations with a normal distribution according to skewness and kurtosis (Figure 2C, Table 3).

3.3. Correlation Analysis

To compare the correlation between agronomic and phytochemical traits, we analyzed Pearson’s pairwise correlation coefficient between four agronomic traits (HD, PH, SC, and DY) and phenolic compounds (TPC, luteolinidin diglucoside, luteolin glucoside, apigeninidin glucoside, luteolinidin, apigeninidin, and 5-O-Me-luteolinidin) in the 96 sorghum lines (Figure 3). Strong positive correlations were shown between PH and DY (r = 0.60, p < 0.001). In comparing the correlations between TPC and the six phenolic compounds, they showed positive correlations overall, except for those between luteolin glucoside and luteolinidin diglucoside. Strong positive correlations were seen between TPC and luteolinidin (r = 0.82, p < 0.001), apigeninidin glucoside and apigeninidin (r = 0.79, p < 0.001), and luteolinidin and apigeninidin (r = 0.75, p < 0.001).

3.4. Genotyping-by-Sequencing of Sorghum Genotypes

The GBS library was constructed from 37 genetic resources and 59 sorghum mutant lines that were sequenced using the Illumina HiSeq X Ten platform. A summary of these sequencing results is in Table 4. In total, 684 million reads comprising 103,348,422,063 nucleotides (103.3 Gb) were generated, with 7.1 million reads (1.0 Gb) per genotype on average. After removing low-quality sequences, 620,196,808 clean reads remained, with 6.4 million reads per genotype on average. The total length range of clean reads was between 98.4 Mb and 2818.9 Mb, with an average read length of 673.3 Mb. The total number of mapped reads was 599,168,188 in all lines, with an average of 6,241,335 reads per sample. The mapped read rates (%) ranged from 91.76% to 97.84%. On average, 96.69% of the filtered reads were mapped to the reference genome sequence. The total length of the mapped region was 4968.2 Mb, with an average of 51.7 Mb per sample, which covered approximately 7.09% of the reference genome sequence. Among the 96 lines, the average depth of the mapped region ranged from 5.00 to 30.17, with an average of 10.27 (Table S1).

3.5. Identification of SNPs

The SNPs for each line were selected from the filtered SNPs in the matrix position between sorghum lines and the reference genome sequence (Table S3). A total of 10,369,812 SNPs ranged from 22,737 (IS2868-1) to 201,950 SNPs (IS14131), with an average of 108,019 SNPs. A total of 192,040 SNPs were identified in the genotypes of the 96 sorghum lines using the GBS approach (Table 5). The chromosome length ranged from 60 million (chromosome 9) to 89 million (chromosome 2). The number of SNPs varied from 13,830 (chromosome 7) to 25,265 (chromosome 1). The highest SNP density was observed on chromosome 1 with 310.0 SNP markers per 1 Mb, whereas the lowest density was on chromosome 7 with 196.8 SNP markers per 1 Mb. The average density was 246.7 markers per 1 Mb. The highest SNP frequency was observed on chromosome 7 with 5.08 kb per SNP, whereas the lowest frequency was on chromosome 1 with 3.23 kb per SNP. The average frequency was 5.06 kb per SNP. The SNPs in the sorghum lines were functionally annotated using the reference genome sequence. Most of the SNPs (82,279; 42.84%) were in genic regions, but a few were in intergenic regions (109,761; 57.16%). In terms of the genic region, the distribution of SNPs in the exon, CDS (35,499; 43.14%), introns (31,041; 37.73%), exon (14,727; 17.90%), exon and intron (517; 0.63%), and exon, CDS, and intron (495; 0.60%) was determined (Table S4).

3.6. GWAS Analysis for Agronomic Traits

A total of 34 significant SNPs (−log10(p) > 4.0) were detected in three agronomic traits (HD, PH, and DY) for the 96 sorghum genotypes using GWAS analysis of the GBS combined dataset (Table S5). In SC, there was not detected a significant SNP of −log10(p) value of more than 4.0. Of the 34 significant SNPs, 9 SNPs (HD, 4 SNPs; PH, 3 SNPs; and DY, 2 SNPs) were co-detected in more than two models (Table 6, Figure S1). We annotated the significant SNPs in HD, PH, and DY. The four SNPs for HD (−log10(p)= 4.15–4.93) that were located in the exon and CDS on chromosomes 2, 6, and 10 were Sb02_6876523, Sb02_6876524 (SbRio.02G064100; benzyl alcohol O-benzoyltransferase), Sb06_8705823 (SbRio.06G036000; endo-1,4-beta-xylanase 4-like isoform X2), and Sb10_7471984 (SbRio.10G099600; galactoside2-alpha-L-fucosyltransferase-like isoform X2). The three SNPs for PH (−log10(p) = 4.12–11.70) were located in the exon and CDS on chromosomes 7, 8, and 9: Sb07_53523852 (SbRio.07G123800; nudix hydrolase 15, mitochondrial), Sb08_63291752 (SbRio.08G141500; hypothetical protein BDA96_08G141500), and Sb09_50399847 (SbRio.09G149200; hypothetical protein BDA96_09G149200). The two SNPs for DY (−log10(p) = 4.20–6.82) were located in the intron, exon, and CDS on chromosomes 4 and 8: Sb04_2143594 (SbRio.04G031300; beta-amylase 8 isoform X2) and Sb06_62687750 (SbRio.06G211400; transcription factor MafB). Of the nine SNPs associated with agronomic traits, Sb10_7471984 was the only one co-detected in all four GWAS models. The effect of the allele was estimated for the SNP marker with the lowest p-value for each agronomic trait. The HD-associated SNP marker Sb10_7471984 on chromosome 10 had the alleles A/G, and the average HD for the individuals with GG alleles was 84 days, 15 days shorter than the average HD for the individuals with AA alleles (99 days). The PH-associated SNP marker Sb09_50399847 on chromosome 9 had the alleles G/A, and the average PH for the individuals with AA alleles was 305 cm, which was 134 cm longer than the average PH for the individuals with GG alleles (171 cm). The DY-associated SNP marker Sb04_2143594 on chromosome 4 had the alleles G/C, and the average DY for the individuals with CC alleles was 11.60 tons per ha, which was 7.58 tons per ha lighter than the average DY for individuals with GG alleles (19.18 tons/ha) (Figure 4). Phenotypic differences between alleles for the detected SNPs in Table 6 are shown in Figure S3.

3.7. GWAS Analysis for Total Phenolic Content

A total of 117 significant SNPs (−log10(p) > 4.0) were detected in TPC and 6 phenolic compounds (luteolinidin diglucoside, luteolin glucoside, apigeninidin glucoside, luteolinidin, apigeninidin, and 5-O-Me luteolinidin) for the 96 sorghum genotypes using GWAS analysis of the GBS combined dataset (Table S6). Of the 117 significant SNPs, 31 SNPs (TPC, 6 SNPs; luteolinidin diglucoside, 8 SNPs; luteolin glucoside, 4 SNPs; apigeninidin glucoside, 8 SNPs; luteolinidin, 3 SNPs; and 5-O-Me luteolinidin, 2 SNPs) were co-detected in more than two models and involved two phenolic compounds (Table 7, Figure S2). We annotated the significant SNPs of TPC and five phenolic compounds. In apigeninidin, no SNPs were identified as being co-detected in more than two models. The three SNPs for TPC (−log10(p) = 4.03–14.04) were located in the intron, exon, and CDS on chromosomes 2 and 4: Sb02_81797062 (SbRio.02G343600; ethylene receptor 4), Sb04_1305322 (SbRio.04G019000; choline/ethanolaminephosphotransferase 1), and Sb04_64461978 (SbRio.04G361300; glycosyltransferase family protein 2). The seven SNPs for luteolinidin diglucoside (−log10(p)= 4.04–22.41) were located in the intron, exon, and CDS on chromosomes 2, 4, and 6: Sb02_79905727 (SbRio.02G316600; NEP1-interacting protein-like 1), Sb04_59016630 (SbRio.04G289300; glutamic acid-rich protein-like isoform X1), and Sb06_59065337, Sb06_59065351, Sb06_59065380, and Sb06_59065407 (SbRio.06G167800; Wall-associated receptor kinase 4). The four SNPs for luteolin glucoside (−log10(p) = 4.01–4.27) were located in the exon and CDS on chromosomes 1, 3, and 5: Sb01_14431763 (SbRio.01G175100; ARM repeat superfamily protein, calcium-transporting ATPase 3; plasma membrane-type), Sb03_4939603 (SbRio.03G056200; hypothetical protein BDA96_03G056200), and Sb05_9038134 and Sb05_9038126 (SbRio.05G076500; probable kinase CHARK). The eight SNPs for apigeninidin glucoside (−log10(p) = 4.08–11.40) were located in the intron, exon, and CDS on chromosomes 1, 3, 6, and 10: Sb01_1229036, Sb01_1229046 (SbRio.01G011000; U2 small nuclear ribonucleoprotein A’), Sb03_68395304 (SbRio.03G375900; ruvB-like protein 1), Sb03_68358847 and Sb03_68358815, and Sb03_68358771 (SbRio.03G375100; protein GPR107), Sb06_55785073 (SbRio.06G125400; disease resistance protein Pik-1), and Sb10_4609482 (SbRio.10G064200; proteasome subunit alpha type-4-2). The one SNP for luteolinidin (−log10(p) = 4.23–4.98) was located in an exon on chromosome 2: Sb02_81797139 (SbRio.02G343600; ethylene receptor 4). The two SNPs for 5-O-Me luteolinidin (−log10(p) = 4.23–7.23) were located in the intron, exon, and CDS on chromosomes 6 and 8: Sb06_68347889 (SbRio.06G295300; multiple RNA-binding domain-containing protein 1) and Sb08_65531987 (SbRio.08G160200; Os04g0380500). Notably, a total of four SNPs were identified to contribute to two phenolic compounds, three of which contributed to TPC and luteolinidin and one to TPC and luteolinidin diglucoside (Table S6). SNPs Sb02_81796960, Sb02_81797062, and Sb02_81797139, which contribute simultaneously to TPC and luteolinidin, were located at 81,796,960 to 81,797,139 bp and encode candidate gene SbRio.02G343600 that functions as ethylene receptor 4. SNP Sb04_56584914, which contributes simultaneously to TPC and luteolinidin diglucoside, was located at 56,584,914 bp and encodes candidate gene SbRio.04G259800 that functions as pyruvate dehydrogenase E1 component subunit alpha-1, mitochondrial. Allele effects were estimated for SNP markers, with the lowest p-values for SNPs involved in two compounds. The TPC and luteolinidin diglucoside-associated SNP marker Sb04_56584914 on chromosome 4 had the alleles C/G, and the average TPC and luteolinidin diglucoside for the individuals with GG alleles were 5.98 and 0.21 mg/100 g, which were 3.46 and 0.11 mg/100 g lower than the average TPC and luteolinidin diglucoside for the individuals with CC alleles (TPC, 9.44 mg/100 g; luteolinidin diglucoside, 0.32 mg/100 g), respectively. The TPC and luteolinidin-associated SNP marker Sb02_81797062 on chromosome 2 had the alleles A/G, and the average TPC and luteolinidin for the individuals with GG alleles were 5.82 and 1.38 mg/100 g, which were 1.30 and 0.54 mg/100 g lower than the average TPC and luteolinidin for the individuals with AA alleles (TPC, 7.12 mg/100 g; luteolinidin, 1.92 mg/100 g) (Figure 5), respectively. Phenotypic differences between alleles for the detected SNPs in Table 7 are shown in Figure S4.

4. Discussion

Sorghum cultivars have undergone improvements in yield and quality thanks to modern breeding concepts and technologies. However, there is an urgent need to accelerate the breeding of bioenergy or bioplastic sorghum varieties that possess high biomass, energy conversion efficiency, sugar content, and juiciness [1,2,3,4]. Meeting industrial requirements for sorghum biomass yield necessitates high sugar contents, and this has been recognized by various breeders [2,3]. Mutation breeding has emerged as a powerful tool for developing elite cultivars by augmenting genetic variation in terms of both qualitative and quantitative traits [41]. Radiation-based mutation breeding has the potential to improve a wide range of agronomic characteristics in sorghum, including heading date, seed maturity, and other yield-related traits [42]. Previous studies on mutation breeding have demonstrated that gamma rays can successfully induce mutations in quantitative traits of sorghum, such as increased grain and biomass yields, as well as improved nutritional value for food and fodder quality [43]. In our study, we found that the DINE-A-MITE-1 (PH), IS645-3, and Moktak-2 (DY) lines displayed high biomass production. These findings suggest that these mutant lines could serve as valuable materials for developing novel sorghum cultivars.
HD, PH, SC, and DY are crucial agronomic characteristics that affect the practical breeding and crop yield of sorghum. In this study, we observed HD (58.0–115.0 days), PH (89.0–465.0 cm), SC (5.0–18.8 brix°), and DY (2.37–26.07 tons/ha) in 37 sorghum genetic resources and 59 mutant lines (Table 1). In a previous study by Kawahigashi et al. (2013), HD (64.0–114.0 days), PH (68.2–342.4 cm), and SC (2.2–20.5 brix°) were reported in 109 sorghum accessions from India and Japan [4]. Additionally, Shiringani and Friedt (2011) reported a DY range of 2.56–15.86 tons per ha in their study, indicating that agronomic traits are closely related to biomass in sorghum [2]. In our study, we selected sorghum lines with superior agronomic characteristics to serve as high biomass sources.
Plant height and flowering time have already been considered in grain sorghum production at temperate altitudes, and significant QTLs and/or genes controlling PH and flowering have been identified, but the relationship between PH, photoperiod response, and sorghum development is poorly understood [44,45]. Furthermore, the complex inheritance of juice accumulation in sorghum is also far from understood. Although dry yield can control the juicy content in sorghum, its regulation network is unknown yet. Grain sorghums that have juicy stems usually vary in their final grain yields, but it is not clear whether this is related to dry yield [46]. In addition, late maturing has been an essential trait in sorghum breeding, and B35, SC56, and E36-1 are generally recognized as late-heading sorghums [47]. Although many green genetic loci, including the major four stay-green QTLs (Stg1, Stg2, Stg3, and Stg4), have been identified, the causal genes have not been cloned yet [48,49]. More recently, Kiranmayee et al. (2020) identified seven QTLs and several candidate genes controlling the stay-green trait in a FINE-mapping population, which provides a reliable experimental and theoretical basis for understanding the mechanism of stay-green [50]. In the future, in-depth investigations should be performed in terms of unraveling the phenotypic variations and genetic variations, as well as characterizing the novel alleles of important genes, molecular modules (MMs), and the functional networks conferring important agronomic traits. Further, targeting of the incorporation of these super alleles of specific genes and functional MMs into superior lines could potentially develop improved varieties. In biomass sorghum, the breeding goal is to increase PH and DY while reducing the vegetative growth period. In this study, the major alleles of HD-, PH-, and DY-associated SNPs detected in 96 sorghum genotypes were associated with reduced heading date, lower dry yield, and increased plant height (Figure 4). When we compared the alleles of each trait to the sorghum reference genome (Sorghum bicolor Rio_v2.1), we discovered that many mutant lines had alternative alleles, indicating that mutant breeding has the potential to provide diversity in breeding materials.
Sorghum is a promising biomass crop for producing polyhydroxyalkanoates (PHA) due to its high yield of green biomass, drought tolerance, short growth period, and adaptability to different soil conditions and climates [51]. Furthermore, sorghum is a lignocellulosic crop consisting of lignin and polysaccharides (cellulose and hemicellulose), making it an excellent feedstock for fermentable sugar [52]. However, pretreatment such as hydrolysis is necessary to use lignocellulose efficiently. During hydrolysis and pretreatment, phenolic compounds may severely inhibit microbial growth and bioproduct production, leading to low biomass conversion efficiency [21]. Total phenolic content (TPC) in sorghum stems, including leaves, was identified by UPLC in this study to understand its potential negative impact on pretreatment and subsequent processes in utilizing lignocellulose as biomass. The UPLC analysis revealed that Pahat-4 exhibited the lowest TPC (1.92 mg/100 g), indicating that this line could serve as a potential breeding material for phytochemical sorghum biomass. Therefore, TPC could be considered an important trait in sorghum biomass breeding programs. However, high TPC levels in biomass sorghum may not be advantageous as a breeding material. The study also found that major alleles of SNPs associated with TPC and phenolic compounds in 96 sorghum genotypes were linked to increased TPC and phenolic compounds (Figure 5). These findings could help identify key genetic resources for biomass sorghum breeding.
Using the 109 accessions of sorghum, Kawahigashi et al. (2013) reported that a relatively positive correlation was found in PH and DY (r = 0.323, p < 0.01), HD and PH (r = 0.358, p < 0.01), and SC and DY (r = 0.673, p < 0.01) [4]. Our studies showed a positive correlation between PH and DY (r = 0.60, p < 0.001), HD and PH (r = 0.40, p < 0.001), and SC and DY (r = 0.23, p < 0.01), stronger than that shown by Kawahigashi et al. (2013) [4]. As a result of the correlation analysis between TPC and the six phenolic compounds, TPC and luteolinidin showed the highest correlation (r = 0.82, p < 0.001). This research showed that luteolinidin in TPC was the highest at 26.8%. This means that luteolinidin is highly involved in TPC. Similarly, Petti et al. (2014) analyzed 3-deoxy anthocyanidins in the red leaf (RG) and found that luteolinidin (68%) was the highest [31]. This study demonstrated that the HD of sorghum had a positive correlation with PH and DY. In addition, it was shown that there was a significant correlation between DY and PH and SC. In phytochemicals, there was a strong correlation between TPC and luteolinidin. Our findings indicate a correlation between agronomic traits and phenolic compounds that will be advantageous for breeding programs focused on enhancing biomass production in sorghum.
We identified SNPs in 96 sorghum genotypes using GBS data, obtaining approximately 719 million reads with an average of 246.7 SNPs per Mb (ranging from 196.8 on chromosome 7 to 310.0 on chromosome 1) (Table 5). In a previous study by Li et al. (2018), SNPs were identified in 245 sorghum accessions using GBS, generating approximately 36 million reads less than our study [53]. In a study by Li et al. (2018), the SNP density varied from 92.91 (chromosome 7) to 150.31 (chromosome 3) SNPs per Mb (an average of 124.04) [54]. Our study showed about twice the number of reads in all chromosomes compared to the results of Li et al. (2018) [53]. This finding will be beneficial for detecting significant SNPs related to agronomic traits and phytochemicals in GWAS analyses.
In this study, we conducted GWAS analyses for three agronomic traits (HD, PH, and DY) and six phenolic compounds (TPC, luteolinidin diglucoside, luteolin glucoside, apigeninidin glucoside, luteolinidin, and 5-O-Me luteolinidin) using four models (BLINK, FarmCPU, MLMM, and MLM). A total of 40 SNPs on 10 chromosomes were found to be highly associated with three agronomic traits (9 SNPs) and six phenolic compounds (31 SNPs) (Table 6 and Table 7). We identified four candidate SNPs for HD on chromosomes 2, 6, and 10. The two SNPs (Sb02_6876523, −log10(p) = 4.15 and Sb02_6876524; −log10(p) = 4.15) identified on chromosome 2 encode a candidate gene, SbRio.02G064100 (6,875,288–6,876,924), that functions as a benzyl alcohol O-benzoyltransferase (BEBT). The BEBT gene has not been reported in sorghum, but it is expressed in various tissues, including leaves, stems, and flowers, and its expression can be regulated throughout the plant life cycle [54]. It has also been reported to play an important role in plant defense against herbivores. The HD-associated SNP Sb06_8705823 (−log10(p) = 4.16) was on chromosome 6 and encoded SbRio.06G036000 (8,702,846–8,706,870), which functions as endo-1,4-beta-xylanase 4-like isoform X2. The function of the endo-1,4-beta-xylanase 4-like isoform is to hydrolyze the beta-1,4 linkages between xylose units in xylan, producing shorter xylooligosaccharides (XOS) and xylose monomers in sorghum [55]. This process is important for the degradation of plant cell walls, but there is no direct relationship between endo-1,4-beta-xylanase and its 4-like isoform. The SNP marker Sb10_7471984 was selected for HD, and the gene SbRio.10G099600 (7,471,439–7,474,862) was detected as a strong candidate gene. SbRio.10G099600 encodes the galactoside 2-alpha-L-fucosyltransferase (FUT1) gene. FUT1 is involved in cell wall biosynthesis, which plays a crucial role in plant development, disease resistance, and signal transduction [56]. This marker showed the highest −log10(p) = 4.20–4.93 for HD (Table 6); the variance between the major and minor alleles for HD was as high as 15 days (Figure 4).
In a GWAS of NAM families, Mace et al. (2013) found a significant QTL (QDTFL10.9; 7,404,486–7,843,453; −log10(p) = 3.09) for days to flowering on chromosome 10 [57]. The SNPs we identified belonged to the Mace et al. (2013) QTL region [57]. In addition, Sb10_7471984 was the only agronomic-trait-related SNP co-detected in four GWAS models. Therefore, we suggest that Sb10_7471984 is a significant SNP involved in HD. We identified three PH-related SNPs (Sb07_53523852, −log10(p) = 4.12–4.18; Sb08_63291752, −log10(p) = 7.80–8.08; and Sb09_50399847, −log10(p) = 5.77–11.70) that were located in SbRio.07G123800 (53,519,727–53,524,825), SbRio.08G141500 (63,291,201–63,292,248), and SbRio.09G149200 (50,399,626–50,401,297) on chromosomes 7, 8, and 9, respectively. Madhusudhana and Patil (2013) identified a PH-associated QTL (QHGHT7.14; 50,987,537–56,527,686; LOD = 3.7) on chromosome 7 using the RIL population (‘296B’ × ‘IS18551′), and Sb07_53523852 was located in the same region [44]. Sb08_63291752 and Sb09_50399847 encoded hypothetical proteins whose functions were unknown. However, Sb09_50399847 was in the same region as the QTL (QDTFL9.14; 49,467,769–53,919,120; LOD = 4.2) in a study by Kong et al. (2013), and this QTL was associated with maturity [45]. In addition, this marker had the highest −log10(p) = 5.77–11.70 for PH, with a difference of 99 days between the major and minor alleles (Figure 4). Thus, we selected SNP marker Sb09_50399847 for PH, and SbRio.09G149200 was detected as a candidate gene. In this study, we detected two SNPs for DY on chromosomes 4 and 6. We identified a candidate SNP for DY (Sb04_2143594; −log10(p) = 4.40–6.82) that was located in SbRio.04G031300 (2,139,572–2,145,536) on chromosome 4. Ortiz et al. (2017) detected significant SNPs for cold tolerance and photosynthesis on chromosome 4 (QPSII4.11; 2,006,688–2,158,867; p = 7.09 × 10⁵; QLFTE4.1; 2,116,548–2,268,727; p = 1.00 × 10⁴) in a sorghum association panel, and our SNPs were located within that region [58]. We detected one novel SNP. The novel SNP (Sb06_62687750; −log10(p) = 4.20–6.08) was located in SbRio.06G211400 (62,686,769–62,688,489) on chromosome 6, which is the region related to transcription factor MafB (v-maf musculoaponeurotic fibrosarcoma oncogene homolog B). MAFB is a Maf transcription factor encoding the bZIP (basic bucine zipper) protein. The bZIP protein regulates various plant-specific phenomena, including germination, seed maturation, photomorphogenesis, and floral induction and development [59,60]. It is also involved in biotic and abiotic stress responses through the ABA signal transduction pathway [60]. The SNP marker Sb06_62687750 for DY was selected based on the gene’s function, and SbRio.06G211400 was detected as a candidate gene. Our agronomic-trait-related GWAS results suggest that genes in SbRio.10G099600 (HD), SbRio.09G149200 (PH), and SbRio.06G211400 (DY) can be utilized as important molecular markers for plant breeding programs targeting trait improvement and biomass materials. The GWAS analysis of grain- and biomass-related plant architecture traits in sorghum identified 101 SNPs associated with at least one of the nine traits, and KS3, a GA biosynthetic gene that is located in a significant genetic locus on chromosome 6, was associated with seed number [61]. Recently, a large-scale GWAS of a panel of 837 sorghum accessions and a BC-NAM population of 1421 individuals dissected 81 QTLs related to grain size [62]. Since the agronomical traits of cereal crops have a similar physiological basis, further comparative studies of different cereal crops can facilitate the research of the genetic basis of sorghum grain yield.
The GWAS analysis of TPC and six phenolic compounds revealed four SNPs associated with two compounds, and we selected them as candidate SNPs for phenolic compounds. Three candidate SNPs (Sb02_81796960, Sb02_81797062, and Sb02_81797139) contributed to TPC and luteolinidin, and they are novel SNPs located in regions that have not been previously reported. These SNPs co-localize in SbRio.02G343600 (81,787,329–81,797,324) on chromosome 2, which encodes the ethylene receptor 4 (LeETR4) gene. LeETR4 is an ethylene negative regulator and belongs to the ethylene receptor subfamily II [63]. The expression of LeETR4 has been found to be inversely related to ethylene sensitivity, indicating that the receptor can regulate ethylene response [64,65]. This suggests that LeETR4 may play a role in controlling the synthesis of phenylpropanoid compounds, including flavonols, which are synthesized by genes such as CHS, CHI, and FLS, as these genes are known to be induced by ethylene [66]. The fact that these three SNPs contribute to both TPC and luteolinidin is likely due to the strong positive correlation observed between these two compounds (r = 0.82, p < 0.001) (Figure 3). Furthermore, among the three SNPs, Sb02_81797062 had the highest −log10(p) values of 6.55–14.04 for TPC and 4.58 for luteolinidin (Table 7). The difference in TPC and luteolinidin between the major and minor alleles of this SNP was 5.82 and 1.38 mg/100 g, respectively. (Figure 5). Therefore, the three novel SNP markers found in this study are thought to be closely related to TPC and luteolinidin. We suggest that SNP markers Sb02_81796960, Sb02_81797062, and Sb02_81797139 for TPC and luteolinidin and the gene SbRio.02G343600 were detected as strong candidate genes. Candidate SNP Sb04_56584914, which contributes simultaneously to TPC and luteolinidin diglucoside, was located in SbRio.04G259800 (56,584,076–56,588,610) on chromosome 4, which encodes pyruvate dehydrogenase E1 component subunit alpha-1, mitochondrial (PDHA1). PDHA1 is a protein that participates in the conversion of pyruvate to acetyl-CoA within the pyruvate dehydrogenase complex (PDC), a critical step in cellular respiration that occurs in the mitochondria of eukaryotic cells [67]. The E1 component of PDC is responsible for the first step in converting pyruvate to acetyl-CoA, and its expression and activity can affect the availability of acetyl-CoA, a precursor for flavonoid metabolites, and therefore impact the production of phenylpropanoids in plants [68,69]. The SNP marker Sb04_56584914 was identified as a strong candidate gene for TPC and luteolinidin diglucoside, and the gene SbRio.04G259800 was found to be associated with this marker. With a −log10(p) value of 4.06 for TPC and 4.40 for luteolinidin (Table 5), this marker had the highest significance for both compounds. Our results suggest that SbRio.02G343600 (LeETR) and SbRio.04G259800 are promising targets for plant breeding programs aimed at developing crops with improved flavonoid compounds, which could have applications in the food and feed industries or in the production of biomass products. These findings are likely to aid in the precise breeding of agronomic and phytochemical traits in sorghum. To better understand the genetic basis of bioenergy-related traits in sorghum, Brenton et al. (2016) conducted a GWAS analysis on 390 diverse sorghum types, including sweet and biomass varieties, and discovered that non-fibrous carbohydrate accumulation was associated with cellulase enzymes and a vacuolar transporter [70]. In the realm of forage quality traits, Li et al. (2018) analyzed the crude protein, neutral detergent fiber, acid detergent fiber, hemicellulose, and cellulose contents of 245 sorghum lines, identifying 42 SNPs and 14 candidate genes [53]. Additionally, a recent GWAS of 206 forage sorghum accessions identified nine QTLs for lignin content, which covered 184 genes. Notably, 13 of the 184 sorghum lignin-related loci showed high collinearity with gene families reported in other crops [71]. These studies provide valuable information for the future genetic improvement of sorghum as a bioenergy and forage crop.

5. Conclusions

In this study, a GWAS analysis was conducted on a sorghum population comprising genetic resources and mutant lines for four agronomic traits (HD, PH, SC, and DY) and seven phenolic compounds (TPC, luteolinidin diglucoside, luteolin glucoside, apigeninidin glucoside, luteolinidin, apigeninidin, and 5-O-Me luteolinidin). The results showed significant variations in three agronomic traits (HD, PH, and DY) and six phenolic compounds (TPC, luteolinidin diglucoside, luteolin glucoside, apigeninidin glucoside, luteolinidin, and 5-O-Me luteolinidin) of 96 sorghum genotypes. The study demonstrated that GWAS is a powerful tool for identifying potential genetic factors that contribute to these important traits. Using 192,040 filtered SNPs obtained from GBS, significant association signals were detected for agronomic traits and phenolic compounds, except for SC and apigeninidin. A total of 40 SNPs were identified as highly associated with the investigated traits. We selected five strong candidate genes from the 40 significant SNPs, of which five genes (HD, SbRio.10G099600 (FUT1); PH, SbRio.09G149200; DY, SbRio.06G211400 (MAFB); TPC and luteolinidin, SbRio.02G343600 (LeETR4); and TPC and luteolinidin diglucoside, SbRio.04G259800 (PDHA1)) are thought to be closely related to each trait. These findings can improve the molecular breeding of sorghum populations and help develop new cultivars for biomass- and phytochemical-related breeding programs.

Supplementary Materials

The following supporting information can be downloaded at: https://www.mdpi.com/article/10.3390/agronomy13061449/s1, Figure S1: Manhattan and QQ plots for agronomic traits (HD, PH, and DY) in the sorghum genotypes using four GWAS models (BLINK, FarmCPU, MLMM, and MLM); Figure S2: Manhattan and QQ plots for phenolic compounds (TPC, luteolinidin diglucoside, luteolin glucoside, apigeninidin glucoside, luteolinidin, and 5-O-Me luteolinidin) in the sorghum genotypes using four GWAS models (BLINK, FarmCPU, MLMM, and MLM); Figure S3: Phenotypic differences between lines with different alleles (left, reference genome; right, alternative genome) for SNPs associated with heading date (HD), plant height (PH), and dry yield (DY); Figure S4: Phenotypic differences between lines with different alleles (left, reference genome; right, alternative genome) for SNPs involved phenolic compounds; Table S1: Results of genotyping-by-sequencing (GBS) analysis in sorghum; Table S2: Six phenolic compounds (luteolinidin diglucoside, luteolin glucoside, apigeninidin glucoside, luteolinidin, apigeninidin, and 5-O-Me luteolinidin) of the 96 sorghum genotypes used in this study; Table S3: Summary of total SNP numbers and alignment to the reference genome sequence; Table S4: List of filtered SNP matrix loci that were generated for 96 sorghum genotypes; Table S5: Significant SNPs associated with agronomic traits (HD, PH, and DY) based on the GWAS results; Table S6: Significant SNPs associated with phenolic compounds (TPC, luteolinidin diglucoside, luteolin glucoside, apigeninidin glucoside, luteolinidin, apigeninidin, and 5-O-Me luteolinidin) based on the GWAS results.

Author Contributions

Conceptualization: J.R., C.-H.B. and E.-S.R.; materials: J.R. and B.-K.H.; writing—original draft preparation: Y.-J.L. and W.J.K.; formal analysis: Y.-J.L., B.Y. and J.H.K.; investigation: J.K., S.-J.K., J.-W.A. and J.R.; writing—review and editing: J.R. and C.-H.B.; project administration: S.H.K.; funding acquisition: J.R. All authors have read and agreed to the published version of the manuscript.

Funding

This work was supported by the National Research Foundation of the Republic of Korea (NRF) grant funded by the Republic of Korea government (RS-2022-00156231).

Data Availability Statement

The original contribution presented in the study are publicly available.

Conflicts of Interest

The authors declare no conflict of interest.

References

  1. Habyarimana, E.; Laureti, D.; De Ninno, M.; Lorenzoni, C. Performances of biomass sorghum [Sorghum bicolor (L.) Moench] under different water regimes in Mediterranean region. Ind. Crops Prod. 2004, 20, 23–28. [Google Scholar] [CrossRef]
  2. Shiringani, A.L.; Friedt, W. QTL for fibre-related traits in grain × sweet sorghum as a tool for the enhancement of sorghum as a biomass crop. Theor. Appl. Genet. 2011, 123, 999–1011. [Google Scholar] [CrossRef] [PubMed]
  3. Habyarimana, E.; De Franceschi, P.; Ercisli, S.; Baloch, F.S.; Dall’Agata, M. Genome-wide association study for biomass related traits in a panel of Sorghum bicolor and S. bicolor × S. halepense populations. Front. Plant Sci. 2020, 11, 551305. [Google Scholar] [CrossRef]
  4. Kawahigashi, H.; Kasuga, S.; Okuizumi, H.; Hiradate, S.; Yonemaru, J.i. Evaluation of Brix and sugar content in stem juice from sorghum varieties. Grassl. Sci. 2013, 59, 11–19. [Google Scholar] [CrossRef]
  5. Shukla, S.; Felderhoff, T.J.; Saballos, A.; Vermerris, W. The relationship between plant height and sugar accumulation in the stems of sweet sorghum (Sorghum bicolor (L.) Moench). Field Crops Res. 2017, 203, 181–191. [Google Scholar] [CrossRef]
  6. Sabadin, P.; Malosetti, M.; Boer, M.; Tardin, F.; Santos, F.; Guimaraes, C.; Gomide, R.; Andrade, C.; Albuquerque, P.; Caniato, F. Studying the genetic basis of drought tolerance in sorghum by managed stress trials and adjustments for phenological and plant height differences. Theor. Appl. Genet. 2012, 124, 1389–1402. [Google Scholar] [CrossRef] [PubMed]
  7. Soleymani, A.; Shahrajabian, M.H.; Esfahan, I. The Effects of Fe, Mn and Zn Foliar Application on Yield, Ash and Protein Percentage of Forage Sorghum in Climatic Condition of Esfahan. Int. J. Biol. 2012, 4, 92. [Google Scholar] [CrossRef] [Green Version]
  8. Hassan, M.U.; Chattha, M.U.; Barbanti, L.; Mahmood, A.; Chattha, M.B.; Khan, I.; Mirza, S.; Aziz, S.A.; Nawaz, M.; Aamer, M. Cultivar and seeding time role in sorghum to optimize biomass and methane yield under warm dry climate. Ind. Crops Prod. 2020, 145, 111983. [Google Scholar] [CrossRef]
  9. Kim, H.-J.; Woo, K.S.; Lee, J.Y.; Choe, M.E.; Lee, H.; Lee, Y.-Y.; Lee, B.W.; Kim, M.; Kang, M.S. Physicochemical properties, functional components, and physiological activities of sorghum cultivars. Korean J. Food Sci. Technol. 2020, 49, 1349–1356. [Google Scholar] [CrossRef]
  10. Bado, S.; Forster, B.P.; Nielen, S.; Ali, A.M.; Lagoda, P.J.; Till, B.J.; Laimer, M. Plant mutation breeding: Current progress and future assessment. Plant Breed. Rev. 2015, 39, 23–88. [Google Scholar]
  11. Johnson, R.E.; Washington, M.T.; Prakash, S.; Prakash, L. Fidelity of human DNA polymerase η. J. Biol. Chem. 2000, 275, 7447–7450. [Google Scholar] [CrossRef] [Green Version]
  12. Jiang, S.-Y.; Ramachandran, S. Natural and artificial mutants as valuable resources for functional genomics and molecular breeding. Int. J. Biol. Sci. 2010, 6, 228–251. [Google Scholar] [CrossRef]
  13. Martin, J. Understanding gamma sterilization. Biopharm Int. 2012, 25, 18. [Google Scholar]
  14. Djezzar, B. Ionizing Radiation Effects and Applications; IntechOpenLo: London, UK, 2018. [Google Scholar]
  15. Malek, M.; Rafii, M.Y.; Afroz, S.S.; Nath, U.K.; Mondal, M. Morphological characterization and assessment of genetic variability, character association, and divergence in soybean mutants. Sci. World J. 2014, 2014, 968796. [Google Scholar] [CrossRef] [PubMed] [Green Version]
  16. Chaudhary, J.; Alisha, A.; Bhatt, V.; Chandanshive, S.; Kumar, N.; Mir, Z.; Kumar, A.; Yadav, S.K.; Shivaraj, S.; Sonah, H. Mutation breeding in tomato: Advances, applicability and challenges. Plants 2019, 8, 128. [Google Scholar] [CrossRef] [PubMed] [Green Version]
  17. Girard, A.L.; Awika, J.M. Sorghum polyphenols and other bioactive components as functional and health promoting food ingredients. J. Cereal Sci. 2018, 84, 112–124. [Google Scholar] [CrossRef]
  18. de Morais Cardoso, L.; Pinheiro, S.S.; Martino, H.S.D.; Pinheiro-Sant’Ana, H.M. Sorghum (Sorghum bicolor L.): Nutrients, bioactive compounds, and potential impact on human health. Crit. Rev. Food Sci. Nutr. 2017, 57, 372–390. [Google Scholar] [CrossRef]
  19. Pontieri, P.; Pepe, G.; Campiglia, P.; Merciai, F.; Basilicata, M.G.; Smolensky, D.; Calcagnile, M.; Troisi, J.; Romano, R.; Del Giudice, F. Comparison of Content in Phenolic Compounds and Antioxidant Capacity in Grains of White, Red, and Black Sorghum Varieties Grown in the Mediterranean Area. ACS Food Sci. Technol. 2021, 1, 1109–1119. [Google Scholar] [CrossRef]
  20. Obruca, S.; Benesova, P.; Marsalek, L.; Marova, I. Use of lignocellulosic materials for PHA production. Chem. Biochem. Eng. Q. 2015, 29, 135–144. [Google Scholar] [CrossRef]
  21. Lee, S.J.; Lee, J.H.; Yang, X.; Kim, S.B.; Lee, J.H.; Yoo, H.Y.; Park, C.; Kim, S.W. Phenolic compounds: Strong inhibitors derived from lignocellulosic hydrolysate for 2, 3-butanediol production by Enterobacter aerogenes. Biotechnol. J. 2015, 10, 1920–1928. [Google Scholar] [CrossRef]
  22. Dlamini, N.R.; Taylor, J.R.; Rooney, L.W. The effect of sorghum type and processing on the antioxidant properties of African sorghum-based foods. Food Chem. 2007, 105, 1412–1419. [Google Scholar] [CrossRef]
  23. Elshire, R.J.; Glaubitz, J.C.; Sun, Q.; Poland, J.A.; Kawamoto, K.; Buckler, E.S.; Mitchell, S.E. A robust, simple genotyping-by-sequencing (GBS) approach for high diversity species. PLoS ONE 2011, 6, e19379. [Google Scholar] [CrossRef] [PubMed] [Green Version]
  24. Kim, C.; Guo, H.; Kong, W.; Chandnani, R.; Shuang, L.-S.; Paterson, A.H. Application of genotyping by sequencing technology to a variety of crop breeding programs. Plant Sci. 2016, 242, 14–22. [Google Scholar] [CrossRef] [PubMed] [Green Version]
  25. Hirschhorn, J.N.; Daly, M.J. Genome-wide association studies for common diseases and complex traits. Nat. Rev. Genet. 2005, 6, 95–108. [Google Scholar] [CrossRef]
  26. Cuevas, H.E.; Rosa-Valentin, G.; Hayes, C.M.; Rooney, W.L.; Hoffmann, L. Genomic characterization of a core set of the USDA-NPGS Ethiopian sorghum germplasm collection: Implications for germplasm conservation, evaluation, and utilization in crop improvement. BMC Genom. 2017, 18, 108. [Google Scholar] [CrossRef] [Green Version]
  27. Zhang, Z.; Ersoz, E.; Lai, C.-Q.; Todhunter, R.J.; Tiwari, H.K.; Gore, M.A.; Bradbury, P.J.; Yu, J.; Arnett, D.K.; Ordovas, J.M. Mixed linear model approach adapted for genome-wide association studies. Nat. Genet. 2010, 42, 355–360. [Google Scholar] [CrossRef] [Green Version]
  28. Jiao, Y.; Burke, J.; Chopra, R.; Burow, G.; Chen, J.; Wang, B.; Hayes, C.; Emendack, Y.; Ware, D.; Xin, Z. A sorghum mutant resource as an efficient platform for gene discovery in grasses. Plant Cell 2016, 28, 1551–1562. [Google Scholar] [CrossRef] [Green Version]
  29. Kim, D.-G.; Lyu, J.I.; Kim, J.M.; Seo, J.S.; Choi, H.-I.; Jo, Y.D.; Kim, S.H.; Eom, S.H.; Ahn, J.-W.; Bae, C.-H. Identification of Loci Governing Agronomic Traits and Mutation Hotspots via a GBS-Based Genome-Wide Association Study in a Soybean Mutant Diversity Pool. Int. J. Mol. Sci. 2022, 23, 10441. [Google Scholar] [CrossRef]
  30. Ryu, J.; Lyu, J.I.; Kim, D.-G.; Koo, K.M.; Yang, B.; Jo, Y.D.; Kim, S.H.; Kwon, S.-J.; Ha, B.-K.; Kang, S.-Y. Single Nucleotide Polymorphism (SNP) discovery and association study of flowering times, crude fat and fatty acid composition in rapeseed (Brassica napus L.) mutant lines using Genotyping-by-Sequencing (GBS). Agronomy 2021, 11, 508. [Google Scholar] [CrossRef]
  31. Petti, C.; Kushwaha, R.; Tateno, M.; Harman-Ware, A.E.; Crocker, M.; Awika, J.; DeBolt, S. Mutagenesis breeding for increased 3-deoxyanthocyanidin accumulation in leaves of Sorghum bicolor (L.) Moench: A source of natural food pigment. J. Agric. Food Chem. 2014, 62, 1227–1232. [Google Scholar] [CrossRef]
  32. Martin, M. Cutadapt removes adapter sequences from high-throughput sequencing reads. EMBnet. J. 2011, 17, 10–12. [Google Scholar] [CrossRef]
  33. Cox, M.P.; Peterson, D.A.; Biggs, P.J. SolexaQA: At-a-glance quality assessment of Illumina second-generation sequencing data. BMC Bioinform. 2010, 11, 485. [Google Scholar] [CrossRef] [PubMed] [Green Version]
  34. Cooper, E.A.; Brenton, Z.W.; Flinn, B.S.; Jenkins, J.; Shu, S.; Flowers, D.; Luo, F.; Wang, Y.; Xia, P.; Barry, K. A new reference genome for Sorghum bicolor reveals high levels of sequence similarity between sweet and grain genotypes: Implications for the genetics of sugar metabolism. BMC Genom. 2019, 20, 420. [Google Scholar] [CrossRef] [Green Version]
  35. Li, H. Aligning sequence reads, clone sequences and assembly contigs with BWA-MEM. arXiv 2013, arXiv:1303.3997. [Google Scholar]
  36. Li, H.; Handsaker, B.; Wysoker, A.; Fennell, T.; Ruan, J.; Homer, N.; Marth, G.; Abecasis, G.; Durbin, R. The sequence alignment/map format and SAMtools. Bioinformatics 2009, 25, 2078–2079. [Google Scholar] [CrossRef] [PubMed] [Green Version]
  37. Kim, J.-E.; Oh, S.-K.; Lee, J.-H.; Lee, B.-M.; Jo, S.-H. Genome-wide SNP calling using next generation sequencing data in tomato. Mol. Cells 2014, 37, 36. [Google Scholar] [CrossRef] [PubMed]
  38. Cingolani, P.; Platts, A.; Wang, L.L.; Coon, M.; Nguyen, T.; Wang, L.; Land, S.J.; Lu, X.; Ruden, D.M. A program for annotating and predicting the effects of single nucleotide polymorphisms, SnpEff: SNPs in the genome of Drosophila melanogaster strain w1118; iso-2; iso-3. Fly 2012, 6, 80–92. [Google Scholar] [CrossRef] [Green Version]
  39. Lipka, A.E.; Tian, F.; Wang, Q.; Peiffer, J.; Li, M.; Bradbury, P.J.; Gore, M.A.; Buckler, E.S.; Zhang, Z. GAPIT: Genome association and prediction integrated tool. Bioinformatics 2012, 28, 2397–2399. [Google Scholar] [CrossRef] [Green Version]
  40. Yu, J.; Pressoir, G.; Briggs, W.H.; Vroh Bi, I.; Yamasaki, M.; Doebley, J.F.; McMullen, M.D.; Gaut, B.S.; Nielsen, D.M.; Holland, J.B. A unified mixed-model method for association mapping that accounts for multiple levels of relatedness. Nat. Genet. 2006, 38, 203–208. [Google Scholar] [CrossRef]
  41. Beyaz, R.; Yildiz, M. The use of gamma irradiation in plant mutation breeding. In Plant Engineering; InTech: Rijeka, Croatia, 2017; pp. 34–46. [Google Scholar]
  42. Micke, A.; Maluszynski, M.; Donini, B. Plant Cultivars Derived from Mutation Induction or the Use of Induced Mutants in Cross Breeding; IAEA: Vienna, Ausrtria, 1985. [Google Scholar]
  43. Human, S.; Indriatama, W.M. Sorghum improvement program by using mutation breeding in Indonesia. IOP Conf. Ser. Earth Environ. Sci. 2020, 484, 012003. [Google Scholar] [CrossRef]
  44. Madhusudhana, R.; Patil, J. A major QTL for plant height is linked with bloom locus in sorghum [Sorghum bicolor (L.) Moench]. Euphytica 2013, 191, 259–268. [Google Scholar] [CrossRef]
  45. Kong, W.; Jin, H.; Franks, C.D.; Kim, C.; Bandopadhyay, R.; Rana, M.K.; Auckland, S.A.; Goff, V.H.; Rainville, L.K.; Burow, G.B. Genetic analysis of recombinant inbred lines for Sorghum bicolor × Sorghum propinquum. G3 Genes Genomes Genet. 2013, 3, 101–108. [Google Scholar] [CrossRef] [PubMed] [Green Version]
  46. Murray, S.C.; Sharma, A.; Rooney, W.L.; Klein, P.E.; Mullet, J.E.; Mitchell, S.E.; Kresovich, S. Genetic improvement of sorghum as a biofuel feedstock: I. QTL for stem sugar and grain nonstructural carbohydrates. Crop Sci. 2008, 48, 2165–2179. [Google Scholar] [CrossRef]
  47. Reddy, P.S. Breeding for Abiotic Stress Resistance in Sorghum; Elsevier: Amsterdam, The Netherlands, 2019; pp. 325–340. [Google Scholar]
  48. Xu, W.; Rosenow, D.; Nguyen, H. Stay green trait in grain sorghum: Relationship between visual rating and leaf chlorophyll concentration. Plant Breed. 2000, 119, 365–367. [Google Scholar] [CrossRef]
  49. Rama Reddy, N.R.; Ragimasalawada, M.; Sabbavarapu, M.M.; Nadoor, S.; Patil, J.V. Detection and validation of stay-green QTL in post-rainy sorghum involving widely adapted cultivar, M35-1 and a popular stay-green genotype B35. BMC Genom. 2014, 15, 909. [Google Scholar] [CrossRef] [Green Version]
  50. Kiranmayee, K.U.; Hash, C.T.; Sivasubramani, S.; Ramu, P.; Amindala, B.P.; Rathore, A.; Kishor, P.K.; Gupta, R.; Deshpande, S.P. Fine-mapping of sorghum stay-green QTL on chromosome10 revealed genes associated with delayed senescence. Genes 2020, 11, 1026. [Google Scholar] [CrossRef]
  51. Sun, X.-Z.; Minowa, T.; Yamaguchi, K.; Genchi, Y. Evaluation of energy consumption and greenhouse gas emissions from poly (phenyllactic acid) production using sweet sorghum. J. Clean. Prod. 2015, 87, 208–215. [Google Scholar] [CrossRef]
  52. Ebrahimian, F.; Karimi, K.; Kumar, R. Sustainable biofuels and bioplastic production from the organic fraction of municipal solid waste. Waste Manag. 2020, 116, 40–48. [Google Scholar] [CrossRef]
  53. Li, J.; Tang, W.; Zhang, Y.-W.; Chen, K.-N.; Wang, C.; Liu, Y.; Zhan, Q.; Wang, C.; Wang, S.-B.; Xie, S.-Q. Genome-wide association studies for five forage quality-related traits in sorghum (Sorghum bicolor L.). Front. Plant Sci. 2018, 9, 1146. [Google Scholar] [CrossRef]
  54. Boatright, J.; Negre, F.; Chen, X.; Kish, C.M.; Wood, B.; Peel, G.; Orlova, I.; Gang, D.; Rhodes, D.; Dudareva, N. Understanding in vivo benzenoid metabolism in petunia petal tissue. Plant Physiol. 2004, 135, 1993–2011. [Google Scholar] [CrossRef] [Green Version]
  55. Yang, X.; Liu, X.; Sheng, Y.; Yang, H.; Xu, X.; Tao, Y.; Zhang, M. Optimization of different acid-catalyzed pretreatments on co-production of xylooligosaccharides and glucose from sorghum stalk. Polymers 2022, 14, 830. [Google Scholar] [CrossRef]
  56. Perrin, R.M.; DeRocher, A.E.; Bar-Peled, M.; Zeng, W.; Norambuena, L.; Orellana, A.; Raikhel, N.V.; Keegstra, K. Xyloglucan fucosyltransferase, an enzyme involved in plant cell wall biosynthesis. Science 1999, 284, 1976–1979. [Google Scholar] [CrossRef] [PubMed] [Green Version]
  57. Mace, E.S.; Hunt, C.H.; Jordan, D. Supermodels: Sorghum and maize provide mutual insight into the genetics of flowering time. Theor. Appl. Genet. 2013, 126, 1377–1395. [Google Scholar] [CrossRef] [PubMed]
  58. Ortiz, D.; Hu, J.; Salas Fernandez, M.G. Genetic architecture of photosynthesis in Sorghum bicolor under non-stress and cold stress conditions. J. Exp. Bot. 2017, 68, 4545–4557. [Google Scholar] [CrossRef] [PubMed] [Green Version]
  59. Nijhawan, A.; Jain, M.; Tyagi, A.K.; Khurana, J.P. Genomic survey and gene expression analysis of the basic leucine zipper transcription factor family in rice. Plant Physiol. 2008, 146, 333. [Google Scholar] [CrossRef] [Green Version]
  60. Xu, F.; Park, M.-R.; Kitazumi, A.; Herath, V.; Mohanty, B.; Yun, S.J.; de los Reyes, B.G. Cis-regulatory signatures of orthologous stress-associated bZIP transcription factors from rice, sorghum and Arabidopsis based on phylogenetic footprints. BMC Genom. 2012, 13, 497. [Google Scholar] [CrossRef] [Green Version]
  61. Zhao, J.; Mantilla Perez, M.B.; Hu, J.; Salas Fernandez, M.G. Genome-wide association study for nine plant architecture traits in Sorghum. Plant Genome 2016, 9. [Google Scholar] [CrossRef] [Green Version]
  62. Tao, Y.; Zhao, X.; Wang, X.; Hathorn, A.; Hunt, C.; Cruickshank, A.W.; van Oosterom, E.J.; Godwin, I.D.; Mace, E.S.; Jordan, D.R. Large-scale GWAS in sorghum reveals common genetic control of grain size among cereals. Plant Biotechnol. J. 2020, 18, 1093–1105. [Google Scholar] [CrossRef] [Green Version]
  63. Kevany, B.M.; Tieman, D.M.; Taylor, M.G.; Cin, V.D.; Klee, H.J. Ethylene receptor degradation controls the timing of ripening in tomato fruit. Plant J. 2007, 51, 458–467. [Google Scholar] [CrossRef]
  64. Klee, H.J. Control of ethylene-mediated processes in tomato at the level of receptors. J. Exp. Bot. 2002, 53, 2057–2063. [Google Scholar] [CrossRef] [Green Version]
  65. Klee, H.; Tieman, D. The tomato ethylene receptor gene family: Form and function. Physiol. Plant. 2002, 115, 336–341. [Google Scholar] [CrossRef] [PubMed]
  66. Lewis, D.R.; Ramirez, M.V.; Miller, N.D.; Vallabhaneni, P.; Ray, W.K.; Helm, R.F.; Winkel, B.S.; Muday, G.K. Auxin and ethylene induce flavonol accumulation through distinct transcriptional networks. Plant Physiol. 2011, 156, 144–164. [Google Scholar] [CrossRef] [Green Version]
  67. Tovar-Méndez, A.; Miernyk, J.A.; Randall, D.D. Regulation of pyruvate dehydrogenase complex activity in plant cells. Eur. J. Biochem. 2003, 270, 1043–1049. [Google Scholar] [CrossRef]
  68. DeBrosse, S.D.; Kerr, D.S. Pyruvate Dehydrogenase Complex Deficiency; Elsevier: Amsterdam, The Netherlands, 2016; pp. 93–101. [Google Scholar]
  69. Noel, J.P.; Austin, M.B.; Bomati, E.K. Structure–function relationships in plant phenylpropanoid biosynthesis. Curr. Opin. Plant Biol. 2005, 8, 249–253. [Google Scholar] [CrossRef] [PubMed] [Green Version]
  70. Brenton, Z.W.; Cooper, E.A.; Myers, M.T.; Boyles, R.E.; Shakoor, N.; Zielinski, K.J.; Rauh, B.L.; Bridges, W.C.; Morris, G.P.; Kresovich, S. A genomic resource for the development, improvement, and exploitation of sorghum for bioenergy. Genetics 2016, 204, 21–33. [Google Scholar] [CrossRef] [Green Version]
  71. Niu, H.; Ping, J.; Wang, Y.; Lv, X.; Li, H.; Zhang, F.; Chu, J.; Han, Y. Population genomic and genome-wide association analysis of lignin content in a global collection of 206 forage sorghum accessions. Mol. Breed. 2020, 40, 73. [Google Scholar] [CrossRef]
Figure 1. Ultra-performance liquid chromatography (UPLC) profiles of phenolic compounds were detected at 320 nm: (A) IS645, original cultivar; (B) IS645-2, 1 luteolinidin diglucoside, 2 luteolin glucoside, 3 apigeninidin glucoside, 4 luteolinidin, 5 apigeninidin, 6 5-O-Me-luteolinidin; (C) chemical structure of sorghum phenolics.
Agronomy 13 01449 g001
Figure 2. Ultra-performance liquid chromatography (UPLC) 3D profiles of total phenolic content (TPC): (A) High-land-sweet, TPC maximum value; (B) Pahat-4, TPC minimum value; 1 luteolinidin diglucoside, 2 luteolin glucoside, 3 apigeninidin glucoside, 4 luteolinidin, 5 apigeninidin, 6 5-O-Me-luteolinidin; (C) Total phenolic content of 96 genotypes.
Agronomy 13 01449 g002
Figure 3. Correlation analyses among individual agronomic traits and phenolic compounds. HD (heading date); PH (plant height); SC (soluble solids content); DY (dry yield); TPC (total phenolic content); *, **, and *** are significant at the 0.05, 0.01, and 0.001 probability levels, respectively.
Agronomy 13 01449 g003
Figure 4. Phenotypic differences between lines with different alleles (left, reference genome; right, alternative genome) for SNPs associated with heading date (HD), plant height (PH), and dry yield (DY); *** are significant at the 0.001 probability level.
Agronomy 13 01449 g004
Figure 5. Phenotypic differences between lines with different alleles (left, reference genome; right, alternative genome) for SNPs involved in two or more compounds in TPC and phenolic compounds; * and *** are significant at the 0.05 and 0.001 probability levels, respectively.
Agronomy 13 01449 g005
Table 1. Origin, agronomic traits, and total phenolic content of the 96 sorghum genotypes used in this study.
LinesOriginTypesAccession NumbersHD 1
(days)
PH 2
(cm)
SC 3
(brix°)
DY 4
(ton/ha)
TPC 5
(mg/100 g)
Gangwonsamcheok-2001-40Republic of KoreaAccessionIT218409 *70.0311.018.59.57.31
High-land-sweetRepublic of KoreaAccessionIR139445 *100.0307.014.610.011.54
DINE-A-MITERepublic of KoreaAccessionIR100992 *97.0362.09.317.45.87
Pioneer931Republic of KoreaAccessionIT033846*115.0348.016.715.28.04
KingsorgoRepublic of KoreaAccessionIT033841 *96.0248.012.59.57.80
IS645United StateAccessionIT124065 *90.0330.018.111.96.67
IkumbaKenyaAccessionIT262644 *98.0331.015.817.43.36
OlusiKenyaAccessionIT262629 *97.0330.017.214.24.84
Sorghum-medovoeRussiaAccessionIT199372 *74.0234.013.38.86.59
IS2868South AfricaAccessionIT124094 *89.0273.08.013.58.29
IS5718IndiaAccessionIT124108 *90.0253.05.05.98.13
Andiwo-ma-rabourKenyaAccessionIT262529 *80.0331.015.524.95.45
SabinaKenyaAccessionIT262628 *90.0340.015.214.27.09
IS14131PortugalAccessionIT143764 *91.0333.011.29.53.77
IS1211ChinaAccessionIT143846 *77.0295.07.07.16.64
KLSo79168Republic of KoreaAccessionIT028417 *75.0347.08.510.37.03
KLSo79125Republic of KoreaAccessionIT028385 *90.0338.015.710.710.83
KLSo79075Republic of KoreaAccessionIT028358 *71.0275.012.26.66.02
JM4621South AfricaAccessionIS27887 **110.0307.017.223.74.01
JM 4682South AfricaAccessionIS27912 **85.0307.017.216.64.33
MuansusuRepublic of KoreaCultivarIT028258 *69.0284.09.813.58.69
NulsusuRepublic of KoreaCultivarIT185794 *102.0354.011.011.110.50
Chalsusu1Republic of KoreaCultivarIT191187 *99.0343.010.211.97.72
ShikyoungRepublic of KoreaCultivarIT105551 *100.0341.011.59.56.27
JangmokRepublic of KoreaCultivarIT103274 *100.0323.011.38.98.13
HansanRepublic of KoreaCultivarIT101381 *95.0338.012.610.34.57
MoktakRepublic of KoreaCultivarIT124114 *95.0302.013.017.86.34
BanwoldangRepublic of KoreaCultivarIT124115 *75.0301.09.014.27.96
Chalsusu2Republic of KoreaCultivarIT028260 *67.0308.013.114.27.69
BitjaruRepublic of KoreaCultivarIT104110 *95.0348.09.311.18.70
MesusuRepublic of KoreaCultivarIT028269 *98.0326.012.711.93.75
SOG102Republic of KoreaAccessionIS30507 **85.0229.018.89.59.11
SOG103Republic of KoreaAccessionIS30508 **82.0233.016.013.54.47
SOG129Republic of KoreaAccessionIS30533 **80.0252.018.115.93.46
SOG132Republic of KoreaAccessionIS30536 **75.0320.018.819.05.27
SOG159Republic of KoreaAccessionIS30562 **92.0260.015.014.26.51
HDW501IndonesiaAccession IS20956 **100.0265.012.911.93.27
Banwoldang-1BanwoldangMutantGamma-ray 200 Gy ***100.0329.015.311.16.76
Banwoldang-2BanwoldangMutantGamma-ray 400 Gy62.0137.012.19.58.22
Banwoldang-3BanwoldangMutantGamma-ray 400 Gy62.0126.016.39.510.64
Banwoldang-4BanwoldangMutantGamma-ray 400 Gy100.0175.012.511.910.95
Banwoldang-5BanwoldangMutantGamma-ray 400 Gy110.0135.013.19.55.24
Banwoldang-6BanwoldangMutantGamma-ray 400 Gy110.0155.015.211.99.81
Banwoldang-7BanwoldangMutantGamma-ray 400 Gy58.0125.013.09.58.19
Banwoldang-8BanwoldangMutantGamma-ray 400 Gy62.0215.017.214.23.86
Banwoldang-9BanwoldangMutantGamma-ray 400 Gy59.0112.015.311.97.70
Banwoldang-10BanwoldangMutantGamma-ray 400 Gy110.0369.014.511.94.00
Banwoldang-11BanwoldangMutantGamma-ray 400 Gy110.0374.014.211.92.59
Banwoldang-12BanwoldangMutantGamma-ray 400 Gy70.0252.014.816.66.12
Banwoldang-13BanwoldangMutantGamma-ray 400 Gy80.0376.010.816.67.39
Banwoldang-14BanwoldangMutantGamma-ray 400 Gy80.0365.012.516.67.06
Banwoldang-15BanwoldangMutantGamma-ray 400 Gy100.0342.011.916.63.89
Banwoldang-16BanwoldangMutantGamma-ray 400 Gy100.0412.012.423.75.09
Banwoldang-17BanwoldangMutantGamma-ray 400 Gy100.0402.011.623.75.55
Banwoldang-18BanwoldangMutantGamma-ray 400 Gy102.0242.013.98.35.34
Dansusu2-1SOG103MutantProton beam 300 Gy100.0294.016.819.07.78
Dansusu2-2SOG103MutantProton beam 300 Gy100.0308.015.816.69.21
Dansusu2-3SOG103MutantProton beam 300 Gy79.0282.012.69.511.05
Dansusu2-4SOG103MutantProton beam 300 Gy79.0290.013.49.54.97
Dansusu2-5SOG103MutantProton beam 300 Gy110.0268.014.29.05.02
Dansusu2-6SOG103MutantProton beam 300 Gy100.0308.016.210.76.14
Dansusu2-7SOG103MutantProton beam 300 Gy100.0310.016.814.24.10
Dansusu2-8SOG103MutantProton beam 300 Gy100.089.05.02.44.04
Dansusu2-9SOG103MutantProton beam 300 Gy90.0138.013.27.12.85
Dansusu2-10SOG103MutantGamma-ray 200 Gy105.0253.016.59.55.87
Dansusu2-11SOG103MutantGamma-ray 200 Gy105.0308.016.116.68.83
Dansusu2-12SOG103MutantGamma-ray 150 Gy105.0282.014.811.93.03
KLSo79125-1KLSo79125MutantGamma-ray 400 Gy69.0270.012.314.28.63
KLSo79125-2KLSo79125MutantGamma-ray 400 Gy69.0214.016.311.98.87
KLSo79125-3KLSO79125MutantGamma-ray 200 Gy77.0270.013.411.94.48
KLSo79125-4KLSO79125MutantGamma-ray 200 Gy100.0352.013.314.23.94
KLSo79125-5KLSO79125MutantGamma-ray 200 Gy110.0350.013.416.65.84
Pahat-1HDW501MutantGamma-ray 200 Gy90.0240.017.814.23.21
Pahat-2HDW501MutantGamma-ray 200 Gy90.0239.018.69.56.01
Pahat-3HDW501MutantGamma-ray 200 Gy69.0100.010.77.14.23
Pahat-4HDW501MutantGamma-ray 200 Gy68.0108.09.59.51.92
Pahat-5HDW501MutantGamma-ray 200 Gy110.095.010.17.65.34
Pahat-6HDW501MutantGamma-ray 200 Gy71.0132.012.19.52.21
IS5718-1IS5718MutantGamma-ray 200 Gy62.0220.014.28.19.00
IS5718-2IS5718MutantGamma-ray 200 Gy61.0192.015.08.311.11
IS5718-3IS5718MutantGamma-ray 100 Gy61.0240.012.68.36.55
IS5718-4IS5718MutantGamma-ray 100 Gy62.0242.013.58.36.11
IS645-1IS645MutantGamma-ray 200 Gy99.0373.014.521.39.08
IS645-2IS645MutantGamma-ray 200 Gy75.0371.011.011.913.10
IS645-3IS645MutantGamma-ray 200 Gy61.0348.012.826.13.95
DINE-A-MITE-1DINE-A-MITEMutantGamma-ray 100 Gy102.0465.06.023.74.22
DINE-A-MITE-2DINE-A-MITEMutantGamma-ray 100 Gy77.0319.010.511.99.16
DINE-A-MITE-3DINE-A-MITEMutantGamma-ray 100 Gy105.0410.08.516.65.99
Moktak-1MoktakMutantGamma-ray 100 Gy68.0289.015.214.27.17
Moktak-2MoktakMutantGamma-ray 100 Gy100.0390.015.326.16.96
Chalsusu1-1Chalsusu1MutantGamma-ray 200 Gy110.0408.016.416.65.57
High-land-sweet-1High-land-sweetMutantGamma-ray 200 Gy71.0270.016.311.94.80
IS2868-1IS2868MutantGamma-ray 100 Gy90.0345.016.921.39.28
Mesusu-1MesusuMutantGamma-ray 100 Gy105.0375.012.814.22.85
IS2864-1South AfricaMutantGamma-ray 100 Gy69.0108.08.27.12.81
IS2864-2South AfricaMutantGamma-ray 100 Gy90.0240.012.68.32.25
1 Heading date; 2 plant height; 3 soluble solids content; 4 dry yield, 5 total phenolic content. * Rural Development Association GenBank in Republic of Korea (RDA) accession numbers, ** Research Institute for Semi-Arid Tropics (ICRSAT) accession numbers, *** type and dose of radiation treated with seed.
Table 2. Summary of agronomic traits of the 96 sorghum genotypes used in this study.
Trait 1Min 2Max 3MeanSkew 4Kurt 5CV 6
HD58.0115.087.8−0.29−1.190.18
PH89.0465.0282.0−0.66−0.060.30
SC5.018.813.4−0.530.080.23
DY2.426.113.00.900.650.37
1 HD, heading date; PH, plant height; SC, soluble solids content; DY, dry yield; 2 Min, minimum; 3 Max, maximum; 4 Skew, skewness; 5 Kurt, kurtosis; 6 CV, coefficient of variation. The list of values for each genotype is shown in Table 1.
Table 3. Summary of total phenolic content and six phenolic compounds of 96 sorghum genotypes used in this study.
TypeMin 1Max 2MeanSkew 3Kurt 4CV 5
Luteolinidin diglucoside0.090.460.231.082.130.29
Luteolin glucoside0.001.240.301.332.020.90
Apigeninidin glucoside0.021.180.401.012.290.49
Luteolinidin0.065.201.710.760.390.67
Apigeninidin0.000.750.320.25−0.130.52
5-O-Me-luteolinidin0.010.430.160.16−0.810.50
Total phenolic content
(TPC)
1.9213.106.370.36−0.440.38
1 Min, minimum; 2 Max, maximum; 3 Skew, skewness; 4 Kurt, kurtosis; 5 CV, coefficient of variation. The list of values for each genotype is shown in Table S2.
Table 4. Summary of GBS sequence data and alignment to the reference genome sequence.
TotalAverage/Plant
Raw data
Reads684,426,6367,129,444
Bases (bp)103,348,422,0361,076,546,063
After trimming
Reads620,196,8086,460,383
Bases (bp)64,640,661,227673,340,221
Mapped reads on reference genome 1
Reads599,168,1886,241,335
Bases (bp)4,968,266,85551,752,780
Reference genome coverage (%)7.0954%
1 Reference genome; Sorghum bicolor Rio_v2.1.
Table 5. Chromosomal distribution and frequency of SNPs identified using the GBS approach in 96 sorghum genotypes.
ChromosomeLength (bp)No. of SNPsKb/SNPSNPs/Mb
Chromosome 181,498,37325,2653.23310.0
Chromosome 289,798,10923,9703.75266.9
Chromosome 375,771,32220,1893.75266.4
Chromosome 466,264,05619,5323.39294.8
Chromosome 574,474,82020,7073.60278.0
Chromosome 669,324,44518,3023.79264.0
Chromosome 770,271,34713,8305.08196.8
Chromosome 870,703,59217,0454.15241.1
Chromosome 960,147,66215,6413.85260.0
Chromosome 1061,107,42316,9863.60278.0
Scaffolds10,018,71357317.4857.2
Total729,379,862192,040
Mean 5.06246.7
Table 6. Information about co-detected SNPs for agronomic traits (HD, PH, and DY) based on the GWAS results.
SNPTrait 1Chr.Position (bp)Effect−log10(p)MAF 2AlleleMethod 3Candidate Gene 4Description
Sb02_6876523HD26,876,523−8.144.150.42G/A1, 2SbRio.02G064100benzyl alcohol O-benzoyltransferase
Sb02_6876524HD26,876,5248.144.150.42G/T1, 2SbRio.02G064100benzyl alcohol O-benzoyltransferase
Sb06_8705823HD68,705,823−9.744.160.47T/C1, 2SbRio.06G036000endo−1,4-beta-xylanase 4-like isoform X2
Sb10_7471984HD107,471,984−12.67–12.194.20–4.930.16A/G1, 2, 3, 4SbRio.10G099600galactoside 2-alpha-L-fucosyltransferase-like isoform X2
Sb07_53523852PH753,523,852−82.68–54.154.12–4.180.11T/C3, 4SbRio.07G123800nudix hydrolase 15, mitochondrial
Sb08_63291752PH863,291,752−49.51–38.377.80–8.080.19G/A1, 2SbRio.08G141500hypothetical protein BDA96_08G141500
Sb09_50399847PH950,399,847−127.68–117.145.77–11.700.18G/A3, 4SbRio.09G149200hypothetical protein BDA96_09G149200
Sb04_2143594DY42,143,5941.32–3.974.40–6.820.15G/C1, 2, 4SbRio.04G031300beta-amylase 8 isoform X2
Sb06_62687750DY662,687,7501.79–4.024.20–6.080.17G/A2, 4SbRio.06G211400transcription factor MafB
1 HD (heading date); PH (plant height); DY (dry yield); 2 MAF (minor allele frequency); 3 methods 1–4 refer to BLINK (1), FarmCPU (2), MLMM (3), and MLM (4); 4 reference genome, Sorghum bicolor Rio_v2.1.
Table 7. Information on SNPs detected in two or more GWAS models or involved in two or more compounds for TPC and five phenolic compounds (luteolinidin diglucoside, luteolin glucoside, apigeninidin glucoside, luteolinidin, and 5-O-Me luteolinidin) based on GWAS results.
SNPTrait 1ChrPosition (bp)Effect−log10(p)MAF 2AlleleMethod 3Candidate gene 4Description
Sb04_1305322141,305,322−1.68–1.054.03–6.690.33T/C2, 3SbRio.04G019000choline/ethanolaminephosphotransferase 1
Sb04_644619781464,461,978−0.88–1.167.28–7.670.30C/A1, 2SbRio.04G361300glycosyltransferase family protein 2
Sb04_565849141456,584,914−3.494.060.08C/G4SbRio.04G259800pyruvate dehydrogenase E1 component subunit alpha-1, mitochondrial
24 −0.114.400.08C/G4SbRio.04G259800pyruvate dehydrogenase E1 component subunit alpha-1, mitochondrial
Sb02_817969601281,796,9601.854.100.28T/C4SbRio.02G343600ethylene receptor 4
5 0.804.640.28T/C3SbRio.02G343600ethylene receptor 4
Sb02_817970621281,797,062−2.29–1.436.55–14.040.24A/G1, 2, 3SbRio.02G343600ethylene receptor 4
5 −0.874.580.24A/G3SbRio.02G343600ethylene receptor 4
Sb02_817971391281,797,1392.184.560.26G/C4SbRio.02G343600ethylene receptor 4
52 0.914.23–4.980.26G/C3, 4SbRio.02G343600ethylene receptor 4
Sb02_799057272279,905,7270.03–0.044.52–5.390.17A/T1, 2, 3SbRio.02G316600NEP1-interacting protein-like 1
Sb04_590166302459,016,630−0.14–0.064.04–22.410.12G/T1, 2, 4SbRio.04G289300glutamic acid-rich protein-like isoform X1
Sb06_1797783261,797,7830.05–0.064.10–4.390.16T/G1, 3, 4SbRio.06G011700fe-S cluster assembly factor HCF101, chloroplastic
Sb06_590653372659,065,337−0.034.56–4.760.35C/T1, 3SbRio.06G167800wall-associated receptor kinase 4
Sb06_590653512659,065,3510.034.81–4.850.36T/G1, 3SbRio.06G167800wall-associated receptor kinase 4
Sb06_590653802659,065,3800.034.30–4.650.34G/C1, 3SbRio.06G167800wall-associated receptor kinase 4
Sb06_590654072659,065,4070.034.07–4.420.34T/A1, 3SbRio.06G167800wall-associated receptor kinase 4
Sb01_144317633114,431,7630.164.010.38G/A1, 2SbRio.01G175100ARM repeat superfamily protein | calcium-transporting ATPase 3, plasma membrane-type
Sb03_4939603334,939,6030.174.18–4.270.30A/G1, 2, 3SbRio.03G056200hypothetical protein BDA96_03G056200
Sb05_9038134359,038,1340.184.030.20G/A1, 2SbRio.05G076500probable kinase CHARK
Sb05_9038126359,038,126−0.204.120.18C/G1, 2SbRio.05G076500probable kinase CHARK
Sb01_1229036411,229,0360.094.080.18G/C1, 3SbRio.01G011000U2 small nuclear ribonucleoprotein A’
Sb01_1229046411,229,046−0.094.080.18A/C1, 3SbRio.01G011000U2 small nuclear ribonucleoprotein A’
Sb06_557850734655,785,0730.16–0.255.52–11.400.09G/C1, 2, 3, 4SbRio.06G125400disease resistance protein Pik-1
Sb03_683953044368,395,3040.104.580.23C/T1, 3SbRio.03G375900ruvB-like protein 1
Sb03_683588474368,358,8470.094.460.27G/T1, 3SbRio.03G375100protein GPR107
Sb03_683588154368,358,8150.094.720.26C/T1, 3SbRio.03G375100protein GPR107
Sb03_683587714368,358,771−0.094.410.27T/C1, 3SbRio.03G375100protein GPR107
Sb10_46094824104,609,482−0.16–0.274.65–7.730.08C/G2, 3, 4SbRio.10G064200proteasome subunit alpha type-4-2
Sb06_683478896668,347,889−0.09–0.074.51–7.230.17A/G1, 2, 3, 4SbRio.06G295300multiple RNA-binding domain-containing protein 1
Sb08_655319876865,531,987−0.07–0.054.23–5.940.31A/G1, 2, 4SbRio.08G160200Os04g0380500
1 Traits 1–6 refer to TPC (1), luteolinidin diglucoside (2), luteolin glucoside (3), apigeninidin glucoside (4), luteolinidin (5), 5-O-Me-luteolinidin (6); 2 MAF (minor allele frequency); 3 methods 1–4 refer to BLINK (1), FarmCPU (2), MLMM (3), MLM (4); 4 reference genome, Sorghum bicolor Rio_v2.1.
Disclaimer/Publisher’s Note: The statements, opinions and data contained in all publications are solely those of the individual author(s) and contributor(s) and not of MDPI and/or the editor(s). MDPI and/or the editor(s) disclaim responsibility for any injury to people or property resulting from any ideas, methods, instructions or products referred to in the content.

