Article

Better Nitrogen Fertilizer Management Improved Mchare Banana Productivity and Profitability in Northern Highlands, Tanzania

1
Department of Sustainable Agriculture, Biodiversity and Ecosystems Management, Nelson Mandela African Institution of Science and Technology, Arusha P.O. Box 447, Tanzania
2
International Institute of Tropical Agriculture, Kampala P.O. Box 7878, Uganda
3
Department of Biosystems, Division Plant Biotechnics, KU Leuven, W. De Croylaan 42, 3001 Heverlee, Belgium
4
Department of Water and Environmental Sciences, Nelson Mandela African Institution of Science and Technology, Arusha P.O. Box 447, Tanzania
5
Department of Earth and Environmental Sciences, Division of Soil and Water Management, KU Leuven, Kasteelpark Arenberg 20, 3001 Heverlee, Belgium
*
Author to whom correspondence should be addressed.
Agronomy 2023, 13(5), 1418; https://doi.org/10.3390/agronomy13051418
Submission received: 30 March 2023 / Revised: 29 April 2023 / Accepted: 15 May 2023 / Published: 20 May 2023
(This article belongs to the Special Issue Application of Organic Amendments in Agricultural Production)

Abstract

:
Declining land productivity is a major problem constraining banana (Musa spp.) production in Tanzania. Banana fruit yield consequently reaches only 15% of the potential, primarily due to inadequate soil nutrient replenishment. Improving farmers’ soil nutrient replenishment strategy in banana home gardens, which relies on applications of cattle manure only, by mixing with inorganic fertilizer resources can increase land productivity and can improve the overall profitability of banana production in the country. Experiments were conducted at Tarakea, Lyamungo, and Tengeru to determine the effects of organic fertilizer resources (animal manure and crop residue) and their combination with inorganic fertilizer resources on the productivity and profitability of Mchare banana production. Banana fruit yield differed significantly among the experimental sites, with drier areas of Tengeru recording, on average, 19.6 t ha−1 year−1, while the more humid areas of Lyamungo recorded, on average, 39.3 ha−1 year−1. Mchare banana plants grown under sole inorganic fertilizer produced significantly low yields (33.0 t ha−1 year−1) compared with those fertilized with cattle manure only, which lifted the yields to 38.8 t ha−1 year−1, but the latter required more labor input. Soil nitrogen (N) fertilization via cattle manure + mineral fertilizer gave the highest average banana fruit yield (43.0 t ha−1 year−1) across the sites, and reduced fertilization costs by 32%. Subsequently, this integrated fertilization technique generated the highest average net benefits in all sites and both cropping cycles. Thus, the findings of this study form a basis to improve land productivity and profitability in banana-based home gardens in the study area by directing more labor input to good soil N management.

1. Introduction

Banana-based farming, most specifically the banana/coffee/common bean/smallholder dairy cattle system, has played a significant role in sustaining smallholder farmers’ livelihoods in the humid highlands of Tanzania [1,2,3]. For a long period, bananas have served as a staple food, whereas coffee was a major cash earner [2,3]. Apart from serving as a source of animal protein for subsistence, dairy cattle in the system provided organic fertilizer for banana-based agroforestry home gardens [1,4,5]. Conversely, the increasing demand for bananas in the local market forces smallholder farmers to plant more bananas in their home gardens to replace coffee to generate additional income to support their livelihood [2,3,6].
Bananas can feed up to 30% of the entire human population in Tanzania [7]. In the principle banana growing areas (e.g., Arusha, Kagera, Kilimanjaro, and Mbeya regions), the traditional highlands East African cooking banana (Mchare and Matooke) feeds up to 95% of the population [8] and contributes to around 70% of the household income through the sales of surplus banana bunches [2,3]. Regrettably, farmland fragmentation resulting from the large population pressure in the humid highlands has caused most of the farmers to derive their livelihoods on farmsteads that hardly reach 0.5 ha [1,2,3]. As a result, marginal lands that were allocated for fodder production have been converted to croplands [4,5] to produce food to feed more people. This, in turn, reduced the amounts of animal fodder [2,3,4] and, hence, the number of dairy cattle that can be kept in a farmstead [1,5,9,10,11]. Logically, quantities of animal manure dwindled down to only 25% of the total requirement [12], precluding acceptable productivity figures due to the declining land productivity, a result of inadequate soil nutrient replenishment [1,10,11,13].
The acquisition of additional animal manure is hardly possible for resource-less endowed smallholder farmers [2,3,5]. In this view, supplementation with mineral fertilizers is crucial to enhance banana productivity output [12]. Combined use of organic and inorganic fertilizer resources significantly improved land productivity in comparison to using animal manure or inorganic fertilizers alone [14,15,16]. However, the economic profitability of such an approach will finally determine its adoption. Therefore, this study aimed to demonstrate the agronomic and economic benefits of N fertilization in Mchare banana production by analyzing data from two crop cycles for three experimental sites. The objectives of the study were to (i) evaluate the productivity, and (ii) assess the profitability of soil N replenishment techniques in Mchare banana production in the study area.

2. Materials and Methods

2.1. Site Characteristics

The study was conducted in newly established fields at three sites from November 2015 to December 2019 on the volcanic slopes of Mount Kilimanjaro and Mount Meru in the central–northern highlands of Tanzania. The experimental sites included (i) Tarakea, at the farm of Tarakea secondary school (latitude 03°02′17.0″ S, longitude 037°35′24.9″ E; 1608 meters (m) above sea level (a.s.l) in the Rombo district, Kilimanjaro region, (ii) Lyamungo, at the farm of Tanzania Coffee Research Institute (latitude 03°13′49.6″ S, longitude 037°14′55.9″ E; 1346 m a.s.l in the Hai district, Kilimanjaro region, and (iii) Tengeru, in the land of the Nelson Mandela African Institution of Science and Technology (latitude 03°23′58″ S, longitude 037°35′24.9″ E; 1106 m a.s.l in the Arumeru district, Arusha region. The first field was established in the Upper zone, the second field in the Mid zone, and the third in the interflow zone between the Mid and Lower zones. This arbitrary zoning led to three different climatic conditions. Lyamungo was the more humid site (Figure S1), with annual precipitation exceeding 1300 mm year−1, which is considered optimal for banana production [17]. Likewise, Tarakea and Tengeru were drier sites (Figures S2 and S3, respectively), and rains were less than optimal with annual precipitation below 1000 mm. Soil types are classified as Cambic Chermic Phaeozem (Gravelly Clayic, Colluvic, Novic, Vitric) at Tarakea; Eutric Luvic Mollic Nitisol (Humic) at Lyamungo; and Chermic Phaeozem (Geo-abruptic, Clayic, Pachic) over Eutric Cambisol (Clayic, Humic, Protovertic) at Tengeru [18]. Except for total N and C levels that were below the established critical limits for crop production in all experimental fields, other soil properties were generally acceptable for the production of bananas [19].

2.2. Experimental Fields’ Establishment, Experimental Design, and N Fertilization Treatments

Hole measurements for planting bananas were 0.9 m in length, 0.9 m wide, and 0.7 m deep. Each treatment plot measured 150 m2 (15 m long by 10 m wide) and had five rows spaced 3 m apart and five plants within a row spaced 2 m apart. The Crop Bio-Science tissue culture laboratory in Arusha provided the banana plant materials (Mchare-Huti Green Bell AA) for the experiment, which were about 0.3 m tall. Banana planting was carried out during the long rainy season and the corresponding planting density was 1666 plants ha−1. In the respective treatment plots, common bean (variety Lyamungo 90, bush type) inoculated with Rhizobium leguminosarum (manufactured by Legume Technology Ltd. Batch: CIAT 300813-1, Nairobi, Kenya) was grown in association with banana in four rows spaced 0.2 m by 0.5 m, with a corresponding planting density of 100,000 plants ha−1. Legume intercrop was grown in two cropping seasons each year. Common bean seeds were outsourced from the Tanzania Agriculture Research Institute (TARI), Selian station located in Arusha region, northern Tanzania.
The field experiment consisted of eight N fertilization treatments arranged in a randomized complete block design and was repeated three times. All N fertilization treatments were applied each year in all three experimental sites. Treatments 3, 5, and 6 were designed to equalize the total N contents derived from different amounts of urea and cattle manure. This was calculated based on equal N amounts (153.4 kg N ha−1 year−1 equivalent to 92 g N mat−1 year−1 determined according to the amount of organic N traditionally applied by resource-endowed farmers). Fertilization treatments included (N rates expressed in kg ha−1 year−1): T1 = 0 N (control); T2 = 76.7 kg N (derived from urea, 50% below the N dose applied by resource-endowed farmers); T3 = 153.4 kg N (derived from urea, corresponding to the traditional N rate derived from cattle manure applied by resource-endowed farmers); T4 = 230 kg N (derived from urea, 50% above the traditional N rate); T5 = 50% urea (providing 76.7 kg mineral N) + 50% cattle manure (providing 76.7 kg organic N); T6 = 100% cattle manure (providing 153.4 kg organic N); T7 = 50% urea (providing 76.7 kg mineral N) + common bean haulms (providing, on average, 52 kg organic N); and T8 = 100% common bean haulms (providing, on average, 52 kg organic N) (Table S1) [18]. As a first step toward improving the traditional soil fertility management practices in the banana-based farming systems of northern Tanzania, we aimed to estimate the ideal N fertilization rate in T1 through T4. In this study, we tested the concept while we chose the cattle manure dose (T6) applied by the resource-endowed farmers as a reference, well aware that such is beyond the doses used by the average smallholder farmers.
Dry cattle manure about six months old was locally sourced from the Kilari sisters’ dairy farm each year and contained, on average, 2–3–12 g kg−1 N–P–K (Table 1) [12]. It was not possible to perform a full chemical analysis of the manure because of financial constraints. Although the manure’s moisture content was not measured, it was estimated to be between 87 and 90%. The moisture content of the cattle manure given to the crop was, hence, not considered when calculating the required manure dose. Even yet, it is likely that the levels of N delivered by cattle manure did not depart greatly from the planned annual rate. Each banana mat in T5 received 23 kg of dry cattle manure (equivalent to 38 t ha−1) + 100 g of urea (46% N) (equivalent to 167 kg ha−1) year−1 [18]. As for 100% cattle manure treatment (T6), each mat was amended with 46 kg dry manure (equivalent to 76 t ha−1) year−1 [18]. Common bean haulms were produced in situ in T7–T8 during the course of two seasons each year and contained, on average, 31–3–24 g kg−1 N–P–K (Table 1) [12]. Each banana mat in T8 received between 0.9 and 1.1 kg of dry common bean haulms (equivalent to 1.6 t ha−1 on average) year−1, while in T7, each banana mat received this amount in combination with the lowest dose of urea (Tables S1 and S2). Each banana mat in T1–T4 received 20.1 g P (46 g P2O5) and 276 g K (334 g K2O) year–1, which is equivalent to 33.5 kg P (76.6 kg P2O5) and 459.8 kg K (556.4 kg K2O) ha–1 year–1, respectively, from triple superphosphate (TSP, 46% P2O5) and muriate of potash (MOP, 60% K2O). Likewise, each banana mat in T7 and T8 received the same amounts as in T1–T4 plus, on average, 3 g P and 24 g K mat−1 year−1, equivalent to 5 kg P and 40 kg K ha−1 year−1 derived from common bean haulms (Table S2). Each banana mat in T5 received 69 g P and 276 g K year−1, which is equal to 115 kg P and 459.8 kg K ha−1 year−1, whereas those in T6 received 138 g P and 552 g K mat−1 year−1, which is equal to 230 kg P and 916.9 kg K ha−1 year−1, both from cattle manure (Table S2).
While T3, T5, and T6 were designed to receive equal quantities of the total N derived from various amounts of urea and cattle manure, this was not the case for P and K in T5 and T6. Mchare banana plants in T6 always received double amounts of P and K compared with T5 and six times more than T1–T4 caused by the larger quantities of cattle manure applied in this treatment. Cattle manure and TSP were applied once each year at the onset of the short rainy season. Common bean haulms were retained in the respective N fertilization treatment plots to recycle nutrients. To reduce leaching losses, urea and MOP, on the other hand, were administered in three splits each year: the first split at the beginning of the short wet season, the second split at the beginning of the long rainy season, and the third split near the end of the long rainy season (Table S3).

2.3. Agronomic Assessment of N Fertilization

Yield data were collected from two consecutive cycles between April 2017 and December 2019 on nine central banana plants in each treatment plot. Yield-related parameters included (i) harvested bunches and (ii) bunch size. Using the formula shown in Equation (1) below, yield (t ha−1 year−1) was then computed based on the bunch weight and collected bunches ha−1 in a year related to crop duration. Crop duration refers to the number of days between planting and harvesting for each cropping cycle.
Y i e l d   [ t   ha 1   year 1 ] = [ B W 1000 ] × n °   h a 1 × [ 365 C D ]
with BW bunch weight in kg, n° number of harvested bunches ha−1, and CD crop duration.

2.4. Economic Assessment of N Fertilization

A partial budget analysis of the costs and benefits related to each treatment on the yield data was carried out as described in [20] in order to evaluate the profitability of N fertilizer utilization. The analysis was carried out using the farm gate price of banana bunches, common bean grains harvested from intercropped treatment plots, opportunity costs of common bean haulms, prevailing retail prices of mineral fertilizers, transport cost of cattle manure, and labor costs associated with each fertilization treatment. Calculations were made on a hectare basis per year in Tanzania shilling (TZS). Then, monetary values were translated from TZS at the average exchange rate near the end of the experimental period, which was 2309 TZS to 1 USD. The closest agro-dealers were contacted for prices on mineral fertilizers, common bean seeds, and Rhizobium inoculants. Costs related to cattle manure utilization were obtained from banana growers and were checked against those provided by extension staff in each site. Labor costs for fertilizer application, planting, weeding, and harvesting of the bean intercrop were collected from the neighboring farmers (Tables S3–S6). Conversely, labor costs related to banana harvesting and local transport were not included in the analysis because bunches for family consumption are harvested piecemeal and those for sale are often harvested by the merchants.
The average farm gate price of banana bunches was obtained from the merchants at the nearest market centers during peak season when prices are customarily low. The same was carried out for common bean grains harvested from the intercropped N fertilization treatment plots. The opportunity cost of common bean haulms was obtained from the nearest smallholder dairy cattle keepers, who normally use them as fodder. Because banana bunches were harvested after fingers have reached full horticultural maturity, which is not a normal practice by most smallholder farmers, the average yield (t ha−1 year−1) was reduced by 10%. The average farm gate prices of Mchare banana (USD 0.23 kg−1), common bean grains (USD 1.3 kg−1), and common bean haulms (USD 86 ha−1) were used to determine the harvest value referred to herein as gross benefits (GB) from the respective N fertilization treatment plots.
Total variable costs (TVC) were the sum of costs of fertilizers, common bean seed, and labor for fertilizers application, planting, weeding, and harvesting of the intercropped common bean. Net benefits (NB) were calculated by subtracting the TVC from GB. Then, prospective profitable N fertilization treatments were chosen using a dominance analysis. Treatments were deemed to be dominated and, as a result, were excluded from the marginal analysis if they provided NB that was lower or equal to that of a treatment with lower TVC. The non-dominated N fertilization treatments were sorted in ascending order of their costs, and a marginal (extra) cost (MC) and benefit (MB) were computed for each adjacent pair of treatments. The MC was then the difference in TVC between the lower costly treatment and the subsequent higher costly treatment. The MB was calculated in the same way, but using the NB values. Then, using the formula shown in Equation (2) below, the marginal rate of return (MRR), which measures the level of returns to the investment costs, was computed. The MRR for the respective sites was computed from the average values of the non-dominated N fertilization treatments (T2, T3, T4, and T5). Sensitivity analysis was performed by recalculating the MRR based on the projected future price (50% price inflation) of mineral fertilizers and Rhizobium inoculants to understand the degree of risk involved in making the proposed change as described by [21].
M R R = ( c h a n g e   i n   N B ÷ c h a n g e   i n   T V C )
with change in NB calculated relative to treatment with smaller net benefits and the subsequent treatment with larger net benefits: (for mineral N fertilization treatments: T1–T4) and T2 for the integrated N fertilization treatment (T5). The TVC was calculated relative to the treatment with lower N fertilization costs and the subsequent treatment with higher costs (for mineral N fertilization treatments: T1–T4) and T2 for the integrated N fertilization treatment (T5).

2.5. Statistical Analysis

We performed a one-way analysis of variance (ANOVA) using Equation (3) to assess the effects of N fertilization treatments on yield and economic-related parameters for each site separately but using cycle as a repeated measure in light of the strong interaction between sites and fertilization treatments in both cropping cycles. In every instance, a p-value of 0.05 or less was regarded as significant, and a 95% probability Tukey HSD test was used for multiple mean comparisons. Treatments with MRR above USD 1.18 $−1 were deemed profitable [20,22] in terms of the viability of the evaluated N fertilization strategies [22]. All statistical analyses were performed using the STATISTICA statistical package version 8.0 [23].
Y i j = μ + T i + β j + Ɛ i j  
with Yij banana yield, µ overall mean, Ti the ith N fertilization treatment effect, βj the jth blocking effect, and Ɛij the ijth random error.

3. Results

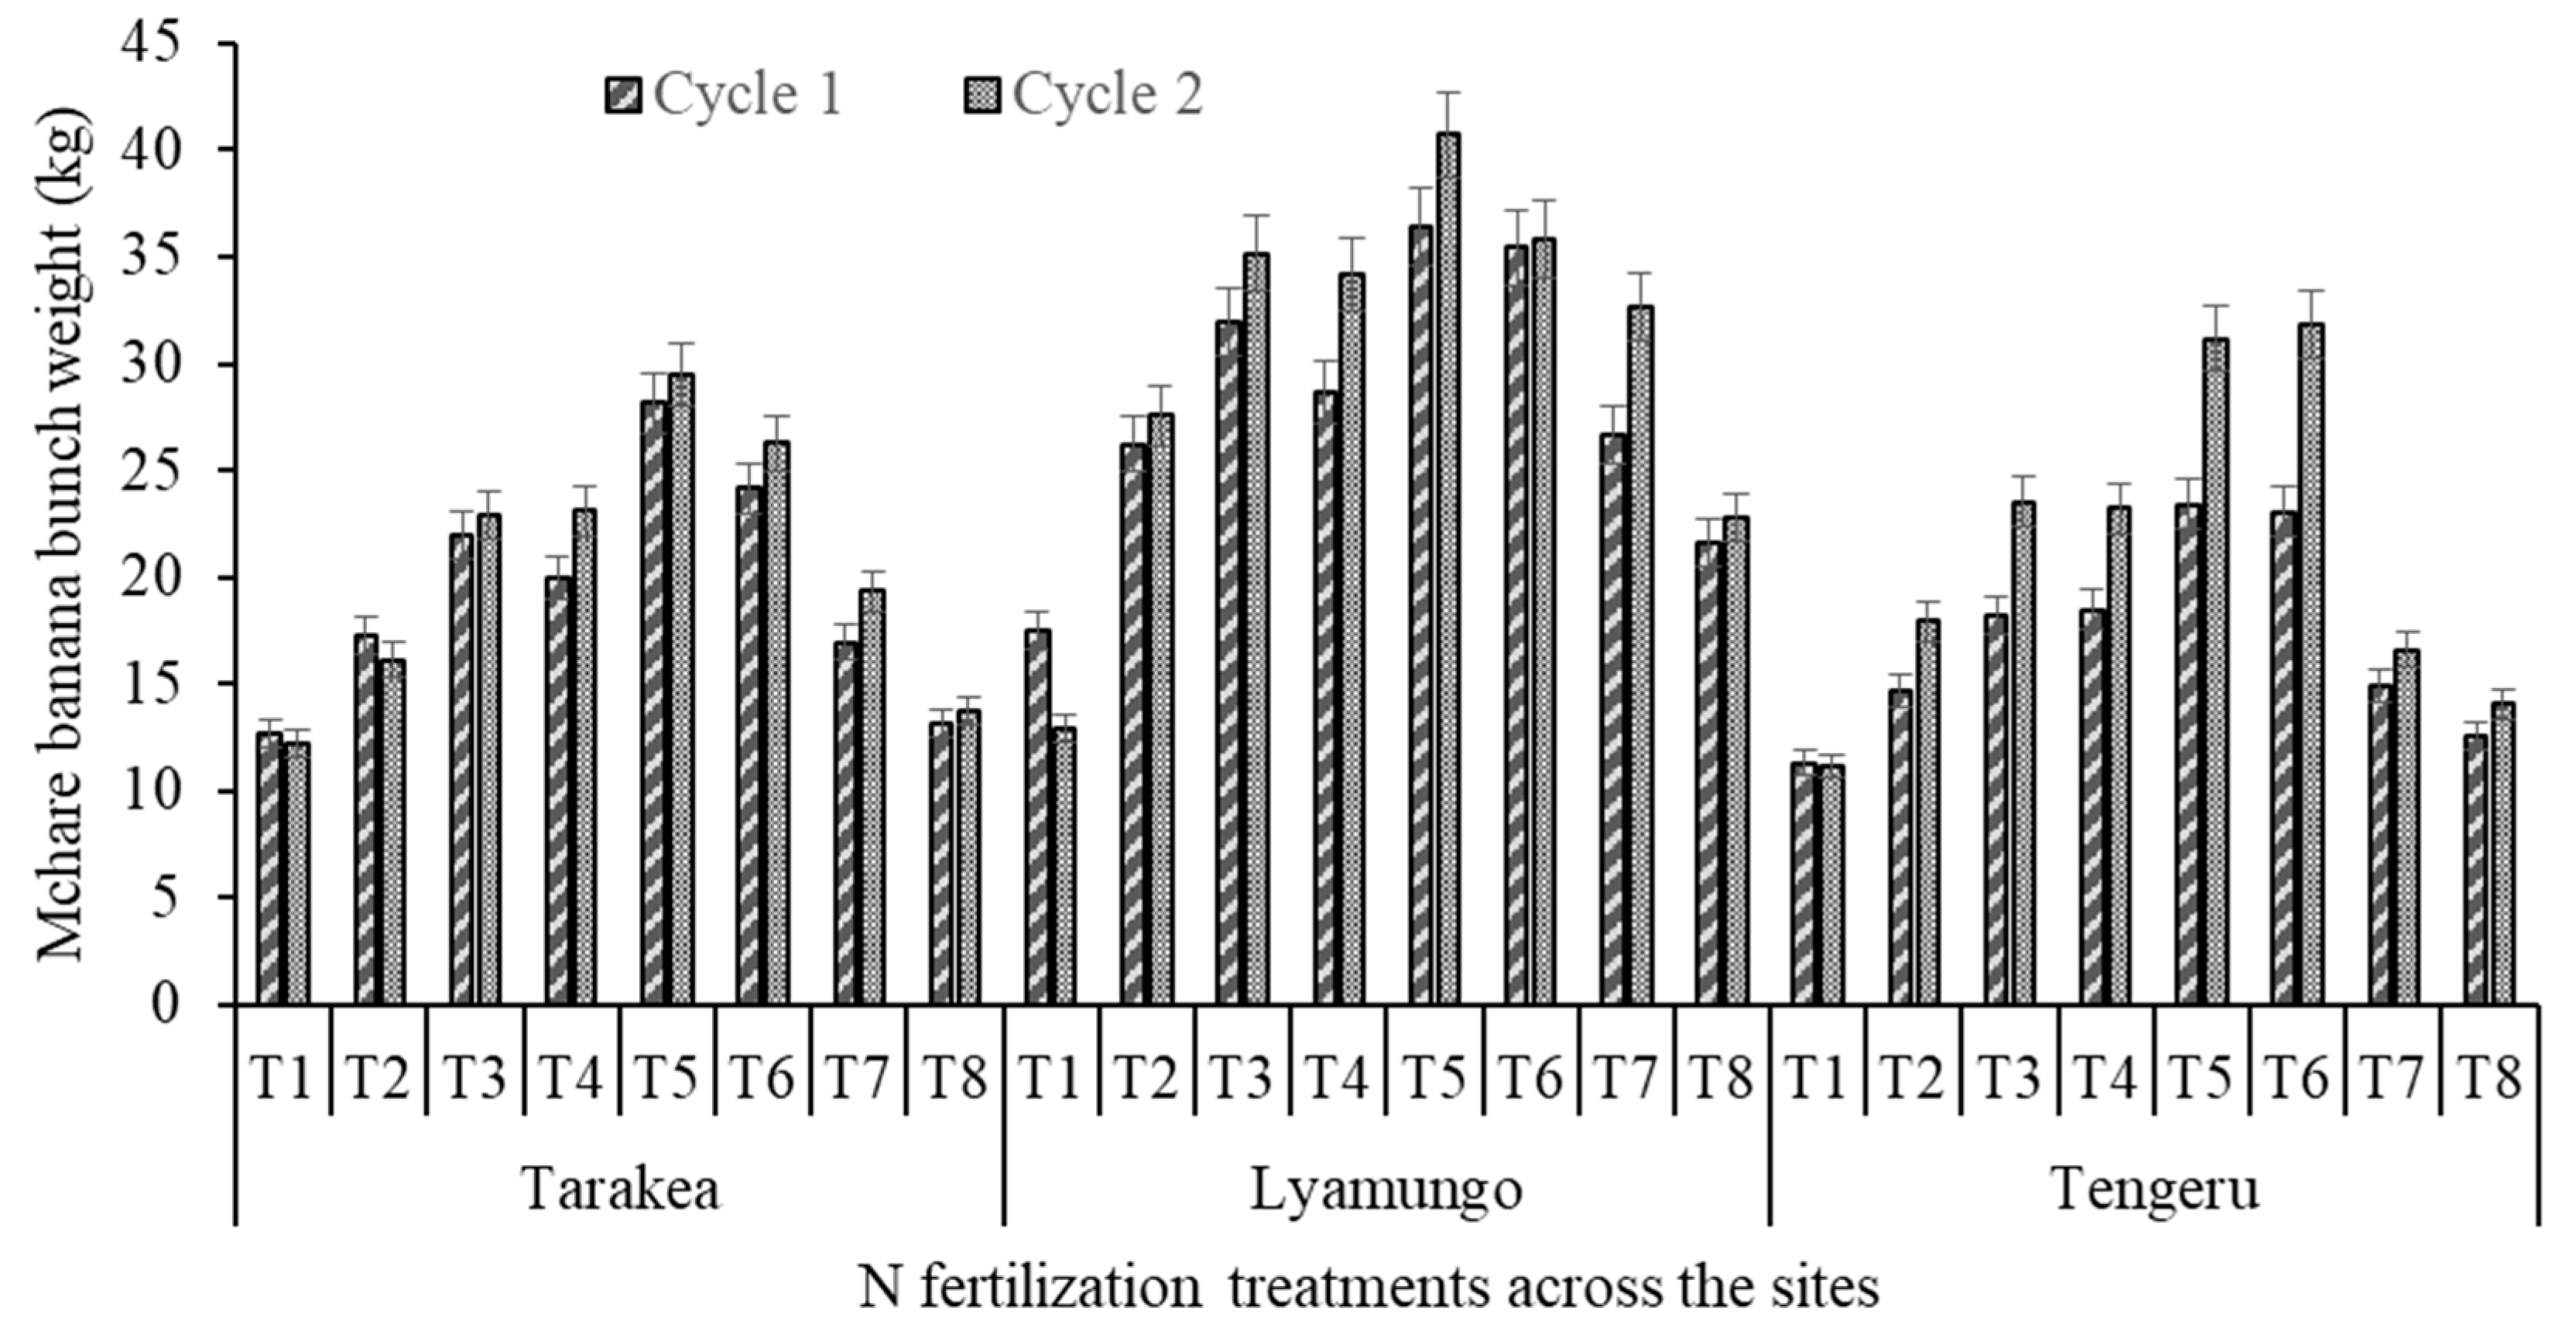
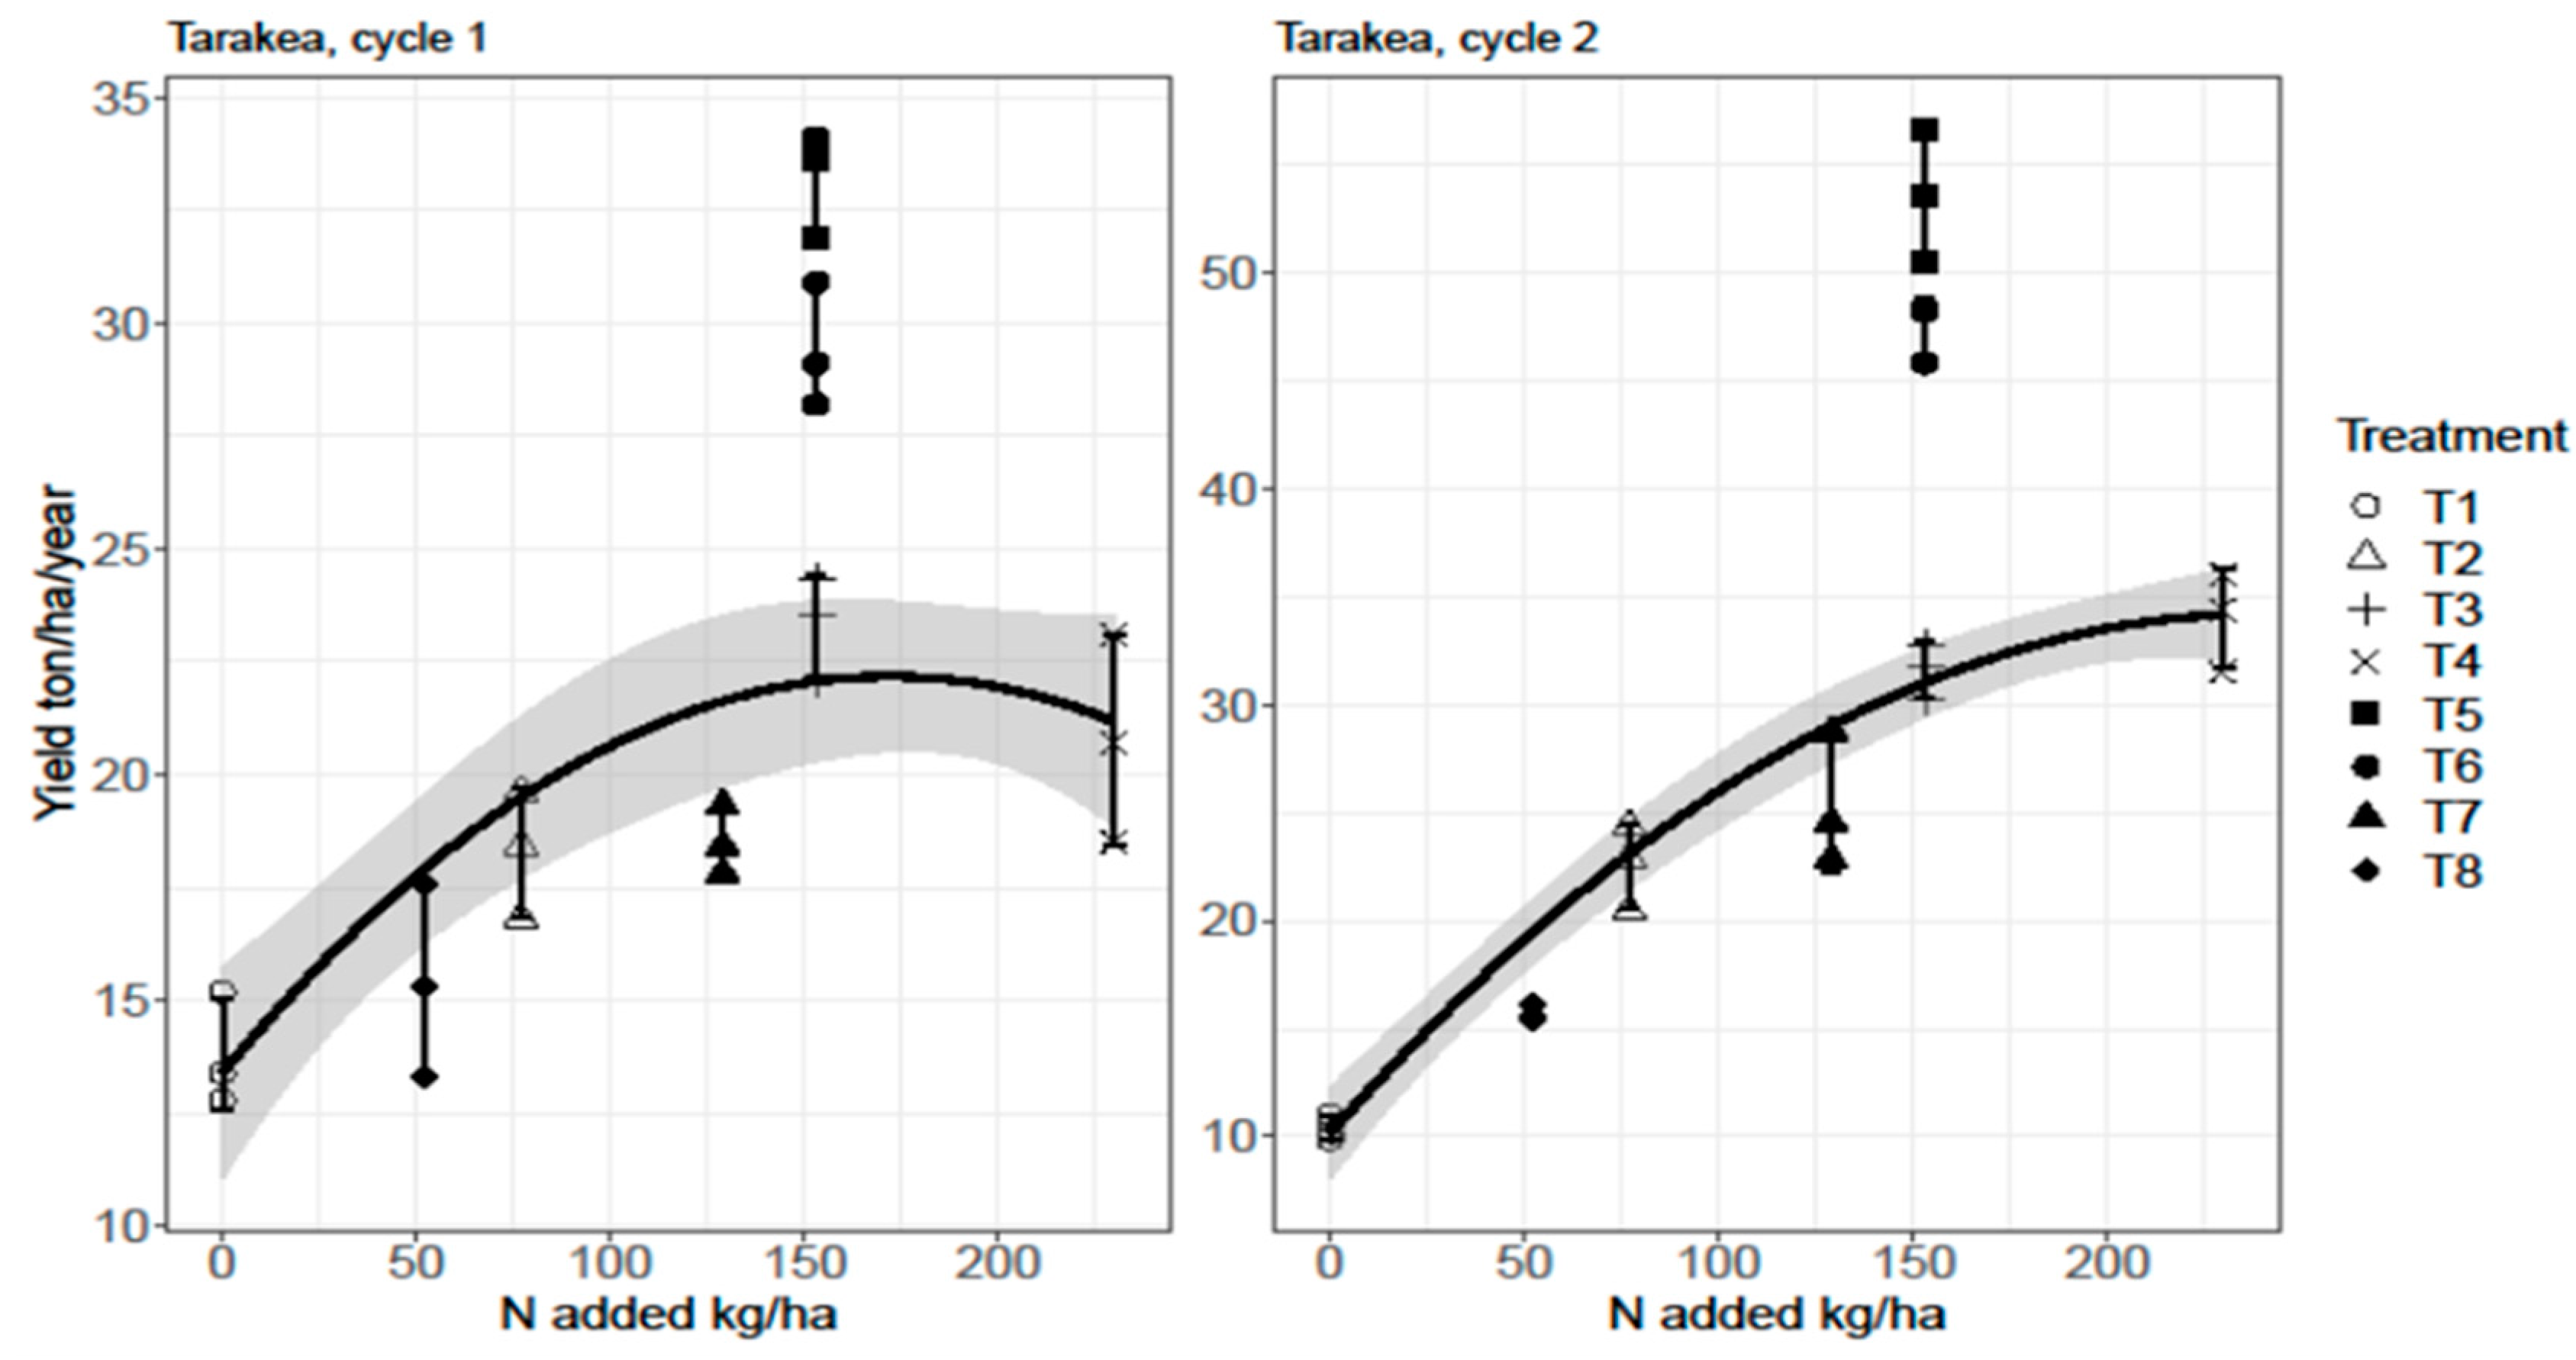
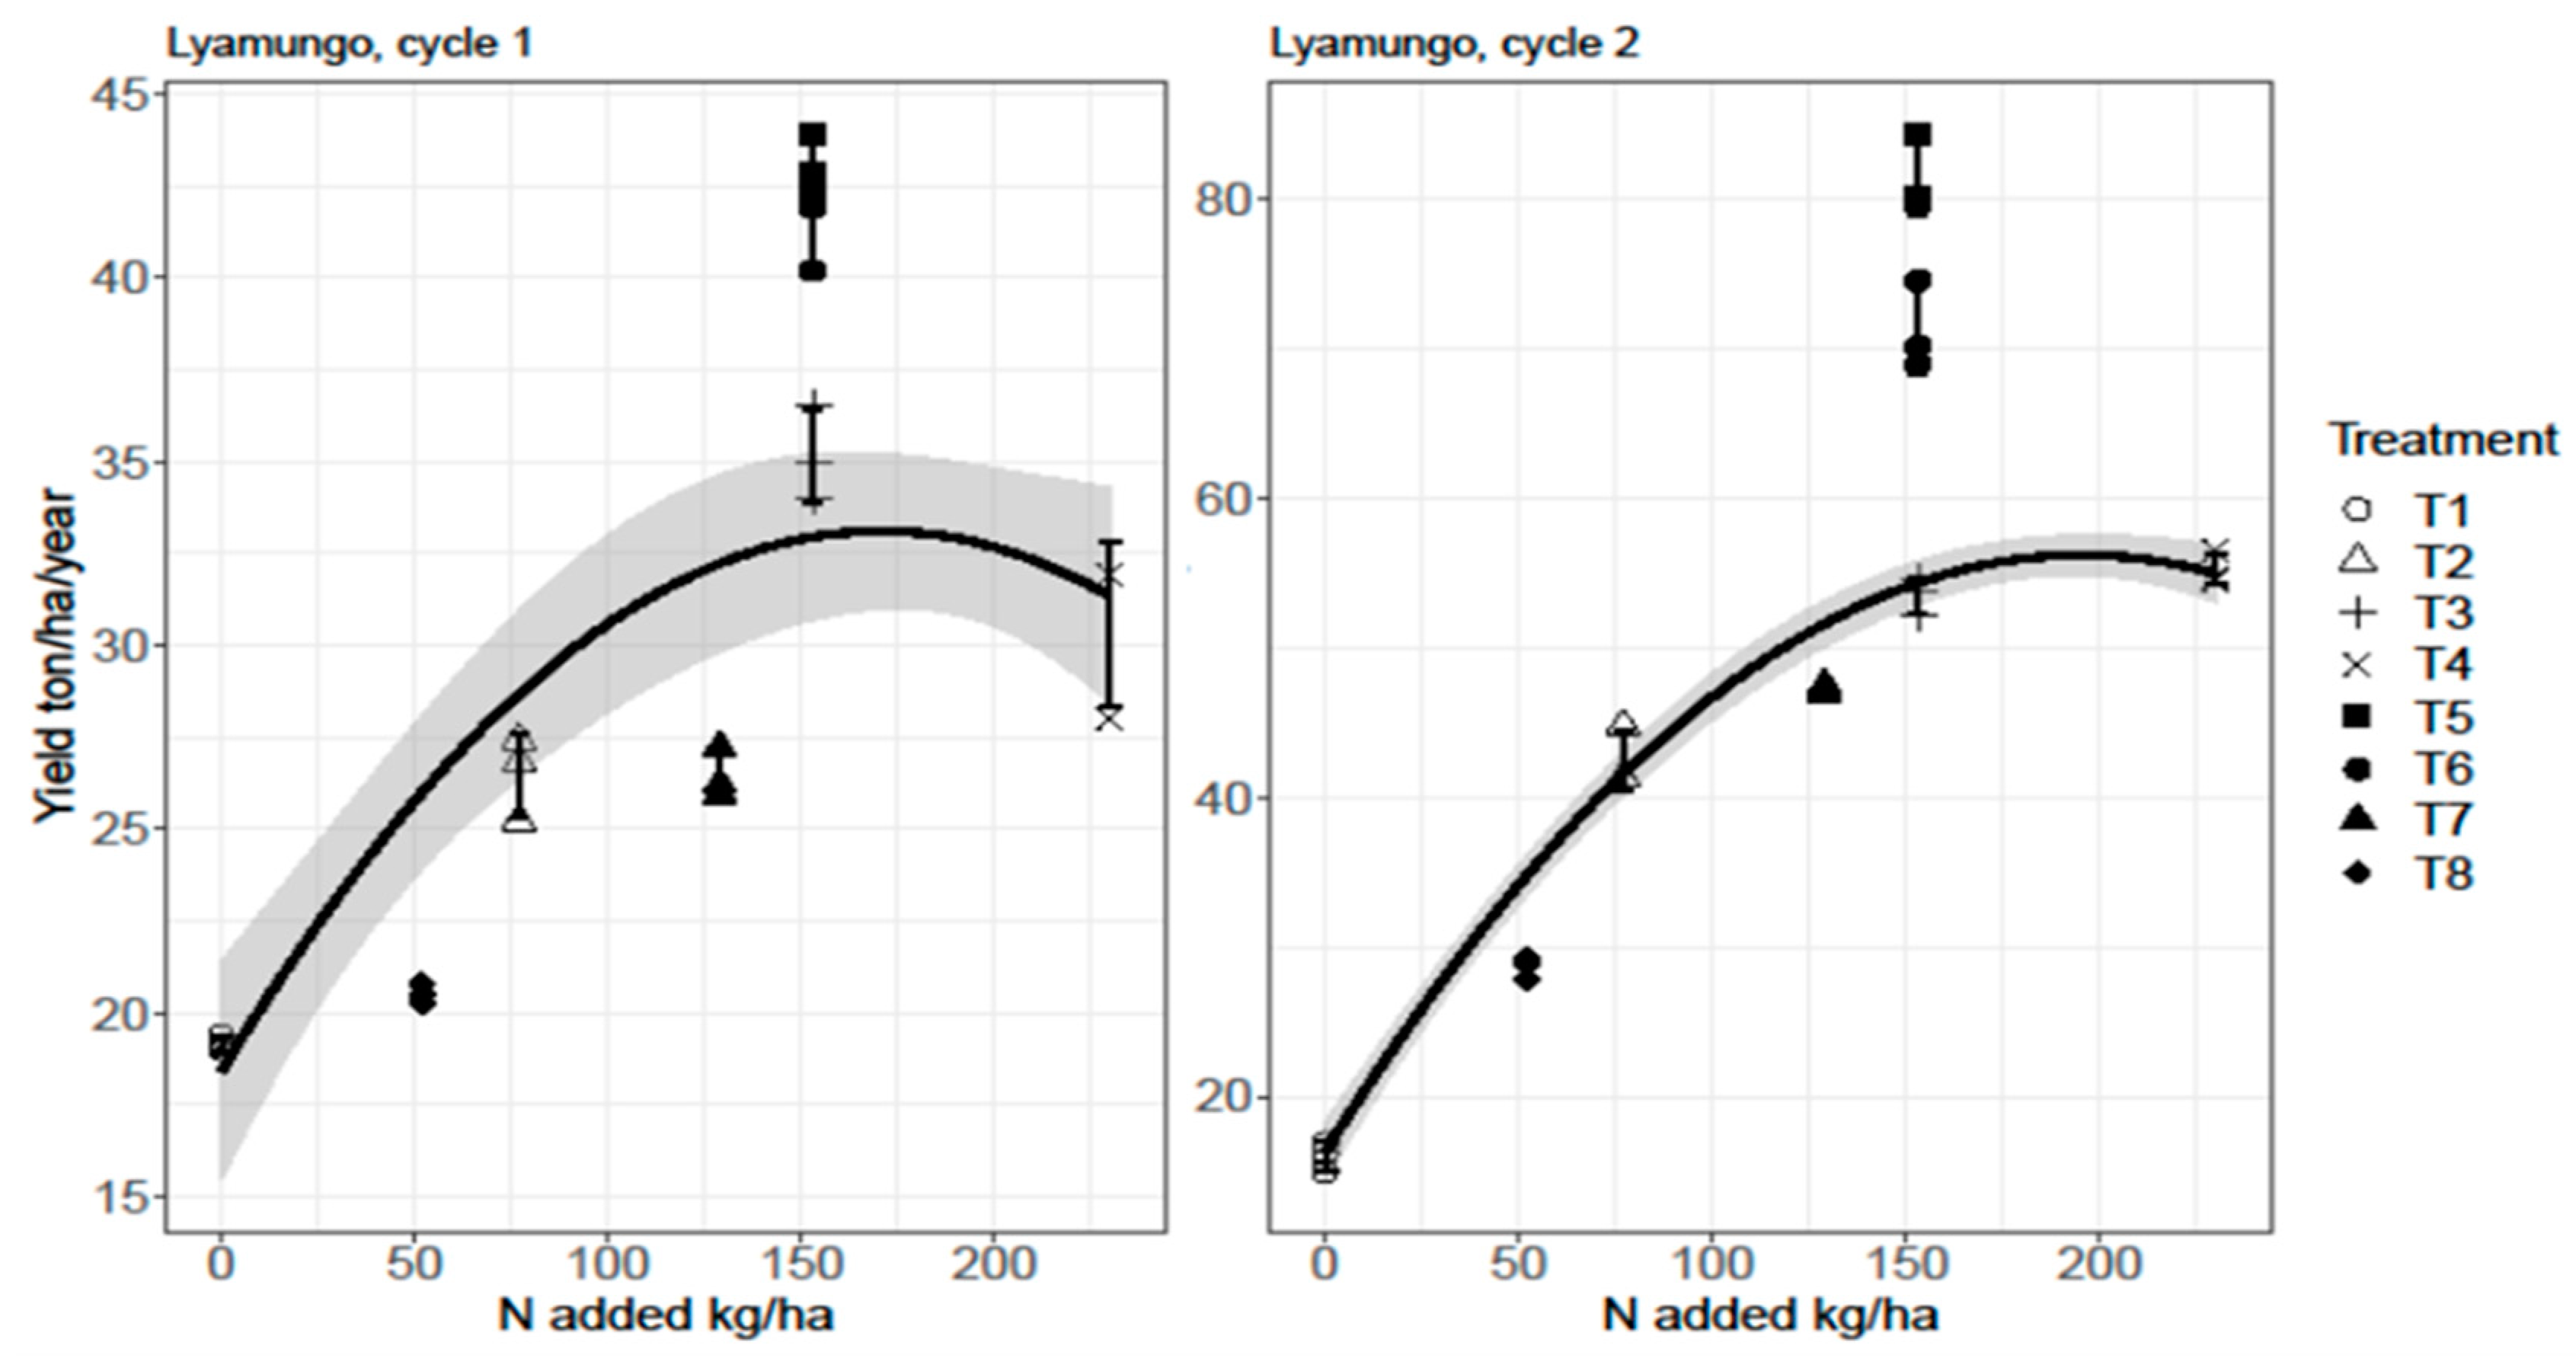
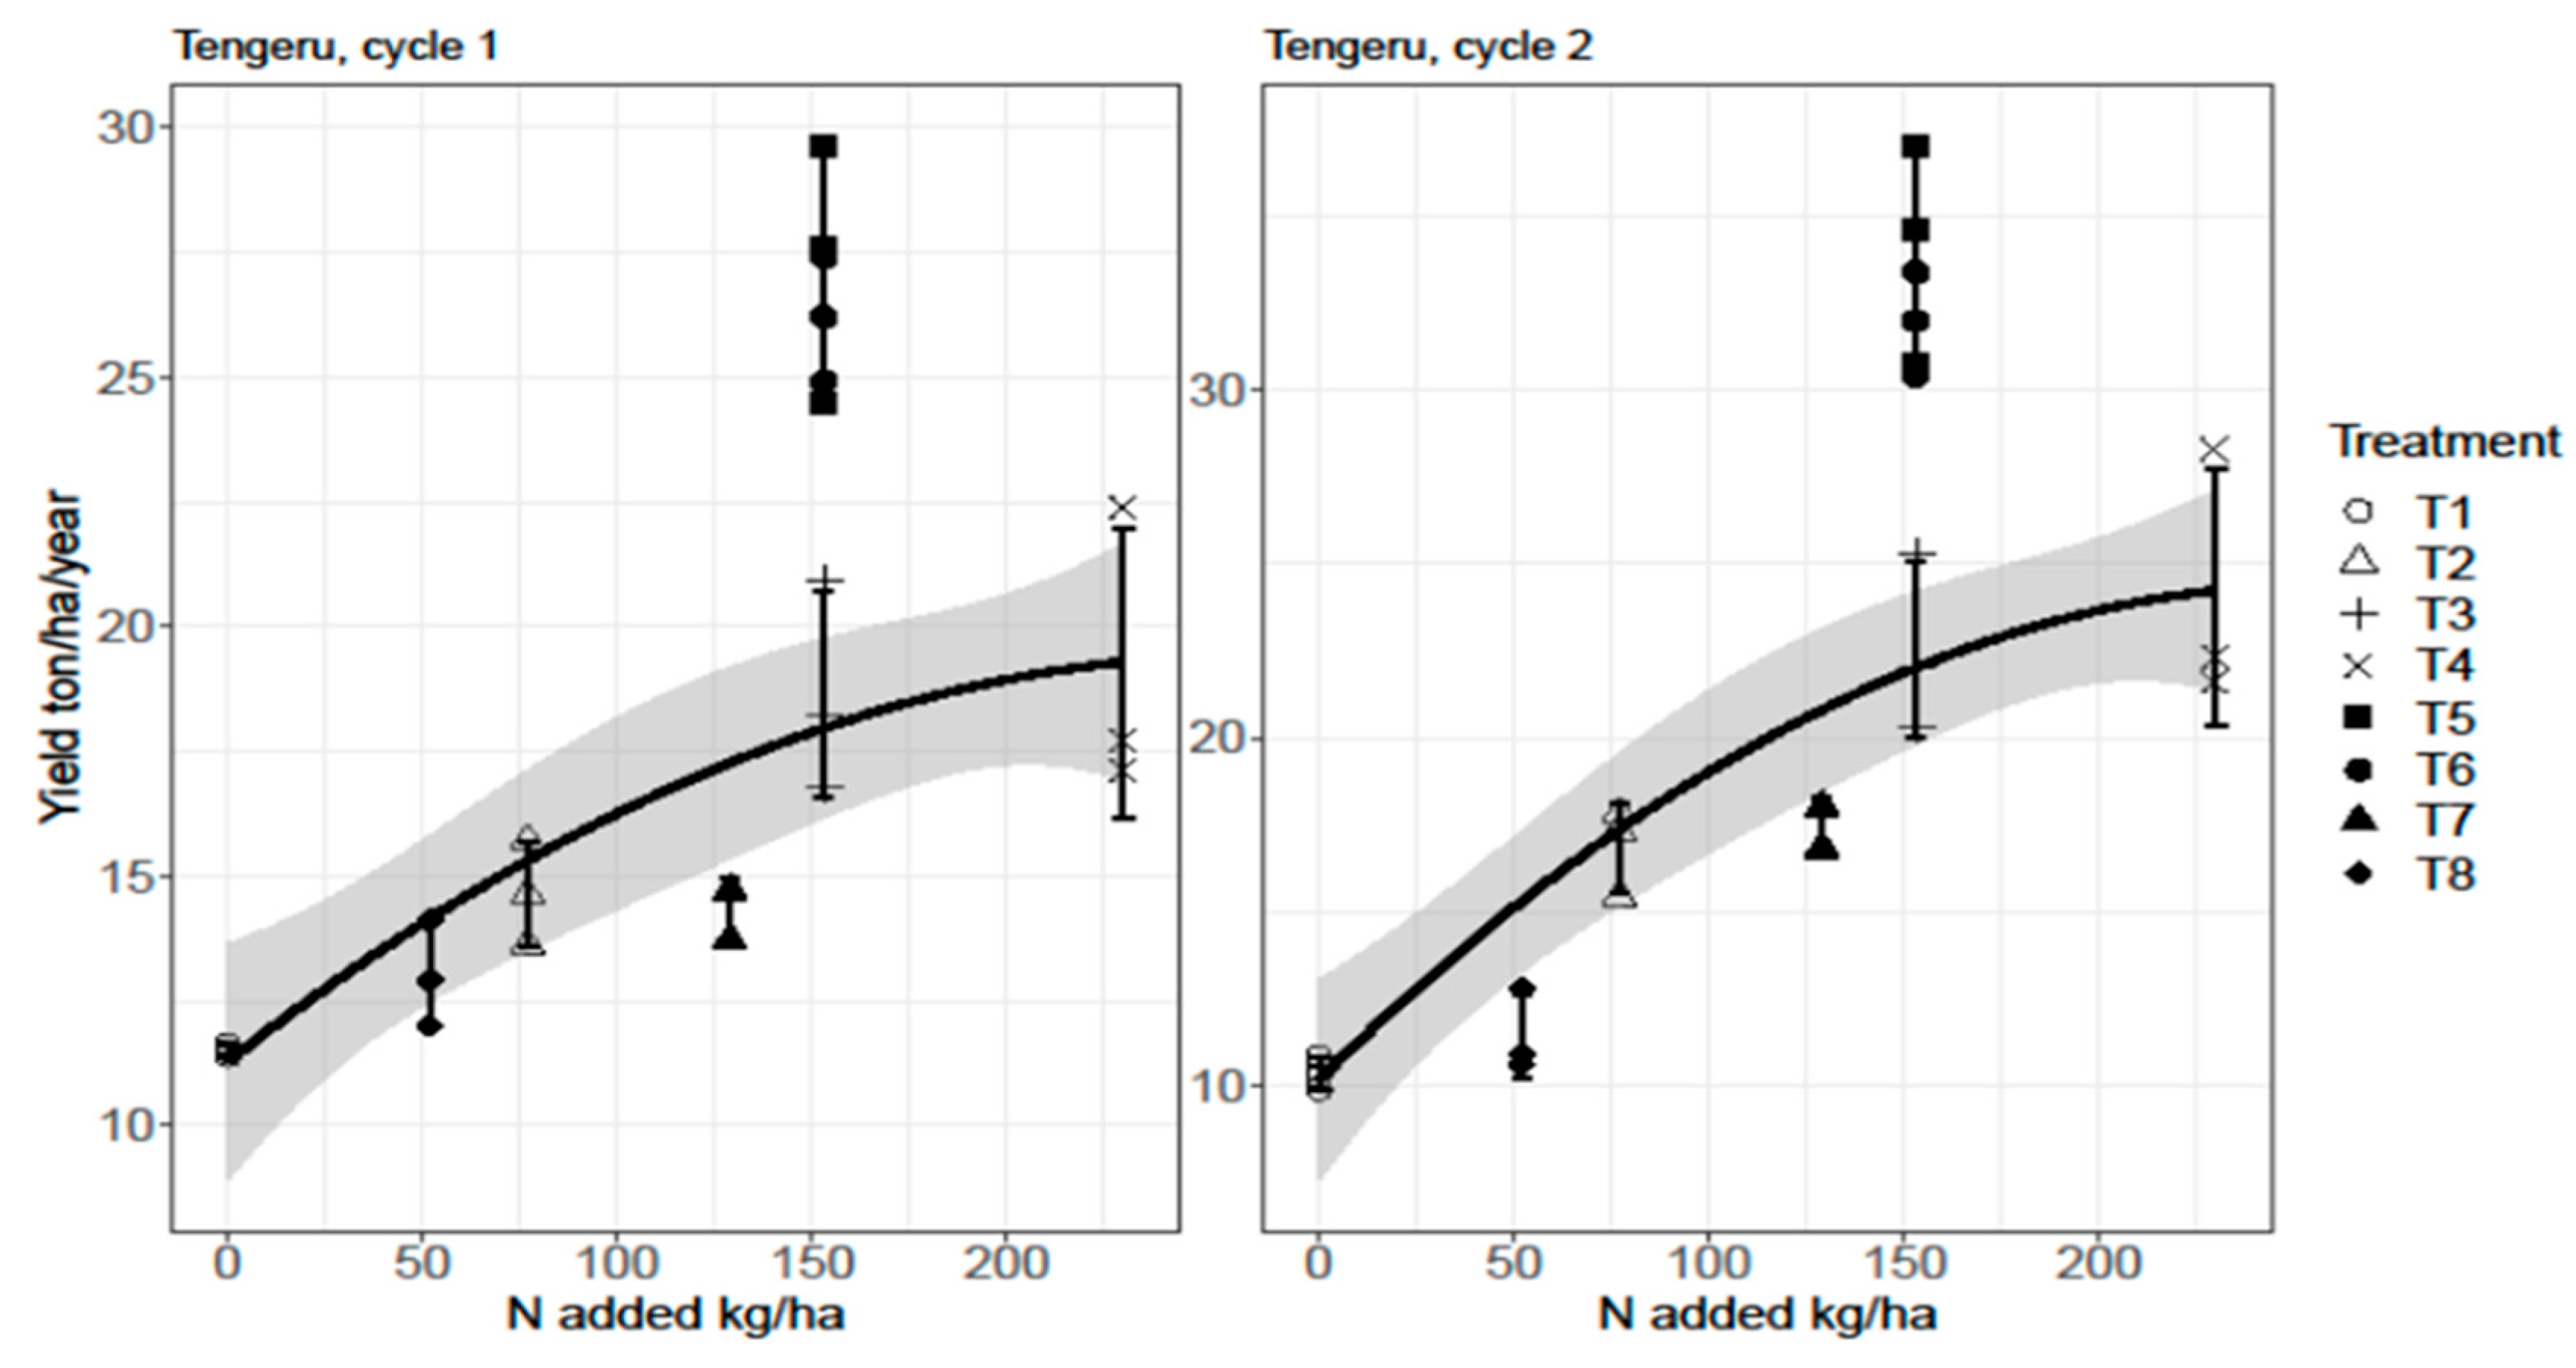
3.1. Agronomic Assessment of N Fertilization

In general, the results indicate that the Mchare banana grown in the most humid site of Lyamungo had more heavy bunches (Figure 1), and, thus, higher banana fruit yields than in the drier sites of Tarakea and Tengeru in both cropping cycles (Table 2). The Mchare banana bunch weight and total fruit yield varied from 12.0 to 35.0 kg (Figure 1) and 11.5 to 42.9 t ha−1 year−1 in cycle one (Table 2), respectively. In cycle two, bunch weight varied from 11.0 to 40.0 kg (Figure 1) and total yield from 10.9 to 82.5 t ha−1 year−1 (Table 2), with an average output of 45 t ha−1 year−1. The Mchare banana’s yields were significantly (p < 0.001) and favorably increased in response to both organic and mineral N fertilization treatments (Table 2). Nevertheless, cattle manure only (T6) or in combination with urea at 50% each (T5) resulted in the highest yield, and were similar to each other in cycle one in Lyamungo and Tengeru, while T5 was higher than T6 in Tarakea (Table 2). On the other hand, cattle manure only (T6) in cycle two produced smaller yield than the integrated approach (T5), except in Tengeru (Table 2). The results further indicate that yields in the control (T1) and common bean haulms only (T8) were quite similar within respective cropping cycles, except in cycle two where T8 demonstrated superior performance compared with T1 in Lyamungo (Table 2).
Furthermore, the results reveal that Mchare banana finger yield was higher in cycle two than in cycle one, except for the control (T1) (Table 2). Mchare banana finger yield in the control decreased by 2.6 t ha−1 year−1 between cycle one and cycle two. When N fertilization treatments were compared within the respective cropping cycle, sole urea (T2–T4) resulted in substantial and significant yield responses up to T3 (Figure 2, Figure 3 and Figure 4). It is interesting to note that after one cycle, sole urea (T2–T4) and cattle manure only (T6) fertilization treatments became more clearly distinct from one another (Figure 2, Figure 3 and Figure 4). However, common bean haulms alone (T8) as an alternative organic treatment did not result in a similar yield increase, with the yield only slightly above the control treatment (T1) (Figure 2, Figure 3 and Figure 4). Similarly, the combination of urea and common bean haulms (T7) did not lift the yield much above that obtained with the smallest N dose derived from urea only (T2) (Figure 2, Figure 3 and Figure 4).

3.2. Economic Analysis of N Fertilization

Nitrogen fertilization costs were higher at Tarakea than Lyamungo and Tengeru sites (Table 3, Table 4 and Table 5). This was due to higher retail prices of mineral fertilizer because Tarakea is far (80 km) from Moshi, a regional business center. Since Lyamungo and Tengeru locations are just 25 km from Moshi town and Arusha city, respectively, the retail price of a 50 kg bag of mineral fertilizer sold at Tarakea includes substantial transport costs in comparison with those two sites. The farm gate price of Mchare banana was similar in all three sites, with a mean of USD 0.23 kg−1. Therefore, large values of NB recorded in the moist areas of Lyamungo were, to a large extent, due to the large production quantity of the tested Mchare banana cultivar. The MRR appeared to increase in cycle two (Table 3, Table 4 and Table 5). The use of urea alone (T2–T4) or in combination with cattle manure at 50% each (T5) was less costly than cattle manure only (T6) and common bean haulms (T7–T8) (Table 3, Table 4 and Table 5). Combined use of urea and cattle manure (T5) reduced N fertilization costs by 41% at Tarakea and Tengeru (Table 3 and Table 5) and 23% at Lyamungo (Table 4) compared with that of cattle manure only (T6). The NB did not differ significantly (except for Tarakea, p < 0.001) between N fertilization treatments, but the values were relatively larger in cycle two than in cycle one at each site. With the exception of Tengeru, sole urea applications at 153.4 kg N ha−1 year−1 (T3) produced greater NB than the other mineral N fertilization treatments (T2 and T4). However, the largest NB value was obtained when using urea in combination with cattle manure, each contributing 50% of the annual N rate (T5) (Table 3, Table 4 and Table 5). Common bean haulms alone (T8) produced the smallest NB relative to the other N fertilization treatments (Table 3, Table 4 and Table 5). The results further reveal that T4 (except for Tengeru), T6, T7, and T8 were dominated (Table 3, Table 4 and Table 5) and, thus were excluded from the marginal analysis. In general, the MRR of the mineral N fertilization treatments (T2, T3, and T4) decreased with utilization costs reflected in N dose and was lowest in T4 (Table 3, Table 4 and Table 5). Inflating prices of mineral fertilizer and the labor costs for application resulted in further reduction of the MRR to the investment capital (Table 3, Table 4 and Table 5). The obtained values, however, exceeded the estimated minimum acceptable MRR in our analysis, which was USD 1.18 $−1.

4. Discussion

4.1. Agronomic Assessment of N Fertilization

The yield at Lyamungo increased to 35.1 t ha−1 year−1 in cycle one and 53.4 t ha−1 year−1 in cycle two under 153.4 kg mineral N ha−1 year−1 (T3), which is higher than that achieved under 230 kg mineral N ha−1 year−1 (T4), according to fertilization response curves (Figure 2, Figure 3 and Figure 4). Nevertheless, when the same quantity of N is derived from a 50% mixture of urea and cattle manure (T5), yield increases of up to 28.0 t ha−1 year−1 or 34.4% can be reached. Our findings further revealed that the integrated approach (T5) in cycle one improved Mchare banana productivity equally well as cattle manure only (T6), which mimics the standard farmers’ practice in the country. Then, yields in the integrated approach (T5) were significantly higher than that attained in the conventional mode of production (T6) in cycle two (except for Tengeru, where these two treatments performed the same). This is in line with earlier studies, e.g., by [12,14,15,16,24,25,26,27,28], where the usage of both organic and inorganic fertilizers produced higher yields than using either organic or inorganic fertilizers alone. Therefore, this shows that the integrated approach (T5) can be used to replenish nutrients and manage soil N in farmsteads with inadequate quantities of cattle manure while improving banana productivity and maintaining environmental sustainability.
In comparison to the control (T1), retaining common bean haulms as the only source of organic N fertilizer (T8) increased production significantly (Figure 2, Figure 3 and Figure 4), but compared to the control treatment (T1), this increment was only 1.4 t ha−1 year−1 in cycle one and 12.5 t ha−1 year−1 in cycle two, or 6.8 and 43.8%, respectively. A slowly building residual effect of the inoculated common bean intercrop, which adds organic N to the soil through the decomposing roots and haulms, may be responsible for the significant yield increase shown in cycle two. Legume intercropping has been reported to increase yield in earlier studies, e.g., [29] in plantain, [30] in robusta coffee (Coffea robusta), and [31] in banana cv. ‘Prata Anã’. Therefore, for the peasant farmer who has limited access to animal manure and/or mineral fertilizers, an inoculated legume intercrop can be utilized as an alternate package to improve soil N. In the intercrop treatment plots, the amount of N derived from common bean haulms only hardly reached 52 kg ha−1 year−1 (Tables S1 and S2), which was insufficient to meet the N needs of the tested Mchare banana cultivar. This could be explained by the small quantity of common bean haulms produced in situ in the corresponding intercrop treatment plots, probably as a result of the study’s high banana planting density, which prevented each mat from receiving enough haulms. Still, an inoculated common bean intercrop can be a viable option in households with inadequate amounts of animal manure, especially when banana mats are more widely spaced. This is in agreement with earlier recommendations published in [32,33].
The response curves (Figure 2, Figure 3 and Figure 4) further indicate a higher yield variability in cycle one than in cycle two. As a rule, crop plants established with in vitro plants should have a lower yield variability, and yield and yield variability increase gradually in the subsequent cycles. Higher yield variations observed in cycle one can be ascribed to two events that occurred in the course of our research. First, mole rat infestation in the first 4 months after planting at Lyamungo and Tarakea trial sites destroyed almost 2/3 of the plants. As such, there were several rounds of replanting depending on the time of destruction. Second, heavy loss of the banana plants occurred due to a strong windstorm at the Tengeru trial site almost 10 months after planting. Toppled plants were cut just above the soil level to allow regrowth. Unusual lower yield variations observed in cycle two at Lyamungo and Tarakea trial sites could be attributed to the challenges in estimating harvesting dates of the individual plants because they were 80 and 150 km from Arusha where the researcher was based. As a result, some bunches were harvested a little earlier to reduce field visit frequencies and minimize travel costs. This seemed to have caused some inaccuracies in estimating the cycle duration of individual plants, an important component when calculating yield per year.

4.2. Economic Evaluation of N Fertilization

The large MRR of the non-dominated N fertilization treatments (T2–T5) recorded at all three sites indicates that these treatments were profitable in the study area. Sensitivity analysis revealed that MRR decreased with price inflation (projected future price) of mineral fertilizers, Rhizobium inoculants, and the associated labor costs for the application. Nonetheless, the MRR of investment continued to exceed USD 1.18 $−1, which was estimated as the minimum acceptable level in our study. This suggests that non-dominated N fertilization treatments can still be acceptable to farmers in the study area even if mineral N fertilizer utilization cost would inflate by 50%. The combined use of urea and cattle manure at 50% each of the annual N budget (T5) appears to lower the requirements for animal manure and fertilization costs, on average, by 50 and 32% respectively, compared with the use of cattle manure exclusively (T6), while it is possible that this difference depends on the site. This was due to reduced transportation costs of additional manure from the nomadic cattle herds roaming in the drier lowlands, and the labor to apply.
In terms of economic performance, fertilization at a rate of 153.4 kg N ha−1 year−1 using a mixture of urea and cattle manure at 50% each (T5) increased NB up to USD 1640 (21%) in cycle one and USD 2983 (30%) in cycle two in comparison with the same rate derived from mineral N alone (T3). Likewise, the integrated approach (T5) gave NB increments of up to USD 1130 (18%) in cycle one and USD 1808 (18%) in cycle two relative to that obtained in cattle manure only (T6). This difference was mainly due to (i) lower production costs of the integrated application (T5) than the use of cattle manure alone (T6), of which the latter had higher transportation and application costs, and (ii) higher yields than in the traditional mode of production (T6). Compared with the control (T1), NB increment in common bean haulms (T8) was smaller than those attained with other N fertilization techniques. This could be explained by the low productivity of the system, which corroborates previous findings e.g., by [12,32,33] when bush and climbing beans were grown in association with bananas.
The MRR in non-dominated N fertilization treatments was greater in cycle two than in cycle one and appeared to decrease with the N fertilization rate. The MRR in treatments involving mineral N alone (T2–T4) recorded significant MRRs in comparison to the treatment comprising cattle manure plus urea at 50% each (T5). A similar decreasing trend in the MRR was published in [16] for P fertilization in maize, with a mean of USD 8.4, 6.1, and 3.5 $−1 under 13, 26, and 52 kg mineral P ha−1, respectively. In addition, [26] recorded higher returns of up to USD 9.4 $−1 in highland bananas grown under pure mineral fertilization. Even though the integrated N fertilization treatment (T5) had the lowest value of MRR among the non-dominated treatments, the value still exceeded the projected minimum acceptable rate of USD 1.18 $−1 in our study, demonstrating the profitability of this novel strategy in addressing Mchare banana nutrient requirements in the study area. Due to this, the integrated approach (T5) is the best alternative N fertilization option for farmsteads in the research area that do not have enough animal manure. The integrated strategy increases nutrient uptake and, thus, the utilization efficiency of the applied mineral N fertilizer [12,16], which in turn increases the cropping system’s sustainability.
These findings further revealed that the tested Mchare banana cultivar in the integrated approach (T5) provided the best yields, approximately 29.8% of the yield reached in the control (T1), the latter mimicking smallholder farmer conditions. Earlier, the studies by [3,6,8] estimated that 60-70% of the harvested banana bunches in the study area are used for family consumption, and the remaining 30-40% of the banana bunches are sold mainly in the fresh local market. This means that the integrated approach (T5) can produce surpluses of up to 13.5 t ha−1 year−1 (with a planting density of 1666 plants ha-1), which can generate about USD 3105 ha−1 year−1 from surplus sales of banana bunches. Translating these figures to a 0.5 ha well-fertilized plot in the uplands [3], with 417 plants and an average bunch weight of 31.5 kg, one would conclude that a banana-based home garden in the central–northern highlands of Tanzania can generate up to USD 905 year−1 by surplus sales of banana bunches only. Annual household income of a smallholder farmer is around USD 321, generated by surplus sales of all crops cultivated in a 0.5 ha banana-based home garden in the uplands and 0.4 ha maize-based fields in the drier lowlands of the northern highlands, Tanzania. Hence, it could be argued that better N fertilization could significantly improve banana-based home gardens’ productivity and boost household income from banana sales alone by 36% compared with the current figures obtained under the existing smallholder conditions.

5. Conclusions

Banana fruit yields increased substantially and significantly as the crop stayed for a longer time in the field, with the N fertilization treatments producing more in cycle two than in cycle one. Banana plants grown in the integrated approach (T5) produced the same yield as those in cattle manure only (T6) in cycle one, while land productivity became significantly higher in cycle two in all three sites. This infers that it is critical to draw conclusions regarding the best-performing N fertilization technique based on crop productivity of two cropping cycles. The decrease in land productivity observed in low-nutrient-input treatment plots (T1) in the subsequent cropping cycle depicts the actual scenario in the majority of farmsteads that are unable to produce enough animal manure.
According to a partial budget of the costs and benefits, using cattle manure alone (T6) was the most expensive N fertilization technique. In contrast, the integrated approach (T5) reduced N fertilization costs, on average, by 32% related to 50% less cattle manure requirements and, thus, transportation costs of additional manure and labor to apply. Furthermore, this approach generated a household income of about USD 905 year−1 by surplus sales of banana bunches, which is substantial for a smallholder farmer. This income allows for covering annual health insurance for all household’s family members, education expenses for the children, and electricity and water bills. Therefore, a potential and cost-effective alternative strategy for replenishing soil nutrients in farmsteads with insufficient amounts of animal manure appears to be the combined use of cattle manure and mineral N, each supplying 50% of the annual N budget.

Supplementary Materials

The following supporting information can be downloaded at: https://www.mdpi.com/article/10.3390/agronomy13051418/s1: Figure S1. Monthly rainfall, crop duration, and harvesting periods during the experimental period at the Lyamungo research site located on the southeast slopes of Mount Kilimanjaro. CD refers to the crop duration of both cycles one and two; FPC1 flowering period cycle one; HPC1 harvesting period cycle one; HPC2 harvesting period cycle two. Figure S2. Monthly rainfall, crop duration, and harvesting periods during the experimental period at the Tarakea research site located on the northeast slopes of Mount Kilimanjaro. CD refers to the crop duration of both cycles one and two; FPC1 flowering period cycle one; HPC1 harvesting period cycle one; HPC2 harvesting period cycle two. Figure S3. Monthly rainfall, crop duration, and harvesting periods during the experimental period at the Tengeru research site located on the southeast slopes of Mount Meru. CD refers to the crop duration of both cycles one and two; FPC1 flowering period cycle one; HPC1 harvesting period cycle one; HPC2 harvesting period cycle two. Source: [18]. Table S1. Common bean haulms produced in situ in the banana–bean intercrop treatment plots in each site and nutrients supplied by the haulms (kg ha−1 year−1). Table S2. Fertilization treatments, nutrient sources, and application rates used in the field experiments. Table S3. Mineral nutrient dose (g mat−1 year−1) in the respective fertilization treatments, annual fertilizer budget, and application time during rainy seasons of each year. Table S4. Variable costs (USD ha−1 year−1) involved in each fertilization treatment at Tarakea located on the northeast slopes of Mount Kilimanjaro in northern highlands, Tanzania. Table S5. Variable costs (USD ha−1 year−1) involved in each fertilization treatment at Lyamungo located on the southeast slopes of Mount Kilimanjaro in northern highlands, Tanzania. Table S6. Variable costs (USD ha−1 year−1) involved in each fertilization treatment at Tengeru located on the southeast slopes of Mount Meru in northern highlands, Tanzania.

Author Contributions

A.I.M.: investigation, formal analysis, data curation, writing—original draft preparation; K.M.M.: writing—reviewing and editing the first draft of the manuscript; P.A.N., R.S. and R.M.: funding acquisition, supervision, writing—reviewing and editing the final draft of the manuscript. All authors have read and agreed to the published version of the manuscript.

Funding

This work was supported by (i) the Government of Belgium through the VLIR-UDC program for institutional support to the Nelson Mandela African Institution of Science and Technology, Tanzania, and (ii) the CGIAR Fund (http://www.cgiar.org/who-we-are/cgiar-fund/fund-donors-2/) (accessed on April 10 2021), and in particular to the CGIAR Research Program Roots, Tubers, and Bananas (RTB-CRP).

Institutional Review Board Statement

Not applicable because the study did not involve humans or animals.

Informed Consent Statement

Not applicable.

Data Availability Statement

The dataset is not available because it has been submitted to the library of the Nelson Mandela African Institution of Science and Technology, Tanzania and will be made available online in accordance with institutional policies.

Acknowledgments

The authors are indebted to the host institutions (NM-AIST, Tarakea secondary school, and TARI-Lyamungo) on whose lands the field experiments were established. We also thank Jan Diels for suggestions and support with some economic and statistical aspects of this paper.

Conflicts of Interest

The authors declare no conflict of interest.

References

  1. Baijukya, F.P.; de Ridder, N.; Masuki, K.F.; Giller, K.E. Dynamics of banana-based farming systems in Bukoba District, Tanzania: Changes in land use, cropping and cattle keeping. Agric. Ecosyt. Environ. 2005, 106, 395–406. [Google Scholar] [CrossRef]
  2. Soini, E. Land use change patterns and livelihood dynamics on the slopes of Mt. Kilimanjaro, Tanzania. Agric. Syst. 2005, 85, 306–323. [Google Scholar] [CrossRef]
  3. Ichinose, Y.; Higuchi, H.; Kubo, R.; Nishigaki, T.; Kilasara, M.; Shinjo, H.; Funakawa, S. Adaptation of farmland management strategies to maintain livelihood by the Chagga people in the Kilimanjaro highlands. Agric. Syst. 2020, 181, 102829. [Google Scholar] [CrossRef]
  4. Ikegami, K. The traditional agrosilvipastoral complex system in the Kilimanjaro region, and its implications for the Japanese-assisted lower irrigation project. Afr. Study Monogr. 1994, 15, 189–210. [Google Scholar] [CrossRef]
  5. Maruo, S. Differentiation of subsistence farming patterns among the Haya banana growers in northwestern Tanzania. Afr. Study Monogr. 2002, 23, 147–175. [Google Scholar]
  6. Promar Consulting. Fact-Finding Survey for the Support Aid to Developing Countries: Agriculture, Forestry, and Fisheries of Tanzania; Promar Consulting: Tokyo, Japan, 2011; p. 151. [Google Scholar]
  7. Famine Early Warning Systems Network (FEWS NET). Tanzania Market Fundamentals Summary. 2018. p. 33. Available online: https://fews.net/east-africa/tanzania/market-fundamentals/august-20-2018 (accessed on 24 August 2019).
  8. Bill and Melinda Gates Foundation (BMGF). Multi Crop Value Chain Phase II Tanzania/Uganda Cooking Banana (Revisions). 2014, p. 90. Available online: https://gatesopenresearch.org/documents/3-716 (accessed on 24 August 2019).
  9. Rugalema, G.H.; Okting’ati, A.; Johnsen, F.H. The home garden agroforestry system of Bukoba district, North-Western Tanzania. 1. Farming system analysis. Agrof. Systs. 1994, 26, 53–64. [Google Scholar] [CrossRef]
  10. Raeymaekers, S.; Stevens, B. Characterization of Banana-Based Farming Systems in the Upper-Pangani Basin, Tanzania. Master’s Thesis, Katholieke Universiteit Leuven, Leuven, Belgium, 2015; p. 217. [Google Scholar]
  11. Vandekerckhove, E.; Young, M. Characterization of Banana-Based Farming Systems in the Upper-Pangani Basin, Tanzania. Master’s Thesis, Katholieke Universiteit Leuven, Leuven, Belgium, 2016; p. 188. [Google Scholar]
  12. Meya, A.I.; Ndakidemi, P.A.; Mtei, K.M.; Swennen, R.; Merckx, R. Optimizing soil fertility management strategies to enhance banana production in volcanic soils of the Northern Highlands, Tanzania. Agronomy 2020, 10, 289. [Google Scholar] [CrossRef]
  13. Maro, G.; Msanya, B.; Mrema, J. Soil fertility evaluation for coffee (Coffea arabica) in Hai and Lushoto districts, northern Tanzania. Int. J. Plant Soil Sci. 2014, 3, 934–947. [Google Scholar] [CrossRef]
  14. Chivenge, P.; Vanlauwe, B.; Six, J. Does the combined application of organic and mineral nutrient sources influence maize productivity? Plant Soil. 2011, 342, 1–30. [Google Scholar] [CrossRef]
  15. Ripoche, A.; Achard, R.; Laurens, A.; Tixier, P. Modeling spatial partitioning of light and nitrogen resources in banana cover-cropping systems. Eur. J. Agron. 2012, 41, 81–91. [Google Scholar] [CrossRef]
  16. Otinga, A.N.; Pypers, P.; Okalebo, J.R.; Njoroge, R.; Emong’ole, M.; Six, L.; Vanlauwe, B.; Merckx, R. Partial substitution of phosphorus fertilizer by farmyard manure and its localized application increases agronomic efficiency and profitability of maize production. Field Crops Res. 2013, 140, 32–43. [Google Scholar] [CrossRef]
  17. Mustaffa, M.M.; Kumar, V. Banana production and productivity enhancement through spatial, water, and nutrient management. J. Hort. Sci. 2012, 7, 1–28. [Google Scholar]
  18. Meya, A.I. Nutrient Use Efficiency in Banana-Bean Intercropping Systems in the Upper Pangani Catchment, Tanzania. Ph.D. Thesis, Katholieke Universiteit Leuven, Leuven, Belgium, 2021; p. 195. Available online: https://limo.libis.be/primo-explore/fulldisplay?docid=LIRIAS3448113&context=L&vid=Lirias&search_scope=Lirias&tab=default_tab&fromSitemap=1 (accessed on 20 October 2021).
  19. National Soil Services (NSS). Classification for General Soil Fertility Evaluation; NSS, Mlingano Research Institute: Tanga, Tanzania, 1990; p. 48. [Google Scholar]
  20. International Maize and Wheat Improvement Center (CIMMYT). From Agronomic Data to Farmer Recommendations: An Economics Training Manual; Completely Revised Edition; CIMMYT: Mexico City, Mexico, 1988; p. 79. [Google Scholar]
  21. Alimi, T.; Manyong, V.M. Partial Budget Analysis for On-Farm Research; International Institute of Tropical Agriculture (IITA) Research Guide 65; IITA: Ibadan, Nigeria, 2000; p. 55. [Google Scholar]
  22. Pypers, P.; Bimponda, W.; Lodi-Lama, J.; Lele, B.; Mulumba, R.; Kachaka, C.; Boeckx, P.; Merckx, R.; Vanlauwe, B. Combining mineral fertilizer and green manure for increased, profitable cassava production. Agron. J. 2012, 104, 178–187. [Google Scholar] [CrossRef]
  23. StatSof Inc. STATISTICA (Data Analysis Software System), Version 8; TIBCO, Data Science; Palo-ILTO, CA, 94304, United States of America; 2007. Available online: www.statsoft.com (accessed on 23 June 2018).
  24. Abd el Moniem, E.A.; Abd-Allah, A.S.E.; Ahmed, M.A. The combined effect of some organic manures, mineral N fertilizers and Algal cells extract on yield and fruit quality of Williams banana plants. Am.-Eurasian J. Agric. Environ. Sci. 2008, 4, 417–426. [Google Scholar]
  25. Baijukya, F.P.; de Ridder, N.; Masuki, K.F.; Giller, K.E. Nitrogen release from decomposing residues of leguminous cover crops and their effect on maize yield on depleted soils of Bukoba District, Tanzania. Plant Soil 2006, 279, 77–93. [Google Scholar] [CrossRef]
  26. Wairegi, L.W.I.; Van Asten, P.J.A. The agronomic and economic benefits of fertilizer and mulch use in highland banana systems in Uganda. Agric. Syst. 2010, 103, 543–550. [Google Scholar] [CrossRef]
  27. Vanlauwe, B.; Wendit, J.; Diels, J. Combined application of organic matter and fertilizer. In Sustaining Soil Fertility in West Africa; Tian, G., Ishinda, F., Keatinge, J.D.H., Eds.; Number 58; SSSA Special Publication: Madison, WI, USA, 2001; pp. 247–280. [Google Scholar]
  28. Vanlauwe, B.; Batiano, A.; Chianu, J.; Giller, K.E.; Merckx, R.; Mokwunye, U.; Ohiokpehai, O.; Pypers, P.; Tabo, R.; Shepherd, K.D.; et al. Integrated soil fertility management-operational definition and consequences for implementation and dissemination. Outlook Agric. 2010, 39, 17–24. [Google Scholar] [CrossRef]
  29. Banful, B.; Dzietror, A.; Ofori, I.; Hemeng, O.B. Yield of plantain alley cropped with Leucaena leucocephala and Flemingia macrophylla in Kumasi, Ghana. Agrof. Systs. 2000, 49, 189–199. [Google Scholar] [CrossRef]
  30. Opoku-Ameyaw, K.; Oppong, F.K.; Ofori-Frimpong, K.; Amoah, F.M.; Osei-Bonsu, K. Intercropping robusta coffee with some edible crops in Ghana: Agronomic performance and economic returns. Ghana J. Agric. Sci. 2003, 36, 13–21. [Google Scholar] [CrossRef]
  31. Barbosa, F.E.L.; de Lacerda, C.F.; Amorim, A.V.; Costa, R.N.T.; da Silva, J.A.; Hernandez, F.F.F. Production and economic viability of banana managed with cover crops. Rev. Bras. Eng. Agricola Ambient. 2016, 20, 1078–1082. [Google Scholar] [CrossRef]
  32. Blomme, G.; Ntamwira, J.; Kearsley, E.; Bahati, L.; Amini, D.; Safari, N.; Ocimati, W. Sensitivity and tolerance of different annual crops to different levels of banana shade and dry Season weather. Front. Sustain. Food Syst. 2020, 4, 545926. [Google Scholar] [CrossRef]
  33. Ntamwira, J.; Ocimati, W.; Kearsley, E.; Safari, N.; Bahati, L.; Amini, D.; Lubobo, A.K.; Waswa, B.; Blomme, G. The Integration of Shade-Sensitive Annual Crops in Musa spp. Plantations in South Kivu, Democratic Republic of Congo. Agronomy 2021, 11, 368. [Google Scholar] [CrossRef]
Figure 1. Effects of N fertilization on Mchare banana bunch weight in cycles one and two at three sites located on the slopes of the volcanic mountains Mount Meru and Mount Kilimanjaro in northern highlands, Tanzania. T1—no N (control); T2—76.7 kg N (urea); T3—153.4 kg N (urea); T4—230 kg N (urea); T5—76.7 kg N (urea) + 76.7 kg N (cattle manure); T6—153.4 kg N (cattle manure only); T7—76.7 kg N (urea) + 52 kg N (common bean haulms); T8—52 kg N (common bean haulms only) [18]. Fertilization treatments resulted in a significant (p = 0.001) and positive increase in the bunch weight of the tested Mchare banana variety. The difference between cattle manure (T6) or in combination with urea (T5) and other N fertilization treatments (T2–T8) was definite, and increased in cycle two at each experimental site.
Agronomy 13 01418 g001
Figure 2. Nitrogen fertilization response curve in cycles one and two of Mchare banana grown in volcanic soils of Tarakea located on the northeast slopes of Mount Kilimanjaro in northern highlands, Tanzania. Nitrogen response is fitted with a quadratic polynomial, and the grey areas give the 95% confidence interval. T1—no N (control); T2—76.7 kg N (urea); T3—153.4 kg N (urea); T4—230 kg N (urea); T5—76.7 kg N (urea) + 76.7 kg N (cattle manure); T6—153.4 kg N (cattle manure only); T7—76.7 kg N (urea) + 52 kg N (common bean haulms); T8—52 kg N (common bean haulms only). The relationship between the predictor (N fertilization rate) and the response variable (banana yield) was significant (p = 0.001). The difference between cattle manure (T6) or in combination with urea (T5) and other N fertilization treatments (T2–T8) was distinct and increased in cycle two. Source: [18].
Agronomy 13 01418 g002
Figure 3. Nitrogen fertilization response curve in cycles one and two of Mchare banana grown in volcanic soils of Lyamungo located on the southeast slopes of Mount Kilimanjaro in northern highlands, Tanzania. Nitrogen response is fitted with a quadratic polynomial, and the grey areas give the 95% confidence interval. T1—no N (control); T2—76.7 kg N (urea); T3—153.4 kg N (urea); T4—230 kg N (urea); T5—76.7 kg N (urea) + 76.7 kg N (cattle manure); T6—153.4 kg N (cattle manure only); T7—76.7 kg N (urea) + 52 kg N (common bean haulms); T8—52 kg N (common bean haulms only). The relationship between the predictor (N fertilization rate) and the response variable (banana yield) was significant (p = 0.001). The difference between cattle manure (T6) or in combination with urea (T5) and other N fertilization treatments (T2–T8) was distinct and increased in cycle two. Source: [18].
Agronomy 13 01418 g003
Figure 4. Nitrogen fertilization response curve in cycles one and two of Mchare banana grown in volcanic soils of Tengeru located on the southeast slopes of Mount Meru in northern highlands, Tanzania. Nitrogen response is fitted with a quadratic polynomial, and the grey areas give the 95% confidence interval. T1—no N (control); T2—76.7 kg N (urea); T3—153.4 kg N (urea); T4—230 kg N (urea); T5—76.7 kg N (urea) + 76.7 kg N (cattle manure); T6—153.4 kg N (cattle manure only); T7—76.7 kg N (urea) + 52 kg N (common bean haulms); T8—52 kg N (common bean haulms only). The relationship between the predictor (N fertilization rate) and the response variable (banana yield) was significant (p = 0.001). The difference between cattle manure (T6) or in combination with urea (T5) and other N fertilization treatments (T2–T8) was distinct and increased in cycle two. Source: [18].
Agronomy 13 01418 g004
Table 1. Nutrient concentrations of the cattle manure and common bean haulms used during the experimental period (2015–2019). Haulms were produced in situ in T7–T8 during the course of two seasons each year, while cattle manure was sourced at the Kilari sisters’ dairy farm each year.
Organic Fertilizer ResourceNutrient Concentrations (g kg−1 Dry Weight)
NPK
Cattle manure2312
Common bean haulms31324
Source: [12].
Table 2. Effects of fertilization treatments on the yield of cycle one and two Mchare banana at three sites located on the slopes of Mount Kilimanjaro and Mount Meru in northern highlands, Tanzania.
Crop CycleN Fertilization TreatmentsMchare Banana Fresh Fruit Yield (t ha−1 year−1)
TarakeaLyamungoTengeru
1T1—no N (control) 13.79 ± 0.74 f19.13 ± 0.12 h11.50 ± 0.06 hi
1T2—76.7 kg N (urea)18.24 ± 0.82 e26.49 ± 0.66 g14.65 ± 0.61 f-i
1T3—153.4 kg N (urea)23.32 ± 0.63 d35.14 ± 0.73 e18.65 ± 1.20 def
1T4—230 kg N (urea)20.75 ± 1.33 de30.60 ± 1.29 f19.09 ± 1.68 def
1T5—76.7 kg N (urea) + 76.7 kg N (cattle manure)33.18 ± 0.64 b42.94 ± 0.53 d27.24 ± 1.45 bc
1T6—153.4 kg N (cattle manure)29.37 ± 0.79 c41.49 ± 0.64 d26.14 ± 0.73 c
1T7—76.7 kg N (urea) + 52 kg (common bean haulms)18.47 ± 0.42 e26.42 ± 0.40 g14.35 ± 0.32 f-i
1T8—52 kg N (common bean haulms) z13.73 ± 0.87 f20.56 ± 0.13 h12.50 ± 0.82 ghi
2T1—no N (control) 10.95 ± 0.00 f15.77 ± 0.65 i10.34 ± 0.26 i
2T2—76.7 kg N (urea)20.30 ± 0.00 de41.96 ± 0.25 d16.82 ± 0.73 e-h
2T3—153.4 kg N (urea)30.89 ± 0.34 bc51.62 ± 0.14 c22.54 ± 1.45 cde
2T4—230 kg N (urea)30.65 ± 0.33 bc51.27 ± 0.27 c24.11 ± 2.13 cd
2T5—76.7 kg N (urea) + 76.7 kg N (cattle manure)38.15 ± 0.00 a82.52 ± 0.94 a34.09 ± 1.84 a
2T6—153.4 kg N (cattle manure)32.15 ± 0.00 bc71.59 ± 0.66 b31.95 ± 0.89 ab
2T7—76.7 kg N (urea) + 52 kg (common bean haulms)19.35 ± 0.10 e43.16 ± 0.00 d17.58 ± 0.39 efg
2T8—52 kg N (common bean haulms) z12.42 ± 0.06 f28.29 ± 0.00 fg11.43 ± 0.69 hi
Mean22.939.319.6
CV%4.42.59.7
p-value0.0010.0010.001
Key: Values presented are means ± SE; SE = standard error; z = maximum common bean haulms produced in situ in banana–bean intercropping treatment plots. Means with similar letters in the same column are not significantly different at p = 0.05. Source: [18].
Table 3. Economic analyses for the N fertilization in cycles one and two of Mchare banana grown in volcanic soils of Tarakea located on the northeast slopes of Mount Kilimanjaro in northern highlands, Tanzania.
Nitrogen Fertilization TreatmentsCycle OneCycle Two
Gross Variable NetMarginal Marginal MRR 100% f MRR 150% g Gross Variable Net Marginal Marginal MRR 100% fMRR 150% g
Benefit aCost bBenefit cCost dBenefit eUrea Price Benefit aCost bBenefit cCost dBenefit eUrea Price
USD ha−1USD ha−1USD ha−1USD ha−1USD ha−1USD $−1USD $−1USD ha−1USD ha−1USD ha−1USD ha−1USD ha−1USD $−1USD $−1
T1317210132159 251710131504
T24195117830171648585.233.13466811783490164198612.117.02
T353641333403115610146.54.03710413335771156228114.628.81
T4477214893283D 704914895560D
T576312026560584825883.051.787742026674884932583.841.56
T6675434373317D 739434373957D
T7424719812266D 445019812469D
T8315818251333D 285518251030D
Mean491114623126 560114623816
LSD0.05560 560 121 121
p-value0.001 0.001 0.001 0.001
Key: T1—no N (control); T2—76.7 kg N (urea); T3—153.4 kg N (urea); T4—230 kg N (urea); T5—76.7 kg N (urea) + 76.7 kg N (cattle manure); T6—153.4 kg N (cattle manure); T7—76.7 kg N (urea) + 52 kg N (common bean haulms); T8—52 kg N (common bean haulms) [18]; D = dominated treatments, thus, were eliminated from marginal analysis; a = product of the average yield of the respective experimental treatment and farm gate price; b = sum of retail/farm gate cost to purchase mineral fertilizer, inoculant and bean seed, cattle manure, and labor for application of fertilizer, sowing, weeding and harvesting of the bean intercrop; c = difference between gross benefits and total variable costs; d = change in total variable costs calculated relative to treatment with lower fertilization costs and the subsequent treatment with higher costs (for mineral N fertilization treatments: T1—T4) and T2 for the integrated N fertilization treatment (T5); e = change in net benefits calculated relative to treatment with smaller net benefits and the subsequent treatment with larger net benefits (for mineral N fertilization treatments: T1—T4) and T2 for the integrated N fertilization treatment (T5); f and g = marginal benefit (change in net benefits) over marginal cost (change in total variable costs) calculated at actual and projected future fertilizer price relative to the smallest N dose (T2) for all non-dominated treatments; MRR = marginal rate of return; LSD = least significant difference.
Table 4. Economic analyses for the N fertilization in cycles one and two of Mchare banana grown in volcanic soils of Lyamungo located on the southeast slopes of Mount Kilimanjaro in northern highlands, Tanzania.
Nitrogen Fertilization TreatmentsCycle OneCycle Two
Gross Variable NetMarginal Marginal MRR 100% f MRR 150% g Gross Variable Net Marginal Marginal MRR 100% f MRR 150% g
Benefit aCost bBenefit cCost dBenefit eUrea Price Benefit aCost bBenefit cCost dBenefit eUrea Price
USD ha−1USD ha−1USD ha−1USD ha−1USD ha−1USD $−1USD $−1USD ha−1USD ha−1USD ha−1USD ha−1USD ha−1USD $−1USD $−1
T134958852610 29758852090
T24386102933571447475.193.13599010304960144287019.9312.86
T359481174477414414179.846.18805511746881144192113.348.56
T4521713183899D 790313186585D
T578541840601481126573.281.8511,7041840986481149046.043.7
T6767423905284D 10,44623908056D
T7450016852815D 606916854384D
T8369515402155D 410615402566D
Mean5346 3731 715614825541
LSD0.052900 3061 6749 6955
p-value0.031 0.187 0.167 0.323
Key: T1—no N (control); T2—76.7 kg N (urea); T3—153.4 kg N (urea); T4—230 kg N (urea); T5—76.7 kg N (urea) + 76.7 kg N (cattle manure); T6—153.4 kg N (cattle manure); T7—76.7 kg N (urea) + 52 kg N (common bean haulms); T8—52 kg N (common bean haulms) [18]; D = dominated treatments thus, were eliminated from marginal analysis; a = product of the average yield of the respective experimental treatment and farm gate price; b = sum of retail/farm gate cost to purchase mineral fertilizer, inoculant and bean seed, cattle manure, and labor for application of fertilizer, sowing, weeding and harvesting of the bean intercrop; c = difference between gross benefits and total variable costs; d = change in total variable costs calculated relative to treatment with lower fertilization costs and the subsequent treatment with higher costs (for mineral N fertilization treatments: T1—T4) and T2 for the integrated N fertilization treatment (T5); e = change in net benefits calculated relative to treatment with smaller net benefits and the subsequent treatment with larger net benefits (for mineral N fertilization treatments: T1—T4) and T2 for the integrated N fertilization treatment (T5); f and g = marginal benefit (change in net benefits) over marginal cost (change in total variable costs) calculated at actual and projected future fertilizer price relative to the smallest N dose (T2) for all non-dominated treatments; MRR = marginal rate of return; LSD = least significant difference.
Table 5. Economic analyses for the N fertilization in cycles one and two of Mchare banana grown in volcanic soils of Tengeru located on the southeast slopes of Mount Meru in northern highlands, Tanzania.
Nitrogen Fertilization TreatmentsCycle OneCycle Two
Gross Variable NetMarginal Marginal MRR 100% f MRR 150% g Gross Variable Net Marginal Marginal MRR 100% fMRR 150% g
Benefit aCost bBenefit cCost dBenefit eUrea Price Benefit aCost bBenefit cCost dBenefit eUrea Price
USD ha−1USD ha−1USD ha−1USD ha−1USD ha−1USD $−1USD $−1USD ha−1USD ha−1USD ha−1USD ha−1USD ha−1USD $−1USD $−1
T133698852484 27718851886
T24809103037791441,2958.995.62611610305086144320022.2214.37
T35881117447071449286.443.96803611746862144177612.337.88
T45935131846172898382.891.6083871318706928819836.884.25
T578461840600681122272.741.4911,942184010,10281150166.183.79
T6725331414112D 10,38231417241D
T7460916842925D 616416844480D
T8368915402149D 396115402421D
Mean542416213802 722015765605
LSD0.052534 2718 6439 6663
p-value0.016 0.107 0.107 0.226
Key: T1—no N (control); T2—76.7 kg N (urea); T3—153.4 kg N (urea); T4—230 kg N (urea); T5—76.7 kg N (urea) + 76.7 kg N (cattle manure); T6—153.4 kg N (cattle manure); T7—76.7 kg N (urea) + 52 kg N (common bean haulms); T8—52 kg N (common bean haulms) [18]; D = dominated treatments thus, were eliminated from marginal analysis; a = product of the average yield of the respective experimental treatment and farm gate price; b = sum of retail/farm gate cost to purchase mineral fertilizer, inoculant and bean seed, cattle manure, and labor for application of fertilizer, sowing, weeding and harvesting of the bean intercrop; c = difference between gross benefits and total variable costs; d = change in total variable costs calculated relative to treatment with lower fertilization costs and the subsequent treatment with higher costs (for mineral N fertilization treatments: T1—T4) and T2 for the integrated N fertilization treatment (T5); e = change in net benefits calculated relative to treatment with smaller net benefits and the subsequent treatment with larger net benefits (for mineral N fertilization treatments: T1—T4) and T2 for the integrated N fertilization treatment (T5); f and g = marginal benefit (change in net benefits) over marginal cost (change in total variable costs) calculated at actual and projected future fertilizer price relative to the smallest N dose (T2) for all non-dominated treatments; MRR = marginal rate of return; LSD = least significant difference.
Disclaimer/Publisher’s Note: The statements, opinions and data contained in all publications are solely those of the individual author(s) and contributor(s) and not of MDPI and/or the editor(s). MDPI and/or the editor(s) disclaim responsibility for any injury to people or property resulting from any ideas, methods, instructions or products referred to in the content.

