Article

Deciphering the Impact of Induced Drought in Agriculture Soils: Changes in Microbial Community Structure, Enzymatic and Metabolic Diversity

by
Kalisa Amarsingh Bogati
1,*,
Patrycja Golińska
2,
Piotr Sewerniak
3,
Aleksandra Burkowska-But
1,4 and
Maciej Walczak
1,4
1
Department of Environmental Microbiology and Biotechnology, Faculty of Biological and Veterinary Sciences, Nicolaus Copernicus University, 87-100 Toruń, Poland
2
Department of Microbiology, Faculty of Biological and Veterinary Sciences, Nicolaus Copernicus University, 87-100 Toruń, Poland
3
Department of Soil Science and Landscape Management, Faculty of Earth Science and Spatial Management, Nicolaus Copernicus University, 87-100 Toruń, Poland
4
Bacto-Tech Sp. z o.o., Polna 148, 87-100 Toruń, Poland
*
Author to whom correspondence should be addressed.
Agronomy 2023, 13(5), 1417; https://doi.org/10.3390/agronomy13051417
Submission received: 11 April 2023 / Revised: 13 May 2023 / Accepted: 17 May 2023 / Published: 20 May 2023
(This article belongs to the Special Issue Global Climate Change Effect on the Diversity of Soil Microorganisms)

Abstract

:
Prolonged drought stress may have a significant impact on the structure and activity of the soil microbial community. Our study aims to investigate the impact of short-term drought (2 months) on the microbial community structure, enzymes, and metabolic diversity in four agricultural soils (Gniewkowo (G), Lulkowo (L), Wielka Nieszawka (N) and Suchatówka (S) sites) in Poland. These four types of soil were selected based on differences in their texture (gleyic luvisol Phaeozem in G (rich in clay and humus), stagnic luvisol in L, fluvisol in N and haplic luvisol in S (sandy)). We investigated the (1) number of bacteria, actinomycetes (formally phylum Actinomycetota) and fungi; (2) microbial community (16S rRNA and ITS amplicon regions); (3) biological activity by community-level physiological profiling (CLPP); (4) soil enzyme activities (dehydrogenases (DH), phosphatases (acid ACP and alkaline ALP) and urease (UR)); and (5) soil chemical properties. At the end of our experiment, we observed a significant decrease in soil moisture content with the highest in the soil from the S site. Overall, there was no change in total bacteria, but actinomycetes and fungal numbers increased after the 1st week with a decrease in moisture content. ACP activity decreased in three out of four analyzed soil samples. The exception was in sample G, where activity increased for 1–2 weeks and then decreased. ALP activity significantly increased with a decrease in moisture in the 1st week and was lowest at the end of the experiment. DH activity increased up to the 4th week in the G and N samples and up to the 2nd week in the L and S samples. UR activity showed variations in the analyzed samples. A reduction in the utilization of carbon sources (except D-mannitol and L-asparagine) was noted with the highest reduction in the G sample followed by the L, N and S samples. Thus, the pattern of changes was different depending on the analyzed soil type. The 16S rRNA and ITS amplicon sequencing revealed a decrease in the relative abundance of Pseudomonadota, Basidiomycota, Apicomplexa, and increased abundance of Actinomycetota, Bacillota and Ascomycota under prolonged drought conditions. With this, we concluded that drought conditions resulted in a significant alteration of soil microbial communities, enzyme activities, and metabolic diversity in the investigated soils.

1. Introduction

Drought, a consequence of climate change, is defined as a lack of precipitation in an area/region causing a decrease in soil moisture alongside surface and groundwater sources or dehydration events that simultaneously increase with variations in precipitation events [1]. Industrialization causes a boost toward climate change and is responsible for the emission of greenhouse gases (GHGs). This not only brings forth the occurrence of drought conditions but also global warming (rise in atmospheric temperature; 0.07 °C/decade since 1880), strong heat waves, floods, intense summers, and other climate-related hazards [2]. The Intergovernmental Panel on Climate Change [3] reported that the significant factors contributing to decreased precipitation are the recurrence of El Nino events, water stress, decreased atmospheric moisture, and rise in temperature, specifically in arid and semi-arid regions. The same report claims that drought affects global agricultural production and soil quality, which are vital for agricultural sustainability. On the other hand, Eastern Europe and Mediterranean regions are mainly affected by drought, and it is predicted that in the future, Europe will be experiencing further drought events [4]. According to the Institute of Soil Sciences and Plant Cultivation State Research Institute of Poland (http://www.susza.iung.pulawy.pl, accessed on 17 March 2022), for the last ten years, agricultural lands in Poland have been in danger of drought or significantly affected by drought that caused severe damage to crop, but they were the strongest during 2015. Reasons behind the multi-faceted impact of drought on soil biological activity are often not well understood, but we cannot exclude that it is site specific [4]. Adverse effects of drought on agricultural soils lead to soil degradation, loss of biodiversity and agricultural yields/lands, and decreased surface and groundwater levels. In addition, drought stress is not only known to affect the physical and chemical parameters of soil fertility but also its microbiological parameters [4].
Soil microbes play a vital role in ecosystem function as they are responsible for the biogeochemical cycling of nutrients (macronutrients and micronutrients) by the secretion of enzymes and transform other elements crucial for plant growth [5]. In this context, short-term or prolonged drought can affect microbial community composition and consequently its activity in the soil [4,6]. As exemplified by studies of Schimel et al. [7], the one month of drought conditions caused a reduction in microbial populations and their activity in litter soil under birch trees. However, among bacteria, the Gram-positive ones, such as actinomycetes and Bacillus sp., are grouped as drought-tolerant members [5]. Siebielec et al. [6] showed that bacterial communities of the loamy soil samples in Poland were dominated (>95%) by six phyla, namely Actinobacteria (now Actinomycetota; https://lpsn.dsmz.de/phylum/actinomycetot, accessed on 17 May 2023); commonly known as actinomycetes), Bacteroidetes (now Bacteroidota; https://lpsn.dsmz.de/phylum/bacteroidota, accessed on 17 May 2023), Firmicutes (now Bacillota; https://lpsn.dsmz.de/phylum/bacillota, accessed on 17 May 2023), Planctomyces (now Planctomycetota; https://lpsn.dsmz.de/phylum/planctomycetota, accessed on 17 May 2023) and Verrucomicrobia (now Verrucomicrobiota; https://lpsn.dsmz.de/phylum/verrucomicrobiota, accessed on 17 May 2023), where Actinobacteria and Proteobacteria were present in relatively equal percentages under optimal soil moisture. However, the prolonged drought stress, up to two months, influenced the dominance of Actinobacteria while the relative abundance of Proteobacteria, Bacteroidetes and Verrucomicrobia decreased. In contrast, such soil conditions increased the abundance of Firmicutes. In addition, these loamy soils were dominated by ten genera, namely Aquihabitans, Brevundimonas, Flavobacterium, Gaiella, Kribbella, Marmoricola, Nocardioides, Pseudomonas, Solirubrobacter and Sphingomonas. The prolonged drought stress led to a decrease in abundance of Pseudomonas, Sphingomonas, Brevundimonas and Flavobacterium whereas Gaiella, Kribbella, Nocardioides, Marmoricola and Solirubrobacter, which belong to actinomycetes, increased [6]. Similarly, Santos-Medellín et al. [8] found that drought negatively affected microbial community composition in rice agricultural soil, while Xu et al. [9] observed a decrease in bacterial community diversity in the rhizosphere and root endosphere of sorghum cultivars. In the case of fungal community, Hayden et al. [10] observed a decrease in fungal abundance in response to warming in grassland soil. Oliveira et al. [11] found that phytopathogenic fungi which belonged to the genera of Curvularia, Thielavia and Fusarium were more prevalent in water deficit conditions. The investigations on drought in soils and the corresponding meta-analyses often reflect detrimental effects of drought on the variety and abundance of soil microbial communities, with bacteria being claimed to be more vulnerable than fungi [12,13,14]. Since different groups of bacteria and fungi are susceptible to soil moisture change, as a result, generalizations about various agricultural areas are challenging, and it is unclear what impact these modifications will have on certain functions over time.
Soil nutrient cycling is greatly dependent on extracellular enzymes [15]. These enzymes are produced by soil microbes via the breakdown of complex organic matter, polymeric carbon, and nitrogen substrates (for example lignin, cellulose, pectin, hemicellulose, and microbial debris). These products become ultimately useful for microbial metabolism and growth [15]. The balance between the synthesis and degradation of these complexes in soil determines the soil fertility and quality, microbial composition, nutrient availability, and microbial enzyme activities. Moisture stress causes a decline in the decomposition of soil organic carbon (SOC) and its respiration to CO2 and nitrification rates in the soil [16]. The presence of extracellular enzymes in the soil indicates healthy soil microbial function, which in turn shows the response pattern of microbial communities to environmental changes [4]. Many reports revealed different significant consequences of drought on soil enzymes [17,18,19]. Decreases in precipitation (drought) significantly suppressed phenol oxidase (POX) (−47.2%), urease (−30.6%), β-1,4-glucosidase (BG) (−4.6%), and acid phosphatase (AP) (−5.1%) in the soil. In addition, the overall activity of carbon, nitrogen and phosphorus acquisition enzymes were negatively affected by −4.6, −17.6% and −5.1%, respectively [17]. Similarly, a decrease in urease activity during the reduction in soil moisture levels was confirmed by other authors [19,20]. Dehydrogenase, an intracellular enzyme synthesized by viable cells, was also negatively affected under drought stress [6,21].
It is claimed that drought events have harmful effects on extracellular enzymes and oxidative activity in the soil, which is probably due to the decrease in the diffusion of substrates in the soil [22]. Although by the end of this century, the frequency of drought is expected to increase, this trend may gradually change the underground characteristics of the agricultural ecosystems [22]. Altogether, there has been no coordinated effort to dissect the impacts of extreme conditions in soils (e.g., drought or heat) on the microbial community composition and activity in different agricultural soils.
Our study was designed to investigate the influence of prolonged drought (2 months) on the microbial community (bacteria, fungi and actinomycetes), their enzymes, namely dehydrogenases, phosphatases (acidic and alkaline) and urease, and metabolic diversity in four types of agricultural soil samples collected in Poland during the spring season. These four types of soil were selected based on differences in their texture and bonitation classification (gleyic luvisol Phaeozem in G (rich in clay and humus, 1st class), stagnic luvisol in L (3rd class), fluvisol in N (3rd class) and haplic luvisol in S (sandy, 5th class)). The entire experiment was planned for 8 weeks (almost two months). Such a decision was justified by the climatic zone and weather conditions in central Europe [4]. In Poland and neighboring countries, there are periods of drought lasting from one to a maximum of two months. Such a drought in this region of Europe is already considered catastrophic, shortening the vegetation period of crops to a maximum of 5 months [4,6]. In addition, our hypothesis assumes that the lack of rainfall in the following weeks should lead to radical changes in soil biological activity and changes in the composition of the soil microbiome. As impacts of drought stress on the soil environment are still not well understood, therefore, comprehensive studies on the above parameters in response to drought may provide new opportunities to mitigate the impact of such abiotic stress on the healthy functioning of agricultural land in the future [4].

2. Materials and Methods

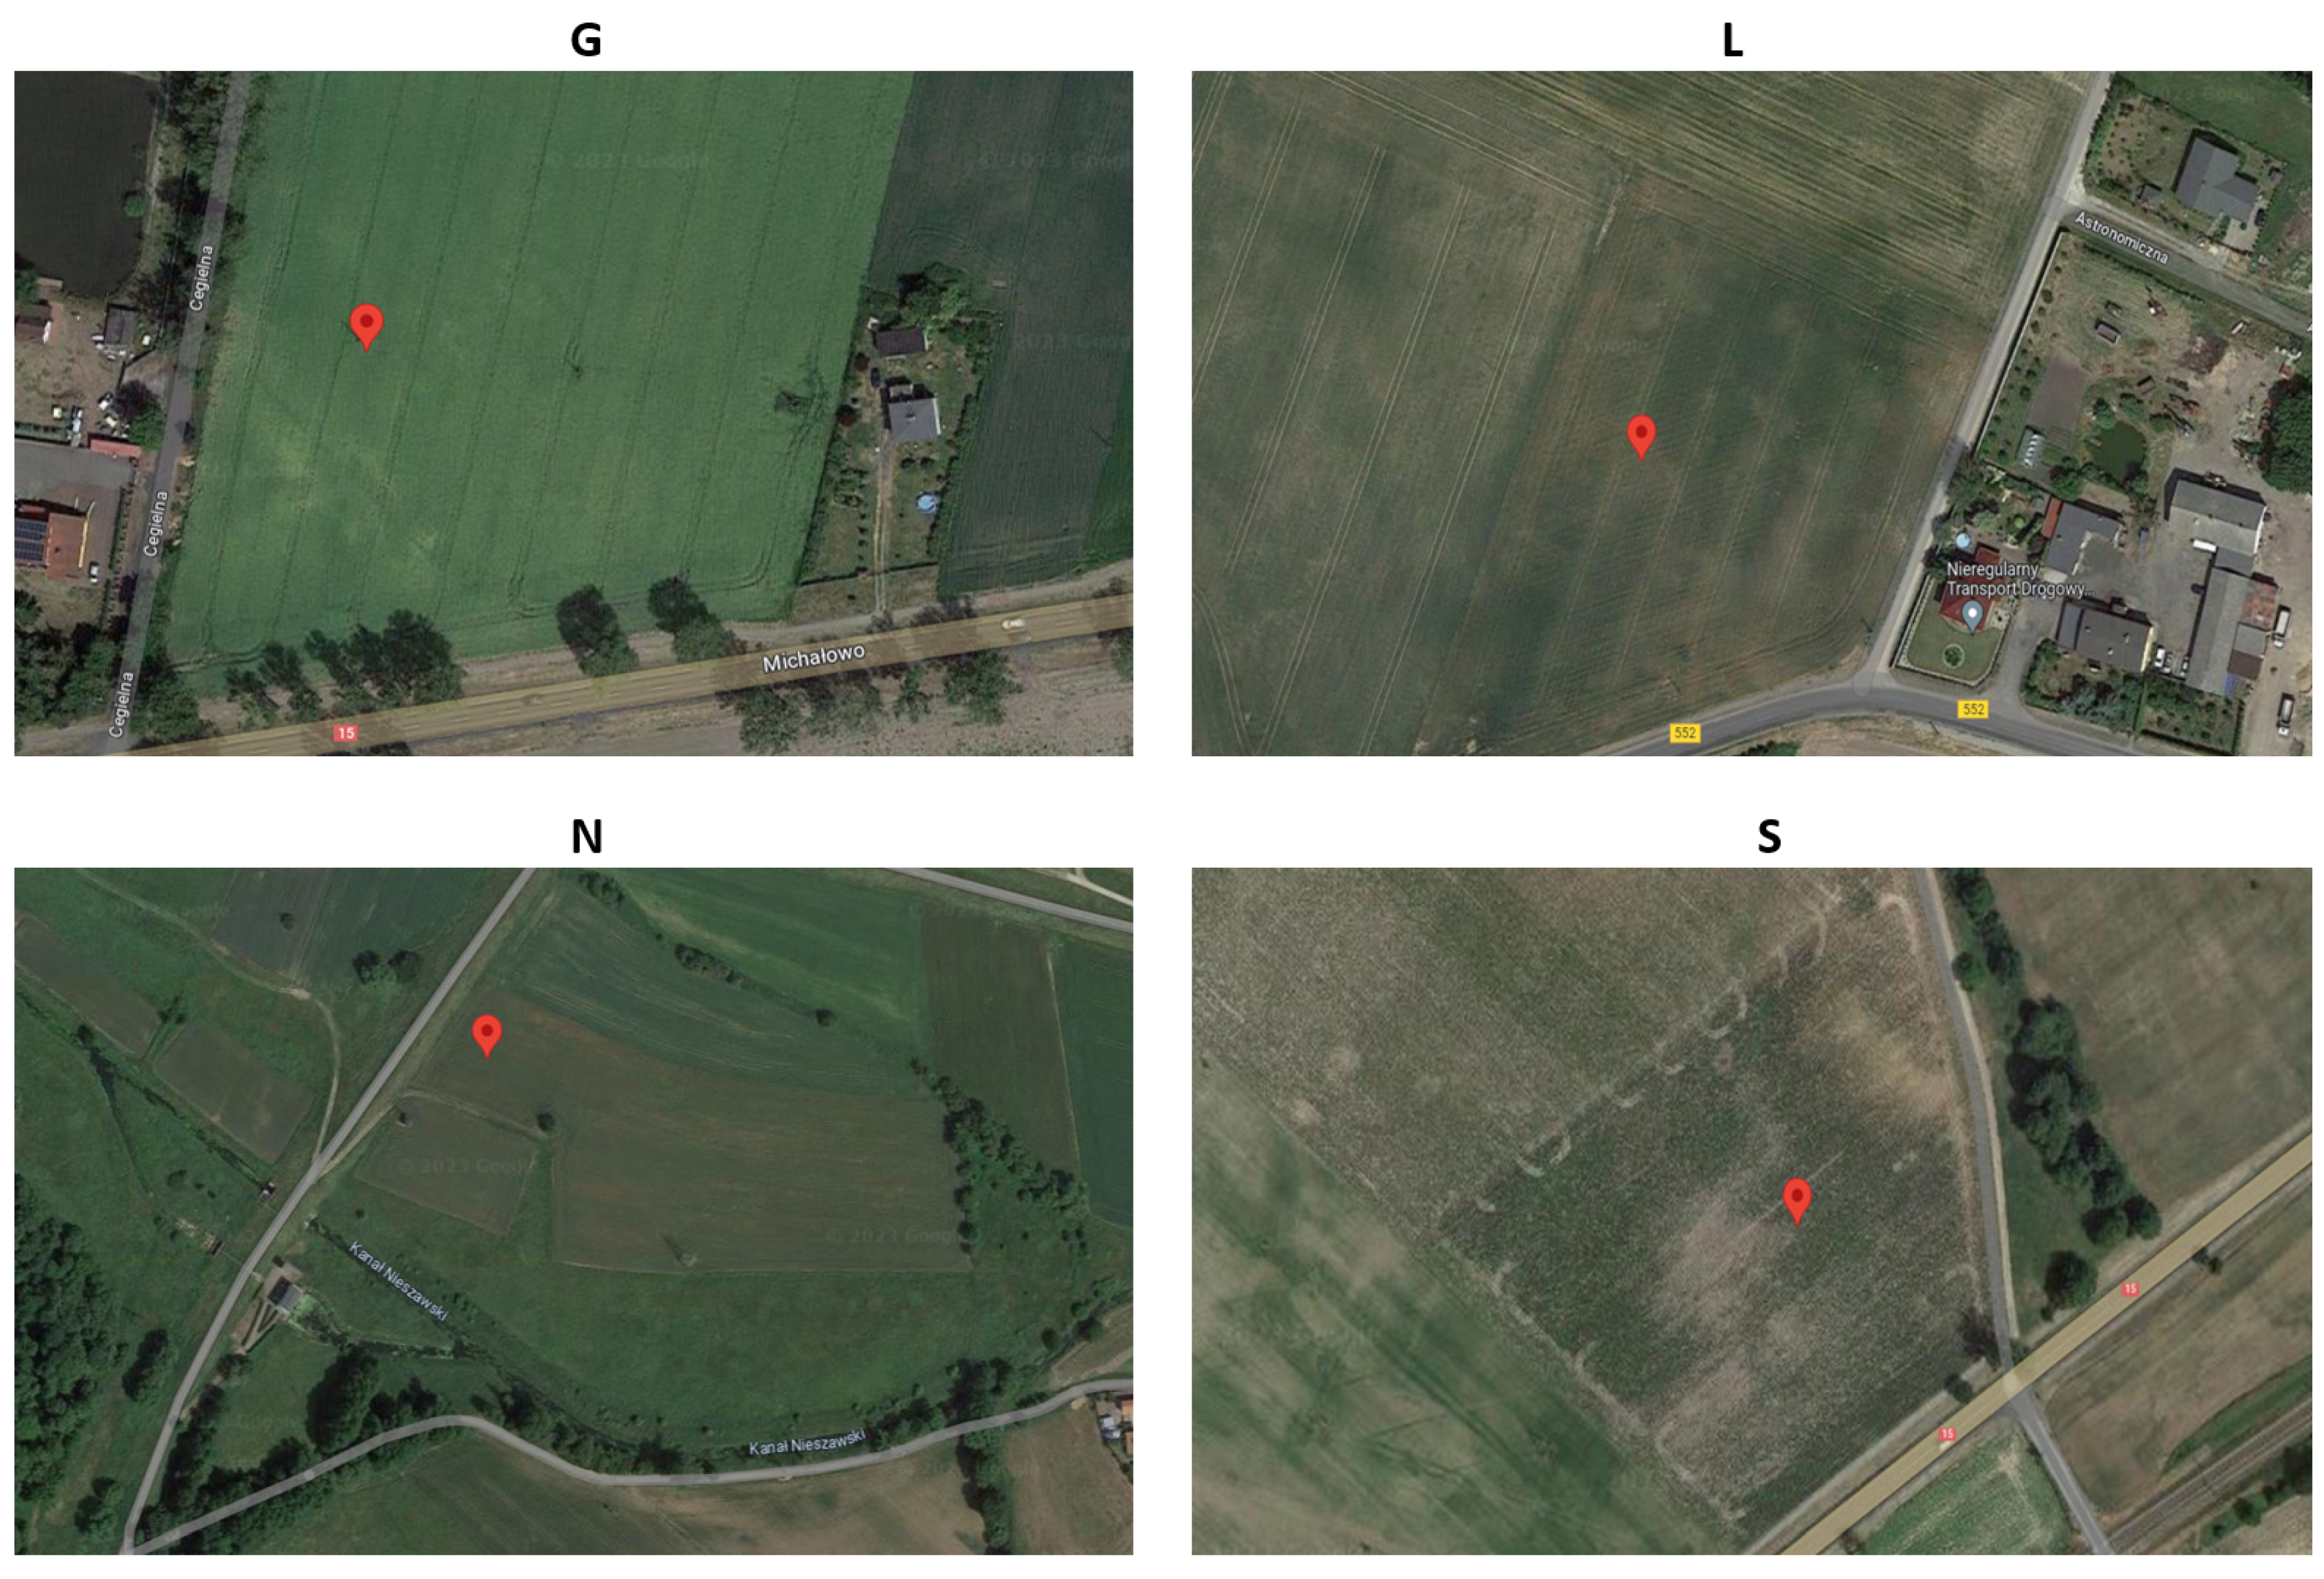
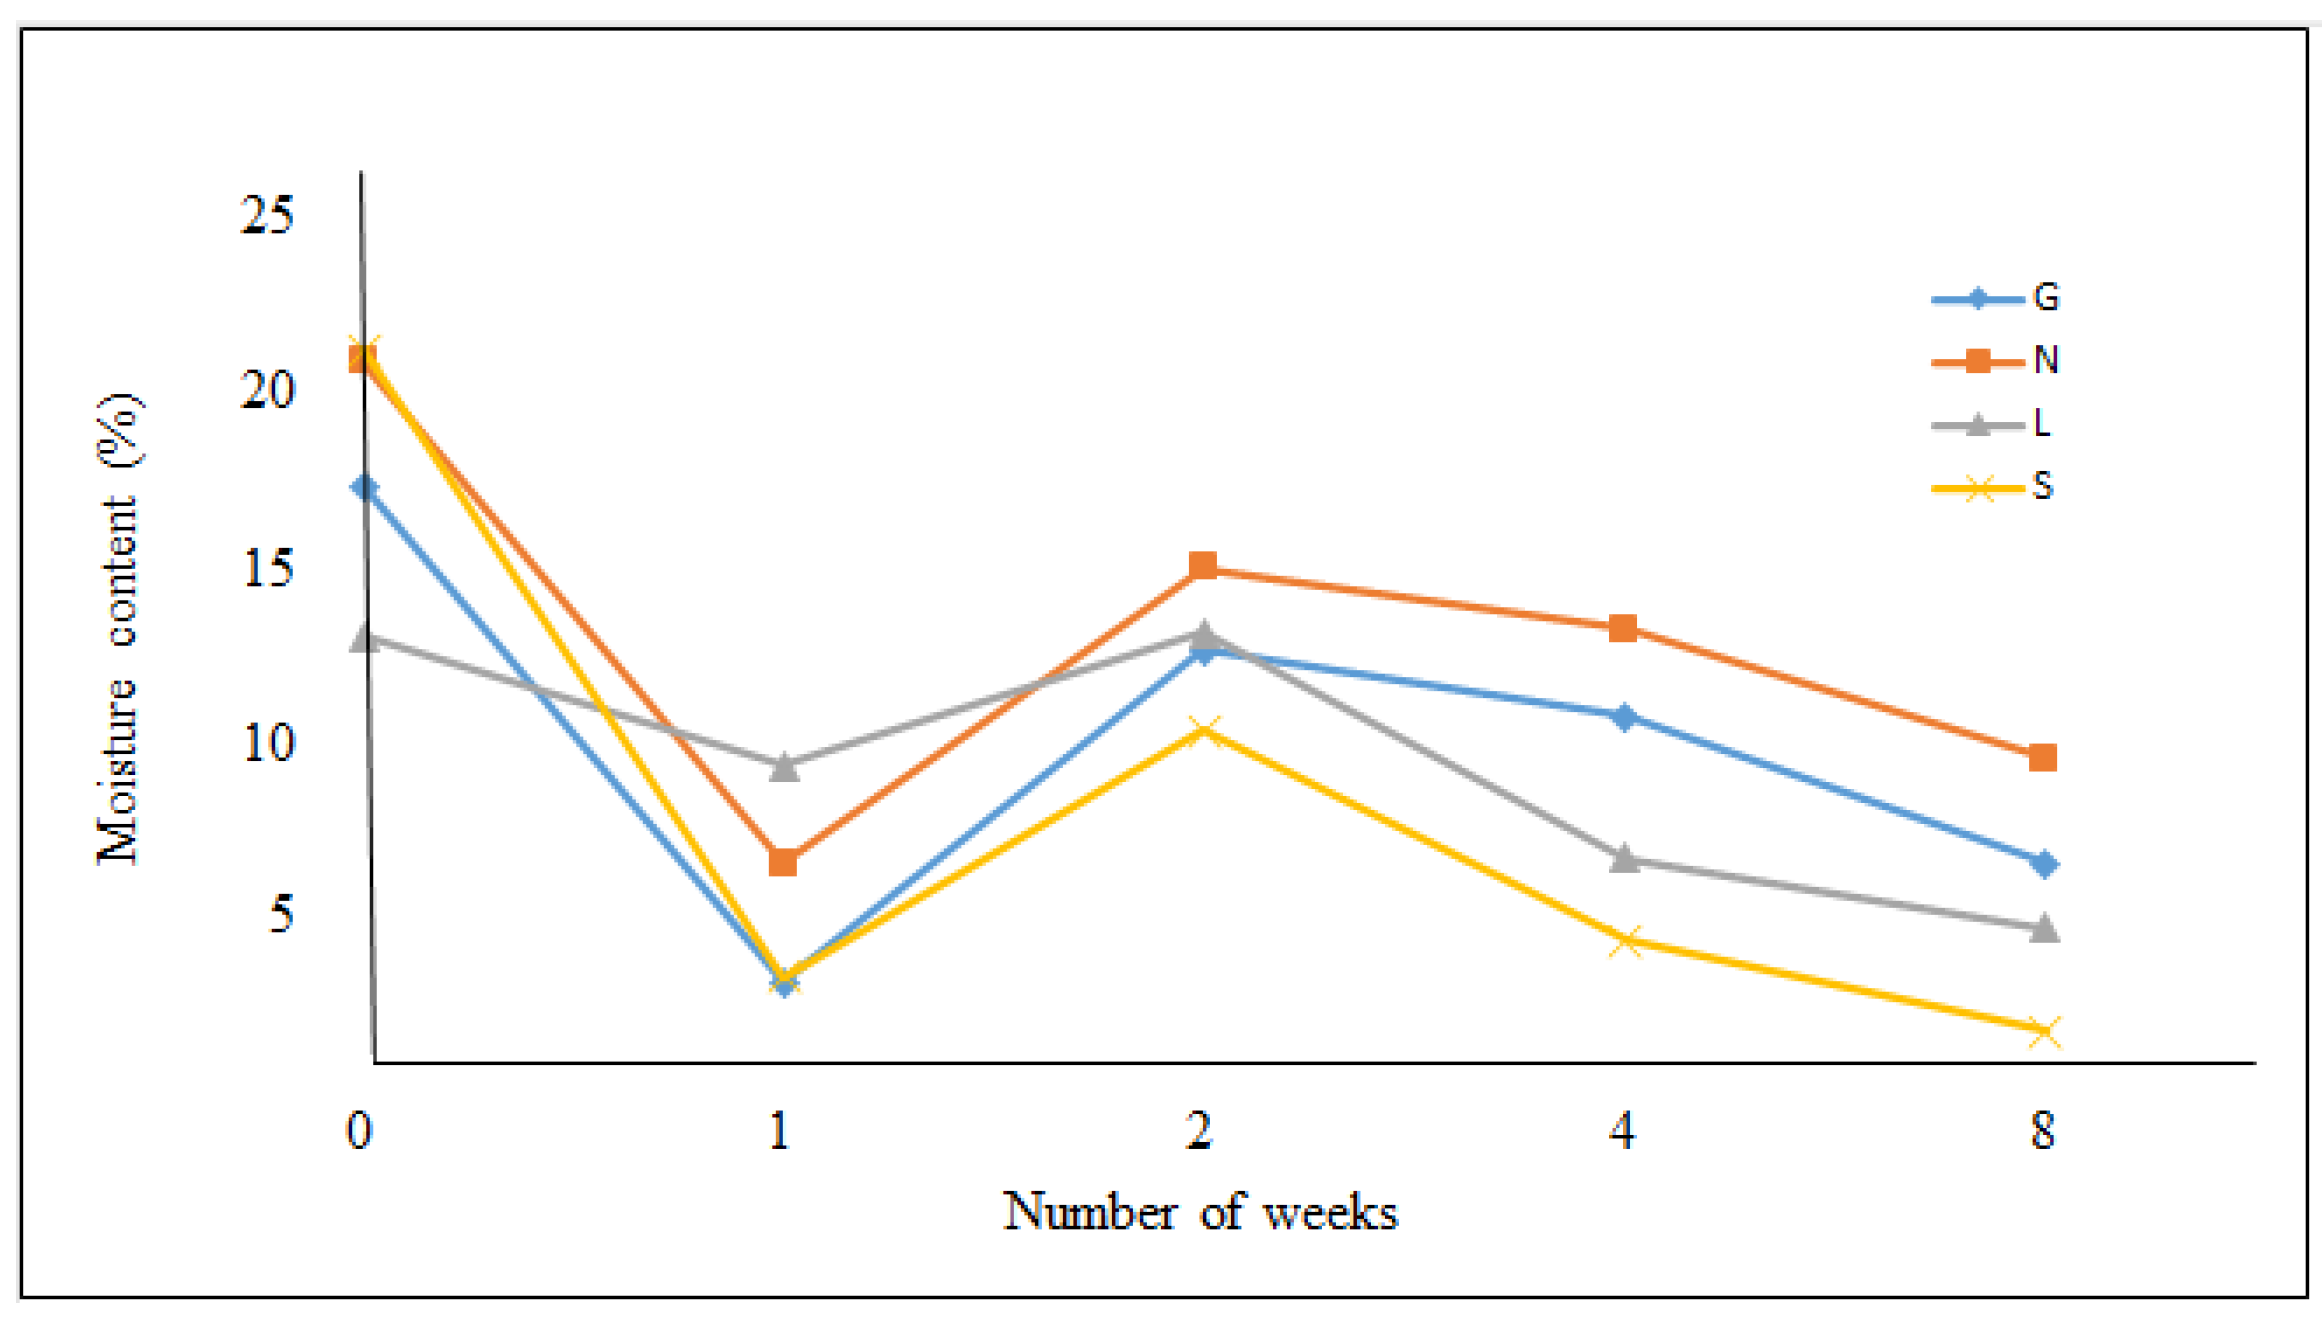
2.1. Sample Collection and Physicochemical Analyses of Soil Samples

The agriculture soil samples (20 cm in depth from the soil surface; n = 5 per site) were collected on 29 May 2021 (spring season) from four sites, namely in Gniewkowo (G; 52.901355° N, 18.432330° E), Lulkowo (L; 53.090675° N, 18.580300° E), Wielka Nieszawka (N; 53.006132° N, 18.466123° E) and Suchatówka (S; 52.907623° N, 18.467457° E) near Toruń, Poland (Figure 1) into plastic containers (high = 23 cm and Ø = 28 cm). For each site, five plastic containers were filled with soil for the 0, 1st, 2nd, 4th and 8th week treatments. In total, 20 containers were exposed to drought conditions by placing them outside but under the roof for up to 8 weeks. Therefore, soil samples were protected against rainfall but not maintained in strictly controlled conditions of humidity and temperature. We selected these sites based on soil bonitation classification (G (1st class), L (3rd class), N (3rd class), S (5th class)). At each treatment time, soil samples were collected from their corresponding container (in five replicates) into the plastic bag, mixed well, and subjected to further tests in the laboratory.
Soil samples for the study of microbial community and activities were analyzed at time (T) intervals (0, 1, 2, 4 and 8 weeks, where “0” is sampling day). For this purpose, soil samples were collected from the containers after 0, 1, 2, 4 and 8 weeks using a stainless-steel soil sampler probe (Ø 50 mm) to the plastic bags and analyzed immediately, as described below. The mean soil moisture at time intervals was determined, in five replicates, by calculation of the difference in soil mass between the collected samples and dried samples (100 °C for 4 days). The soil pH was measured, in five replicates, in distilled water at the ratio of 1:2.5 using a pH meter CP-401 (ELMETRON, Zabrze, Poland). Total organic carbon (TOC) and total nitrogen (TN) were determined using organic elemental analyzer Vario Macro Cube (Elementar Analysensysteme GmbH, Langenselbold, Germany). The graining of the soil and its texture were determined according to the Bouyoucos areometric method, modified by Casagrande and Prószyński [23], and the sieve method [24].

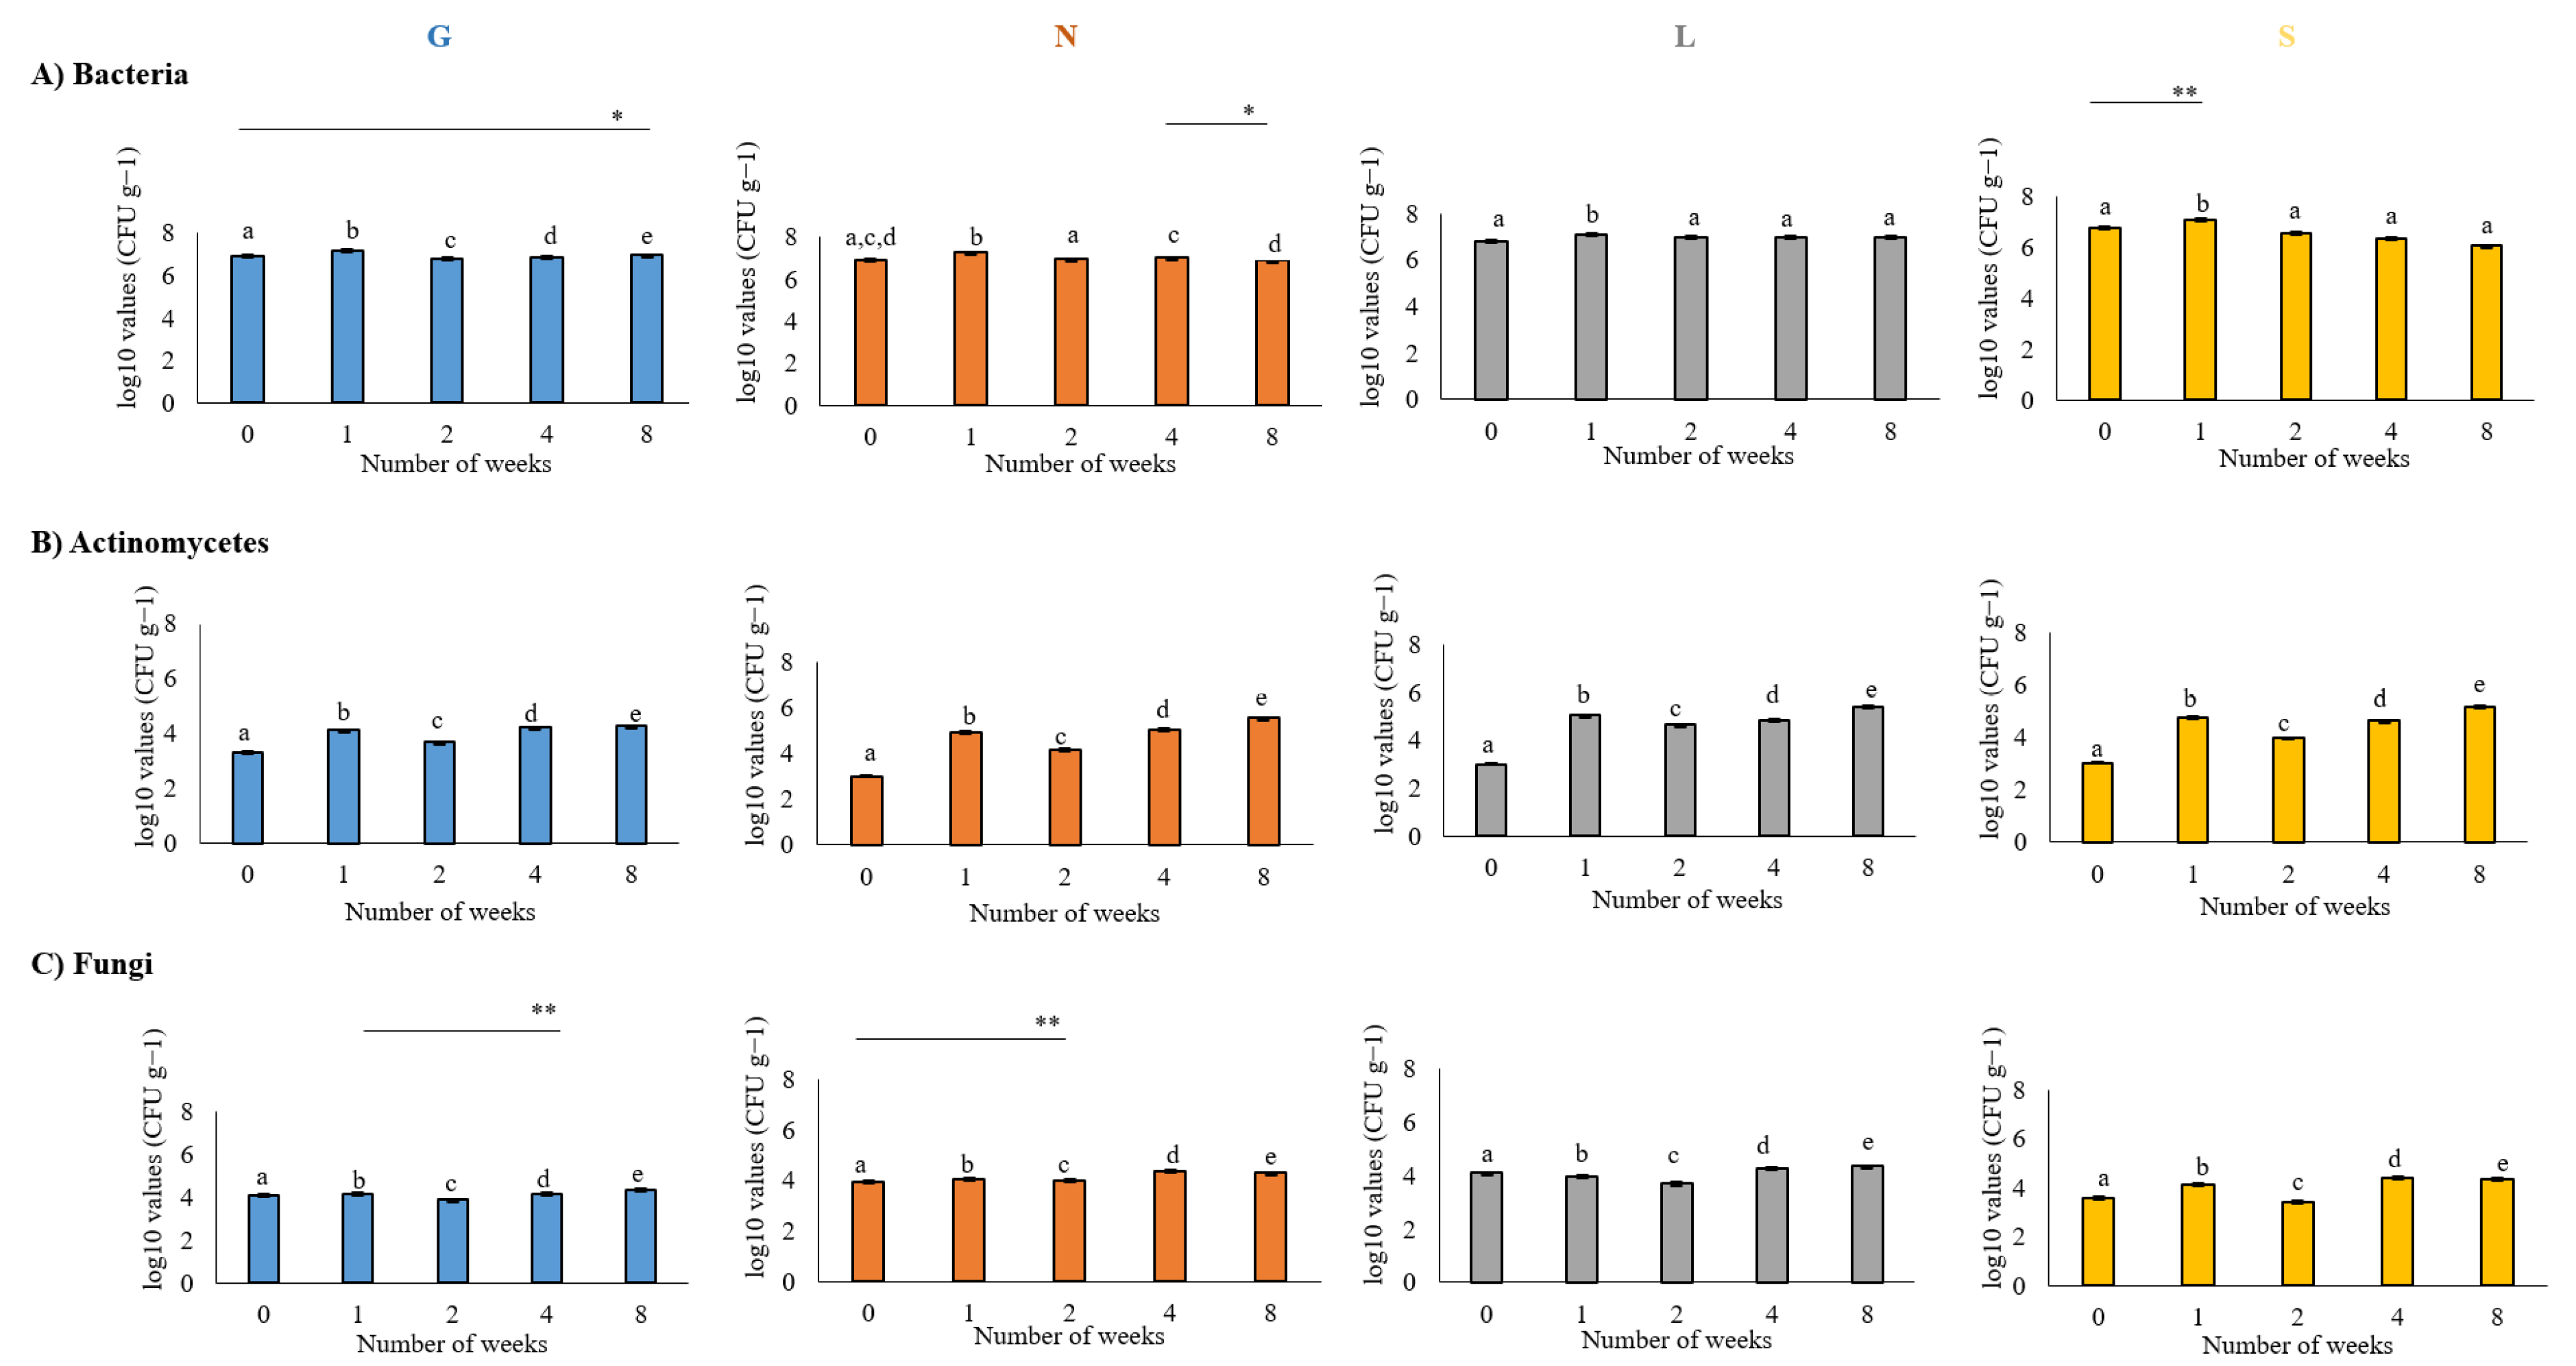
2.2. Determination of the Number of Bacteria, Actinomycetes and Fungi in Soil Samples

Bacteria, actinomycetes (Actinomycetota) and fungi were isolated from four agricultural soil samples using a standard ten-fold dilution plate procedure. First, 1 mL of serial dilutions (10−4–10−6 and 10−2–10−4) of each soil sample was placed into sterile Petri plates and poured with Plate Count Agar (PCA, Biomaxima, Lublin, Poland) for bacteria enumeration and Rose Bengal Agar (Biomaxima) for fungal enumeration, respectively. The aliquots (100 µL) of serial dilutions (10−3–10−5) of soil samples were spread over the surface of Actinomycete Isolation Agar (Becton Dickinson, Franklin Lakes, NJ, United States). The media for the isolation of bacteria and actinomycetes were supplemented with cycloheximide (0.1 g L−1), whereas chloramphenicol (0.1 g L−1) for fungal isolation was used to prevent fungal and bacterial growth, respectively. The inoculated plates (5 replicates per dilution) were incubated at 28 °C for 2 weeks. The number of colonies was counted using colony counter LKB 2002 (Pol-Eko, Wodzisław Śląski, Poland) after 7 and 14 days of incubation. The number of microorganisms were expressed as log10 of colony-forming unit (CFU) per gram of dry soil.

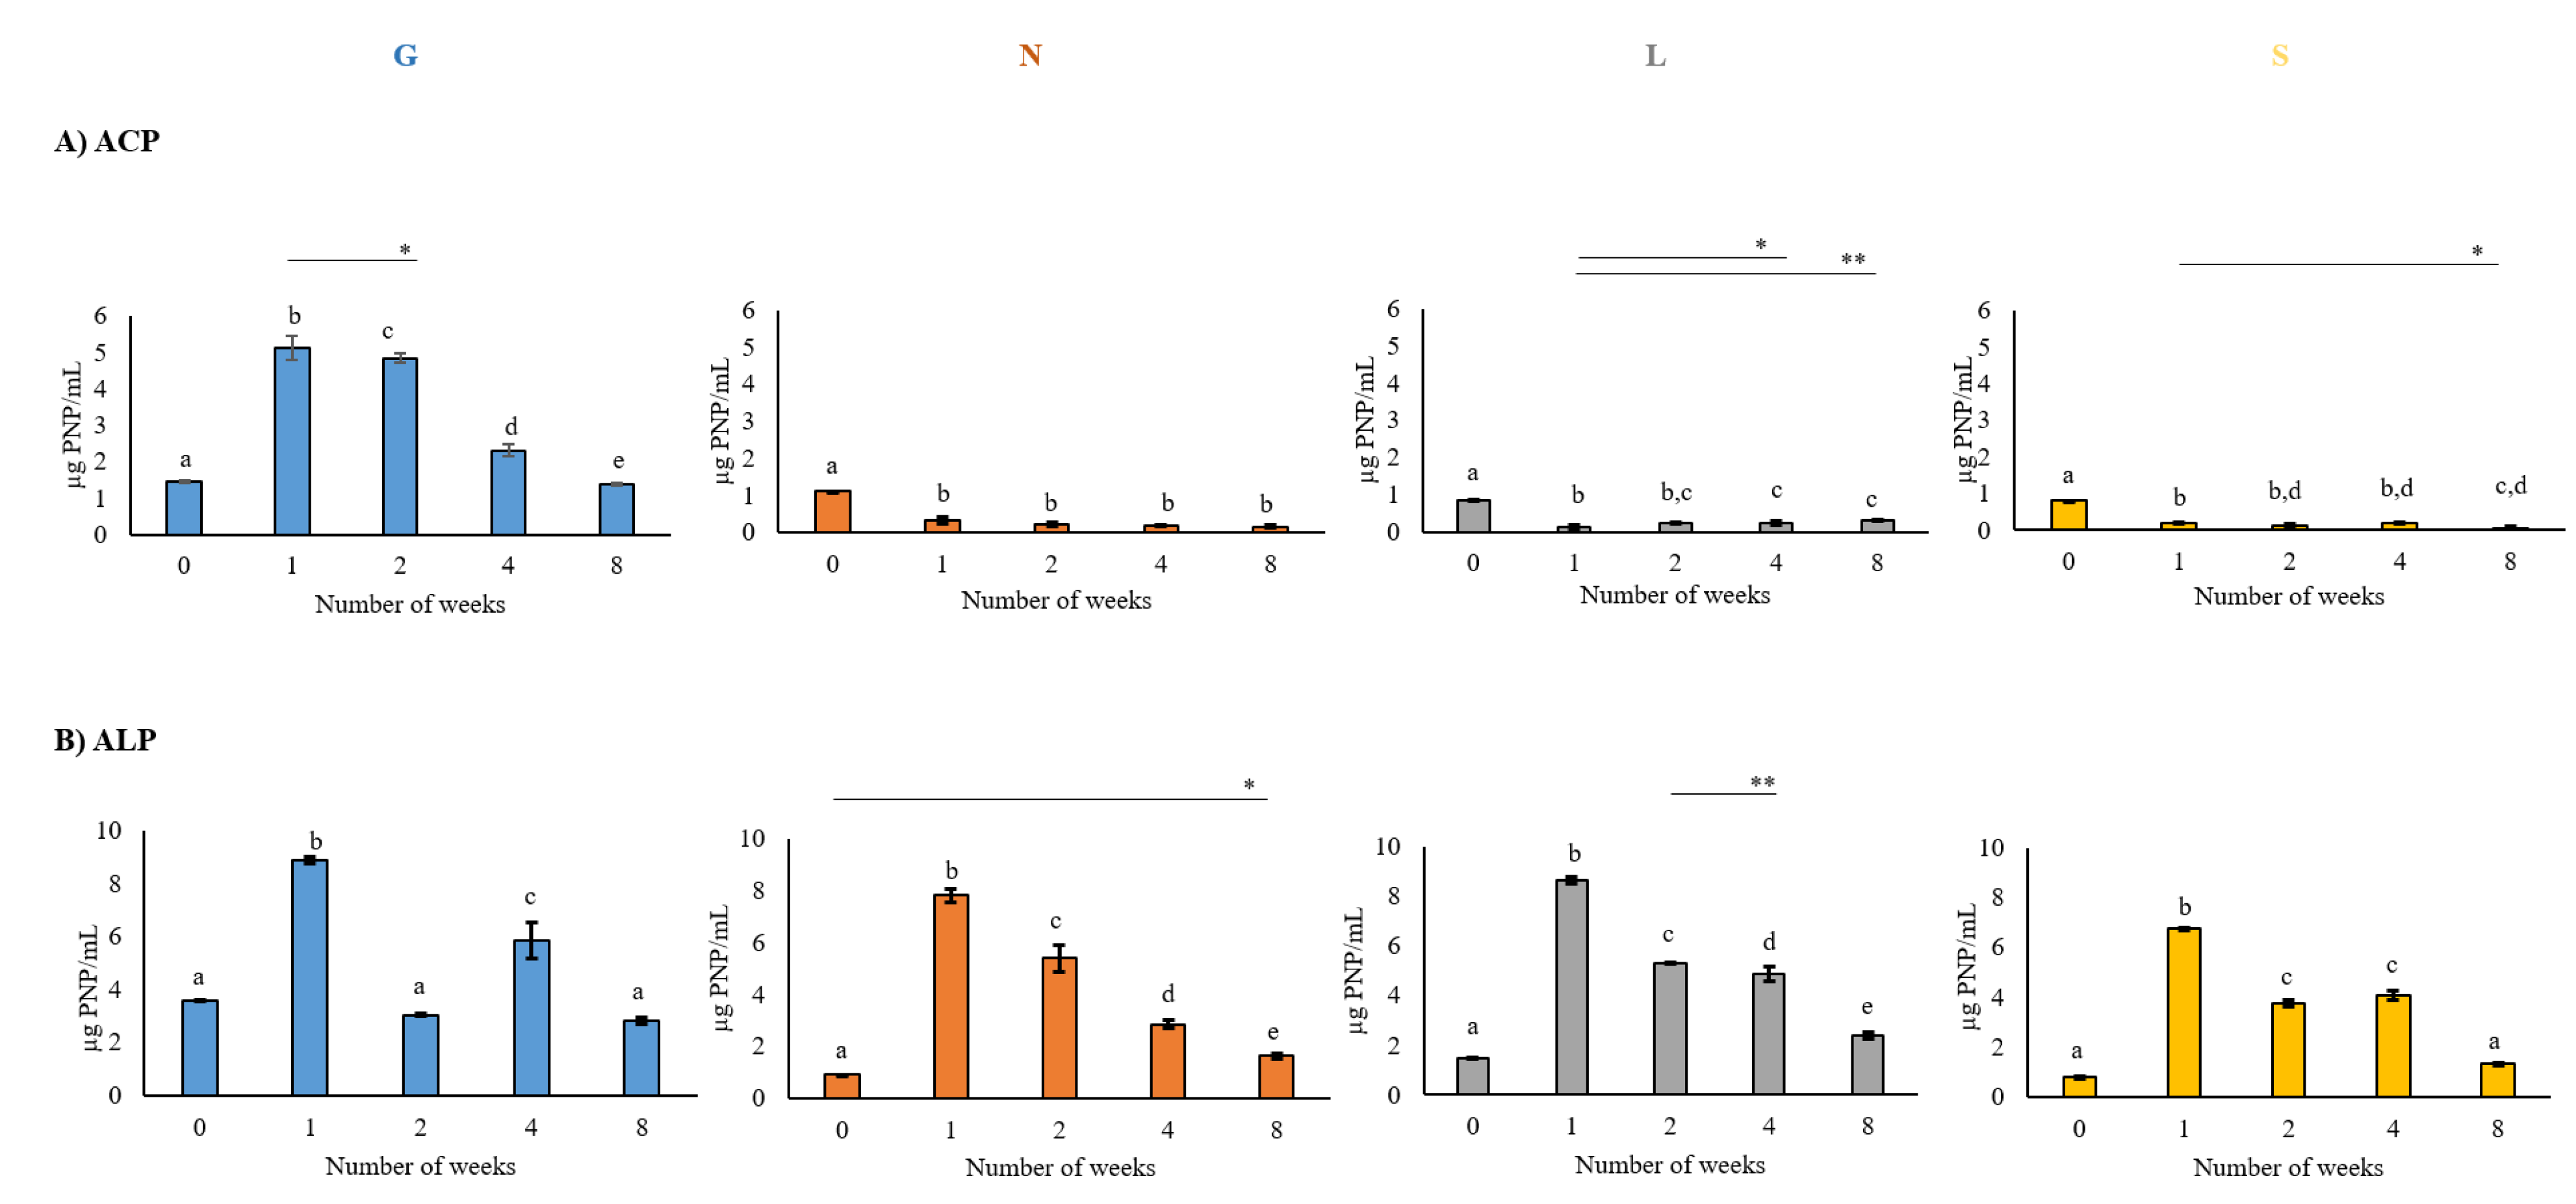
2.3. Soil Enzymatic Activities

The dehydrogenase (DH) activity in soil samples was determined colorimetrically according to Furtak et al. [25]. Absorbance measurements of the triphenylformazan (TPF) at 490 nm were performed using the spectrophotometer Marcel Pro Eko (Warsaw, Poland). The urease (UR) activity was determined using the spectrophotometric technique according to Nakano et al. [26], modified by Kandeler and Gerber [27]. The absorbance at 420 nm was measured using the spectrophotometer Marcel Pro Eko (Poland). The acid phosphatase (ACP) and alkaline phosphatase (ALP) activities were determined according to the method described by Tabatabai [28] and modified by Furtak et al. [25] using sodium p-nitrophenylphosphate (PNP). Absorbance at 410 nm was measured using the spectrophotometer Marcel Pro Eko (Poland). All analyses were performed in five replicates.

2.4. Metabolic Diversity of Soil Microbes

This diversity based on ability to oxidize carbon substrates was estimated using 96-well Biolog EcoPlates (Biolog Inc., Hayward, CA, USA), as described by Weber and Legge [29]. Biolog Ecoplates consisting of 31 carbon sources, including carbohydrates (10), carboxylic and acetic acids (9), amino acids (6), polymers (4), and amines (2), all in triplicate, were inoculated with 100 µL of suspension (dilution of 10−2) of soil sample, incubated for 4 days at 28 °C and read for absorbance at a wavelength of 590 nm using a microplate reader Multiskan FC photometer (Thermo Fisher Scientific, Waltham, MA, USA). The changes in color from colorless to purple resulted from a reduction in water-soluble triphenyl tetrazolium chloride to triphenyl formazan, thus indicating the degradation of carbon sources. The average well color development (AWCD) was determined after the incubation time for individual plates using the method described by Garland and Mills [30].

2.5. Statistical Analysis

All biological and chemical parameters were measured using five repetitions. The Biolog Ecoplate-derived metabolic diversity indices, AWCD, variations in the impact of drought stress on carbon source utilization and heatmaps were analyzed using a Morpheus heatmap (https://software.broadinstitute.org/morpheus/, accessed on 13 January 2022). Statistical analyses were performed using a repeated-measures ANOVA test (analysis of variance). The declared level of significance is p < 0.05 (*), p < 0.01 (**) and p < 0.001 (***). The principal component analysis (PCA) was performed to assess variations in the impact of drought stress on analyzed parameters. All data prior to PCA analysis were centered and log transformed.

2.6. DNA Extraction, Amplicon Sequencing and Bioinformatics Analyses

All analyses were performed by Eurofins Genomics (Constance, Germany). The DNA was quantified fluorometrically (Qubit 2.0), and the quality was assessed spectrophotometrically (NanoDrop 2000, Thermo Scientific, Waltman, MA, USA). The V1–V3 and V3–V4 regions of the bacterial 16S rRNA genes were amplified using primers 5′-AGAGTTTGATCATGGCTCAG-3′ [31], 5′-GTATTACCGCGGCTGCTG-3′ [32], and 5′-TACGGGAGGCAGCAG-3′ [33], respectively. The ITS regions of eukaryotic ribosomal DNA were amplified with the ITS1 and ITS2 primers [34]. The PCR products were sequenced using the Illumina sequencing platforms with a paired end-run type, as per the instructions provided in the manufacturer’s manual. A standard genomic library using UDI (unique dual indexing) was performed.
After determining DNA integrity and quality, DNA was prepared and sequenced at Eurofins Genomics (Constance, Germany) using an INVIEW Metagenome (eurofinsgenomics.eu) product. This included fragmentation, end-repair and dA-tailing, adapter ligation, size selection and library amplification. The prepared libraries were then quality-checked, pooled, and sequenced on an Illumina platform (Illumina NovaSeq6000, PE150 mode). Briefly, raw sequencing data were processed using fastp [35] software to remove poor-quality bases (below Phred Quality 20). The sequences were trimmed with a quality score threshold of ≤30, and those shorter than 250 bp were discarded. Manipulation of the FASTA/Q file was performed using a cross-platform and ultrafast toolkit SeqKit [36]. Taxonomic profiling was performed using MetaPhlAn [37] and the NCBI database for bacterial and fungal genomes. Unclassified reads were subjected to KrakenUniq [38] software, which performs confident and fast metagenomics classification, using unique k-mer counts. Kraken [39] classifies the reads by breaking each read into overlapping k-mers. A Vegan bioconductor package [40] was used to collect and normalize the read counts and compare species richness from all samples in the analysis run. Alpha-diversity (Shannon diversity index) was calculated at the genus level to show the relative bacterial and fungal diversity.

3. Results

3.1. Chemical Properties of Soil Samples

The chemical properties of four agricultural soil samples are shown in Table 1. The texture of the investigated soils varies from haplic luvisol in Suchatówka (S), which was most sandy, to stagnic luvisol in Lulkowo (L), fluvisol in Wielka Nieszawka (N), and gleyic luvisol (or luvic gleyic) Phaeozem in Gniewkowo (G), which were richer in clay. In addition, soil samples from the G location were rich in humus. The texture of the soils was as follows: 91–94% sand (2–0.05 mm), respectively; 5–7% silt (0.05–0.002 mm), respectively; and 1–2% clay (<0.002 mm), respectively. The total carbon and nitrogen content were not significantly affected in studied soil samples between the sampling day and the end of the prolonged drought stress (8 weeks), as given in Table 1.
The highest moisture content, observed on sampling day (T0), was reduced significantly after the 1st week (T1) of drought conditions in all soil samples (Figure 2). The most intense decrease in moisture content was observed in the sandy soil from the S site also at the end of the experiment (8 weeks, T8). The less intense reduction in moisture content was noted in fluvisol soil from the N site. The average moisture content in soil samples ranged from 12.23% to 20.40% at the collection date and from 0.96% to 8.75% at the end of the experiment, indicating a reduction in water content by 2.3, 2.9, 3.1 and 21.2 times in N, G, L and S soil samples, respectively.

3.2. Influence of Prolonged Drought Stress on Number of Microorganisms

Generally, the number of bacteria was significantly higher than the number of fungi in all tested soil samples (Figure 3). The number of studied microorganisms, especially Actinomycetota, increased at the 1st week of induced drought stress. Further prolonged drought conditions decreased the number of bacteria, but not radically, and significantly increased the number of Actinomycetota, especially at the end of the experiment. The numbers of fungi during four weeks of the experiment were found to be like those at the sampling day, but in most cases, similarly to actinomycetes, they were the highest at the end of the experiment (Figure 3).

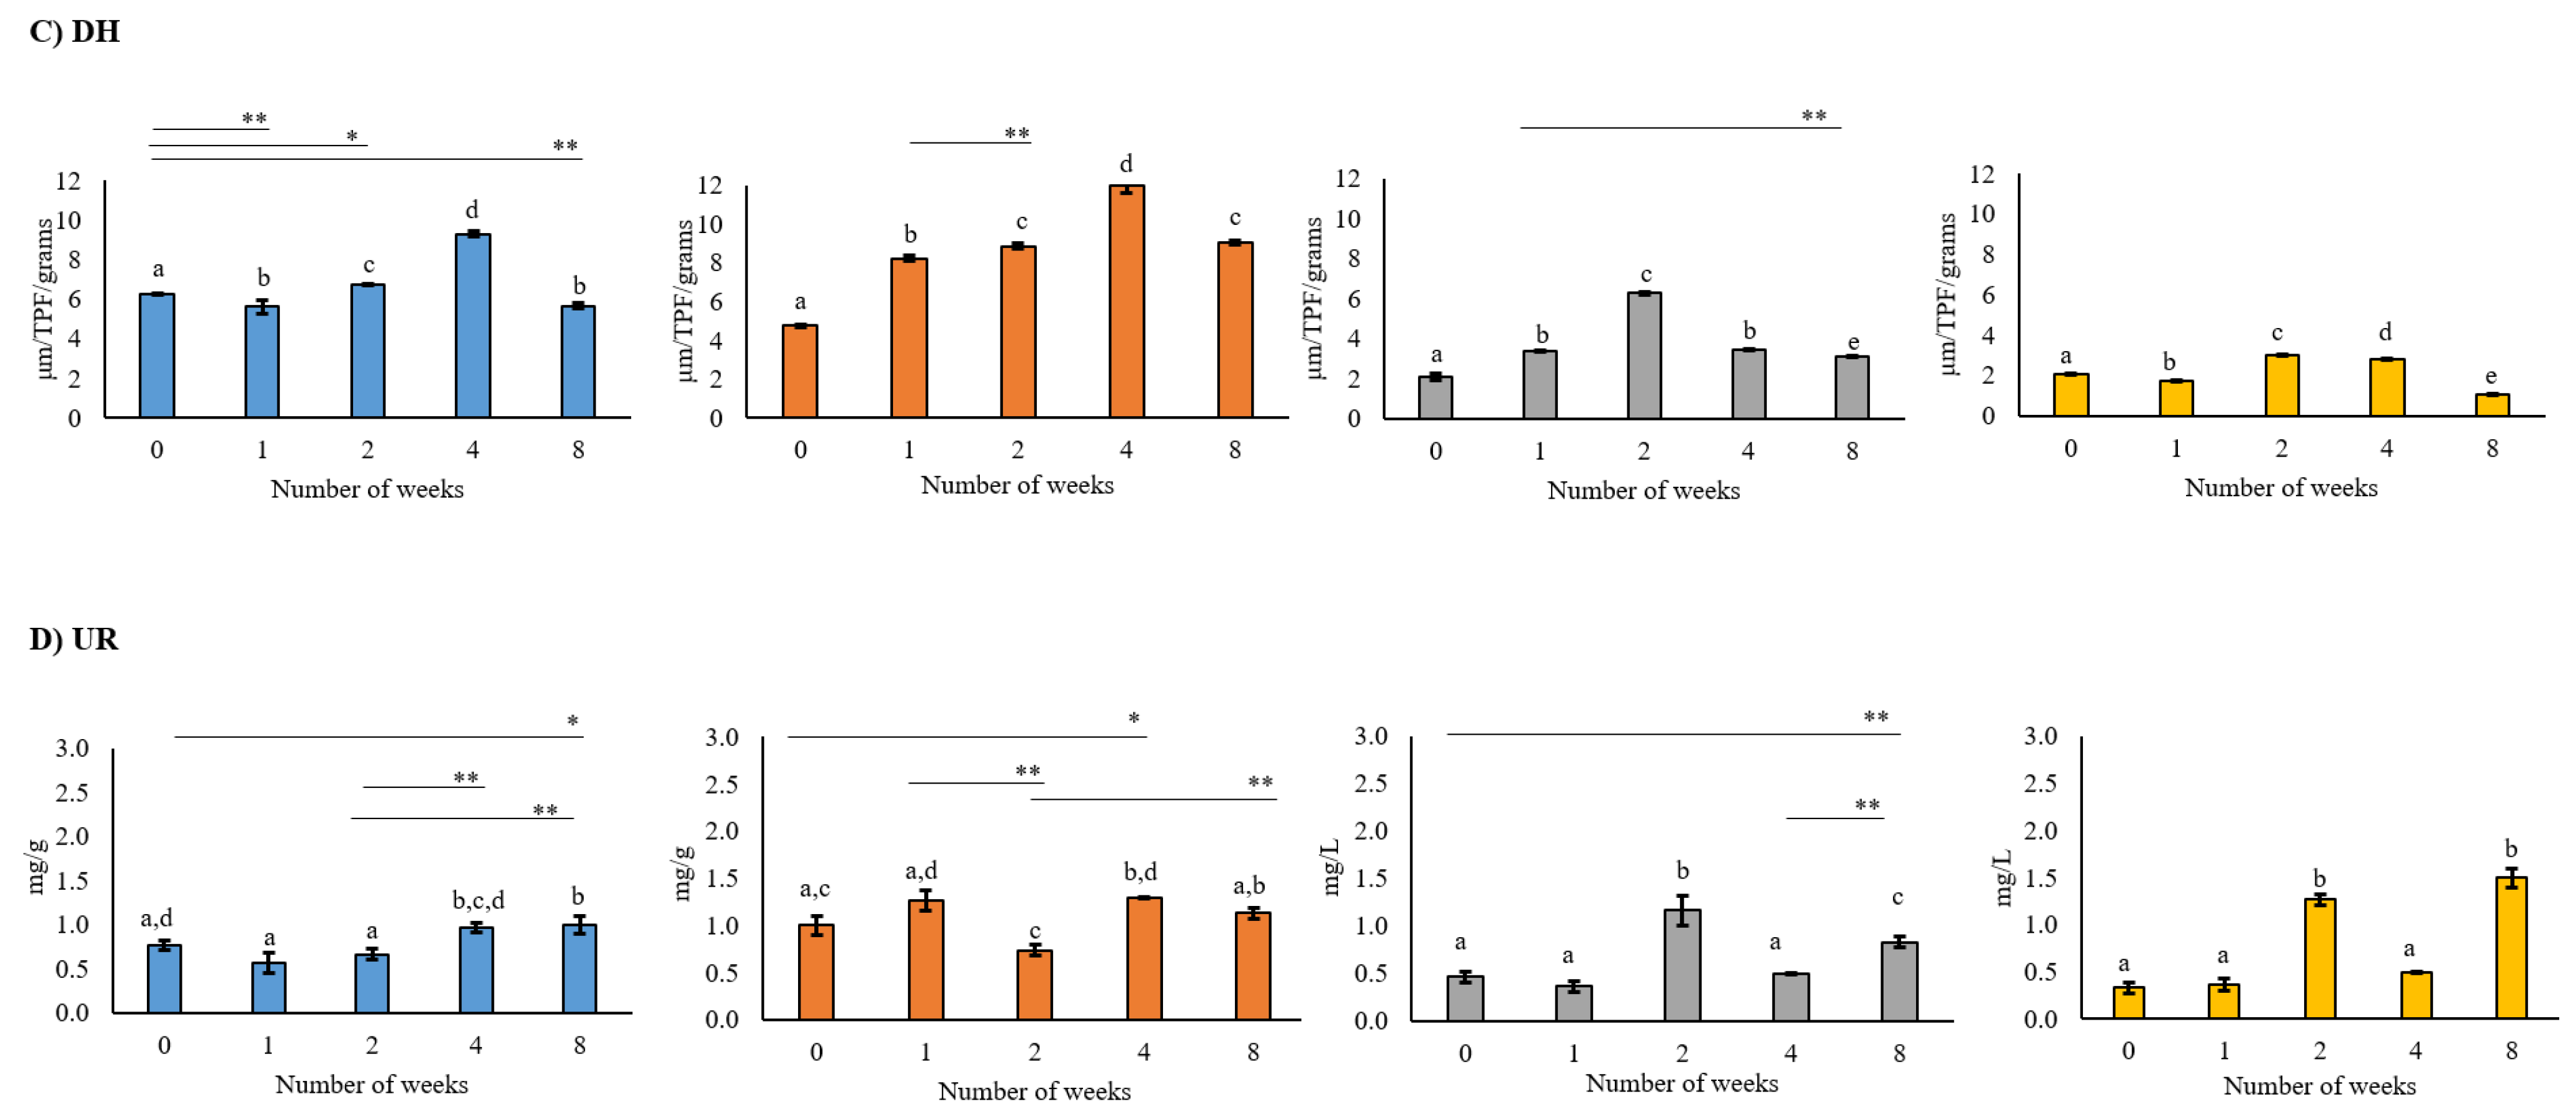
3.3. Effect of Drought Stress on Enzyme Activity

Overall, enzymatic activities varied during prolonged drought (Figure 4). Such conditions mostly negatively affected acid phosphatases activity in analyzed soil samples. The activity of acid and alkaline phosphatases was comparable in samples from the same location on the sampling day. In this study, the activity of alkaline phosphatase (ALP) was higher than that of acid phosphatases in corresponding soil samples. The ACP activity was strongly inhibited by drought in three soil samples, namely N, L and S sites. In turn, in the G soil sample, which was rich in organic matter content, the initial (1st week) drought conditions caused an increase in ACP activity and then a gradual decrease to be the lowest at the end of the experiment. Similarly, the ALP activity significantly increased together with a strong decrease in moisture content in the first week of drought stress and then decreased in all analyzed soil samples. A higher activity of dehydrogenases (DHs) was observed in soil samples with a higher amount of clay, especially those collected at G and N locations, which were less exposed to moisture loss than sandy soil from the S site. In the latter, the DH activity was significantly lower. Generally, DH activities in analyzed soil samples increased in the first month of induced drought and finally significantly decreased at the end of the experiment. The activity of urease (UR) varied in all analyses of the soil samples, and its activity fluctuated during the drought period but was higher at the end of the experiment than on the sampling day (more prominent in the S soil sample).
Moreover, based on PCA analysis, we showed a positive correlation between the moisture and dehydrogenase activity (Figure 5), indicating the dehydrogenase enzyme as an indicator of drought compared to other biological parameters (Figure 5). The total variance explained by Axis 1 and Axis 2 was 85.82% (45.617% and 40.203%, respectively).

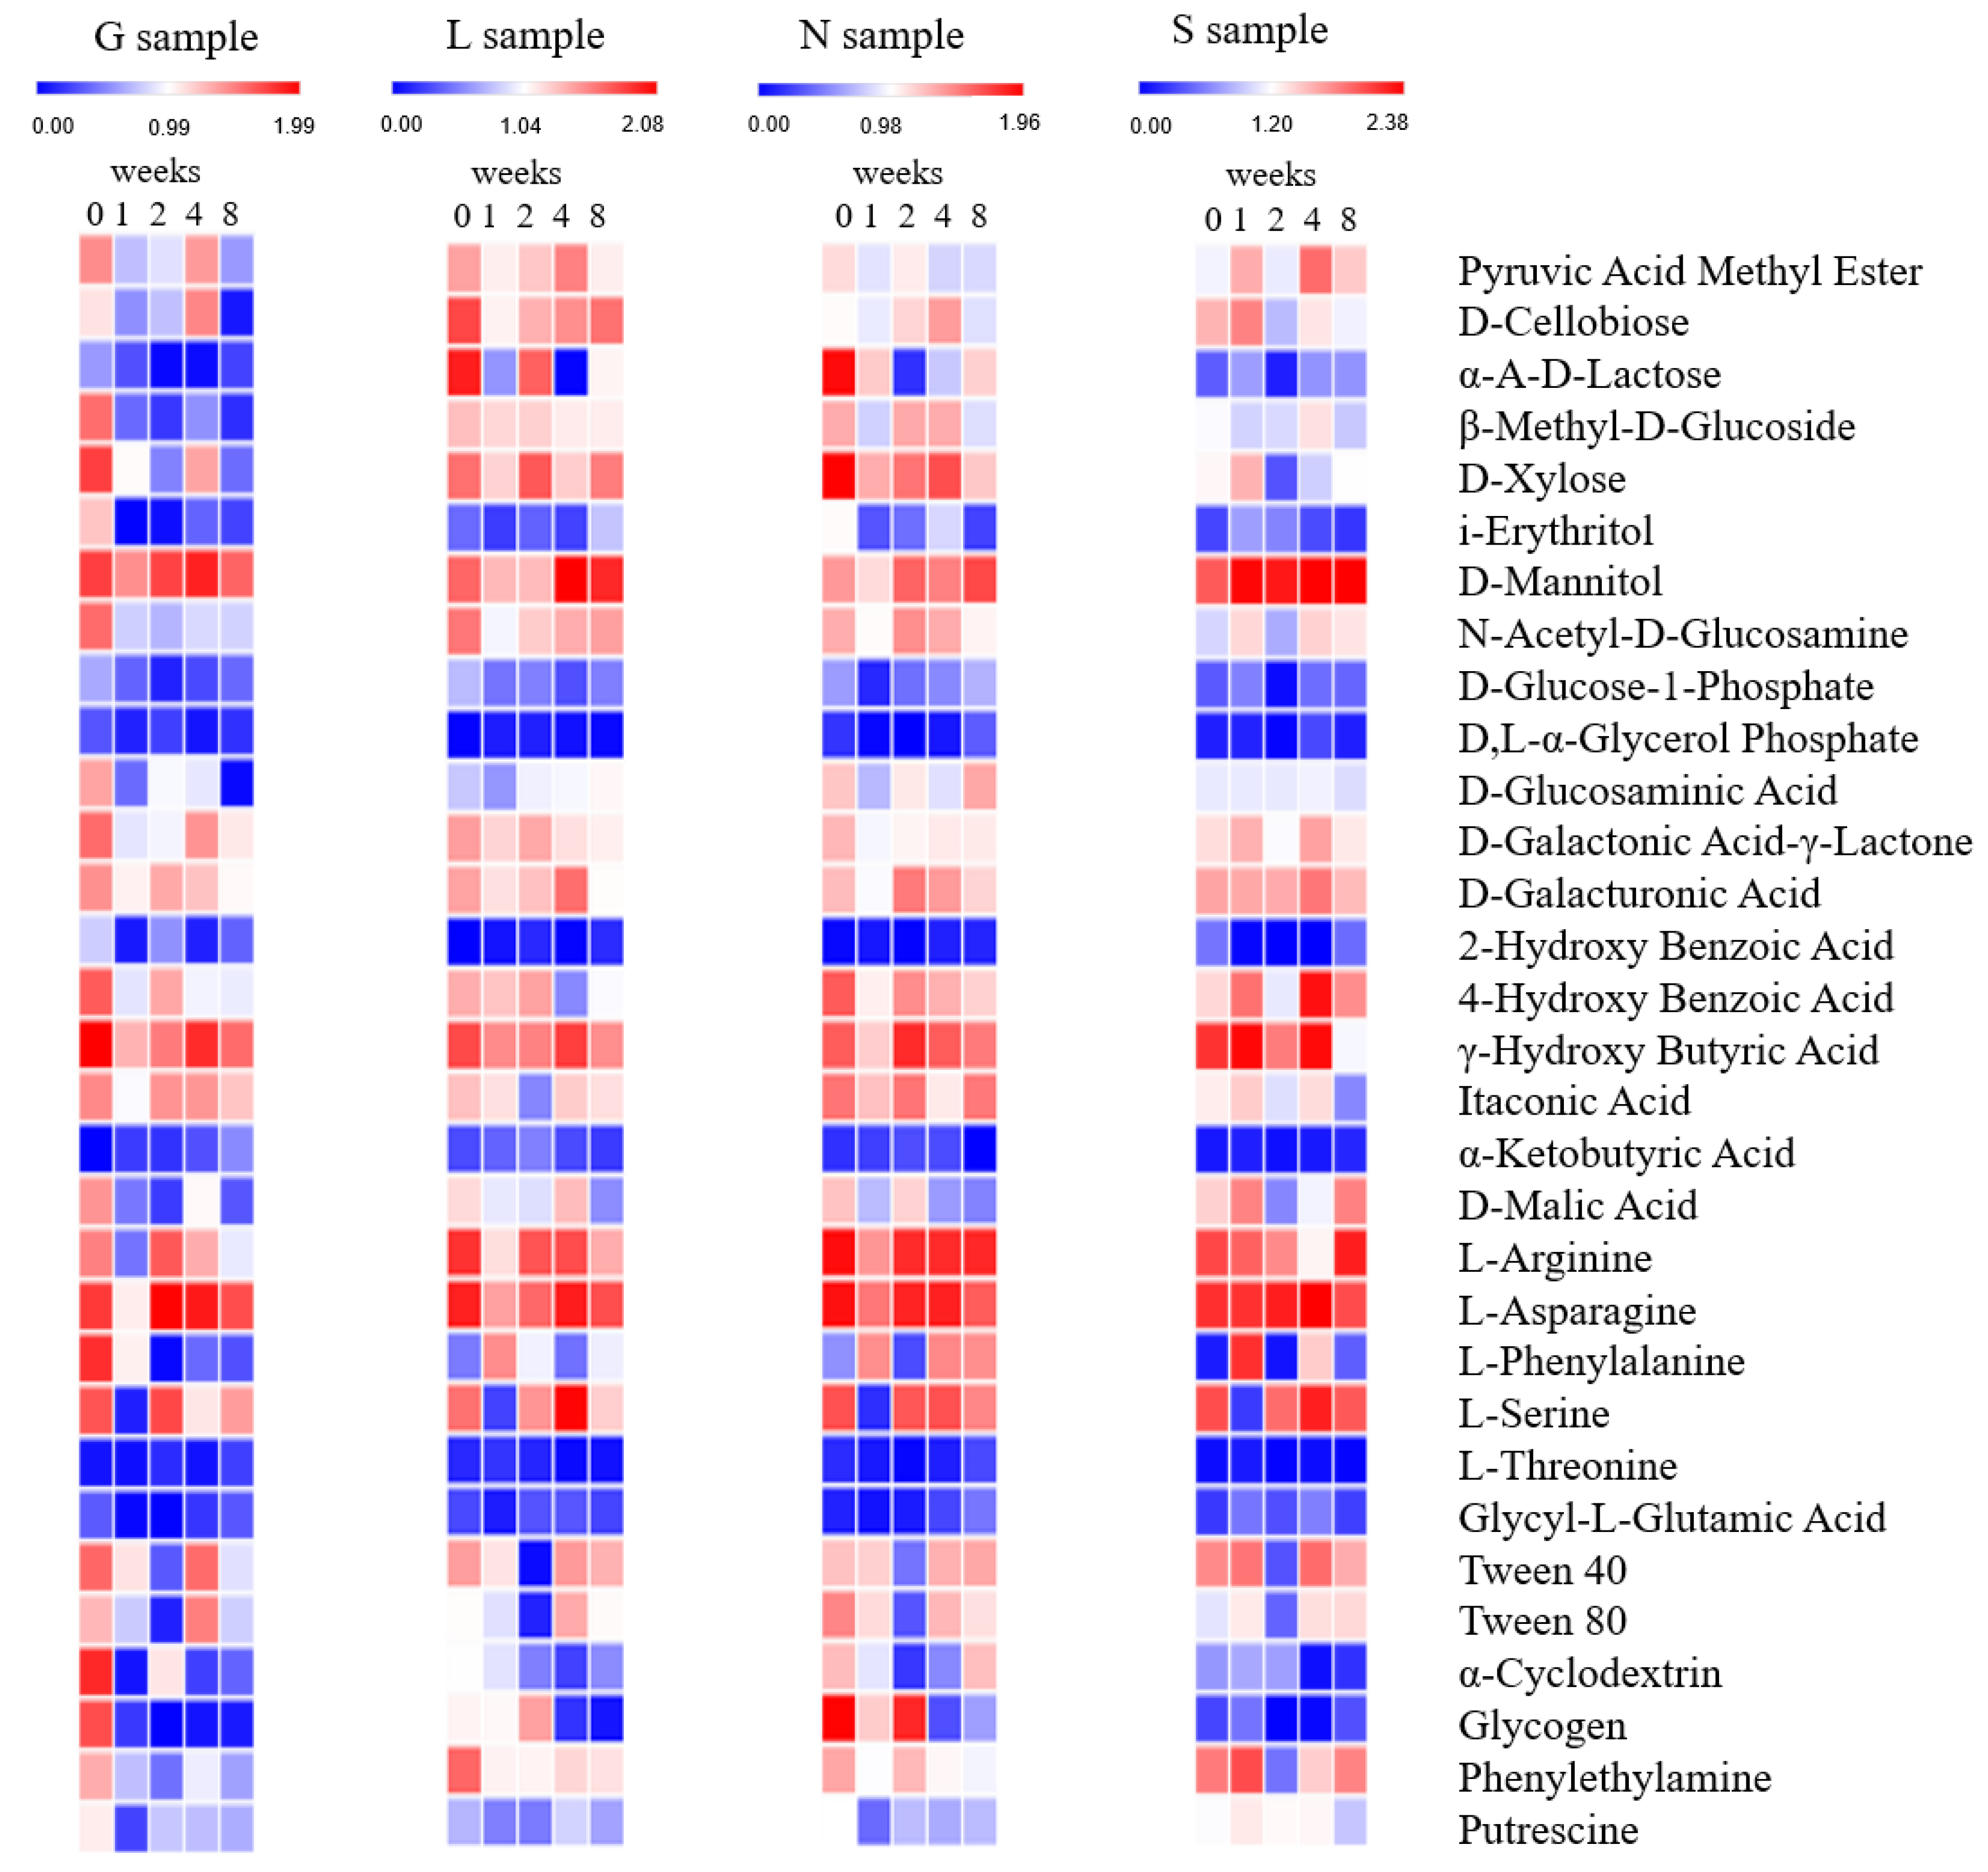
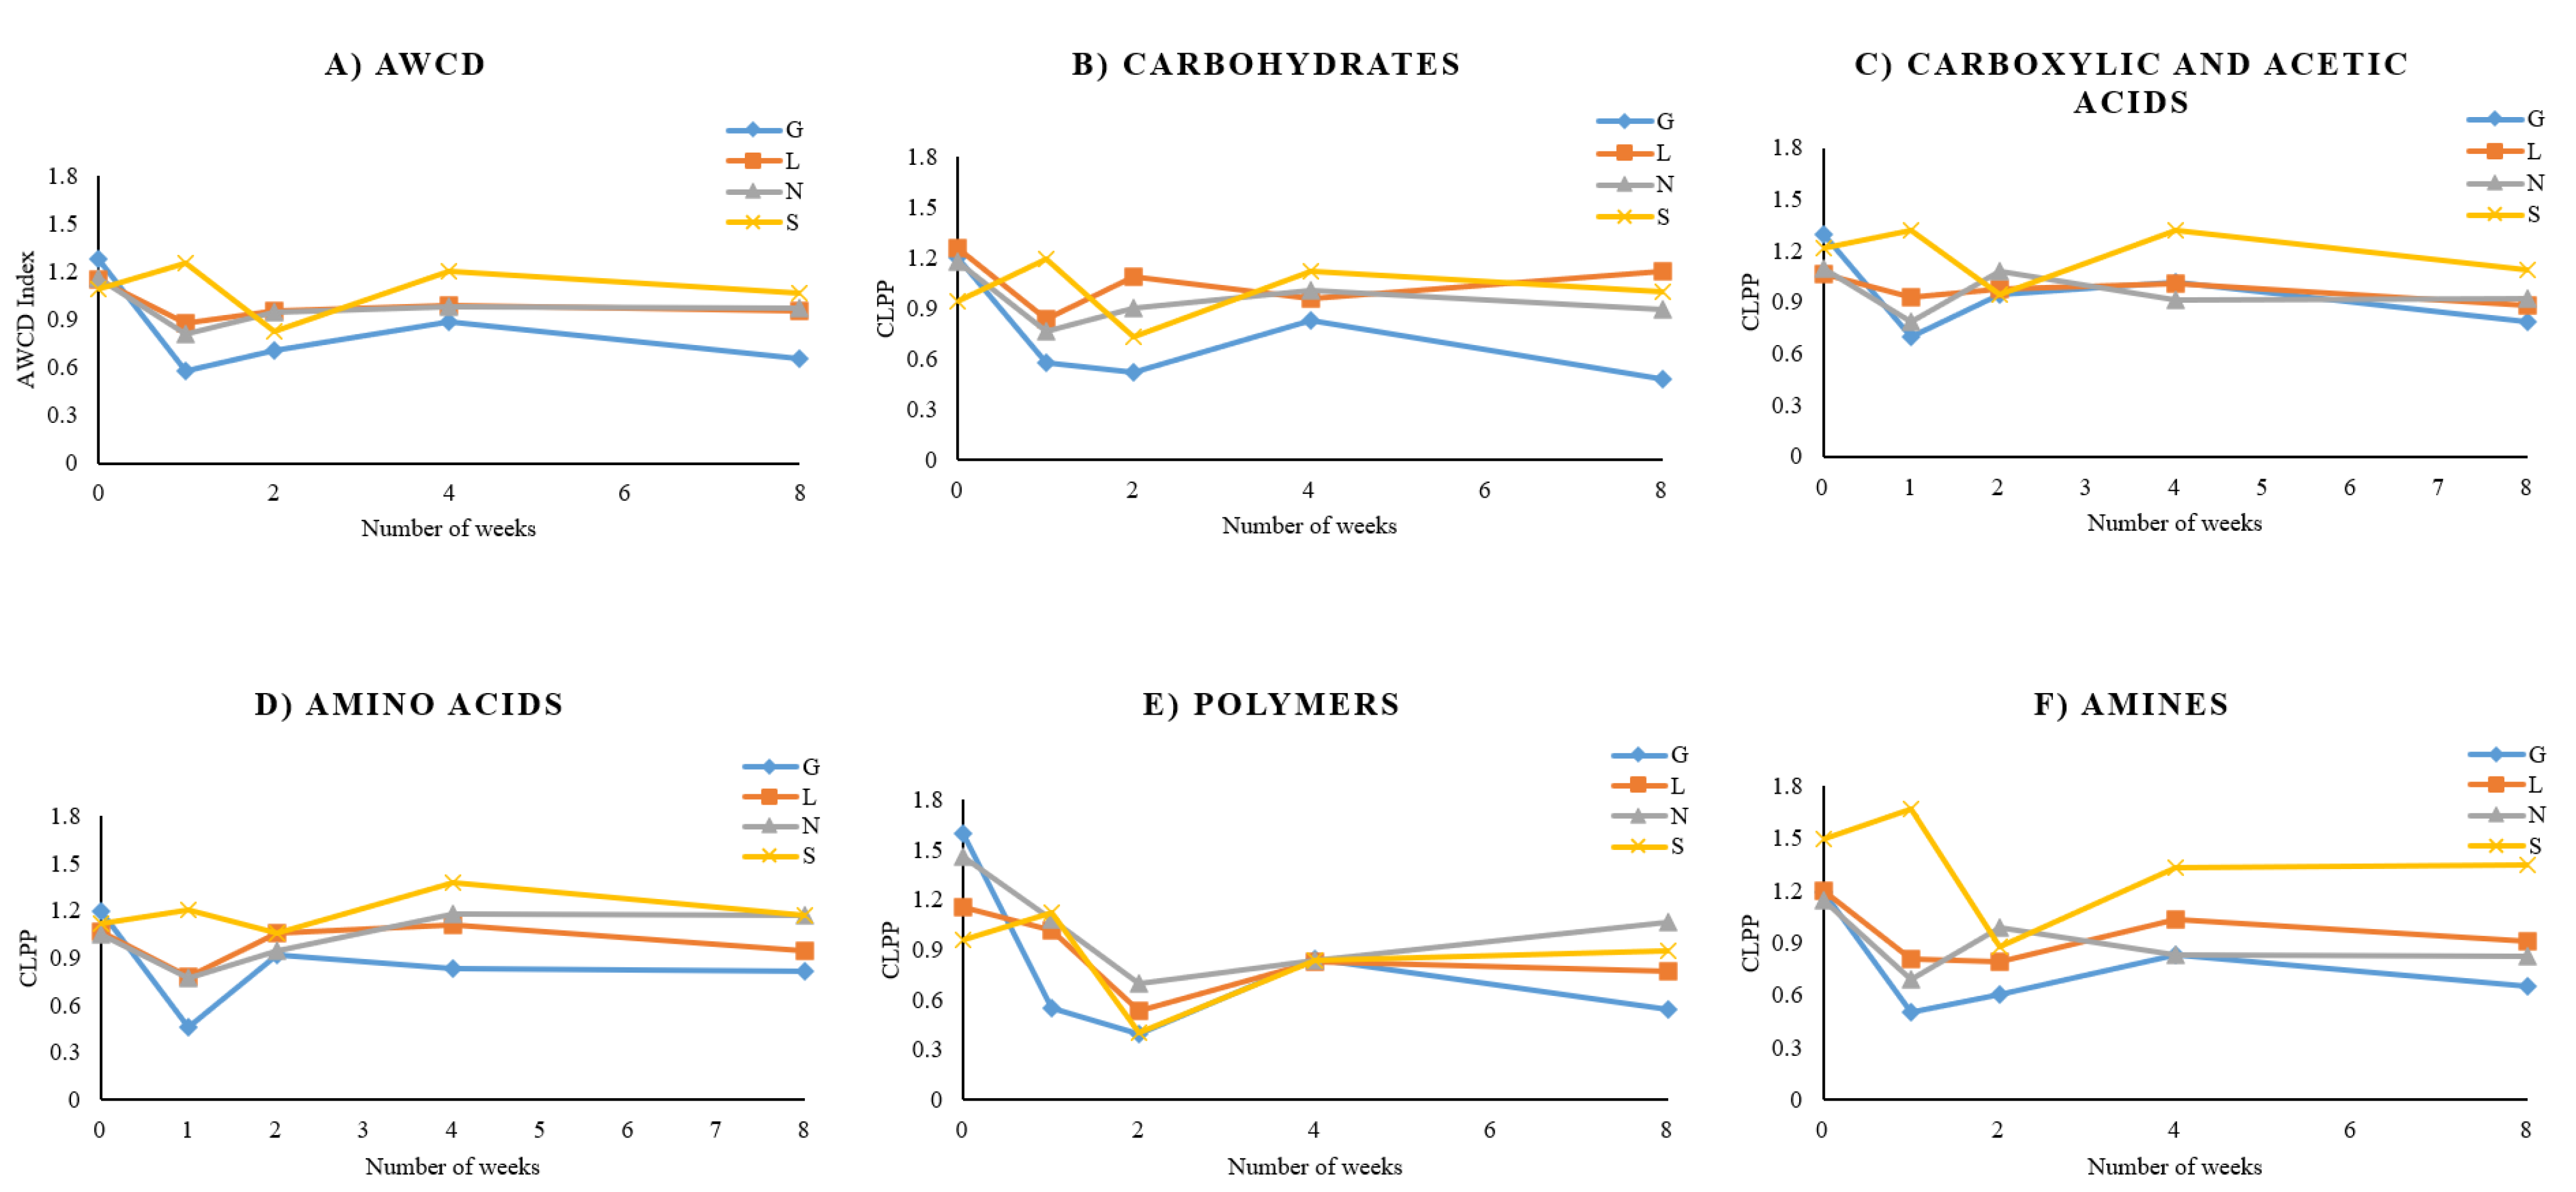
3.4. Estimation of Community Level Physiological Profiling (CLPP) of Soil Samples under Drought Stress

In the present study, CLPP analysis revealed the different metabolic potential to substrate utilization by microorganisms in the soil samples under induced drought conditions (Figure 6 and Figure 7A–F). At prolonged water stress conditions, a decrease in the utilization of major carboxylic and acetic acids, amino acids, polymers, and amines, with the exception of one carbohydrate D-mannitol and one amino acid, L-asparagine, was observed.
In our experiment, CLPP analysis revealed the highest utilization of carbon substrates for the S site followed by N, L and G sites. Consequently, in the S sample, a decrease in the utilization of three carbohydrates (D-cellobiose, β-methyl-D-glucoside and D-xylose), two carboxylic and acetic acids (γ-hydroxy butyric and itaconic acids), a polymer (α-cyclodextrin) and an amine (putrescine) were recorded at the end of the experiment compared to the sampling day (Figure 6 and Figure 7B–F). In turn, in the N sample, such a tendency was recorded for seven carbohydrates (pyruvic acid methyl ester, D-cellobiose, α-A-D-lactose, β-methyl-D-glucoside, D-xylose, i-erythritol and N-acetyl-D-glucosamine), three carboxylic and acetic acids (D-galactonic acid-γ-lactone, and 4-hydroxy benzoic and D-malic acids), an amino acid (L-serine), polymers (Tween 80 and glycogen), and amines. In case of the L sample, the weakness of the metabolism of five carbohydrates (pyruvic acid methyl ester, α-A-D-lactose, β-methyl-D-glucoside, N-acetyl-D-glucosamine and D-glucose-1-phosphate), six carboxylic and acetic acids (D-galactonic acid-γ-lactone, and D-galacturonic, 4-hydroxy benzoic, γ-hydroxy butyric, itaconic and D-malic acids), two amino acids (L-arginine and L-serine), polymers and amines was recorded at the end of the experiment compared to the sampling day. Finally, in the G sample, weak utilization was noted for eight carbohydrates (pyruvic acid methyl ester, D-cellobiose, α-A-D-lactose, β-methyl-D-glucoside, D-xylose, i-erythritol, N-acetyl-D-glucosamine and D-glucose-1-phosphate), eight carboxylic and acetic acids (D-glucosaminic acid, D-galactonic acid-γ-lactone, and D-galacturonic acid, 2-hydroxy benzoic acid, 4-hydroxy benzoic acid, γ-hydroxy butyric acid, itaconic acid, and D-malic acid), three amino acids (L-arginine, L-phenylalanine and L-serine), polymers and amines at the end of the experiment compared to the sampling day.
The AWCD values (representing carbon use intensities) were highest on the sampling day (T0) in all four soil samples and decreased with the decrease in water moisture levels at the 8th week. This can be correlated with a reduction in water content and bacterial community counts (Figure 7A). This analysis provides further evidence that prolonged induced drought led to an overall reduction in the metabolism of carbohydrates, carboxylic and acetic acids, and amino acids, polymers, and amines in all soil samples at the 8th week, except for high-carbohydrate metabolism observed in the S soil sample (Figure 7B–F). Mid-water stress (after 4 weeks of drought) led to the reduction in the AWCD and weak utilization of substrates. Although microorganisms still utilized the carbon substrates under drought conditions, the patterns revealed slow degradation but not complete inhibition (Figure 7B–F).

3.5. Impact of Drought on Genetic Diversity of Bacteria and Fungi

A total of 1,120,019 to 1,657,588 and 1,344,712 to 1,931,231 bacterial 16S rRNA sequences were obtained through amplicon sequencing on the sampling day and after 2 months of drought conditions, respectively. The bacterial communities in the soil samples at the beginning (T0) and the end (T8) of the experiment were dominated by four phyla, namely Actinomycetota, Bacteroidota, Bacillota and Pseudomonadota, accounting for >95% of the total abundance of bacteria in all sites (Table 2A). Pseudomonadota and Actinomycetota were found to dominate in all analyzed soil samples constituting 57.65%, 63.84%, 59.08% and 60.83%, and 38.38%, 32.83%, 37.57% and 36.96% of bacterial population at the G, L, N and S sites, respectively. In contrast, Bacteroidota and Bacillota abundance was significantly lower, namely 1.14–3.14% and 0.83–1.21%, respectively, in all soil samples. The relative abundance of Actinomycetota and Bacillota increased, while that of Pseudomonadota and Bacteroidota decreased after prolonged drought conditions. The relative abundance of Pseudomonadota decreased at the end (8 weeks, T8) of our experiment in the corresponding samples by 12.74%, 17.13%, 6.7% and 12.46%, respectively. In contrast, the relative abundance of the phylum Actinomycetota increased after prolonged drought stress by 14.97%, 18.25%, 8.08% and 12.44%, respectively (Table 2A). The relative abundance of Bacteroidota was reduced in the analyzed soil samples after prolonged drought and was found to be in the range of 0.61–1.10%, while Bacillota increased in samples G, L and S (1.12–1.24%) and slightly decreased in the N sample, namely from 1.21% to 1.05% (Table 2A). On the other hand, the total bacterial sequences increased by 4.77% and 2.21% in the L and N sites, respectively, and decreased by 1.86% and 2.23% in the G and S sites, respectively.
The investigated soil samples (G, L, N and S), at the beginning of the experiment, consisted of bacterial communities dominated by eleven genera, namely Actinoplanes, Bradyrhizobium, Geodermatophilus, Lysobacter, Micromonospora, Mycobacterium, Nocardioides, Solirubrobacter, Sorangium, Sphingomonas and Streptomyces (Table 2A). Genera Bradyrhizobium, Streptomyces, Sphingomonas, Nocardioides and Mycobacterium were the most abundant genera in the analyzed soil samples (34.4%, 16.0%, 9.9%, 9.6% and 8.1%, respectively), while others constituted < 4% of abundance (Table 2A). However, the abundance of these genera varied and showed different patterns depending on soil moisture fluctuations. The increase in abundance after prolonged drought was found for eight genera, namely Mycobacterium (by 8.22%, 8.91%, 8.01% and 15.46%), Geodermatophilus (by 5.94%, no significant difference in the L site, 2.06% and 3.57%), Actinoplanes (by 4.16%, 4.52%, 2.65% and 4.73%), Micromonospora (by 7.07%, 4.28%, 3.75% and 4.56%), Nocardioides (by 13.66%, 11.24%, 7.42% and 12.17%), Streptomyces (by 19.38%, 20.66%, 16.56% and 17.42%), Solirubrobacter (by 4.96%, 4.38%, 4.07% and 3.44%) and Sorangium (by 2.44%, 4.01%, 2.77% and 6%) in the G, L, N, and S sites, respectively. In contrast, the percentage of relative abundance of the genus Sphingomonas decreased at the 8th week of drought by 12.24%, 16.13%, 5.62% and 11.17%, whereas the genus Lysobacter decreased by 4.49%, 5.74%, 3.27% and 2.8% in the G, L, N, and S sites, respectively (Table 2A). Finally, the abundance of genus Bradyrhizobium decreased by 1.64% and 12.34% in the N and S sites at eight weeks, respectively, and increased by 1.46% and 3.69% in the G and L sites, respectively (Table 2A). The percentage of relative abundance of bacterial taxa living symbiotically with plant roots (Bradyrhizobium) in relation to the total number of bacterial taxa changed slightly during the study. The highest decrease in the relative abundance of symbiotic bacteria by 12% was observed in the S soil. In the remaining soil samples, the relative abundance of symbiotic bacteria was similar at the beginning and the end of the experiment (Table 2A). In case of alpha diversity, the drought treatment decreased the Shannon index of soil bacterial communities significantly for only the L site (p < 0.01) but increased in the S site (p < 0.001) (Table 3). The result indicated that the distributions of bacterial alpha diversity (Shannon index values) were altered under drought conditions.
A total of 10,526 to 12,658 and 11,088 to 40,414 fungal ITS sequences were obtained through amplicon sequencing on the sampling day and after 2 months of drought conditions, respectively. The fungal communities in the soil samples on the sampling day were dominated by four phyla: Ascomycota (83.48% abundance), Basidiomycota (10.25% abundance), Mucoromycota (3.57% abundance) and Apicomplexa (2.70% abundance), as shown in Table 2B. In general, phylum Ascomycota was the most abundant in all sites, where their abundance slightly increased by 1.96% and 2.22% in the N and S sites, respectively, but decreased by 0.9% and 0.24% in the G and L sites, respectively, after 2 months of drought conditions (Table 2B). Phylum Basidiomycota was found to increase by 2.27% in the G site, but it decreased by 0.43%, 0.76% and 1.87% in the L, N and S sites, respectively, at the end of the experiment (Table 2B). Similarly, the relative abundance of phylum Mucoromycota increased by 1.16 and 0.76% in the N and S sites but decreased by 0.76% and 1.14% in the G and L sites, respectively, at the end of our experiment (Table 2B). The lowest abundance among recognized phyla was Apicomplexa, which showed a reduction under prolonged drought stress by 0.62%, 0.50%, 0.07% and 1.11% in the G, L, N and S sites, respectively (Table 2B). On the other hand, the total fungal ITS sequences increased by 23.41%, 1.72%, 3.42% in the G, L and N sites, respectively, and they decreased by 0.03% in the S site.
A total of 23 genera consisting of Fusarium, Aspergillus, Colletotrichum, Trichoderma, Penicillium, Exophiala, Ustilago, Pseudogymnoascus, Verticillium, Chaetomium, Lobosporangium, Alternaria, Marssonina, Metarhizium, Anthracocystis, Thermothelomyces, Gaeumannomyces, Rhizophagus, Phycomyces, Tilletiopsis, Bipolaris, Purpureocillium, and Pyricularia were noted (Table 2B). Among the fungal communities, the most dominated genera were Fusarium (23.89% abundance) and Aspergillus (15.64% abundance), whereas others constituted < 8.16% of fungal genera abundance (Table 2B). The relative abundance of the genus Fusarium increased by 11.87%, 4.68% and 20.31% in the L, N and S soil samples, but it decreased by 8.39% in the G soil sample, respectively, after 2 months of drought (Table 2B). In contrast, the relative abundance of the genus Aspergillus increased by 0.68% in the G site and declined by 5.82%, 1.31% and 3.59% in the L, N and S sites, respectively, after 2 months of drought (Table 2B). Overall, the higher reduction in the relative abundance of genera after 2 months of drought was observed in the S site (in case of Aspergillus, Exophiala, Chaetomium, Colletotrichum, Lobosporangium, Marssonina, Metarhizium, Penicillium, Phycomyces, Pseudogymnoascus, Purpureocillium, Pyricularia, Rhizophagus, Thermothelomyces, Tilletiopsis, Trichoderma, Ustilago and Verticillium) and the L site (in case of Alternaria, Anthracocystis, Aspergillus, Chaetomium, Gaeumannomyces, Lobosporangium, Marssonina, Pseudogymnoascus, Pyricularia, Thermothelomyces, Tilletiopsis, Trichoderma, Ustilago and Verticillium) when compared to the G site (for Alternaria, Bipolaris, Chaetomium, Fusarium, Lobosporangium, Purpureocillium, Pyricularia, Rhizophagus and Verticillium) and the N site (for Aspergillus, Anthracocystis, Colletotrichum, Lobosporangium, Marssonina, Phycomyces, Rhizophagus, Trichoderma, Ustilago and Verticillium), as shown in Table 2B. The average percentage of relative abundance of mycorrhizal fungi (Rhizophagus) in relation to the other taxa participating in the decomposition of organic matter is less than 2%. The former abundance decreased by <1% in the G, N and S sites, but it increased by 2% in the L site at the end of the experiment. We did not observe significant changes between the sampling day and the end of the experiment (Table 2B). The drought treatment decreased the Shannon index of soil fungal communities significantly in three sites (L (p < 0.001), N (p < 0.05) and S (p < 0.001)) but increased in the G site (p < 0.001) (Table 3). The results indicate the alteration of fungal alpha diversity (Shannon index) when the soil was subjected to water stress conditions.

4. Discussion

Drought conditions alter the structure, abundance, and activity of microbial community in soils [4,6]. Under a low water amount, drought-sensitive microorganisms release substrates upon death into their surroundings, making it available for other drought-tolerant microbes [4,6]. However, under prolonged dry conditions, the abundance of active microorganisms may significantly decrease, leading to a reduction in soil enzyme activities and thereby lowering the nutrient mineralization (carbon, nitrogen, and phosphorus) and respiration [4,6]. Microbes either diminish or acquire a dormant phase when exposed to stressful environments, but the dormant ones regain their activity after the onset of favorable conditions. Therefore, understanding the impact of drought on microorganisms is critical for predicting the rates of decomposition and nutrient cycling in soils [41].

4.1. Soil Chemical Parameters

Soil chemical and nutrient properties can influence the overall biological structure of soil. Therefore, any changes in soil properties under drought conditions can have a significant impact on the ecosystem [42]. In this study, the chemical properties of the investigated agricultural soil samples largely varied under drought conditions. The soil moisture content was low at the end of drought conditions compared to the sampling day (Figure 2). However, between T1 (1st week) and T2 (2nd week), a significant rise in moisture levels in all the analyzed samples was observed (Figure 2). This could be related to rainfall and high humidity (>93%) on 12th June 2021 just before the sample collection at T2 (https://www.timeanddate.com/weather/poland/torun/historic?month=6&year=2021, accessed on 27 November 2022).
The soil sample from the S location, due to the highest sand and lowest organic carbon contents, was exposed to higher water loss. The total organic carbon and total nitrogen contents were slightly lower at the 8th week compared to the sampling day under drought stress conditions, but this decline was not significant (Table 1). Our results are in line with those by Zhang et al. [43] who observed no significant decrease in the organic carbon and total nitrogen contents after 2 years of drought stress in semi-humid forests, indicating that drought conditions slow down the transformations of carbon and nitrogen in soils. Such impacts may slowly decrease soil functionality, reducing the availability of soil nutrients to plants [41]. Interestingly, the highest increase in soil pH was observed in sandy soil and loamy soil with the highest organic matter content (Table 1). However, these changes were not considerable. Similar observations were reported by Siebielec et al. [6] in agriculture loamy, sandy, and sandy amended with compost soil samples under high drought conditions. The pH values of loamy soil were maintained at similar levels during prolonged drought up to 8 weeks, while in sandy soil, the pH slightly increased after the first period of drought (from 6.57 to 6.83) and then decreased at the 8th week of drought (6.43) (Table 1). In sandy soil amended with compost, a similar tendency (6.57, 6.73 and 6.67, respectively) was recorded [6].

4.2. Culture-Dependent and Culture-Independent Characterization of Microorganisms

The results of the present studies are in line with those previously published showing a negative influence of drought on the number of microorganisms in the soil environment and changes in the structure of cultivable microorganisms [6,44]. An increase in the abundance of spore-forming microorganisms, especially Gram-positive, spore-forming actinomycetes, unlike Gram-negative bacteria, in soil during drought conditions has been reported previously [6]. The high increase in the number of actinomycetes for two months’ drought stress could balance the decrease in the remaining bacteria, and therefore, the decrease in the number of all cultivable bacteria was not significant (Figure 3). In fact, the total bacterial sequences were higher after 2 months of drought conditions compared to the sampling day (Table 2A), using the metagenomics approach [45,46].
Overall, a significant decrease in the abundance of bacteria during drought conditions in the Mediterranean forest was found based on culture-independent studies [47]. Similarly, a lower abundance of bacteria was noted in two types of agriculture soil in Poland during prolonged (8 weeks) induced heavy drought maintained under controlled conditions [6].
The biodiversity and relative abundance of specific taxa of bacteria obtained from culture-independent studies precisely indicated the influence of water availability on these microorganisms. Prolonged drought conditions (2 months) lowered the relative abundance of Pseudomonadota (dominant at the sampling day) and Bacteroidota, and they increased Actinomycetota and Bacillota compared to the sampling day (Table 2A). Thus, our results from culture-independent studies follow other findings showing an increase in the abundance of Actinomycetota and Bacillota in soils under drought conditions [6,45,46,48,49] and decrease in Pseudomonadota and Bacteroidota (Table 2A) [6,45]. Moreover, Siebielec et al. [6] showed a significant decrease in the relative abundance of Verrucomicrobia (now Verrucomicrobiota; https://lpsn.dsmz.de/phylum/verrucomicrobia-1, accessed on 17 May 2023) in such conditions.
The increase in the abundance of Actinomycetota and Bacillota in analyzed soil samples by the end of 2 months of induced drought stress could be due to the spore-forming ability present in the members of these taxa, thus making them more resistant to both desiccation and harsh environments. Among Actinomycetota communities, possibly the growth of desiccation-tolerant taxa was favored under soil water deficit conditions [48]. Similarly, Veach et al. [50] showed a higher abundance of phylum Firmicutes (now Bacillota) under drought stress in soils, which is in line with our results (Table 2A). Actinomycetes contain adaptive mechanisms toward drought such as the utilization of recalcitrant carbon sources in nutrient-poor soils and are present in great abundance in arid soils [51]. They can grow at a minimum osmotic potential with an increase in abundance in dry soils. This could be because their spores can generally withstand, grow, and dominate in dry environments. In addition, they contain genes for complex carbon degradation and are resistant to desiccation [46,51]. Other general mechanisms that help them to sustain growth under droughted conditions consist of sporulation and thick cell walls characteristic of Gram-positive taxa, biofilm formation, and the production of osmolytes (amino acids and carbohydrates) [10,52].
In addition, prolonged drought stress may affect bacterial abundance at the genus level [6]. In the present study, genera Bradyrhizobium followed by Streptomyces were found to be most abundant at the beginning of the experiment, and prolonged drought increased their richness in the analyzed soil samples (Table 2A). In contrast, the highest decrease in abundance was found to be in Sphingomonas and Lysobacter (both Gram-negative) (Table 2A). Furthermore, there is a lot of evidence of decline in bacterial and fungal richness under drought conditions [49,53,54]. This reduction in the total bacterial biomass under drought conditions could result from limited access to resources such as plant litter [15]. There are different reasons for the shifts in soil bacterial community composition under drought conditions that may verify their unique drought stress sensitivities. Gram-positive and Gram-negative bacteria harbor different substrate utilization and metabolic potential. Therefore, the former is metabolically stable compared to the latter. In addition, Gram-positive bacteria can synthesize extracellular enzymes by utilizing inorganic nitrogen to break down complex organic compounds available in abundance in droughted soils, while Gram-negative bacteria prefer the utilization of labile carbon compounds and organic nitrogen from plant root exudates [55]. Under drought conditions, due to the very low availability of labile organic carbon in soil, it becomes difficult for the survival of Gram-negative bacteria [56]. Moreover, the lysis of sensitive bacterial cells results in the release of substrates that possibly act as an energy source for the drought-resistant microorganisms [57]. Therefore, due to microbial death and undergoing dormancy under drought soil conditions, the overall bacterial activity decreases [15].
Fungi are essential in the functioning of soil ecosystem, as they are one of the major contributors toward efficient biogeochemical cycles. They help in the decomposition or mineralization of organic matter from plant-available nutrients, thus contributing to the stability of soil organic carbon pools [58]. It should be highlighted that reports on the impact of prolonged drought stress on fungi in agricultural soils are limited (Figure 3). Although the numbers of fungi in analyzed soil samples varied during the experiment period, their increase in abundance was observed at the 8th week of prolonged drought stress compared to the sampling day (Figure 3). The resistance of fungal communities to drought stress was previously reported [59,60,61]. However, some studies are in contradiction to our findings, showing a negative influence of drought on soil fungi, as exemplified by studies of Ochoa-Hueso et al. [62] on mesic ecosystems and Hayden et al. [10] on grassland soil, and causing alterations in functional and compositional changes [63]. The variation of fungal response toward drought may develop based on the environmental structure, thus revealing the sensitivity of fungal communities toward harsh conditions in agricultural soil and mesic environments compared to other ecosystems [53]. During alterations in the soil moisture content, the dominant fungi adapted to previous moisture content may have reduced because the fungal community presents a specific composition depending on soil moisture [64]. Hence, it is difficult to predict the response of fungal communities under dry conditions, which makes this area of study lagging with incomplete understanding [65].
In this study, the fungal community was dominated by Ascomycota and Basidiomycota (Table 2B), as previously reported in most dryland, semi-arid grasslands, and agricultural soils [6,59,66,67]. Both phyla constituted 81.54–83.48% and 10.25–13.51% on the sampling day, and 82.58–85.23% and 10.11–12.52% during the 8th week of prolonged drought stress in four soil samples, respectively (Table 2B). Our results are in line with the findings of other authors who also reported a high relative abundance of Ascomycota and Basidiomycota in different soil habitats, such as grasslands (56% and 17%), mixed grasslands (54% and 25%), mixed woodlands (62% and 21%) and woodlands (58% and 24%) [66], agricultural soil 62–89% (Ascomycota) [59], drylands (89.3–93.5% and 2.6–6.3%) [68], and semi-arid ecosystem (91.88% and 7.27%) [67], respectively. Their ability to form extensive networks of hyphae makes them tolerant to low moisture environments via accessing nutrients and water from long distances [69]. However, a disturbance in nutrient diffusion in low water conditions can promote the expansion of soil hyphal networks [11]. It is known that fungi can preferentially live in large pores of the soil that are filled with high moisture levels but are void at water deficit conditions. Therefore, these large pores inhabit a reduced relative abundance of fungal taxa in dry conditions, while the abundance of other microbial populations could increase [70]. The occurrence of soil moisture shifts also results in a decline in the activity of dominant fungal communities that are previously adapted to moisture content, resulting in having a weak competitive ability against other fungal populations [71]. This explains the disproportion of fungal communities between the zero-sampling day and after the 2 month drought period in all sites. On the other hand, we found an overall highest relative abundance of the genus Fusarium, which includes numerous plant pathogens of important agricultural lands and are known to cause dangerous lethal effects on crops. This genus is also responsible in the production of greenhouse gas nitrous oxide (N2O) [11].

4.3. Impact of Drought on Soil Enzyme Activities

Generally, in water stress conditions, microbial enzyme activities slow down or completely decrease due to the lack of sufficient substrates, uneven diffusion of substrates, and accumulation of inhibitory osmolytes or ions toward enzymes. This leads to the alteration of their functioning and affects the decomposition of soil organic matter (SOM) [21]. DH is the most important soil enzyme which plays a vital role in the biological oxidation of SOM and the carbon (C) cycling in this biome [21]. DHs exist only in viable microbial cells; they do not accumulate in the soil, and therefore, they can be used as an indicator of the overall soil microbial activity, including the influence of abiotic stress on such activity [21]. Dehydrogenase activity is influenced by water content and decreases with the reduction in soil humidity [21]. Li et al. [72] found that an increase in aridity caused a decrease in DH activity in humid, mildly arid, and arid Mediterranean soil samples. However, DH activity is also positively correlated with the SOM content, which provides nutrients for microbial biomass and affects higher enzyme production [21]. Therefore, a higher dehydrogenase enzyme activity was found in loamy soils, especially in the G and N samples than in sandy soil samples (the S samples), even if the moisture content decreased for prolonged drought stress (Figure 4). Moreover, an increase or similar abundance of microorganisms was observed for the first month of drought stress (Figure 3). Prolonged 8-week stress finally decreased the abundance of bacteria and significantly decreased the DH activity (Figure 4). Similar observations were reported by Siebielec et al. [6] who showed an increase in DH activity in highly stressed loamy soil after one month and its significant decrease after two months of drought, while in sandy soil, this activity was similar during all periods of the experiment. Thus, soils exposed to drought or changes in soil water levels are critical in determining groups of physiologically active soil microorganisms [73].
Microorganisms are a prime source of soil phosphatases activity in the bulk soil [74]. Levels of soil phosphatase in the soil depend on various factors such as organic material content, microbial counts, tillage, organic and mineral fertilizers, and other agricultural-related practices [75]. Moreover, soil pH could determine phosphatase activity. Acid and alkaline phosphatase activity are higher in acid and alkaline soils, respectively [75]. As the pH of soil samples was slightly acidic and even increased after prolonged drought stress (Table 1), it was expected that the activity of acid phosphatases would be low. This situation was confirmed in three soil samples collected from the L, N and S soil samples (Figure 4). On the other hand, the G site showed higher ACP activity compared to the other sites during 2 months of induced drought stress (Figure 4). This could be due to the presence of high humic substances in the G site [76] that binds and protects the enzyme from heat degradation. In general, ALP activities are correlated with soil water content [20]. ALP activities due to propitious pH values of analyzed soils were higher than ACP activities (Figure 4). The increase in the alkaline phosphatase activities in the first week of drought stress, in which the highest decrease in moisture content was observed, could result from the increase in the number of microorganisms, especially actinomycetes (Figure 3). A subsequent decrease in this enzyme activity reflects the negative impact of prolonged drought on the activity of the microbial community and can affect the alteration of P cycles by water stress conditions [20]. The reduction in rhizosphere alkaline phosphatase activity due to water stress conditions was also proved by other researchers [77]. Reports on phosphatase activity in agriculture soils under drought stress are limited. Our results show similarity with other studies. Sardans and Peñuelas [20] confirmed that a reduction of 21% of soil moisture reduced acid phosphatase activity by 31–40% (pH 6.5) in the Mediterranean forest. Huang et al. [78] showed a decrease in acid phosphatases in the dry season (p < 0.01; 1.33 times lower) (4.06 (Masson pine forest), 3.82 (coniferous and broadleaved mixed forest) and 3.67 (monsoon evergreen broadleaved forest)) compared to the wet season (4.14 (Masson pine forest), 3.95 (coniferous and broadleaved mixed forest) and 3.67 (p < 0.05; monsoon evergreen broadleaved forest)). According to Siebielec et al. [6], acid and alkaline phosphatases activities in loamy and sandy agriculture soils were negatively affected after one month under severe drought stress, and then its activities highly increased after two months of such stress conditions when compared with the sampling day. However, these activities were found to decrease when compared with control samples maintained under optimal conditions of 60% of field water-holding capacity. Under drought stress, the mineralization of P is affected due to the inactivation of microbial decomposers or accumulation of solutes or organic P on the upper soil layers [79]. Such water stress environments restrict the diffusion of the enzyme, substrates, and products, affecting the uptake of nutrients and results in a negative impact on soil microbial activity, microbial biomass, and plants [80]. Therefore, phosphatase serves as an indicator for the presence of inorganic phosphorus for microorganisms and plants [81].
The UR enzyme is the most important soil enzyme in the functioning of nitrogen (N) cycle in soil [20]. Although fluctuations in the UR activity were observed under the drought period, at the end of the experiment, its activity was found to increase when compared with the sampling day in all analyzed soil samples (Figure 4). Our results are in line with findings by Ng et al. [82] which showed that drought did not affect the soil urease activity. However, Sardans and Peñuelas [20] revealed that a reduction of 10% and 21% of soil moisture decreased UR activity by 10–67% and 42–60%, respectively, in Mediterranean forest soil, revealing the link between dry conditions and slower nutrient turnover. Although a drop in moisture content in the analyzed samples ranged from 12.23% to 20.40% in the analyzed soil samples (highest in the S soil sample) (Figure 2), the significant decreases in UR activity were not noticed (Figure 4). No effect of drought on the inhibition of urease activity could be due to the interaction of enzymes with clay and humic substances, helping the microorganisms retain functional levels of activity even under prolonged drought conditions [83]. Hence, the determination of UR activity can be useful in monitoring microbial metabolism, N cycling and soil fertility.
An overall decrease in the soil enzymes activities, which are responsible for regulating P, N and C nutrient cycles, in the stressed soils indicates that soil nutrients might be altered under such conditions, thus altering soil nutrient availability and reducing the nutrient supply to plants [20]. Our study reveals direct or indirect alterations in soil microbial abundances and communities, nutrient cycling, and enzymes under dry conditions ultimately hampering the soil quality and productivity.

4.4. CLPP Analysis under Drought Conditions

Biolog EcoPlates are useful in the evaluation of changes in microbial community structure and soil respiration [84]. This assay is helpful in revealing the functional profile of potential microbial communities in biological soil samples [84]. Biolog EcoPlates have been a rarely explored tool for studying the response of microbial communities to drought conditions. In our study, we observed a strong inhibition of microbial functions in two months of drought conditions. The highest metabolic diversity in soil samples was observed on the sampling day and decreased simultaneously up to 2 months under drought conditions (Figure 6 and Figure 7A–F). The different substrate utilization potential of soil microbial communities under 2 months of drought conditions indicates their diverse metabolic capacity [85]. AWCD reveals variations in soil respiratory activity depending on the preference of substrate utilization by microbes [86]. The data show a decrease in the amount and rate of substrate utilization after 2 months compared to the sampling day under induced drought conditions (Figure 6 and Figure 7B–F). In addition, a linear relationship between the concentration and physiological state of the microorganism and soil moisture levels with respect to AWCD rates was observed. It was noted that the metabolic activity of soil microbial species decreased with the decrease in soil water status [63].
This suggests that a change in the soil water availability is critical in discriminating the microbial abundance and physiologically active types of microbes [4,16,72,87]. According to Preece et al. [16], a great negative influence of drought on microbial community physiological profiles in soil was observed. It could be the result of a decrease in the number of microorganisms and microbial activity [4]. Our results are in line with the above findings, revealing a decrease in substrate utilization in response to drought in different soil ecosystems. Although our study shows different effects in CLPP between the soil samples, it confirms that a decrease in soil moisture status leads to a decrease in the overall soil respiration potential.
Although short-term drought had a significant effect on soil properties and microbial communities among the four sites, there may be other limitations in our study. At the time of sampling, there were no crops on all sampling sites, which was the effect of a very cold spring and delayed vegetation season in 2021 in Poland. All sites were not fertilized by organic fertilizers, and the last fertilization process was carried out in the autumn season in the previous year, and therefore, our samples were devoid of manure. Further contributing factors need to be also considered to understand the impact of water deficit conditions on agricultural soils. Some of such factors include the effect of plant-derived inputs (e.g., litter fall and root biomass), temperature, fertilizers, different crops, irrigation, and other agricultural practices.

5. Conclusions

This study showed the significant impact of prolonged induced drought stress on soil water content, microbial community, their enzymes, and metabolic diversity. Here, we provide evidence that the soil chemical properties, microbial abundance, dehydrogenase, phosphatase and urease enzyme activities, and overall metabolic diversity are sensitive to water stress conditions in the tested soil samples. Our results suggest that the reduction in soil enzyme activities can affect soil nutrient availability (i.e., phosphorus, nitrogen, and carbon), leading to obstruction of the nutrient supply to plants. After 2 months of induced drought conditions, we observed that the sandiest soil from Suchatówka (S) had the lowest moisture content and enzyme activities compared to soil samples from Lulkowo (L), Wielka Nieszawka (N) and Gniewkowo (G) that were richer in clay. Overall, an increase in the number of actinomycetes and fungi, with no significant changes in total bacterial numbers, was observed in all sites at the end of our experiment compared to the sampling day but with fluctuations in one month of induced drought stress. For enzyme activity, the decrease in overall phosphatase activity (acid and alkaline), dehydrogenases activity, and increase in urease activity was observed at the end of the experiment compared to the sampling day. The acid phosphatase activity was the most sensitive to drought conditions compared to other analyzed enzymes, with the overall lowest enzyme activities in site S. In case of metabolic diversity analysis, a decrease in the average well color development (AWCD) values was observed with a decrease in soil moisture content and overall reduction in the utilization of carbon sources, apart from D-mannitol and L-asparagine, in all sites. This may indicate substantial shifts both in the microbial community composition and metabolic diversity in our investigated soil samples. Our study found differences in the soil microbial community composition on the sampling day and after 2 months of induced drought conditions in agricultural soils by evaluating both fungal and bacterial taxa via amplicon sequencing. In general, we found a reduction in the abundance of Pseudomonadota, greater abundance of drought-resistant bacteria (Actinomycetota and Bacillota), lower abundance of Basidiomycota and Apicomplexa and high abundance of Ascomycota. This pattern suggests that microbial communities may respond differently to drought along moisture gradients, and fungal populations were more sensitive to drought in these agricultural lands compared to bacteria. The genetic diversity of bacteria and fungi reflects the importance of soil moisture levels in improving the ability of microbes to access nutrients and enhance their motility. Moreover, climate change scenarios can create new insights into the response of microbial communities under drought conditions. Thus, knowledge about their response to global climate change is of fundamental importance and should be used in building mitigation techniques.
Our understanding of the links between the direct effects of climate change (drought) on microbial community changes, their enzymes and metabolic diversity are vital to mitigate negative impact on agricultural soils. The limited knowledge on extreme weather events makes it difficult to deal with their harmful effects on ecosystems. Perhaps the implementation of various strategies to escape from drought conditions needs to be initiated in drought-sensitive regions. For example, water ponds and tank-fed watersheds, integrated in situ soil and water conservation practices, groundwater recharge, decrease in greenhouse gases at the field level, afforestation, mulching, optimum fertilizers and manures application, and many other management practices could be a remedy in several arid and semi-arid regions. Hence, this comprehensive study on the impact of prolonged water stress generates new insights about the modification of the soil microbiome, their enzymes and the metabolic potential in an ecosystem. Future research is important to precisely understand the shift of microbiological-derived soil functioning at the genetic diversity level under drought conditions. This knowledge maybe possibly be utilized to build a potential bridge between current issues and mitigation processes resulting from drought conditions.

Author Contributions

M.W. conceptualized the study. M.W. and P.G. supervised the study. K.A.B. performed all studies related to microbial isolation, enumeration and activity and analyzed the data. K.A.B. and P.S. were responsible for soil parameters analyses. K.A.B. and P.G. were responsible for the original draft preparation. P.G., M.W. and A.B.-B. reviewed and edited the manuscript. All authors contributed to the article and approved the submitted version. All authors have read and agreed to the published version of the manuscript.

Funding

This work was supported and funded by the Bacto-Tech Sp. z o.o. (Poland).

Data Availability Statement

The raw data supporting the conclusion of this manuscript will be made available by the authors, without undue reservation, to any qualified researcher. DNA sequencing data are available at NCBI SRA BioProject ID PRJNA935985.

Acknowledgments

K.B. thankfully acknowledge Bacto-Tech Sp. z o.o. for financial support.

Conflicts of Interest

Authors M.W. and A.B.B. are employed by Bacto-Tech Sp. z o.o. All authors declare no competing interests.

References

  1. Kumar, A.; Rana, K.S.; Choudhary, A.K.; Bana, R.S.; Sharma, V.K.; Prasad, S.; Gupta, G.; Choudhary, M.; Pradhan, A.; Rajpoot, S.K.; et al. Energy Budgeting and Carbon Footprints of Zero-Tilled Pigeonpea–Wheat Cropping System under Sole or Dual Crop Basis Residue Mulching and Zn-Fertilization in a Semi-Arid Agro-Ecology. Energy 2021, 231, 120862. [Google Scholar] [CrossRef]
  2. Swaminathan, M.S.; Kesavan, P.C. Agricultural Research in an Era of Climate Change. Agric. Res. 2012, 1, 3–11. [Google Scholar] [CrossRef]
  3. IPCC. Summary for Policymakers. In Climate Change 2021: The Physical Science Basis. Contribution of Working Group I to the Sixth Assessment Report of the Intergovernmental Panel on Climate Change; Delmotte, M.V., Zhai, P., Pirani, A., Connors, S.L., Péan, C., Berger, S., Caud, N., Chen, Y., Goldfarb, L., Gomis, M.I., et al., Eds.; Cambridge University Press: Cambridge, UK, 2021; In Press. [Google Scholar]
  4. Bogati, K.; Walczak, M. The Impact of Drought Stress on Soil Microbial Community, Enzyme Activities and Plants. Agronomy 2022, 12, 189. [Google Scholar] [CrossRef]
  5. Jansson, J.K.; Hofmockel, K.S. Soil Microbiomes and Climate Change. Nat. Rev. Microbiol. 2020, 18, 35–46. [Google Scholar] [CrossRef]
  6. Siebielec, S.; Siebielec, G.; Klimkowicz-Pawlas, A.; Gałązka, A.; Grządziel, J.; Stuczyński, T. Impact of Water Stress on Microbial Community and Activity in Sandy and Loamy Soils. Agronomy 2020, 10, 1429. [Google Scholar] [CrossRef]
  7. Schimel, J.P.; Gulledge, J.M.; Clein-Curley, J.S.; Lindstrom, J.E.; Braddock, J.F. Moisture Effects on Microbial Activity and Community Structure in Decomposing Birch Litter in the Alaskan Taiga. Soil Biol. Biochem. 1999, 31, 831–838. [Google Scholar] [CrossRef]
  8. Santos-Medellín, C.; Edwards, J.; Liechty, Z.; Nguyen, B.; Sundaresan, V. Drought Stress Results in a Compartment-Specific Restructuring of the Rice Root-Associated Microbiomes. mBio 2017, 8, e00764-17. [Google Scholar] [CrossRef]
  9. Xu, L.; Naylor, D.; Dong, Z.; Simmons, T.; Pierroz, G.; Hixson, K.K.; Kim, Y.-M.; Zink, E.M.; Engbrecht, K.M.; Wang, Y.; et al. Drought Delays Development of the Sorghum Root Microbiome and Enriches for Monoderm Bacteria. Proc. Natl. Acad. Sci. USA 2018, 115, E4284–E4293. [Google Scholar] [CrossRef]
  10. Hayden, H.L.; Mele, P.M.; Bougoure, D.S.; Allan, C.Y.; Norng, S.; Piceno, Y.M.; Brodie, E.L.; DeSantis, T.Z.; Andersen, G.L.; Williams, A.L.; et al. Changes in the Microbial Community Structure of Bacteria, Archaea and Fungi in Response to Elevated CO2 and Warming in an Australian Native Grassland Soil: Climate Change Effects on Microbial Communities. Environ. Microbiol. 2012, 14, 3081–3096. [Google Scholar] [CrossRef]
  11. Oliveira, T.B.; Lucas, R.C.; de Scarcella, A.S.A.; Contato, A.G.; Pasin, T.M.; Martinez, C.A.; Polizeli, M.d.L.T.d.M. Fungal Communities Differentially Respond to Warming and Drought in Tropical Grassland Soil. Mol. Ecol. 2020, 29, 1550–1559. [Google Scholar] [CrossRef]
  12. Evans, S.E.; Wallenstein, M.D. Soil Microbial Community Response to Drying and Rewetting Stress: Does Historical Precipitation Regime Matter? Biogeochemistry 2012, 109, 101–116. [Google Scholar] [CrossRef]
  13. Fry, E.L.; Manning, P.; Macdonald, C.; Hasegawa, S.; De Palma, A.; Power, S.A.; Singh, B.K. Shifts in Microbial Communities Do Not Explain the Response of Grassland Ecosystem Function to Plant Functional Composition and Rainfall Change. Soil Biol. Biochem. 2016, 92, 199–210. [Google Scholar] [CrossRef]
  14. Wu, Z.; Dijkstra, P.; Koch, G.W.; Peñuelas, J.; Hungate, B.A. Responses of Terrestrial Ecosystems to Temperature and Precipitation Change: A Meta-Analysis of Experimental Manipulation: Meta-Analysis Of Experimental Manipulation. Glob. Chang. Biol. 2011, 17, 927–942. [Google Scholar] [CrossRef]
  15. Alster, C.J.; German, D.P.; Lu, Y.; Allison, S.D. Microbial Enzymatic Responses to Drought and to Nitrogen Addition in a Southern California Grassland. Soil Biol. Biochem. 2013, 64, 68–79. [Google Scholar] [CrossRef]
  16. Preece, C.; Farré-Armengol, G.; Peñuelas, J. Drought Is a Stronger Driver of Soil Respiration and Microbial Communities than Nitrogen or Phosphorus Addition in Two Mediterranean Tree Species. Sci. Total Environ. 2020, 735, 139554. [Google Scholar] [CrossRef] [PubMed]
  17. Steinweg, J.M.; Dukes, J.S.; Paul, E.A.; Wallenstein, M.D. Microbial Responses to Multi-Factor Climate Change: Effects on Soil Enzymes. Front. Microbiol. 2013, 4, 146. [Google Scholar] [CrossRef] [PubMed]
  18. Yan, Z.; Li, Y.; Wu, H.; Zhang, K.; Hao, Y.; Wang, J.; Zhang, X.; Yan, L.; Kang, X. Different Responses of Soil Hydrolases and Oxidases to Extreme Drought in an Alpine Peatland on the Qinghai-Tibet Plateau, China. Eur. J. Soil Biol. 2020, 99, 103195. [Google Scholar] [CrossRef]
  19. Deng, L.; Peng, C.; Kim, D.-G.; Li, J.; Liu, Y.; Hai, X.; Liu, Q.; Huang, C.; Shangguan, Z.; Kuzyakov, Y. Drought Effects on Soil Carbon and Nitrogen Dynamics in Global Natural Ecosystems. Earth-Sci. Rev. 2021, 214, 103501. [Google Scholar] [CrossRef]
  20. Sardans, J.; Peñuelas, J. Drought Decreases Soil Enzyme Activity in a Mediterranean Quercus Ilex L. Forest. Soil Biol. Biochem. 2005, 37, 455–461. [Google Scholar] [CrossRef]
  21. Wolińska, A.; Stepniewsk, Z. Dehydrogenase Activity in the Soil Environment. In Dehydrogenases; Canuto, R.A., Ed.; InTech: Houston, TX, USA, 2012; ISBN 978-953-307-019-3. [Google Scholar]
  22. Henry, H.A.L. Reprint of “Soil Extracellular Enzyme Dynamics in a Changing Climate”. Soil Biol. Biochem. 2013, 56, 53–59. [Google Scholar] [CrossRef]
  23. Warzyński, H.; Sosnowska, A.; Harasimiuk, A. Effect of Variable Content of Organic Matter and Carbonates on Results of Determination of Granulometric Composition by Means of Casagrande’s Areometric Method in Modification by Prószyński. Soil Sci. Annu. 2018, 69, 39–48. [Google Scholar] [CrossRef]
  24. Bednarek, R.; Dziadowiec, H.; Pokojska, U.; Prusinkiewicz, Z. Eco-Pedological Studies; PWN: Warsaw, Poland, 2004; p. 344. [Google Scholar]
  25. Furtak, K.; Grządziel, J.; Gałązka, A.; Niedźwiecki, J. Analysis of Soil Properties, Bacterial Community Composition, and Metabolic Diversity in Fluvisols of a Floodplain Area. Sustainability 2019, 11, 3929. [Google Scholar] [CrossRef]
  26. Nakano, H.; Takenishi, S.; Watanabe, Y. Purification and Properties of Urease from Brevibacterium Ammoniagenes. Agric. Biol. Chem. 1984, 48, 1495–1502. [Google Scholar] [CrossRef]
  27. Kandeler, E.; Gerber, H. Short-Term Assay of Soil Urease Activity Using Colorimetric Determination of Ammonium. Biol. Fert. Soils 1988, 6, 68–72. [Google Scholar] [CrossRef]
  28. Tabatabai, M.A. Soil enzymes. In Methods of Soil Analysis, Part 2; Page, A.L., Miller, R.H., Keeney, D.R., Eds.; American Society of Agronomy and Soil Science Society of America: Madison, WI, USA, 1982. [Google Scholar]
  29. Weber, K.P.; Legge, R.L. One-Dimensional Metric for Tracking Bacterial Community Divergence Using Sole Carbon Source Utilization Patterns. J. Microbiol. Methods 2009, 79, 55–61. [Google Scholar] [CrossRef]
  30. Garland, J.L.; Mills, A.L. Classification and Characterization of Heterotrophic Microbial Communities on the Basis of Patterns of Community-Level Sole-Carbon-Source Utilization. Appl. Environ. Microbiol. 1991, 57, 2351–2359. [Google Scholar] [CrossRef]
  31. Weisburg, W.G.; Barns, S.M.; Pelletier, D.A.; Lane, D.J. 16S Ribosomal DNA Amplification for Phylogenetic Study. J Bacteriol 1991, 173, 697–703. [Google Scholar] [CrossRef]
  32. Leser, T.D.; Amenuvor, J.Z.; Jensen, T.K.; Lindecrona, R.H.; Boye, M.; Møller, K. Culture-Independent Analysis of Gut Bacteria: The Pig Gastrointestinal Tract Microbiota Revisited. Appl. Environ. Microbiol. 2002, 68, 673–690. [Google Scholar] [CrossRef]
  33. Turner, S.; Pryer, K.M.; Miao, V.P.W.; Palmer, J.D. Investigating Deep Phylogenetic Relationships among Cyanobacteria and Plastids by Small Subunit RRNA Sequence Analysis. J. Eukaryot. Microbiol. 1999, 46, 327–338. [Google Scholar] [CrossRef]
  34. White, T.J.; Bruns, T.; Lee, S.; Taylor, J. Amplification and Direct Sequencing of Fungal Ribosomal Rna Genes for Phylogenetics. In PCR Protocols; Elsevier: Amsterdam, The Netherlands, 1990; pp. 315–322. ISBN 978-0-12-372180-8. [Google Scholar]
  35. Chen, S.; Zhou, Y.; Chen, Y.; Gu, J. Fastp: An Ultra-Fast All-in-One FASTQ Preprocessor. Bioinformatics 2018, 34, i884–i890. [Google Scholar] [CrossRef]
  36. Shen, W.; Le, S.; Li, Y.; Hu, F. SeqKit: A Cross-Platform and Ultrafast Toolkit for FASTA/Q File Manipulation. PLoS ONE 2016, 11, e0163962. [Google Scholar] [CrossRef] [PubMed]
  37. Truong, D.T.; Franzosa, E.A.; Tickle, T.L.; Scholz, M.; Weingart, G.; Pasolli, E.; Tett, A.; Huttenhower, C.; Segata, N. MetaPhlAn2 for Enhanced Metagenomic Taxonomic Profiling. Nat. Methods 2015, 12, 902–903. [Google Scholar] [CrossRef] [PubMed]
  38. Breitwieser, F.P.; Baker, D.N.; Salzberg, S.L. KrakenUniq: Confident and Fast Metagenomics Classification Using Unique k-Mer Counts. Genome Biol. 2018, 19, 198. [Google Scholar] [CrossRef] [PubMed]
  39. Wood, D.E.; Salzberg, S.L. Kraken: Ultrafast Metagenomic Sequence Classification Using Exact Alignments. Genome Biol. 2014, 15, R46. [Google Scholar] [CrossRef]
  40. Oksanen, J.; Blanchet, F.G.; Kindt, R.; Legendre, P.; Minchin, P.R.; O’Hara, R.B.; Simpson, G.L.; Solymos, P.; Stevens, M.H.H.; Wagner, H. Vegan: Community Ecology Package. R Package Version 2.2-0. 2014. Available online: http://CRAN.Rproject.org/package=vegan (accessed on 10 April 2023).
  41. Nguyen, L.T.T.; Osanai, Y.; Anderson, I.C.; Bange, M.P.; Tissue, D.T.; Singh, B.K. Flooding and Prolonged Drought Have Differential Legacy Impacts on Soil Nitrogen Cycling, Microbial Communities and Plant Productivity. Plant Soil 2018, 431, 371–387. [Google Scholar] [CrossRef]
  42. Schimel, J.P. Life in Dry Soils: Effects of Drought on Soil Microbial Communities and Processes. Annu. Rev. Ecol. Evol. Syst. 2018, 49, 409–432. [Google Scholar] [CrossRef]
  43. Zhang, Q.; Shao, M.; Jia, X.; Wei, X. Changes in Soil Physical and Chemical Properties after Short Drought Stress in Semi-Humid Forests. Geoderma 2019, 338, 170–177. [Google Scholar] [CrossRef]
  44. Luis Moreno, J.; Bastida, F.; Díaz-López, M.; Li, Y.; Zhou, Y.; López-Mondéjar, R.; Benavente-Ferraces, I.; Rojas, R.; Rey, A.; Carlos García-Gil, J.; et al. Response of Soil Chemical Properties, Enzyme Activities and Microbial Communities to Biochar Application and Climate Change in a Mediterranean Agroecosystem. Geoderma 2022, 407, 115536. [Google Scholar] [CrossRef]
  45. Chodak, M.; Gołębiewski, M.; Morawska-Płoskonka, J.; Kuduk, K.; Niklińska, M. Soil Chemical Properties Affect the Reaction of Forest Soil Bacteria to Drought and Rewetting Stress. Ann. Microbiol. 2015, 65, 1627–1637. [Google Scholar] [CrossRef]
  46. Hartmann, M.; Brunner, I.; Hagedorn, F.; Bardgett, R.D.; Stierli, B.; Herzog, C.; Chen, X.; Zingg, A.; Graf-Pannatier, E.; Rigling, A.; et al. A Decade of Irrigation Transforms the Soil Microbiome of a Semi-Arid Pine Forest. Mol. Ecol. 2017, 26, 1190–1206. [Google Scholar] [CrossRef]
  47. Curiel Yuste, J.; Fernandez-Gonzalez, A.J.; Fernandez-Lopez, M.; Ogaya, R.; Penuelas, J.; Sardans, J.; Lloret, F. Strong Functional Stability of Soil Microbial Communities under Semiarid Mediterranean Conditions and Subjected to Long-Term Shifts in Baseline Precipitation. Soil Biol. Biochem. 2014, 69, 223–233. [Google Scholar] [CrossRef]
  48. Mickan, B.S.; Abbott, L.K.; Solaiman, Z.M.; Mathes, F.; Siddique, K.H.M.; Jenkins, S.N. Soil Disturbance and Water Stress Interact to Influence Arbuscular Mycorrhizal Fungi, Rhizosphere Bacteria and Potential for N and C Cycling in an Agricultural Soil. Biol. Fertil. Soils 2019, 55, 53–66. [Google Scholar] [CrossRef]
  49. Naylor, D.; Coleman-Derr, D. Drought Stress and Root-Associated Bacterial Communities. Front. Plant Sci. 2018, 8, 2223. [Google Scholar] [CrossRef]
  50. Veach, A.M.; Zeglin, L.H. Historical Drought Affects Microbial Population Dynamics and Activity During Soil Drying and Re-Wet. Microb. Ecol. 2020, 79, 662–674. [Google Scholar] [CrossRef]
  51. Mohammadipanah, F.; Wink, J. Actinobacteria from Arid and Desert Habitats: Diversity and Biological Activity. Front. Microbiol. 2016, 6, 1541. [Google Scholar] [CrossRef]
  52. Bouskill, N.J.; Wood, T.E.; Baran, R.; Ye, Z.; Bowen, B.P.; Lim, H.; Zhou, J.; Nostrand, J.D.V.; Nico, P.; Northen, T.R.; et al. Belowground Response to Drought in a Tropical Forest Soil. I. Changes in Microbial Functional Potential and Metabolism. Front. Microbiol. 2016, 7, 525. [Google Scholar] [CrossRef]
  53. Hawkes, C.V.; Kivlin, S.N.; Rocca, J.D.; Huguet, V.; Thomsen, M.A.; Suttle, K.B. Fungal Community Responses to Precipitation: Fungal Climate Response. Glob. Chang. Biol. 2011, 17, 1637–1645. [Google Scholar] [CrossRef]
  54. Fahey, C.; Koyama, A.; Antunes, P.M.; Dunfield, K.; Flory, S.L. Plant Communities Mediate the Interactive Effects of Invasion and Drought on Soil Microbial Communities. ISME J. 2020, 14, 1396–1409. [Google Scholar] [CrossRef]
  55. Balasooriya, W.K.; Denef, K.; Huygens, D.; Boeckx, P. Translocation and Turnover of Rhizodeposit Carbon within Soil Microbial Communities of an Extensive Grassland Ecosystem. Plant Soil 2014, 376, 61–73. [Google Scholar] [CrossRef]
  56. Thaysen, E.M.; Reinsch, S.; Larsen, K.S.; Ambus, P. Decrease in Heathland Soil Labile Organic Carbon under Future Atmospheric and Climatic Conditions. Biogeochemistry 2017, 133, 17–36. [Google Scholar] [CrossRef]
  57. Zornoza, R.; Guerrero, C.; Mataix-Solera, J.; Arcenegui, V.; García-Orenes, F.; Mataix-Beneyto, J. Assessing the Effects of Air-Drying and Rewetting Pre-Treatment on Soil Microbial Biomass, Basal Respiration, Metabolic Quotient and Soluble Carbon under Mediterranean Conditions. Eur. J. Soil Biol. 2007, 43, 120–129. [Google Scholar] [CrossRef]
  58. Bowles, T.M.; Acosta-Martínez, V.; Calderón, F.; Jackson, L.E. Soil Enzyme Activities, Microbial Communities, and Carbon and Nitrogen Availability in Organic Agroecosystems across an Intensively-Managed Agricultural Landscape. Soil Biol. Biochem. 2014, 68, 252–262. [Google Scholar] [CrossRef]
  59. Carbone, M.J.; Alaniz, S.; Mondino, P.; Gelabert, M.; Eichmeier, A.; Tekielska, D.; Bujanda, R.; Gramaje, D. Drought Influences Fungal Community Dynamics in the Grapevine Rhizosphere and Root Microbiome. J. Fungi 2021, 7, 686. [Google Scholar] [CrossRef] [PubMed]
  60. Hanaka, A.; Ozimek, E.; Reszczyńska, E.; Jaroszuk-Ściseł, J.; Stolarz, M. Plant Tolerance to Drought Stress in the Presence of Supporting Bacteria and Fungi: An Efficient Strategy in Horticulture. Horticulturae 2021, 7, 390. [Google Scholar] [CrossRef]
  61. Yan, L.; Zhu, J.; Zhao, X.; Shi, J.; Jiang, C.; Shao, D. Beneficial Effects of Endophytic Fungi Colonization on Plants. Appl. Microbiol. Biotechnol. 2019, 103, 3327–3340. [Google Scholar] [CrossRef] [PubMed]
  62. Ochoa-Hueso, R.; Collins, S.L.; Delgado-Baquerizo, M.; Hamonts, K.; Pockman, W.T.; Sinsabaugh, R.L.; Smith, M.D.; Knapp, A.K.; Power, S.A. Drought Consistently Alters the Composition of Soil Fungal and Bacterial Communities in Grasslands from Two Continents. Glob. Chang. Biol. 2018, 24, 2818–2827. [Google Scholar] [CrossRef]
  63. Manzoni, S.; Schimel, J.P.; Porporato, A. Responses of Soil Microbial Communities to Water Stress: Results from a Meta-analysis. Ecology 2012, 93, 930–938. [Google Scholar] [CrossRef]
  64. Chenu, C.; Hassink, J.; Bloem, J. Short-term changes in the spatial distribution of microorganisms in soil aggregates as affected by glucose addition. Biol. Fertil. Soils 2001, 34, 349–356. [Google Scholar] [CrossRef]
  65. Lennon, J.T.; Jones, S.E. Microbial Seed Banks: The Ecological and Evolutionary Implications of Dormancy. Nat. Rev. Microbiol. 2011, 9, 119–130. [Google Scholar] [CrossRef]
  66. Maestre, F.T.; Delgado-Baquerizo, M.; Jeffries, T.C.; Eldridge, D.J.; Ochoa, V.; Gozalo, B.; Quero, J.L.; García-Gómez, M.; Gallardo, A.; Ulrich, W.; et al. Increasing Aridity Reduces Soil Microbial Diversity and Abundance in Global Drylands. Proc. Natl. Acad. Sci. USA 2015, 112, 15684–15689. [Google Scholar] [CrossRef]
  67. Vargas-Gastélum, L.; Romero-Olivares, A.L.; Escalante, A.E.; Rocha-Olivares, A.; Brizuela, C.; Riquelme, M. Impact of Seasonal Changes on Fungal Diversity of a Semi-Arid Ecosystem Revealed by 454 Pyrosequencing. FEMS Microbiol. Ecol. 2015, 91, fiv044. [Google Scholar] [CrossRef]
  68. Wang, Z.; Liu, L.; Chen, Q.; Wen, X.; Liao, Y. Conservation Tillage Increases Soil Bacterial Diversity in the Dryland of Northern China. Agron. Sustain. Dev. 2016, 36, 28. [Google Scholar] [CrossRef]
  69. Joergensen, R.; Wichern, F. Quantitative Assessment of the Fungal Contribution to Microbial Tissue in Soil. Soil Biol. Biochem. 2008, 40, 2977–2991. [Google Scholar] [CrossRef]
  70. Kaisermann, A.; Maron, P.A.; Beaumelle, L.; Lata, J.C. Fungal Communities Are More Sensitive Indicators to Non-Extreme Soil Moisture Variations than Bacterial Communities. Appl. Soil Ecol. 2015, 86, 158–164. [Google Scholar] [CrossRef]
  71. Allison, S.D.; Treseder, K.K. Warming and Drying Suppress Microbial Activity and Carbon Cycling in Boreal Forest Soils: Warming Suppresses Microbial Activity. Glob. Chang. Biol. 2008, 14, 2898–2909. [Google Scholar] [CrossRef]
  72. Li, X.; Sarah, P. Enzyme Activities along a Climatic Transect in the Judean Desert. CATENA 2003, 53, 349–363. [Google Scholar] [CrossRef]
  73. Williams, M.A.; Rice, C.W. Seven Years of Enhanced Water Availability Influences the Physiological, Structural, and Functional Attributes of a Soil Microbial Community. Appl. Soil Ecol. 2007, 35, 535–545. [Google Scholar] [CrossRef]
  74. Nannipieri, P.; Giagnoni, L.; Landi, L.; Renella, G. Role of Phosphatase Enzymes in Soil. In Phosphorus in Action; Bünemann, E., Oberson, A., Frossard, E., Eds.; Soil Biology; Springer: Berlin/Heidelberg, Germany, 2011; Volume 26, pp. 215–243. ISBN 978-3-642-15270-2. [Google Scholar]
  75. Dodor, D.E.; Tabatabai, M.A. Effect of Cropping Systems on Phosphatases in Soils. Z. Pflanzenernähr. Bodenk. 2003, 166, 7–13. [Google Scholar] [CrossRef]
  76. Pukalchik, M.; Mercl, F.; Terekhova, V.; Tlustoš, P. Biochar, Wood Ash and Humic Substances Mitigating Trace Elements Stress in Contaminated Sandy Loam Soil: Evidence from an Integrative Approach. Chemosphere 2018, 203, 228–238. [Google Scholar] [CrossRef]
  77. Song, F.; Han, X.; Zhu, X.; Herbert, S.J. Response to Water Stress of Soil Enzymes and Root Exudates from Drought and Non-Drought Tolerant Corn Hybrids at Different Growth Stages. Can. J. Soil. Sci. 2012, 92, 501–507. [Google Scholar] [CrossRef]
  78. Huang, W.; Liu, J.; Zhou, G.; Zhang, D.; Deng, Q. Effects of Precipitation on Soil Acid Phosphatase Activity in Three Successional Forests in Southern China. Biogeosciences 2011, 8, 1901–1910. [Google Scholar] [CrossRef]
  79. Suriyagoda, L.D.B.; Ryan, M.H.; Renton, M.; Lambers, H. Plant Responses to Limited Moisture and Phosphorus Availability. In Advances in Agronomy; Elsevier: Amsterdam, The Netherlands, 2014; Volume 124, pp. 143–200. ISBN 978-0-12-800138-7. [Google Scholar]
  80. Menge, D.N.L.; Field, C.B. Simulated Global Changes Alter Phosphorus Demand in Annual Grassland. Glob. Chang. Biol. 2007, 13, 2582–2591. [Google Scholar] [CrossRef]
  81. Piotrowska-Długosz, A.; Charzyński, P. The Impact of the Soil Sealing Degree on Microbial Biomass, Enzymatic Activity, and Physicochemical Properties in the Ekranic Technosols of Toruń (Poland). J. Soils Sediments 2015, 15, 47–59. [Google Scholar] [CrossRef]
  82. Ng, E.-L.; Patti, A.F.; Rose, M.T.; Schefe, C.R.; Smernik, R.J.; Cavagnaro, T.R. Do Organic Inputs Alter Resistance and Resilience of Soil Microbial Community to Drying? Soil Biol. Biochem. 2015, 81, 58–66. [Google Scholar] [CrossRef]
  83. Burns, R.G.; DeForest, J.L.; Marxsen, J.; Sinsabaugh, R.L.; Stromberger, M.E.; Wallenstein, M.D.; Weintraub, M.N.; Zoppini, A. Soil Enzymes in a Changing Environment: Current Knowledge and Future Directions. Soil Biol. Biochem. 2013, 58, 216–234. [Google Scholar] [CrossRef]
  84. Ros, M.; Goberna, M.; Moreno, J.L.; Hernandez, T.; García, C.; Insam, H.; Pascual, J.A. Molecular and Physiological Bacterial Diversity of a Semi-Arid Soil Contaminated with Different Levels of Formulated Atrazine. Appl. Soil Ecol. 2006, 34, 93–102. [Google Scholar] [CrossRef]
  85. Chakraborty, A.; Chakrabarti, K.; Chakraborty, A.; Ghosh, S. Effect of Long-Term Fertilizers and Manure Application on Microbial Biomass and Microbial Activity of a Tropical Agricultural Soil. Biol. Fertil. Soils 2011, 47, 227–233. [Google Scholar] [CrossRef]
  86. Braun, B.; Böckelmann, U.; Grohmann, E.; Szewzyk, U. Bacterial Soil Communities Affected by Water-Repellency. Geoderma 2010, 158, 343–351. [Google Scholar] [CrossRef]
  87. Misson, L.; Rocheteau, A.; Rambal, S.; Ourcival, J.-M.; Limousin, J.-M.; Rodriguez, R. Functional Changes in the Control of Carbon Fluxes after 3 Years of Increased Drought in a Mediterranean Evergreen Forest? Glob. Chang. Biol. 2009, 16, 2461–2475. [Google Scholar] [CrossRef]
Figure 1. Four locations of the research sites are at Gniewkowo (G), Lulkowo (L), Wielka Nieszawka (N) and Suchatówka (S).
Agronomy 13 01417 g001
Figure 2. Soil moisture content under prolonged drought conditions in samples collected from Gniewkowo (G), Lulkowo (L), Wielka Nieszawka (N) and Suchatówka (S).
Agronomy 13 01417 g002
Figure 3. Changes in number of microorganisms under prolonged drought conditions in four agricultural soil samples (Gniewkowo (G), Lulkowo (L), Wielka Nieszawka (N) and Suchatówka (S)). (A) Bacteria; (B) Actinomycetes; (C) Fungi. All analyses were performed in five replicates, and the data are presented as mean ± SD. All statistical analyses were carried out using repeated-measures ANOVA and Tukey test at p < 0.001 (* p < 0.05; ** p < 0.01). Mean values described with the same letters (e.g., aa, etc.) are not significantly different at p < 0.001. Error bars indicate standard errors of the mean (n = 5).
Agronomy 13 01417 g003
Figure 4. Enzyme activities under prolonged drought conditions in four types of agricultural soil samples (Gniewkowo (G), Lulkowo (L), Wielka Nieszawka (N) and Suchatówka (S)). (A) Acid phosphatase (ACP); (B) Alkaline phosphatase (ALP); (C) Dehydrogenase (DH); (D) Urease (UR) enzyme activities. All analyses were performed in five replicates, and the data are presented as mean ± SD. All statistical analyses were carried out using repeated-measures ANOVA and a Tukey test at p <0.001 (* p < 0.05; ** p < 0.01). Mean values described with same letters (e.g., aa, etc.) are not significantly different at p < 0.001. Error bars indicate standard errors of the mean (n = 5).
Agronomy 13 01417 g004aAgronomy 13 01417 g004b
Figure 5. Principal component analysis (PCA) diagram indicating correlations between soil physicochemical and biological parameters in four soil samples at 0, 1, 2, 4 and 8 weeks. G, Gniewkowo; L, Lulkowo; N, Wielka Nieszawka; S, Suchatówka; ACP, Acid phosphatase; ALP, Alkaline phosphatase; ACT, Actinomycetes; DH, Dehydrogenase; UR, Urease; G0 (G at week 0); G1 (G at week 1); G2 (G at week 2); G4 (G at week 4); G8 (G at week 8) (likewise for L, N and S site).
Agronomy 13 01417 g005
Figure 6. Heat map for community-level physiological profiles (CLPPs) in four types of agricultural soil samples (Gniewkowo (G), Lulkowo (L), Wielka Nieszawka (N) and Suchatówka (S)).
Agronomy 13 01417 g006
Figure 7. Absorbance values of Biolog Ecoplates in four types of agricultural soil samples (Gniewkowo (G), Lulkowo (L), Wielka Nieszawka (N) and Suchatówka (S)) with carbon substrate utilization efficiency. (A) Average rate of the average well color development (AWCD) over the incubation time (ΔAWCD/weeks); Metabolism of (B) Carbohydrates; (C) Carboxylic and acetic acids; (D) Amino acids; (E) Polymers; (F) Amines.
Agronomy 13 01417 g007
Table 1. Soil chemical parameters. T0, collection date, T8; 8 weeks of drought.
LocationAbbreviationTotal Organic Carbon Content (%) (Mean ± SD)Total Nitrogen Content (%) (Mean ± SD)pH (Mean ± SD)
T0T8T0T8T0T8
1. GniewkowoG0.97 ± 0.0100.89 ± 0.010 b0.112 ± 0.0020.110 ± 0.0026.96 ± 0.0067.49 ± 0.01 c
2. LulkowoL0.77 ± 0.0060.80 ± 0.0120.092 ± 0.0010.087 ± 0.002 a6.52 ± 0.0126.70 ± 0.006 c
3. Wielka NieszawkaN1.10 ± 0.0150.99 ± 0.5110.140 ± 0.0010.135 ± 0.001 a6.69 ± 0.016.66 ± 0.01
4. SuchatówkaS0.62 ± 0.0100.60 ± 0.0150.057 ± 0.0010.052 ± 0.001 a6.17 ± 0.0155.77 ± 0.012 b
a (p < 0.05), b (p < 0.01), c (p < 0.001); standard deviation (SD).
Table 2. Relative abundance of bacterial and fungal taxa identified by 16S rRNA and ITS amplicon sequencing. G, Gniewkowo; L, Lulkowo; N, Wielka Nieszawka; S, Suchatówka; 0; collection date; 8, 8 weeks of drought.
Taxon Relative Abundance (%)
G0G8L0L8N0N8S0S8
A. Bacterial PhylaPseudomonadota57.6544.9163.8446.7059.0852.3860.8348.37
Actinomycetota38.3853.3632.8351.0937.5745.6536.9649.40
Bacteroidota3.140.612.470.972.150.931.141.10
Bacillota0.831.130.851.241.211.051.061.12
GeneraBradyrhizobium26.7028.1629.9333.6148.5146.8736.9724.63
Streptomyces17.3319.3812.1820.6612.2516.5612.1417.42
Sphingomonas16.063.8219.813.689.734.1116.625.45
Nocardioides8.5313.668.5911.245.997.429.2612.17
Mycobacterium6.228.227.168.916.738.014.4215.46
Micromonospora4.447.072.724.283.033.753.584.56
Lysobacter6.672.187.481.745.011.745.382.58
Solirubrobacter3.114.962.824.383.184.072.693.44
Actinoplanes4.144.162.844.522.122.653.304.73
Geodermatophilus3.995.942.982.981.782.063.163.57
Sorangium2.802.443.494.011.672.772.476.00
B. Fungal PhylaAscomycota83.4882.5883.4683.2283.2785.2381.5483.76
Basidiomycota10.2512.5211.3410.9110.8610.1113.5111.64
Mucoromycota3.572.822.793.953.312.182.112.86
Apicomplexa2.702.082.411.922.562.492.841.73
GeneraFusarium22.8814.4917.2829.1521.3926.0719.7940.10
Aspergillus15.3516.0319.5713.7516.4315.1216.2612.66
Colletotrichum5.998.615.766.167.365.768.395.02
Trichoderma3.884.855.195.0214.0912.493.372.40
Penicillium2.808.272.283.824.684.914.562.34
Exophiala4.734.852.686.672.743.993.653.14
Ustilago1.541.945.314.563.141.088.165.36
Pseudogymnoascus4.286.853.311.604.515.083.021.03
Verticillium3.422.6211.873.022.051.432.851.94
Chaetomium7.242.681.601.311.652.002.801.43
Lobosporangium3.312.972.171.832.852.401.771.43
Marssonina2.173.542.341.882.282.002.910.80
Metarhizium1.253.021.481.771.541.715.191.48
Anthracocystis2.623.312.171.772.111.431.481.71
Thermothelomyces2.342.621.881.431.141.252.511.71
Gaeumannomyces1.711.831.771.651.081.481.833.08
Rhizophagus1.940.971.834.281.311.031.541.43
Phycomyces1.432.341.832.112.341.311.431.43
Tilletiopsis1.772.341.601.481.882.002.050.97
Bipolaris1.831.141.482.400.911.312.052.80
Purpureocillium4.452.000.630.971.771.881.480.74
Pyricularia2.051.941.541.481.601.652.341.14
Alternaria1.030.804.451.881.142.620.575.88
Table 3. Drought treatment effects on bacterial and fungal α-diversity measured as Shannon diversity indices between sites (Gniewkowo (G), Lulkowo (L), Wielka Nieszawka (N) and Suchatówka (S)) at sampling day (0) and 8th week (8)).
Sites
G0G8L0L8N0N8S0S8
Bacteria2.122.092.051.99 b1.771.781.972.14 c
Fungi2.722.81 c2.682.60 c2.622.57 a2.732.33 c
a (p < 0.05), b (p < 0.01), c (p < 0.001).
Disclaimer/Publisher’s Note: The statements, opinions and data contained in all publications are solely those of the individual author(s) and contributor(s) and not of MDPI and/or the editor(s). MDPI and/or the editor(s) disclaim responsibility for any injury to people or property resulting from any ideas, methods, instructions or products referred to in the content.

