Article

Continuous Cropping Alters Soil Hydraulic and Physicochemical Properties in the Karst Region of Southwestern China

1
College of Hydrology and Water Resources, Hohai University, Nanjing 210024, China
2
The National Key Laboratory of Water Disaster Prevention, Hohai University, Nanjing 210024, China
3
China Meteorological Administration Hydro-Meteorology Key Laboratory, Hohai University, Nanjing 210024, China
4
Yangtze Institute for Conservation and Development, Hohai University, Nanjing 210024, China
5
Key Laboratory of Water Big Data Technology of Ministry of Water Resources, Hohai University, Nanjing 210024, China
6
College of Environment, Hohai University, Nanjing 210024, China
7
Department of Bioresource Engineering, McGill University, Montreal, QC H9X 3V9, Canada
8
College of Agricultural Science and Engineering, Hohai University, Nanjing 211100, China
9
Institute of Soil and Environmental Sciences, University of Agriculture, Faisalabad 38000, Pakistan
*
Authors to whom correspondence should be addressed.
Agronomy 2023, 13(5), 1416; https://doi.org/10.3390/agronomy13051416
Submission received: 15 April 2023 / Revised: 12 May 2023 / Accepted: 17 May 2023 / Published: 20 May 2023
(This article belongs to the Special Issue Applied Research and Extension in Agronomic Soil Fertility Series II)

Abstract

:
Continuous cropping causes soil degradation and decreases crop yield in the karst region of southwestern China. However, the relationship between continuous cropping systems and soil hydraulic and physicochemical properties remains incompletely elucidated. In this study, we performed a comparative investigation on the soil physicochemical properties and soil-water-characteristic-curve-derived parameters from sites subjected to 3, 5, or 7 years of continuous cropping (CC3, CC5, and CC7) and cropping rotation (CC0). Soil organic matter content, clay content, and pH were significantly greater in soils under CC0 and short-term cropping (CC3) than in soils under long-term cropping (CC5 and CC7). This finding illustrated that continuous cropping reduced soil organic matter content, clay content, and pH. Across all continuous cropping durations, soil water holding capacity at 40~60 cm was greater than the 20~40 cm and 0~20 cm layers. The significantly greater soil water characteristics (except saturated moisture) in CC0 and CC3 soils than in CC5 or CC7 soils at all soil depths demonstrated that soil water characteristics deteriorated with the prolongation of cropping duration. The same soil water characteristics were positively correlated with soil organic matter content, clay content, and pH. These correlations, when viewed within the context of continuous cropping, can inform the development of more sustainable cropping systems in similar karst regions.

1. Introduction

Continuous cropping regimes can reduce soil water holding capacity, degrade soil hydraulic and physicochemical properties (soil water characteristics and soil physicochemical properties), and adversely affect crop yield and quality [1]. Nonetheless, such crop production regimes remain common in numerous agricultural production systems [2]. The Guizhou Plateau is one of the world’s three major karst concentrated distribution areas [3] and harbors the production of grain crops (wheat, rice, and maize) and plants of economic value (tobacco [Nicotiana tabacum L.] and cotton). Agricultural production on the Guizhou Plateau, particularly the production of economically valuable plants, is a key component of local and national agriculture production. Among provinces in China, the Guizhou Province is the second largest producer of tobacco, which has become an industrial mainstay, and plays a vital role in economic development and agricultural production [4]. On the Guizhou Plateau, the practice of continuous cropping has become common due to the limitations of cultivated land area and climate and its resulting economic benefits. However, long-term continuous cropping has inflicted serious damage to agroecology, proving to be a main factor restricting agricultural production and degrading the human living environment in the region [5].
Soil water affects a wide variety of processes, such as hydrological and agricultural processes, in the soil–plant–atmosphere continuum over a wide range of spatial and temporal scales [4,6]. In large karst landforms, perennial continuous cropping has resulted in poor soil water holding capacities, causing substantial damage to crop production [7]. As a result of the close relationship between plant growth and soil water dynamics, the focus of studies on soil water in typical continuous cropping systems has shifted from solely focusing on soil water to also examining water movement and hydraulic characteristics, particularly the soil water retention characteristics [8]. Soil water holding capacity, field capacity, wilting coefficient, and soil (un)available water are the most important soil hydraulic properties. However, these hydraulic properties are affected by soil physicochemical properties (e.g., soil organic matter, and clay contents) [7]. Specifically, such that increased soil organic matter and clay content can increase soil productivity, which in turn improves crop yield and quality, these soil properties are the premise and basis of agricultural irrigation and drainage management [9]. Soil hydraulic and physicochemical properties are sensitive to continuous cropping, their changes under different land-use types need to be evaluated. In the present case, the relationships between these properties and continuous cropping in this typical karst region of southwestern China were investigated.
Among soil water characteristics, soil water holding capacity is the capacity to capture and store precipitation or irrigation water, and soil water availability is the water that can be taken up by plant roots with equal ease [10]. Information on soil water characteristics is crucial for solving the numerous soil water management problems related to agricultural and environmental issues [11]. The soil water characteristic curve (SWCC) is frequently used to elucidate soil water dynamics and hydraulic properties. The SWCC represents the relationship between soil water content (θ) and suction or pore water pressure (ψ) [12]. It expresses the functional relationship between soil matric potential and its corresponding gravimetric or volumetric water content. The most widely used SWCC models include the Brooks–Corey [13], Gardner [14], Van Genuchten [15], and Lognormal distribution (LND) [16] models. These models’ parameters must be estimated based on experimental data. The models used to generate SWCCs can be divided into direct fitting [14,15] and indirect calculation methods [8]. Among direct fitting models, the Gardner model has been shown to provide good results for most soils in the mountainous karst areas of the Guizhou Plateau [7].
Although many previous studies have been conducted on soil water characteristics, the changes in soil hydraulic and physicochemical properties under continuous cropping in karst areas have yet to be elucidated. On the Guizhou Plateau, continuous cropping systems have caused severe changes, such as reductions in soil organic matter and pH [17] as well as in soil clay content and soil water holding capacity [7], in agroecosystem soil environment and degraded crop yield and quality. Moreover, continuous cropping systems have decreased tobacco yield and quality [4]. An understanding of how soil hydraulic and physicochemical properties evolve under continuous cropping will provide a basis for developing scientifically sound agricultural management practices for the Guizhou Plateau. In our present work, four typical continuous cropping durations were selected to evaluate the effects of different cropping systems on soil properties in a long-term experimental field on the Guizhou Plateau, China. The experimental field was devoted to producing plants with economic value—in this instance tobacco. The soil physicochemical properties, soil water characteristic parameters, and soil water availability at different sites and depths were measured or calculated, and SWCCs were acquired by using a pressure plate apparatus. The purposes of this study were to: (i) reveal the changes in soil hydraulic and physicochemical properties after the implementation of typical continuous cropping production systems for different durations; (ii) compare the differences and similarities in soil water holding capacity, soil water characteristic parameters, and soil water availability between continuous cropping systems with different durations implementation; and (iii) clarify the relationship among soil water characteristics and soil physicochemical properties in response to continuous cropping.

2. Materials and Methods

2.1. Study Site and Soil Sampling

A long-term experimental field was established at the Institute of Tobacco Science in the Guizhou Province, China (26°45′01″ N, 104°0′47″ E), to investigate the effects of different continuous tobacco cropping or tomato rotation systems on soil properties. The experimental site had an annual average precipitation of 626 mm, and an annual mean temperature of 16 °C. Continuous tobacco cropping systems with durations of 3 years (CC3), 5 years (CC5), 7 years (CC7), and tomato rotation (CC0, i.e., the control), were selected in March 2018. All sampling points were adjacent fields with the same topography and climatic conditions. The sampling sites were divided into four typical continuous cropping durations of 3 years, 5 years, 7 years, and tomato rotation. The planting date of each year was generally the end of April. Undisturbed soil samples were collected by excavating the soil profiles (100 cm [length] × 100 cm [width] × 120 cm [depth]) and using 20 mm tall, 50 mm diameter ring cutters to sample the soil. These undisturbed samples were used in generating an SWCC for each sampling site/depth/replicate. Based on the range of soil depths bearing tobacco roots, samples were collected from three depths, namely, 0~20 cm, 20~40 cm, and 40~60 cm. Soil samples were collected at the same points in plastic ZiplockTM bags to determine soil physicochemical properties, with three replicates per layer at each sampling point.

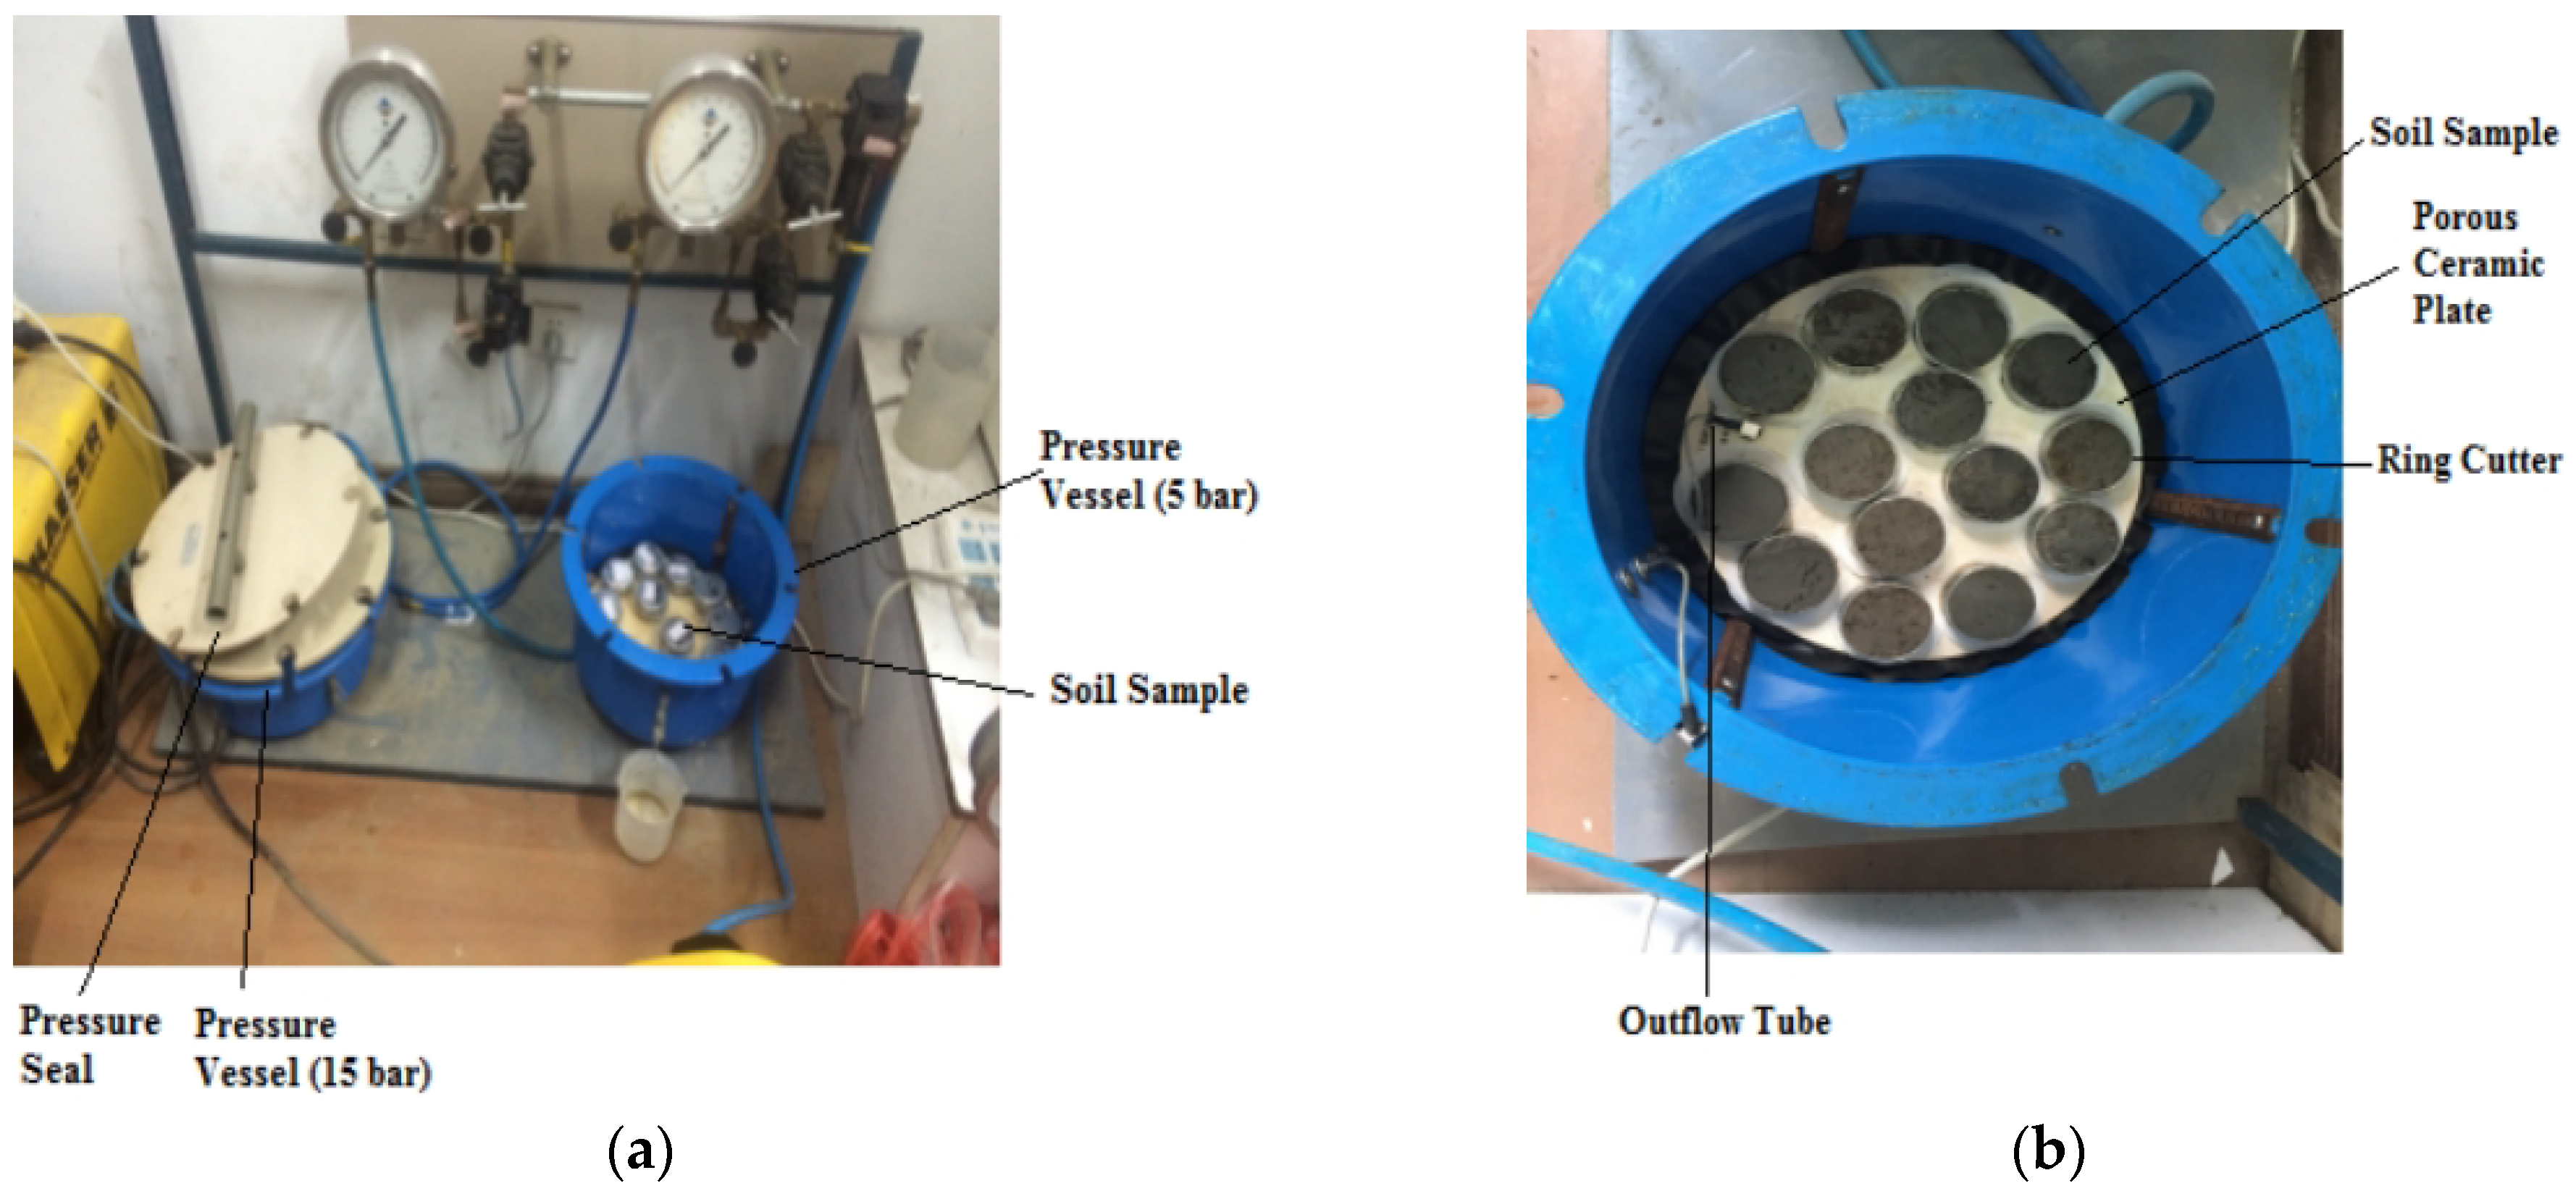
2.2. Determination of Soil Properties

Soil samples were analyzed at the laboratory of Hohai University. Soil clay content was determined by using the hydrometer method [18]. Soil pH was measured by preparing a 1:2.5 soil:water slurry and using a pH electrode. Soil organic matter content was obtained using the potassium dichromate–sulfate acid colorimetric method [19]. SWCCs were acquired by using a pressure plate apparatus (Pressure Vessel 1500, Soil Moisture Equipment Corp., Goleta, CA, USA) in accordance with the method of Yang et al. [7]. Measurements of θ were made at operating pressures of 0, 0.05, 0.1, 0.2, 0.3, 0.5, 1, 3, 5, 10, and 15 (100 kPa) (Figure 1). Ultimately, each soil sample was maintained at 105 °C until it reached a constant mass, then weighed three separate times. To derive the soil’s volumetric water content at each pressure level (saturation to wilting), the mean was calculated.

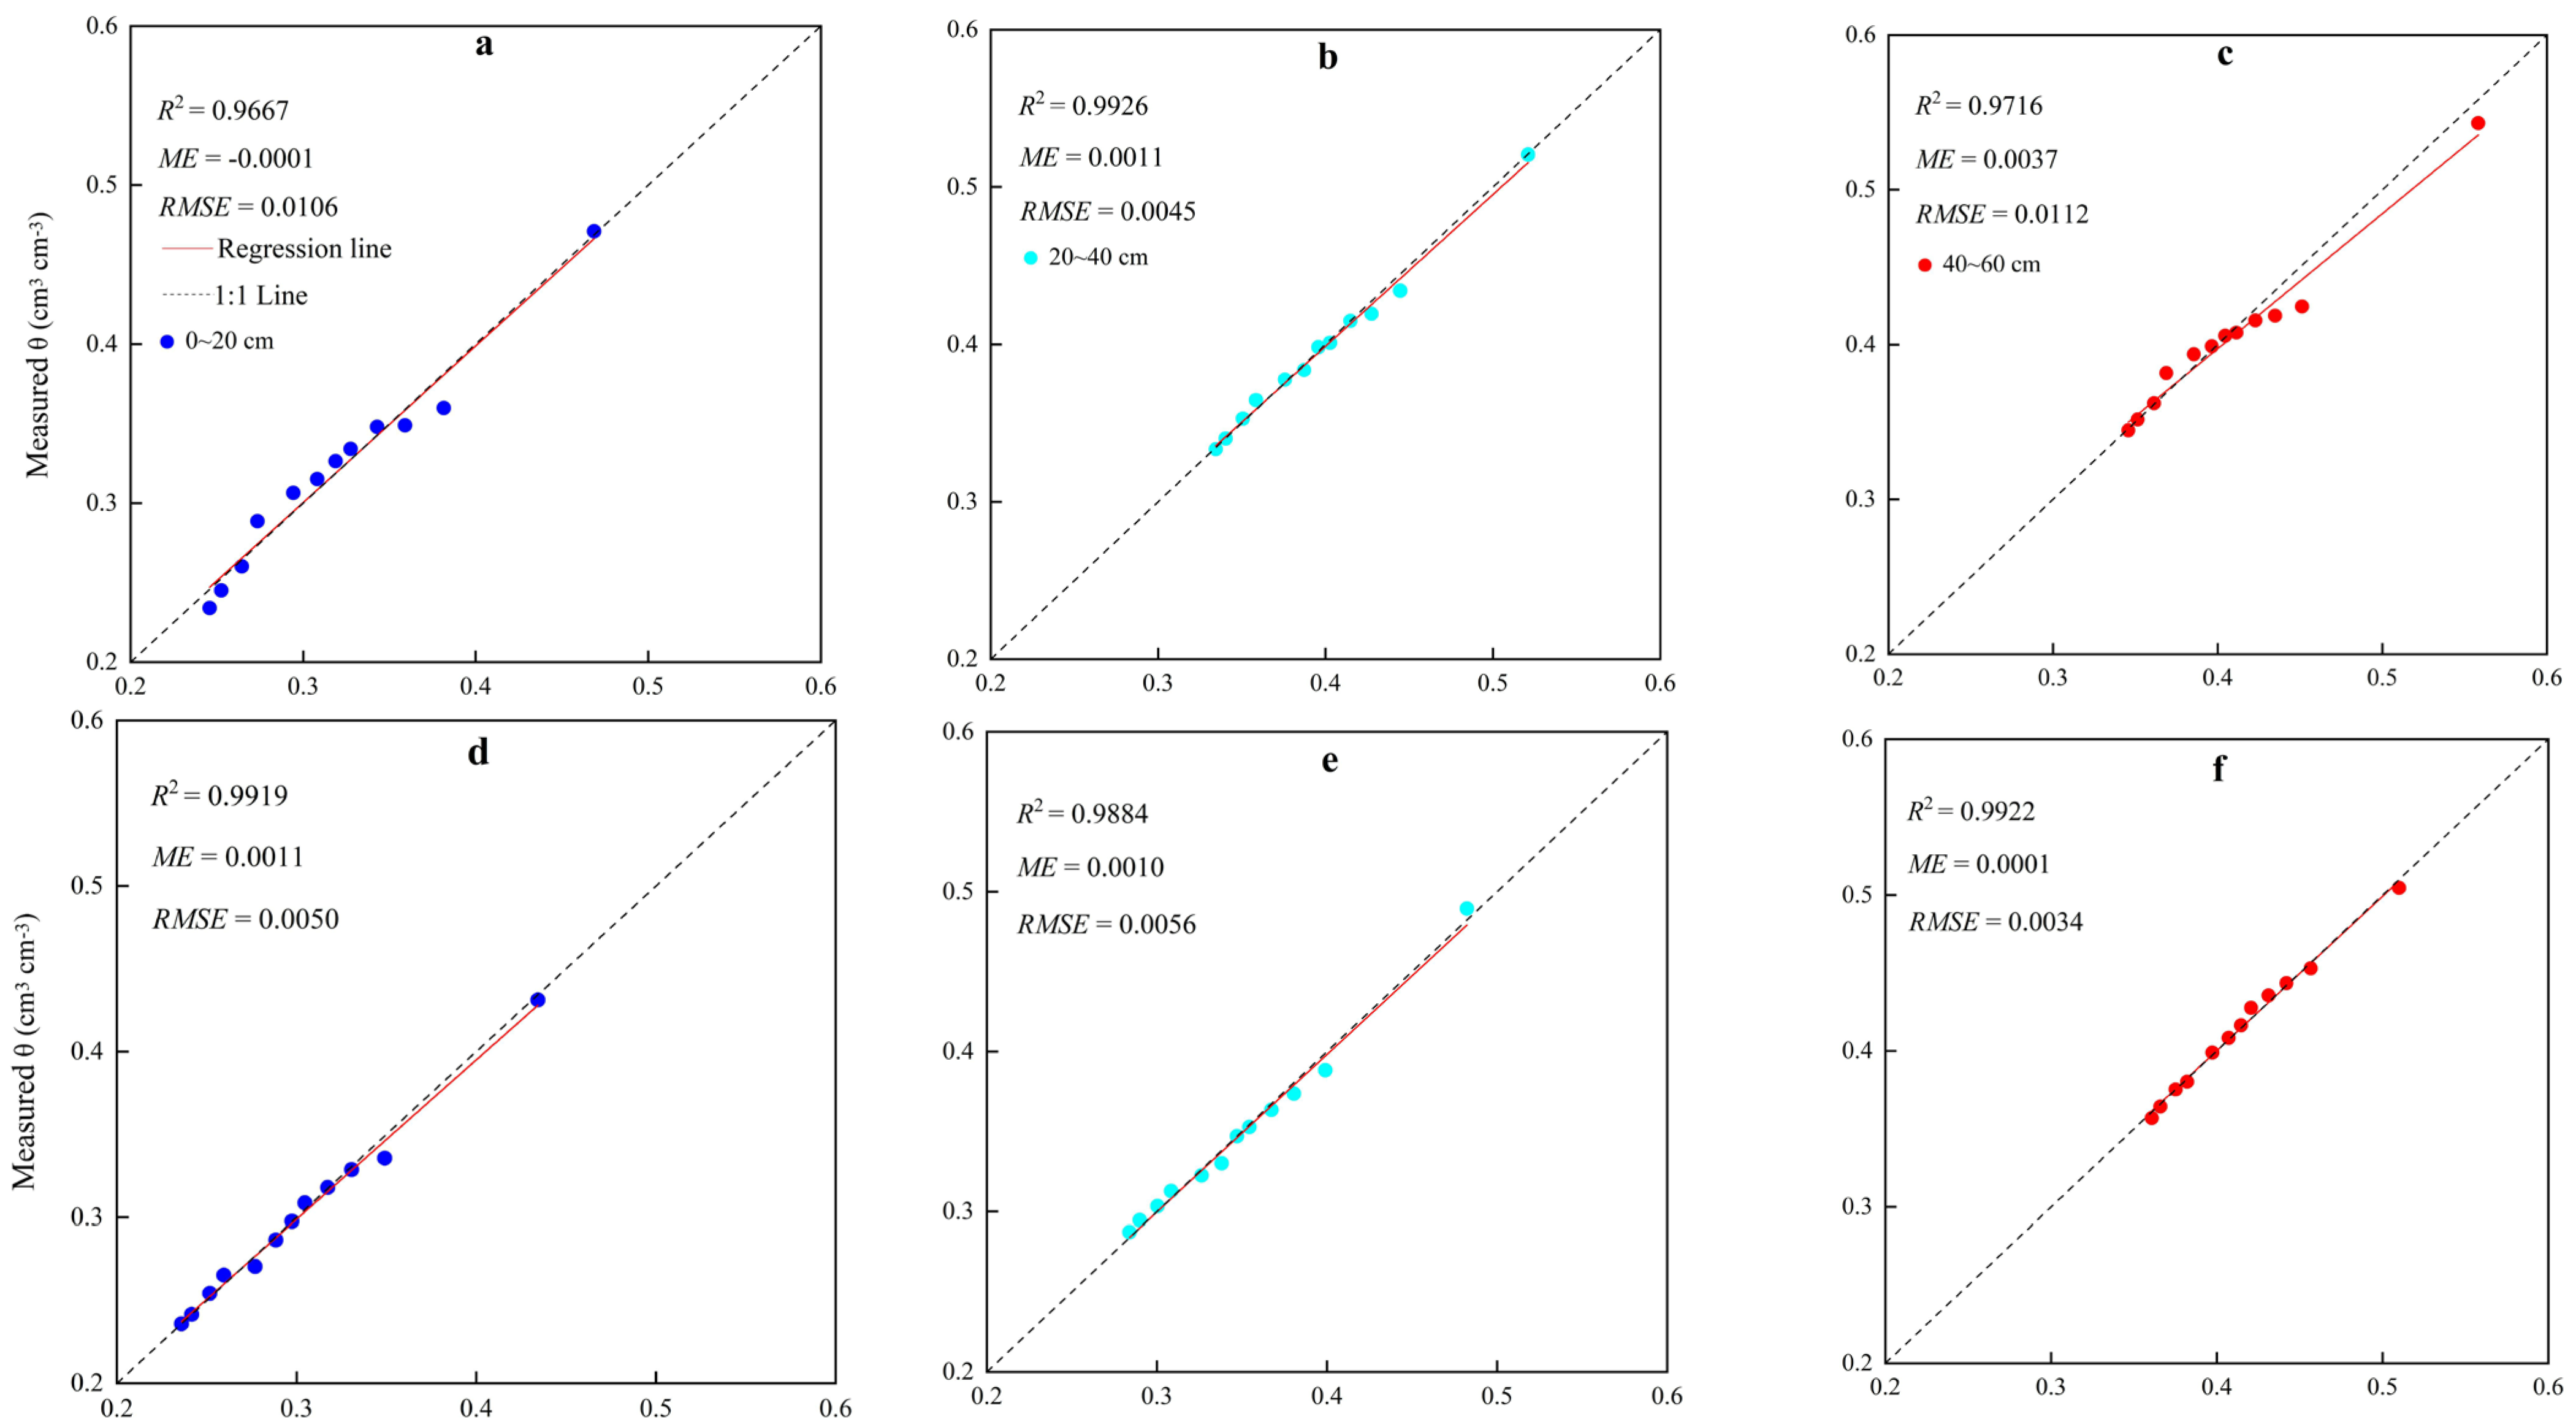
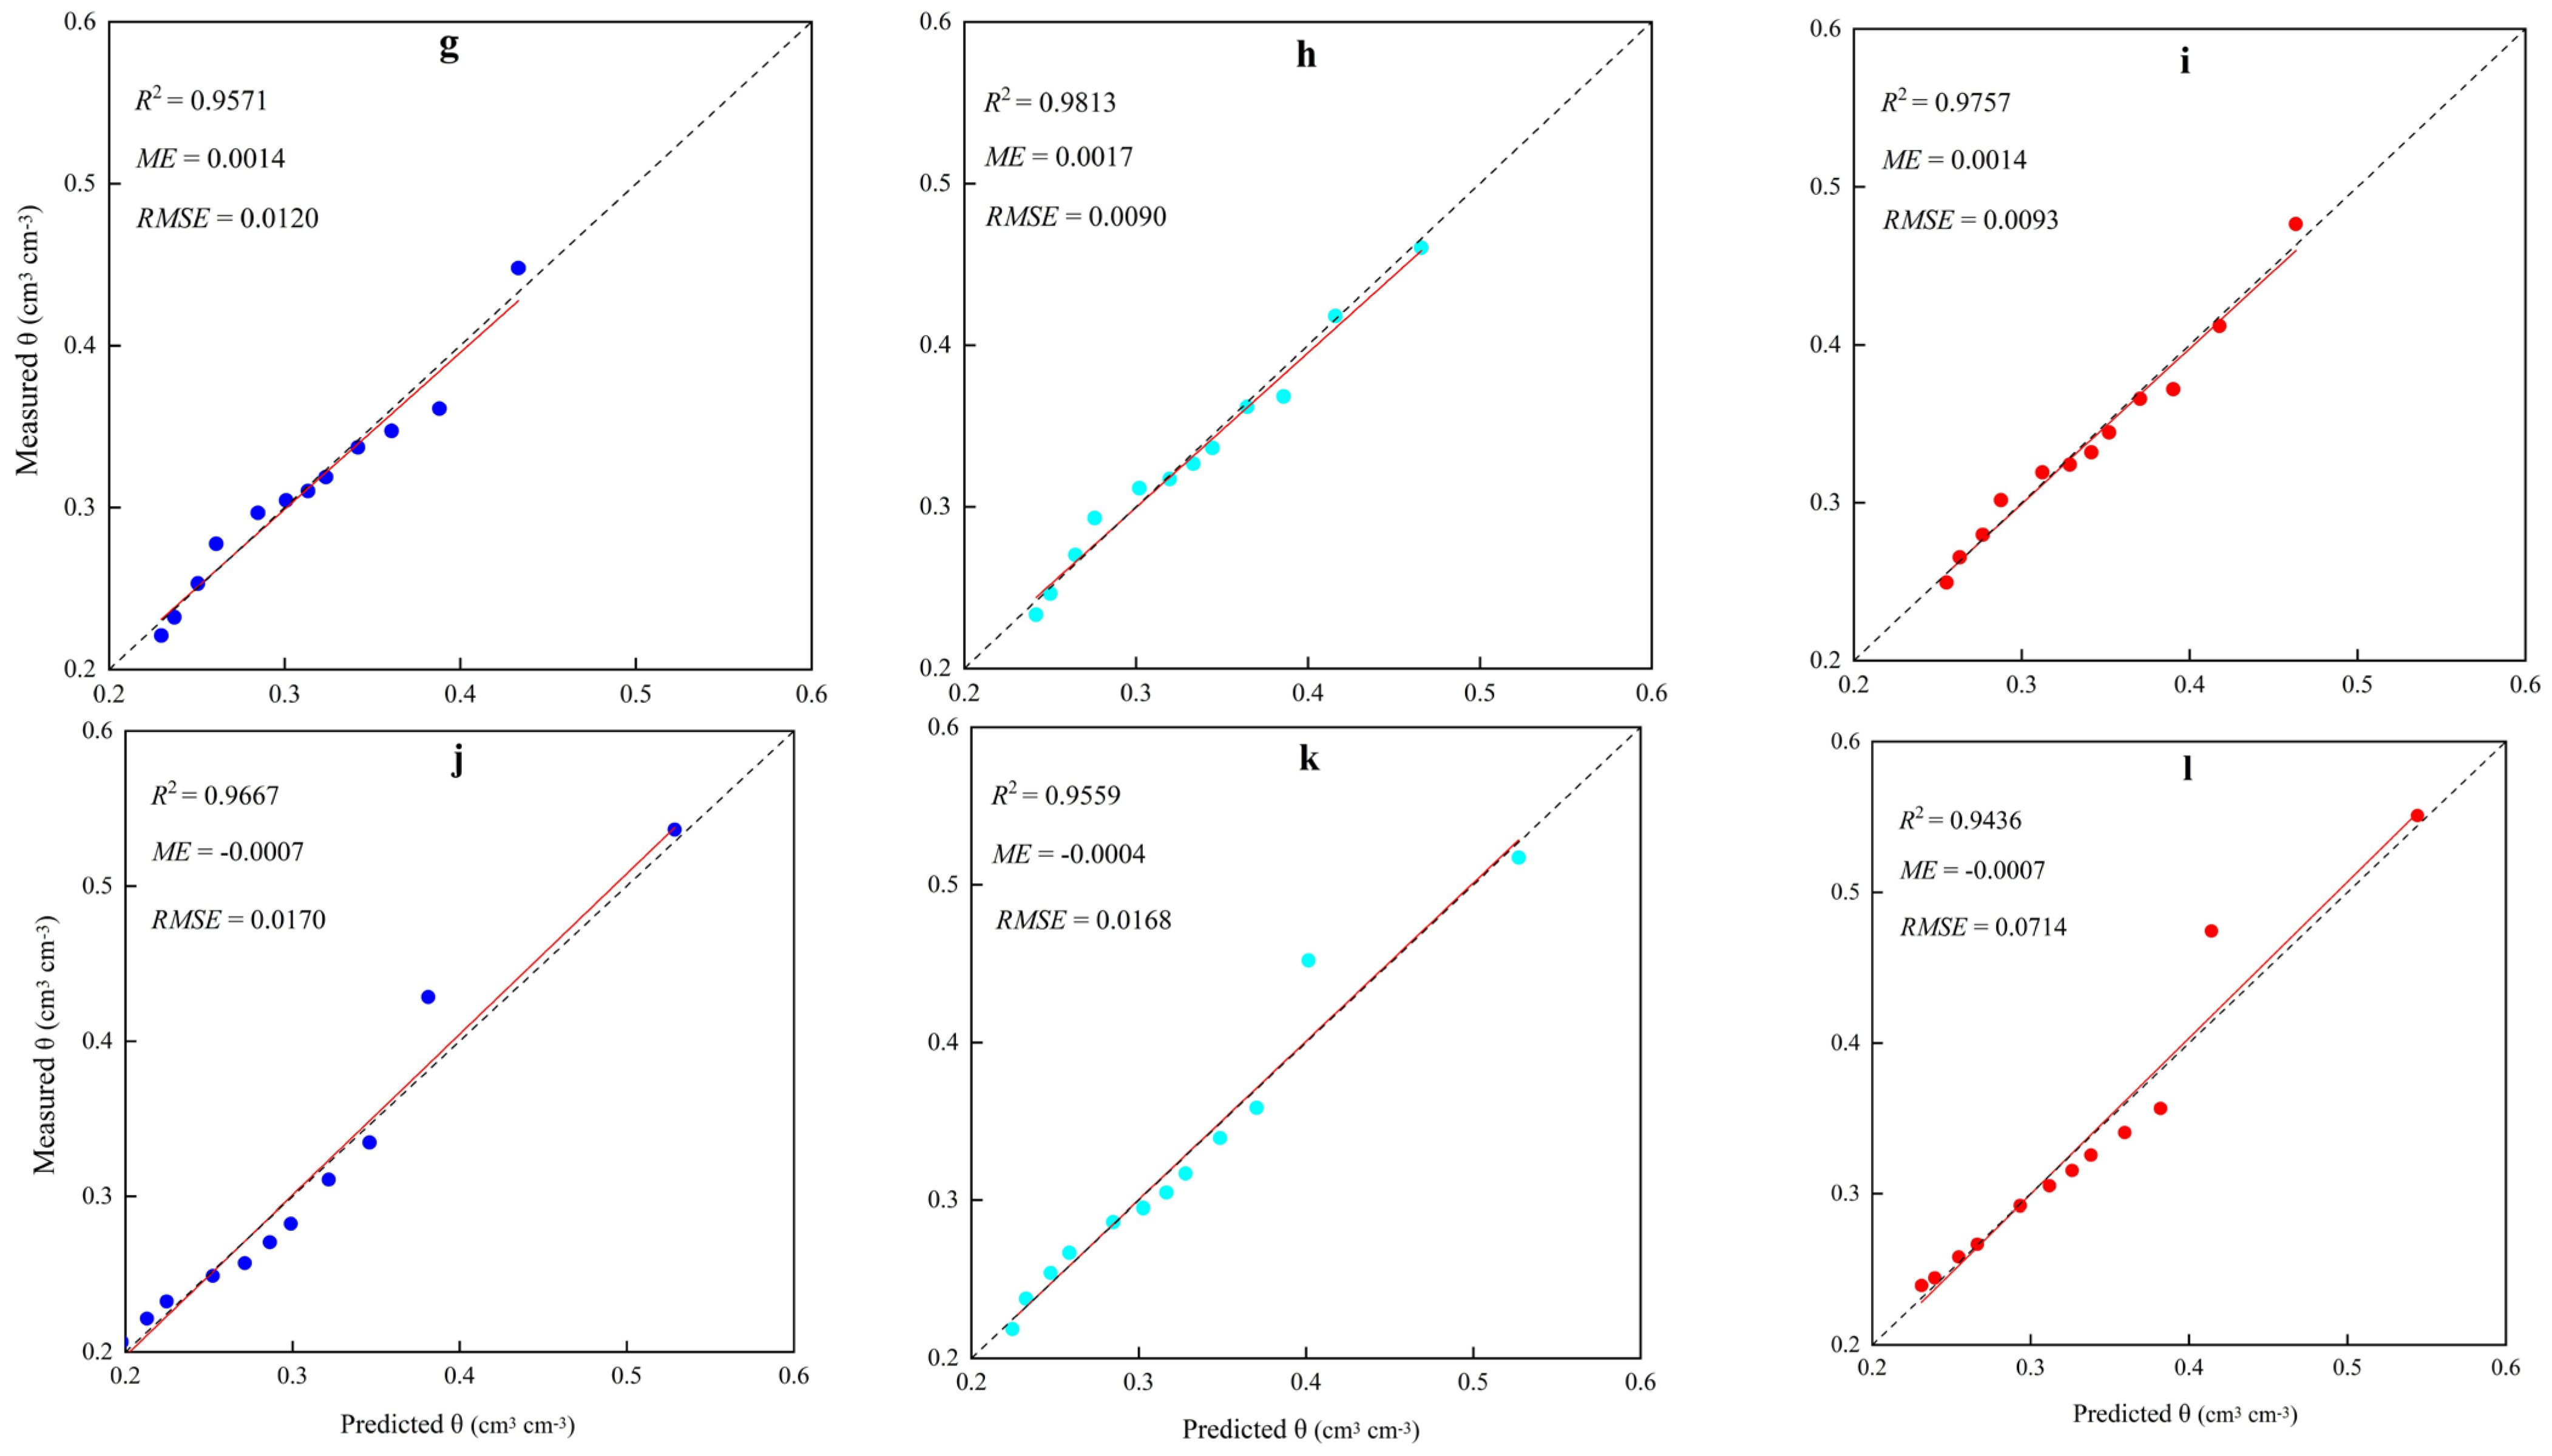
2.3. Fitting of SWCC and Calculating of Soil Water Characteristic Parameters

Plotting θ against soil matrix suction (ψm), a SWCC reflects the internal relationships between the energy and quantity of soil water. The SWCC was fitted by using the Gardner model [14]:
θ = A ψ m B
where θ is the soil water content (%), ψm is the soil matrix suction, and A, B are parameters that denote the shape of the SWCC.
When S = 1 Bar, θ = A, that is, the parameter A in the model is water content when the suction is 1 Bar. The value of A indicates the height of the curve. The higher A is indicative of strong water holding capacity. When the value of A is constant, a larger B value (0 < B < 1), indicates that the curve is close to the ordinate axis, reflecting the degree of change in soil water content when the value changes in soil water potential. A·B is the specific water capacity when the soil suction is 1 Bar. Its value can be used to evaluate the water supply performance or drought tolerance of soil. The high A·B value indicates that the soil has a good water supply or drought resistance, and the B + 1 indicates that the water capacity changes considerably faster than moisture content [7].
The soil water characteristic parameters include moisture at saturation (θsat), field capacity (θfc), capillary fracture (θcp), wilting coefficient (θwc), and hygroscopic coefficient (θhyg). The θsat represents the equilibrium volumetric soil water content at a matric potential of −0 bar [7], while θfc represents the equilibrium volumetric soil water content at a matric potential of −0.3 bar, the θcp was approximately 65% of θfc, the θwc is the volumetric soil water content at a matric potential of −15 bar [20]. The θwc is the soil moisture at which a plant is permanently wilted and θ has reduced to 1.5 to 2.0 times the soil’s θhyg. Soil water availability includes gravity water (GW, calculated as the difference between θsat and θfc), available water (AW, the difference between θfc and θwc), and unavailable water (UAW, water less than θwc) [21,22].
The coefficient of determination (R2), mean error (ME, cm3 cm−3), and root mean square error (RMSE, cm3 cm−3) were employed to assess the models’ performance in predicting the SWCC, the formula is [23].
R M S E = j = 1 m ( P j M j ) 2 m
M E = 1 m j = 1 m ( P j M j )
R 2 = 1 j = 1 m ( P j M j ) 2 j = 1 m ( M j M ¯ ) 2
where Mj is the measured soil water contents, Pj is the predicted soil water contents, i = 1, 2, 3,…, m, M ¯ is the mean of the given range of Mj, and m is the number of observations.

2.4. Statistical Analysis

Statistical analysis for a randomized plot design was carried out using SPSS 17.0, and significant differences were evaluated at p < 0.05. Redundancy analysis (RDA) was employed to analyze the relationships between soil water characteristics and soil physicochemical properties. The regression analysis was normalized for soil physicochemical data.

3. Results

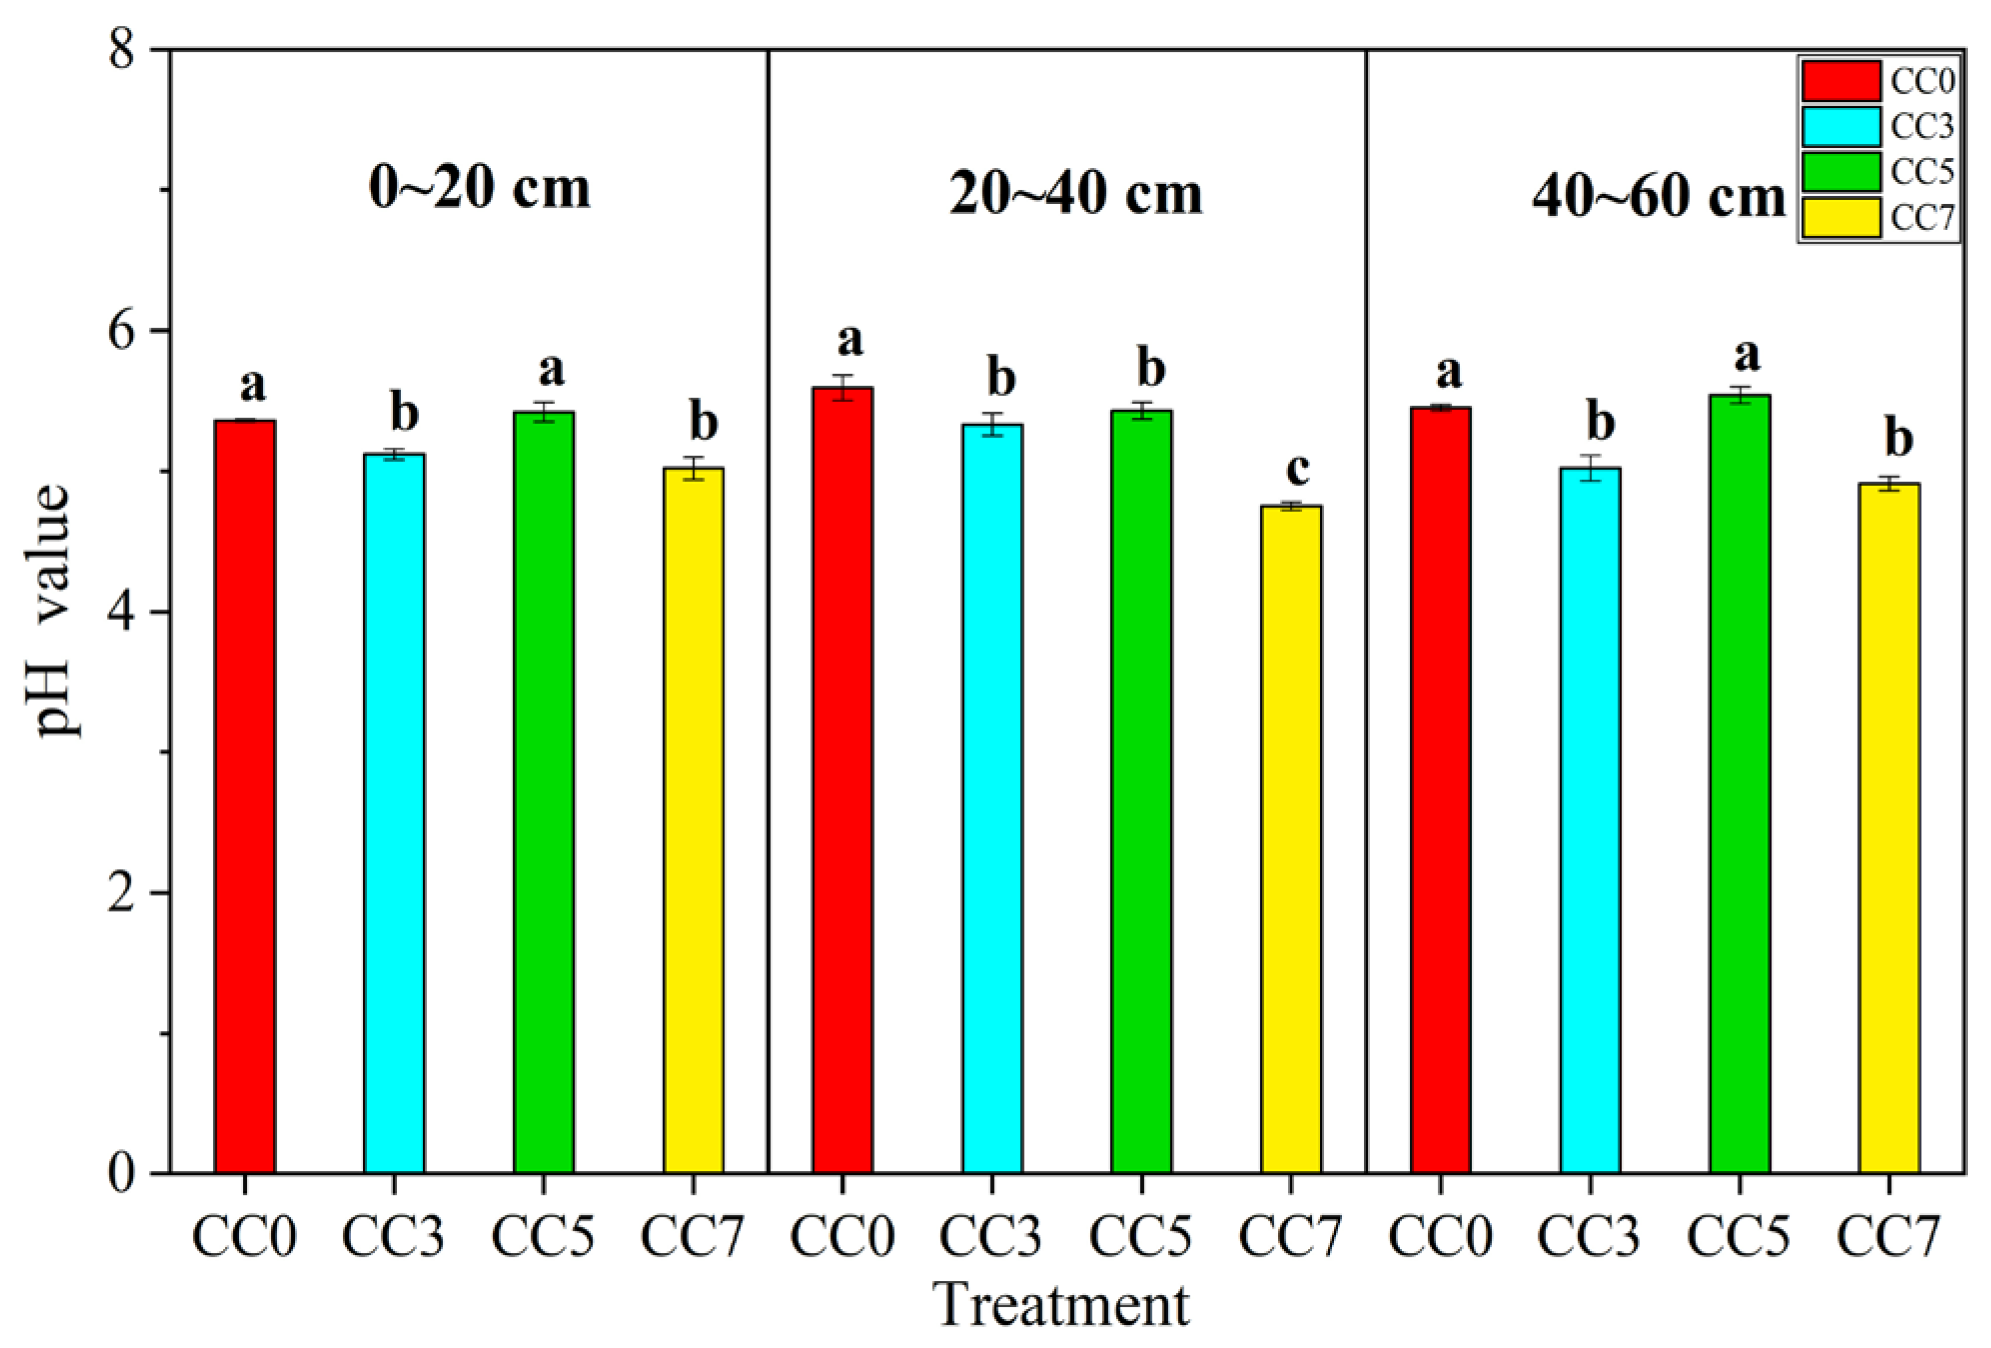
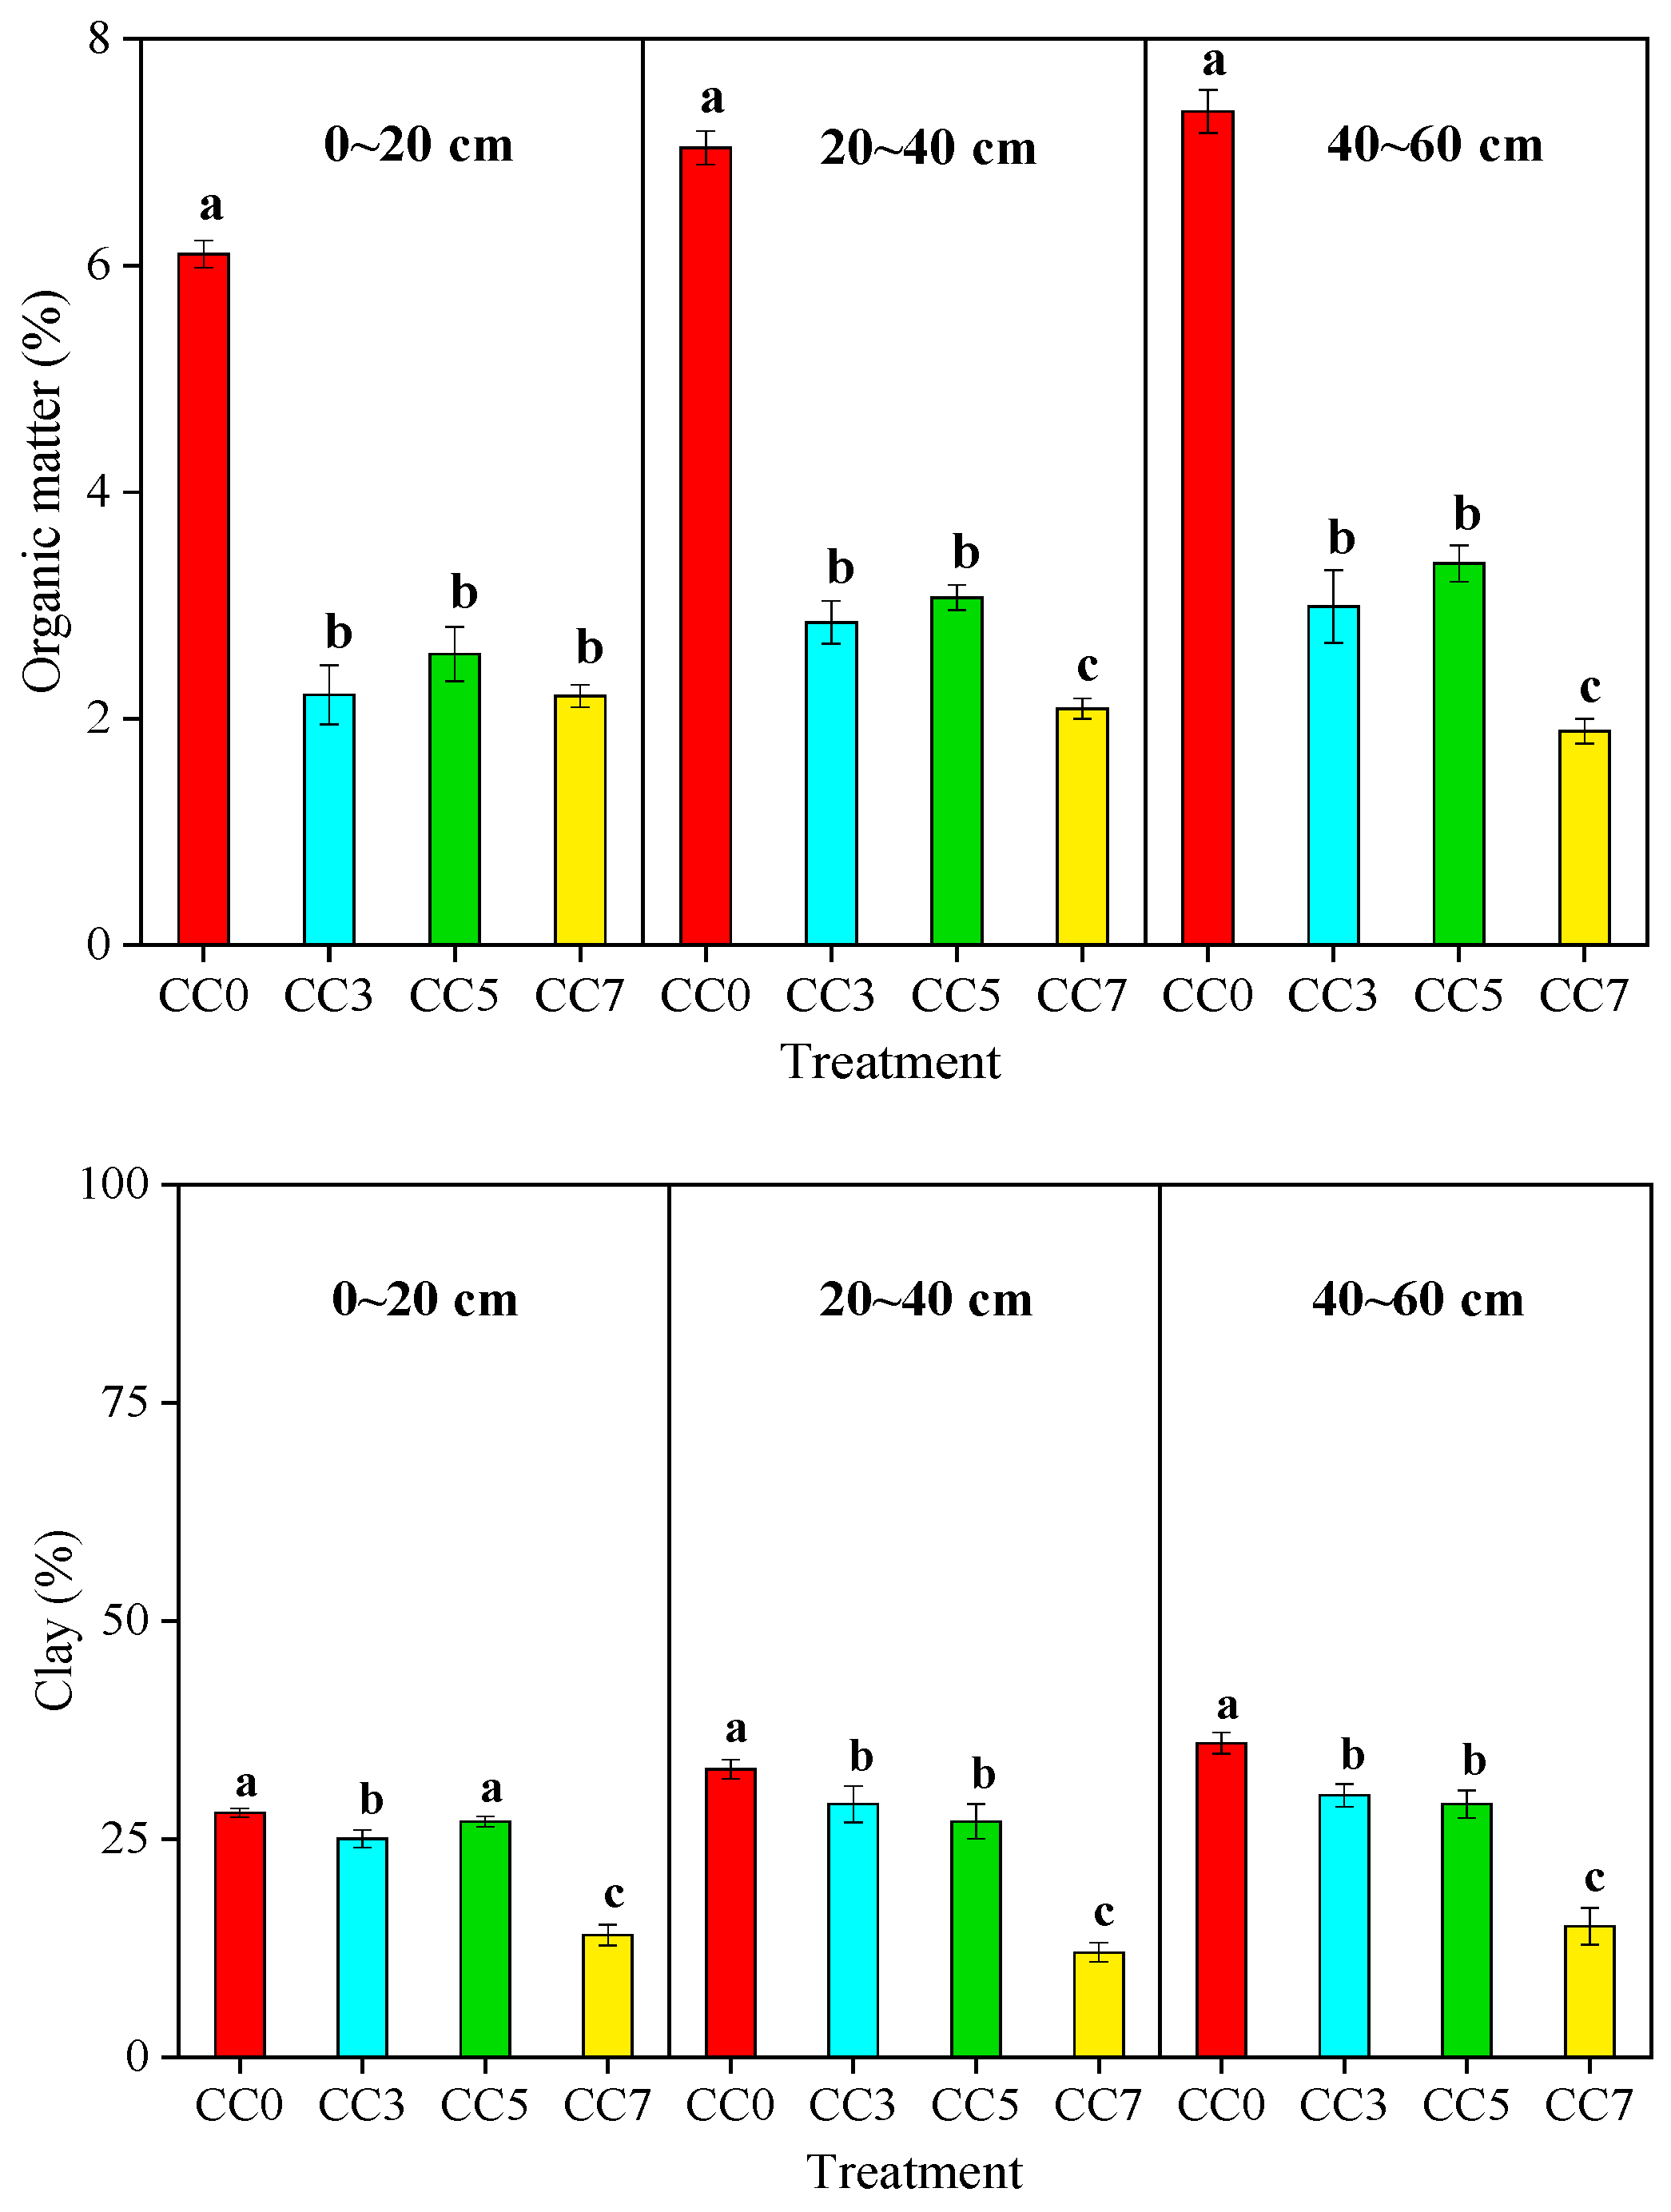
3.1. Effect of Continuous Cropping on Soil Physicochemical Properties

The effects of different continuous tobacco cropping durations or tomato rotation systems on soil physicochemical properties are illustrated in Figure 2. Compared with those at each soil depth in CC0, the pH levels at each soil depth in CC7 had decreased by 6.34% (0~20 cm), 15.03% (20~40 cm), and 9.91% (40~60 cm). Throughout the different durations of continuous cropping, there was a general decrease in soil organic matter content (Figure 2). Moreover, the organic matter content at the same soil depths in CC3, CC5, and CC7 was consistently lower than that in the cropping rotation system (CC0). The organic matter content in CC7 was the lowest and was 3.9% (0~20 cm), 4.95% (20~40 cm), and 5.47% (40~60 cm) lower than that in CC0. Soil organic matter content generally increased as the soil depth increased. The organic matter content at 40~60 cm was 1.26% (CC0), 0.78% (CC3), and 0.8% (CC5) greater than that at 0~20 cm. Meanwhile, in CC7, the soil organic matter content at 40~60 cm was lower than that at 0~20 cm, which was 0.31% (Figure 2). Furthermore, clay content had an opposite trend with the extension of continuous cropping years. Specifically, the clay contents of CC7 in each soil layer had decreased by 14% (0~20 cm), 21% (20~40 cm), and 21% (40~60 cm), respectively, relative to those in CC0. Vertically, clay content increased with the increase in soil depths. The clay contents at 40~60 cm increased by 8% (CC0), 5% (CC3), 2% (CC5), and 1% (CC7) compared with those at 0~20 cm (Figure 2).

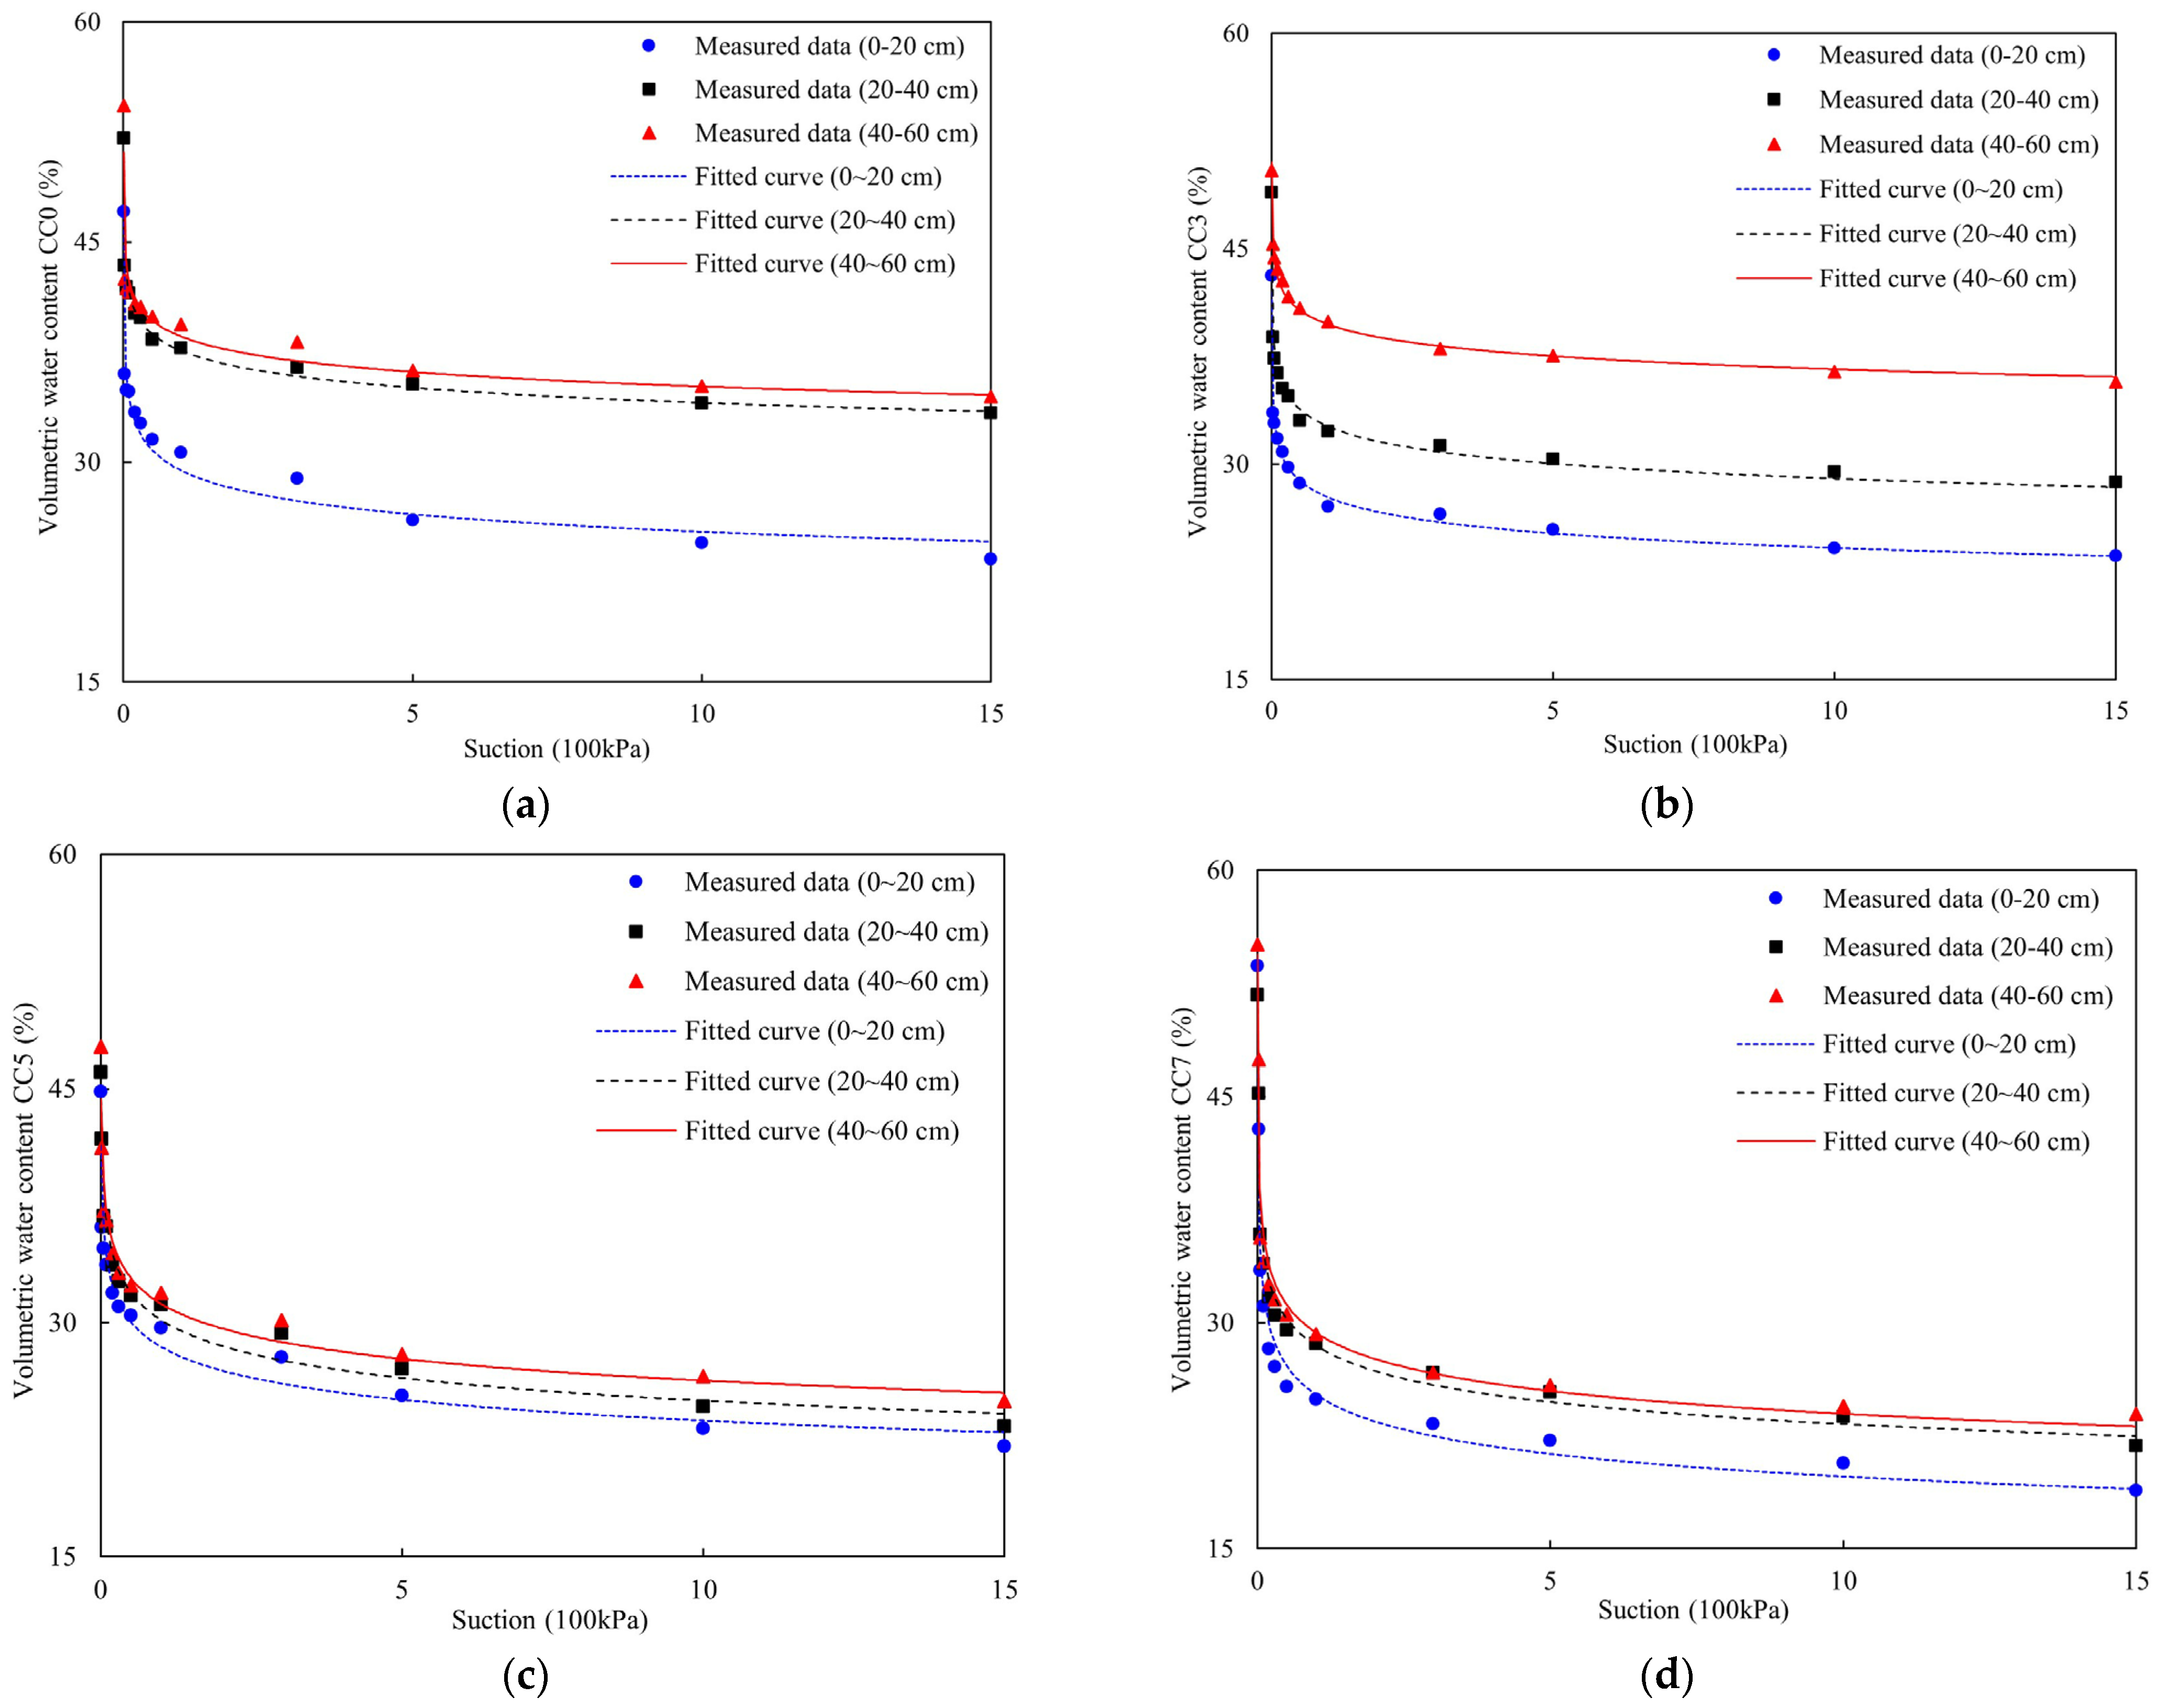
3.2. Effect of Continuous Cropping on Soil Water Holding Capacity

The parameters fitted by the Gardner model under each continuous cropping duration are shown in Table 1, and the fitted curves are shown in Figure 3a–d. The SWCC of CC0 at 40~60 cm was the largest, followed by that at 20~40 cm and 0~20 cm (Figure 3a). The values of the parameter (A) were 0.3855 (40~60 cm), 0.3758 (20~40 cm), and 0.2942 (0~20 cm), respectively (Table 1). Thus, the soil water holding capacity in CC0 declined in the order of 40~60 cm > 20~40 cm > 0~20 cm. Similarly, the soil water holding capacity in CC3 was lowest at 0~20 cm, then at 20~40 cm and 40~60 cm. Therefore, the soil water holding capacity in CC3 decreased in the order of 40~60 cm > 20~40 cm > 0~20 cm (Figure 3b). Furthermore, in CC5 (Figure 3c), with the increase in soil suction, water release was easiest at the soil layer of 0~20 cm, then at 20~40 cm, and was most difficult at 40~60 cm. The SWCC at 40~60 cm was the height, followed by that at 20~40 cm and 0~20 cm (Figure 3c). Therefore, the soil water holding capacity in CC5 decreased in the order of 40~60 cm > 20~40 cm > 0~20 cm. Similarly, in CC7 (Figure 3d), the soil water holding capacity decreased in accordance with the order of 40~60 cm > 20~40 cm > 0~20 cm.
The SWCCs at 0~20 cm in CC0, CC3, and CC5 were higher than those in CC7 (Figure 3), indicating that the soil water holding capacity in CC7 was the lowest, whereas that in CC0 was the highest. Moreover, CC0 had the largest parameter (A), followed by CC3 and CC5, while CC7 had the lowest parameter (A). These findings indicated that the soil water holding capacity of CC0 was the strongest, while CC7 was the weakest. Therefore, soil water holding capacity at 0~20 cm followed the order of CC0 > CC5 > CC3 > CC7. In addition, there was an obvious difference in SWCCs at 20~40 cm of each continuous cropping year, CC0 had the strongest soil water holding capacity, followed by CC3 and CC5, and CC7 had the weakest (Figure 3). Therefore, the soil water holding capacity at 20~40 cm followed the order of CC0 > CC3 > CC5 > CC7. Similarly, the soil water holding capacity at 40–60 cm followed the order of CC3 > CC0 > CC5 > CC7. Therefore, different continuous cropping had varying effects on soil water holding capacity.
Figure 4 illustrates the comparison between the measured and predicted θ values using the Gardner model. A good agreement was observed between the predicted and measured θ values of CC0, CC3, CC5, and CC7, given that linear regression provided R2 values ranging from 0.9436 to 0.9926, ME (−0.0007~0.0010 cm3 cm−3) and RMSE (0.0034~0.0714 cm3 cm−3). For CC0, CC3, CC5, and CC7, the predicted θ values were found to be higher than the measured values at low suction, while the measured θ were higher than the predicted at high suction (Figure 4). The R2 values of CC0 and CC3 (Figure 4a–f) were higher than those of CC5 and CC7 (Figure 4g–l). Among all cropping systems, CC3 had the highest R2 values of 0.9919, 0.9884, and 0.9922; ME values of 0.0011, 0.0010, and 0.0001; and RMSE values of 0.0050, 0.0056, 0.0034 at 0~20, 20~40, and 40~60 cm, respectively. Meanwhile, among all cropping systems, CC7 had the lowest R2 values of 0.9667, 0.9559, and 0.9436; ME values of −0.0007, −0.0004, and −0.0007; and RMSE values of 0.0170, 0.0168, and 0.0714 at 0~20, 20~40, and 40~60 cm, respectively. Moreover, the regression lines of the SWCCs of CC0 (20~40 cm), CC3 (0~20 cm, 20~40 cm, and 40~60 cm), and CC5 (20~40 cm) nearly overlapped with the 1:1 line without obvious deviations in any range (Figure 4). However, the ME values of the CC0 (0~20 cm) and CC7 (0~20 cm, 20~40 cm, and 40~60 cm) were negative, which indicated that the values underestimated the measured θ values, and the CC7 was generally affected by long-term continuous cropping.

3.3. Effect of Continuous Cropping on Soil Water Characteristic Parameters

The effects of different continuous tobacco cropping durations or tomato rotation systems on soil water characteristic parameters are illustrated in Table 2. The saturated moisture in CC0, CC3, and CC5 followed the order of 40~60 cm > 20~40 cm > 0~20 cm, and that in CC7 declined in the order of 40~60 cm > 0~20 cm > 20~40 cm (Table 2). Meanwhile, the saturated moisture at 0~20 cm followed the order of CC7 > CC0 > CC5 > CC3; that at 20~40 cm followed the order of CC0 > CC7 > CC3 > CC5; and that at 40~60 cm followed the order of CC7 > CC0 > CC5 > CC3. These rankings may be related to the distribution of large pores in CC7 and CC5. The order of field capacity and capillary fracture moisture at 0~20 cm was CC0 > CC5 > CC3 > CC7; that at 20~40 cm was CC0 > CC3 > CC5 > CC7; and that at 40~60 cm was CC3 > CC0 > CC5 > CC7. Meanwhile, the wilting and hygroscopic coefficients at 0~20 cm were ordered as CC3 > CC0 > CC5 > CC7; those at 20~40 cm were ordered as CC0 > CC3 > CC5 > CC7; and those at 40~60 cm were ordered as CC3 > CC0 > CC5 > CC7. These results indicated that the field capacity and capillary fracture moisture in CC5 and CC7 were lower than those in CC3 and CC0 and decreased with the increase in continuous cropping durations.

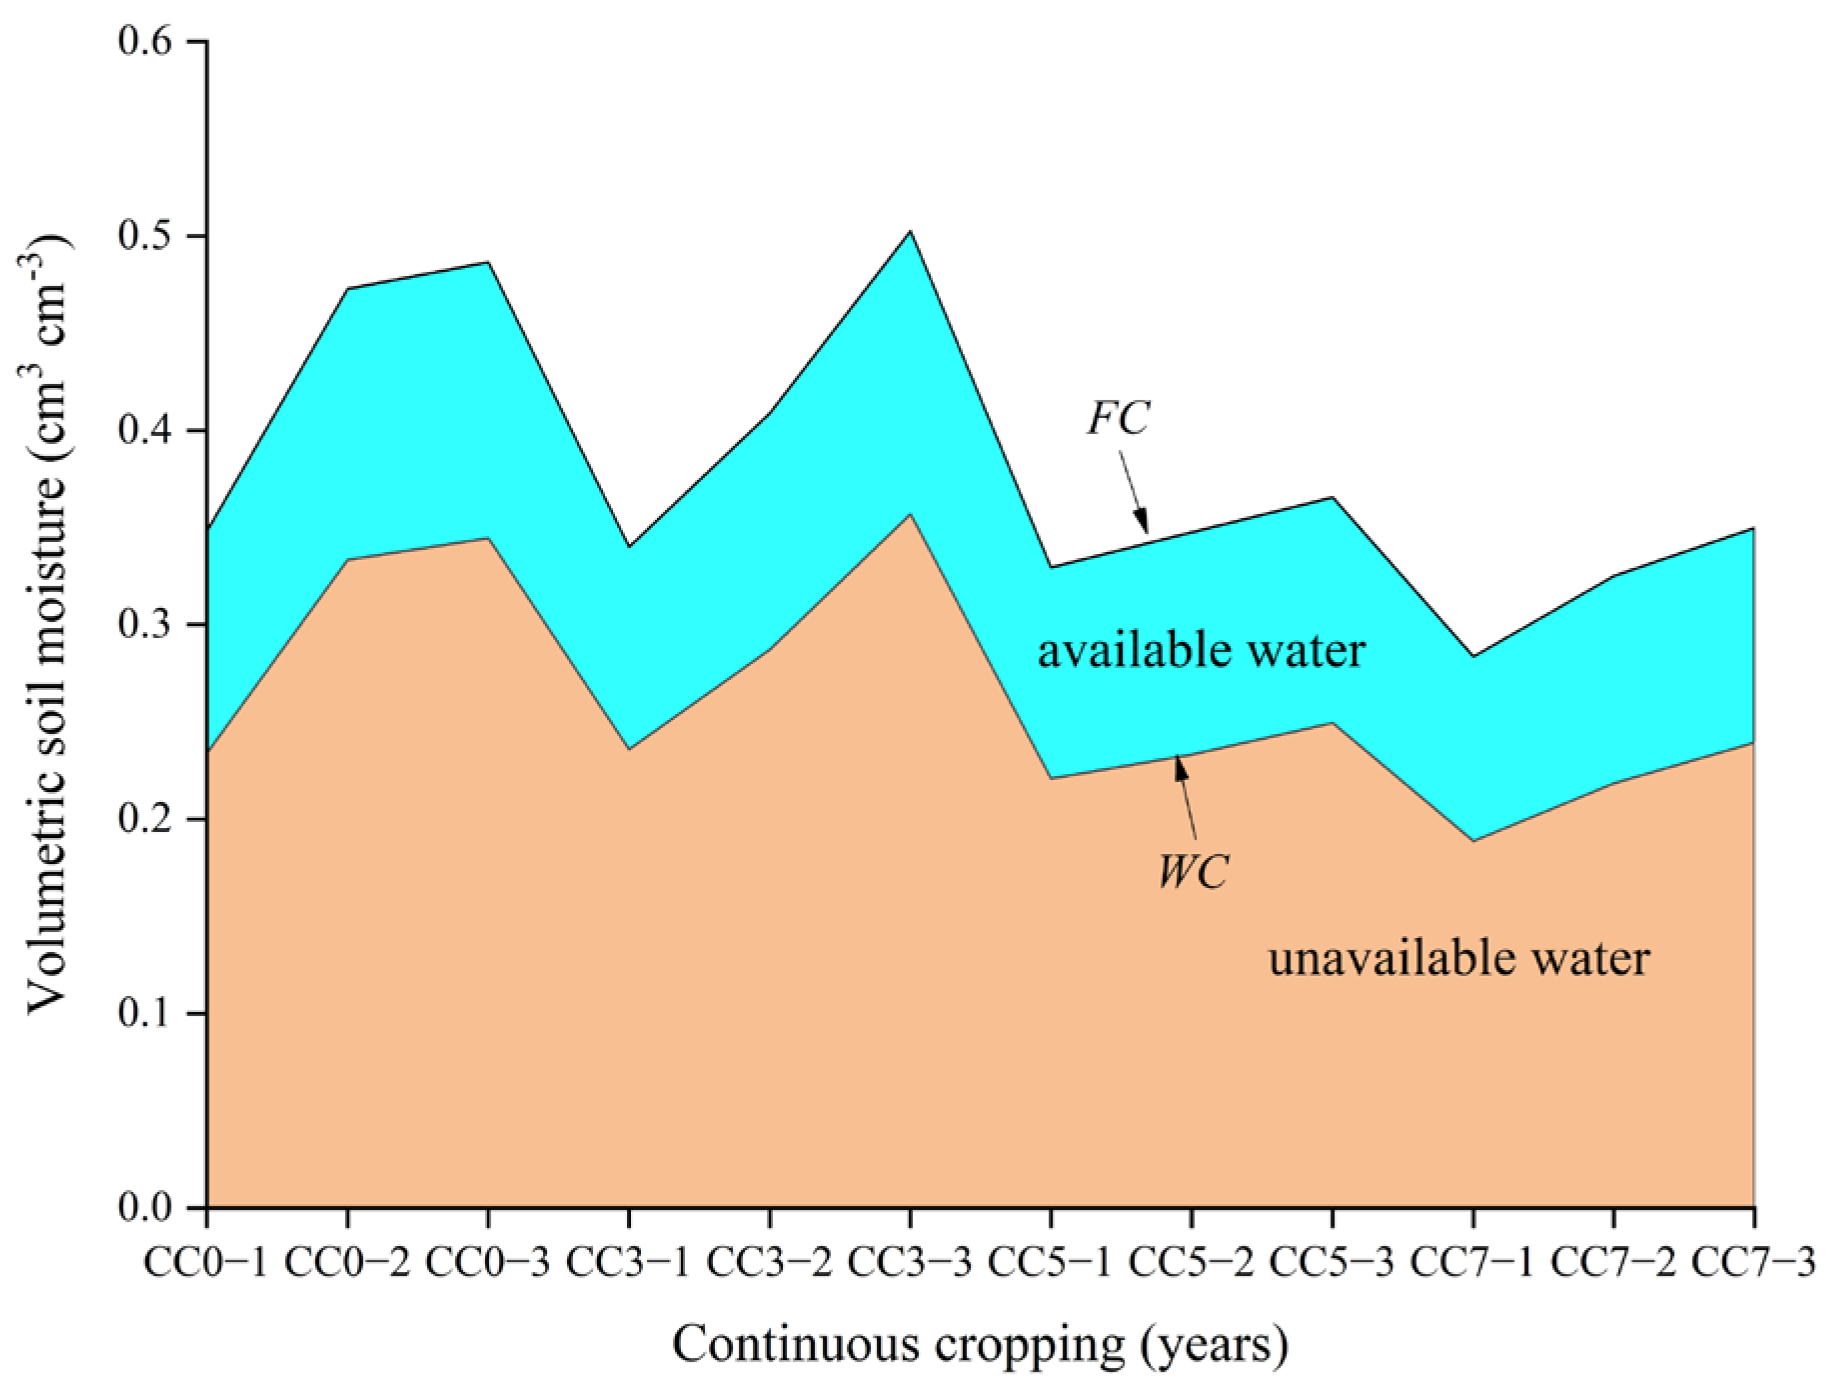
3.4. Effect of Continuous Cropping on Soil Water Availability

The values of gravity water under CC0, CC3, and CC5 had decreased by 0.1211, 0.1321, and 0.1279 cm3 cm−3 (0~20 cm), respectively; by 0.0901, 0.0702, and 0.0789 cm3 cm−3 (20~40 cm), respectively; and by 0.0981, 0.1474, and 0.0908 cm3 cm−3 (40~60 cm), respectively, (Table 3) relative to those under CC7. However, no significant relationship was found between gravity water and soil depths. Similarly, the available water and unavailable water were changed with the continuous cropping years, while there was no significant difference between (un)available water. The available water at 0~20 cm and 20~40 cm was higher in CC0 than in CC3, CC5, and CC7. Meanwhile, the available water at 40~60 cm followed the order of CC3 > CC0 > CC5 > CC7 (Table 3). In addition, the available water in CC0 was higher than that of CC7, which was higher than 0.0194 (0~20 cm), 0.0327 (20~40 cm), and 0.0316 (40~60 cm) cm3 cm−3 (Table 3). Furthermore, the unavailable water at 40~60 cm in CC3 (0.3569 cm3 cm−3) was the highest, followed by that at 40~60 cm and 20~40 cm in CC0.

3.5. Analysis of the Correlation Analysis between Soil Water Characteristics and Soil Physicochemical Properties

Given that soil water holding capacity was affected by soil physicochemical properties, the relationships between soil water holding capacity and soil physicochemical properties under different continuous cropping durations were analyzed (Table 4). Soil water holding capacity was significantly (p < 0.05) and positively correlated with soil organic matter (>0.1 bar) (100 kPa) but showed no significant differences at the low suction (<0.05 bar). This relationship may be the intrinsic reason for the variations in soil water holding capacity increase with the organic matter mentioned above. Similarly, soil pH was positively correlated with soil water holding capacity (p > 0.05) at each suction level. Moreover, soil clay content was significantly and positively correlated with soil water holding capacity (0.1~15 bar) (p < 0.01), and the coefficient of correlation between these two characteristics was the highest at the suction of 3 bar (0.798 **), showing that soil clay content was significantly affecting soil water holding capacity under different continuous cropping systems. Therefore, soil water holding capacity was primarily determined by physical clay (<0.02 mm) and organic matter contents.
The correlation between soil water characteristic parameters and soil physicochemical properties is shown in Table 5. Saturated moisture was positively correlated with organic matter but was negatively correlated with both pH and clay content. Field capacity was significantly and positively correlated with clay content (0.752 **) (p < 0.01) and organic matter (0.648 *) (p < 0.05) and was positively correlated with soil pH (p > 0.05) (Table 5). Similarly, the wilting coefficient was significantly and positively correlated with clay content (0.726 **) (p < 0.01) and organic matter (0.590 *) (p < 0.05) (Table 5).
The correlation between soil gravity water, (un)available water, and physicochemical properties under different continuous tobacco cropping durations or tomato rotation systems are shown in Table 6. Gravity water was negatively correlated with organic matter and pH, and significantly and negatively correlated with clay content (0.791 **) (p < 0.01). Furthermore, available water was significantly and positively correlated with organic matter (0.689 *) (p < 0.05) and clay content (0.762 **) (p < 0.01). Meanwhile, correlation analysis showed that unavailable water was significantly and positively correlated with clay content (0.710 **) (p < 0.01) and organic matter content (0.633 *) (p < 0.05).

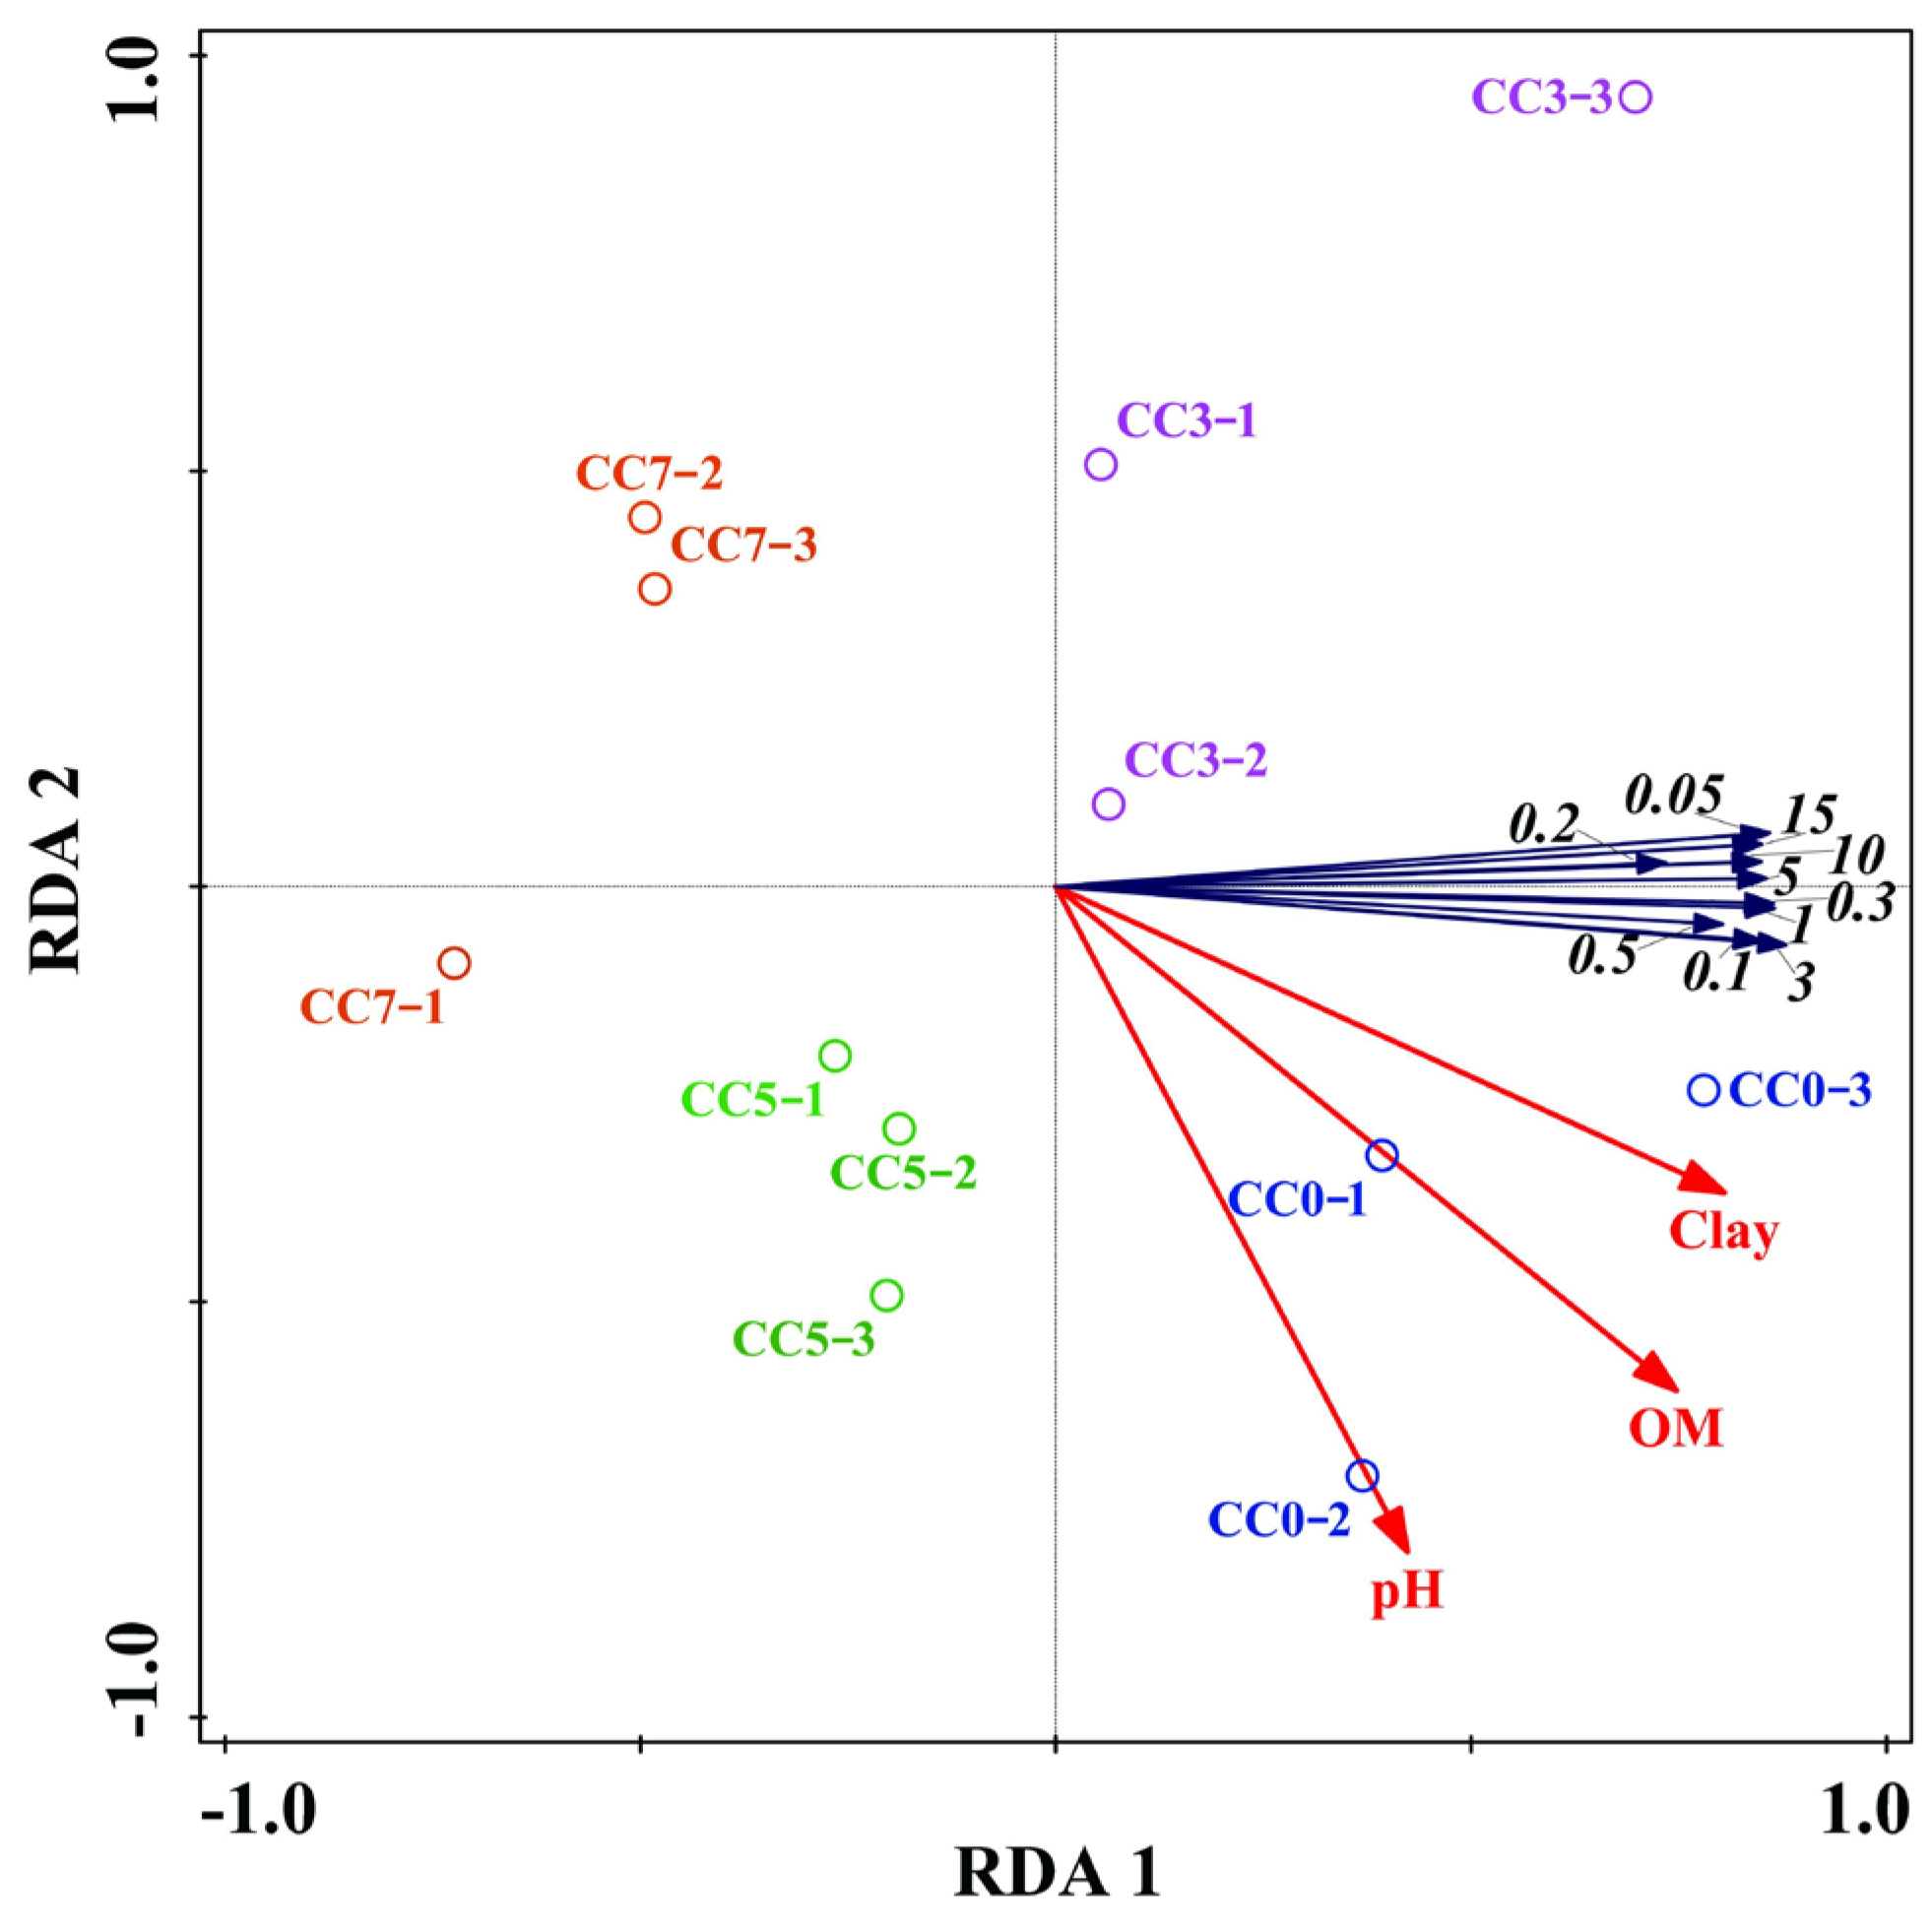
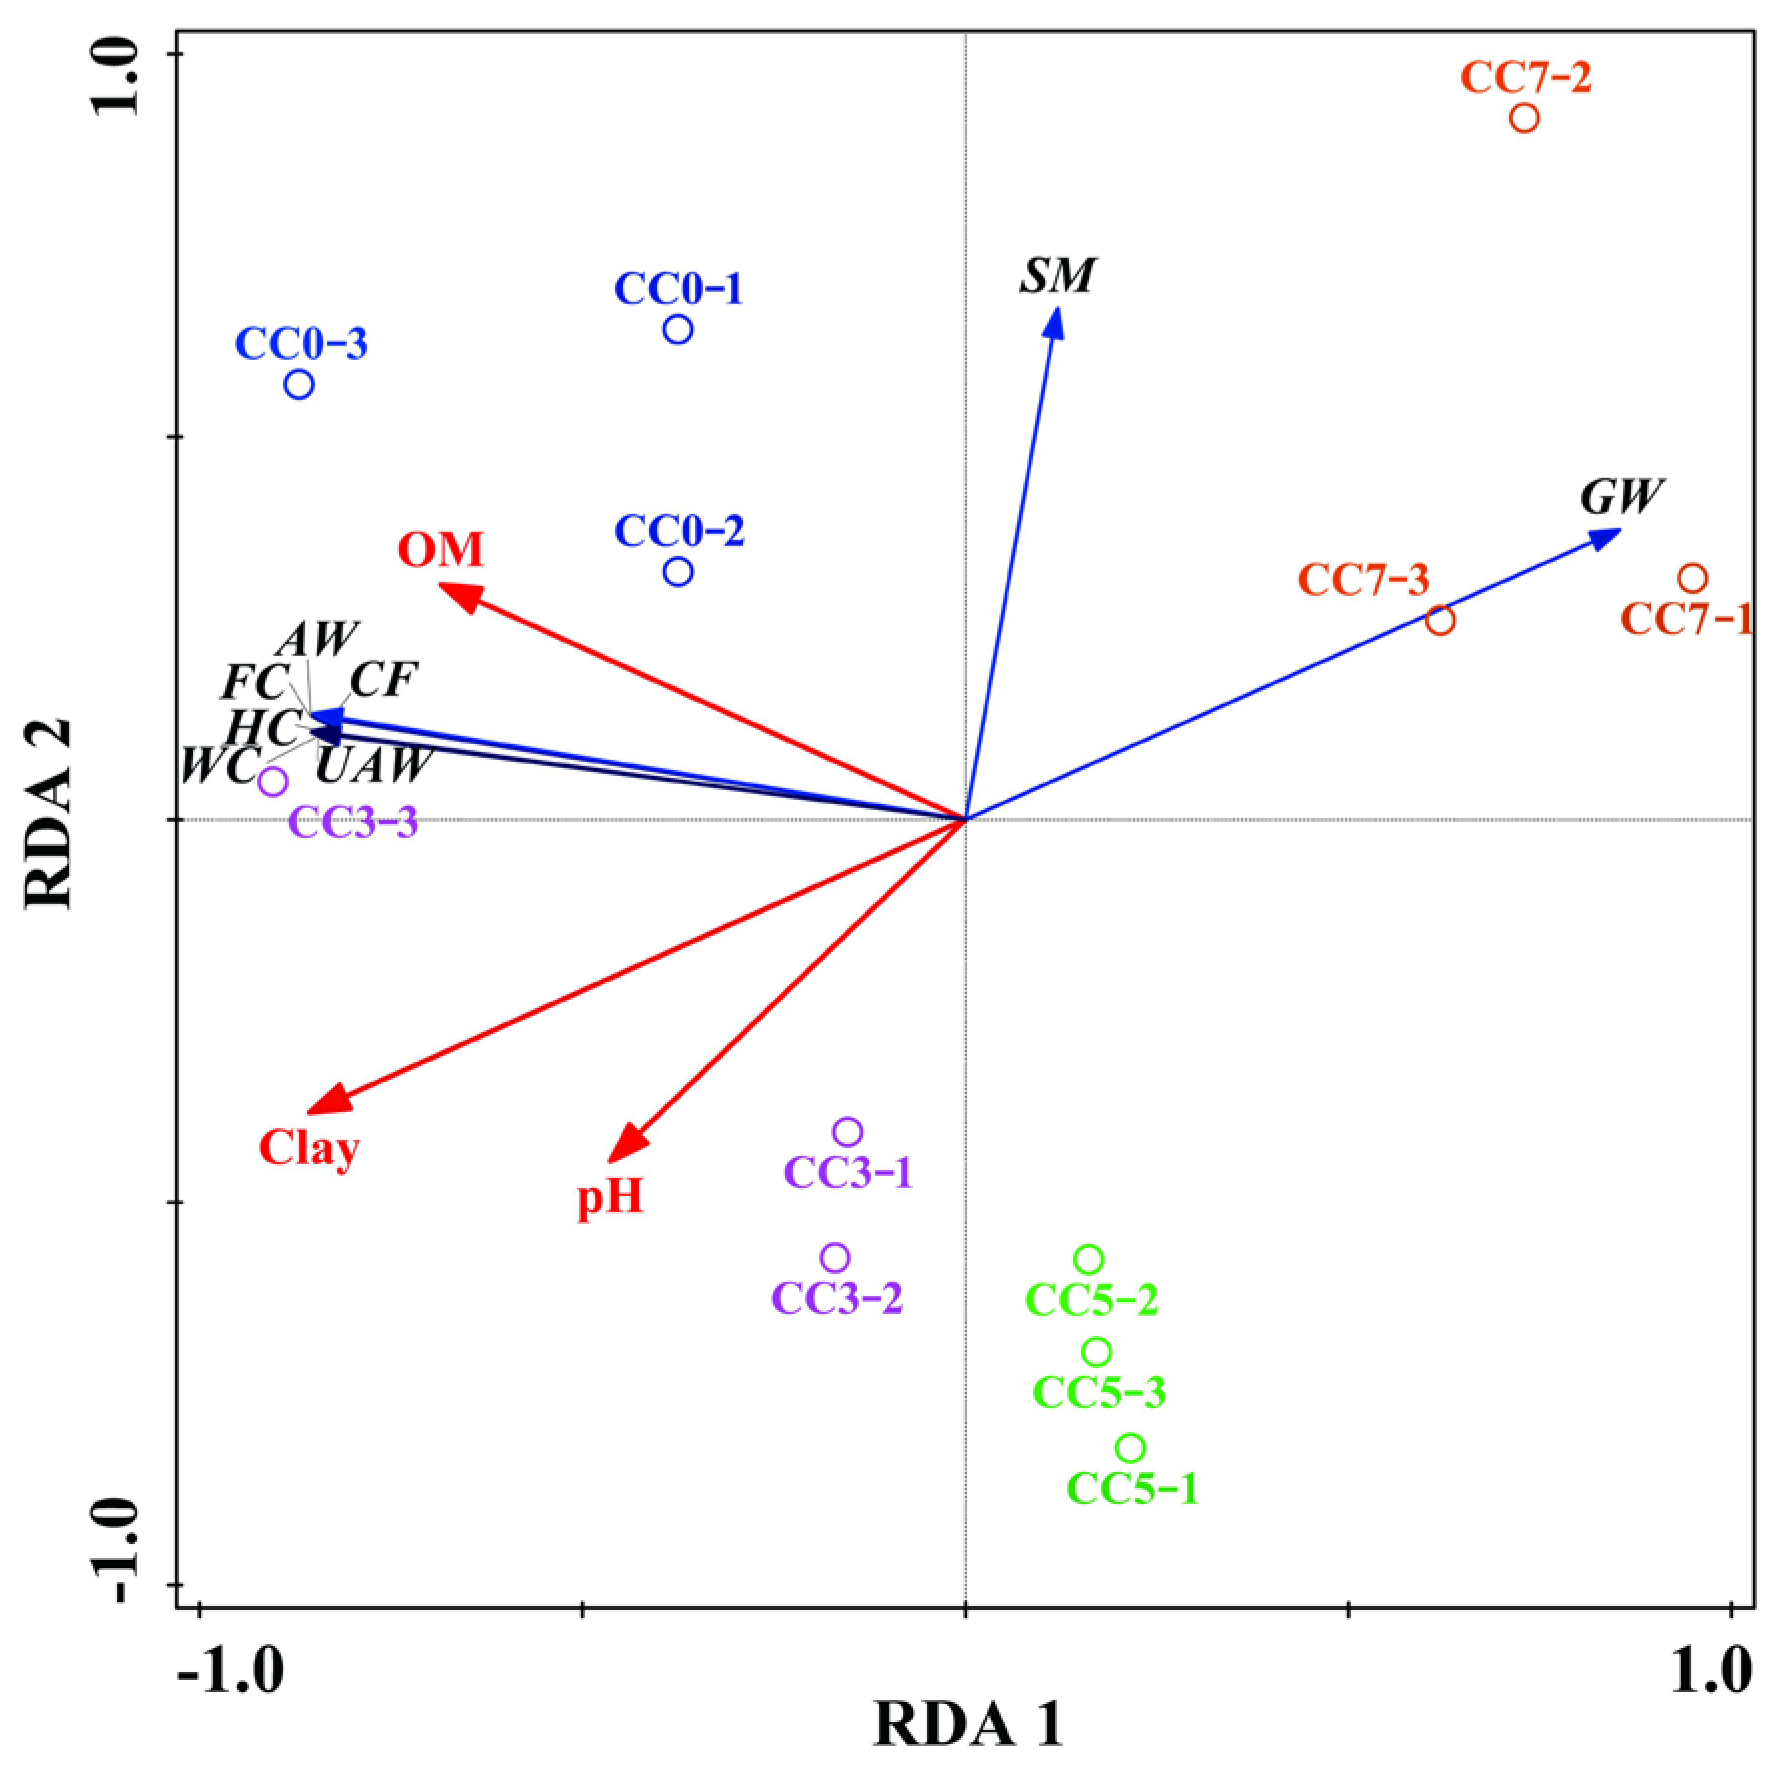
3.6. Interpretations of Soil Hydraulic and Physicochemical Properties by RDA Analysis

RDA indicated that soil physicochemical properties were caused by continuous cropping, which further affected soil water holding capacity (Figure 5). The first two RDA axes explained 72.32% of the cumulative variance in the relationship between soil water holding capacity and physicochemical properties, indicating a strong correlation between the composition of soil water holding capacity and physicochemical properties. In the ordination diagrams, clay and organic matter presented a strong positive correlation with the first axis, while pH revealed was positively correlated with soil water holding capacity (Figure 5).
RDA analysis (Figure 6) showed that field capacity, capillary fracture, wilting coefficient, and hygroscopic coefficient were strongly and positively correlated with organic matter and clay contents. Furthermore, there was a positive correlation between these soil water characteristics and pH.
RDA (Figure 6) demonstrated a strong positive correlation between available water and organic matter content and a positive correlation between clay content and pH. Notably, the changes in available water and unavailable water showed the same trend (Figure 7).

4. Discussion

4.1. Changes in Soil Physicochemical Properties Caused by Continuous Cropping

Soil genesis history, physiography, and continuous cropping have a direct influence on the physicochemical properties of soil [24,25]. This work found that the soil pH decreased under continuous cropping. This result was consistent with previous studies showing that continuous cropping leads to soil acidification [26]. Similarly, we discovered the pH in CC7 was lower than that in CC0, CC3, and CC5 at the same soil depths. This finding was consistent with the result of Li et al. [27], who reported a decrease in soil pH due to the continuous planting of strawberries, and the pH in CC7 was 6.34~15.03% lower than that in CC0. Continuous cropping alters community structures, leading to soil sickness involving the decrease of soil organic matter content, a decline in soil enzyme activity, destroying the soil aggregate structure, and resulting in soil acidification. Thus, soil pH declined after continuous cropping [28]. Specifically, soil pH was strongly associated with the changes in bacterial diversity and community structures, while continuous cropping remarkably reduced bacterial alpha diversity and altered community structures [29]. Moreover, our study showed that soil organic matter was significantly higher in CC0 compared to CC3, CC5, and CC7, which was in line with the previous report [30]. Interestingly, we found that CC5 exhibited higher soil organic matter levels than CC3. This indicated that organic matter content improved after continuous cropping. The main reason for this result is that conventional tillage may lead to a loss of soil organic matter, but this may be due to the increase of organic matter content after crop residues are returned to the soil [31]. However, this finding contradicted the results of Yu et al. [32], who found that by the second and third cropping rotations, soil organic matter content had decreased by 10% and 15%, respectively. Nevertheless, the organic matter content in CC7 was lower than that in CC5, CC3, and CC0, indicating that soil organic matter content decreased as the continuous cropping increased. Similarly, our data demonstrated that the clay content at the depth of 0~60 cm decreased with the increase in continuous tobacco cropping durations and soil depth because the soil was loose and porous at the depths of 0~30 cm where tobacco roots mainly concentrate. This finding agrees with Zhao et al. [33], who discovered that the clay content gradually moved and accumulated in deep layers.

4.2. Changes in Soil Water Holding Capacity Caused by Continuous Cropping

Continuous cropping led to the deterioration of soil water holding capacity. The soil water holding capacity in CC0 and CC3 was significantly higher than that in CC5 and CC7, which is in line with the conclusion that continuous cultivation altered soil physicochemical properties and led to a decline in soil water holding capacity [34]. Previous studies have stated that soil water holding capacity is strongly affected by organic matter [24]. The variability in organic matter content associated with continuous cropping alters pore distribution and water retention at lower suctions [35,36]. However, Abdallah [37] reported that increased soil water holding capacity due to the addition of organic matter might be overestimated or unclear and found that organic matter had a very weak effect on soil water holding capacity. Notably, our findings indicate a positive correlation between soil clay content and soil water content. These results agree with Zhao et al. [33], who discovered that soil water holding capacity was significantly correlated with clay content. Due to our discovery of the relationship between soil water holding capacity and soil physicochemical properties, our study results agree with Bordoloi et al. [24], indicating that the soil water holding capacity was strongly positively correlated with clay content. Similarly, Zhang et al. [8] indicated that the soil water holding capacity was significantly positively correlated with soil depths and clay content.

4.3. Changes in Soil Water Characteristic Parameters Caused by Continuous Cropping

The field capacity, the wilting coefficient, and capillary fracture moisture decreased as the continuous cropping increased. These results agree with Awe et al. [38], who reported that under tillage, soil field capacity differed significantly at the soil layers of 0~10 and 10~20 cm (p < 0.05). Interestingly, Awe et al. [38] also reported that the soil wilting coefficient showed insignificant differences. This finding indicated that the wilting coefficient was unaffected by tillage and contradicted our results. This phenomenon was likely due to the influence of cultivation practices on soil porosity. This work showed a strong positive correlation between field capacity, capillary fracture, wilting coefficient, and hygroscopic coefficient with organic matter and clay content. However, saturated moisture was positively correlated with organic matter content, while it was negatively correlated with clay content and pH. By contrast, our results illustrate that saturated moisture was significantly and negatively correlated with clay content and pH. These results indicate that continuous cropping is the main indicator affecting soil properties and can affect the ability of the soil to conserve water, and support root growth, thereby strongly influencing soil hydraulic characteristics [8].

4.4. Changes in Soil Water Availability Caused by Continuous Cropping

The deterioration of soil physicochemical conditions negatively affected soil hydraulic characteristics. The available water changed with the duration of continuous cropping, and the soil available water in CC0 and CC3 was higher than that in CC5 and CC7. These results agree with Awe et al. [38], who demonstrated that tillage practices either increased or decreased soil water retention at field capacity and that the changes in soil texture markedly influenced soil available water. Similarly, the results also agree with Aiken et al. [39], who showed that continuous cropping may reduce soil water availability. However, our findings contradict Blanco-Canqui et al. [10], who indicated that long-term tillage systems did not differently affect saturated hydraulic conductivity, water retention, and available water. This difference was due to the major influences of different types and intensities of tillage practices on soil properties and processes and thereby modified soil water availability.
The study revealed that available water and unavailable water had a strong positive correlation with organic matter content. However, gravity water had a strong negative correlation with organic matter, pH, and clay content. The literature suggests that increasing the organic matter content of a given soil does not significantly increase available water [40]. Interestingly, Minasny and McBratney [41] demonstrated that the available water increase contributed by organic matter might be overestimated. Nevertheless, given that soil water increases field capacity and the wilting coefficient [34], this approach does not always increase available water [35]. A similar result was reported by Román Dobarco et al. [42], who discovered that the influence of field capacity and the wilting coefficient on soil available water had large errors due to the wide range of mineral compositions within particle size fractions (i.e., clay).

5. Conclusions

Intensive continuous cropping has necessitated studies on soil hydraulic and physicochemical properties. Organic matter, pH, and clay content were negatively correlated with continuous cropping duration. Deeper soil layers have a higher water holding capacity. Soil water holding capacity, field capacity, and available water in rotation or short-term cropping were higher than those in long-term cropping and were positively correlated with soil pH, clay, and organic matter content. Meanwhile, saturated moisture was positively correlated with organic matter content, but was negatively correlated with clay content and pH. Furthermore, gravity water was negatively correlated with soil pH, clay, and organic matter content. Overall, continuous cropping poses a serious hazard to soil hydraulic and physicochemical properties, potentially resulting in decreased crop yield and quality. Our study enhances our understanding of the changes in soil hydraulic and physicochemical properties under continuous cropping in the karst region of southwestern China. Meanwhile, the data can be used to help formulate and implement sustainable and protective measures in areas suffering from continuous cropping obstacles. Thus, during agricultural production, we could regulate the stability of the soil-crop ecological system via crop rotation, or application of microbial fertilizers and soil amendments to mitigate continuous cropping obstacles.

Author Contributions

Conceptualization, X.Y., K.Z. and Z.Q.; methodology, X.Y., K.Z. and C.G.; software, X.Y.; validation, X.Y., K.Z. and Y.A.H.; investigation, X.Y., H.S., C.G., T.C., J.Z. and M.Z.-u.-R.; data curation, X.Y.; writing—original draft preparation, X.Y. and K.Z.; writing—review and editing, X.Y., K.Z., Z.Q., H.S. and Y.A.H.; supervision, K.Z.; funding acquisition, X.Y. and K.Z. All authors have read and agreed to the published version of the manuscript.

Funding

This research was funded by the National Natural Science Foundation of China (grant number 42201047), the China Postdoctoral Science Foundation (grant number 2022M711025), the Fundamental Research Funds for the Central Universities (grant number B230201036 and grant number B200204038), the Jiangsu Funding Program for Excellent Postdoctoral Talent (grant number 2022ZB175), the National Natural Science Foundation of China (grant number 51879067), and the Hydraulic Science and Technology Plan Foundation of Shaanxi Province (grant number 2019slkj-B1).

Data Availability Statement

Not applicable.

Conflicts of Interest

The authors declare no conflict of interest.

References

  1. Liu, Z.; Liu, J.; Yu, Z.; Yao, Q.; Li, Y.; Liang, A.; Zhang, W.; Mi, G.; Jin, J.; Liu, X.; et al. Long-term continuous cropping of soybean is comparable to crop rotation in mediating microbial abundance, diversity and community composition. Soil Tillage Res. 2020, 197, 104503. [Google Scholar] [CrossRef]
  2. Xi, H.; Shen, J.; Qu, Z.; Yang, D.; Liu, S.; Nie, X.; Zhu, L. Effects of long-term cotton continuous cropping on soil microbiome. Sci. Rep. 2019, 9, 18297. [Google Scholar] [CrossRef] [PubMed]
  3. Zeng, J.; Yue, F.-J.; Li, S.-L.; Wang, Z.-J.; Qin, C.-Q.; Wu, Q.-X.; Xu, S. Agriculture driven nitrogen wet deposition in a karst catchment in southwest china. Agric. Ecosyst. Environ. 2020, 294, 106883. [Google Scholar] [CrossRef]
  4. Yang, X.; Shao, X.; Mao, X.; Li, M.; Zhao, T.; Wang, F.; Chang, T.; Guang, J. Influences of drought and microbial water-retention fertilizer on leaf area index and photosynthetic characteristics of flue-cured tobacco. Irrig. Drain. 2019, 68, 729–739. [Google Scholar] [CrossRef]
  5. Stella, L. Dryland farming and the agronomic management of crops in arid environments. J. Agron. 2019, 18, 49–54. [Google Scholar] [CrossRef]
  6. Wang, Y.; Zou, Y.; Cai, H.; Zeng, Y.; He, J.; Yu, L.; Zhang, C.; Saddique, Q.; Peng, X.; Siddique, K.H.M.; et al. Seasonal variation and controlling factors of evapotranspiration over dry semi-humid cropland in guanzhong plain, china. Agr. Water Manag. 2022, 259, 107242. [Google Scholar] [CrossRef]
  7. Yang, X.; Zhao, T.; Wang, F.; Shao, X.; Guo, Y.; Li, M.; Chang, T.; Guang, J.; Wu, W. Analysis on soil water characteristic based on gardner model in southwest of guizhou province. J. Irrig. Drain. 2018, 37, 35–42. [Google Scholar]
  8. Zhang, X.; Zhao, W.; Wang, L.; Liu, Y.; Liu, Y.; Feng, Q. Relationship between soil water content and soil particle size on typical slopes of the loess plateau during a drought year. Sci. Total Environ. 2019, 648, 943–954. [Google Scholar] [CrossRef]
  9. Rahmati, M.; Eskandari, I.; Kouselou, M.; Feiziasl, V.; Mahdavinia, G.R.; Aliasgharzad, N.; Mckenzie, B.M. Changes in soil organic carbon fractions and residence time five years after implementing conventional and conservation tillage practices. Soil Tillage Res. 2020, 200, 104632. [Google Scholar] [CrossRef]
  10. Blanco-Canqui, H.; Wienhold, B.J.; Jin, V.L.; Schmer, M.R.; Kibet, L.C. Long-term tillage impact on soil hydraulic properties. Soil Tillage Res. 2017, 170, 38–42. [Google Scholar] [CrossRef]
  11. Huang, L.; Shao, M.A. Advances and perspectives on soil water research in china’s loess plateau. Earth Sci. Rev. 2019, 199, 102962. [Google Scholar] [CrossRef]
  12. Bordoni, M.; Bittelli, M.; Valentino, R.; Chersich, S.; Meisina, C. Improving the estimation of complete field soil water characteristic curves through field monitoring data. J. Hydrol. 2017, 552, 283–305. [Google Scholar] [CrossRef]
  13. Brooks, R.H.; Corey, A.T. Hydraulic properties of porous media and their relation to drainage design. Trans. ASAE 1964, 7, 26–28. [Google Scholar]
  14. Gardner, W.R.; Hillel, D.; Benyamini, Y. Post-irrigation movement of soil water: 2. Simultaneous redistribution and evaporation. Water Resour. Res. 1970, 6, 1148–1153. [Google Scholar] [CrossRef]
  15. Van Genuchten, M.T. A closed-form equation for predicting the hydraulic conductivity of unsaturated soils. Soil Sci. Soc. Am. J. 1980, 44, 892–898. [Google Scholar] [CrossRef]
  16. Kosugi, K.I. Lognormal distribution model for unsaturated soil hydraulic properties. Water Resour. Res. 1996, 32, 2697–2703. [Google Scholar] [CrossRef]
  17. Han, G.; Tang, Y.; Liu, M.; Van Zwieten, L.; Yang, X.; Yu, C.; Wang, H.; Song, Z. Carbon-nitrogen isotope coupling of soil organic matter in a karst region under land use change, southwest china. Agric. Ecosyst. Environ. 2020, 301, 107027. [Google Scholar] [CrossRef]
  18. Azizi, K.; Garosi, Y.; Ayoubi, S.; Tajik, S. Integration of sentinel-1/2 and topographic attributes to predict the spatial distribution of soil texture fractions in some agricultural soils of western iran. Soil Tillage Res. 2023, 229, 105681. [Google Scholar] [CrossRef]
  19. Cui, X.; Cao, X.; Xue, W.; Xu, L.; Cui, Z.; Zhao, R.; Ni, S.Q. Integrative effects of microbial inoculation and amendments on improved crop safety in industrial soils co-contaminated with organic and inorganic pollutants. Sci. Total Environ. 2023, 873, 162202. [Google Scholar] [CrossRef]
  20. Halecki, W.; Stachura, T. Evaluation of soil hydrophysical parameters along a semiurban small river: Soil ecosystem services for enhancing water retention in urban and suburban green areas. Catena 2021, 196, 104910. [Google Scholar] [CrossRef]
  21. Fu, Q.; Zhao, H.; Li, T.; Hou, R.; Liu, D.; Ji, Y.; Zhou, Z.; Yang, L. Effects of biochar addition on soil hydraulic properties before and after freezing-thawing. Catena 2019, 176, 112–124. [Google Scholar] [CrossRef]
  22. Zhang, J.; Amonette, J.E.; Flury, M. Effect of biochar and biochar particle size on plant-available water of sand, silt loam, and clay soil. Soil Tillage Res. 2021, 212, 104992. [Google Scholar] [CrossRef]
  23. Bayat, H.; Mazaheri, B.; Mohanty, B.P. Estimating soil water characteristic curve using landscape features and soil thermal properties. Soil Tillage Res. 2019, 189, 1–14. [Google Scholar] [CrossRef]
  24. Bordoloi, R.; Das, B.; Yam, G.; Pandey, P.K.; Tripathi, O.P. Modeling of water holding capacity using readily available soil characteristics. Agr. Res. 2019, 8, 347–355. [Google Scholar] [CrossRef]
  25. Simon, L.M.; Obour, A.K.; Holman, J.D.; Roozeboom, K.L. Long-term cover crop management effects on soil properties in dryland cropping systems. Agric. Ecosyst. Environ. 2022, 328, 107852. [Google Scholar] [CrossRef]
  26. Tan, G.; Liu, Y.; Peng, S.; Yin, H.; Meng, D.; Tao, J.; Gu, Y.; Li, J.; Yang, S.; Xiao, N.; et al. Soil potentials to resist continuous cropping obstacle: Three field cases. Environ. Res. 2021, 200, 111319. [Google Scholar] [CrossRef]
  27. Li, D.; Gao, G.; Shao, M.A.; Fu, B. Predicting available water of soil from particle-size distribution and bulk density in an oasis–desert transect in northwestern china. J. Hydrol. 2016, 538, 539–550. [Google Scholar] [CrossRef]
  28. Gao, Z.; Hu, Y.; Han, M.; Xu, J.; Wang, X.; Liu, L.; Tang, Z.; Jiao, W.; Jin, R.; Liu, M.; et al. Effects of continuous cropping of sweet potatoes on the bacterial community structure in rhizospheric soil. BMC Microbiol. 2021, 21, 102. [Google Scholar] [CrossRef]
  29. Xu, Y.; Liu, J.; Liu, X.; Li, H.; Yang, Z.; Wang, H.; Huang, X.; Lan, L.; An, Y.; Li, L.; et al. Continuous cropping of alfalfa (Medicago sativa L.) reduces bacterial diversity and simplifies cooccurrence networks in aeolian sandy soil. Soil Ecol. Lett. 2022, 4, 131–143. [Google Scholar] [CrossRef]
  30. Zhao, H.-T.; Li, T.-P.; Zhang, Y.; Hu, J.; Bai, Y.-C.; Shan, Y.-H.; Ke, F. Effects of vermicompost amendment as a basal fertilizer on soil properties and cucumber yield and quality under continuous cropping conditions in a greenhouse. J. Soil Sediment. 2017, 17, 2718–2730. [Google Scholar] [CrossRef]
  31. Man, M.; Wagner-Riddle, C.; Dunfield, K.E.; Deen, B.; Simpson, M.J. Long-term crop rotation and different tillage practices alter soil organic matter composition and degradation. Soil Tillage Res. 2021, 209, 104960. [Google Scholar] [CrossRef]
  32. Yu, Y.; Yang, J.; Zeng, S.; Wu, D.; Jacobs, D.F.; Sloan, J.L. Soil ph, organic matter, and nutrient content change with the continuous cropping of cunninghamia lanceolata plantations in south china. J. Soil Sediment. 2017, 17, 2230–2238. [Google Scholar] [CrossRef]
  33. Zhao, W.-J.; Cui, Z.; Ma, H. Fractal features of soil particle-size distributions and their relationships with soil properties in gravel-mulched fields. Arab. J. Geosci. 2017, 10, 211. [Google Scholar] [CrossRef]
  34. Gabriel, J.L.; Quemada, M.; Martín-Lammerding, D.; Vanclooster, M. Assessing the cover crop effect on soil hydraulic properties by inverse modelling in a 10-year field trial. Agric. Water Manag. 2019, 222, 62–71. [Google Scholar] [CrossRef]
  35. Costa, A.D.; Albuquerque, J.A.; Costa, A.D.; Pértile, P.; Silva, F.R.D. Water retention and availability in soils of the state of santa catarina-brazil: Effect of textural classes, soil classes and lithology. Rev. Bras. Cienc. Solo 2013, 37, 1535–1548. [Google Scholar] [CrossRef]
  36. Schluter, S.; Leuther, F.; Albrecht, L.; Hoeschen, C.; Kilian, R.; Surey, R.; Mikutta, R.; Kaiser, K.; Mueller, C.W.; Vogel, H.J. Microscale carbon distribution around pores and particulate organic matter varies with soil moisture regime. Nat. Commun. 2022, 13, 2098. [Google Scholar] [CrossRef] [PubMed]
  37. Abdallah, A.M. The effect of hydrogel particle size on water retention properties and availability under water stress. Int. Soil Water Conserv. 2019, 7, 275–285. [Google Scholar] [CrossRef]
  38. Awe, G.O.; Reichert, J.M.; Fontanela, E. Sugarcane production in the subtropics: Seasonal changes in soil properties and crop yield in no-tillage, inverting and minimum tillage. Soil Tillage Res. 2020, 196, 104447. [Google Scholar] [CrossRef]
  39. Aiken, R.M.; O’Brien, D.M.; Olson, B.L.; Murray, L. Replacing fallow with continuous cropping reduces crop water productivity of semiarid wheat. Agron. J. 2013, 105, 199–207. [Google Scholar] [CrossRef]
  40. Bonfante, A.; Basile, A.; Bouma, J. Exploring the effect of varying soil organic matter contents on current and future moisture supply capacities of six italian soils. Geoderma 2020, 361, 114079. [Google Scholar] [CrossRef]
  41. Minasny, B.; Mcbratney, A.B. Limited effect of organic matter on soil available water capacity. Eur. J. Soil Sci. 2018, 69, 39–47. [Google Scholar] [CrossRef]
  42. Román Dobarco, M.; Bourennane, H.; Arrouays, D.; Saby, N.P.A.; Cousin, I.; Martin, M.P. Uncertainty assessment of globalsoilmap soil available water capacity products: A french case study. Geoderma 2019, 344, 14–30. [Google Scholar] [CrossRef]
Figure 1. (a) Pressure plate testing using the Pressure Vessel 1500; (b) soil specimens on a 1 bar ceramic plate.
Agronomy 13 01416 g001
Figure 2. Effect of different continuous tobacco cropping durations or tomato rotation systems on soil physicochemical properties. Data are means ± S.E., n = 3. Different letters indicate a significant difference at the p = 0.05 level. Continuous cropping of tobacco for 3 years (CC3), 5 years (CC5), 7 years (CC7), or cropping rotation (CC0, i.e., the control).
Agronomy 13 01416 g002aAgronomy 13 01416 g002b
Figure 3. SWCCs within the suction range of 0~15 (100 kPa). Continuous tobacco cropping for 3 years (CC3), 5 years (CC5), or 7 years (CC7), or cropping rotation (CC0, i.e., the control). (ad) represent the SWCCs in CC0, CC3, CC5, and CC7, respectively.
Agronomy 13 01416 g003
Figure 4. Comparison of the measured and predicted soil water contents under different treatments. Letters (ac) represent 0~20, 20~40, and 40~60 cm in CC0, respectively; similarly, (df) represent each layer in CC3; (gi) represent each layer in CC5; and (jl) represent each layer in CC7.
Agronomy 13 01416 g004aAgronomy 13 01416 g004b
Figure 5. RDA demonstrates the relationships between soil water holding capacity and soil physicochemical properties. Clay represents clay content; OM represents organic matter; The numbers 0.05, 0.1, 0.2, 0.3, 0.5, 1, 3, 5, 10, and 15 represent the soil water holding capacity at each soil suctions (100 kPa); CC0−1, CC0−2, and CC0−3 represent the soil depths of 0~20, 20~40, and 40~60 cm in CC0, respectively; the soil depths in CC3, CC5, and CC7 are denoted similarly to those in CC0.
Agronomy 13 01416 g005
Figure 6. RDA demonstrates the relationships between soil water characteristic parameters, soil water availability, and soil physicochemical properties. SM represents saturated moisture; FC represents field capacity; CF represents capillary fracture; WC represents wilting coefficient; HC represents hygroscopic coefficient; GW represents gravity water; AW represents available water; UAW represents unavailable water.
Agronomy 13 01416 g006
Figure 7. Variation in available water and unavailable water under different treatments. CC0−1, CC0−2, and CC0−3 represent the soil depths of 0~20, 20~40, and 40~60 cm in CC0; the soil depths in CC3, CC5, and CC7 are denoted similarly as those in CC0.
Agronomy 13 01416 g007
Table 1. Gardner fitting parameters and equations for SWCCs.
TreatmentSoil Depth (cm)ABR2Fitting Equation
CC00~200.29420.06640.9649θ = 0.2942·ψm −0.0664
20~400.37580.04300.9876θ = 0.3758·ψm −0.0430
40~600.38550.04020.9287θ = 0.3855·ψm 0.0402
CC30~200.27690.05920.9881θ = 0.2769·ψm 0.0592
20~400.32630.05140.9804θ = 0.3263·ψm 0.0514
40~600.39730.03560.9931θ = 0.3973·ψm 0.0356
CC50~200.28470.07920.9503θ = 0.2847·ψm 0.0792
20~400.30190.08190.9750θ = 0.3019·ψm 0.0819
40~600.31220.07450.9657θ = 0.3122·ψm 0.0745
CC70~200.25230.10550.9700θ = 0.2523·ψm 0.1055
20~400.28480.08780.9678θ = 0.2848·ψm 0.0878
40~600.29340.08810.9562θ = 0.2934·ψm 0.0881
Continuous tobacco cropping for 3 years (CC3), 5 years (CC5), and 7 years (CC7), or cropping rotation (CC0, i.e., the control). ψm is the soil matrix suction, and A and B are the parameters that denote the shape of the SWCC.
Table 2. Soil water characteristic parameters under different treatments.
TreatmentSoil Depth
(cm)
Saturated Moisture
(cm3 cm−3)
Field
Capacity (cm3 cm−3)
Capillary Fracture Moisture
(cm3 cm−3)
Wilting Coefficient
(cm3 cm−3)
Hygroscopic Coefficient
(cm3 cm−3)
CC00~200.47090.32640.21220.23400.1463
20~400.52060.39820.25880.33340.2084
40~600.54310.40570.26370.34460.2154
CC30~200.43120.29770.19350.23590.1474
20~400.48940.34710.22560.28730.1796
40~600.50450.41640.27070.35690.2231
CC50~200.44790.31020.20160.22090.1381
20~400.46030.32670.21240.23330.1458
40~600.47650.33180.21570.24950.1559
CC70~200.53640.27080.17600.18880.1180
20~400.51730.30480.19810.21840.1365
40~600.55090.31540.20500.23950.1497
Continuous tobacco cropping for 3 years (CC3), 5 years (CC5), and 7 years (CC7), or cropping rotation (CC0, i.e., the control).
Table 3. Soil water availability under different treatments.
TreatmentSoil Depth
(cm)
Gravity Water
(cm3 cm−3)
Available Water
(cm3 cm−3)
Unavailable Water (cm3 cm−3)
CC00~200.14450.11420.2340
20~400.12240.13940.3334
40~600.13740.14200.3446
CC30~200.13350.10420.2359
20~400.14230.12150.2873
40~600.08810.14570.3569
CC50~200.13770.10860.2209
20~400.13360.11430.2333
40~600.14470.11610.2495
CC70~200.26560.09480.1888
20~400.21250.10670.2184
40~600.23550.11040.2395
Continuous tobacco cropping for 3 years (CC3), 5 years (CC5), and 7 years (CC7), or cropping rotation (CC0, i.e., the control).
Table 4. Correlation between soil water holding capacity and soil physicochemical properties.
Suction (100 kPa)Organic Matter and Water ContentpH and Water Content<0.02 mm Physical Clay and Water Content
0.050.5330.2600.613 *
0.10.609 *0.3650.708 **
0.20.613 *0.3490.734 **
0.30.648 *0.3780.752 **
0.50.641 *0.3760.752 **
10.656 *0.4080.761 **
30.673 *0.4350.798 **
50.600 *0.3360.731 **
100.594 *0.3140.718 **
150.590 *0.3150.726 **
* Correlation is significant at the 0.05 level. ** Correlation is significant at the 0.01 level.
Table 5. Correlation between soil water characteristic parameters and physicochemical properties.
Soil Water Characteristic Parameters Clay (%)Organic Matter (%)pH
Saturated moisture (cm3 cm−3)−0.2600.209−0.325
Field capacity (cm3 cm−3)0.752 **0.648 *0.378
Wilting coefficient (cm3 cm−3)0.726 **0.590 *0.315
* Correlation is significant at the 0.05 level. ** Correlation is significant at the 0.01 level.
Table 6. Correlation between soil water availability and physicochemical properties.
Soil Water Availability (cm3 cm−3)Clay (%)Organic Matter (%)pH
Gravity water−0.791 **−0.518−0.341
Available water0.762 **0.689 *0.193
Unavailable water0.710 **0.633 *0.120
* Correlation is significant at the 0.05 level. ** Correlation is significant at the 0.01 level.
Disclaimer/Publisher’s Note: The statements, opinions and data contained in all publications are solely those of the individual author(s) and contributor(s) and not of MDPI and/or the editor(s). MDPI and/or the editor(s) disclaim responsibility for any injury to people or property resulting from any ideas, methods, instructions or products referred to in the content.

