Article

Effects of Different Tillage Practices on Soil Stability and Erodibility for Red Soil Sloping Farmland in Southern China

1
Engineering Research Center of Ecology and Agricultural Use of Wetland, Ministry of Education, Yangtze University, Jingzhou 434020, China
2
College of Agriculture, Yangtze University, Jingzhou 434025, China
3
Jiangxi Institute of Red Soil and Germplasm Resources, Nanchang 330000, China
4
Institute of Soil and Water Conservation and Eco-Environment, College of Resources and Environment, Southwest University, Chongqing 400715, China
*
Author to whom correspondence should be addressed.
These authors contributed equally to this work.
Agronomy 2023, 13(5), 1310; https://doi.org/10.3390/agronomy13051310
Submission received: 27 March 2023 / Revised: 19 April 2023 / Accepted: 27 April 2023 / Published: 6 May 2023

Abstract

:
Tillage practices significantly influence soil nutrient retention, soil structure, and stability. However, the impact of tillage practices on soil stability and erosion resistance through the perturbation approach of soil structure remains unclear. This study aimed to establish universal principles across slope surface and soil profile scales. We evaluated the effects of various tillage practices, including conventional tillage (CT), soil compaction (CM), subsoil tillage (ST), no tillage (NT), and subsoil tillage and soil compaction (SCM) on soil stability and erosion resistance in China’s red soil hilly region. Soil stability, erosion resistance, and other soil properties were quantified using field surveys and laboratory experiments. We discovered significant variations in soil aggregate stability (SAS), wet aggregate stability (WAS), soil mechanical stability (SMS), and soil erodibility (SE) among the five tillage methods. The K factor’s average value indicated that the 0–40 cm soil layer was more erodible for CT (0.472) than for other methods, with NT (0.26) being the least erodible. NT (0.43) was the most effective treatment for reducing SE, while SCM (0.41) enhanced soil fertility, controlled SE, and mitigated machinery-induced soil compaction risks. CM (0.38) maintained soil stability without improving the soil nutrient storage, while ST (0.33) improved the soil stability such as alleviating the soil hardening caused by CM. The results provide reference parameter values for selecting appropriate tillage methods to decrease soil degradation and erosion while enhancing the soil productivity in a red soil hilly region.

1. Introduction

As the main type of cultivated land resource in China, sloping farmland accounts for 35.09% of the national cultivated land area, and the soil erosion occurring in sloping farmland contributes the most to the total soil erosion area, with a percentage of 28.3% [1]. Sloping farmland will remain an important production base for grain and agricultural products in China for a considerable period in the future [2]. Therefore, it is urgent to prevent soil erosion in sloping farmland, and environmental issues resulting from soil erosion have garnered increasing attention.
Soil aggregates are fundamental units for preserving soil stability and are essential to consider when repairing soil degradation caused by soil erosion in cultivated land [3,4]. Soil aggregates are usually a process of small particles slowly developing into large particles [5]. When large aggregates are destroyed, soil is more easily eroded [6]. Soil aggregate stability (SAS) has been increasingly considered as a critical indicator of sensitivity to water erosion [7,8]. Wet aggregate stability (WAS) is crucial for maintaining adequate pore space for water infiltration and storage in soil. Soil mechanical stability (SMS) characterizes the soil’s resistance to the destructive actions of wetting, rainfall, and agricultural cultivation [9]. Thus, the extent to which soil aggregates are destroyed depends on the strength of the cohesive forces that hold soil particles together and the magnitude of the external destructive force during operation. Overall, when the destructive force is greater than the cohesive force, the soil aggregate will disintegrate, the runoff increases, and the possibility of soil degradation under erosion becomes imminent. SAS, WAS, and SMS are important indicators of soil stability on sloping farmland [9] to resist soil erosion and mechanical external force damage. Additionally, they reduce the rate of aggregate disintegration and promote crop production, directly by soil erosion and change in soil quality [10,11]. Rational tillage should therefore promote the soil stability in response to the disruption due to soil erosion and intensive farming and to reduce soil loss from hillside farmland. Currently, research on soil stability generally focuses on one aspect: soil aggregate stability or moisture retention in soil aggregates. Therefore, the mechanical stability of the bonding between soil aggregates as a whole of the soil profile has not been fully investigated, and we have solved this problem in this study.
Soil tillage is the most important activity in agricultural crop production, and directly impacts soil stability and erodibility. Suitable tillage can significantly improve soil aggregation, promote crop root growth, and assist in the control of soil erosion [12]. Differences in soil structure due to different tillage practices have been shown to affect the aggregate distribution, gas diffusion, and the transformation of organic matter [13]. Portella et al. [14] observed the changes in the aggregate stability index, mean weighted diameter, and the mean geometric diameter due to tillage practices. CT accelerates soil mineralization, loss of soil organic matter (SOM) [15], as well as decreases the SAS, increases clay content, and intensifies nutrient loss [16,17]. NT is a little affected by agricultural machinery, its surface is relatively undisturbed, and crop residue on the surface increases the SOM content, which is conducive to forming soil aggregates [3], but the change from CT to NT leads to soil compaction [18]. Tillage can both disrupt and compact soil and thus affects the soil structure, particularly with regard to the occurrence, distribution, and geometry of pores. It can also alter soil hydraulic properties, which is a particular concern as the use of heavy machinery in tillage has rapidly increased recently [19]. Long-term mechanical compaction degrades the soil in the tillage layer by thinning the soil and reducing the soil infiltration and decreasing moisture retention [20,21,22]. Ekelof et al. [23] showed that ST reduced the surface soil bulk density by 17.1%, significantly increasing the number of stable aggregates by 30.7%. The most direct effect of tillage practices on soil is to change the soil aggregate composition and so alter the soil profile [24].
Red soil sloping farmland is one of the important cultivated land resources in the hilly region of southern China, which also faces with serious soil erosion, nutrient degradation, thinning of the arable layer, soil fertility decline, and deterioration of the ecological environment. In order to control soil stability and create a rational cultivated-layer in the red soil, it is important to understand the effects of tillage measures on soil stability and erodibility. The specific goals of the study were: (1) to analyze the effects of different tillage methods on SAS, WAS, and SMS; (2) to identify and quantify the changes in soil erodibility in response to different tillage methods; and (3) to identify the best tillage practices to maintain soil stability and resist soil erosion. The results will provide a baseline for determining the suitable tillage to restore the quality of eroded soil and increase soil erosion resistance to promote the sustainable utilization of sloping farmland in hilly areas.

2. Materials and Methods

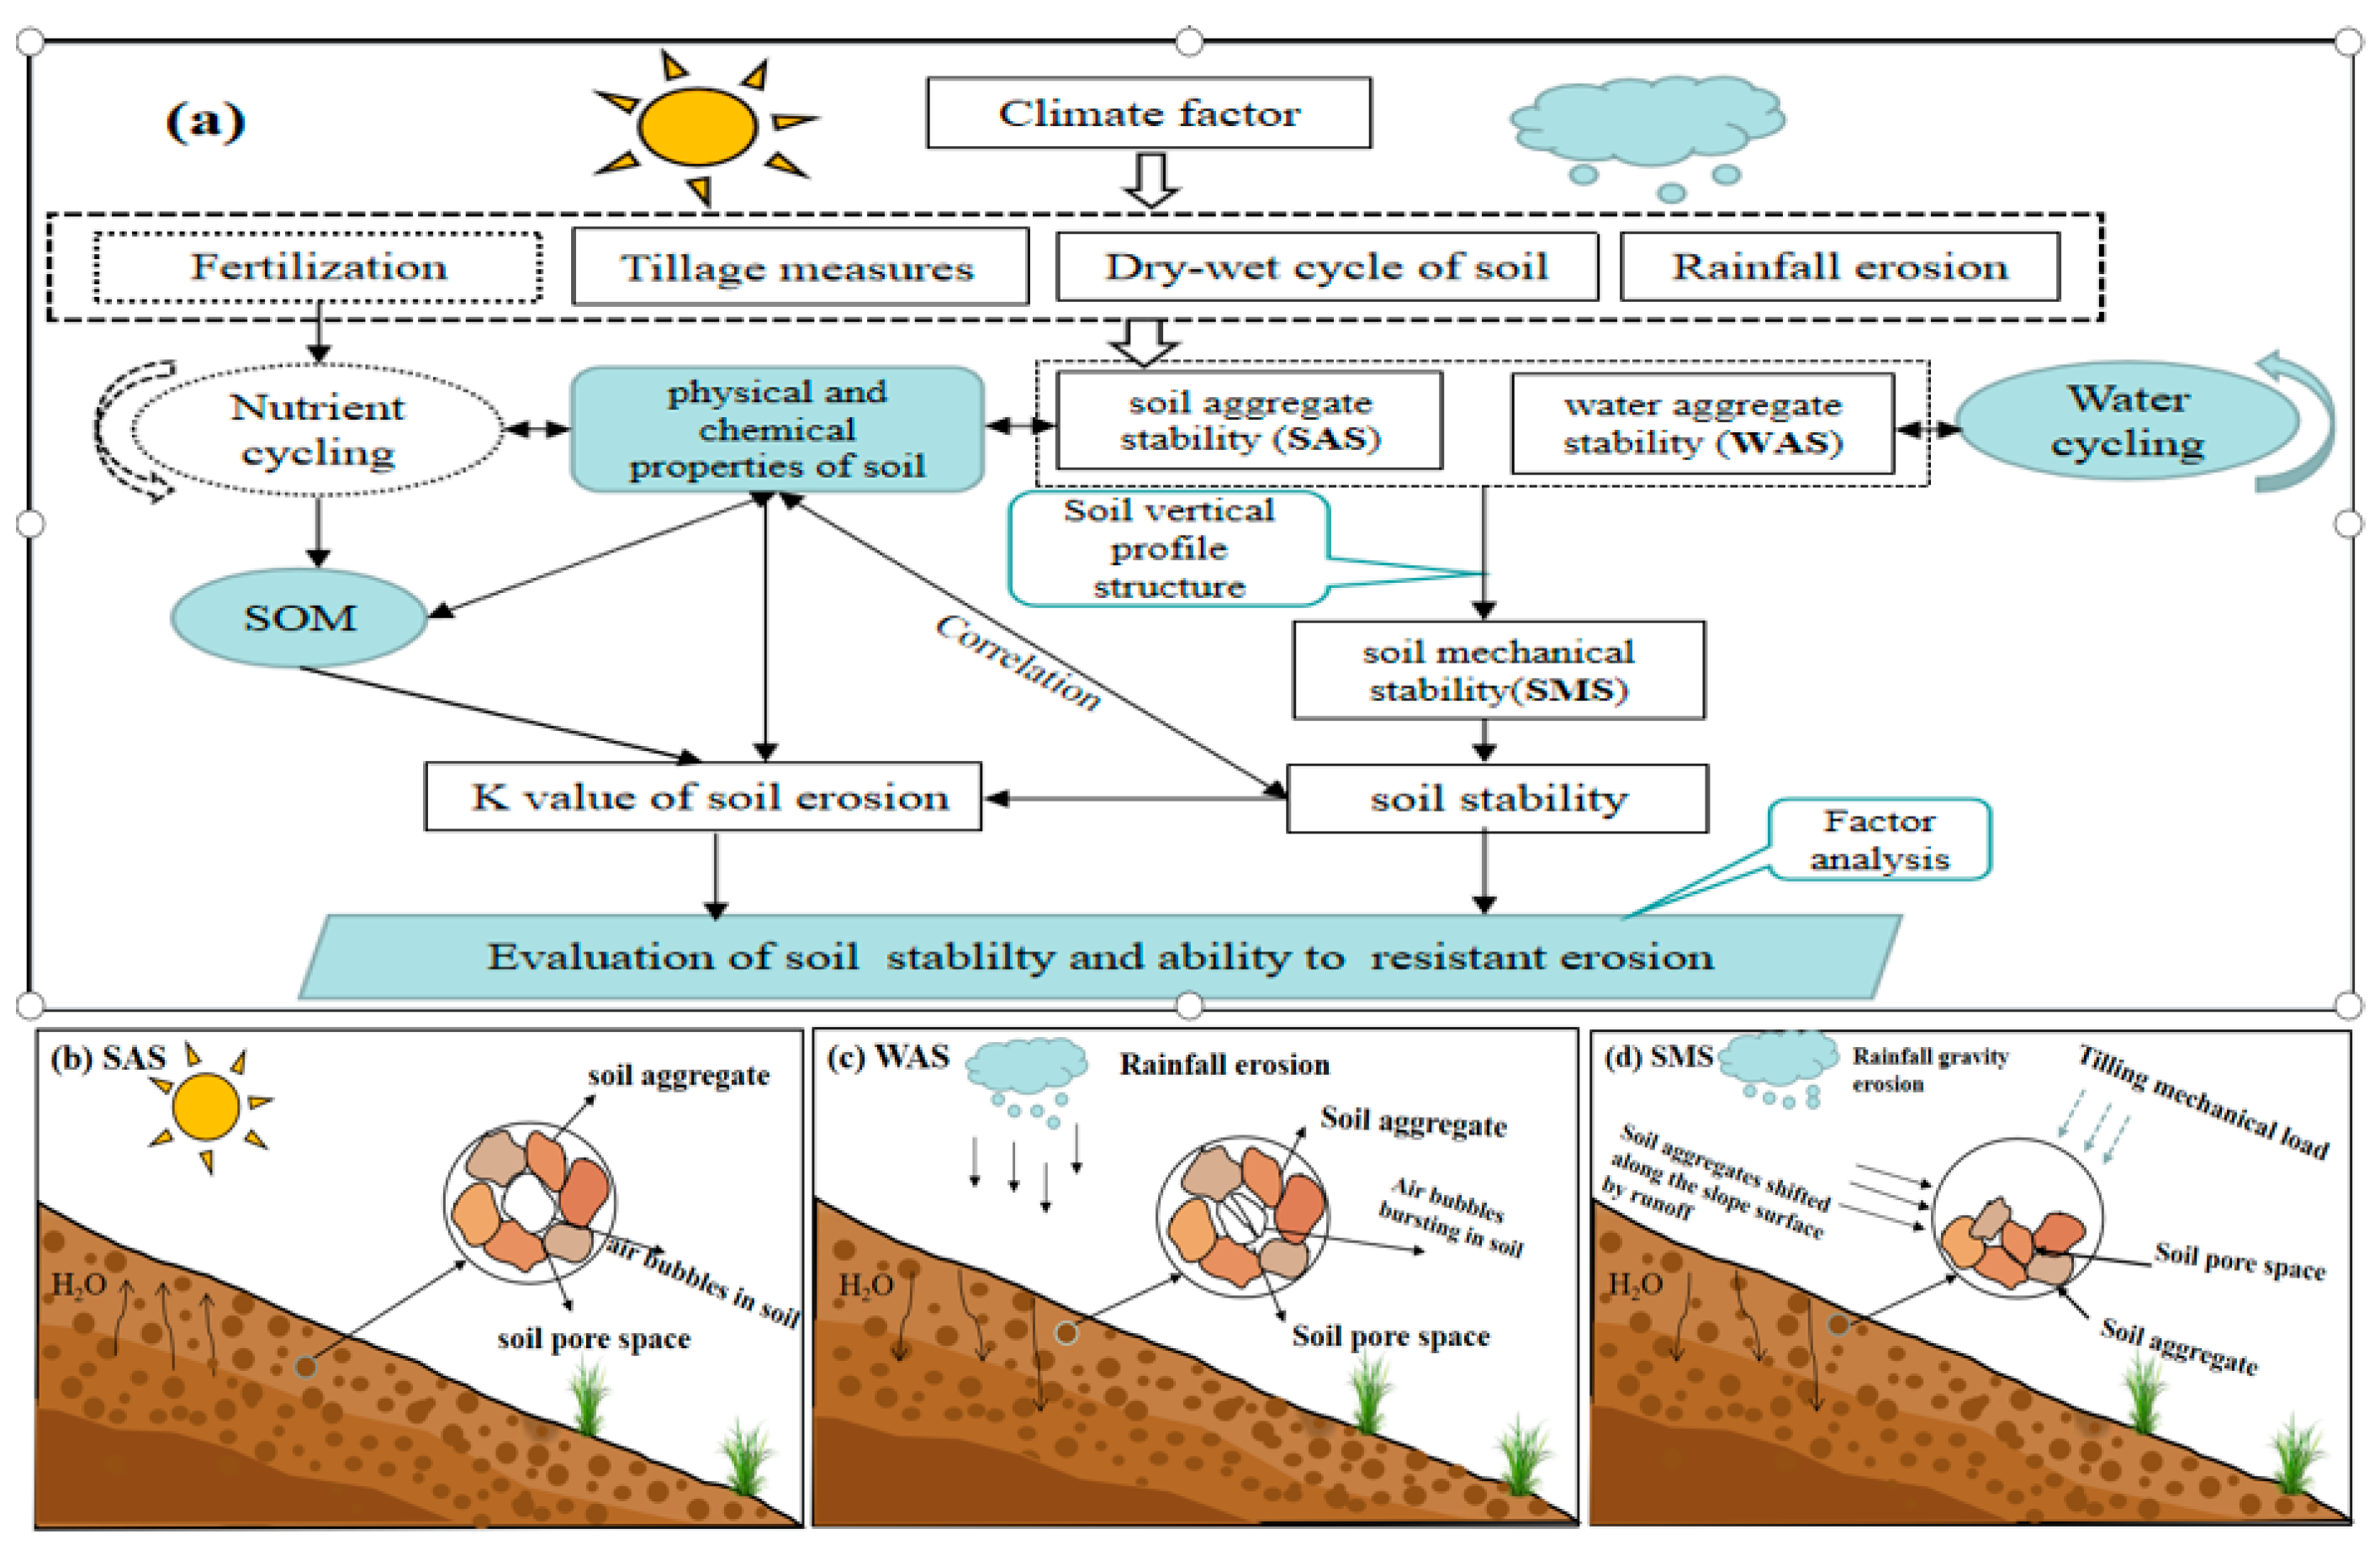
2.1. Research Strategy

The flowchart for quantifying tillage methods in terms of soil stability and erosion resistance (SSE) on sloping farmland is shown in Figure 1. Scientifically based fertilizer application is important for soil stability and erosion resistance; its determination has not been included in this study, and will become the focus of future research.

2.2. Study Area

The experimental soil management plot (28°19′29.7″ N, 116°08′4.8″ E) was in Jinxian County, Nanchang City, Jiangxi Province, China (Figure 2), and the watershed area was 41.21 km2. The region has a subtropical monsoon climate with a mean annual rainfall of 1587 mm. Annual evaporation is 1100–1200 mm. The mean annual temperature is 17.7–18.5 °C, the frost-free period is 282 d, and sunshine hours are 2200–2550 h. The landform is predominantly low hilly land. The gradient of the sloping farmland is approximately 5°. The soil type is quaternary period red clay loam that developed from the parent material of granite and is classified as ferroaluminous soil according to the World Reference Base for Soil Resources (WRB). The soil is mainly prismatic or blocky and is characterized by a deep tight structure, heavy texture, and low permeability (Table 1, Figure 2e).

2.3. Tillage Method Experiment

The experimental plots were defined in 2015, and the soil samples were collected on 15 March 2015 before the start of the experiment. To prepare the plots, a Dong Fang Hong tractor (Model LX754) from the Nanjing Agricultural Mechanization Research Institute in China was utilized. For detailed information on the tractor’s composition and technical specifications, please refer to the following webpage: https://www.nongjitong.com/product/7839.html accessed on 16 April 2023. Five tillage methods (CT, CM, ST, NT, and SCM) were each used on four plots of area 16 m2 (2 m × 8 m), giving a total of 20 experimental plots (Table 2, Figure 3). The planted crops were annually rotated peanuts (strain Yue you.933) and sweet potato (strain Su shu.8). Initial fertilizer application and ground topography were the same for each plot. The local standard fertilizer application was N at 118 kg/ha, P2O5 at 45 kg/ha, and K2O at 180 kg/ha, and was applied in the base: the growing season ratio was 7:3. Base fertilizer was applied before tillage, and top dressing was applied before the first flowering of peanuts or during the sweet potato stem and leaf growth period. The first crop of peanuts was planted at 33 cm × 15 cm, with seeds sown in early April and harvested in mid-August. Sweet potato seedlings were transplanted in rows in late May at 50 cm × 40 cm and harvested in early November.

2.4. Soil Sampling and Basic Chemical and Mechanical Analysis

Soil was sampled on 6 July 2018 before the sweet potato harvest after 3 y. The maximum tillage depth during the experiment was 30 cm, but tillage may have affected the soil below the 30 cm depth, so we sampled the soil in layers at depths of 0–10 cm, 10–20 cm, 20–30 cm, and 30–40 cm. Soil profiles were excavated in the middle of each test plot, and three cutting rings (100 cm3) were collected from each layer (four layers) to measure BD and SHC; SC and SS were measured in each layer five times. Mixed soil samples (five-point method) were collected from the same soil layer in the three plots of the same tillage method and then placed in separate plastic boxes (20 cm × 10 cm × 5 cm) for the determination of soil aggregate, wet aggregate characteristics, soil organic matter (SOM), total nitrogen (TN), available phosphorus (AP), and available potassium (AK). Test methods of soil property indexes are shown in Table 3.

2.5. Sample Analysis

The samples in plastic boxes were taken to the laboratory and naturally air dried. They were stripped into aggregates of about 10 cm in depth according to their original layering, and coarse roots and plant impurities were removed from the soil samples.

2.5.1. Dry Sieving

Samples of 500 g were weighed by quartering and placed in the electric vibrating screen machine (Model 8411, Hangzhou, Sansi Instrument Company, China). They were dry sieved at 0.5 Hz. After 10 min, the 10 mm, 7 mm, and 5 mm sieves were removed. The remaining sieves were shaken for another 5 min. We obtained aggregate distributions across the categories <0.25 mm, 0.25–0.5 mm, 0.5–1 mm, 1–2 mm, 2–3 mm, 3–5 mm, 5–7 mm, 7–10 mm, and >10 mm. The dry sieve aggregates in each diameter class were weighed and the percentage distribution was calculated. The weight of soil aggregates with the particle size < 0.25 mm was calculated as the difference between the total weight of the soil samples and the total weight of soil aggregates with a >0.25 mm particle size.

2.5.2. Wet Screening

Identical 50 g soil samples were constituted from the different aggregate fractions in the proportions identified by dry sieving, and water stable aggregates of different sizes were obtained according to the standard of Dou [12] by the soil aggregate analyzer (Topyunon TPF-100). The different fractions of soil aggregates and water-stable aggregates were combined to calculate the fractal dimension of soil aggregates (FDAs), the rate of soil structural damage (RSD), and soil erodibility (K factor) by the equations described in the following section.

2.6. Data Analysis

2.6.1. Fractal Dimension of Soil Aggregates

The fractal dimension of the soil aggregates primarily indicates the composition characteristics of the soil aggregates. A higher fractal dimension of soil aggregates implies finer particles and a coarser surface of soil aggregates.
M ( r < x i ¯ ) M T = x i ¯ x max 3 D
Take the logarithm of both sides of Equation (1) to obtain Equation (2):
lg M ( r < x i ¯ ) M T = ( 3 D ) lg x i ¯ x max
where x i ¯ is the mean diameter of the aggregate particles in size category i, mm; M ( r < x i ¯ ) is the mass of aggregate particles with diameter < x i ¯ , g; M T is the total mass of the aggregate, g; and x max is the maximum diameter (i.e., the mean diameter of particles in the largest size category) of the aggregate, mm. Equation (2) was used to fit the test data to obtain FDA.

2.6.2. Characteristic Parameters of Soil Aggregate Composition

The characteristic parameters of aggregate composition mainly analyze the distribution and grouping characteristics of the soil aggregates of various sizes.
Standard deviation:
σ = 1 100 i = 1 n x i x ¯ 2 f i
Bias coefficient:
C s = σ 3 1 100 i = 1 n x i x ¯ 3 f i
Peak convex coefficient:
C E = σ 4 1 100 i = 1 n x i x ¯ 4 f i 3
where x i is the median diameter of the aggregate particles in the size category i; x ¯ is the mean diameter of all aggregate particles; and fi is the mass proportion of the total aggregate in size category i. When both CS = 0 and CE = 0, the diameters of most aggregate particles are close to average, and there are fewer particles in the tails of the distribution. When CS > 0, the distribution of the particle size is skewed towards larger particles (a positively skewed distribution). The aggregate particles typically have a large diameter and are strongly aggregated. When CS < 0, the result is reversed. When CE < 0, the distribution of soil aggregates is platykurtic, which indicates that the distribution is balanced and has a narrow range with no predominant size category, and when CE > 0, the result is reversed.

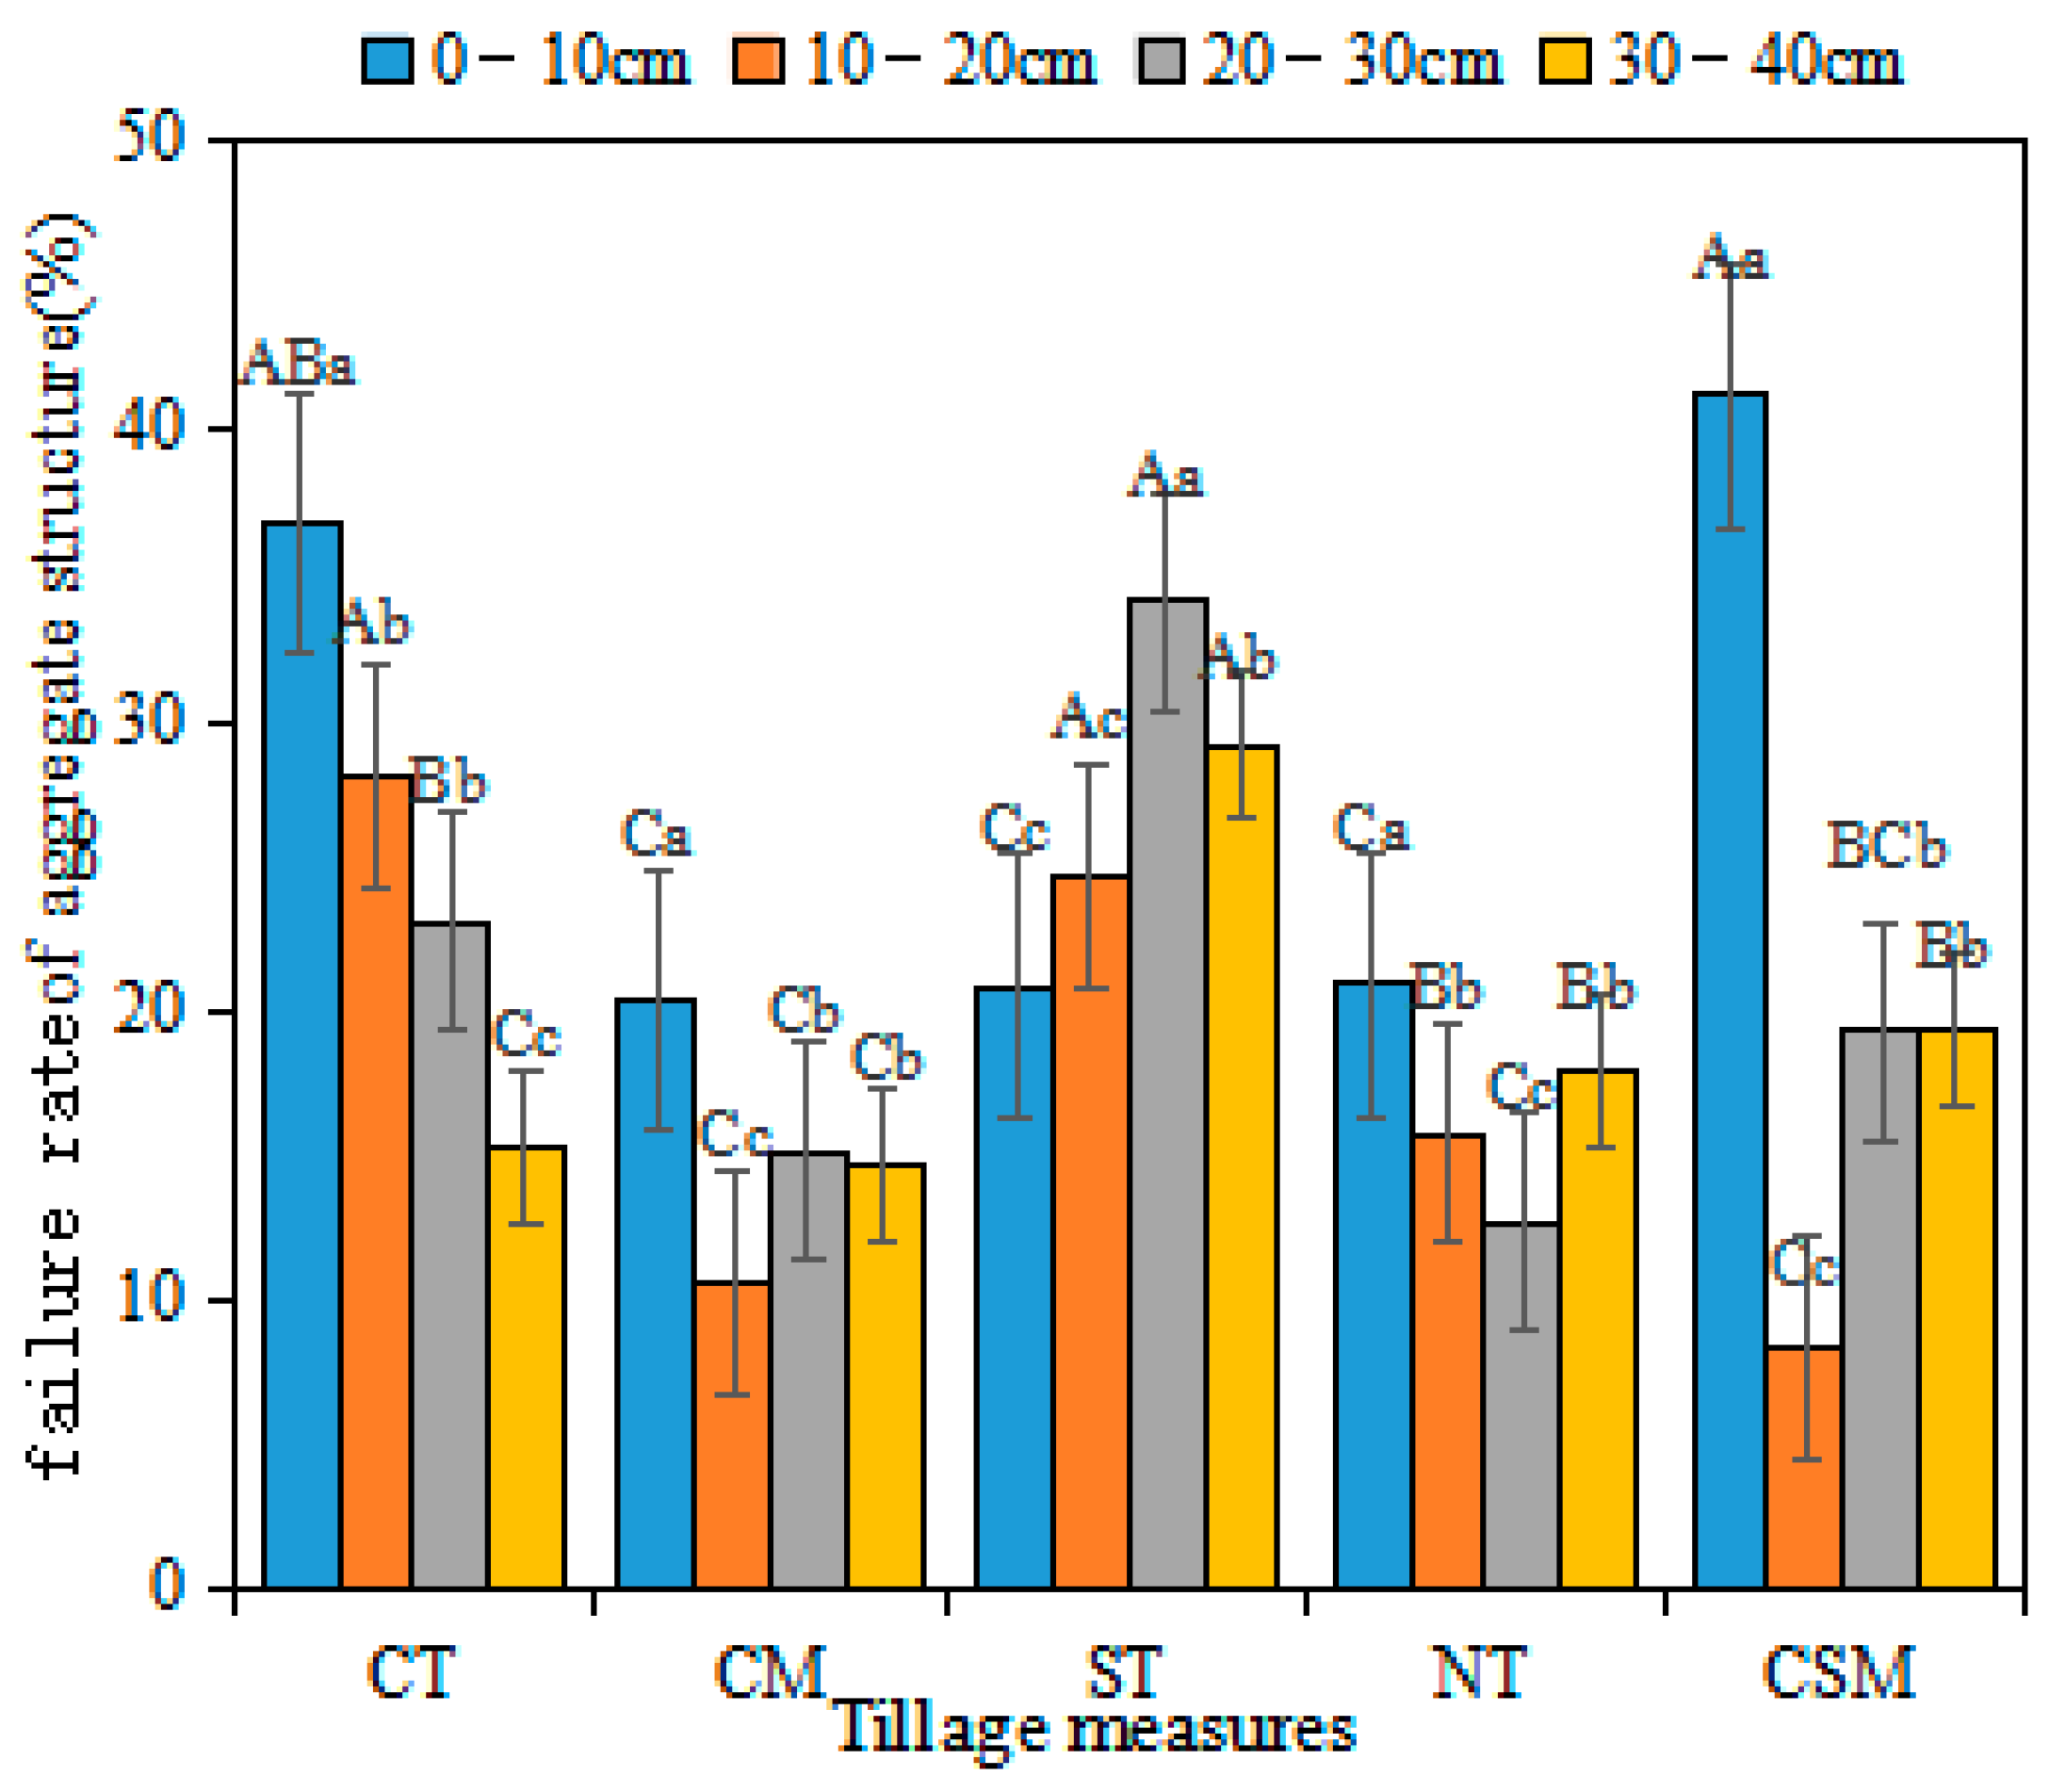
2.6.3. Rate of Structural Damage to Soil Aggregates

The rate of structural damage to soil aggregates primarily assesses the extent and proportion of damage to the soil aggregates. A higher value indicates a greater degree of damage to soil aggregates.
R S D = > 0.25   mm   Aggregate   content ( Dry   sieve Wet   sieve ) aggregate   content   with   dry   sieve ( > 0.25   mm ) × 100 %

2.6.4. Aggregate Stability Index

Assuming that the percentages of the air-dried aggregate distributed in the size categories i constitute an input matrix M:
M = { M 1 , M 2 , M 3 , M 4 , , M i }
The water stability of the aggregate is determined after wet sieving. The percentages of particles distributed in the size category i constitute an output matrix N:
N = { N 1 , N 2 , N 3 , N 4 , , N i }
The theory of soil aggregate formation holds that, over a long period, small aggregates form large aggregates consisting of clay particles, organic materials, and inorganic colloids through cementation. We formed the following alternative hypotheses:
(1)
In the process of aggregate screening, large aggregates are granulated to form small aggregates, and the combination of small aggregates to form large aggregates is an impossible event.
(2)
When the large aggregates are sieved to collect small aggregates, it is assumed that they can only be decomposed into particles in the next lower size category. After multiple cycles of continuous screening, such an effect will be observed.
(3)
All aggregate particles have the same probability of being fractured, whether a particle is in a particular category when sieving is initiated or whether it results from the fracturing of a particle of larger size.
If the aggregate sieve sizes are ordered 1, 2, 3, 4, …, i, the preservation probability that a particle larger than the sieve size remains in the sieve at the time of screening is x1, x2, x3, x4, …, xi, and the fracture probability that a particle will be fractured and pass through the sieve is 1 − x1, 1 − x2, 1 − x3, 1 − x4, …, 1 − xi. Then, the following relationships can be established between M i and N i :
M 1 X 1 = N 1 M 1 ( 1 X 1 ) X 2 + M 2 X 2 = N 2 M 1 ( 1 X 1 ) ( 1 X 2 ) X 3 + M 2 ( 1 X 2 ) X 3 + M 3 X 3 = N 3 M 1 ( 1 X 1 ) ( 1 X 2 ) ( 1 X i 1 ) X i + M 2 ( 1 X 2 ) ( 1 X i 1 ) X i + + M i N i = N i
Equation (9) is converted into the matrix form as:
X 1 0 0 0 ( 1 x 1 ) x 2 x 2 0 0 ( 1 x 1 ) ( 1 x 2 ) x 3 ( 1 x 2 ) x 3 x 3 0 0 ( 1 x 1 ) ( 1 x 2 ) ( 1 x i 1 ) X i X i M 1 M 2 M 3 M i = N 1 N 2 N 3 N i
If:
X = X 1 0 0 0 ( 1 x 1 ) x 2 x 2 0 0 ( 1 x 1 ) ( 1 x 2 ) x 3 ( 1 x 2 ) x 3 x 3 0 0 ( 1 x 1 ) ( 1 x 2 ) ( 1 x i 1 ) X i X i
then:
XM = N
and:
A S I = x 1 + x 2 + x 3 + x 4 + + x i
where the matrix X is a transfer matrix. The air-dried and water stability aggregates are linked by the preservation probability and the fracture probability. If the preservation probability of a certain particle size is greater than the fracture probability, then the aggregates of this particle size are more resistant to fracturing and have greater stability during energy transmission in the wet sieve test.

2.6.5. K Value of Soil Erodibility

Soil erodibility, defined as the propensity of soil to undergo erosion, is a crucial factor in soil conservation and management. The K factor is commonly used to quantify soil erodibility, with higher values indicating greater susceptibility to erosion by wind or water.
k = 0.2 + 0.3 exp 0.0256 S a 1 S i 100 S i C i + S i 0.3 1 0.25 C C + exp ( 3.72 2.95 C ) 1 0.75 S n S n + exp ( 5.51 + 22.9 S n )
where S n = 1 S a / 100 ; S a is the sand content of the aggregate (2–0.05 mm), %; S i is the silt content (0.05–0.002 mm), %; C i is the clay content (<0.002 mm), %; and C is the organic carbon content (soil organic matter content/1.724 as organic carbon content), %.

2.6.6. Comprehensive Evaluation of Soil Stability and Erosion Resistance

SPSS 21.0 was used to analyze the difference in the soil properties, and the FDA, RSD, ASI, SS, SC, and K factor values of different tillage methods were obtained by ANOVA. Specifically, Pearson correlation analysis was utilized to assess the correlations between the percentage of soil indicators. Moreover, the comprehensive scores of soil aggregate stability and erodibility were obtained by utilizing the factor analysis method in the SPSS software, based on the 14 aforementioned soil indicators. The common factors (F1, F2, F3, and F4) were calculated using factor scores for these indicators in SPSS. The weight of each factor connected with all related factors was used to calculate the F score of each tillage method to obtain the value of soil stability and erosion resistance.
F1 = 0.318X1 − 0.127X2 + 0.029X3 + 0.16X4 + 0.081X5 + 0.045X6 + 0.037X7 − 0.167X8 − 0.024X9 + 0.037X10 − 0.039X11 + 0.259X12 + 0.302X13 − 0.067X14
F2 = 0.121X1 + 0.12X2 + 0.064X3 + 0.104X4 + 0.335X5 + 0.335X6 + 0.28X7 + 0.105X8 − 0.014X9 − 0.096X10 + 0.087X11 + 0.048X12 + 0.031X13 + 0.031X14
F3 = 0.095X1 + 0.058X2 + 0.135X3 + 0.192X4 − 0.062X5 − 0.116X6 + 0.03X7 + 0.041X8 + 0.151X9 + 0.402X10 − 0.389X11 − 0.032X12 + 0.072X13 − 0.143X14
F4 = 0.015X1 + 0.073X2 − 0.421X3 + 0.138X4 − 0.073X5 − 0.05X6 + 0.13X7 + 0.12X8 + 0.163X9 − 0.179X10 + 0.172X11 − 0.008X12 − 0.037X13 + 0.427X14
and
F = 0.4085 F 1 + 0.2811 F 2 + 0.1897 F 3 + 0.1206 F 4
where F is the composite score of soil stability and erosion resistance, and 0.4085, 0.2811, 0.1897, and 0.1206 are the respective contribution weights of the four factors F1, F2, F3, and F4.

3. Results

3.1. Basic Physicochemical Properties of Soil for Different Tillage Methods

There were differences between the different tillage methods in the basic physicochemical properties of soil (Table 4). The average value of BD in the 0–40 cm soil layer produced by ST (1.32 g/cm3) was less than for other tillage methods. SHC for ST (4.35 mm/min) was significantly greater than for other tillage methods. It gradually decreased as the soil depth increased, and even reached 0 for CM and NT in the 20–40 cm layer. We attributed this to soil hardening. The average clay content for ST, CM, SCM, and NT was greater than for CT, respectively, by 18.35%, 10.94%, 23.83%, and 24.48%. The soil nutrient content for ST was significantly greater than for other methods, as shown by the average values of OM (12.06 g/kg), TN (0.93 g/kg), AP (45.51 mg/kg), and AK (328.15 mg/kg), which were greater than for CT, respectively, by 6.26%, 7.43%, 6.36%, and 43.4%. In comparison with CT, the soil nutrient content for CM and SCM was slightly less, which was mainly due to the decrease in soil porosity and the reduction in nutrient storage space caused by mechanical compaction. The soil nutrient content for NT was slightly greater, especially in the 0–20 cm soil layers, which was mainly due to residual surface mulching.

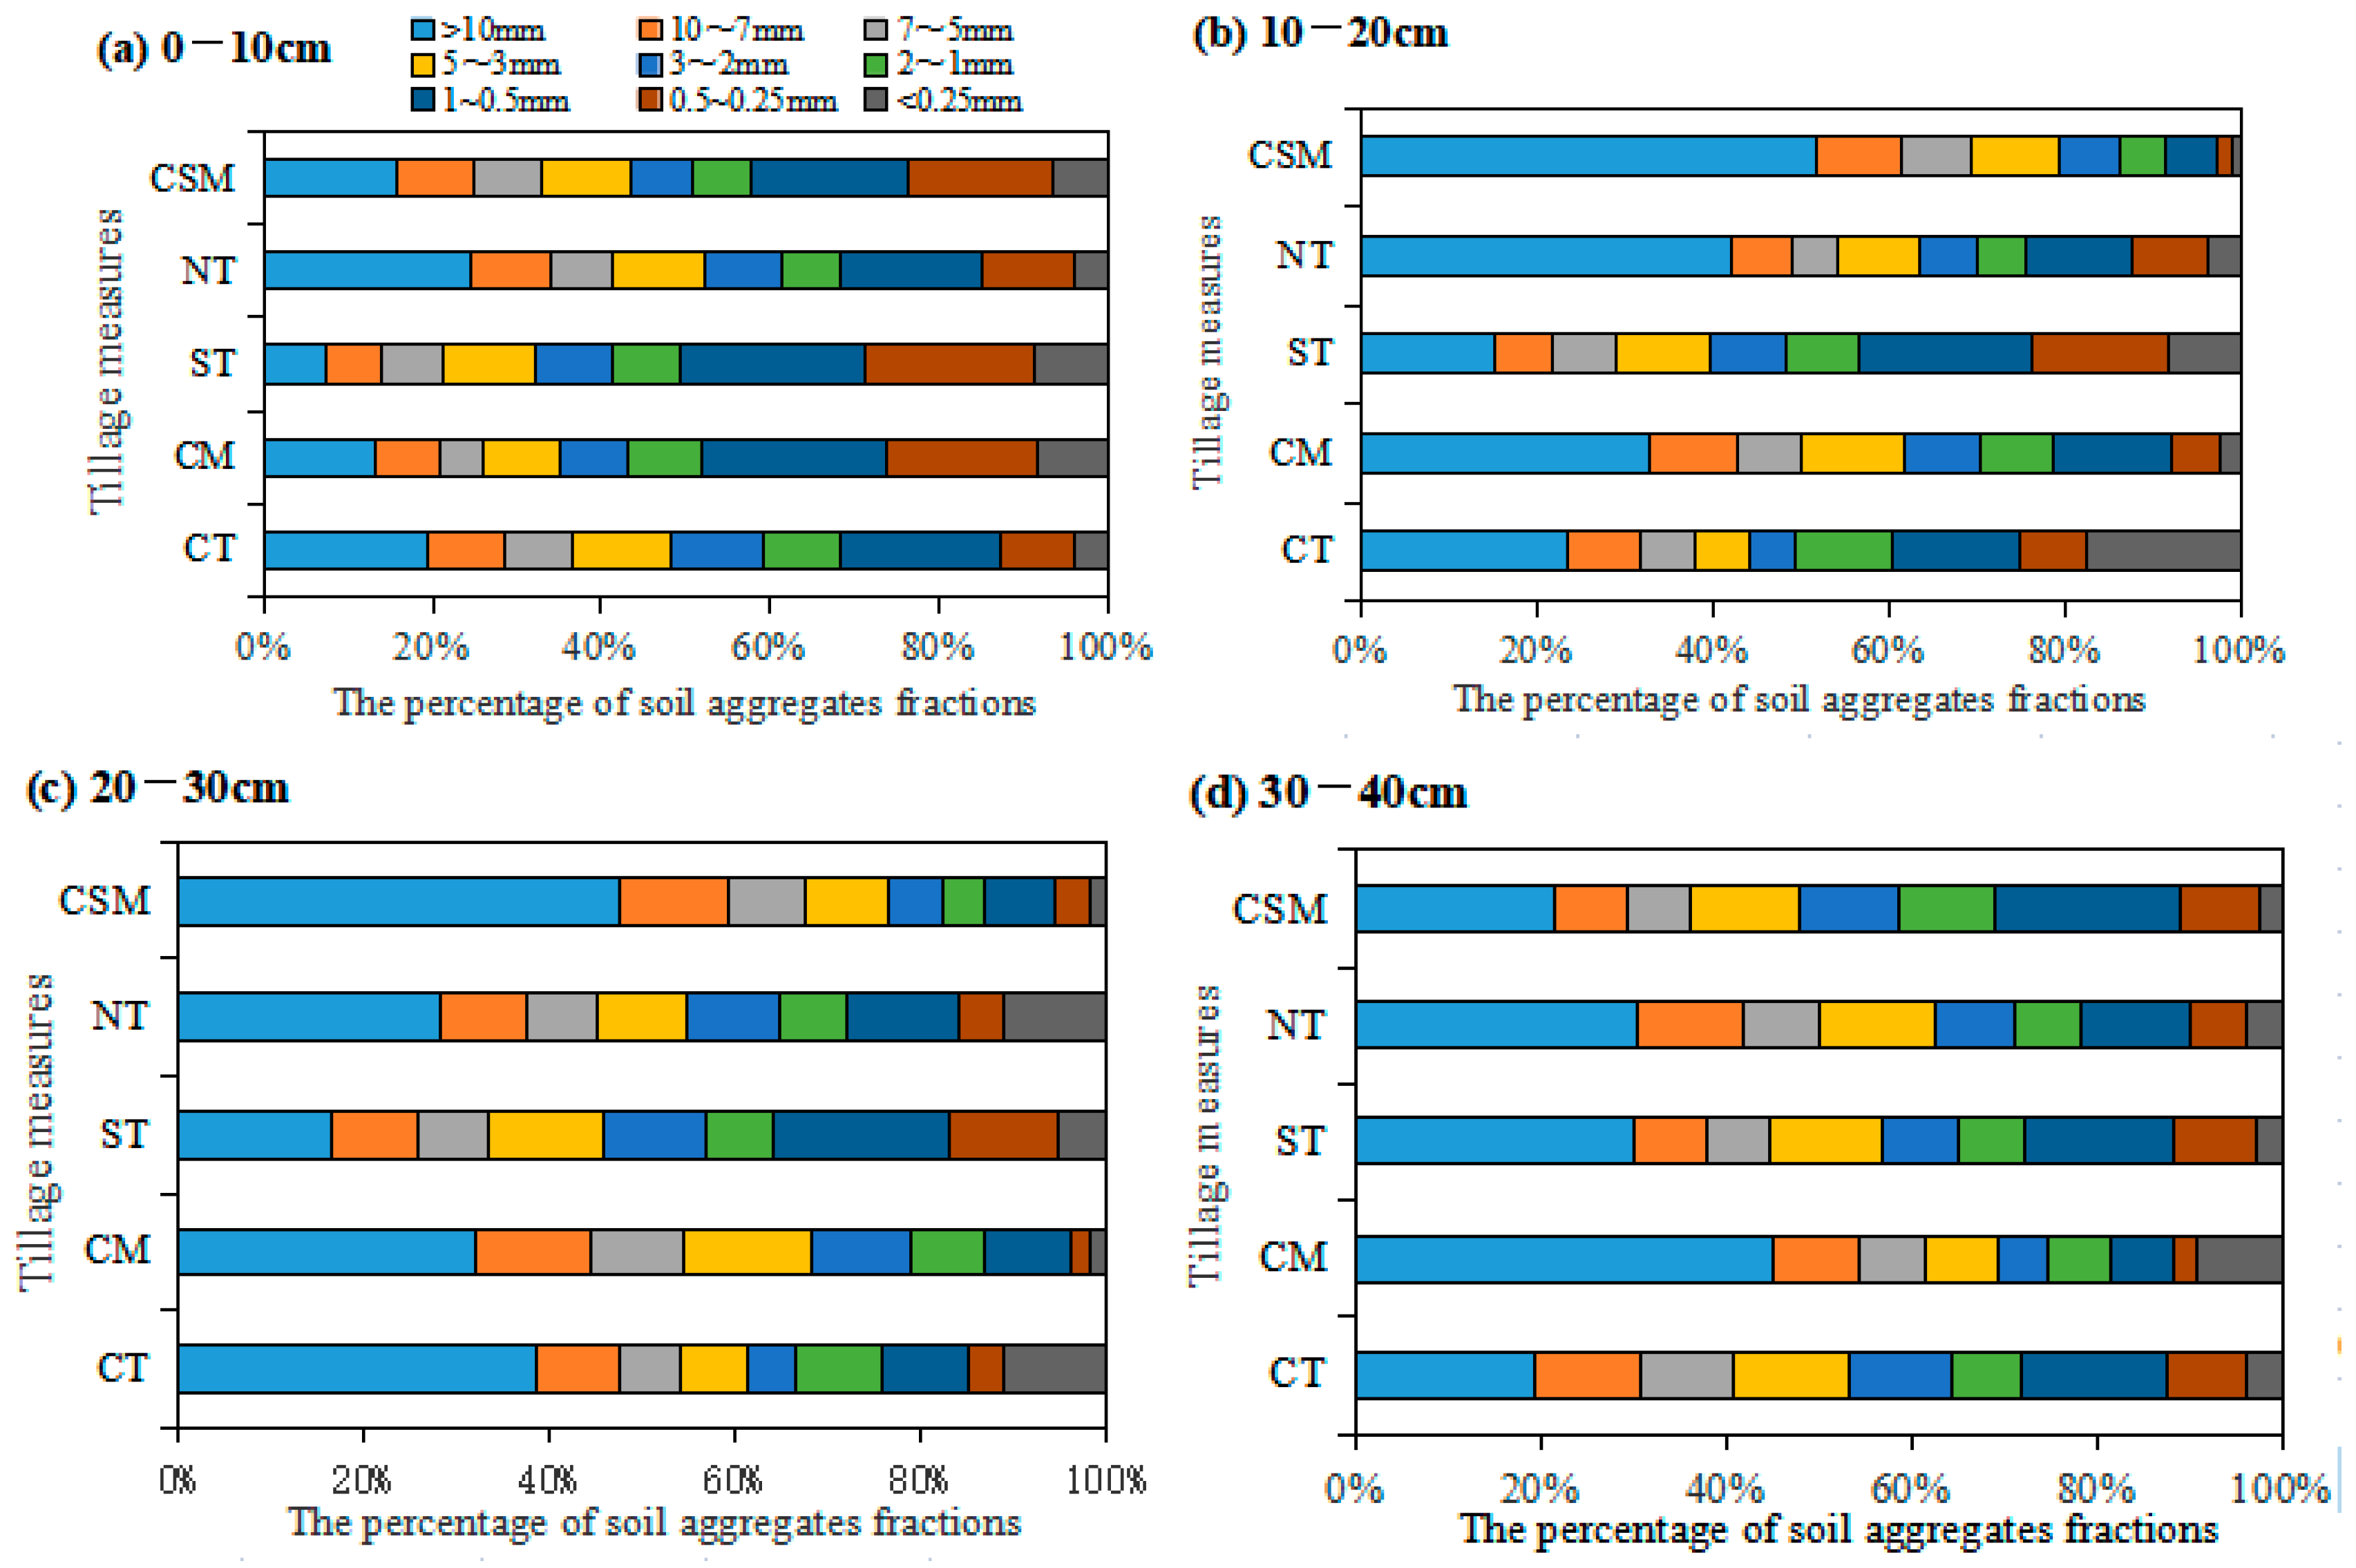
3.2. Characteristics of SAS for Different Tillage Methods

The composition of soil aggregates differed significantly across tillage methods (Figure 4). The average contents of particles with a diameter > 10 mm were ordered ST (17.33%) < CT (25.13%) < SCM (29.28%) < CM (30.74%) < NT (36.15%), and particles with diameters 7–10 cm and 5–7 cm were similarly ordered. However, particles with a diameter < 5 mm showed different orderings. The average contents of particles with a diameter of 0.5–0.25 mm were ordered ST (14.05%) > SCM (8.13%) > NT (7.32%) > CT (7.10%) > CM (6.97%), and those of particles with a diameter < 0.25 mm were ordered CT (9.13%) > ST (6.17%) > CM (5.45%) > SCM (5.17%) > NT (3.37%). The effectiveness of NT depends on the macro-aggregate, which varied with soil depth. The content of the particles with a diameter > 5 mm was 0–10 cm < 10–20 cm < 20–30 cm < 30–40 cm. A similar soil composition was observed for CT and SCM; it initially increased and then decreased. The content of particles with a diameter > 5 mm for ST and CM continually increased with depth. The aggregate content of particles with a diameter < 5 mm showed the opposite behavior.
Tillage disturbs the soil structure and alters the soil aggregate fractions. Our data suggest that the CS were ordered NT (−0.43) > CM (−0.53) > SCM (−0.56) > CT (−0.73) > ST (−0.86), which indicates that the soil aggregates mainly consist of medium or small particles <5 mm. The soil aggregate particle diameter and soil stability were the least for ST and the greatest for NT. The CE varied a little across tillage methods; it ranged from −1.54 to −1.72 and was not correlated with either the tillage method or soil depth (Table 5). The soil aggregate composition did not change significantly, mainly due to the small diameter of the soil particles and their even distribution. The mean values of FDA for the various tillage methods were ordered CT (2.37) > ST (2.31) > CM (2.23) > SCM (2.2) > NT (2.16). FDA decreased slowly as the soil depth increased for NT and ST and changed little between CT, CM, and SCM (Figure 5). The most influential factors that influenced this phenomenon were the tillage method and tillage depth.

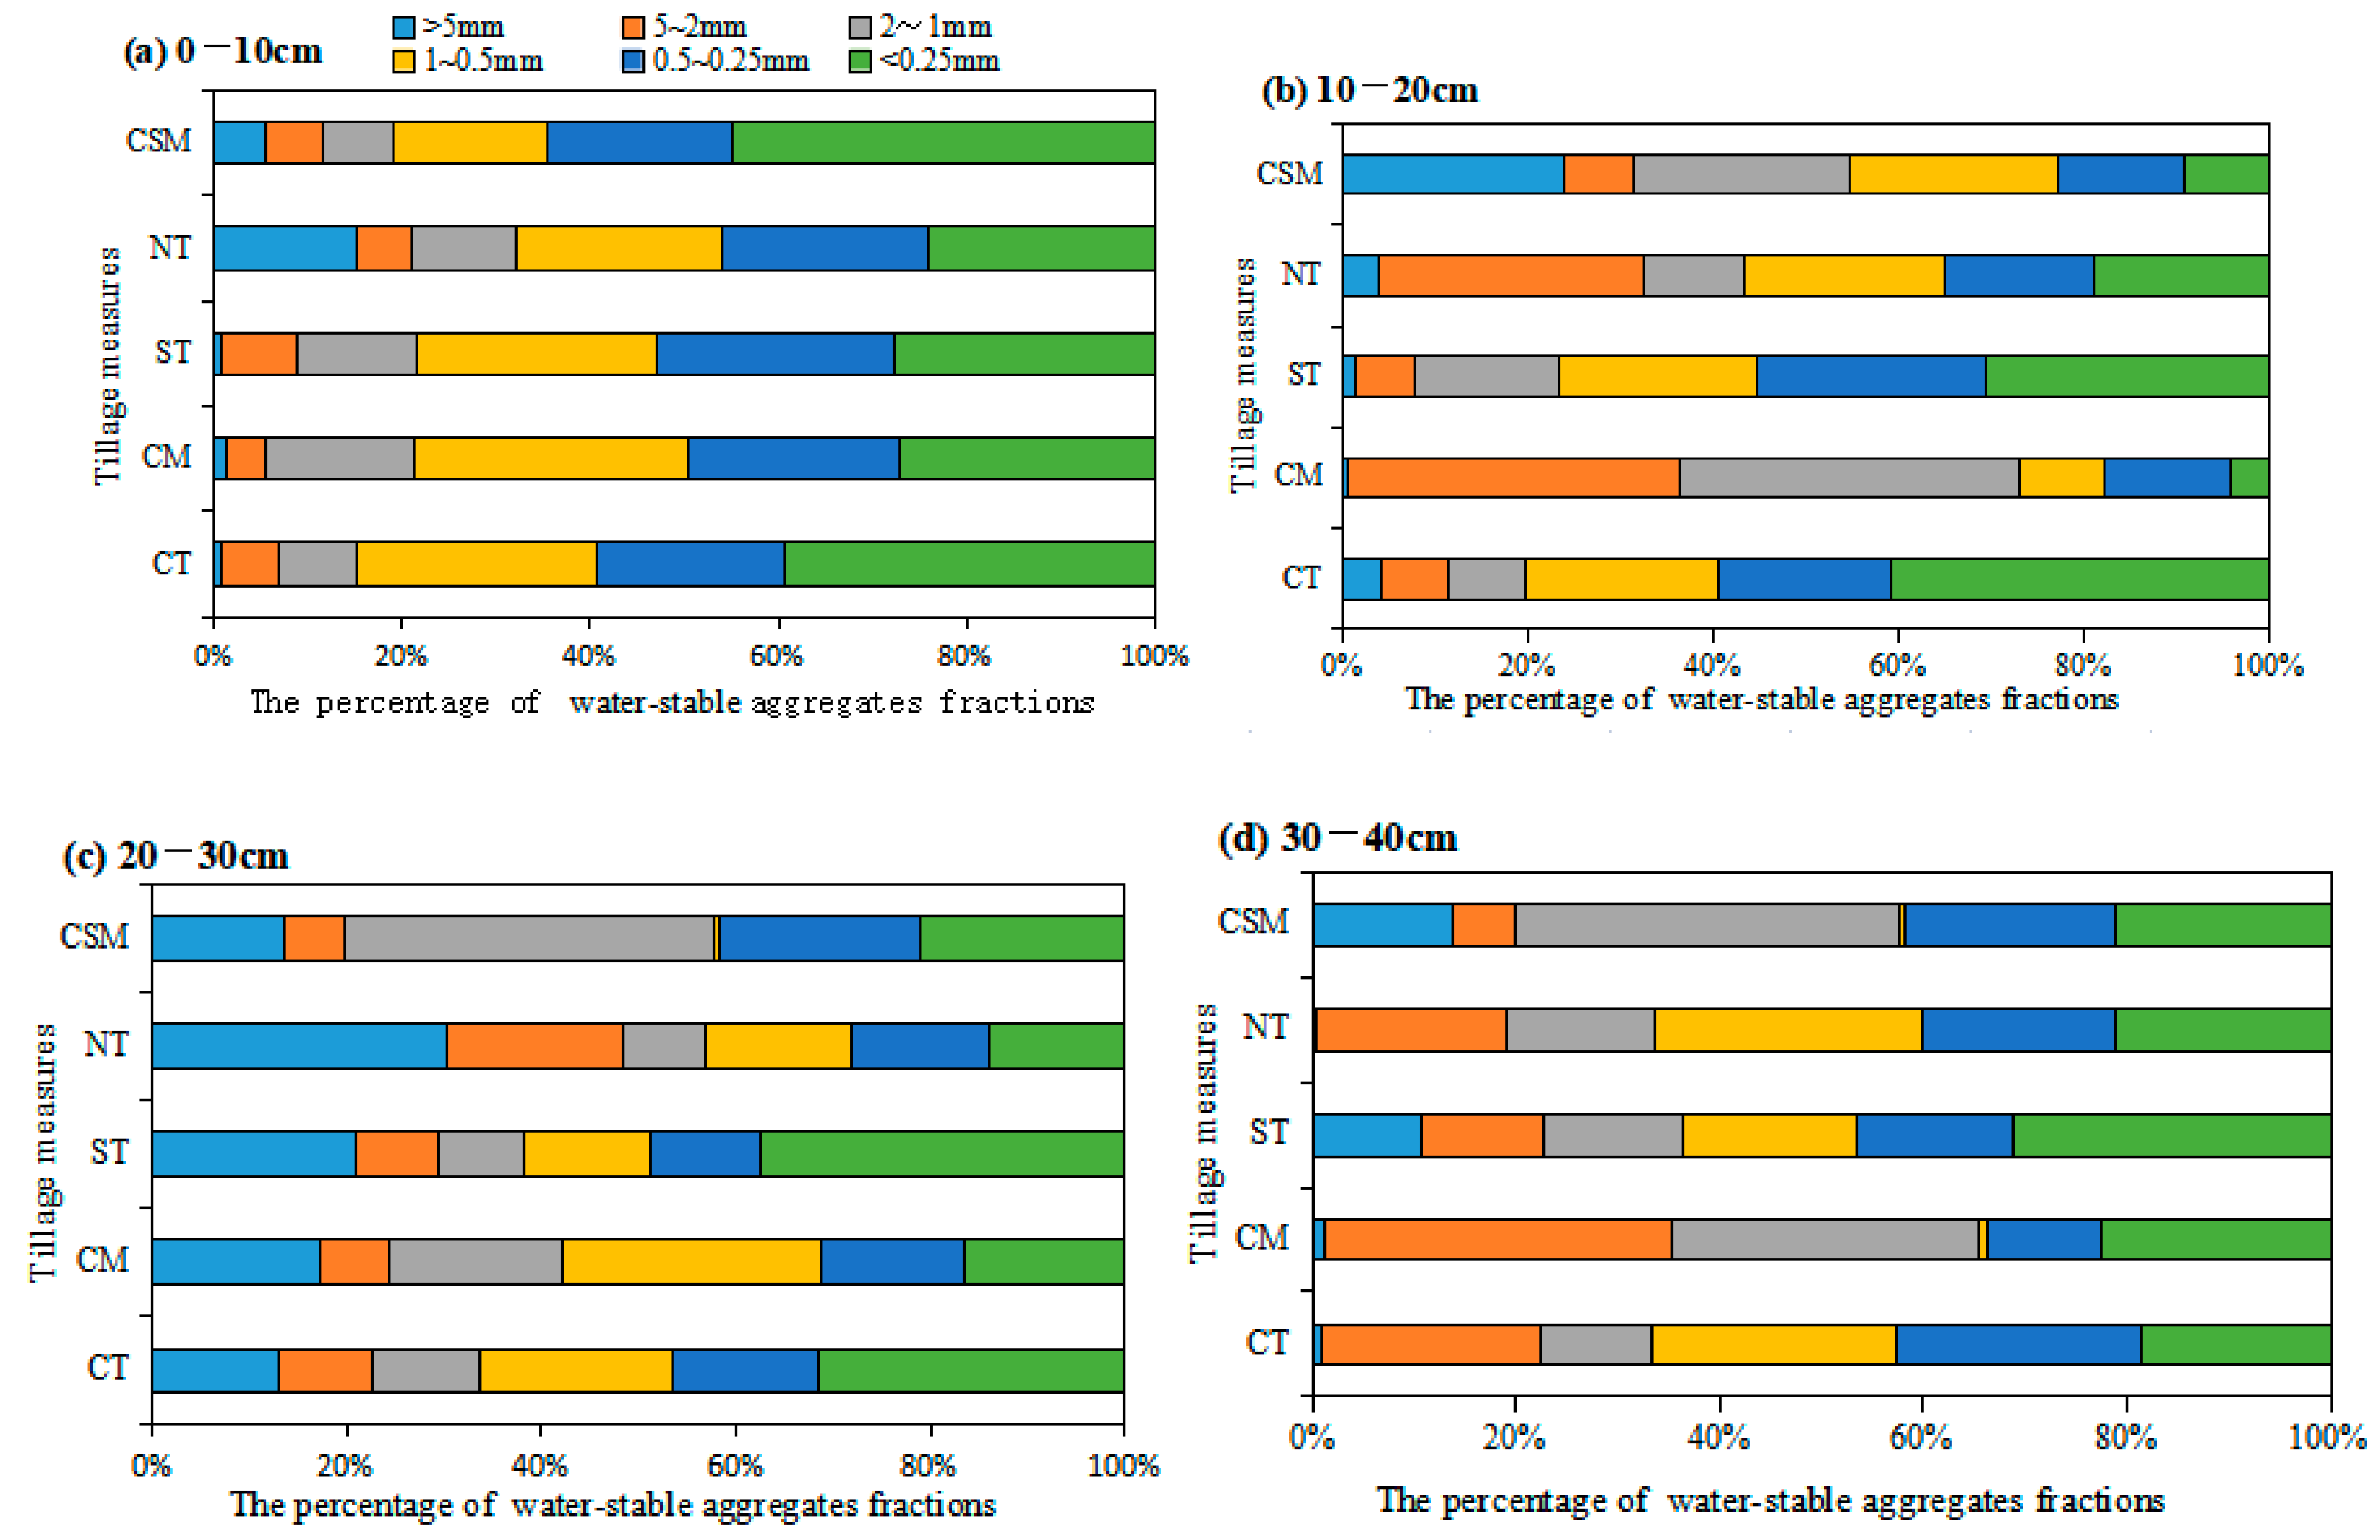
3.3. WAS for Different Tillage Methods

The proportion of water-stable aggregates in the soil differed significantly across tillage methods (Figure 6). The mean values for WAS particles with a diameter >5 mm were ordered CT (4.67%) < CM (4.99%) < ST (8.37%) < NT (12.43%) < SCM (13.65%). The maximum proportion of WAS particles with a diameter of 2–5 mm was 20.37% (CM), and the minimum was 8.84% (ST). The proportions of WAS particles with diameters of 2–1 mm, 1–0.5 mm, and 0.5–0.25 mm differed slightly across tillage methods. The proportions of WAS particles with a diameter of 0.5–1 mm were CT (22.45%) > NT (21.22%) > ST (19.24%) > CM (16.43%) > SCM (14.78%). The proportions of WAS particles with diameters of 1–0.5 mm and <0.25 mm were less for the tillage methods that included compaction than for other methods. The soils mainly contained WAS particles with diameters of 2–1 mm and 1–0.5 mm for different tillage methods.
The proportion of WAS clearly changed across tillage methods as the soil depth increased. The proportions of WAS in the 0–10 cm layer were ordered NT (75.9%) > CM (72.92%) > ST (72.32%) > CT (64.78%) > SCM (55.08%). In the 10–20 cm layer, the proportion of WAS was the greatest for CM (95.86%) and SCM (90.72%), and the patterns in the 20–30 cm and 30–40 cm layer were similar to that in the 10–20 cm layer. RSD was clearly the greatest for ST (27.19%), which showed a high resistance to erosion from runoff (Figure 7). RSD gradually decreased as the depth increased for CT, but first increased and then decreased for CM, SCM, and NT, before initially decreasing and then increasing for ST. RSD was generally greater in the 0–10 cm layer than in the other layers, and was the greatest for SCM (41.2%) and CT (36.82%), but there was little difference between other tillage methods. The mean ASI was clearly greater for CM (2.64) and NT (2.61) than for other tillage methods (Figure 8), which indicates that resistance to erosion is the greatest for CM, and that mechanical compaction decreases the soil porosity and increases aggregate stability.

3.4. SMS for Different Tillage Methods

Mean values of shear strength (SS) significantly increased for CT (4.73 kg/cm2) and NT (4.43 kg/cm2) in the 0–40 cm layer (Figure 9). SS values in the 0–20 cm soil layer were ordered ST (2.74 kg/cm2) < CM (2.82 kg/cm2) < SCM (3.64 kg/cm2) < NT (4.11 kg/cm2) < CT (4.56 kg/cm2). SS showed a similar pattern in the 20–40 cm layer to that in the 0–20 cm layer, but the values were clearly greater in the 20–40 cm layer. Soil compactness (SC) was greater in CM (319.72 N/cm2) and NT (295.52 N/cm2) than in the other tillage methods. This was due to the increase in BD and the decrease in soil porosity due to soil compression caused by the agricultural machinery in CM and in NT, which was due to soil hardening caused by the decrease in soil infiltration capacity on account of less soil disturbance.

3.5. Soil Erodibility for Different Tillage Methods

The average value of the K factor showed that soil was more erodible in the 0–40 cm layer for CT (0.472) than for other tillage methods and least erodible for NT (0.26) (Figure 10). The maximum value of the K factor was 0.493 for the 10–20 cm layer for CT, and the minimum value was 0.223 for the 10–20 cm layer for NT. K factor values behaved differently across tillage methods as the soil depth increased. The K factor gradually decreased as the soil depth increased for ST and initially increased and then decreased as the soil depth increased for CT. In contrast, the K factor initially decreased, and then increased for CM and fluctuated for NT and SCM.

3.6. Correlations between Soil Stability Indicators and Basic Physicochemical Properties of Soil

Table 6 shows the correlations between SAS, WAS, SMS, and the K factor and the physicochemical properties of the soil. SS and SC increased BD and were negatively correlated with SHC. This indicates that soil porosity decreased and led to a decrease in soil water content. FDA, RSD, and ASI were significantly correlated with OM. Thus, an increase in OM will promote soil aggregation. There was a significant negative correlation between the clay content and the K factor (−0.665 **); clay was transported by runoff, which increased the soil erosion.

3.7. Soil Stability and Erosion Resistance

Composite indicators of soil stability and erosion resistance are shown in Figure 11. Soil stability and erosion resistance were decreasingly ordered NT (0.43), SCM (0.41), CM (0.38), ST (0.33), and CT (0.31). The composite indicator was greater for NT than for other tillage methods. ST was less effective than other methods in maintaining the soil stability and erosion resistance.

4. Discussion

4.1. Effects of Tillage Methods on the Distribution of Soil Aggregate Fractions

Tillage disturbs soil structure and alters the soil aggregate fractions [32]. Long-term tillage practices changed the association relationship between the aggregates of various particle sizes. In this study, the soil aggregate with a diameter > 10 mm was the greatest for NT and the least for ST, which was due to ST disintegrating the soil aggregate [33]. There was little soil disturbance in NT, so aggregation was increased by crop residue on the soil surface, promoting the formation of large soil aggregate particles [34]. Similar results were demonstrated by these studies [35,36,37].The proportion of soil aggregates with diameters > 1 mm and 0.25–1 mm significantly increased in NT and ST separately, similarly to in other studies [38,39]. CM plots contained predominantly large aggregates. Mechanical loading increased the soil density, thus decreasing the porosity and the gap between aggregates becomes smaller, and the bond between aggregates becomes larger under external stress, which is conducive to the formation of large aggregates [40]. The value of CE ranged from −1.54 to −1.72 in this study, indicating that the soil aggregate content is balanced and with a small diameter, which is mainly due to the parent materials of the soil originating in granite [41,42]. Soil disturbance from agricultural machinery results in a uniform distribution of soil aggregates. When farmland is tilled and soil is exposed to rain erosion, aggregates exposed to >5 mm are more vulnerable to erosion because erosion can physically disrupt the formation of water-stabilized aggregates of larger sizes [11].
NT has the largest value of Cs, while ST has the smallest Cs, which indicates that less soil disturbance results in the formation of larger soil aggregate particles. This suggests that NT is the most appropriate tillage method for stabilizing soil aggregates [43]. However, the tillage measures with high disturbance intensity negatively affected the soil aggregate stability with lower mean weights and diameters obtained by wet sieving [44]. The composition of the soil aggregate was found to remain relatively stable, despite external disturbances, due to the small diameter of the soil aggregate particles and their even distribution. FDA was the greatest for CT, which disaggregated the soil and increased the proportion of microparticles in the soil [45,46]. FDA for SCM was relatively low and close to FDA for NT, which was explained by ST and CM having opposite effects on the soil structure. FDA was slightly higher for SCM than for CM, which may have been related to the order of tillage, in which ST was followed by CM. Further research is required to explain this result. We did not collect data annually, mainly due to our research focus and the availability of human, material, and financial resources for the project, and therefore, we could not analyze the interannual variability in soil property indicators. We did not see this as a defect of the study as it was defined, but it can become the subject of later research. The majority of current research on tillage practices in agriculture has focused on their effects on soil nutrients and crop yields, while studies examining the impact of tillage on soil structure and other physical properties of soil have been relatively limited. This study aimed to examine the relationship between soil erosion and the intensification of agricultural machinery usage on sloping farmland, and to analyze the resulting impacts on the sloping farmland. Given the importance of soil aggregates for maintaining soil structure and preventing erosion, it is crucial to identify the effects of different tillage practices on soil aggregate composition and stability. This is particularly relevant for sloping farmland, where the risk of erosion is elevated, and where soil conservation is of the utmost importance to maintain the long-term productivity and sustainability of agricultural systems. To achieve this, it is essential to evaluate the ecological benefits of various tillage practices and to identify the most suitable practices that promote the sustainable utilization of sloping farmland while minimizing negative impacts on soil health. By doing so, we can develop effective conservation strategies that support the continued productivity and health of agricultural systems while preserving natural resources for future generations.

4.2. Effects of Different Tillage Methods on Soil Erodibility

The quantification of soil erodibility provides an essential indicator for predicting and monitoring soil erosion [47,48]. The soil erodibility factor, namely the K value, can reflect the stability of the soil physical structure, which is closely linked to soil stability [2]. Soils with large K values are vulnerable to erosion. Tillage methods can affect the soil properties, especially the soil’s physical properties [38]. In the present study, we observed the changes in the K value under different tillage measures (Figure 10), and there was less disturbance to the soil from NT (0.26), thus resulting in the formation of large aggregates [49]. This resulted in a stable soil structure that contained fine SOC particles in large aggregations and gave the soil a high capacity for carbon sequestration [3]. Surface crop residue inhibits rainfall erosion and buffers the soil surface and subsoil layers from rainfall damage, thereby reducing the damage caused to aggregates from frequent drying–wetting cycles [50] and significantly decreasing erosion [51]. Average K factor values, which indicate soil erodibility, are clearly greater for CT than for other methods due to the subsoil turnover from the tillage machinery. Soil turnover and mixing in ST increases the soil porosity, decreases BD [33], and increases the soil permeability, precipitation water accumulation, and deep soil content of OM and other nutrients [52]. The erodibility of SCM was slightly less than that of CT due to the increased soil nutrient storage capacity and greater resistance to erosion resulting from ST [33]. The soil erodibility of CM (K = 0.396) is less than that of SCM due to the changes in the physical properties such as soil porosity and BD caused by mechanical compaction.
The importance of SOM on key soil functions is well recognized (e.g., [2]), and consequently, the loss of SOM is considered an important index affecting soil erodibility and a major threat to sustained soil functions [17], which is also affected by other physical and nutrient indicators. It is known that WSA increases as SOM content increases. Quantifying the rates of change in SAS and knowledge of the links between SAS and SOM fractions is beneficial in reducing soil erodibility, remediating degraded soil, and developing sustainable management practices for soil with adequate SAS. Influenced by tillage practices, soil nutrients are also important in maintaining soil stability and decreasing erosion as well as activities that require further research (Figure 1; [33]). The results of this research provide straightforward information for policymakers to ensure the provision of effective tillage.

4.3. Mechanism of Tillage Measure’s Effect on the Erosive Soil Stability

Soil aggregate stability directly determines the capacity of soil to resist erosive forces and disruptive mechanical stresses [25]. We found that the main indicators of soil stability in the vertical section were SAS, WAS, and SMS, all of which significantly influenced soil erodibility. Rabot et al. [53] and Schlüter et al. [54] also showed two different perspectives on quantifying the aggregate structure of soils: one focused on the aggregates of the solid and liquid phases, and the other on the pore and forces between aggregates. Seasonal rainfall, tillage period, crop growth cycle, and plant roots are important factors affecting soil aggregate stability [55]. In this study, the sampling period is July, and the soil structure settlement and stability period is after spring plough. The early stage of peanuts has little influence on the soil structure. Meanwhile, it is the rainy season in southern China, and the soil erosion effect is strong. Soil samples collected at this stage can reflect the maximum strength of soil stability and erosion resistance. Comparative analysis from the perspective of seasonal differences can be used as a new research breakthrough point. High aggregate stability is imperative for supporting soil functions [56]. Eroded soil is transported and deposited due to rainfall runoff in a process that changes the soil structure and decreases the soil stability. This indicates that there are interactive effects when attempting to maintain soil aggregate stability and reduce the soil erosion [11].
The tillage measures directly affect the soil structure, SOM, and other soil physical and chemical properties. They can promote the development of stable soil aggregates [57], and affect farmland ecology [58]. Our research found that the SSEs of different tillage measures ordered as NT > SCM > CM > ST > CT, which is similar to the conclusions of other researchers [38]. NT disturbs soil less than other measures [38]. The accumulation of crop residue on the soil surface increases SOM, which significantly increases the content of WAS with a diameter > 5 mm. The macroaggregate has a high capacity for sequestering SOC and so increases soil anti-erosion ability [6]. Similarly, increased aggregate stability and percentage of soil macroaggregates were documented by shifting tillage practices from CT to NT systems [59]. These conclusions are consistent with our study. The SSE of CT was significantly less than that for other tillage methods, which indicates that the CT disrupts the soil structure and enhances the SOM decomposition and turnover, as well as decreases the proportion of large aggregated particles in the soil and soil aggregate stability (Figure 12a). CT also accelerates the mineralization of cementitious particle bonds, resulting in the loss of SOM [60], and significantly decreases the soil erodibility. Increased tillage intensity decreases the aggregate stability, indicating that a high percentage of large-sized aggregates in CT does not necessarily translate into aggregate stability [33]. ST disturbs the deeper soil and disrupts the soil large aggregate, forming pockets of nutrients and water in the subsoil (Figure 12b) [34]. Soil water retention increases and resistance to runoff shear decreases, and cohesive forces that support soil mechanical stability become weaker. The soil is therefore less stable during rainfall events. Although ST disturbs the soil, it does not disturb soil layers; and the content of microaggregates increases. Small aggregates fill the gap between large soil aggregates, thus increasing the soil aggregate strength, and the soil becomes more compact. There is less water infiltration in the soil, so the frequency of water expulsion and air expulsion caused by the water infiltration of the soil aggregate decreases, and soil erosion significantly decreases. ST loosens the soil, but the degree of disturbance is clearly less than that of CT and is conducive to the storage of SOM and promoting aggregate formation [10]. The SSE of ST was found to be greater than that of CT, which is consistent with the findings of other research on this topic [33].
Consequently, the soil stability and erosion resistance are significantly less than for SCM and NT. The results show that SCM, the combination of CM and ST, may be a novel and effective tillage method for gentle sloping farmland (Figure 12c) [20]. We need to pay more attention to the problem of cumulative compaction in the cultivated layer. When deep soil is compacted, it can take decades for it to recover naturally, and it is difficult to alleviate the effects of long-term compaction through traditional tillage and crop rotation. Our view is that it is desirable to create appropriate cultivated-layer thickness through ST. SCM, which combines CM with ST, reduces the soil erosion and nutrient degradation caused by the single tillage method and alleviates problems such as soil disaggregation caused by deep tillage and decreased topsoil water retention due to mechanical compaction.

5. Conclusions

SAS, WAS, SMS, and SSE significantly changed in the studied red soil hilly region. SAS was significantly greater for NT than for other tillage methods. The aggregate contents of particles with a diameter > 10 mm across tillage methods were ordered NT > CM > SCM > CT > ST. A similar order was found for the particles with diameters of 10–7 cm and 7–5 cm. CM resulted in compact soil particles. The soil structure of NT was relatively stable because the soil was relatively undisturbed. NT with K factor = 0.26 had greater values for soil stability and erosion resistance (SE = 0.43) than other methods. CM (SE = 0.38) is an effective method for maintaining soil stability and inhibiting the erosion of the topsoil. ST (SE = 0.33) is good at improving the soil structure and increasing nutrient retention in mechanically compacted soil. SCM (SE = 0.41) is an effective method for improving soil fertility, controlling soil erosion, and moderating the effects of mechanical soil compaction.

Author Contributions

Writing—original draft preparation, H.J.; investigation, S.H.; writing—review and editing, D.S. and J.L. (Junkai Li); formal analysis, Y.L.; investigation, J.L. (Jifu Li) and H.Z. All authors have read and agreed to the published version of the manuscript.

Funding

This research was funded by the Natural Science Foundation of China (grant number 42107370), Provincial Science and Technology Special Project of Jinggangshan Nonggao District (20222-051261), the Public Welfare Industry (Agriculture) Special Research Project (No. 201503119-01-01), Engineering Research Center of Ecology and Agricultural Use of Wetland, Ministry of Education, China (KF202009).

Data Availability Statement

Not applicable.

Conflicts of Interest

The authors declare no conflict of interest.

References

  1. Shi, D.M.; Jin, H.F.; Jiang, G.Y. Degradation effect of soil erosion on tillage-layer quality of slope farmland and its evaluation trend. Trans. CSAE 2019, 35, 118–126. [Google Scholar]
  2. Xia, R.; Shi, D.; Ni, S.; Wang, R.; Zhang, J.; Song, G. Effects of soil erosion and soil amendment on soil aggregate stability in the cultivated-layer of sloping farmland in the Three Gorges Reservoir area. Soil Tillage Res. 2022, 223, 105447. [Google Scholar] [CrossRef]
  3. Six, J.; Elliott, E.T.; Paustian, K. Soil macro-aggregate turnover and micro-aggregate formation: A mechanism for C sequestra-tion under no-tillage agriculture. Soil Biol. Biochem. 2000, 32, 2099–2103. [Google Scholar] [CrossRef]
  4. Karami, A.; Homaee, M.; Afzalinia, S.; Ruhipour, H.; Basirat, S. Organic resource management: Impacts on soil aggregate stability and other soil physico-chemical properties. Agric. Ecosyst. Environ. 2012, 148, 22–28. [Google Scholar] [CrossRef]
  5. Tisdall, J.M.; Oades, J.M. Organic matter and water-stable aggregates in soils. Eur. J. Soil Sci. 1982, 33, 141–163. [Google Scholar] [CrossRef]
  6. Six, J.; Paustian, K.; Elliott, E.T.; Combrink, C. Soil structure and organic matter: I. Distribution of aggregate-size classes and aggregate-associated carbon. Soil Sci. Soc. Am. J. 2000, 64, 681–689. [Google Scholar] [CrossRef]
  7. Nsabimana, G.; Bao, Y.; He, X.; Nambajimana, J.D.D.; Yang, L.; Li, J.; Uwiringiyimana, E.; Nsengumuremyi, P.; Ntacyabukura, T. Soil aggregate stability response to hydraulic conditions in water level fluctuation zone of the Three Gorges Reservoir, China. Catena 2021, 204, 105387. [Google Scholar] [CrossRef]
  8. Abbas, F.; Zhu, Z.; An, S. Evaluating aggregate stability of soils under different plant species in Ziwuling Mountain area using three renowned methods. Catena 2021, 207, 105616. [Google Scholar] [CrossRef]
  9. Dimoyiannis, D. Wet aggregate stability as affected by excess carbonate and other soil properties. Land Degrad. Dev. 2012, 23, 450–455. [Google Scholar] [CrossRef]
  10. Jin, H.F.; Shi, D.M.; Zeng, X.Y.; Wang, S.S.; Lou, Y.B.; Duan, T. Soil-reinforcement mechanisms by the root system in bio-embankments of sloping farmland in the purple hilly area. China J. MT Sci. 2019, 16, 2285–2298. [Google Scholar] [CrossRef]
  11. Dou, Y.X.; Yang, Y.; An, S.S.; Zhu, Z.L. Effects of different vegetation restoration methods on soil aggregate stability and erodi-bility on the Loess Plateau, China. Catena 2020, 185, 104294. [Google Scholar] [CrossRef]
  12. Mosaddeghi, M.; Mahboubi, A.; Safadoust, A. Short-term effects of tillage and manure on some soil physical properties and maize root growth in a sandy loam soil in western Iran. Soil Tillage Res. 2009, 104, 173–179. [Google Scholar] [CrossRef]
  13. Schjønning, P.; Thomsen, I.K.; Petersen, S.O.; Kristensen, K.; Christensen, B.T. Relating soil microbial activity to water content and tillage-induced differences in soil structure. Geoderma 2011, 163, 256–264. [Google Scholar] [CrossRef]
  14. Portella, C.M.R.; Guimarães, M.D.F.; Feller, C.; de Batista Fonseca, I.C.; Filho, J.T. Soil aggregation under different management systems. Rev. Bras. Ciência Solo 2012, 36, 1868–1877. [Google Scholar] [CrossRef]
  15. Hajabbasi, M.; Hemmat, A. Tillage impacts on aggregate stability and crop productivity in a clay-loam soil in central Iran. Soil Tillage Res. 2000, 56, 205–212. [Google Scholar] [CrossRef]
  16. Kravchenko, A.N.; Wang, A.N.W.; Smucker, A.J.M.; Rivers, M.L. Long-term differences in tillage and land use affect intra-aggregate pore heterogeneity. Soil Sci. Soc. Am. J. 2011, 75, 1658–1666. [Google Scholar] [CrossRef]
  17. Peth, S.; Horn, R.; Beckmann, F.; Donath, T.; Fischer, J.; Smucker, A.J.M. Three-dimensional quantification of intra-aggregate pore-space features using synchrotron-radiation-based microtomography. Soil Sci. Soc. Am. J. 2008, 72, 897–907. [Google Scholar] [CrossRef]
  18. Schlueter, S.; Grossmann, C.; Diel, J.; Wu, G.M.; Sabine, T.; Annette, D.; Jan, R. Long-term effects of conventional and reduced tillage on soil structure, soil ecological and soil hydraulic properties. Geoderma 2018, 332, 10–19. [Google Scholar] [CrossRef]
  19. Bhattacharyya, R.; Prakash, V.; Kundu, S.; Gupta, H. Effect of tillage and crop rotations on pore size distribution and soil hydraulic conductivity in sandy clay loam soil of the Indian Himalayas. Soil Tillage Res. 2006, 86, 129–140. [Google Scholar] [CrossRef]
  20. An, J.; Zhang, Y.; Yu, N. Quantifying the effect of soil physical properties on the compressive characteristics of two arable soils using uniaxial compression tests. Soil Tillage Res. 2015, 145, 216–223. [Google Scholar] [CrossRef]
  21. Bogunovic, I.; Bilandzija, D.; Andabaka, Z.; Stupic, D.; Comino, J.R.; Cacic, M.; Brezinscak, L.; Maletic, E.; Pereira, P. Soil compaction under different management practices in a Croatian vineyard. Arab. J. Geosci. 2017, 10, 340. [Google Scholar] [CrossRef]
  22. Ghadernejad, K.; Shahgholi, G.; Mardani, A.; Chiyaneh, H.G. Prediction effect of farmyard manure, multiple passes and moisture content on clay soil compaction using adaptive neuro-fuzzy inference system. J. Terramech. 2018, 77, 49–57. [Google Scholar] [CrossRef]
  23. Ekelöf, J.; Guamán, V.; Jensen, E.S.; Persson, P. Inter-Row Subsoiling and Irrigation Increase Starch Potato Yield, Phosphorus Use Efficiency and Quality Parameters. Potato Res. 2015, 58, 15–27. [Google Scholar] [CrossRef]
  24. Perfect, E.; Kay, B.D.; van Loon, W.K.P.; Sheard, R.W.; Pojasok, T. Rates of change in soil structural stability under forages and corn. Soil Sci. Soc. Am. J. 1990, 54, 179–186. [Google Scholar] [CrossRef]
  25. Howard, R.F.; Singer, M.J. Measuring forest soil bulk density using irregular hole, paraffin clod, and air permeability, Cali-fornia. Forest 1981, 2, 316–322. [Google Scholar]
  26. Bonsu, M.; Laryea, K.B. Scaling the saturated hydraulic conductivity of an Alfonso. Eur. J. Soil Sci. 1989, 40, 731–742. [Google Scholar] [CrossRef]
  27. United States Department of Agriculture (USDA). Soil survey laboratory methods manual. In Soil Survey Investigations; Report No. 42; U.S. Department of Agriculture, National Resources Conservation Services, National Soil Survey Centre: Washington, DC, USA, 1996. [Google Scholar]
  28. Walkley, A.; Black, I.A. An examination of the Degtjareff method for determining soil organic matter, and a proposed modification of the chromic acid titration method. Soil Sci. 1934, 37, 29–38. [Google Scholar] [CrossRef]
  29. Nguyen, T.H.; Shindo, H. Effects of different levels of compost application on amounts and distribution of organic nitrogen forms in soil particle size fractions subjected mainly to double cropping. Agric. Sci. 2014, 2, 213–219. [Google Scholar] [CrossRef]
  30. Olsen, S.R.; Sommers, L.E. Phosphorus. In Methods of Soil Analysis, 2nd ed.; Page, A.L., Miller, R.H., Keeney, D.R., Eds.; Agronomy Series No. 9, Part 2; Soil Science Society of America, Inc.: Madison, WI, USA, 1982; pp. 403–430. [Google Scholar]
  31. Lu, R.K. Soil Analytical Methods of Agronomic Chemical; China Agricultural Science and Technology Press: Beijing, China, 2000. (In Chinese) [Google Scholar]
  32. Pi, H.; Huggins, D.R.; Sharratt, B. Dry aggregate stability of soils influenced by crop rotation, soil amendment, and tillage in the Columbia Plateau. Aeolian Res. 2019, 40, 65–73. [Google Scholar] [CrossRef]
  33. Leonard, A.L.; Catherine, M.W.; Takele, B.Z. Effect of subsoiling and injection of pelletized organic matter on soil quality and productivity. Can. J. Soil Sci. 2012, 92, 269–276. [Google Scholar]
  34. Meng, Q.; Sun, Y.; Zhao, J.; Zhou, L.; Ma, X.; Zhou, M.; Gao, W.; Wang, G. Distribution of carbon and nitrogen in water-stable aggregates and soil stability under long-term manure application in solonetzic soils of the Songnen plain, northeast China. J. Soils Sediments 2014, 14, 1041–1049. [Google Scholar] [CrossRef]
  35. Gizachew, T.G.; Thomas, K.; Lars, J.M.; Katrin, R.; Holger, K. Effects of loosening combined with straw incorporation into the upper subsoil on soil properties and crop yield in a three-year field experiment. Soil Tillage Res. 2022, 223, 105466. [Google Scholar]
  36. Filipe, B.K.; H´ector, M.; Patricia, L.F.; Matías, D.; Juan, G.; Lucas, G. Influence of edaphic and management factors on soils ag-gregates stability under no-tillage in Mollisols and Vertisols of the Pampa Region, Argentina. Soil Tillage Res. 2021, 209, 104901. [Google Scholar]
  37. Zhang, Y.; Dalal, R.C.; Bhattacharyya, R.; Meyer, G.; Wang, P.; Menzies, N.W.; Kopittke, P.M. Effect of long-term no-tillage and nitrogen fertilization on phosphorus distribution in bulk soil and aggregates of a Vertisol. Soil Tillage Res. 2020, 205, 104760. [Google Scholar] [CrossRef]
  38. Wang, X.; Qi, J.-Y.; Zhang, X.-Z.; Li, S.-S.; Virk, A.L.; Zhao, X.; Xiao, X.-P.; Zhang, H.-L. Effects of tillage and residue management on soil aggregates and associated carbon storage in a double paddy cropping system. Soil Tillage Res. 2019, 194, 104339. [Google Scholar] [CrossRef]
  39. Wang, Y.X.; Chen, S.P.; Zhang, D.X.; Yang, L.; Cui, T.; Jing, H.R.; Li, Y.H. Effects of subsoiling depth, period interval and com-bined tillage practice on soil properties and yield in the Huang-Huai-Hai Plain, China. J. Integr. Agric. 2020, 19, 1596–1608. [Google Scholar] [CrossRef]
  40. Martin, H.T.; Egon, B.N.; Mathieu, L.; Ana, F.; Chris, K.; Marianne, Z.; Schjønninga, P. Sustainable soil manage-ment-Farmers’perspectives on subsoil compaction and the opportunities and barriers for intervention. IEEE Int. Conf. Smart Cloud 2018, 89, 427–437. [Google Scholar]
  41. Liu, K.; Han, T.; Huang, J.; Huang, Q.; Li, D.; Hu, Z.; Yu, X.; Muhammad, Q.; Ahmed, W.; Hu, H.; et al. Response of soil aggregate-associated potassium to long-term fertilization in red soil. Geoderma 2019, 352, 160–170. [Google Scholar] [CrossRef]
  42. Mao, X.; Van Zwieten, L.; Zhang, M.; Qiu, Z.; Yao, Y.; Wang, H. Soil parent material controls organic matter stocks and retention patterns in subtropical China. J. Soils Sediments 2020, 20, 2426–2438. [Google Scholar] [CrossRef]
  43. Pirmoradian, N.; Sepaskhah, A.R.; Hajabbasi, M.A. Application of Fractal Theory to quantify Soil Aggregate Stability as influenced by Tillage Treatments. Biosyst. Eng. 2005, 90, 227–234. [Google Scholar] [CrossRef]
  44. Tian, S.; Wang, Y.; Ning, T.; Li, N.; Zhao, H.; Wang, B.; Li, Z.; Chi, S. Continued No-Till and Subsoiling Improved Soil Organic Carbon and Soil Aggregation Levels. Agron. J. 2014, 106, 212–218. [Google Scholar] [CrossRef]
  45. Zhang, S.; Li, Q.; Zhang, X.; Wei, K.; Chen, L.; Liang, W. Effects of conservation tillage on soil aggregation and aggregate binding agents in black soil of Northeast China. Soil Tillage Res. 2012, 124, 196–202. [Google Scholar] [CrossRef]
  46. Gao, L.; Becker, E.; Liang, G.; Houssou, A.A.; Wu, H.; Wu, X.; Cai, D.; Degré, A. Effect of different tillage systems on aggregate structure and inner distribution of organic carbon. Geoderma 2017, 288, 97–104. [Google Scholar] [CrossRef]
  47. Quan, X.; He, J.; Cai, Q.; Sun, L.; Li, X.; Wang, S. Soil erosion and deposition characteristics of slope surfaces for two loess soils using indoor simulated rainfall experiment. Soil Tillage Res. 2020, 204, 104714. [Google Scholar] [CrossRef]
  48. Liu, K.; Harrison, M.T.; Yan, H.; Liu, D.L.; Meinke, H.; Hoogenboom, G.; Bin Wang, B.; Bin Peng, B.; Guan, K.; Jaegermeyr, J.; et al. Silver lining to a climate crisis in multiple prospects for alleviating crop waterlogging under future climates. Nat. Commun. 2023, 14, 765. [Google Scholar] [CrossRef]
  49. Lipiec, J.; Kus, J.; Nosalewicz, A.; Turski, M. Tillage system effects on stability and sorptivity of soil aggregates. Int. Agrophys. 2006, 20, 189–193. [Google Scholar]
  50. Modaka, K.; Ghosh, A.; Bhattacharyya, R.; Biswas, D.R.; Das, T.K.; Das, S.; Singh, G. Response of oxidative stability of aggre-gate-associated soil organic carbon and deep soil carbon sequestration to zero-tillage in subtropical India. Soil Tillage Res. 2019, 195, 104370. [Google Scholar] [CrossRef]
  51. Mohammad, S.A.; Nicholas, M.H. Quantitative soil quality indexing of temperate arable management systems. Soil Tillage Res. 2015, 150, 57–67. [Google Scholar]
  52. Kuang, N.; Tan, D.; Li, H.; Gou, Q.; Li, Q.; Han, H. Effects of subsoiling before winter wheat on water consumption characteristics and yield of summer maize on the North China Plain. Agric. Water Manag. 2020, 227, 5786. [Google Scholar] [CrossRef]
  53. Rabot, E.; Wiesmeier, M.; Schlüter, S.; Vogel, H.-J. Soil structure as an indicator of soil functions: A review. Geoderma 2018, 314, 122–137. [Google Scholar] [CrossRef]
  54. Schlüter, S.; Sammartino, S.; Koestel, J. Exploring the relationship between soil structure and soil functions via pore-scale imaging. Geoderma 2020, 370, 4370. [Google Scholar] [CrossRef]
  55. Meurer, K.; Barron, J.; Chenu, C.; Coucheney, E.; Fielding, M.; Hallett, P.; Herrmann, A.M.; Keller, T.; Koestel, J.; Larsbo, M.; et al. A framework for modelling soil structure dynamics in-duced by biological activity. Glob. Chang. Biol. 2020, 26, 5382–5403. [Google Scholar] [CrossRef]
  56. Miller, J.J.; Beasley, B.W.; Drury, C.F.; Larney, F.; Hao, X. Influence of long-term (9 yr) composted and stockpiled feedlot manure application on selected soil physical properties of a clay loam soil in Southern Alberta. Compos. Sci. Util. 2014, 23, 1–10. [Google Scholar] [CrossRef]
  57. Wang, H.; Wang, S.; Wang, R.; Zhang, Y.; Wang, X.; Li, J. Direct and indirect linkages between soil aggregates and soil bacterial communities under tillage methods. Geoderma 2019, 354, 113879. [Google Scholar] [CrossRef]
  58. Mikha, M.M.; Rice, C.W. Tillage and manure effects on soil and aggregate-associated carbon and nitrogen. Soil Sci. Soc. Am. J. 2004, 68, 809–816. [Google Scholar] [CrossRef]
  59. Pinheiro, E.; Pereira, M.; Anjos, L. Aggregate distribution and soil organic matter under different tillage systems for vegetable crops in a Red Latosol from Brazil. Soil Tillage Res. 2004, 77, 79–84. [Google Scholar] [CrossRef]
  60. Luis, A.; Pires, B. Modelling the aggregate structure of a bulk soil to quantify fragmentation properties and energy demand of soil tillage tools in the formation of seedbeds. Biosyst. Eng. 2020, 197, 203–215. [Google Scholar]
Figure 1. Elements of soil stability and evaluation ideas: (a) shows the influence path of soil stability and erosion resistance; and (bd) represent the changing process of SAS, WAS, and SMS at soil profile scales under different climatic conditions, respectively.
Agronomy 13 01310 g001
Figure 2. Overview and sampling of the study area: (a,b) represent the location of the study area in China and Jiangxi Province; (c) represents the sampling site and elevation in Jiangxi Province; (d) represents the sampling mode; and (e) represents the soil profile and soil layer division diagram.
Agronomy 13 01310 g002
Figure 3. Site of the experiments by different tillage methods: (ae) represent the plots treated by different tillage practices of ST, CT, CM, and NT; the two figures of (f,g) show the process of ST followed by CM under the combined model of subsoil tillage and compaction.
Agronomy 13 01310 g003
Figure 4. Soil aggregate fractions as percentages for different tillage methods: (ad) represent different soil depths.
Agronomy 13 01310 g004
Figure 5. Fractal dimension of soil aggregates for different tillage methods. Note: Different uppercase letters indicate significant differences in different tillage practices at the same vertical level (p < 0.005), and different lowercase letters indicate significant differences in the different vertical levels of the same tillage practices (p < 0.005).
Agronomy 13 01310 g005
Figure 6. Water-stable aggregate soil fractions as percentages at different depths for different tillage methods. (ad) represent different soil depths.
Agronomy 13 01310 g006
Figure 7. Failure rate of aggregate structures for different tillage methods. Note: Different uppercase letters indicate significant differences in different tillage practices at the same vertical level (p < 0.005), and different lowercase letters indicate significant differences in the different vertical levels of the same tillage practices (p < 0.005).
Agronomy 13 01310 g007
Figure 8. Aggregate water stability indexes for different tillage methods. Note: Different uppercase letters indicate significant differences in different tillage practices at the same vertical level (p < 0.005), and different lowercase letters indicate significant differences in the different vertical levels of the same tillage practices (p < 0.005).
Agronomy 13 01310 g008
Figure 9. Mechanical characteristics of soil stability: (a) represents the variation characteristics of the soil shear strength under five different tillage practices; and (b) represents the variation characteristics of soil compactness under five different tillage practices.
Agronomy 13 01310 g009
Figure 10. K factor values of soil erodibility for different tillage methods.Note: Different uppercase letters indicate significant differences in different tillage practices at the same vertical level (p < 0.005), and different lowercase letters indicate significant differences in the different vertical levels of the same tillage practices (p < 0.005).
Agronomy 13 01310 g010
Figure 11. Composite indicators of soil stability and erosion resistance.
Agronomy 13 01310 g011
Figure 12. Effects of different tillage measures on soil.
Agronomy 13 01310 g012
Table 1. Basic physical and chemical properties of soil before the experiment.
Soil Layer (cm)pHBulk Density (g/cm3)Organic Matter (g/kg)Clay (%)Silt (%)Sand (%)
0–104.761.2015.3442.3441.3516.31
10–204.691.2914.7140.3643.316.34
20–304.791.3912.3641.5142.5515.94
30–404.811.378.341.143.1215.78
Table 2. Basic tillage of hillside farmland using different tillage methods.
ModelCodeTillage Method
Conventional tillageCTPlowing at a depth of 20 cm followed by rotary tillage twice at a depth of 15 cm before planting crops. This is the common local tillage method.
CompactionCMFollowing the same method as CT but with a tractor surface contact pressure of 100 kPa to thoroughly compact the sloping farmland to simulate the compaction of soil by large machinery.
Subsoil tillageSTPlowing at a depth of 20 cm followed by subsoil tillage at a depth of 30 cm and then rotary tillage at a depth of 10 cm before planting crops.
No tillageNTNo tillage for the entire year.
Subsoil tillage + compactionSCMSubsoil tillage followed by mechanical compaction (i.e., ST followed by CM).
Table 3. Methods used for soil physical and chemical properties.
IndicatorsCodeMethod/InstrumentReference
Bulk density/g·cm3BDParaffin method[25]
Saturated hydraulic conductivity/mm·minSHCFalling-head permeameter method[26]
Clay/%ClayRobinson pipette method[27]
Soil shearing Strength/kg·cm2SSField survey method/tri-head shear tester of 14.10 pocket vane tester, Netherlands (http://www.chem17.com/st6381/Product_17988874.html accessed on 16 April 2023)[10]
Soil compactness meterSCTJSD-750 soil compaction meter, Tuopu Instrument Factory in Hangzhou, Zhejiang Province, China (http://www.top17.net/product/1309.html accessed on 16 April 2023)[10]
Organic matter/g·kgOMDichromate oxidation method [28]
pH valuepHPotentiometric method (1:1 soil:water ratio)[10]
Total nitrogen/g·kgTNKjeldahl method[29]
Available phosphorus/mg·kgAPOlsen method[30]
Available kalium/mg·kgAKlmol/LNH4Ac extraction-flame photometry[31]
Table 4. Characteristics of physical and chemical soil properties under different tillage methods.
Methods TypeSoil Layer (cm)BD (g/cm3)SHC (mm/min)Clay (%)OM (g/kg)TN (g/kg)AP (mg/kg)AK (mg/kg)
CT
(conventional tillage)
0–101.22 ± 0.03 Dc6.81 ± 0.21 Aa17.60 ± 0.31 Ba13.61 ± 0.87 Aa0.96 ± 0.33 Ba63.79 ± 4.28 Ca360.33 ± 8.82 Ba
10–201.43 ± 0.01 Aab1.26 ± 0.11 Cb14.20 ± 0.11 Bb11.77 ± 0.42 Bb0.87 ± 0.19 Ca50.44 ± 5.63 Bb290.12 ± 6.43 Ab
20–301.48 ± 0.03Aa0.60 ± 0.32 Bb10.40 ± 1.33 Bc11.78 ± 0.55 Ab0.76 ± 0.33 Cb33.74 ± 3.41 Bc120.05 ± 7.20 Bc
30–401.40 ± 0.04 ABb0.00 ± 0.00Bc9.00 ± 0.67 Ac8.35 ± 0.30 Ac0.76 ± 0.41 Ab23.41 ± 3.29 Ad94.87 ± 5.11 Bc
ST
(subsoil tillage)
0–101.23 ± 0.13 Dc7.48 ± 1.01 Aa24.80 ± 2.01 Aa15.62 ± 0.91 Aa1.03 ± 0.07 Aa89.37 ± 0.90 Aa460.06 ± 7.67 Aa
10–201.28 ± 0.17 Bb5.90 ± 0.52 Ab16.20 ± 2.12 Ab13.22 ± 0.51 ABa1.02 ± 0.06 Ba71.93 ± 1.78 Ab310.12 ± 4.51 Ab
20–301.31 ± 0.03 Bb3.68 ± 0.23 Abc11.00 ± 1.78 Bc12.38 ± 0.57 Aab0.94 ± 0.41 Aa40.46 ± 3.44 Ac242.35 ± 1.60 Ac
30–401.47 ± 0.02 Aa0.35 ± 0.01 Ac8.60 ± 1.43 Bd10.67 ± 0.28 Ab0.72 ± 0.25 Ab24.15 ± 2.65 Ad300.09 ± 1.52 Ab
CM
(compaction)
0–101.47 ± 0.04 Aa2.98 ± 0.41 Ca21.80 ± 3.45 Aa12.37 ± 0.89 Ba0.87 ± 0.09 Cab39.05 ± 3.54 Ea150.64 ± 4.87 Ca
10–201.44 ± 0.07 Aa3.21 ± 0.26 Ba13.00 ± 1.41 Bb12.16 ± 0.14 Ba0.94 ± 0.27 Ba28.58 ± 5.34 Db114.22 ± 5.02 Bb
20–301.40 ± 0.05 Aa0.00 ± 0.00 Cb6.60 ± 2.41 Cc10.10 ± 1.28 Bab0.87 ± 0.21 Bab19.12 ± 2.35 Cbc133.69 ± 4.31 Ba
30–401.36 ± 0.01 Bab0.00 ± 0.00 Bb7.00 ± 0.58 Bc4.56 ± 0.09 Cb0.55 ± 0.04 Cb11.87 ± 2.43 Bc108.36 ± 3.55 Bb
SCM
(subsoil tillage + compaction)
0–101.31 ± 0.01 Cb4.33 ± 0.15 Ba20.80 ± 0.74 Aa14.65 ± 0.22 Aa0.99 ± 0.31 Ba51.93 ± 3.29 Da330.21 ± 2.52 Ba
10–201.42 ± 0.01 Aa2.64 ± 0.03 BCb18.40 ± 3.59 Aa14.36 ± 0.87 Aa0.97 ± 0.10 Ba40.86 ± 4.27 Cb129.25 ± 4.11 Bb
20–301.39 ± 0.03 Aa0.53 ± 0.19 Bbc14.60 ± 2.91 Ab9.50 ± 0.96 Bb0.71 ± 0.42 Cb35.22 ± 3.72 ABbc109.67 ± 0.98 Bb
30–401.36 ± 0.15 Ba0.00 ± 0.00 Bc9.60 ± 1.36 Ac6.13 ± 0.34 Bc0.64 ± 0.24 Bbc7.45 ± 4.26 BCc103.09 ± 2.32 Bb
NT
(no tillage)
0–101.37 ± 0.06 Ba3.98 ± 0.56 Ba17.20 ± 0.78 Ba16.89 ± 1.02 Aa1.24 ± 0.05 Aa71.25 ± 6.76 Ba430.25 ± 6.43 Aa
10–201.41 ± 0.02 Aa2.87 ± 0.03 Bb16.80 ± 4.45 Aa15.61 ± 0.57 Aa1.04 ± 0.25 Ab41.06 ± 5.29 Cb230.28 ± 2.56 Bb
20–301.36 ± 0.11 Aa0.00 ± 0.00 Cc13.80 ± 2.03 Ab10.53 ± 0.44 ABb0.75 ± 0.03 Cc32.81 ± 3.64 Bc110.87 ± 0.43 Cc
30–401.26 ± 0.02 Cb0.00 ± 0.00 Bc10.60 ± 0.84 Ac6.30 ± 0.31 Bc0.66 ± 0.41 Bcd10.67 ± 2.73 Bd85.32 ± 0.45 Cc
Note: Different uppercase letters indicate significant differences between tillage methods at the same depth (p < 0.005); different lowercase letters indicate significant differences between layers in the same tillage method (p < 0.005).
Table 5. Characteristic values of soil agglomeration for different tillage methods.
Characteristic ParameterSoil Layer (cm)CTCMSTNTSCM
CS0–10−0.82−0.94−1.03−0.73−0.92
10–20−0.80−0.50−0.92−0.380.11
20–30−0.47−0.39−0.88−0.05−0.67
30–40−0.82−0.28−0.61−0.55−0.77
Range ability0.240.550.210.680.82
CE0–10−1.63−1.72−1.70−1.63−1.64
10–20−1.69−1.63−1.69−1.70−1.68
20–30−1.66−1.55−1.62−1.62−1.62
30–40−1.54−1.64−1.66−1.57−1.67
Range ability.−0.04−0.04−0.02−0.03−0.02
Table 6. Correlations between SAS, WAS, SMS, and K factor and physical and chemical soil properties.
IndicatorsBDSHCClayOMTNAPAK
FDA0.0010.339−0.26−0.425 *−0.1490.2910.319
RSD−0.533 **0.386−0.0690.603 **−0.0390.4390.509 *
ASI0.032−0.2870.150.591 **0.002−0.489 *−0.565 **
SS0.660 **−0.692 **−0.262−0.176−0.176−0.231−0.597 **
SC0.819 **−0.546 *−0.101−0.275−0.301−0.397−0.746 **
K0.1630.069−0.665 **−0.074−0.1340.2040.179
Note: ** p < 0.01, and * p < 0.05.
Disclaimer/Publisher’s Note: The statements, opinions and data contained in all publications are solely those of the individual author(s) and contributor(s) and not of MDPI and/or the editor(s). MDPI and/or the editor(s) disclaim responsibility for any injury to people or property resulting from any ideas, methods, instructions or products referred to in the content.

