Article

Application of UAV RGB Images and Improved PSPNet Network to the Identification of Wheat Lodging Areas

1
National Engineering Research Center for Analysis and Application of Agro-Ecological Big Data, Anhui University, Hefei 230601, China
2
School of Electronic and Information Engineering, Anhui University, Hefei 230601, China
*
Author to whom correspondence should be addressed.
Agronomy 2023, 13(5), 1309; https://doi.org/10.3390/agronomy13051309
Submission received: 13 March 2023 / Revised: 27 April 2023 / Accepted: 5 May 2023 / Published: 6 May 2023

Abstract

:
As one of the main disasters that limit the formation of wheat yield and affect the quality of wheat, lodging poses a great threat to safety production. Therefore, an improved PSPNet (Pyramid Scene Parsing Network) integrating the Normalization-based Attention Module (NAM) (NAM-PSPNet) was applied to the high-definition UAV RGB images of wheat lodging areas at the grain-filling stage and maturity stage with the height of 20 m and 40 m. First, based on the PSPNet network, the lightweight neural network MobileNetV2 was used to replace ResNet as the feature extraction backbone network. The deep separable convolution was used to replace the standard convolution to reduce the amount of model parameters and calculations and then improve the extraction speed. Secondly, the pyramid pool structure of multi-dimensional feature fusion was constructed to obtain more detailed features of UAV images and improve accuracy. Then, the extracted feature map was processed by the NAM to identify the less significant features and compress the model to reduce the calculation. The U-Net, SegNet and DeepLabv3+ were selected as the comparison models. The results show that the extraction effect at the height of 20 m and the maturity stage is the best. For the NAM-PSPNet, the MPA (Mean Pixel Accuracy), MIoU (Mean Intersection over Union), Precision, Accuracy and Recall is, respectively, 89.32%, 89.32%, 94.95%, 94.30% and 95.43% which are significantly better than the comparison models. It is concluded that NAM-PSPNet has better extraction performance for wheat lodging areas which can provide the decisionmaking basis for severity estimation, yield loss assessment, agricultural operation, etc.

1. Introduction

Wheat is one of the most important food crops and plays a vital role in determining global food security. In 2017, the global wheat output was 753 million tons, and the planting area was 221 million hectares. With the growth of the global population, the wheat output needs to increase by more than 70% by 2050 to ensure food security [1]. As one of the three major food crops in the world, wheat is an important source of phytochemicals, such as starch, protein, vitamins, and dietary fiber [2]. Lodging is a problem in wheat production which limits grain yield for a long time [3]. The use of plant growth regulators can to some extent prevent wheat lodging but natural factors, such as sudden strong winds, frost, pests, and diseases as well as human factors, such as improper fertilization, can also cause wheat lodging which can affect wheat yield and quality. A large number of stem lodging destroyed the normal canopy structure of crops, resulting in the degradation of crop canopy, and the reduction of photosynthetic activity and mechanized harvesting efficiency led to the loss of grain yield. Therefore, accurately extracting the lodging areas after wheat lodging has important significance for wheat variety screening, yield loss assessment, and guidance for agricultural insurance.
In addition, based on the lodging areas, farmers can be guided to take timely remedial measures to minimize losses. The traditional lodging monitoring method requires investigators to use rulers, GPS, and other tools to conduct field investigations to obtain information about the location and area of the lodging crops. The efficiency is low, especially for irregular lodging areas, which cannot be accurately measured. Traditional methods of identifying the wheat lodging areas and location rely heavily on the ground manual measurement evaluation and random sampling [4], the agricultural management personnel are required to conduct measurement and sampling analysis in the field to quantify the percentage of lodging and the severity of lodging. Generally, it is necessary to carry out preliminary disaster assessment, comprehensive investigation, and review sampling assessment to complete the assessment of the degree of crop lodging damage. The larger the soil area involved, the longer the time required [5], unable to meet the actual needs of large-scale land collapse disaster assessment [6], and in the process of artificial evaluation, wheat cannot be replanted, and even in the process of field measurement, it may cause secondary damage to crops. In addition, the wheat lodging area is manually demarcated by agricultural management personnel which is highly subjective and often controversial. With the rapid development of remote sensing technology, advanced technologies, such as satellite remote sensing and unmanned aerial vehicle remote sensing, are more and more widely used in crop phenotype monitoring [7]. Remote sensing technology can quickly obtain image information and spatial information of large-scale farmland and has been widely used in crop lodging monitoring in recent years [8]. Researchers used satellite remote sensing data as data source, combined with machine learning and depth school algorithm to extract crop lodging areas. Dai et al. [9] used the multi-parameter information in Sentinel-1SAR image and field lodging samples to identify rice lodging caused by heavy rainfall and strong wind and constructed a decision tree model to extract the rice lodging area. The results showed that the overall accuracy of extracting the lodging rice area was 84.38%; Sun et al. [10] carried out experiments using Sentine-2A satellite images and proposed a remote sensing winter wheat extraction method based on medium-resolution image object-oriented and in-depth learning which proved the feasibility and effectiveness of object-oriented classification method in extracting winter wheat planting area, and the precision of this method reached 93.1%. In order to realize deep learning and large-scale monitoring of wheat lodging, Tang et al. [11] proposed a semantic segmentation network model called pyramid transposed convolution network (PTCNet). Using GF-2 (Gaofen 2) satellite data as the data source, the intersection of F1 score of PTCNet and wheat lodging extraction reached 85.31% and 74.38%, respectively, which is superior to SegNet, FPN and other networks.
In recent years, with the development of UAV (Unmanned Aerial Vehicle) remote sensing technology, it has been widely used in precision agriculture because of its convenient operation, low cost, fast speed, high spatial and temporal resolution and the ability to observe in a large area. With its advantages of flexible operation, adjustable flight height and low cost, UAVs can obtain high-frequency, multi-altitude and high-precision image data and play an important role in wheat lodging monitoring and evaluation. At present, the monitoring and extraction of wheat lodging areas are mostly based on single growth stage or single-height UAV images, and the multi-scale and multi-temporal features of multi-height and multi-growth period images are not fully integrated which limits the further improvement of extraction accuracy. The emergence of new remote sensing technology based on unmanned aerial vehicle platform has been favored by remote sensing workers, and agricultural workers are more hopeful about its application prospects of agricultural remote sensing [12]. UAV remote sensing has made some achievements in the field of intelligent agriculture. In order to improve the accuracy of lodging recognition under complex field conditions, Guan et al. [13] selected maize fields with different growth stages as the study area used UAV to obtain maize images, established the data set of lodging and non-lodging and proposed an effective and fast feature screening method (AIC method). After feature screening, BLRC (binary logical regression classification), MLC (Maximum Likelihood Classification) and RFC (Random Forest Classification) distinguish lodging and non-lodging maize based on the selected features. The results show that the proposed screening method has a good extraction effect. Zhang et al. [14] applied nitrogen fertilizer at different levels to induce different lodging conditions in the wheat field and used UAV to obtain RGB and multispectral images of different wheat growth stages. Based on these two types of images, a new method combining migration learning and DeepLabv3+ network is proposed to extract the lodging areas of different wheat growth stages and obtain better extraction results. In order to explore the evaluation of maize lodging disaster, Zheng et al. [15] used the full convolution segmentation network of deep learning technology to extract the maize lodging area, and the score of the network test set reached more than 90%. Mardanisamani et al. [16] proposed a DCNN network for lodging classification using rape and wheat. Through migration learning, the classic deep learning network was used to pre-train the lodging model of crops. The final training results were compared with VGG, AlexNet, ResNet and other networks. The results showed that the proposed network was more suitable for lodging classification. Yang et al. [17] proposed a mobile U-Net model that combines lightweight neural network with depth separable convolution and U-Net model to overcome the problems of low wheat recognition accuracy and poor real-time performance, using UAV to obtain RGB images to build data sets. The proposed model is superior to FCN and U-Net classic network in segmentation accuracy and processing speed. Varela et al. [18] collected time series multispectral UAV imagery and compared the performance of 2D-CNN and 3D-CNN architectures to estimate lodging detection and severity in sorghum. The result shows that integration of spatial and spectral features with 3D-CNN architecture is helpful to improve assessment of lodging severity.
However, most of the current research focuses on the remote sensing image of a single crop growth period or a single height. In order to dynamically monitor the wheat lodging areas and explore the impact of the depth learning network in a multi-dimensional way, this research collects the UAV-based RGB images of wheat lodging areas of two growth periods and flight heights as the data source, and makes three improvements on the basis of the Pyramid Scene Parsing Network (PSPNet) network and NAM (Normalization-based Attention Module): (1) Fusing the lightweight neural network and introducing the residual connection; (2) Constructing a pyramid pool structure of multi-dimensional feature fusion; and (3) Introducing the NAM attention module. The extraction performance of NAM-PSPNet network for wheat lodging areas are comparatively analyzed and discussed.

2. Materials and Methods
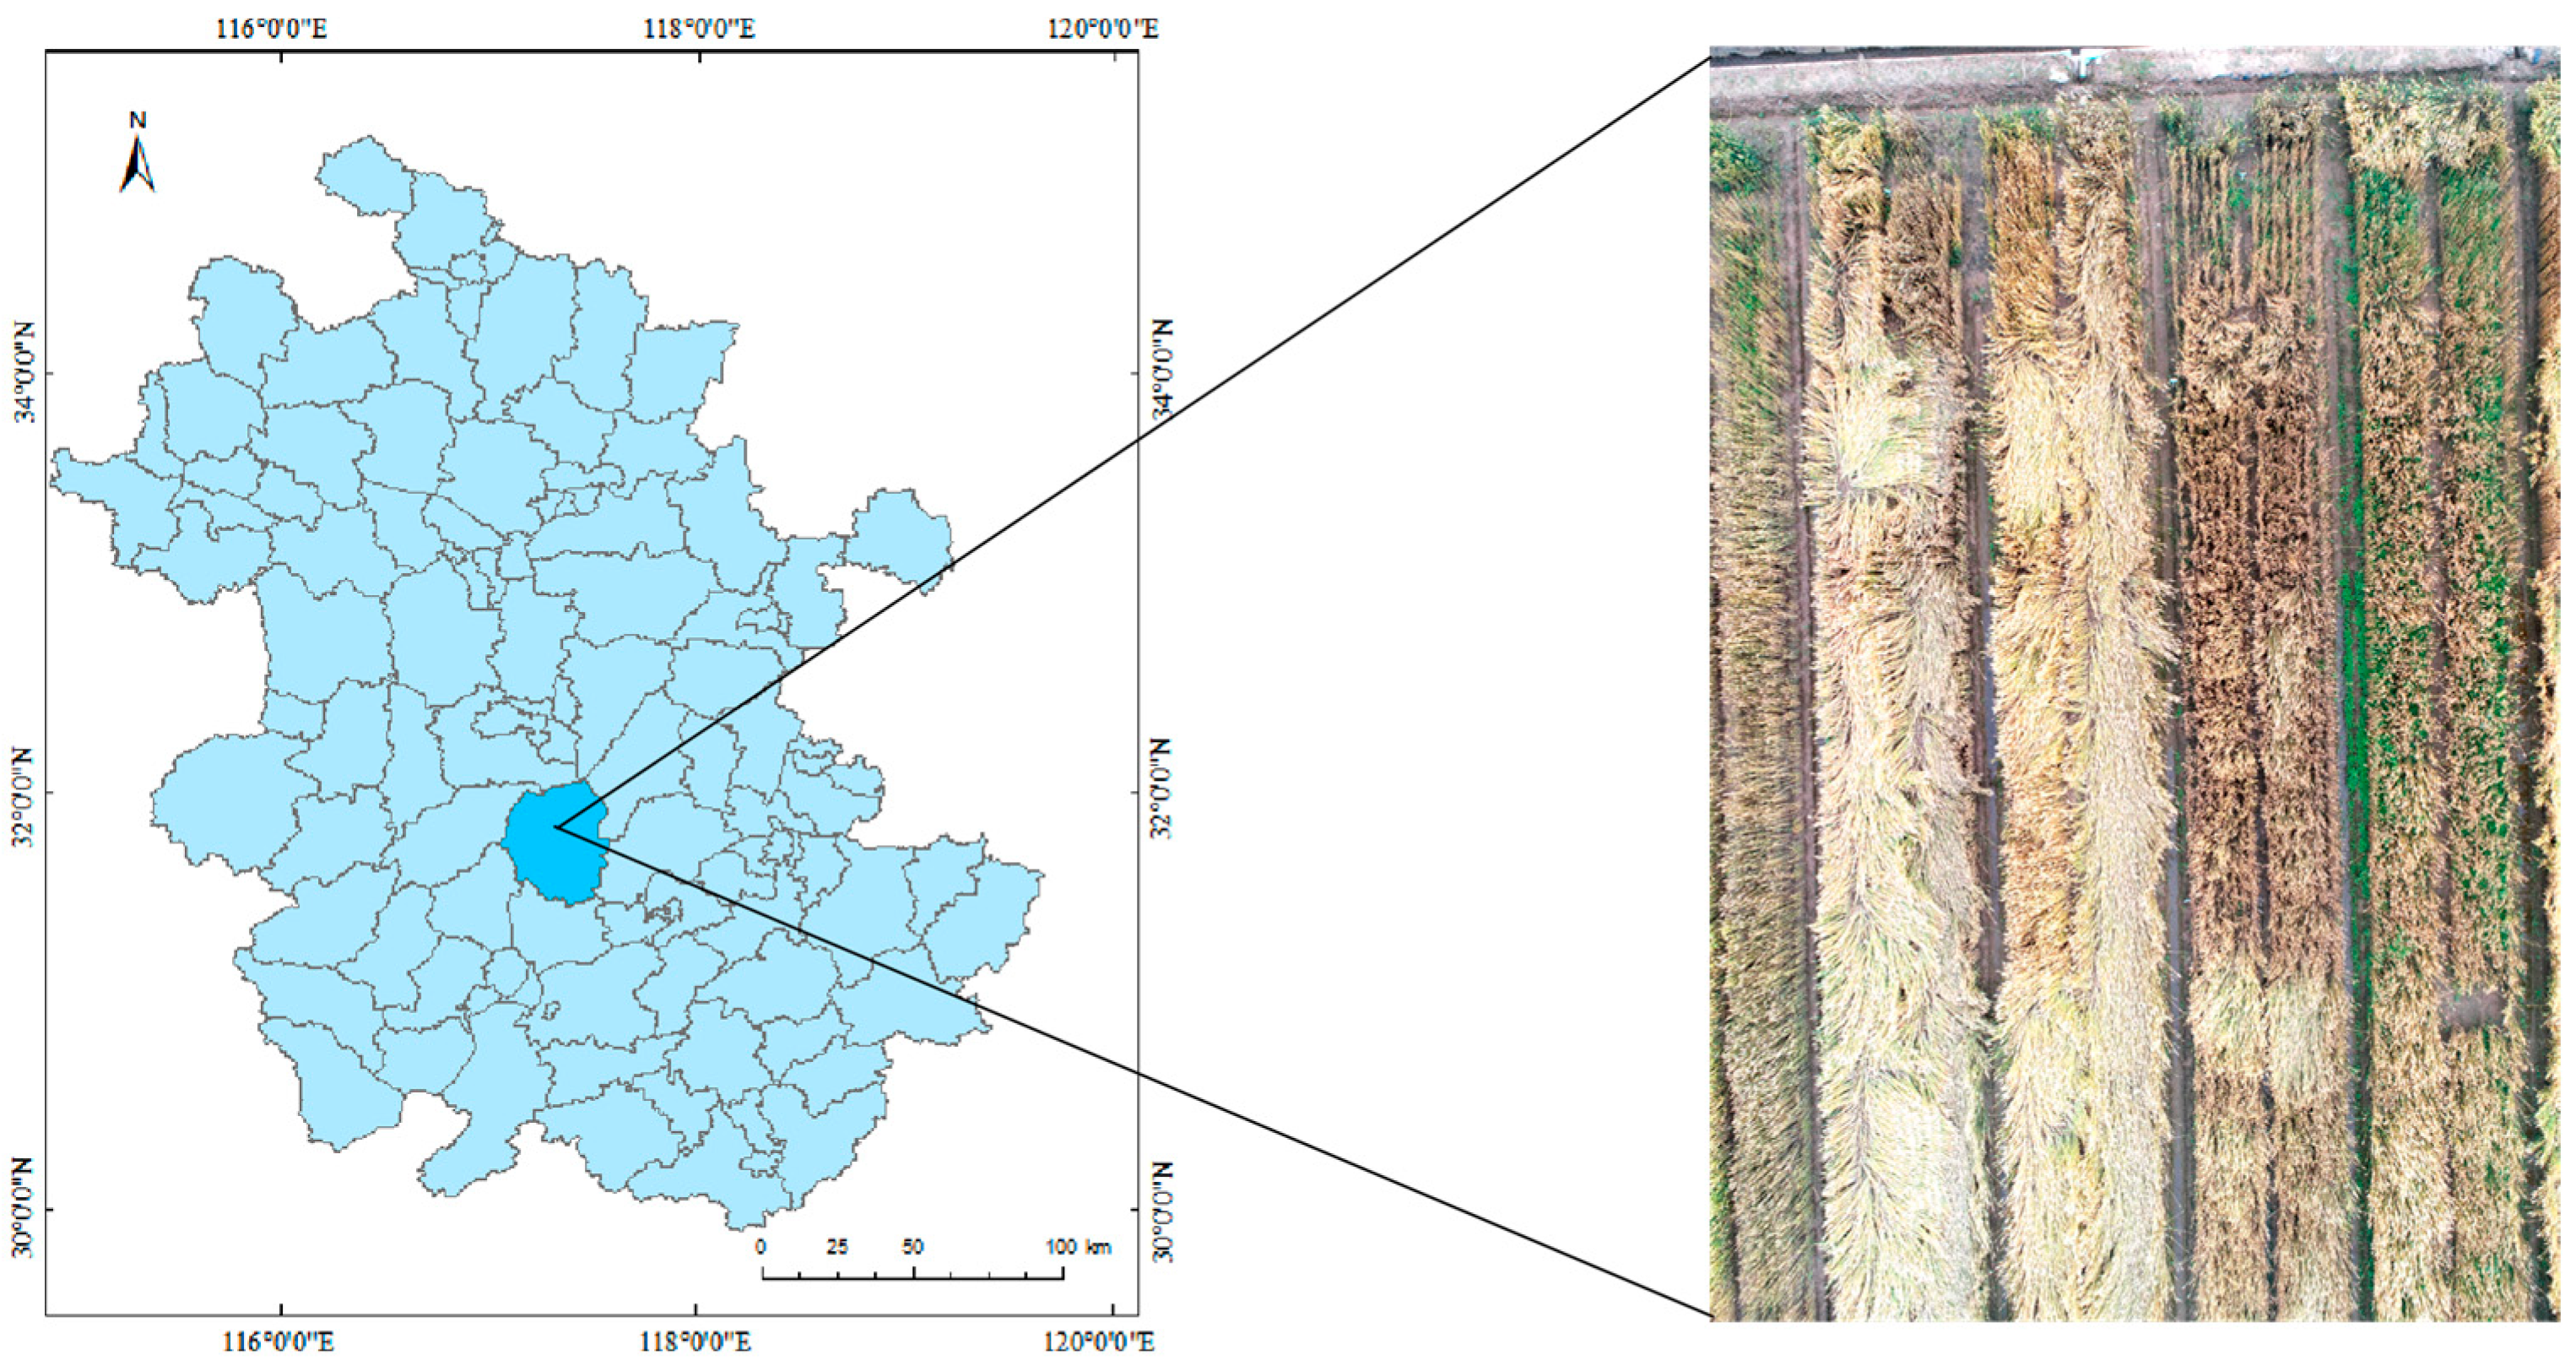
2.1. Study Area

The research area is located in Guohe Farm, Lujiang County, Hefei City, Anhui Province. It is located in the middle of Anhui Province, between the Yangtze River and Huaihe River, and the west wing of the Yangtze River Delta, between 30°56′–32°33′ N, 116°40′–117°58′ E (Figure 1). It is in the subtropical warm monsoon climate zone. The annual climate characteristics are: four distinct seasons, mild climate, moderate rainfall, annual average rainfall of 992 mm, average temperature of 13–20 °C, suitable for wheat growth. Wheat is one of the main crops planted in this area. The wheat variety (Ningmai 13) was sown in October 2020 and belongs to the winter wheat. In addition to basic cultivation, it also carries out management in the process of wheat growth, such as weeding, fertilization, pest control, etc.

2.2. Data Acquisition and Preprocessing

(1)
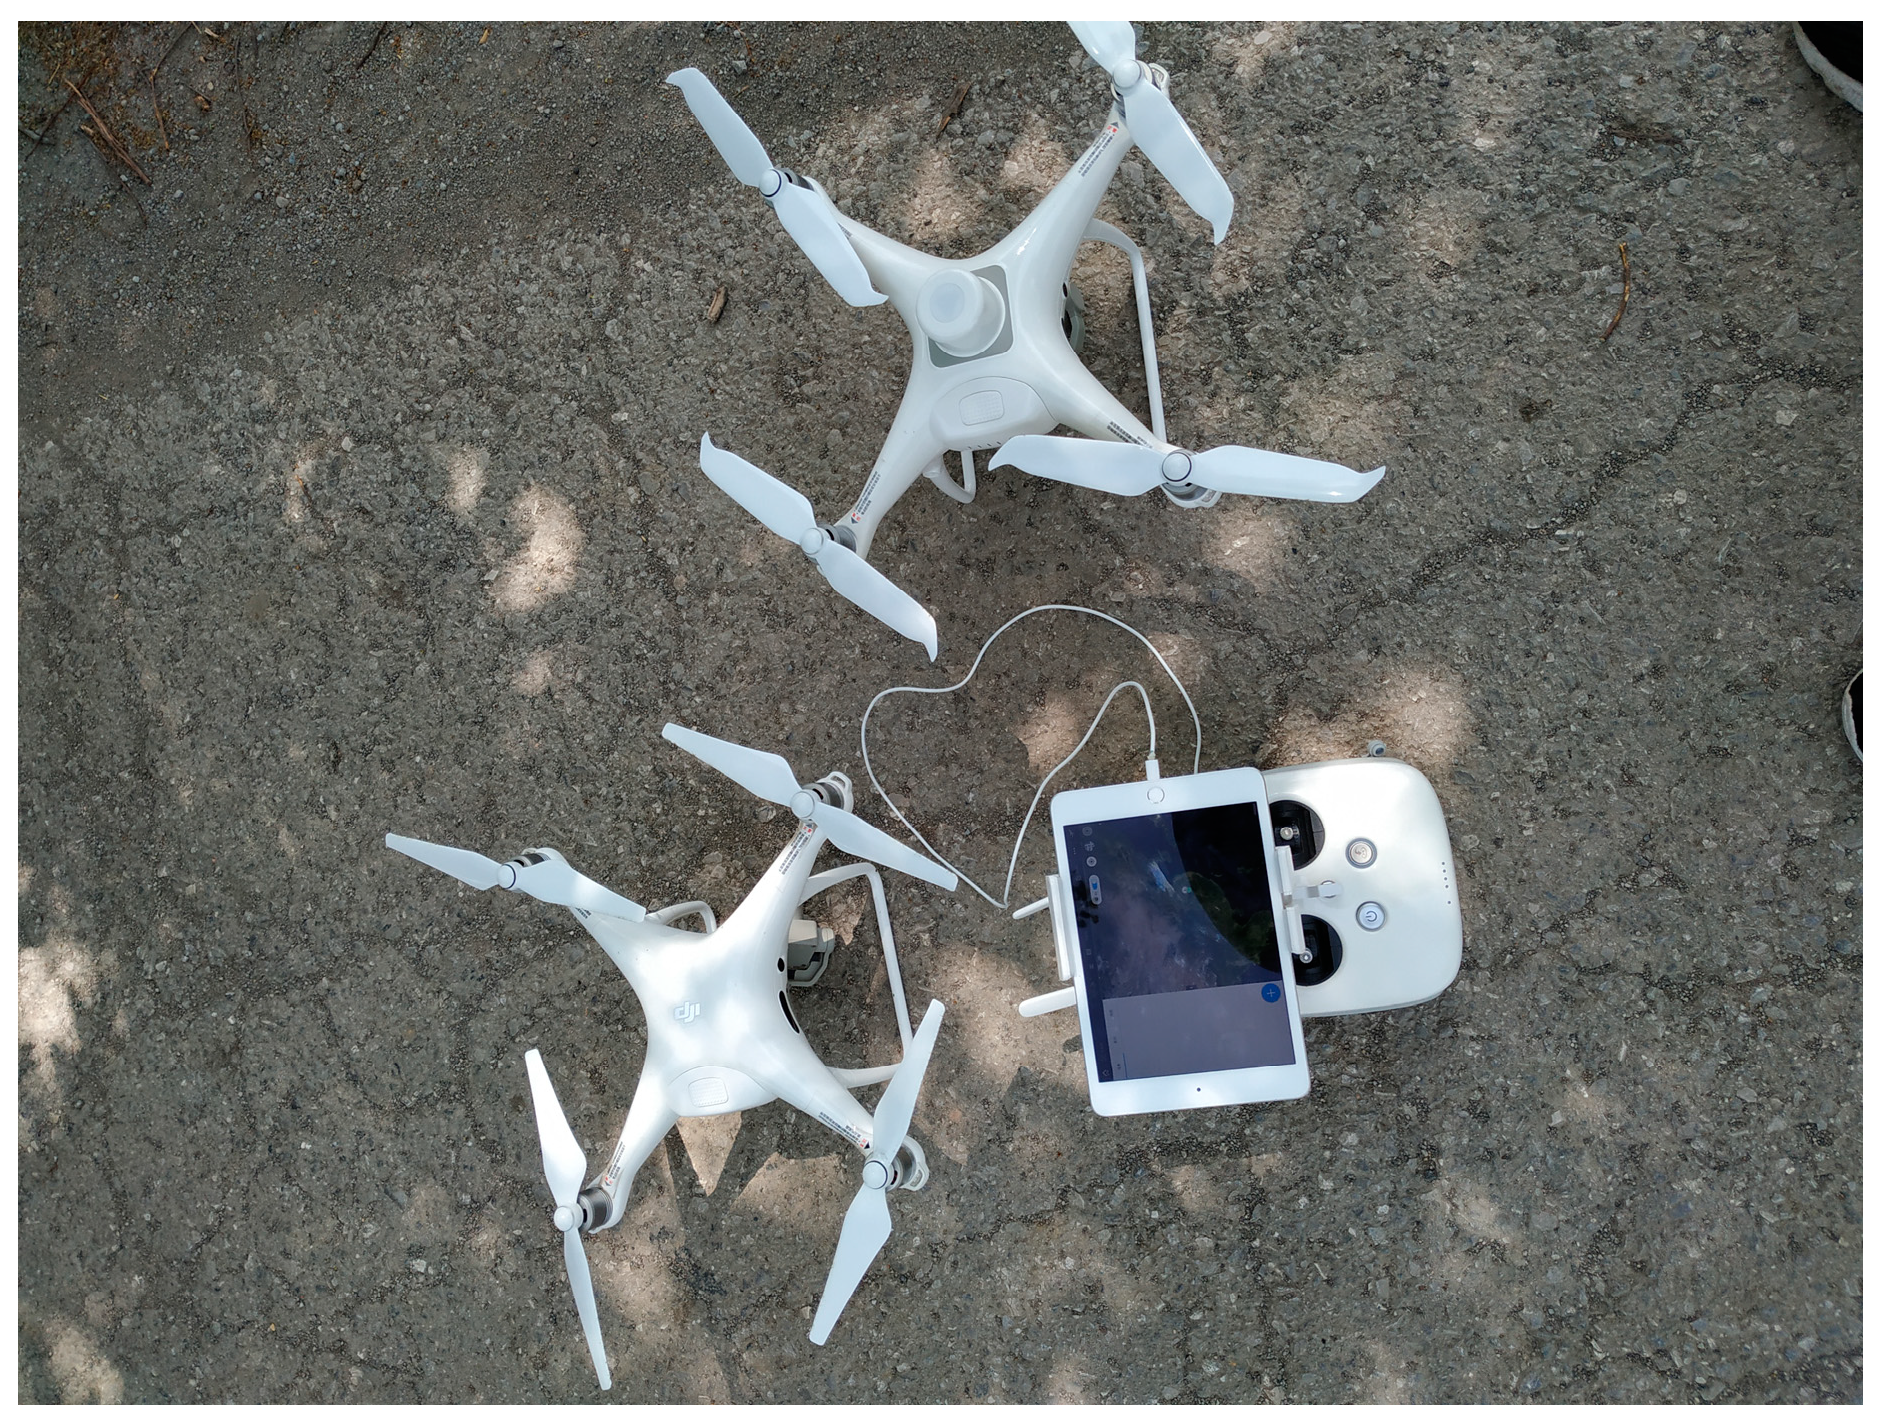
Acquisition of UAV images. The wheat lodging was collected at the wheat grain-filling stage on 4 May 2021 and the mature stage on 24 May 2021. The flight platform is DJI Phantom 4 pro, and the image acquisition equipment is shown in Figure 2. The onboard RGB sensor, including red, green and blue bands, captures images with red, blue and green spectral channels with a resolution of 5472 × 3648 pixels. The flight altitude of UAV is set to 20 m and 40 m. Before the UAV flight, the DJI GS Pro software was used to plan the route, first select the flight area of the farm, set the flight altitude of 20 m and 40 m, the flight speed of 2 m/s and 4 m/s, the heading overlap of 85%, the side overlap of 85% and the shooting mode is set to take photos at equal time intervals. After all parameters are set, the UAV wheat data will be obtained. The day of shooting is sunny and breezy which meets the requirements of UAV flight and remote sensing data acquisition.
(2)
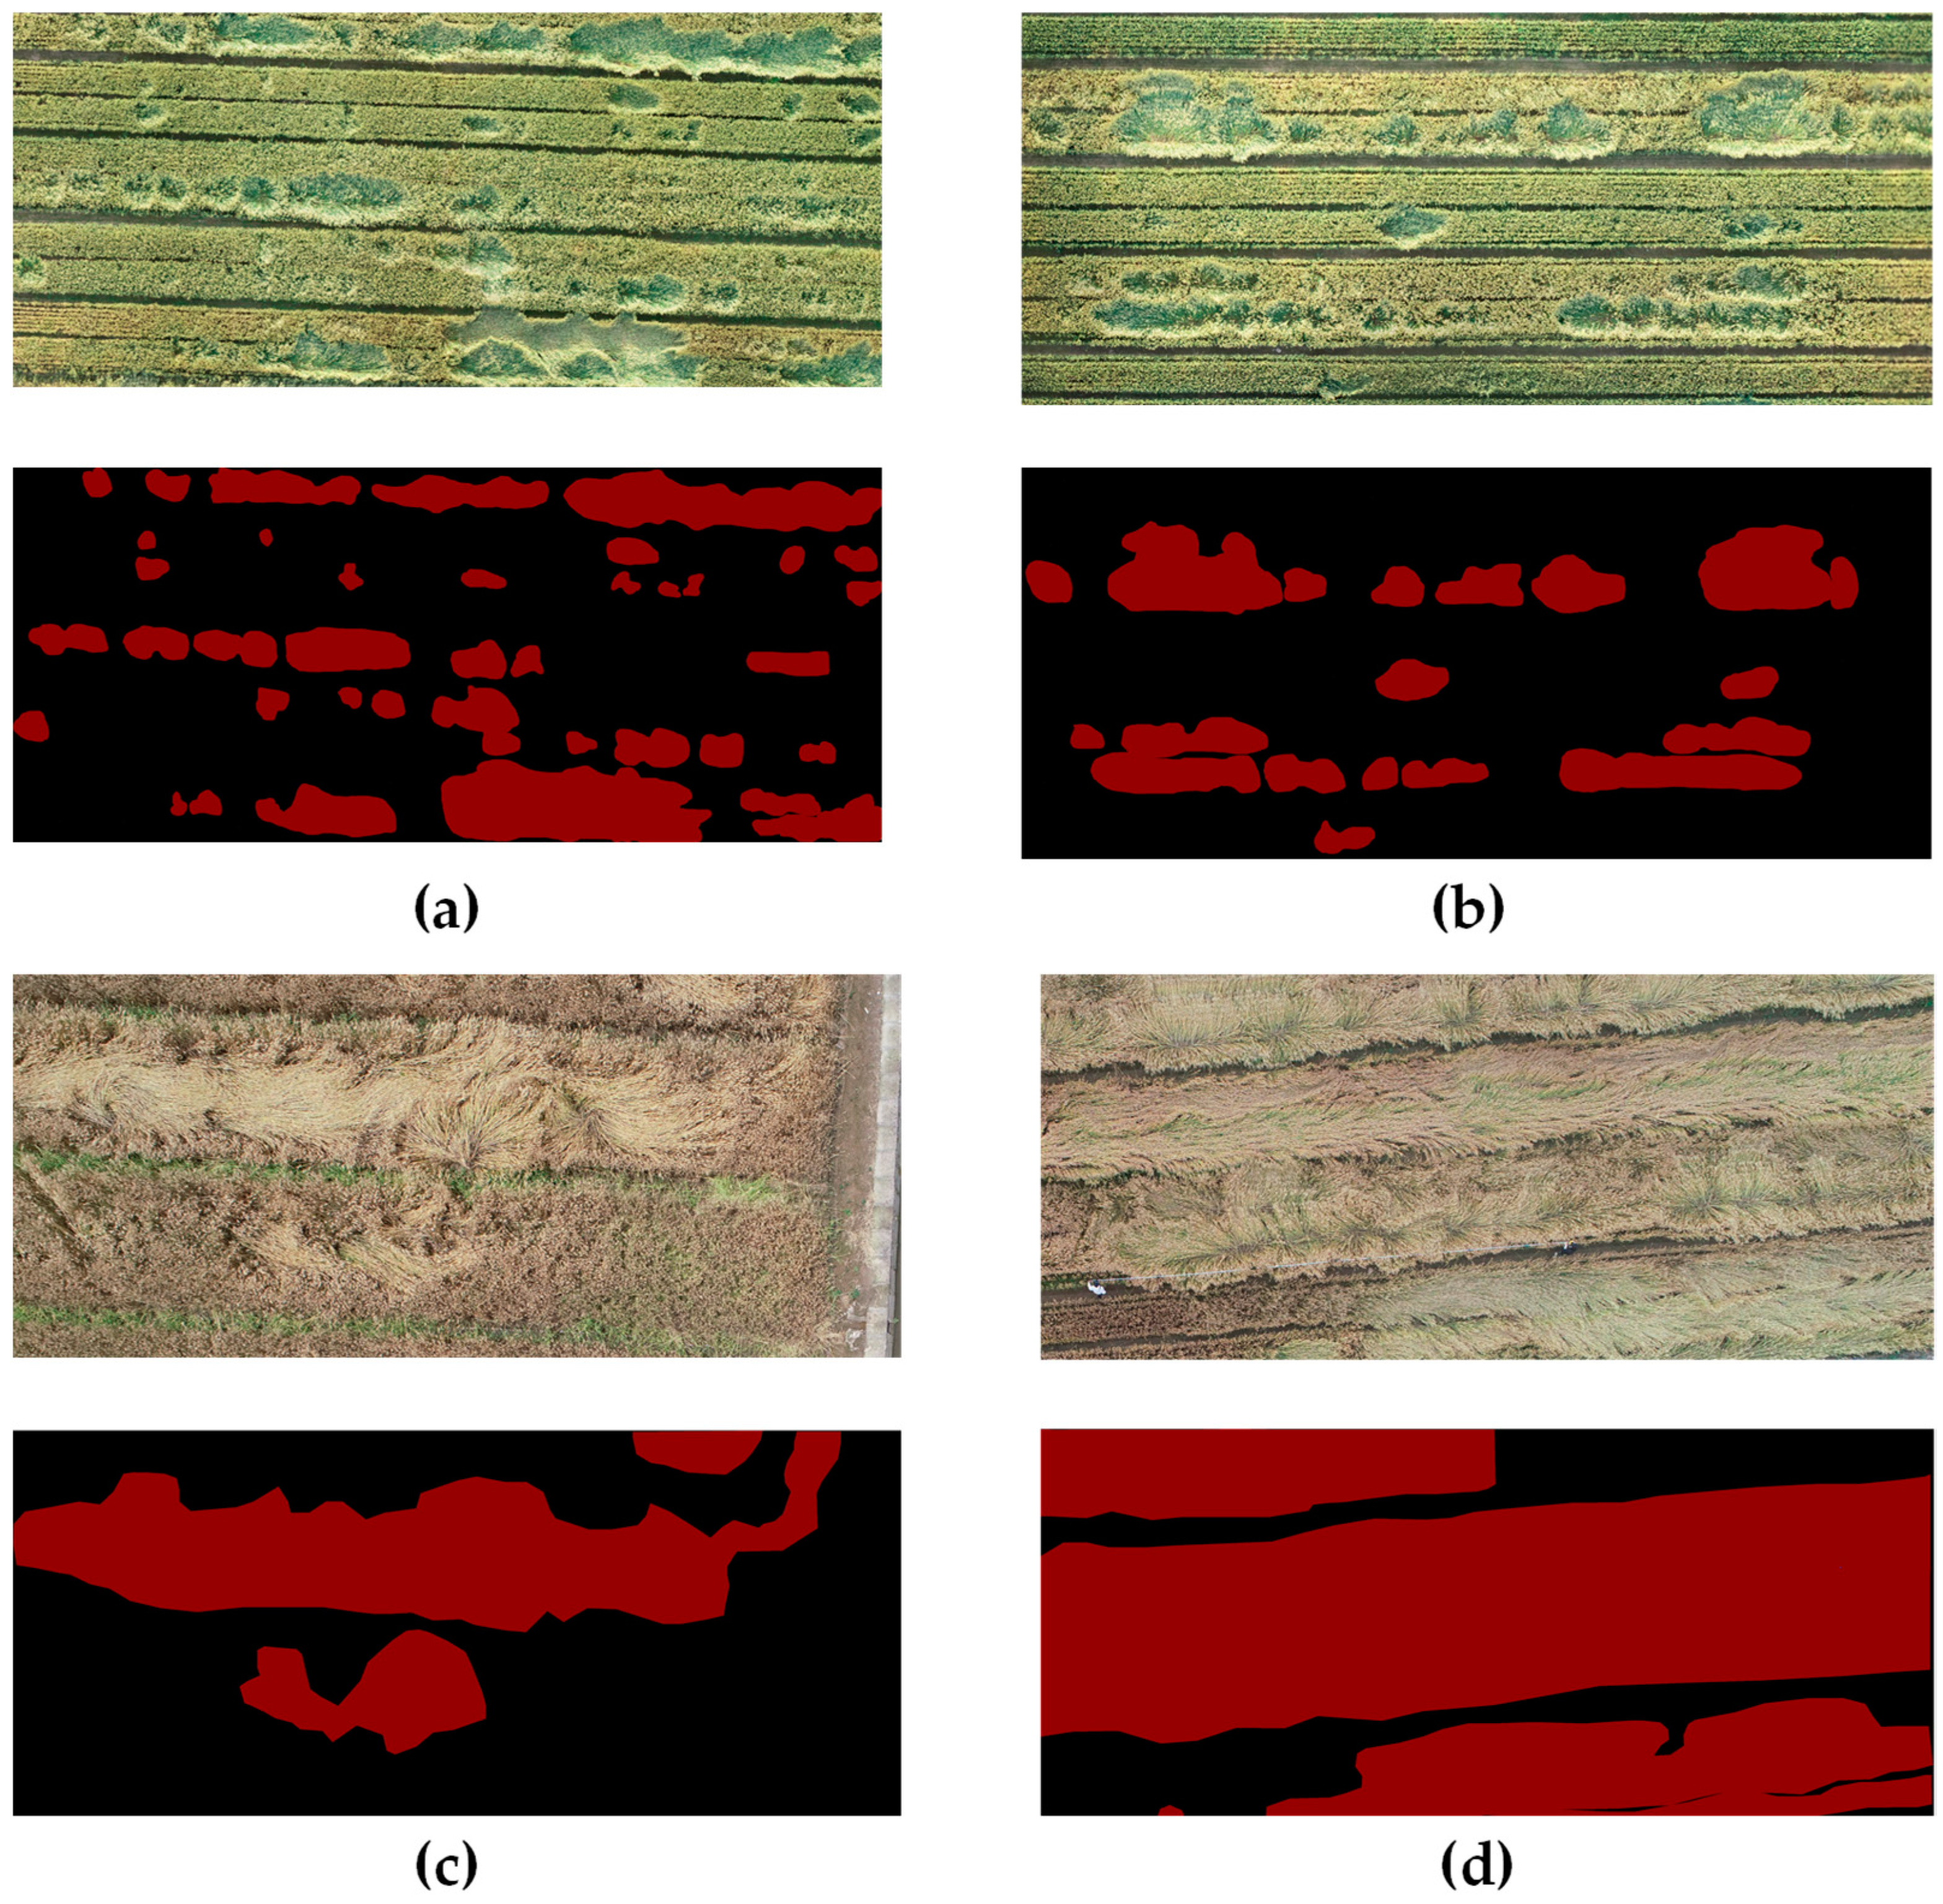
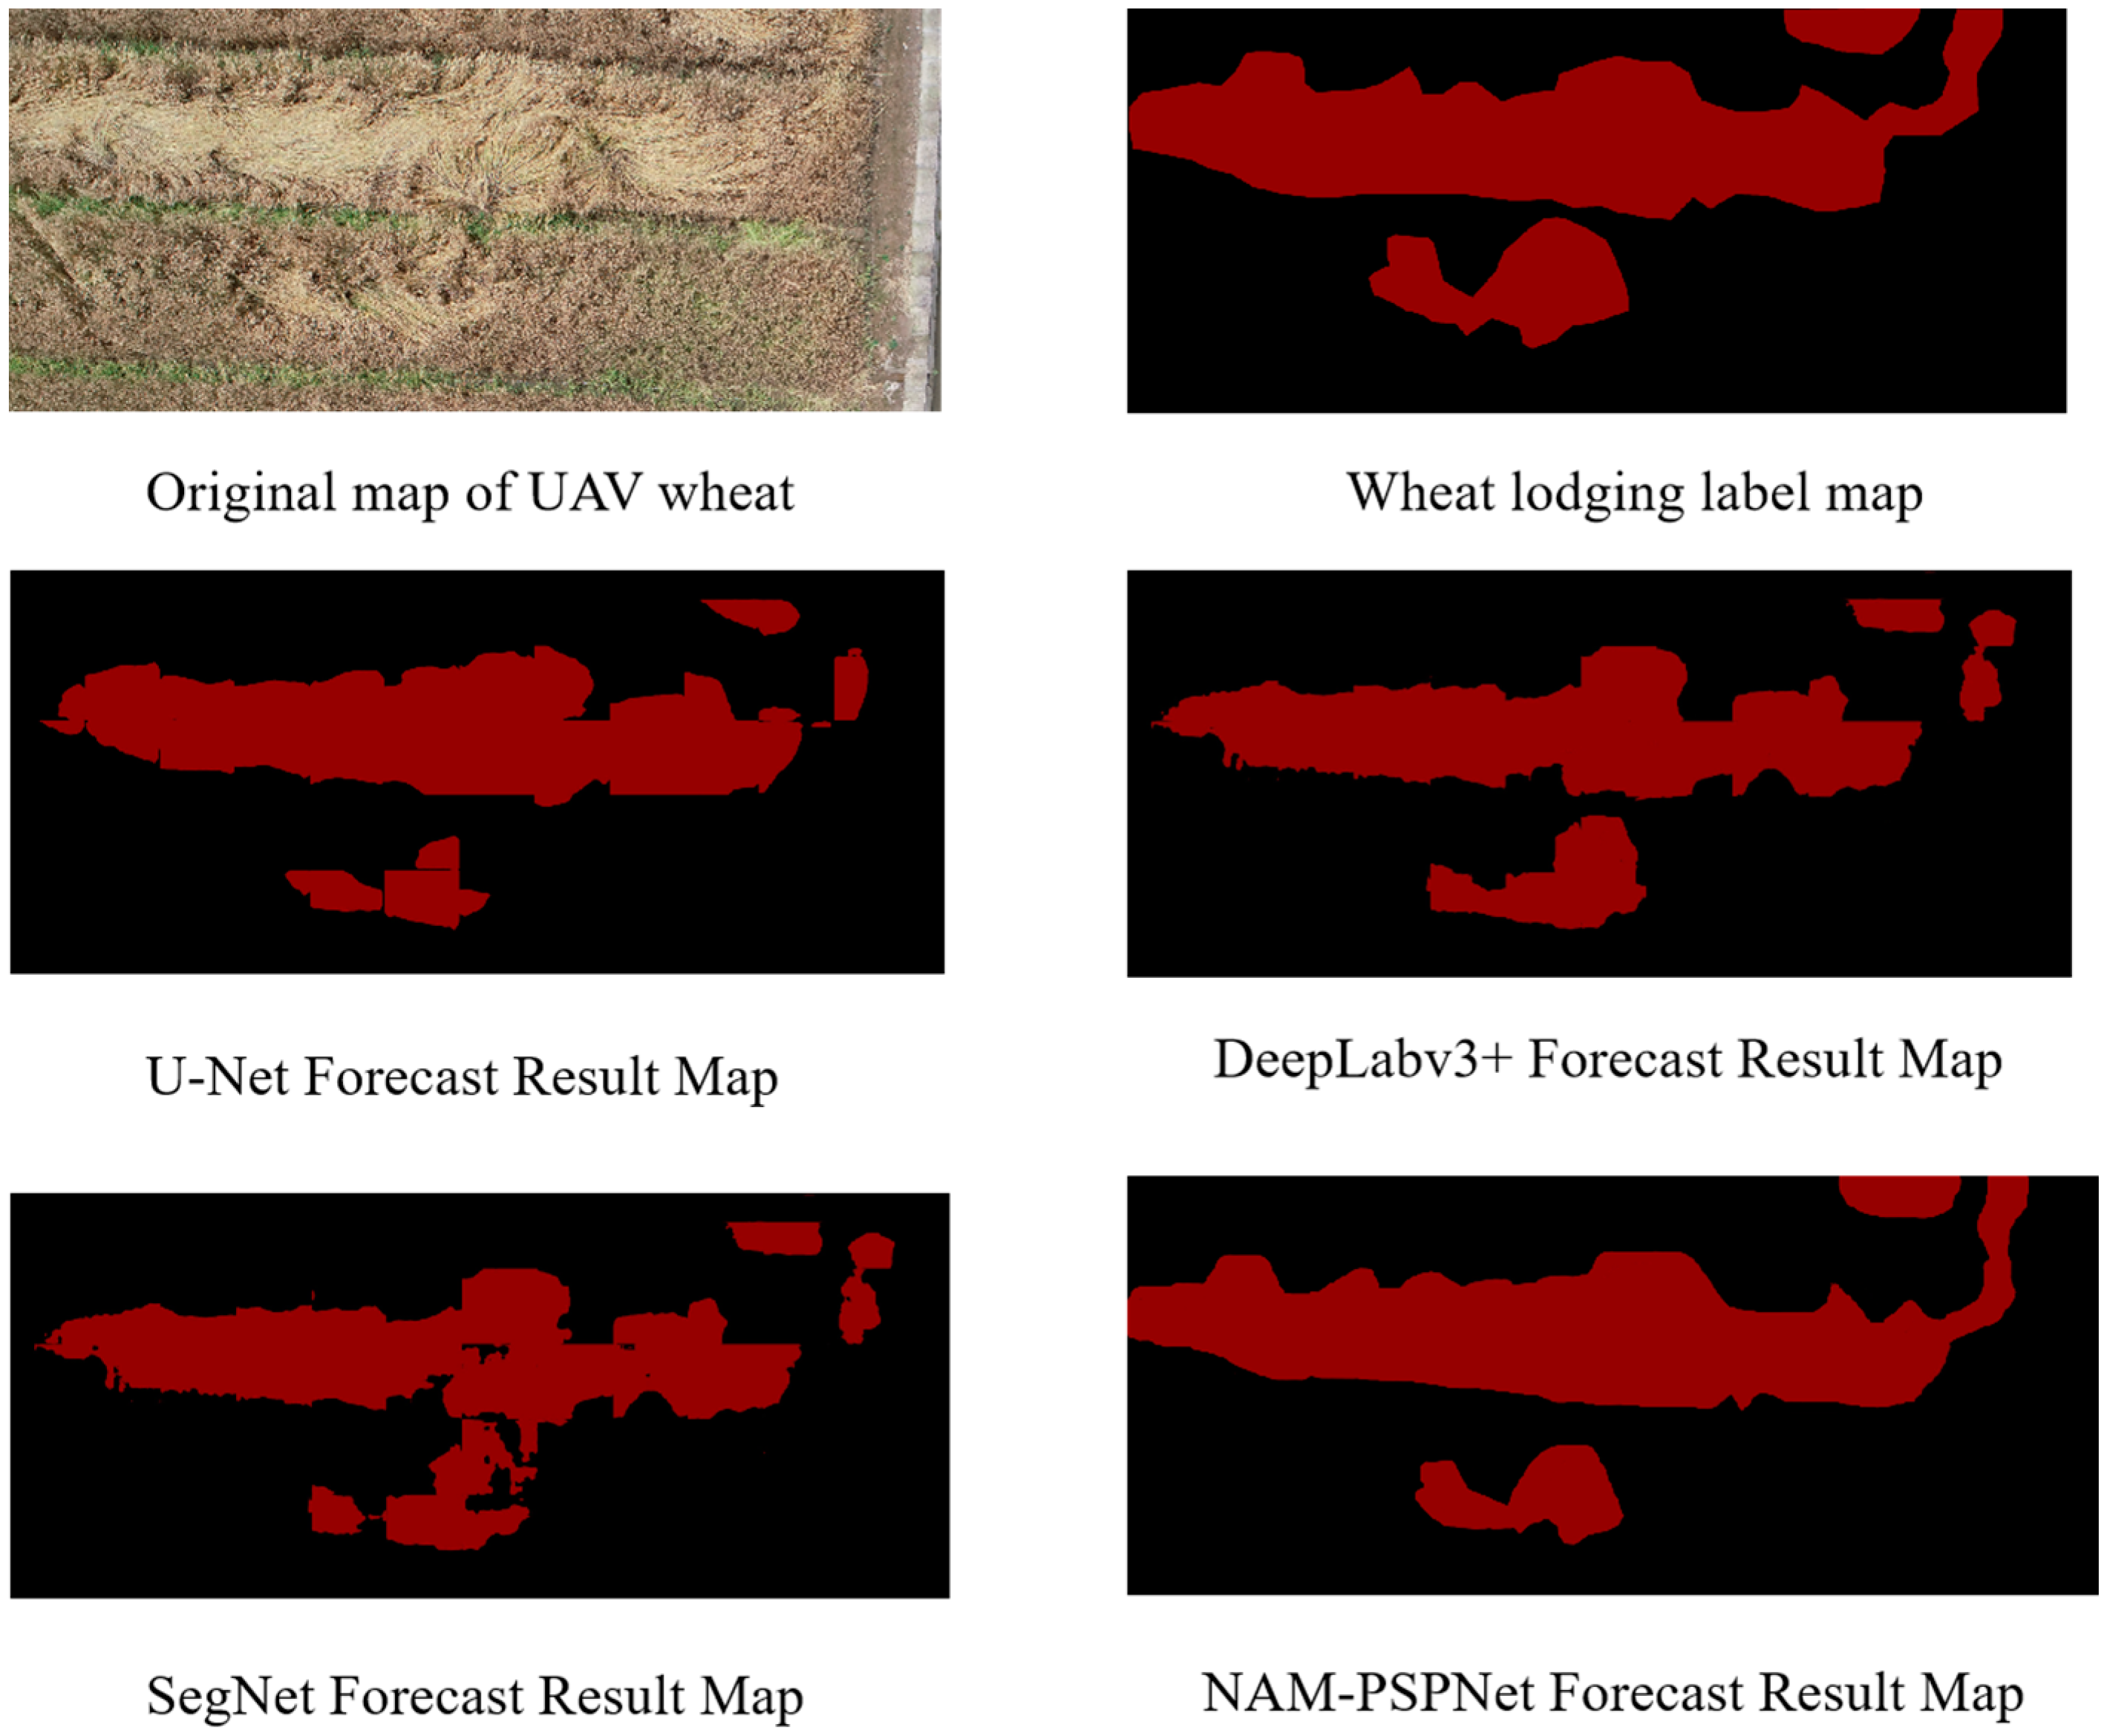
Data annotation. The obtained UAV wheat image during the grain-filling period includes two kinds of data at the height of 20 m and 40 m, and the size of the original wheat lodging image collected is 5472 × 3648 and 8049 × 5486, respectively. Due to hardware constraints and adaptation to subsequent deep learning training, the images are uniformly cropped to the same size. The obtained UAV image has high spatial accuracy and can clearly see the lodging information of wheat. Therefore, Expert Visual Interpretation (EVI) is selected to obtain the landmark data of real lodging areas. LabelMe [19] is selected as the annotation software to manually label the data which is an open annotation tool created by MIT Computer Science and Artificial Intelligence Laboratory (MIT CSAIL). It is a JavaScript annotation tool for online image annotation. Compared with traditional image annotation tools, its advantage is that we can use it anywhere. In addition, it can also help label images without installing or copying large data sets in the computer. According to this software, real ground lodging information can be obtained. The lodging areas were marked in LabelMe to generate a JSON file which was then converted to a PNG format image for deep learning network training preparation. As shown in Figure 3, the red areas represent the lodging areas and the black represents the non-lodging areas.

3. Methodology

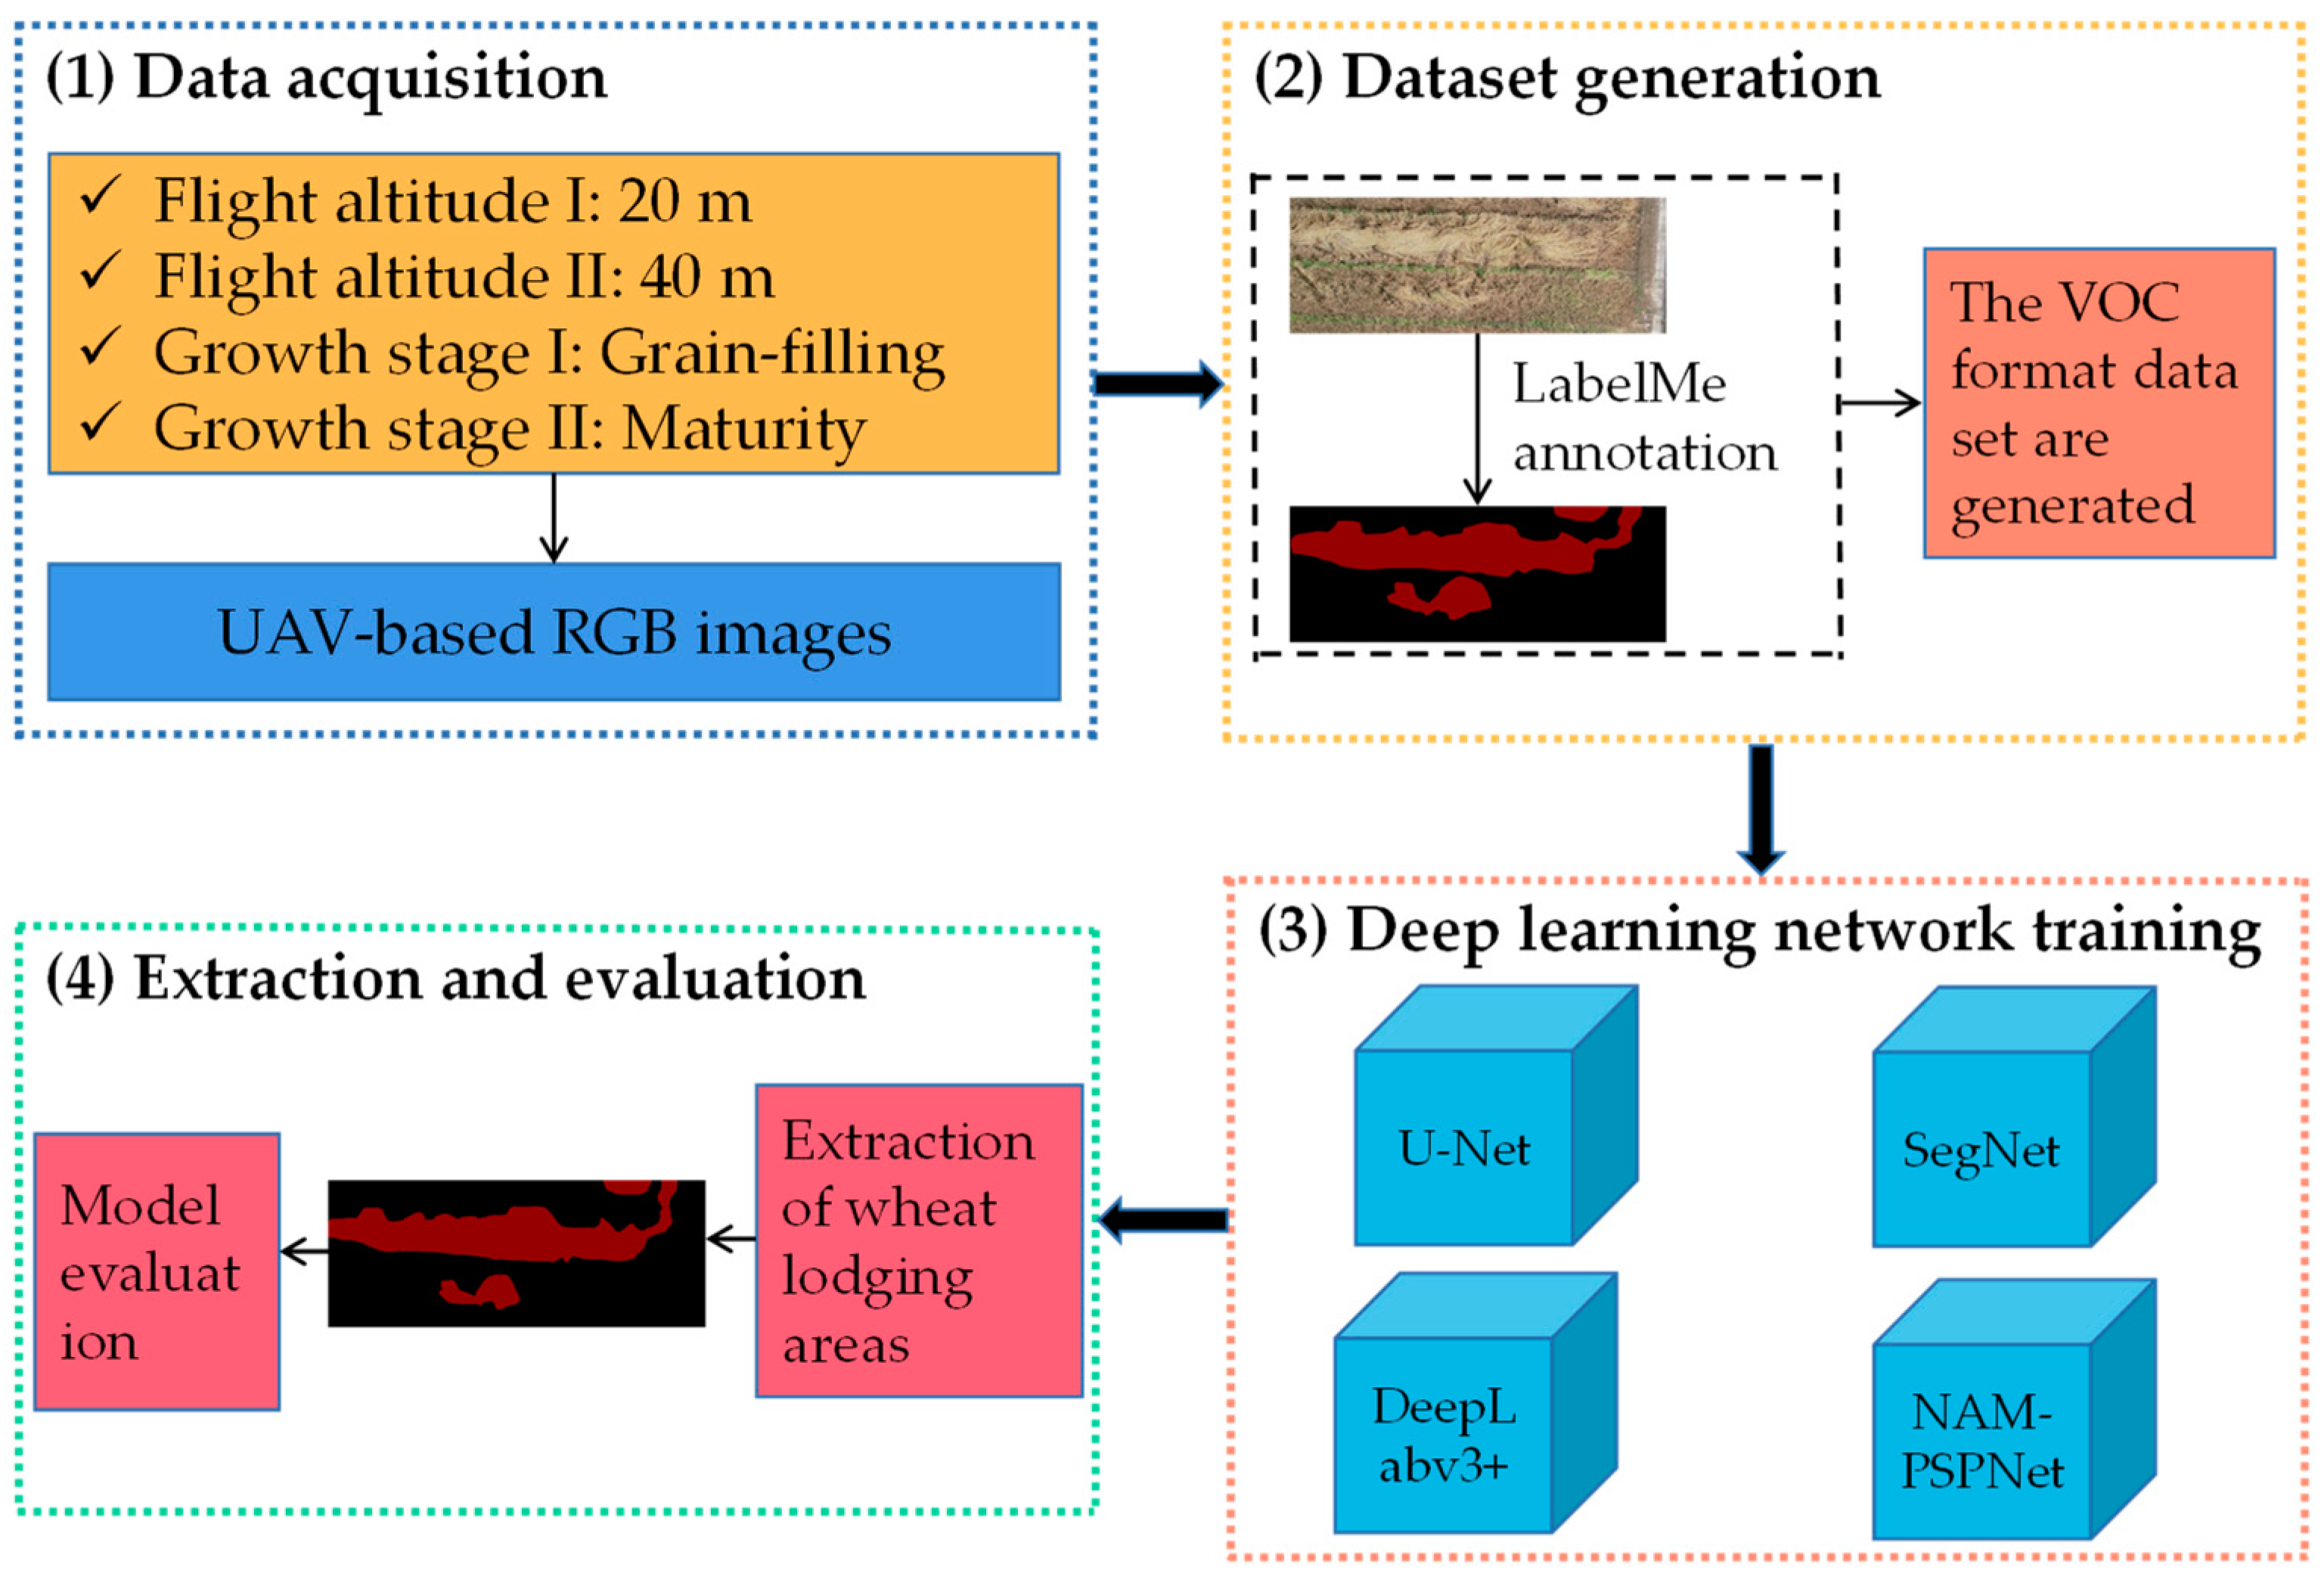
3.1. Technical Workflow

The flow chart of the research method for extraction of wheat lodging area is shown in Figure 4. First, UAV-based RGB images of wheat lodging areas at different growth stages and flight heights are collected. Secondly, the VOC format dataset was produced. Then, the UAV data are trained by using the NAM-PSPNet network and traditional split network method; Finally, the lodging areas of wheat were extracted, and the results were compared and analyzed with the U-net, SegNet and DeeplabV3+.

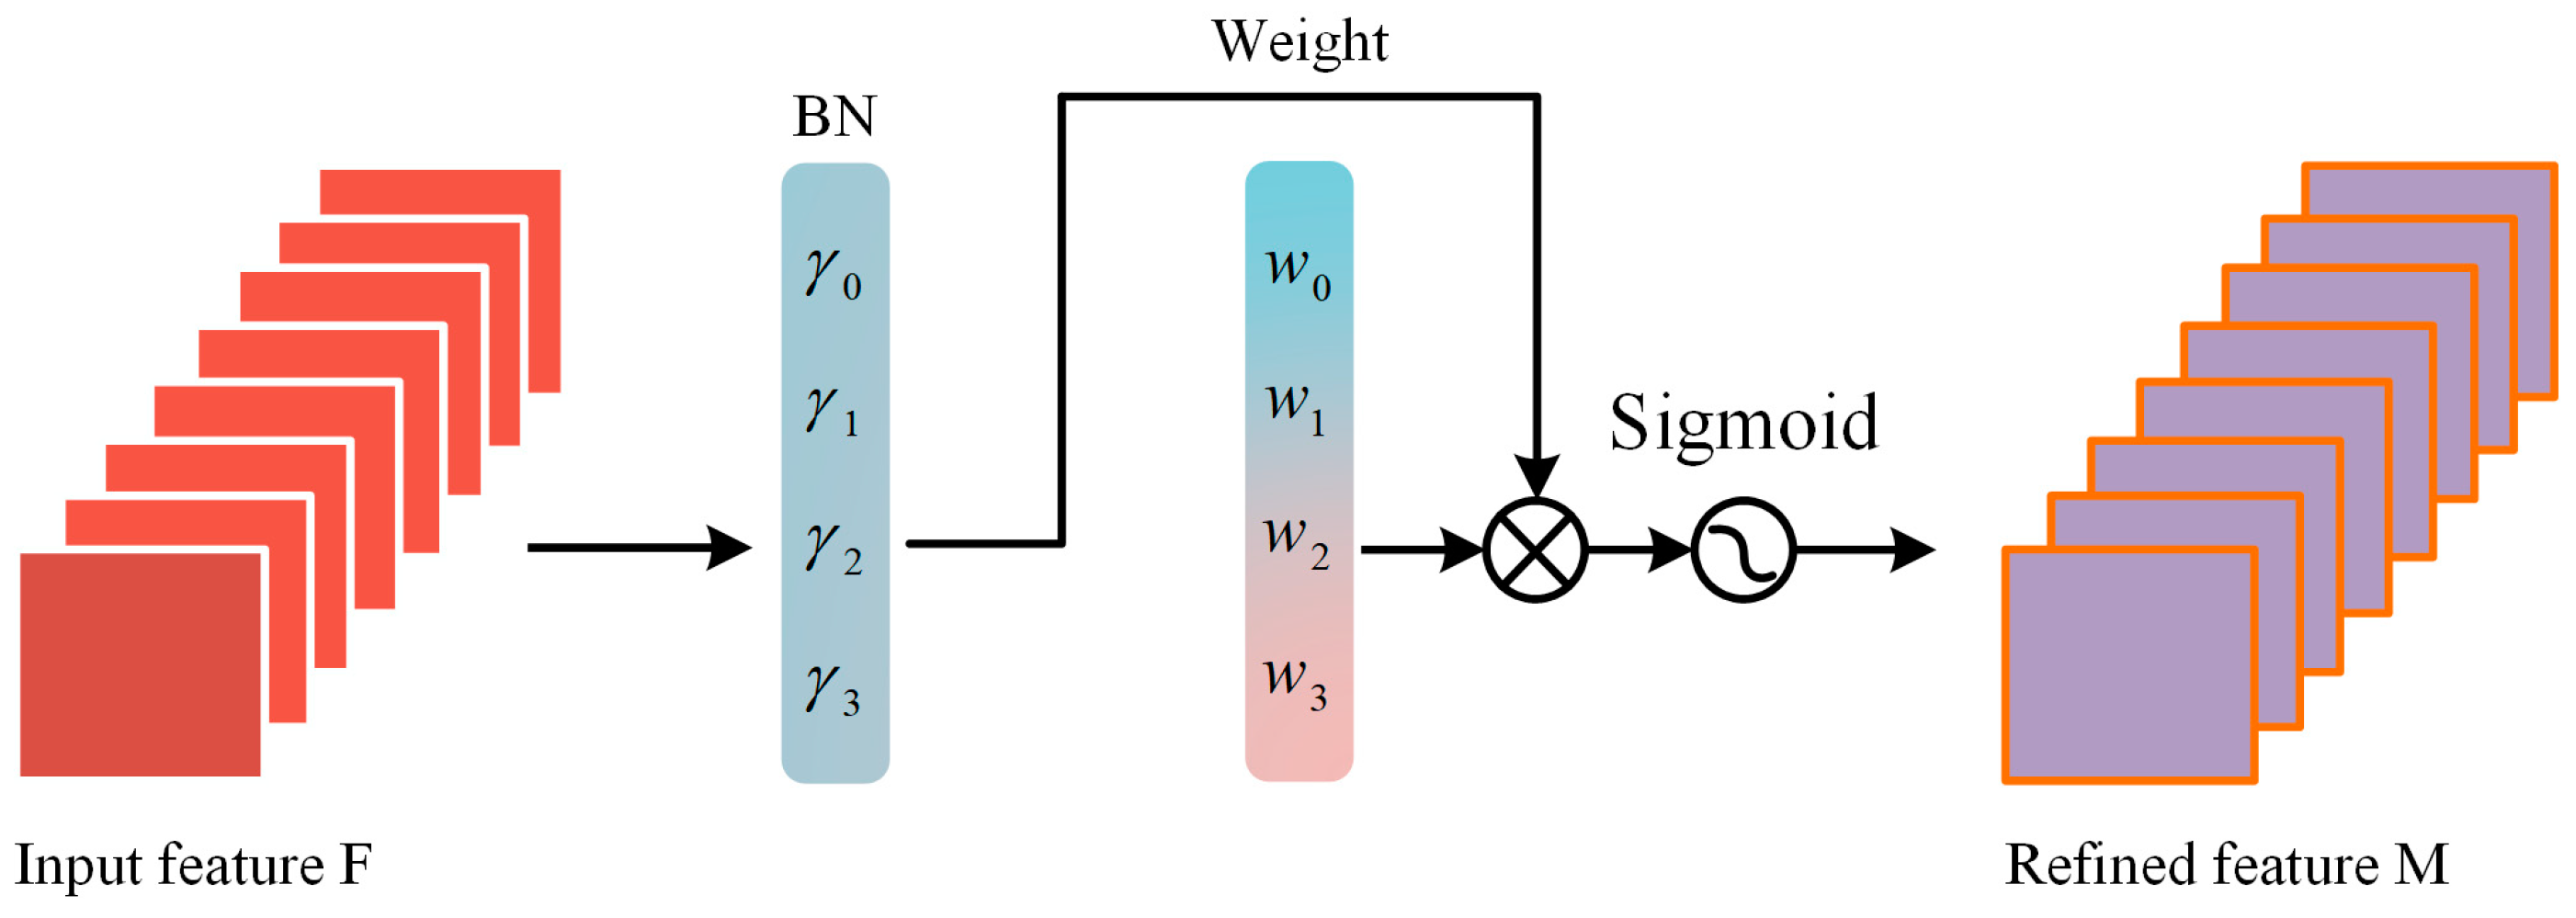
3.2. NAM Attention Module

NAM is based on the standardized attention module which is an efficient and lightweight attention mechanism. It adopts the same integration mode as the Convolutional Block Attention Module (CBAM) [20] and redesigns the channel and spatial attention sub-module, mainly to improve efficiency by suppressing less significant features. Recognition of less significant features is the key compressing the model, thus reducing the amount of computation. The NAM [21] module uses the weight factor to improve the attention mechanism, uses the scale factor of the batch to standardize, uses the standard deviation to express the importance of the weight and identifies the less significant features. The NAM structure diagram is shown in Figure 5.

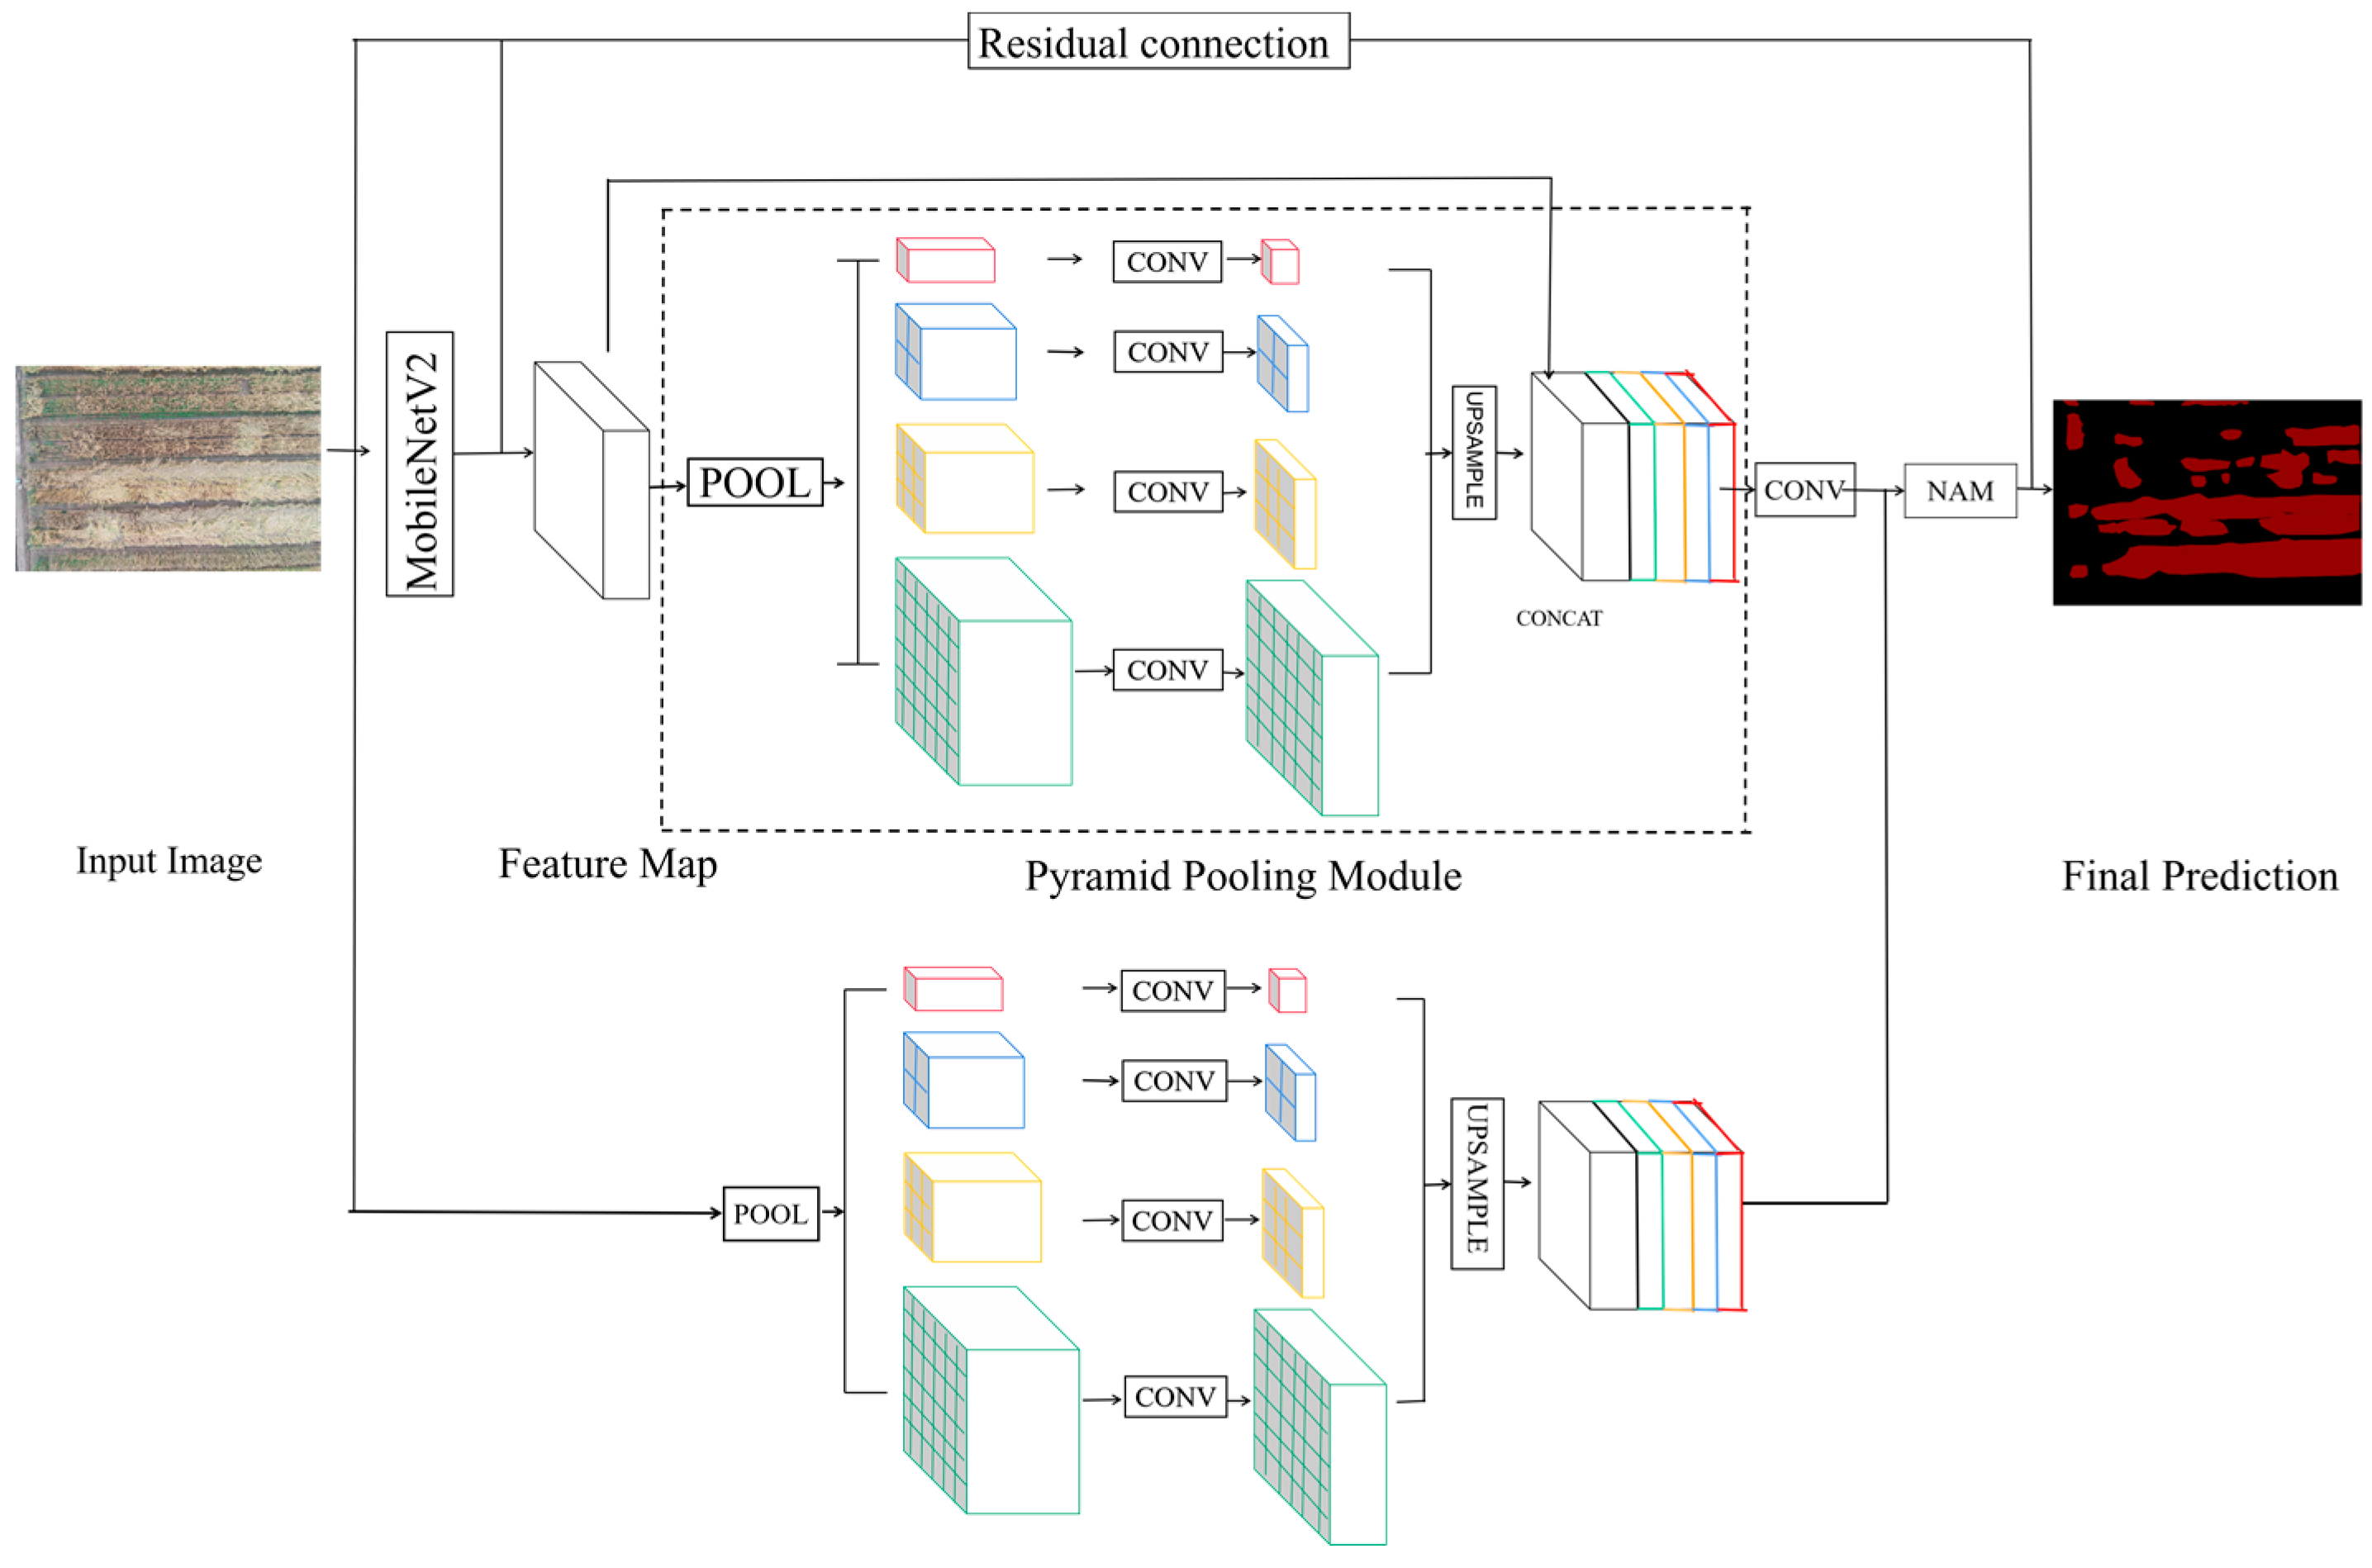
3.3. Structure of the NAM-PSPNet

PSPNet was proposed by Zhao et al. [22] to develop global context information through context aggregation based on different regions. In this paper, taking the PSPNet network framework as the main body, the following improvements are made as shown in Figure 6:
(1)
The lightweight neural network MobileNetV2 is used to replace ResNet as the feature extraction backbone network, MobileNetV2 is used as the backbone feature extraction network and the deep separable convolution is used to replace the standard convolution. That is, the deep separable convolution with a step of one is used at the beginning and end of the feature extraction network, and the deep separable convolution with a step of 2 is used for three consecutive times in the middle layer. Reduce the amount of model parameters and calculation and improve the segmentation speed. The residual connection is introduced to extract the features that may be ignored by the original PSPNet.
(2)
Construct a pyramid pool structure of multi-dimensional feature fusion. Using the method of U-Net [23] multi-dimensional feature cascade for reference, the multi-scale feature is further extracted.
(3)
Add the NAM attention module to recognize the less obvious features, so as to compress the model, reduce the calculation and improve the segmentation accuracy.

4. Training of NAM-PSPNet and Evaluation Metrics

4.1. Image-Label Datasets

Establish the data set of wheat lodging for dynamic monitoring of wheat lodging area and the dataset of the impact of different scales on wheat lodging area extraction: First of all, the wheat images taken by UAV are screened, and the images with the same proportion of wheat lodging and no lodging, the images without image distortion caused by the interference of natural factors during the acquisition process, and the images with moderate exposure and good image quality are screened; Secondly, in order to more effectively increase the diversity of the data set, improve the robustness of the segmentation model and avoid the over-fitting phenomenon of the model due to insufficient data volume in the training process, the expansion of the data set for each group of image data is realized through the expansion methods of flipping, rotating, brightness and contrast enhancement; Then, the original image of the UAV and the corresponding tag image are clipped using the sliding window method, and the size of each sliding window is set to 256 × 256; that is, the size of the final training image is 256 pixels × 256 pixels; Finally, the original map and label map of the UAV at the height of 20 m and 40 m in the wheat grain-filling stage and mature stage are made into a VOC format dataset. The data is divided into training sets and test sets according to the ratio of 7:3, and the training set is divided into training and training verification parts according to the ratio of 8:2. Store the randomly selected data set with the corresponding proportion in the ImageSets folder as a txt file, store the original image data and label data in the JPEGImages and SegmentationClass folders, respectively.

4.2. Model Training

The model training is based on the Windows10 operating system. The selected programming language is Python 3.9 programming language. At the same time, the Python in-depth learning framework is adopted, and TensorFlow is used as the back end. It runs under the Intel Xeon Gold 6248R processor, 192Gb memory, NVIDIA Quadro P4000 graphics card and GPU (CUDA 10.0) environment. The NAM-PSPNet model is trained to determine the parameters in the training process and initialize the parameters of the NAM-PSPNe model. The images and labels of the training set of UAV wheat image data of different growth periods and different heights are input into the NAM-PSPNe model, and finally the wheat lodging area is predicted. The parameters of all models in the training paper are shown in Table 1.
The LOSS used in training consists of two parts: Cross Entropy Loss and Dice Loss. Cross Entropy Loss is the common cross entropy loss. It is used when the semantic segmentation platform uses Softmax to classify pixels. Dice loss takes the evaluation index of semantic segmentation as the loss. Dice coefficient is a set similarity measurement function which is usually used to calculate the similarity of two samples, and the value range is within the scope of [0, 1].
The calculation formula is expressed as:
s = 2 | X Y | | X | + | Y |
where X and Y represent the predicted result and the true result, respectively, and the Dice coefficient is the product of the predicted result and the true result plus two, divided by the predicted result plus the true result. Its value is between zero and one. The larger the predicted result is, the greater the coincidence between the predicted result and the actual result is. The bigger the Dice coefficient is, the better. If it is a loss, the smaller the better; so make Dice loss = 1 − Dice, you can use loss as the loss of semantic segmentation.

4.3. Evaluation Metrics

The evaluation indicators of wheat lodging area extraction used here are the MPA (Mean Pixel Accuracy), MIoU (Mean Intersection over Union), Accuracy, Precision and Recall. The extraction results of wheat lodging can be divided into TP is the lodging feature of correct detection, TN is the non-lodging feature of correct detection, FP is the non-lodging feature of false detection as lodging feature and FN is the lodging feature of wheat that is false detection as non-lodging feature.
MPA is the average value of the ratio of correctly classified pixel points and all pixel points in the two categories of lodging and non-lodging.
M P A = 1 k + 1 × i = 0 k p i i j = 0 k p i j
where k represents the number of categories, pii represents the number of pixels that are correctly classified and pij represents the number of pixels that belong to class i but are predicted to be class j.
MIoU calculates the intersection ratio between the real lodging of the tag and the lodging predicted by the system.
M I o U = 1 k + 1 i = 0 k T P T P + F N + F P
where k represents the number of categories. The MIoU reflects the coincidence degree between the predicted image and the real image. The closer the ratio is, the higher the degree of coincidence is and the higher the quality of semantic segmentation is.
Accuracy is used to evaluate the global accuracy of the model.
A c c u r a c y = T P + T N T P + T N + F P + F N
Precision represents the proportion of the number of pixels correctly extracted as the wheat lodging area in the image to be tested.
P r e c i s i o n = T P T P + F P
Recall is the proportion of all wheat pixels in the test set that are correctly recognized as wheat lodging area pixels.
R e c a l l = T P T P + F N

4.4. Comparison Models

In order to dynamically monitor the wheat lodging area and analyze the extraction of wheat lodging area from different scale data, the data sets of 20 m grain-filling wheat, 20 m mature wheat, 40 m grain-filling wheat and 40 m mature wheat were input into the network training. U-Net, SegNet and DeepLabv3+ are classic models in semantic segmentation networks. These three models were selected as comparative experimental models. At the end of the model training, the optimal training weight is obtained to predict the wheat lodging area.

5. Results and Discussion

In order to dynamically monitor the lodging status of wheat, the wheat lodging area was extracted from the UAV images of the 20 m wheat grain filling stage and the mature stage. The four extraction models of U-Net, SegNet, DeepLabv3+ and NAM-PSPNet are used. The four deep-learning network models all use the training set, verification set and test set made of the same wheat field lodging data. The results obtained are shown in Table 2, showing the wheat lodging extraction results of different deep learning networks.
It can be seen from the table that the MPA and MIoU values of U-Net reached 84.19% and 72.91%, respectively, the MPA and MIoU values of SegNet reached 81.88% and 71.25%. The MPA and MIoU values of DeepLabv3+ reached 88.87% and 81.81%, and the MPA and MIoU values of NAM-PSPNet reached 93.73% and 88.96%, respectively, in the extraction of wheat lodging areas using the four deep learning models. The NAM-PSPNet network is superior to the other three networks in the extraction of lodging data during the grouting period and also shows better results in the accuracy, precision and recall evaluation indicators. The extraction effect obtained by inputting the data of wheat maturity into the network training can be obtained. Because the lodging of wheat at maturity is easier to distinguish and the lodging texture feature is easier to predict by network learning, the data extraction result of wheat maturity is better than that of the data at grain-filling stage.
The extraction results of wheat lodging data at different growth stages show that the extraction effect of wheat lodging at the mature stage is better than that at the grain-filling stage. In order to explore the extraction of multi-scale wheat lodging areas in different spatial dimensions, the data of UAV wheat heights of 20 m and 40 m are used as input. The effects of different spatial scales on the extraction of wheat lodging were discussed using the data of mature wheat at two heights. Different deep learning networks are trained, and MPA and MIoU are used as evaluation indicators. The results are shown in Table 3.
The four deep-learning models can be used to extract the lodging of wheat at different heights. It can be seen that the extraction effect of the lodging data of the 20 m wheat UAV is better than that of the 40 m wheat UAV. Therefore, the lodging area prediction is performed for the 20 m mature UAV data, and the lodging area prediction diagram is shown in Figure 7. It can be seen from the prediction diagram that the edges of some prediction results in the U-Net network prediction diagram are too angular; The prediction results of the SegNet network, although the overall results are in good agreement with the label chart, have some prediction errors and less prediction; The prediction results of DeepLabv3+ network also have some wrong predictions and few predictions; The prediction results of NAM-PSPNet network are closest to the sample label data. By comparison and analysis, it can be concluded that NAM-PSPNet is superior to the other three networks in the extraction of the lodging area of UAV wheat data at different heights.
The analysis above demonstrates that wheat is more susceptible to damage during the process from the grain-filling stage to the maturity stage. Extracting information on the overwhelmed areas of wheat during this stage can provide a dynamic understanding of the overall damage situation which can offer timely warnings to local farmers, reduce their losses, ensure food security and be of great significance for guiding agricultural insurance. Using UAV images of different scales to extract fallen wheat areas and integrating multi-scale and multi-temporal characteristics of different heights and fertility stages, this provides relevant experience for the development of smart agriculture.
To evaluate the effectiveness of the proposed method in this paper, we compared the wheat inversion region extraction results of the original PSPNet and NAM-PSPNet using mature wheat at 20 m and 40 m heights as the dataset for this experiment. The experimental results are presented in Table 4.
Based on the experimental results, it is evident that PSPNet achieved an MPA of 92.15% and an MIoU of 85.33% in the extraction of wheat inversion region at 20 m maturity which were 2.47% and 3.99% lower than those of NAM-PSPNet, respectively. Similarly, in the extraction of wheat inversion region at 40 m maturity, PSPNet achieved an MPA and MIoU of 92.07% and 85.28%, respectively, which were 2.28% and 3.68% lower than those of NAM-PSPNet. These findings demonstrate the effectiveness and superiority of NAM-PSPNet in wheat inversion region extraction. In our study, the UAV-based RGB images of wheat lodging areas at different growth stages and heights are used as the research object. Based on the NAM-PSPNet model, a better extraction effect is obtained for wheat lodging areas. Compared with the Ref. [4], which uses an improved U-Net network for rice lodging area extraction from UAV RGB and multi-spectral images, although better extraction results are obtained, multiple heights and growth stages of images are not integrated, limiting the accuracy improvement. The Ref. [14] combined transfer learning with DeepLabv3+ to extract wheat lodging, but the accuracy still needs improvement compared to our study. The proposed method in this study provides a relevant reference for the agricultural UAV remote sensing field and offers a related experience for those engaged in remote sensing image processing.

6. Conclusions

The application prospect of UAV low altitude remote sensing in intelligent agriculture is very broad. Extraction of the wheat lodging areas via UAV-based RGB images is also one of the most critical research topics in agricultural remote sensing research. With the change of wheat growth period, the extraction of wheat lodging area can show the change of wheat lodging trend to agricultural technicians in time, so that agricultural technicians can take remedial measures in time and reduce losses. In this paper, DJI Phantom 4 pro is used to obtain the RGB images of UAV wheat at the height of 20 m and 40 m at the grain-filling stage and maturity stage and to produce the UAV wheat lodging data sets at different growth stages and different heights. In our study, the NAM-PSPNet network is proposed to monitor the dynamic wheat lodging areas, and the images of wheat lodging area extracted from different scale data is also discussed. It can be seen from the comparison experiment that the extraction effect of the proposed model is better, and the evaluation index is better than other comparison algorithms. In the experimental design, the acquired data sets have errors in the process of manual annotation. Future research should explore the networks with stronger network fault tolerance and the use of semi-supervised methods to improve extraction accuracy and deal with more complex application scenarios.

Author Contributions

Y.L. and L.H. conceived and designed the experiments; J.Z. and Z.L. performed the experiments; J.Z. analyzed the data; J.Z., Z.L., Y.L. and L.H. wrote the paper. All authors have read and agreed to the published version of the manuscript.

Funding

This research was funded by the Industry–University Collaborative Education Project of Ministry of Education (220606353282640), Provincial Quality Engineering Project of Anhui Provincial Department of Education (2021jyxm0060), Natural Science Foundation of Anhui Province (2008085MF184), National Natural Science Foundation of China (31971789) and Science and Technology Major Project of Anhui Province (202003a06020016).

Data Availability Statement

Not applicable.

Conflicts of Interest

The authors declare no conflict of interest.

References

  1. Zhang, H.-J.; Li, T.; Liu, H.-W.; Mai, C.-Y.; Yu, G.-J.; Li, H.-L.; Yu, L.-Q.; Meng, L.-Z.; Jian, D.-W.; Yang, L.; et al. Genetic progress in stem lodging resistance of the dominant wheat cultivars adapted to Yellow-Huai River Valleys winter wheat zone in China since 1964. J. Integr. Agric. 2020, 19, 438–448. [Google Scholar] [CrossRef]
  2. Shewry, P.R.; Hey, S.J. The contribution of wheat to human diet and health. Food Energy Secur. 2015, 4, 178–202. [Google Scholar] [CrossRef] [PubMed]
  3. Shah, L.; Yahya, M.; Shah, S.M.A.; Nadeem, M.; Ali, A.; Ali, A.; Wang, J.; Riaz, M.W.; Rehman, S.; Wu, W.; et al. Improving lodging resistance: Using wheat and rice as classical examples. Int. J. Mol. Sci. 2019, 20, 4211. [Google Scholar] [CrossRef] [PubMed]
  4. Zhao, X.; Yuan, Y.; Song, M.; Ding, Y.; Lin, F.; Liang, D.; Zhang, D. Use of unmanned aerial vehicle imagery and deep learning unet to extract rice lodging. Sensors 2019, 19, 3859. [Google Scholar] [CrossRef] [PubMed]
  5. Yang, M.D.; Boubin, J.G.; Tsai, H.P.; Tseng, H.H.; Hsu, Y.C.; Stewart, C.C. Adaptive autonomous UAV scouting for rice lodging assessment using edge computing with deep learning EDANet. Comput. Electron. Agric. 2020, 179, 105817. [Google Scholar] [CrossRef]
  6. Liu, T.; Li, R.; Zhong, X.; Jiang, M.; Jin, X.; Zhou, P.; Liu, S.; Sun, C.; Guo, W. Estimates of rice lodging using indices derived from UAV visible and thermal infrared images. Agric. For. Meteorol. 2018, 252, 144–154. [Google Scholar] [CrossRef]
  7. Burkart, A.; Aasen, H.; Alonso, L.; Menz, G.; Bareth, G.; Rascher, U. Angular dependency of hyperspectral measurements over wheat characterized by a novel UAV based goniometer. Remote Sens. 2015, 7, 725–746. [Google Scholar] [CrossRef]
  8. Li, Z.; Chen, Z.; Ren, G.; Li, Z.; Wang, X. Estimation of maize lodging area based on Worldview-2 image. Trans. Chin. Soc. Agric. Eng. 2016, 32, 1–5. [Google Scholar]
  9. Dai, X.; Chen, S.; Jia, K.; Jiang, H.; Sun, Y.; Li, D.; Zheng, Q.; Huang, J. A decision-tree approach to identifying paddy rice lodging with multiple pieces of polarization information derived from Sentinel-1. Remote Sens. 2022, 15, 240. [Google Scholar] [CrossRef]
  10. Sun, Y.; Liu, P.; Zhang, Y.; Song, C.; Zhang, D.; Ma, X. Extraction of winter wheat planting area in Weifang based on Sentinel-2A remote sensing image. J. Chin. Agric. Mech. 2022, 43, 98–105. [Google Scholar]
  11. Tang, Z.; Sun, Y.; Wan, G.; Zhang, K.; Shi, H.; Zhao, Y.; Chen, S.; Zhang, X. Winter wheat lodging area extraction using deep learning with GaoFen-2 satellite imagery. Remote Sens. 2022, 14, 4887. [Google Scholar] [CrossRef]
  12. Gao, L.; Yang, G.; Yu, H.; Xu, B.; Zhao, X.; Dong, J.; Ma, Y. Winter Wheat Leaf Area Index Retrieval Based on UAV Hyperspectral Remote Sensing. Trans. Chin. Soc. Agric. Eng. 2016, 32, 113–120. [Google Scholar]
  13. Tang, Z.; Sun, Y.; Wan, G.; Zhang, K.; Shi, H.; Zhao, Y.; Chen, S.; Zhang, X. A quantitative monitoring method for determining Maize lodging in different growth stages. Remote Sens. 2020, 12, 3149. [Google Scholar]
  14. Zhang, D.; Ding, Y.; Chen, P.; Zhang, X.; Pan, Z.; Liang, D. Automatic extraction of wheat lodging area based on transfer learning method and deeplabv3+ network. Comput. Electron. Agric. 2020, 179, 105845. [Google Scholar] [CrossRef]
  15. Zheng, E.G.; Tian, Y.F.; Chen, T. Region extraction of corn lodging in UAV images based on deep learning. J. Henan Agric. Sci. 2018, 47, 155–160. [Google Scholar]
  16. Mardanisamani, S.; Maleki, F.; Kassani, S.H.; Rajapaksa, S.; Duddu, H.; Wang, M.; Shirtliffe, S.; Ryu, S.; Josuttes, A.; Zhang, T.; et al. Crop lodging prediction from UAV-acquired images of wheat and canola using a DCNN augmented with handcrafted texture features. In Proceedings of the IEEE/CVF Conference on Computer Vision and Pattern Recognition Workshops, Long Beach, CA, USA, 16–20 June 2019. [Google Scholar]
  17. Yang, B.; Zhu, Y.; Zhou, S. Accurate wheat lodging extraction from multi-channel UAV images using a lightweight network model. Sensors 2021, 21, 6826. [Google Scholar] [CrossRef] [PubMed]
  18. Varela, S.; Pederson, T.L.; Leakey, A.D.B. Implementing spatio-temporal 3D-convolution neural networks and UAV time series imagery to better predict lodging damage in sorghum. Remote Sens. 2022, 14, 733. [Google Scholar] [CrossRef]
  19. Torralba, A.; Russell, B.C.; Yuen, J. LabelMe: Online image annotation and applications. Proc. IEEE 2010, 98, 1467–1484. [Google Scholar] [CrossRef]
  20. Woo, S.; Park, J.; Lee, J.Y.; Kweon, I.S. Cbam: Convolutional block attention module. In Proceedings of the European Conference on Computer Vision (ECCV), Munich, Germany, 8–14 September 2018; pp. 3–19. [Google Scholar]
  21. Liu, Y.; Shao, Z.; Teng, Y.; Hoffmann, N. NAM: Normalization-based attention module. arXiv 2021, arXiv:2111.12419. [Google Scholar]
  22. Zhao, H.; Shi, J.; Qi, X.; Wang, X.; Jia, J. Pyramid scene parsing network. In Proceedings of the IEEE Conference on Computer Vision and Pattern Recognition, Honolulu, HI, USA, 21–26 July 2017; pp. 2881–2890. [Google Scholar]
  23. Ronneberger, O.; Fischer, P.; Brox, T. U-net: Convolutional networks for biomedical image segmentation. In Medical Image Computing and Computer-Assisted Intervention–MICCAI 2015: 18th International Conference, Munich, Germany, 5–9 October 2015; Proceedings, Part III 18; Springer International Publishing: Cham, Switzerland, 2015; pp. 234–241. [Google Scholar]
Figure 1. Geographical location of Guohe Farm, Lujiang County, Hefei City, Anhui Province, China.
Agronomy 13 01309 g001
Figure 2. The picture of DJI Phantom 4 pro for collecting UAV images.
Agronomy 13 01309 g002
Figure 3. (a) Original map and label map of wheat during grain-filling period of 20 m UAV, (b) Original map and label map of wheat during grain-filling period of 40 m UAV, (c) Original map and label map of mature wheat of 20 m UAV, (d) Original map and label map of mature wheat of 40 m UAV.
Agronomy 13 01309 g003
Figure 4. Technical roadmap of the study.
Agronomy 13 01309 g004
Figure 5. Structure of NAM attention module.
Agronomy 13 01309 g005
Figure 6. Structure diagram of the NAM-PSPNet network.
Agronomy 13 01309 g006
Figure 7. UAV wheat original map, label map and network prediction map.
Agronomy 13 01309 g007
Table 1. Network model training parameter configuration.
ParameterValue
Batch_size32
Learning_rate5 × 10−3
Input_shape256 × 256
Num_classes2
Epoch150
Table 2. Extraction effect evaluation.
ApproachGrowth PeriodMPA (%)MioU (%)Accuracy (%)Precision (%)Recall (%)
U-NetGrain-filling84.1972.9189.9584.4679.52
Maturity90.7983.8191.6091.5892.77
SegNetGrain-filling 81.8871.2585.3382.4876.83
Maturity83.8472.7089.2983.2277.59
DeepLabv3+Grain-filling 88.8781.8191.6685.3680.55
Maturity 91.4484.0792.0186.4381.40
NAM-PSPNetGrain-filling 93.7388.9694.1293.7894.82
Maturity 94.6289.3294.9594.3095.43
Table 3. Evaluation and comparison among the NAM-PSPNet and other methods.
Flight AltitudeEvaluation MetricsU-NetSegNetDeepLabv3+NAM-PSPNet
20 mMPA (%)90.7981.8891.4494.62
MIoU (%)83.8171.2584.0789.32
40 mMPA (%)89.6583.4989.8194.35
MIoU (%)82.6472.1981.1888.96
Table 4. Evaluation and comparison between PSPNet and NAM-PSPNet.
Flight AltitudeEvaluation MetricsPSPNetNAM-PSPNet
20 mMPA (%)92.1594.62
MIoU (%)85.3389.32
40 mMPA (%)92.0794.35
MIoU (%)85.2888.96
Disclaimer/Publisher’s Note: The statements, opinions and data contained in all publications are solely those of the individual author(s) and contributor(s) and not of MDPI and/or the editor(s). MDPI and/or the editor(s) disclaim responsibility for any injury to people or property resulting from any ideas, methods, instructions or products referred to in the content.

