Article

Optimizing Rice Sowing Dates for High Yield and Climate Adaptation in Central China

1
College of Agriculture, Yangtze University, Jingzhou 434025, China
2
Wuhan Regional Climate Center, Wuhan 430074, China
3
Institute of Environment and Sustainable Development in Agriculture, Chinese Academy of Agricultural Sciences, Beijing 100081, China
4
Jingzhou Agricultural Meteorological Experiment Station, Jingzhou 434020, China
5
Department of Soil and Environmental Sciences, Ghazi University, Dera Ghazi Khan 32200, Pakistan
6
Agricultural Information Institute, Chinese Academy of Agricultural Sciences, Beijing 100081, China
*
Authors to whom correspondence should be addressed.
These authors contributed equally to this work.
Agronomy 2023, 13(5), 1339; https://doi.org/10.3390/agronomy13051339
Submission received: 17 April 2023 / Revised: 8 May 2023 / Accepted: 9 May 2023 / Published: 10 May 2023

Abstract

:
Optimizing the sowing date of rice can change the seasonal patterns and distributions of climate factors during the crop growing season, making it one of the most effective ways to adapt to climate change and achieve high yield. A four–year field experiment (2018–2021) was conducted at Jingzhou Agricultural Meteorological Experiment Station, central China, with four different sowing dates (SD) each year, late April (SD1), early May (SD2), mid–May (SD3) and late May (SD4). Dry matter accumulation, grain yield and climate conditions were observed across sowing dates. Our findings revealed that delaying the sowing date from early May to mid or late May could increase grain yield by 5.6% to 8.6%. However, sowing too early could increase heat stress, decrease the net effective accumulated temperature, inhibit rice growth, and reduce grain yield. On the other hand, sowing too late could increase the risk of low temperatures after flowering. From the perspective of increasing net effective accumulated temperature, reducing heat stress and low temperature after flowering, mid to late May was the most favorable sowing date to ensure high yield. It is suggested that optimizing rice sowing dates can effectively avoid the threat of heat stress and better match thermal resources, thereby increasing rice productivity.

1. Introduction

As the largest rice (Oryza sativa L.) producing and consuming country, China’s rice production has accounted for about 37% of the global rice production [1]. Rice is the most important grain crop in China, which accounts for about 26% and 32% of total crop area and production, respectively [2]. During the past 30 years, rice yield has increased by around 9.3% [3], while continued yield improvement is still needed to ensure food security. The main rice growing systems in China include single–cropping rice, double–cropping rice, rice–wheat, or rapeseed rotation. In central China, rice is often sown in early May. Central China accounts for nearly 24% of China’s rice production [2], making it an important and typical rice cultivation area.
The most significant and uncontrollable factor influencing crop yield has been assumed to be climate [4,5]. Previous studies have documented that increases in temperatures have accelerated rice phenology development, thus decreasing crop yield [6,7,8,9]. Furthermore, many research works have also emphasized the compound climate risk that occurs during the rice reproductive stage, such as heading, flowering, and early grain filling stage, which would normally cause a great loss in yield [10,11,12]. High temperature during flowering is well known to cause spikelet sterility and reduce yield in rice [13], and temperature at grain filling is a significant factor influencing spikelet fertility, 1000–grain weight [14], and rice quality [15]. The maximum, optimum, and base temperature of rice anthesis phases were approximately 37 °C, 25 °C and 15 °C, respectively, while the maximum and base temperature of rice grain filling stage were nearly 30 °C and 20 °C [8]. Different rice varieties had different temperature thresholds. Welch and Vincent [16] found that increasing maximum temperature (Tmax) improves rice yield. However, Pattanayak and Kumar [4] showed that Tmax was the primary source of yield reduction, especially during the reproductive stage, and the Tmax played a larger role in reducing rice yield than minimum temperature (Tmin). The response of rice yield to changes in Tmin was insignificant, and the temperature effects varied by rice–growth stage after statistically analyzing 30 years of weather and yield data in China [17]. An increase in average daily temperature may shorten crop growth and thus reduce crop yields [18]. In central China, the main climate resource that restricts rice production is heat resources. If sown too early, it will generally encounter heat stress from heading to grain filling, and if sown too late, it will also cause low temperatures after flowering. Therefore, an appropriate sowing date is crucial for grain yield in central China.
Increasing crop production adaptation to climate change is one of the most effective ways to ensure global food security. Regulating the sowing date has been proposed as the most efficient and cost–effective method of adjusting the distribution and patterns of climate factors during the crop growing season, thereby mitigating the negative climate impacts on rice production in China [6]. Choosing the best sowing date to maximize yield is the simplest and least expensive adaptation for farmers. As a result, it would be crucial to change the patterns of climate factors to coincide with rice growth.
Some researchers suggested that adjusting the rice sowing date in Sichuan province could improve dry matter accumulation and grain yield [19]. This is owing to higher solar radiation and lower temperature during the growing season, which contributed to higher dry matter accumulation pre– and post–anthesis and a greater number of panicles. Tu and Jiang [20] investigated the rice responses to temperature and solar radiation variations and suggested that delaying the sowing date could stabilize and improve rice yield and resource use efficiency in central China. A similar study has been reported in India that the delay of the sowing date increased the amount of dry matter and nitrogen uptake at anthesis, which increased the grain yield of rice [21]. Overall, adjusting the sowing date to synchronize crop growth stages with optimal climate factors appears to be a practical and eco–friendly approach to maintaining high grain yield, while mitigating negative climate impacts. Therefore, it is important to adjust the original rice sowing date in order to make better use of climatic factors and avoid the occurrence of extreme events that cause yield decline. From 2018 to 2021, a four–year field experiment was conducted with different rice sowing dates, and the responses of rice growth and variations in climate resources were synchronously observed to investigate the most suitable sowing date.

2. Materials and Methods

2.1. Experimental Site and Design

Field experiments were conducted from 2018 to 2021 at the Jingzhou Agrometeorological Experiment Station (30°21′ N, 112°09′ E), Hubei Province, China. The experimental site is located in the center of Jianghan plain, which has a subtropical monsoon climate with annual precipitation of 1100–1300 mm and a mean annual temperature of 15.9–16.6 °C. The soil is classified as gleyic paddy soil after years of rice cultivation, with a medium loam texture, and the soil nutrient characteristics are shown in Table 1. The main meteorological elements for 2018 to 2021 were collected from Jingzhou agrometeorological experiment station.
The rice variety of Fengliangyouxiang 1 (FLYX 1) was chosen owing to its high quality and high yield. It is one of the most ordinary hybrid rice varieties planted in central China. The detailed sowing and transplanting dates for each year are shown in Table 2. Treatments were arranged in a randomized complete block design with four replicates, each area is 20 m2 (4 m × 5 m). For rice seedlings with different sowing dates, Pre–germinated seeds were sown in a seedbed. Thirty–day–old seedlings were transplanted to the field, Transplanting was conducted at a hill spacing of 20 cm × 18 cm with two seedlings per hill. N fertilizer was applied at the basal, tillering, and panicle initiation stages in a ratio of 5:2:3: 90, 36, and 54 kg N ha−1 respectively. Phosphorus (80 kg ha−1) was applied and incorporated into all subplots on the day before transplantation. Potassium (100 kg ha−1) was split equally between the basal and panicle initiation stages. The N, P, and K sources were urea, calcium superphosphate, and potassium chloride, respectively. Crop management followed the standard cultural practices.

2.2. Plant Sampling and Analysis

At the jointing, heading, and maturity stage, aboveground biomass was measured. Twenty–five representative plants were taken from each plot at each sowing date, and plant samples were first dried in an oven at 105 °C for 30 min, then dried at 70 °C to constant weight, and weighted to obtain aboveground biomass. At maturity stage, panicle number, spikelet number per panicle, spikelet fertility, and 1000–grain weight were measured in the fifth plot. The whole samples were collected, and divided into four parts as replications, for grain yield and panicle number (excluding plants at plot borders). Two planting pits of rice plants were chosen to observe spikelet number per panicle, filled and empty grains to calculate the spikelet fertility (seed setting rate, %) and 1000–grain weight.
The dry matter accumulation rate (DMAR, kg·ha−1·d−1) at different growth stages of rice was calculated by Formula (1).
DMAR = (WbWa)/D
where Wb is the dry matter weight of the next growth period, Wa is the dry matter weight of the previous period, and D is the duration of a growth period of rice (days).

2.3. Thermal Resource

The net effective accumulated temperature (Aen), hot accumulated temperature (Hht) and cold accumulated temperature (Hct) were analyzed at the jointing to heading (J–H), heading to maturity (H–M), and whole growing stage in each sowing date, respectively. The stages of J–H and H–M were regarded to be the most critical for kernel setting in this study. Aen was calculated by accumulating mean daily temperature between 12 °C (B, biological zero point) and 27 °C (Bh, biological upper limit temperature). Usually, there are different temperature thresholds at different growth stages of rice. In light of agricultural practice in Jianghan Plain, Hubei, China. This study adopted the high–temperature threshold as 30 °C at J–H stage and 28 °C at H–M stage, and the low temperature threshold as 20 °C at the two stages. The hot accumulated temperature (Hht) was calculated by accumulating mean daily temperature above 30 °C during J–H and 28 °C during H–M [10], while the cold accumulated temperature (Hct) was calculated by the accumulating mean daily temperature above 20 °C [8]. Aen, Hht, and Hct are calculated by the following formulas.
A e n = T B T B h
H h t = T 30 or   28
H c t = ( T 20 )
where Aen is the net effective accumulated temperature, T is average temperature, B is biological zero point, Bh is biological upper limit temperature, Hht is the hot accumulated temperature, and Hct is the cold accumulated temperature. In Formula (2), while TB, then TB = 0; similarly, while TBh, then TBh = 0.

2.4. Statistics Analysis

The data were analyzed using the statistical program Excel 2019 and SPSS 23.0. Data are presented as mean ± standard error. A one–way analysis of variance (ANOVA), followed by LSD (Least Significant Difference) test was used to compare different factors among four sowing dates. The changing trend of climate variables at different sowing dates was determined by correlation analysis between climate variables and the days of the year in which each sowing date was located. Regression analysis was used to determine the relationship between grain yield components and effective accumulated temperature or harmful accumulated temperature.

3. Results

3.1. Grain Yield and Yield Components

In the four–year experiment, the grain yield was 7382.1 to 10,693.9 kg·ha−1 evenly, the year with the lowest grain yield was 2020, which may be due to higher rainfall year within 2020. Grain yield increased with sowing date delay in all four years, and slightly decreased in SD4. Compared with SD1, the four–year average yield of SD2, SD3, and SD4 increased by 7.6%, 15.5%, and 12.7%, respectively. The yield of SD3 and SD4 was more than that in SD2 and increased by 5.6~8.6% (Table 3). This indicated that proper delay of the sowing date is beneficial in increasing rice yield.
Among the yield components, SD3 almost had the most panicle number, spikelet number, spikelet fertility, and 1000–grain weight, and these were primarily influenced by climatic variables during J–H and H–M stages, respectively. There were significant differences between sowing dates in spikelet number per panicle and spikelet fertility rate in sowing dates, and the significance in spikelet fertility and 1000–grain weight were not obvious. The yield components of SD3 and SD4 were both greater than SD2.

3.2. Dry Matter Accumulation Rate (DMAR)

During the four–year field experiment, the Dry matter accumulation rate (DMAR) at different sowing dates increased rapidly at first and then decreased (Figure 1). The DMAR of SD2 and SD3 were generally larger than that of SD1 and SD4, and the maximum DMAR in J–H and H–M stages both occurred in SD3, except for the J–H stage in 2019, with high reproducibility of the four–year experiment. Compared with SD1, the DMAR of SD4 was usually larger, except for 2019. DMAR of SD3 differed significantly from other sowing dates (p < 0.05) in both J–H and H–M stage. Compared with SD2 (normal sowing date), DMAR of SD1 and SD4 decreased by 51.7% and 2.4% in J–H, and increased by 19.9% at that of SD3. Similarly in H–M, the DMAR of SD1 and SD4 decreased by 12.8% and 3.6% compared with SD2 and increased by 8.7% evenly at that of SD3.
The error bars represent the standard error. Different letters on the error bars express the significance of the difference of the LSD test at p < 0.05).

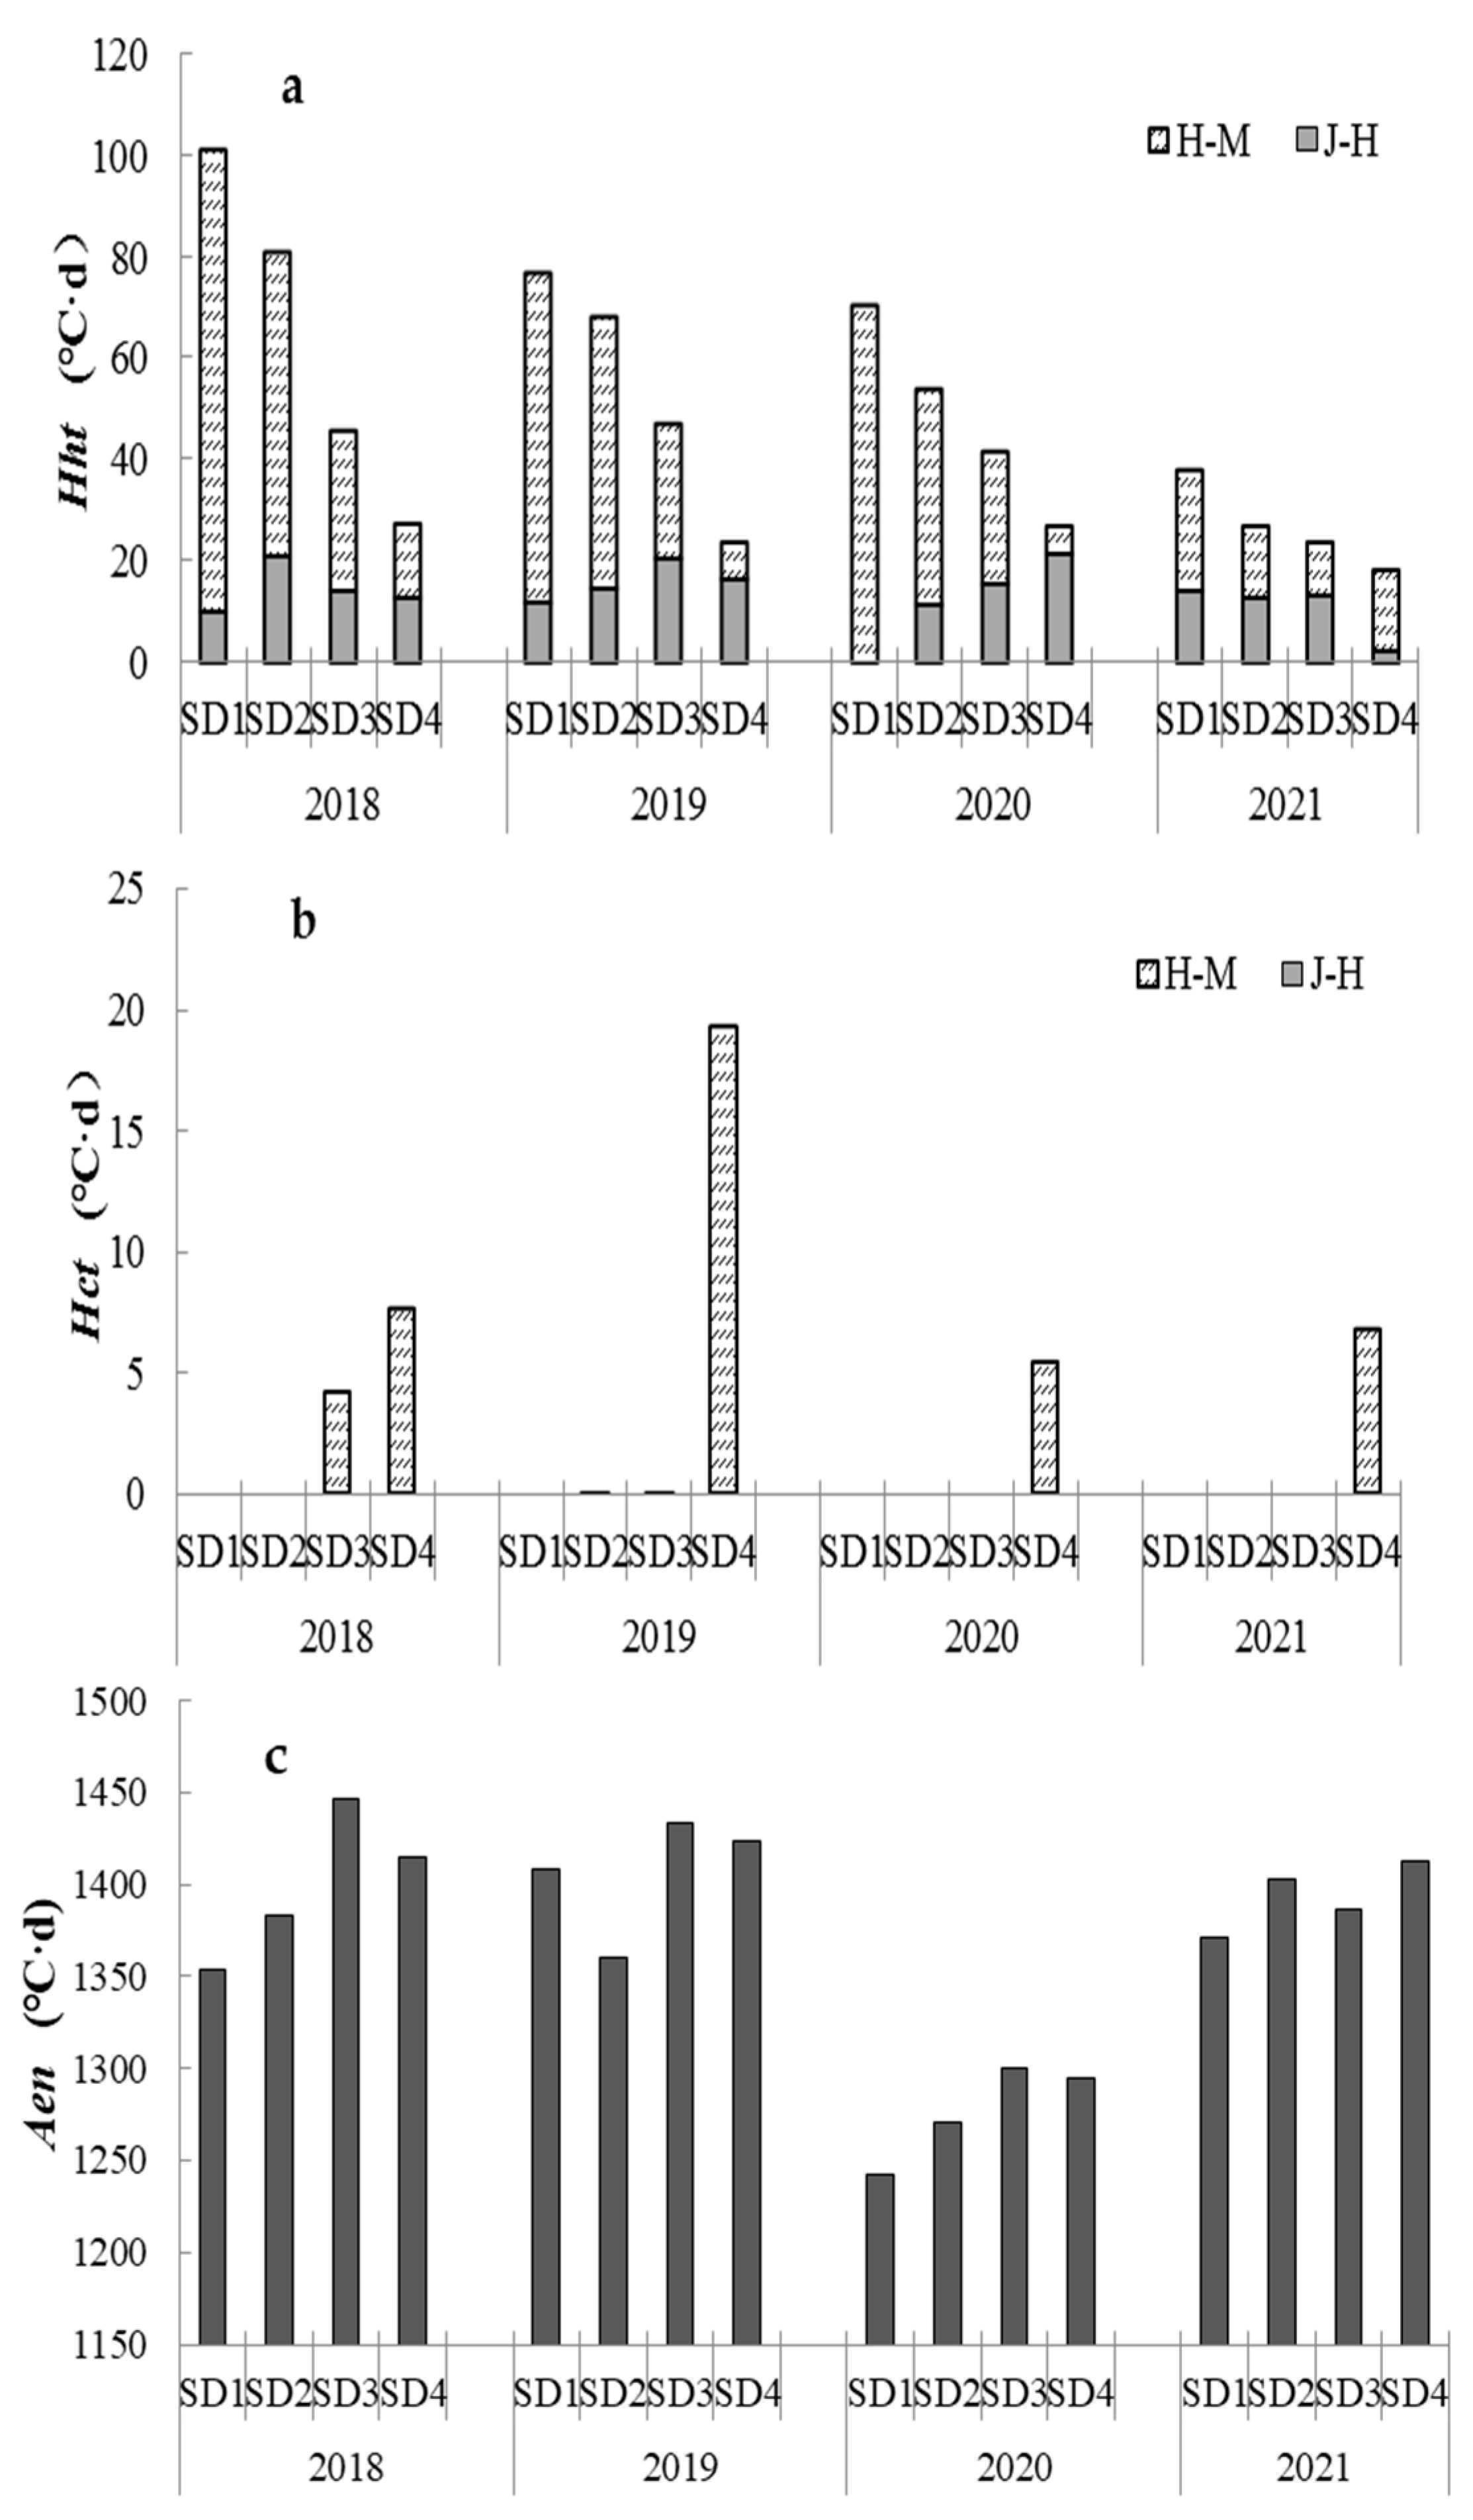
3.3. Thermal Resource

The monthly precipitation and temperature of the rice growing stage from 2018 to 2021 were shown in Figure 2. In the four years, July and August were the hottest months, which were the stage of heat stress in rice. Late September and October were the stages of low temperature after flowering. The total precipitation of the rice growing stage in 2018, 2019 and 2021 was 652.9 mm, 647.2 mm, and 712.0 mm, respectively, but in 2020, it was 70% higher than the average of the other three years, reached 1141.6 mm. The variation in monthly precipitation was relatively large too. Generally, there was more precipitation in the early stage of rice growth (April–July), and less in the later stage (August–October). But in 2020, the monthly precipitation in September and October were still very high, occurred an autumn flood.
Thermal resources differ greatly at different sowing dates (Figure 3). Heat stress and low temperature after flowering generally occurred during the jointing to maturity stage, which had the greatest impact on grain yield. The Hht and Hct in the J–H and H–M stage of 16 sowing dates were shown in Figure 3a,b. In the J–H stage, the variation in Hht was generally between 0–20 °C·d, and there was no obvious regularity of increasing or decreasing with the postponement of the sowing date. But in the H–M stage, the downward trend was very obvious, and they had the same performance in four years of experiments. Therefore, delaying the sowing date could significantly reduce the heat stress. On the contrary, low temperatures after flowering only occurred in the H–M stage. From 2018 to 2021, low temperature after flowering occurred every year in SD4, and in SD3 of 2018, the highest Hct could reach to 20 °C·d, which means that the low temperature after flowering could not be ignored while delaying the sowing date.
The Aen that removing Hht and Hct can objectively evaluate the thermal resource during rice growth. In Figure 3c, it was shown that, appropriately delaying the sowing date increased the thermal resource of rice growth, especially the beneficial portion of the heat that promotes rice growth. Among them, The Aen of SD4 was the highest, followed by SD4.

3.4. Relationship between Grain Yield and Thermal Resource

The regression method was used to examine the relationship between rice yield (DMAR, grain yield, panicle number, spikelet number, spikelet fertility, and 1000–grain weight) and heat qualification (Aen, Hht, and Hct) in the four–year experiment (Figure 4). The results revealed that, heat qualification, especially heat qualification in J–H and H–M stages, was closely related to the biomass and grain yield. Among them, Aen had the promoting effect on DMAR, grain yield, panicle number, and spikelet number, and Hht had the inhibition effect on spikelet fertility and 1000–grain weight. Due to the lower frequency and intensity of low temperature after flowering, compared to heat stress, there was no significant regression significance of negative effect between Hct and grain yield.

4. Discussion

Rice (Oryza sativa L.) is mainly planted in tropical and subtropical regions with sufficient rainfall, where temperature stress, especially heat stress, is the main factor threatening rice production [22]. Moore estimated that global warming is exclusively responsible for 4.2% yield loss in rice during 1961–2017 [23], and this is expected to worsen by the end of the 21st century under continuous warming [24]. Alam estimated that an increase in temperature of 1 °C causes a reduction in paddy yield of between 3.44% and 0.03% according to the season [25]. Our four–year experiment has also confirmed that, compared to the average temperature of 28.1 °C during the rice growing season, rice yield was 1.2% lower than that of 27.4 °C. In central China, for double–season rice, cold stress mainly occurred during the vegetative period of early rice and the reproductive period of late rice [26,27]; but for single–season rice, it mainly occurred after flowering, and the impact on rice is much smaller than heat stress. In our experiment, cold stress often occurred in SD3 and SD4, but did not occur in SD1 and SD2. In the future, climate change is most likely towards increasing heat stress and decreasing cold stress [24], cold stress could be reduced to a small intensity but heat stress would be getting severer [28]. Therefore, adaptations are urgently needed to minimize the latent negative effects of rice heat stress in central China.
The sensitivity to heat stress varies greatly among different stages of rice. The optimal temperature in the tillering stage was 28.4 °C, which was highest than that in other stages [8]. At the flowering and grain filling stage, 21.7 to 26.7 °C of average temperature is optimal for grain filling, while higher than 27 °C would lead to a reduction of grain yield due to a decrease in grain weight [29]. Matsui observed that high temperatures (>35 °C) during flowering would cause sterility in rice spikelets, decrease florets fertility, and negatively affect rice reproductive growth [30,31]. A similar study in central China indicated that, when the average daily temperature in the vegetative stage exceeded 26.0 °C, and it was lower than 27 °C in the grain–filling stage, the actual grain yields were higher than average [32]. In our study, we used 30 °C during the J–H stage and 28 °C during the H–M stage. This is because considering that the current rice varieties have stronger high–temperature resistance.
DMAR is a sensitive index of heat stress. Previous research has shown that when the temperature exceeds the optimal growth temperature, it negatively affects the accumulation of dry matter [8]. An increase in the temperature significantly reduced dry matter accumulation, especially during the panicle initiation and heading stages [33]. The anthesis and ripening stages of rice are the most temperature sensitive [8]. Our research found that, adequate heat during the concurrent vegetative–reproductive growth stage (J–H) and reproductive growth stage (H–M) can promote the accumulation of dry matter, but excessive heat stress is detrimental, mainly because it reduces the net photosynthetic rate and reduced carbon assimilation capacity [34] and enhances respiration [34].
Optimization of sowing dates is an important way to improve resource use efficiency and adapt to ongoing climate change [35]. In our study, with the delay of the sowing dates, the temperature from heading to the maturity stage decreased, whereas the relatively higher temperature would not be beneficial to grain yield, as excessive temperature may cause poor grain filling around the anthesis stage [8,36,37,38]. Hht and Hct may reflect the degree of heat stress and low temperature after flowering suffered by rice at different sowing dates. The possibility of heat stress to rice during the key growth stage decreased as the sowing date delayed, while the possibility of low temperature after flowering increased. It should be noted that, due to the impact of climate change, the cold stress in central China will continue to show a decreasing trend in the future, and the probability of low temperature after flowering will further decrease. Therefore, perhaps in the near future, the rice planting date in the region can be postponed even more.
Besides the impact of heat, waterlogging is another important climate factor that threatens rice production in central China. For example, in a four–year experiment, the rice yield in 2020 was 10% lower than the average yield in the other three years, which is 60.3–76.4% higher than the precipitation during the rice growing season. According to nationwide observations in China, rice yield reductions due to extreme rainfall were comparable to those induced by extreme heat over the last two decades, reaching 7.6  ±  0.9% [39]. In the future, yield penalties caused by waterlogging increase from 3–11% historically to 10–20% by 2080 [40]. Therefore, the risk of waterlogging must also be prevented in central China.

5. Conclusions

Our study found that delaying the sowing date of rice in the Jianghan plain can rationally use solar–thermal resources to achieve maximum rice productivity. Sowing rice in mid–May to late May could result in the highest yield. Abundant solar–thermal resources of the early growth stage increase the production potential, while avoiding heat stress during the flowering and maturity stages of rice. In light of climate change, the sowing date should be reasonably scheduled to allow rice to reach the anthesis and ripening stages under the best heat conditions, and then improve the efficiency of the photosynthetic substances production and heat–light resources utilization. As a result, low temperatures after flowering can be ignored in Jianghan plain under the suitable late sowing conditions (no later than late May) for rice. To offset the negative effects of climate change and ultimately achieve high and stable rice yield in central China, the sowing date and other management measures (e.g., breeding high–temperature resistant rice varieties, improving rice water and fertilizer management, etc.) should be comprehensively in the future.

Author Contributions

Conceptualization, B.W. and J.Z.; methodology, X.Y.; validation, H.L. and H.W.; formal analysis, Z.X. and Z.L.; investigation, Y.D., P.Y. and L.W.; data curation, C.S.; writing—original draft preparation, K.L. and C.S.; writing—review and editing, B.W., J.Z., H.W. and X.Y.; funding acquisition, J.Z. and Z.X. All authors have read and agreed to the published version of the manuscript.

Funding

This research has received support from the National Key Research and Development Project of China (2022YFD2300203), the Innovation and Development Project of China Meteorological Administration (CXFZ2021Z059) and Hubei Natural Science Foundation (2022CFD126). The authors are also grateful to the reviewers for their helpful comments and recommendations, which made the presentation of the paper better.

Institutional Review Board Statement

Not applicable.

Informed Consent Statement

Not applicable.

Data Availability Statement

Not applicable.

Conflicts of Interest

The authors declare no conflict of interest.

References

  1. FAO. The FAO Statistical Database–Agriculture; FAO: Rome, Italy, 2022. [Google Scholar]
  2. Statistics, C.N.B. 2019. Available online: http://www.data.stats.gov.cn/easyquery.htm/ (accessed on 10 April 2023).
  3. China Agricultural Yearbook; China Agriculture Press: Beijing, China, 2020.
  4. Pattanayak, A.; Kumar, K. Weather Sensitivity of Rice Yield: Evidence from India. Clim. Change Econ. 2014, 5, 1–24. [Google Scholar] [CrossRef]
  5. Deng, F.; Zhang, C.; He, L.; Liao, S.; Li, Q.; Li, B.; Zhu, S.; Gao, Y.; Tao, Y.; Zhou, W.; et al. Delayed sowing date improves the quality of mechanically transplanted rice by optimizing temperature conditions during growth season. Field Crops Res. 2022, 281, 108493. [Google Scholar] [CrossRef]
  6. Ding, Y.M.; Wang, W.G.; Zhuang, Q.L.; Luo, Y.F. Adaptation of paddy rice in China to climate change: The effects of shifting sowing date on yield and irrigation water requirement. Agric. Water Manag. 2020, 228, 105890. [Google Scholar] [CrossRef]
  7. Xu, Y.F.; Chu, C.C.; Yao, S.G. The impact of high–temperature stress on rice: Challenges and solutions. Crop J. 2021, 9, 963–976. [Google Scholar] [CrossRef]
  8. Sánchez, B.; Rasmussen, A.; Porter, J.R. Temperatures and the growth and development of maize and rice: A review. Glob. Change Biol. 2014, 20, 408–417. [Google Scholar] [CrossRef]
  9. Hatfield, J.L.; Boote, K.J.; Kimball, B.A.; Ziska, L.H.; Izaurralde, R.C.; Ort, D.; Thomson, A.M.; Wolfe, D. Climate impacts on agriculture: Implications for crop production. Agron. J. 2011, 103, 351–370. [Google Scholar] [CrossRef]
  10. Yang, J.Y.; Huo, Z.G.; Li, X.X.; Wang, P.J.; Wu, D.R. Hot weather event–based characteristics of double–early rice heat risk: A study of Jiangxi province, South China. Ecol. Indic. 2020, 113, 106148. [Google Scholar] [CrossRef]
  11. Sun, W.; Huang, Y. Global warming over the period 1961–2008 did not increase high–temperature stress but did reduce low–temperature stress in irrigated rice across China. Agric. For. Meteorol. 2011, 151, 1193–1201. [Google Scholar] [CrossRef]
  12. Zhang, L.; Yang, B.Y.; Guo, A.H.; Huang, D.P.; Huo, Z.G. Multivariate probabilistic estimates of heat stress for rice across China. Stoch. Environ. Res. Risk Assess. Vol. 2018, 32, 3137–3150. [Google Scholar] [CrossRef]
  13. Sakai, H.; Cheng, W.G.; Chen, C.P.; Hasegawa, T. Short–term high nighttime temperatures pose an emerging risk to rice grain failure. Agric. For. Meteorol. 2022, 314, 108779. [Google Scholar] [CrossRef]
  14. Matsue, Y.; Takasaki, K.; Abe, J. Water management for improvement of rice yield, appearance quality and palatability with high temperature during ripening period. Rice Sci. 2021, 28, 409–416. [Google Scholar] [CrossRef]
  15. Hu, Y.J.; Xue, J.T.; Li, L.; Cong, S.M.; Yu, E.W.; Xu, K.; Zhang, H.C. Influence of dynamic high temperature during grain filling on starch fine structure and functional properties of semi–waxy japonica rice. J. Cereal Sci. 2021, 101, 103319. [Google Scholar] [CrossRef]
  16. Welch, J.R.; Vincent, J.R.; Auffhammer, M.; Moya, P.F.; Dobermann, A.; Dawe, D. Rice yields in tropical/subtropical Asia exhibit large but opposing sensitivities to minimum and maximum temperatures. Proc. Natl. Acad. Sci. USA 2010, 107, 14562–14567. [Google Scholar] [CrossRef]
  17. Chen, X.G.; Tian, G.P. Impacts of weather variations on rice yields in China based on province–level data. Reg. Environ. Change 2016, 16, 2155–2162. [Google Scholar] [CrossRef]
  18. Porter, J.R.; Xie, L.; Challinor, A.J.; Cochrane, K.; Howden, S.M.; Iqbal, M.M.; Lobell, D.B.; Travasso, M.I. Food security and food production systems. In Climate Change 2014: Impacts, Adaptation and Vulnerability. Part A: Global and Sectoral Aspects. Contribution of Working Group II to the Fifth Assessment Report of the Intergovernmental Panel on Climate Change; Field, C.B., Barros, V.R., Dokken, D.J., Eds.; Cambridge University Press: Cambridge, UK, 2014; pp. 485–533. [Google Scholar]
  19. Tao, F.; Zhang, Z.; Shi, W.; Liu, Y.; Xiao, D.; Zhang, S.; Zhu, Z.; Wang, M.; Liu, F. Single rice growth period was prolonged by cultivars shifts but yield was damaged by climate change during 1981–2009 in China, and late rice was just opposite. Glob. Change Biol. 2013, 19, 3200–3209. [Google Scholar] [CrossRef] [PubMed]
  20. Zhong, X.Y.; Li, Q.P.; Yang, F.; Chen, D.; He, L.H.; Yang, Z.P.; Wu, Z.Y.; Lu, H.; Li, Z.Z.; Zeng, Y.L.; et al. Higher solar radiation and lower temperature enhance biomass production and grain yield of rice under high–altitude condition. Arch. Agron. Soil. Sci. 2021, 68, 1664–1680. [Google Scholar] [CrossRef]
  21. Tu, D.; Jiang, Y.; Liu, M.; Zhang, L.; Chen, L.; Cai, M.; Ling, X.; Zhan, M.; Li, C.; Wang, J.; et al. Improvement and stabilization of rice production by delaying sowing date in irrigated rice system in central China. J. Sci. Food Agric. 2019, 100, 595–606. [Google Scholar] [CrossRef] [PubMed]
  22. Seck, P.A.; Diagne, A.; Mohanty, S.; Wopereis, M.C. Crops that feed the world 7 rice. Food Secur. 2012, 4, 7–24. [Google Scholar] [CrossRef]
  23. Moore, F. The fingerprint of anthropogenic warming on global agriculture. EarthArXiv 2020, 30, 1–26. [Google Scholar]
  24. IPCC. Climate Change 2021: The Physical Science Basis. Contribution of Working Group I to the Sixth Assessment Report of the Intergovernmental Panel on Climate Change; Cambridge University Press: Cambridge, UK; New York, NY, USA, 2021. [Google Scholar]
  25. Alam, M.; Utara, U.; Drift, M.M.; Countries, A.; Institutions, S.M.; Chini, T.; Reserve, B. The Impacts of Agricultural Supports for Climate Change Adaptation: Farm Level Assessment Study on Paddy. Am. J. Environ. Sci. 2011, 7, 178–182. [Google Scholar] [CrossRef]
  26. Wang, P.; Hu, T.G.; Kong, F.; Xu, J.F.; Zhang, D.R. Rice exposure to cold stress in China: How has its spatial pattern changed under climate change? Eur. J. Agron. 2019, 103, 73–79. [Google Scholar] [CrossRef]
  27. Zhang, L.; Guo, A.H.; He, L.; Hou, Y.Y.; Zhao, X.L.; Qian, Y.L.; Cai, Z. Variation characteristics of chilling dew wind for double–season late rice across southern China in 2020. Meteorol. Mon. 2021, 47, 47,1537–1545. [Google Scholar]
  28. Zhang, L.; Huo, Z.G.; Martial, A.; Xiao, J.J.; Cao, Y.; Gou, P.; Li, S. Optimized rice adaptations in response to heat and cold stress under climate change in southern China. Reg. Environ. Change 2023, 23, 25. [Google Scholar] [CrossRef]
  29. Tashiro, T.; Wardlaw, I. The effect of high temperature on the accumulation of dry matter: Carbon and nitrogen in the kernel of rice. Funct. Plant Biol. 1991, 18, 259–265. [Google Scholar] [CrossRef]
  30. Matsui, T.; Omasa, K.; Horie, T. The difference in sterility due to high temperatures during the flowering period among Japonica rice varieties. Plant Prod. Sci. 2001, 4, 90–93. [Google Scholar] [CrossRef]
  31. Matsui, T.; Omasa, K. Rice (Oryza sativa L.) cultivars tolerant to high temperature at flowering: Anther characteristics. Ann. Bot. 2002, 89, 683–687. [Google Scholar] [CrossRef] [PubMed]
  32. Deng, N.; Ling, X.; Sun, Y.; Zhang, C.; Fahad, S.; Peng, S.; Cui, K.; Nie, L.; Huang, J. Influence of temperature and solar radiation on grain yield and quality in irrigated rice system. Eur. J. Agron. 2015, 64, 37–46. [Google Scholar] [CrossRef]
  33. Wang, W.L.; Cai, C.; He, J.; Gu, J.F.; Zhu, G.L.; Zhang, W.Y.; Zhu, J.G.; Liu, G. Yield, dry matter distribution and photosynthetic characteristics of rice under elevated CO2 and increased temperature conditions. Field Crop. Res. 2020, 248, 107605. [Google Scholar] [CrossRef]
  34. Peraudeau, S.; Roques, S.; Quiñones, C.O.; Fabre, D.; Van Rie, J.; Ouwerkerk, P.B.; Jagadish, K.S.; Dingkuhn, M.; Lafarge, T. Increase in night temperature in rice enhances respiration rate without significant impact on biomass accumulation. Field Crop. Res. 2015, 171, 67–78. [Google Scholar] [CrossRef]
  35. Bonelli, L.E.; Monzon, J.P.; Cerrudo, A.; Rizzalli, R.H.; Andrade, F.H. Maize grain yield components and source–sink relationship as affected by the delay in sowing date. Field Crop. Res. 2016, 198, 215–225. [Google Scholar] [CrossRef]
  36. Laza, M.R.C.; Sakai, H.; Cheng, W.G.; Tokida, T.; Peng, S.B.; Hasegawa, T. Differential response of rice plants to high night temperatures imposed at varying developmental phases. Agric. For. Meteorol. 2015, 209–210, 69–77. [Google Scholar] [CrossRef]
  37. Sakata, T.; Oshino, T.; Miura, S.; Tomabechi, M.; Tsunaga, Y.; Higashitani, N.; Miyazawa, Y.; Takahashi, H.; Watanabe, M.; Higashitani, A. Auxins reverse plant male sterility caused by high temperatures. Proc. Natl. Acad. Sci. USA 2010, 107, 8569–8574. [Google Scholar] [CrossRef] [PubMed]
  38. Prasad, P.V.V.; Boote, K.J.; Allen, L.H.J.; Sheehy, J.E.; Thomas, J.M.G. Species, ecotype and cultivar differences in spikelet fertility and harvest index of rice in response to high temperature stress. Field Crop. Res. 2006, 95, 398–411. [Google Scholar] [CrossRef]
  39. Fu, J.; Jian, Y.; Wang, X.; Li, L.; Ciais, P.; Zscheischler, J.; Wang, Y.; Tang, Y.; Müller, C.; Webber, H.; et al. Extreme rainfall reduces one–twelfth of China’s rice yield over the last two decades. Nat. Food 2023, 2023, 1–11. [Google Scholar] [CrossRef]
  40. Liu, K.; Harrison, M.T.; Yan, H.; Liu, D.L.; Meinke, H.; Hoogenboom, G.; Bin, W.; Peng, B.; Guan, K.; Jaegermeyr, J.; et al. Silver lining to a climate crisis in multiple prospects for alleviating crop waterlogging under future climates. Nat. Commun. 2023, 14, 765. [Google Scholar] [CrossRef] [PubMed]
Figure 1. DMAR of different sowing dates from 2018 to 2021. (a) J–H stage, (b) H–M stage.
Agronomy 13 01339 g001
Figure 2. Monthly precipitation and temperature from 2018 to 2021.
Agronomy 13 01339 g002
Figure 3. Hht, Hct, and Aen of different sowing dates from 2018 to 2021. (a) Hht at J–H and H–M stage; (b) Hct at J–H and H–M stage; (c) Aen at the whole stages.
Agronomy 13 01339 g003
Figure 4. Relationship between Aen and grain yield (a), DMAR (b), panicle number (c) and spikelet number (d), and the relationship between Hht and spikelet fertility (e) and 1000–grain weight (f) in different sowing dates from 2018 to 2021. * and ** indicate significance of the difference at p < 0.05 and p < 0.01, respectively. R2 represents the determination coefficient of this regression equation.
Agronomy 13 01339 g004
Table 1. Soil nutrient characteristics in the experiment field.
Total nitrogenTotal phosphorusTotal potassium
2.18 g/kg0.49 g/kg3.49 g/kg
Alkali hydrolyzed nitrogenAvailable phosphorusAvailable potassium
78.4 mg/kg59.4 mg/kg132.4 mg/kg
Electrical conductivitypHOrganic matter
2.2 mS/cm7.226.7 g/kg
Table 2. Sowing dates and dates of crop growth stages from 2018 to 2021.
YearTreatment CodeSowing DateTransplanting DateJointing DateHeading DateMaturity Date
2018SD121 April26 May1 July20 July28 August
SD26 May11 June16 July5 August12 September
SD316 May21 June25 July14 August28 September
SD426 May1 July4 August24 August9 October
2019SD121 April26 May1 July30 July9 September
SD26 May10 June12 July8 August18 September
SD316 May20 June22 July18 August30 September
SD426 May30 June30 July29 August15 October
2020SD126 April27 May3 July28 July3 September
SD26 May8 June7 July6 August10 September
SD316 May13 June15 July14 August18 September
SD426 May24 June30 July28 August1 October
2021SD126 April25 May6 July4 August4 September
SD211 May9 June17 July14 August14 September
SD321 May19 June24 July24 August23 September
SD431 May29 June6 August1 September8 October
Note: SD1 is 15 days earlier than the normal sowing date, and due to the COVID–19 pandemic, it was only 10 days earlier in 2020. SD2 is the normal sowing date. SD3 is 10 days later than SD2. SD4 is 20 days later than SD2.
Table 3. Grain yield and its components under different sowing dates.
YearSowing DatePanicle Number
m−2
Spikelet NumberSpikelet Fertility1000–Grain WeightGrain Yield
Panicle−1%gkg·ha−1
2018SD1217.3 ± 4.4c200.7 ± 2.7c83.1 ± 1.6b24.6 ± 0.2b9152.8 ± 244.7c
SD2257.1 ± 5.2b219.0 ± 4.9c82.2 ± 0.7b24.9 ± 0.1a10,547.9 ± 262.8b
SD3292.4 ± 6.0a251.5 ± 5.8a89.6 ± 1.6a25.3 ± 0.2a11,790.1 ± 567.1a
SD4233.7 ± 4.8b236.4 ± 4.4b87.7 ± 2.2a25.1 ± 0.1a11,284.8 ± 172.1a
2019SD1181.6 ± 2.2c240.7 ± 10.3b77.5 ± 1.4b24.4 ± 0.1b9716.0 ± 16.7b
SD2191.3 ± 1.2b239.2 ± 1.4b86.0 ± 0.3a24.0 ± 0.1b9765.5 ± 118.5b
SD3202.6 ± 2.7a276.7 ± 6.8a86.7 ± 1.2a25.5 ± 0.1a10,578.5 ± 59.9a
SD4190.0 ± 2.3b244.9 ± 6.2b91.5 ± 0.3a25.4 ± 0.2a10,449.5 ± 90.5a
2020SD1140.1 ± 2.9b216.5 ± 10.8b83.4 ± 0.3b25.4 ± 0.5c6857.3 ± 218.3b
SD2147.6 ± 3.5b216.4 ± 1.4b85.4 ± 0.8b25.9 ± 0.6b7179.0 ± 221.7b
SD3157.2 ± 0.9a247.6 ± 10.6a90.0 ± 0.7a26.7 ± 0.4a7990.9 ± 415.4a
SD4144.1 ± 3.7b238.7 ± 7.7a87.8 ± 1.1b26.2 ± 0.3b7501.3 ± 303.3b
2021SD1201.7 ± 5.9b212.3 ± 10.3b87.3 ± 0.6b26.8 ± 0.1a8813.4 ± 294.4b
SD2205.5 ± 3.5b215.9 ± 1.4b91.2 ± 0.7a26.8 ± 0.1a9876.1 ± 162.4b
SD3224.6 ± 3.7a229.6 ± 6.8a91.1 ± 0.9a27.0 ± 0.1a10,519.6 ± 581.9a
SD4202.1 ± 5.1b219.7 ± 6.2b89.4 ± 1.0a26.9 ± 0.1a10,346.8 ± 420.9a
Note: Data in the table are mean ± standard error. Lower cases after numerical values express the significance of the difference in LSD test (p < 0.05).
Disclaimer/Publisher’s Note: The statements, opinions and data contained in all publications are solely those of the individual author(s) and contributor(s) and not of MDPI and/or the editor(s). MDPI and/or the editor(s) disclaim responsibility for any injury to people or property resulting from any ideas, methods, instructions or products referred to in the content.

