Article

Maize (Zea mays L.) Stem Target Region Extraction and Stem Diameter Measurement Based on an Internal Gradient Algorithm in Field Conditions

1
College of Information Technology, Jilin Agricultural University, Changchun 130118, China
2
A Jilin Province Key Laboratory of Grain and Oil Processing, Jilin Business and Technology College, Changchun 130507, China
*
Author to whom correspondence should be addressed.
Agronomy 2023, 13(5), 1185; https://doi.org/10.3390/agronomy13051185
Submission received: 29 March 2023 / Revised: 20 April 2023 / Accepted: 21 April 2023 / Published: 22 April 2023

Abstract

:
The target region and diameter of maize stems are important phenotyping parameters for evaluating crop vitality and estimating crop biomass. To address the issue that the target region and diameter of maize stems obtained after transplantation may not accurately reflect the true growth conditions of maize, a phenotyping monitoring technology based on an internal gradient algorithm is proposed for acquiring the target region and diameter of maize stems. Observations were conducted during the small bell stage of maize. First, color images of maize plants were captured by an Intel RealSense D435i camera. The color information in the color image was extracted by the hue saturation value (HSV) color space model. The maximum between-class variance (Otsu) algorithm was applied for image threshold segmentation to obtain the main stem of maize. Median filtering, image binarization, and morphological opening operations were then utilized to remove noise from the images. Subsequently, the morphological gradient algorithm was applied to acquire the target region of maize stems. The similarity between the three types of gradient images and the manually segmented image was evaluated by pixel ratio extraction and image quality assessment indicators. Evaluation results indicated that the internal gradient algorithm could more accurately obtain the target region of maize stems. Finally, a checkerboard was employed as a reference for measurement assistance, and the stem diameter of maize was calculated by the pinhole imaging principle. The mean absolute error of stem diameter was 1.92 mm, the mean absolute percentage error (MAPE) was 5.16%, and the root mean square error (RMSE) was 2.25 mm. The R² value was 0.79. With an R² greater than 0.7 and a MAPE within 6%, the phenotyping monitoring technology based on the internal gradient algorithm was proven to accurately measure the diameter of maize stems. The application of phenotyping monitoring technology based on the internal gradient algorithm in field conditions provides technological support for smart agriculture.

1. Introduction

With the global population already above 8 billion, crop yield is expected to double by 2050 to meet global food demand. Breeding research is imperative to address food crises resulting from population growth and adverse climatic factors [1,2,3]. In breeding research, crop genotypes and phenotyping characteristics have received widespread attention from agronomists [4,5,6]. Traditional plant phenotyping monitoring technologies rely on ruler-based measurements [7,8], which are inefficient, labor-intensive, and subjective. Traditional phenotyping monitoring technologies have lagged far behind the rapid development of genomics research [9,10]. Plant phenotyping technology that depends solely on manual detection and analysis can no longer meet the demands of modern agricultural development. Therefore, it is crucial to study low-cost, high-precision, and efficient phenotyping monitoring technologies.
As one of the world’s major cereal crops, maize (Zea mays L.) has high nutritional and medicinal value [11,12,13]. Stem diameter of maize is a key agronomic trait related to yield and lodging resistance [14,15,16], and is an important indicator measured by agronomists. Ma et al. [17] used handheld laser scanners to scan maize plants. The point cloud data was processed by 3D reconstruction techniques. The stem diameter of potted maize at multiple growth stages was calculated by fitting spheres and cylinders. Although the grid method simplified the original point cloud data, the lack of color information in the data acquired by the device is not conducive to the study of plant phenotyping color characteristics. In comparison, depth cameras are more affordable and can simultaneously capture color and depth information of images. The time-of-flight (TOF) camera is a prototypical depth imaging device, which acquires depth-related data of objects through the evaluation of round-trip time of light. This camera has extensive applications in the agricultural domain. Chaivivatrakul et al. [18] used a TOF camera to obtain 3D point clouds of maize plants, and acquired stem diameter through 3D holographic reconstruction. However, due to the insufficient resolution of the TOF camera, the error between the measured stem diameter and the true value was relatively large. In addition, TOF cameras are sensitive to ambient light, so monitoring maize phenotyping parameters with TOF cameras is typically performed in laboratory environments. In light of the TOF camera’s capacity to concurrently acquire both color and depth images of plants, employing this technology within a laboratory environment facilitates a more exhaustive investigation of crop phenotypic characteristics. Although plant phenotyping analysis in controlled environments is of great significance for plant science, the results differ significantly from the actual conditions of crops in field conditions. In recent years, the superior performance of RGB-D sensors have made it possible to extract the stem diameter of maize in field conditions. These sensors have high resolution, low cost, and simple operation, and have attracted widespread attention from scholars. Fan et al. [19] used the Intel RealSense D435i sensor to obtain 3D point cloud data of maize, estimating stem diameter through point cloud convex hull and planar projection, with high measurement accuracy. Vit and Shani [20] studied the filling rate of four different RGB-D sensors in maize stems, tomatoes, and plastic balls. Plastic balls were used to evaluate the ability of RGB-D sensors in the task of calculating stem diameter. The results showed that the Intel RealSense D435 sensor had the best filling rate for plastic balls at different distances and light intensities compared to the other three sensors, making it more suitable for phenotyping analysis in field conditions.
Extracting the target region of maize stems is a critical step in measuring stem diameter, and its effect directly influences the accuracy of stem diameter measurement. Moreover, agronomists can evaluate soil moisture and nutrient supply conditions by analyzing the smoothness and diameter of the target region of maize stems [21]. Among the numerous image edge detection algorithms, the morphological gradient algorithm precisely captures object edge contours. Han and Han [22] proposed an edge detection algorithm based on morphological gradient and maximum between-class variance (Otsu) to extract edge pixels of grayscale images. The performance of the morphological gradient and Otsu-based edge detection algorithm is superior to that of the Sobel and Canny algorithms. Wu and Li [23] proposed an improved watershed color image segmentation algorithm, which improved the original algorithm by combining the morphological gradient and Otsu algorithm. The improved algorithm accurately obtained object edge information with an accuracy rate greater than 0.98, which improved the robustness and applicability of the algorithm.
In this study, maize was as the research subject, and the Intel RealSense D435i sensor was used to obtain color images of maize stems in field conditions. The maize stems were extracted by the HSV + Otsu algorithm, and image noise was eliminated by median filtering, image binarization, and morphological opening operations. The internal gradient algorithm was applied to extract the target region of maize stems, and the stem diameter was calculated by the pinhole imaging principle. This study combines the internal gradient algorithm with color space models, image segmentation technology, and image filtering technology to provide agronomists with more accurate phenotyping data and lays the foundation for subsequent research combining 3D point clouds.

2. Materials and Methods

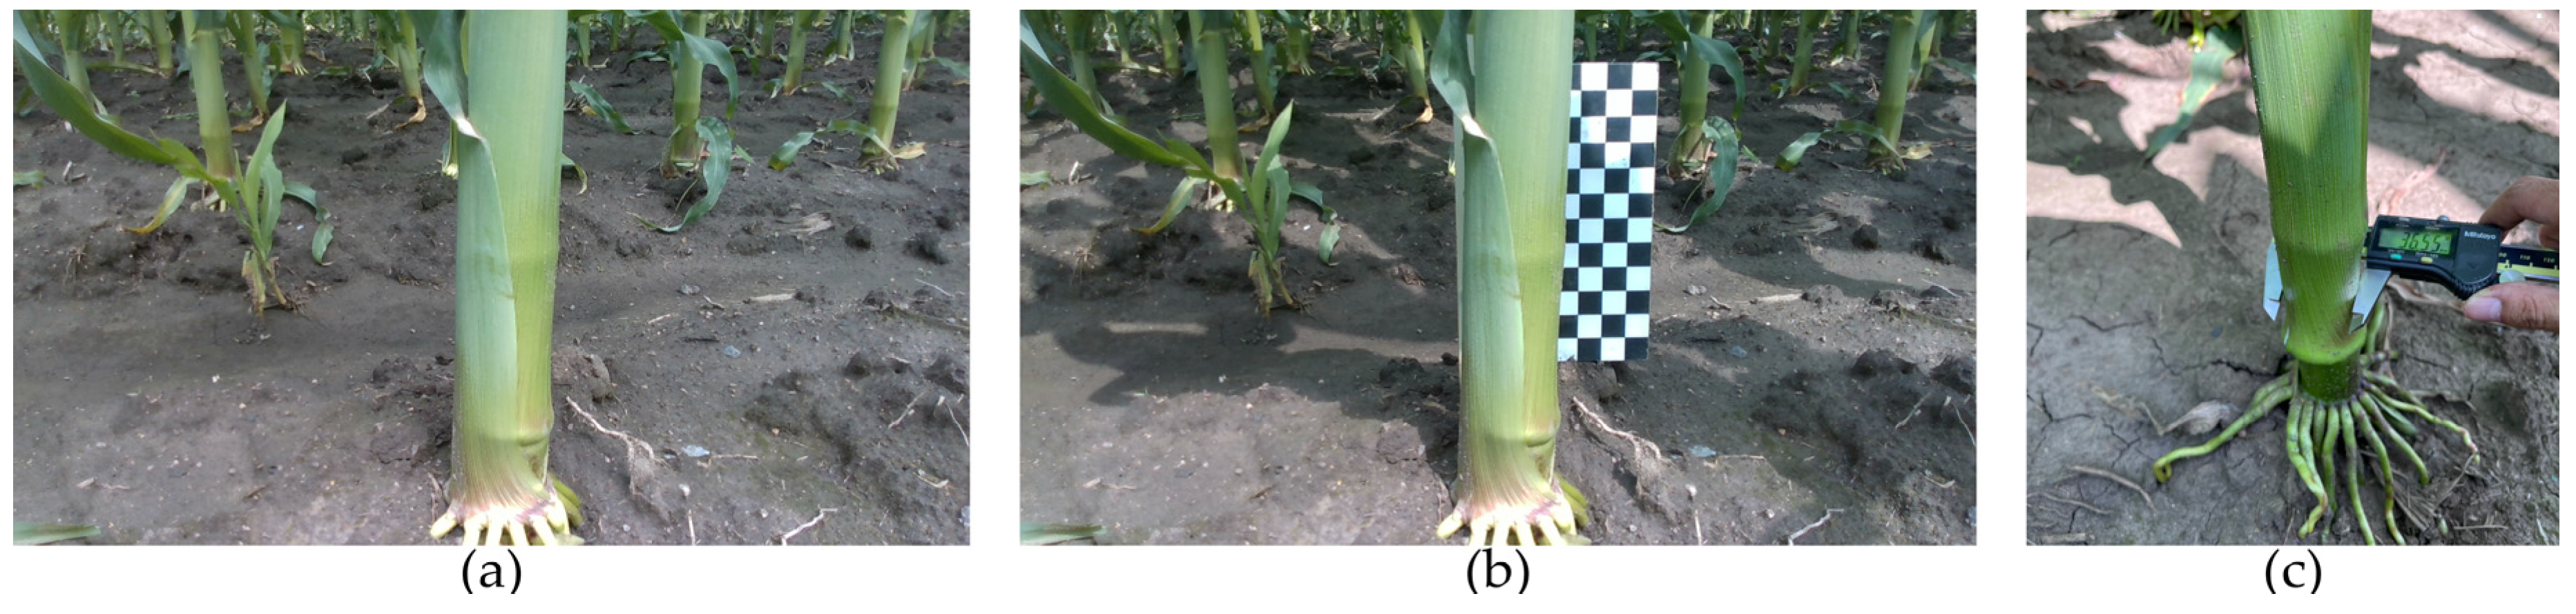
2.1. Image Data Collection

Field experiments were conducted at the teaching and research base of Jilin Agricultural University in Changchun, Jilin Province, China. The maize cultivar selected for the study was Ji Nong Yu 218. Image collection occurred from 12:00 to 15:00 in July 2021 and July 2022, under clear weather conditions. The object of the study was maize stem images during the small bell stage. The maize planting region was 20 m long and 15 m wide, with a planting density of 67,000 plants per hectare. The plant spacing was 0.4 m, and the row spacing was 0.5 m. Four rows of maize were randomly selected in the experimental field for image collection. The canopy density could be neglected as there was almost no overlapping coverage in the early growth stage. The tools employed for image collection and stem diameter measurement included an Intel RealSense D435i camera, a shooting platform, a Vernier caliper, a checkerboard, and a laptop. The Intel RealSense D435i camera was placed on the shooting platform to capture maize plant images, with a distance of 0.5 m between the camera and the ground. To reduce interference from the ground and adjacent plants, the camera was tilted at a 40° angle from the vertical plane towards the maize plant. To preserve the overall morphology and appearance of the maize stem, the distance between the camera lens and the maize stem was 50 cm. The Vernier caliper was utilized to measure the true stem diameter of the maize. Based on the advice of agricultural experts, the second internode of the maize plant was designated as the region of interest [24,25]. Three random measurements of stem diameter were taken in this region, with the mean value of the three measurements considered the true stem diameter. The checkerboard, consisting of 84 alternating black and white squares with dimensions of 15 × 15 mm, was used as a reference for measurement assistance. To measure the maize stem diameter by the pinhole imaging principle, the camera captured two sets of images of the same maize plant at the identical angle: one set with the checkerboard and another without. The laptop was installed with the Intel RealSense SDK 2.0 development package under the Windows 10 operating system. The collected maize stem images were stored in the data collection terminal. The process of maize stem image data collection is shown in Figure 1.

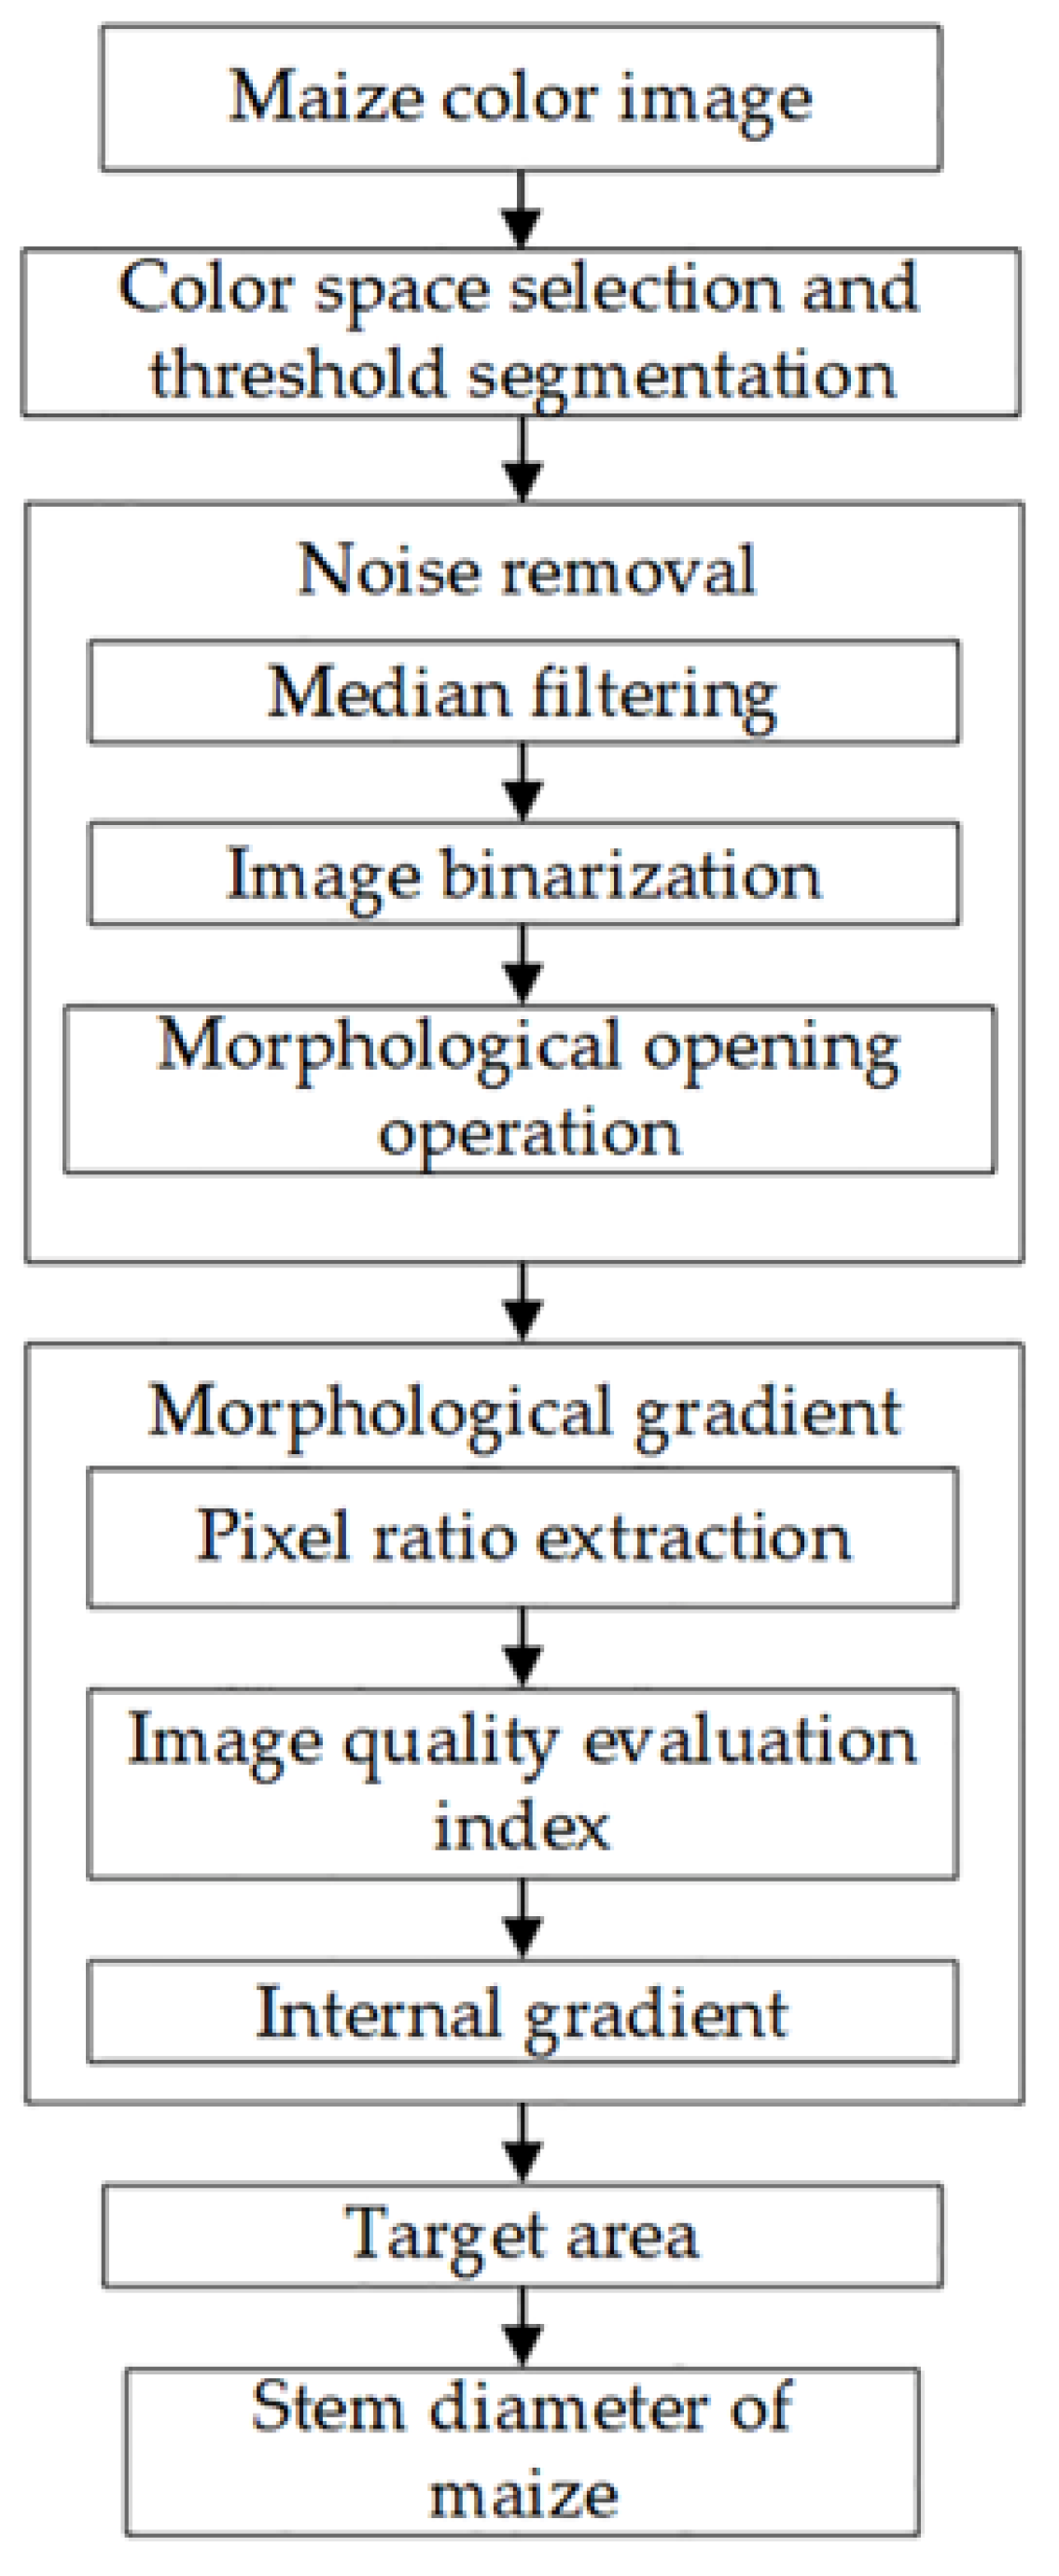
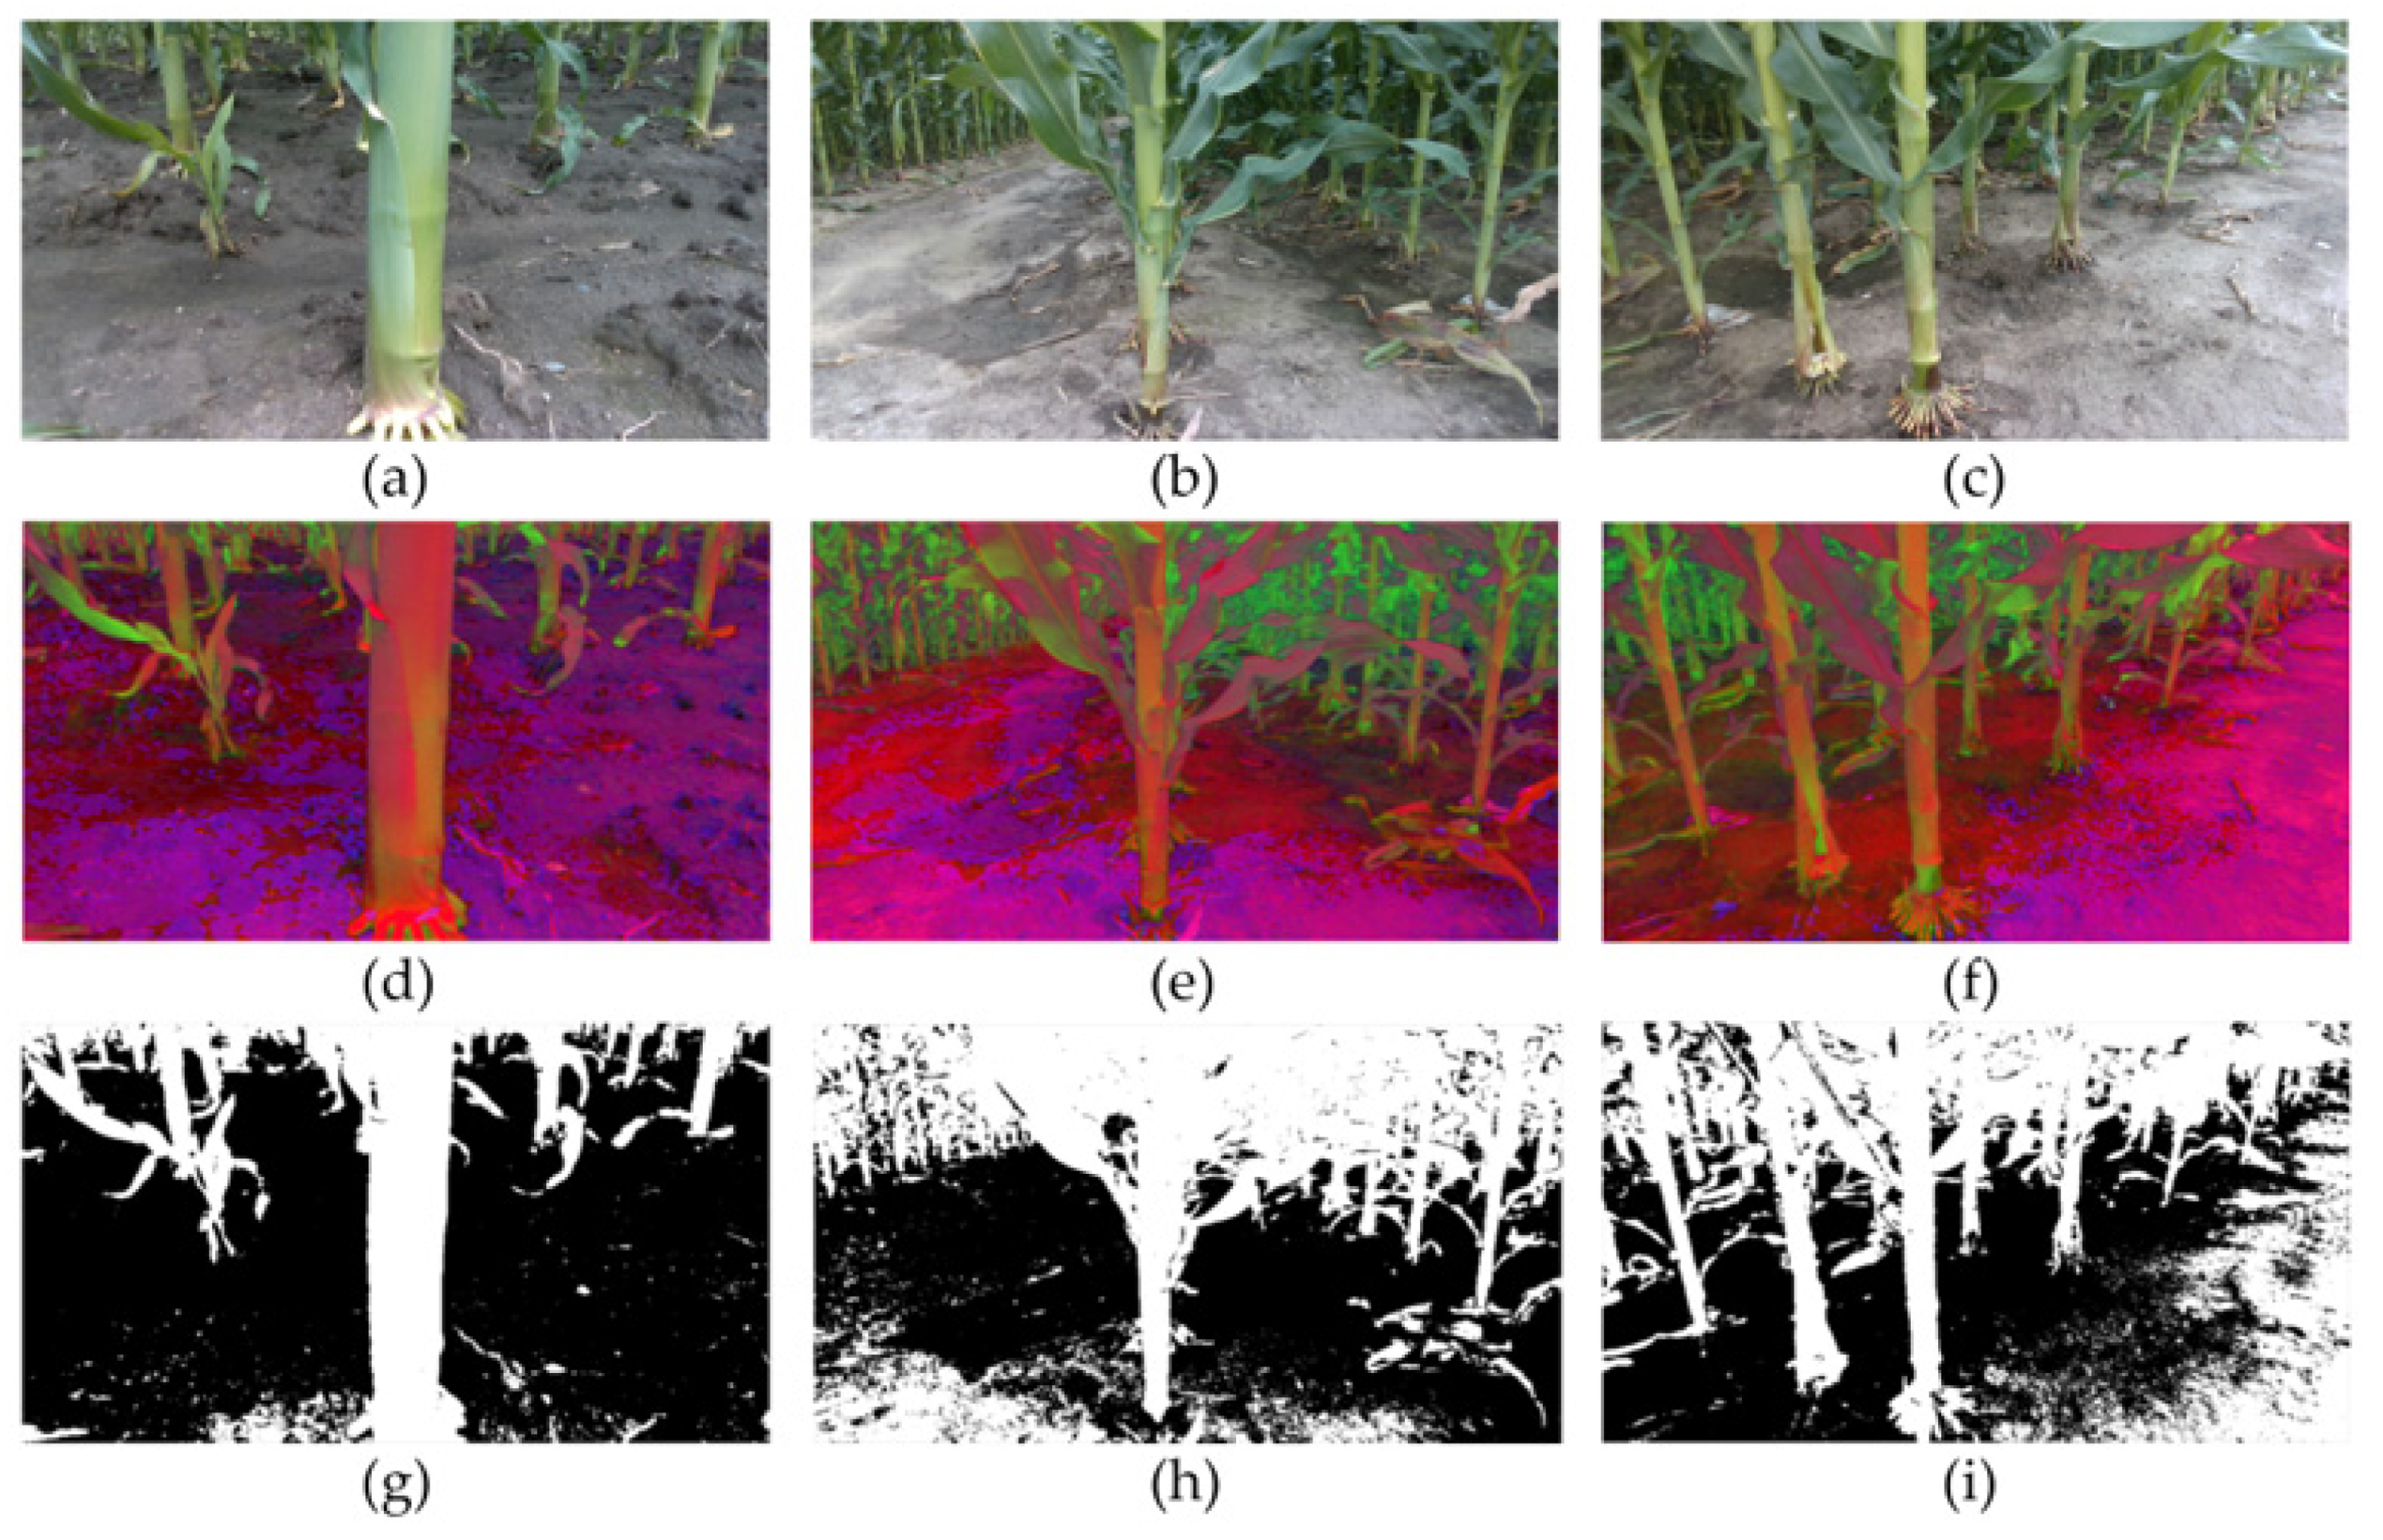
2.2. Image Segmentation and Filtering

In this study, the HSV color space model was selected. The HSV color space model has excellent robustness under varying illumination conditions [26,27,28]. The H value in the model effectively reflects the color information of plant stems, leaves, and other parts, serving as an important basis for separating plants from the background. The Otsu method was employed as the image segmentation algorithm in this paper, utilized for extracting the main stem of maize. The Otsu algorithm is commonly applied in processing plant images under field conditions [29]. Since the experiment required the removal of background noise while preserving the edge information of maize stems, the median filtering was selected for the filtering algorithm for this paper. After filtering, the image was subjected a binarization process. Due to the presence of local noise in the binarized image, an opening operation was conducted on the image. First, a morphological erosion operation was applied to disconnect the weeds or other leaves from the stem. Subsequently, the image was subjected to a morphological dilation operation to fill in the disrupted regions, resulting in a denoised main stem of maize.

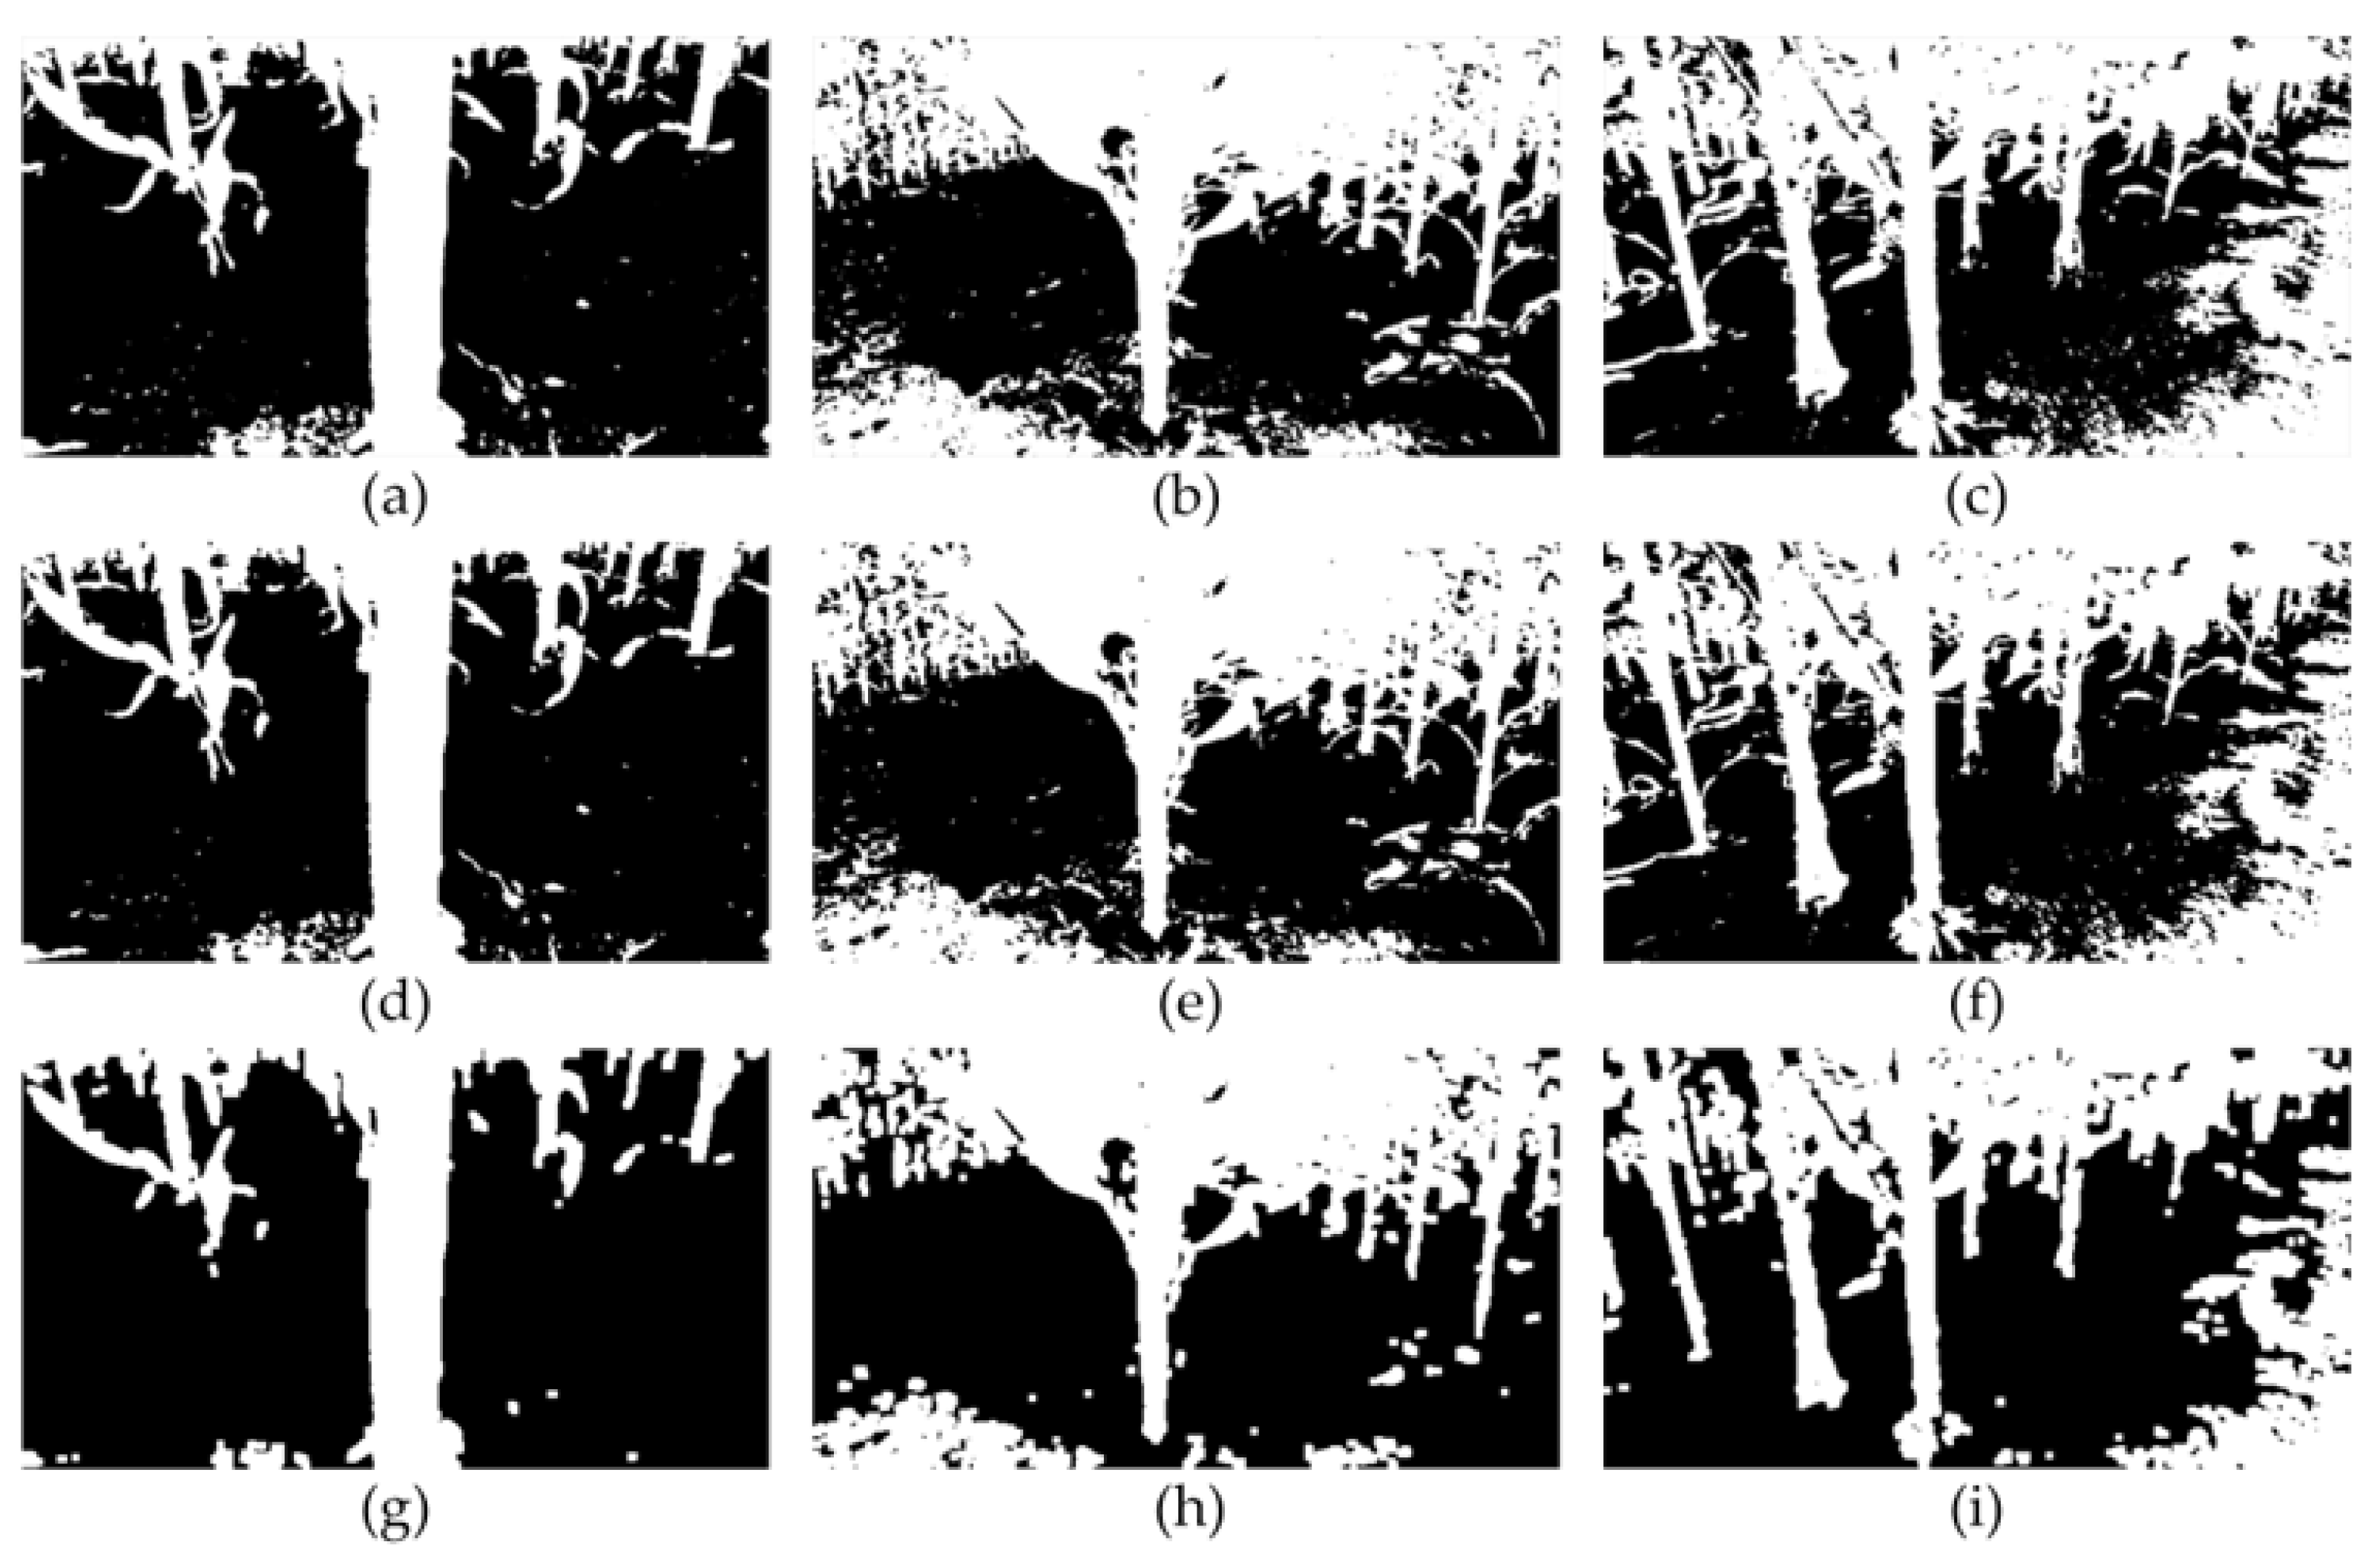
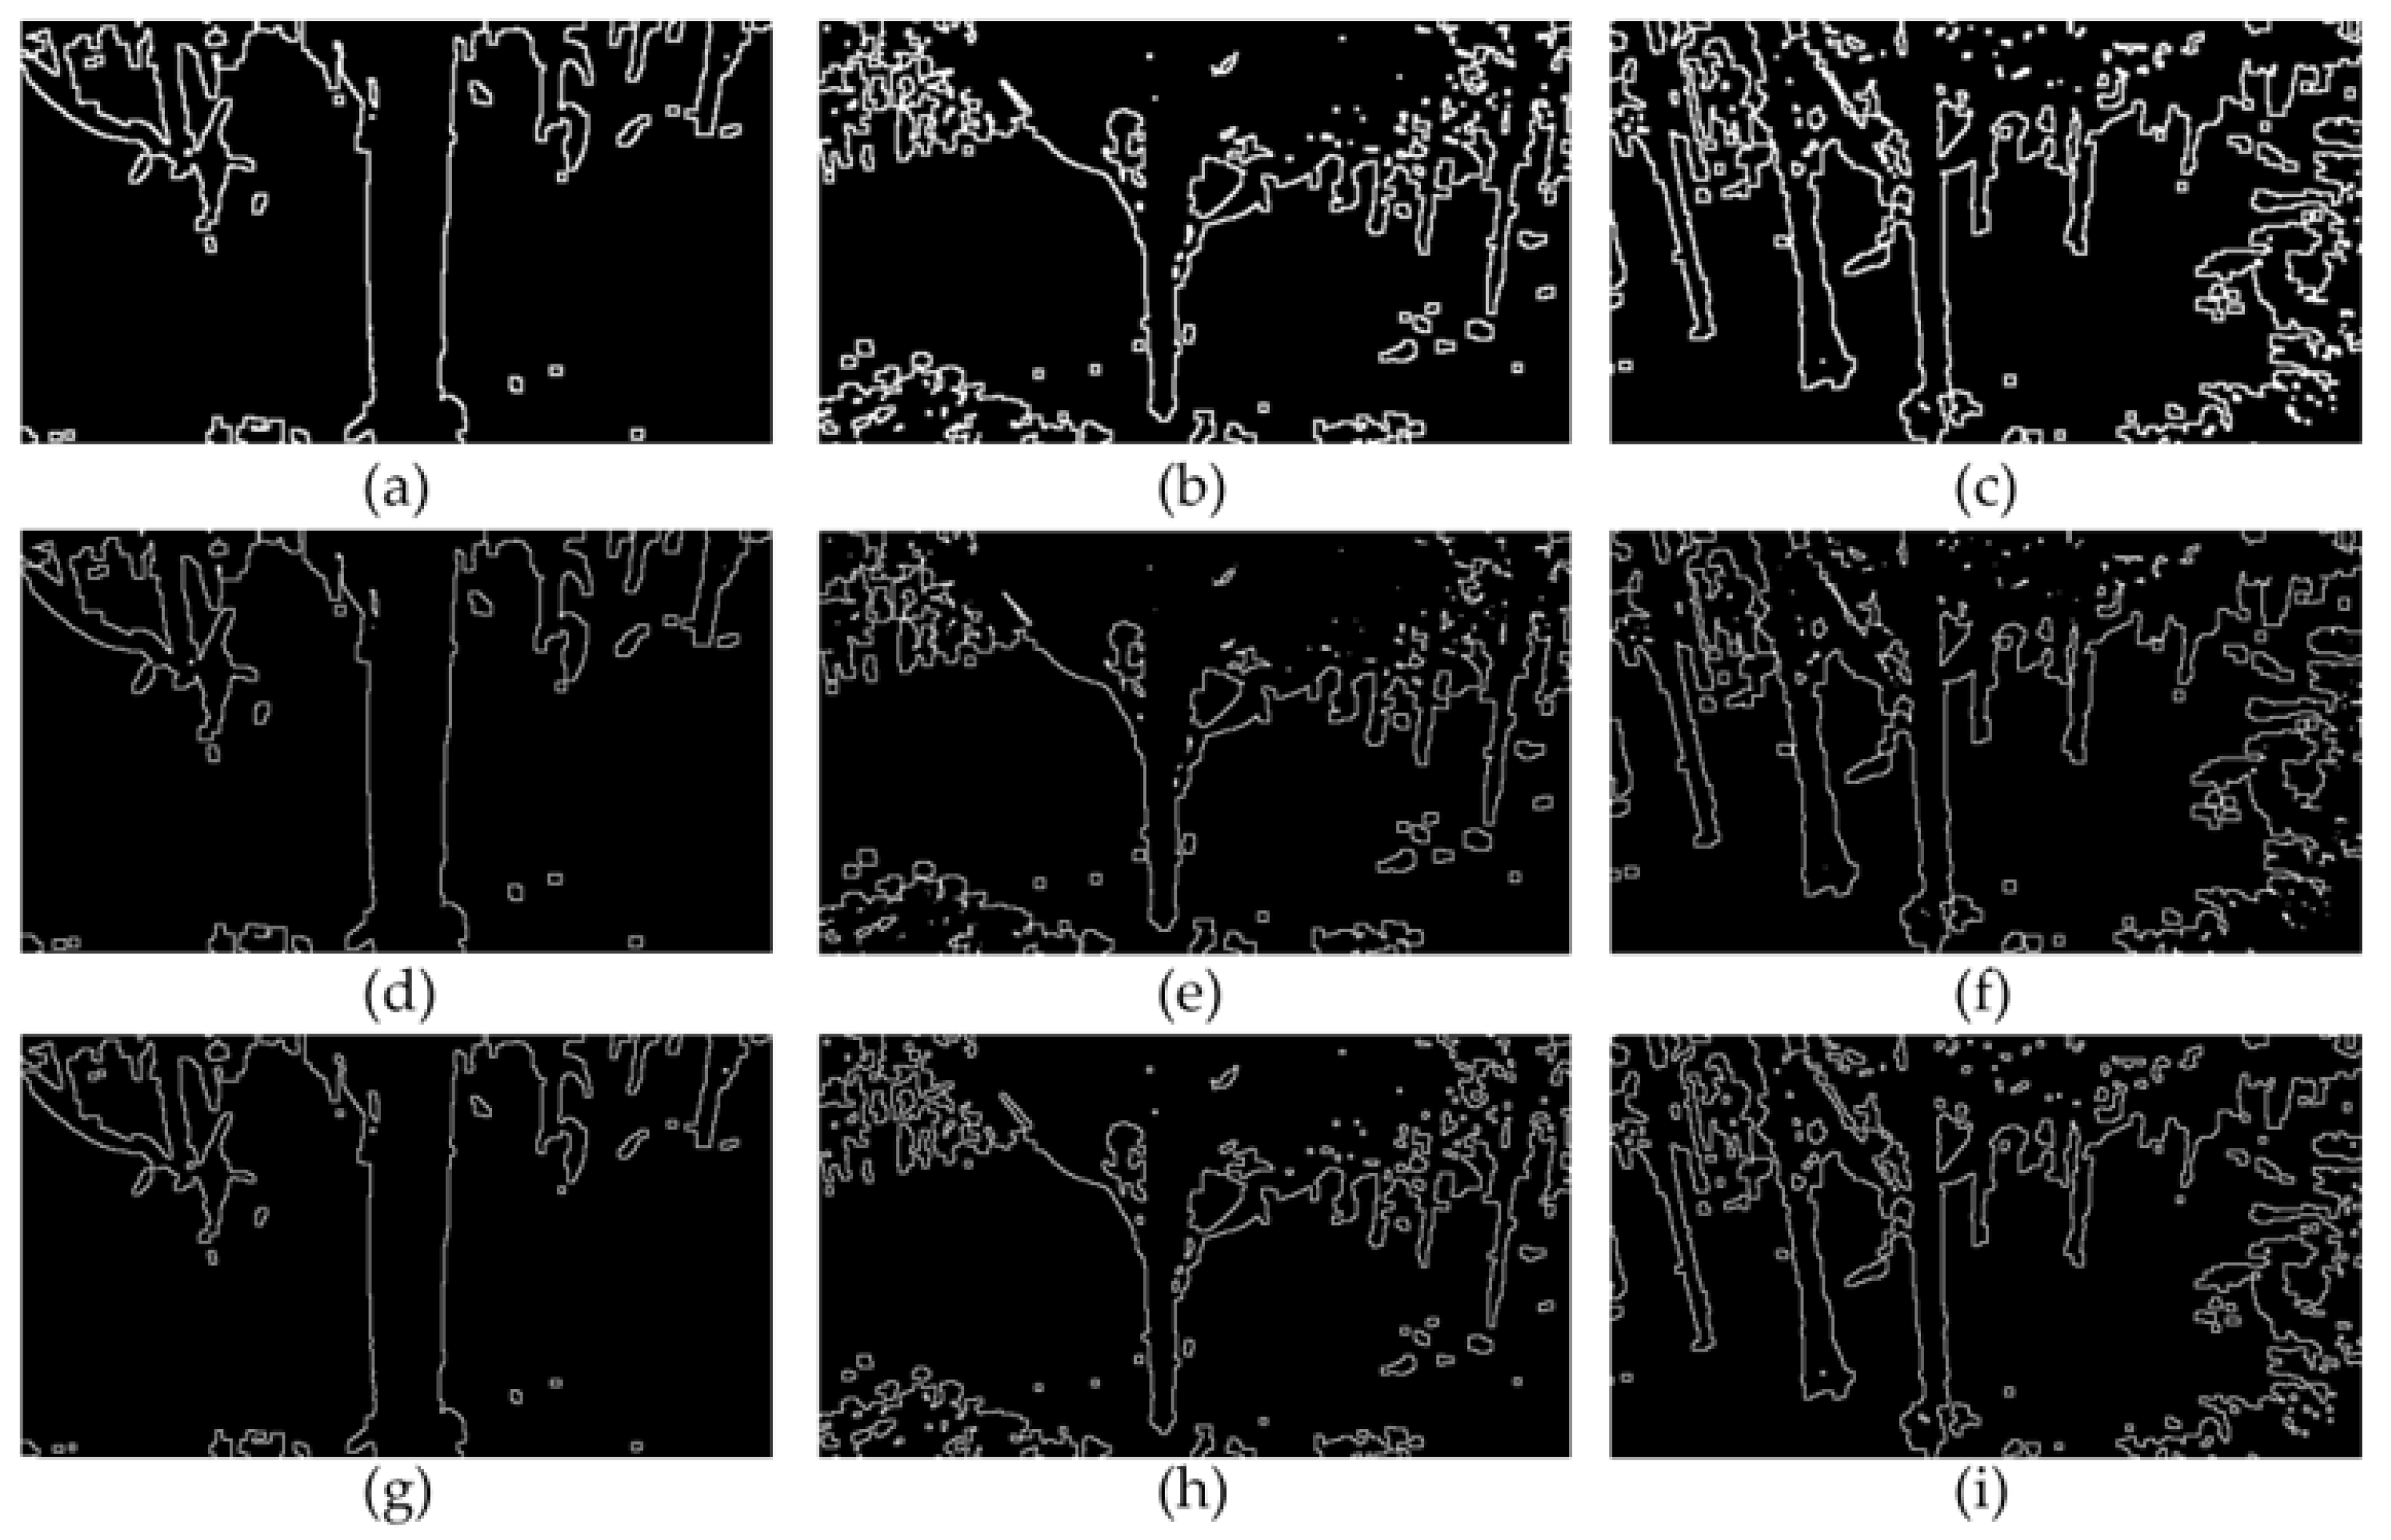
2.3. Morphological Gradient

The extraction of the maize stem target region is a pivotal step in maize phenotyping monitoring technology. The morphological gradient can separate the contours of the target region from the background, facilitating subsequent processing and analysis. The morphological gradient comprises the basic morphological gradient (BMG), external morphological gradient (EMG), and internal morphological gradient (IMG). The basic morphological gradient (BMG) refers to the difference image between the dilated image and the eroded image. The external morphological gradient (EMG) refers to the difference image between the dilated image and the original image. The internal morphological gradient (IMG) refers to the difference image between the original image and the eroded image. The corresponding formulas are shown in Equations (1)–(3).
B M G = A B A B
E M G = A B A
I M G = A A B
Here, A represents the input image, B represents the structuring element, ⊕ represents the dilation operation, and ⊖ represents the erosion operation.

2.4. Image Data Processing

The processing workflow of this study is illustrated in Figure 2.
Three sets of field maize images were randomly selected from 60 samples for experimentation. Field maize images, HSV color space images, and images based on HSV and Otsu algorithms are shown in Figure 3. Median filtered images, binarized images, and images subjected to morphological opening operations are shown in Figure 4. Basic gradient images, external gradient images, and internal gradient images are shown in Figure 5.

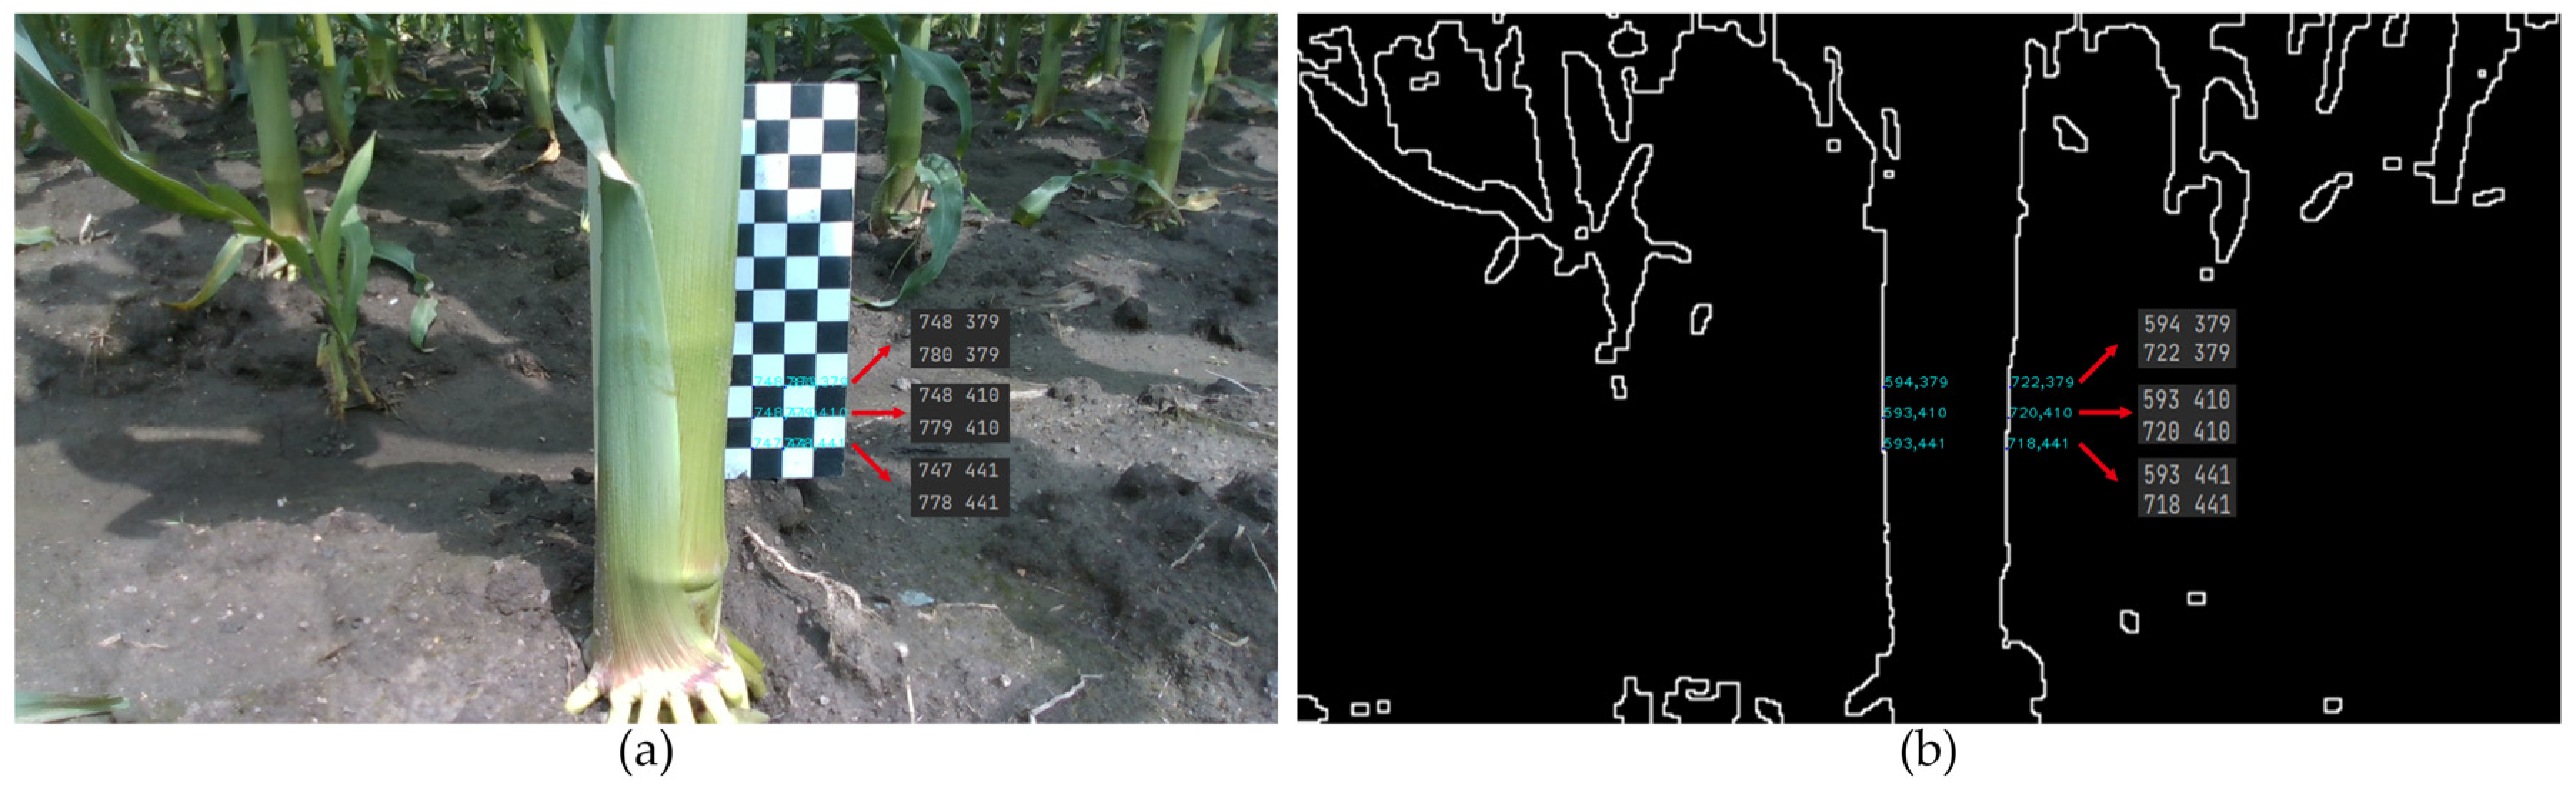
2.5. Coordinate Extraction and Maize Stem Diameter Measurement

In maize gradient images, coordinates were semi-automatically extracted using the OpenCV library functions in Python. The maize stem diameter was extracted based on the pinhole imaging principle. A checkerboard was used as a reference object to facilitate measurements. Since both the original and processed images have a resolution of 1280 × 720, the checkerboard from the original image can be utilized to calculate the stem diameter in the processed image. This approach avoids the impact of an incomplete checkerboard after image processing on the experiment. Taking the internal gradient image, for example, the experiment was conducted in the middle of the second internode of the maize stem. A square was randomly selected on the checkerboard in the original maize image, with its left and right endpoint coordinates being (x1, y1) and (x2, y1), respectively. In the gradient image, a set of contour points was chosen with coordinates (x3, y1) and (x4, y1). Each square in the checkerboard has a side length of W, and the measured stem diameter of maize is denoted as S. S can be calculated by the proportion formula, as shown in Equation (4). This operation is repeated three times, and the average of the three measurements is used as the measured stem diameter of maize. The coordinate acquisition process is illustrated in Figure 6.
S x 4 x 3 = W x 2 x 1

2.6. Gradient Image Evaluation Method

In this study, two objective evaluation methods were employed to assess three types of gradient images. By comparing with manually segmented images, a gradient image more suitable for extracting the target region of maize stems was selected [30].

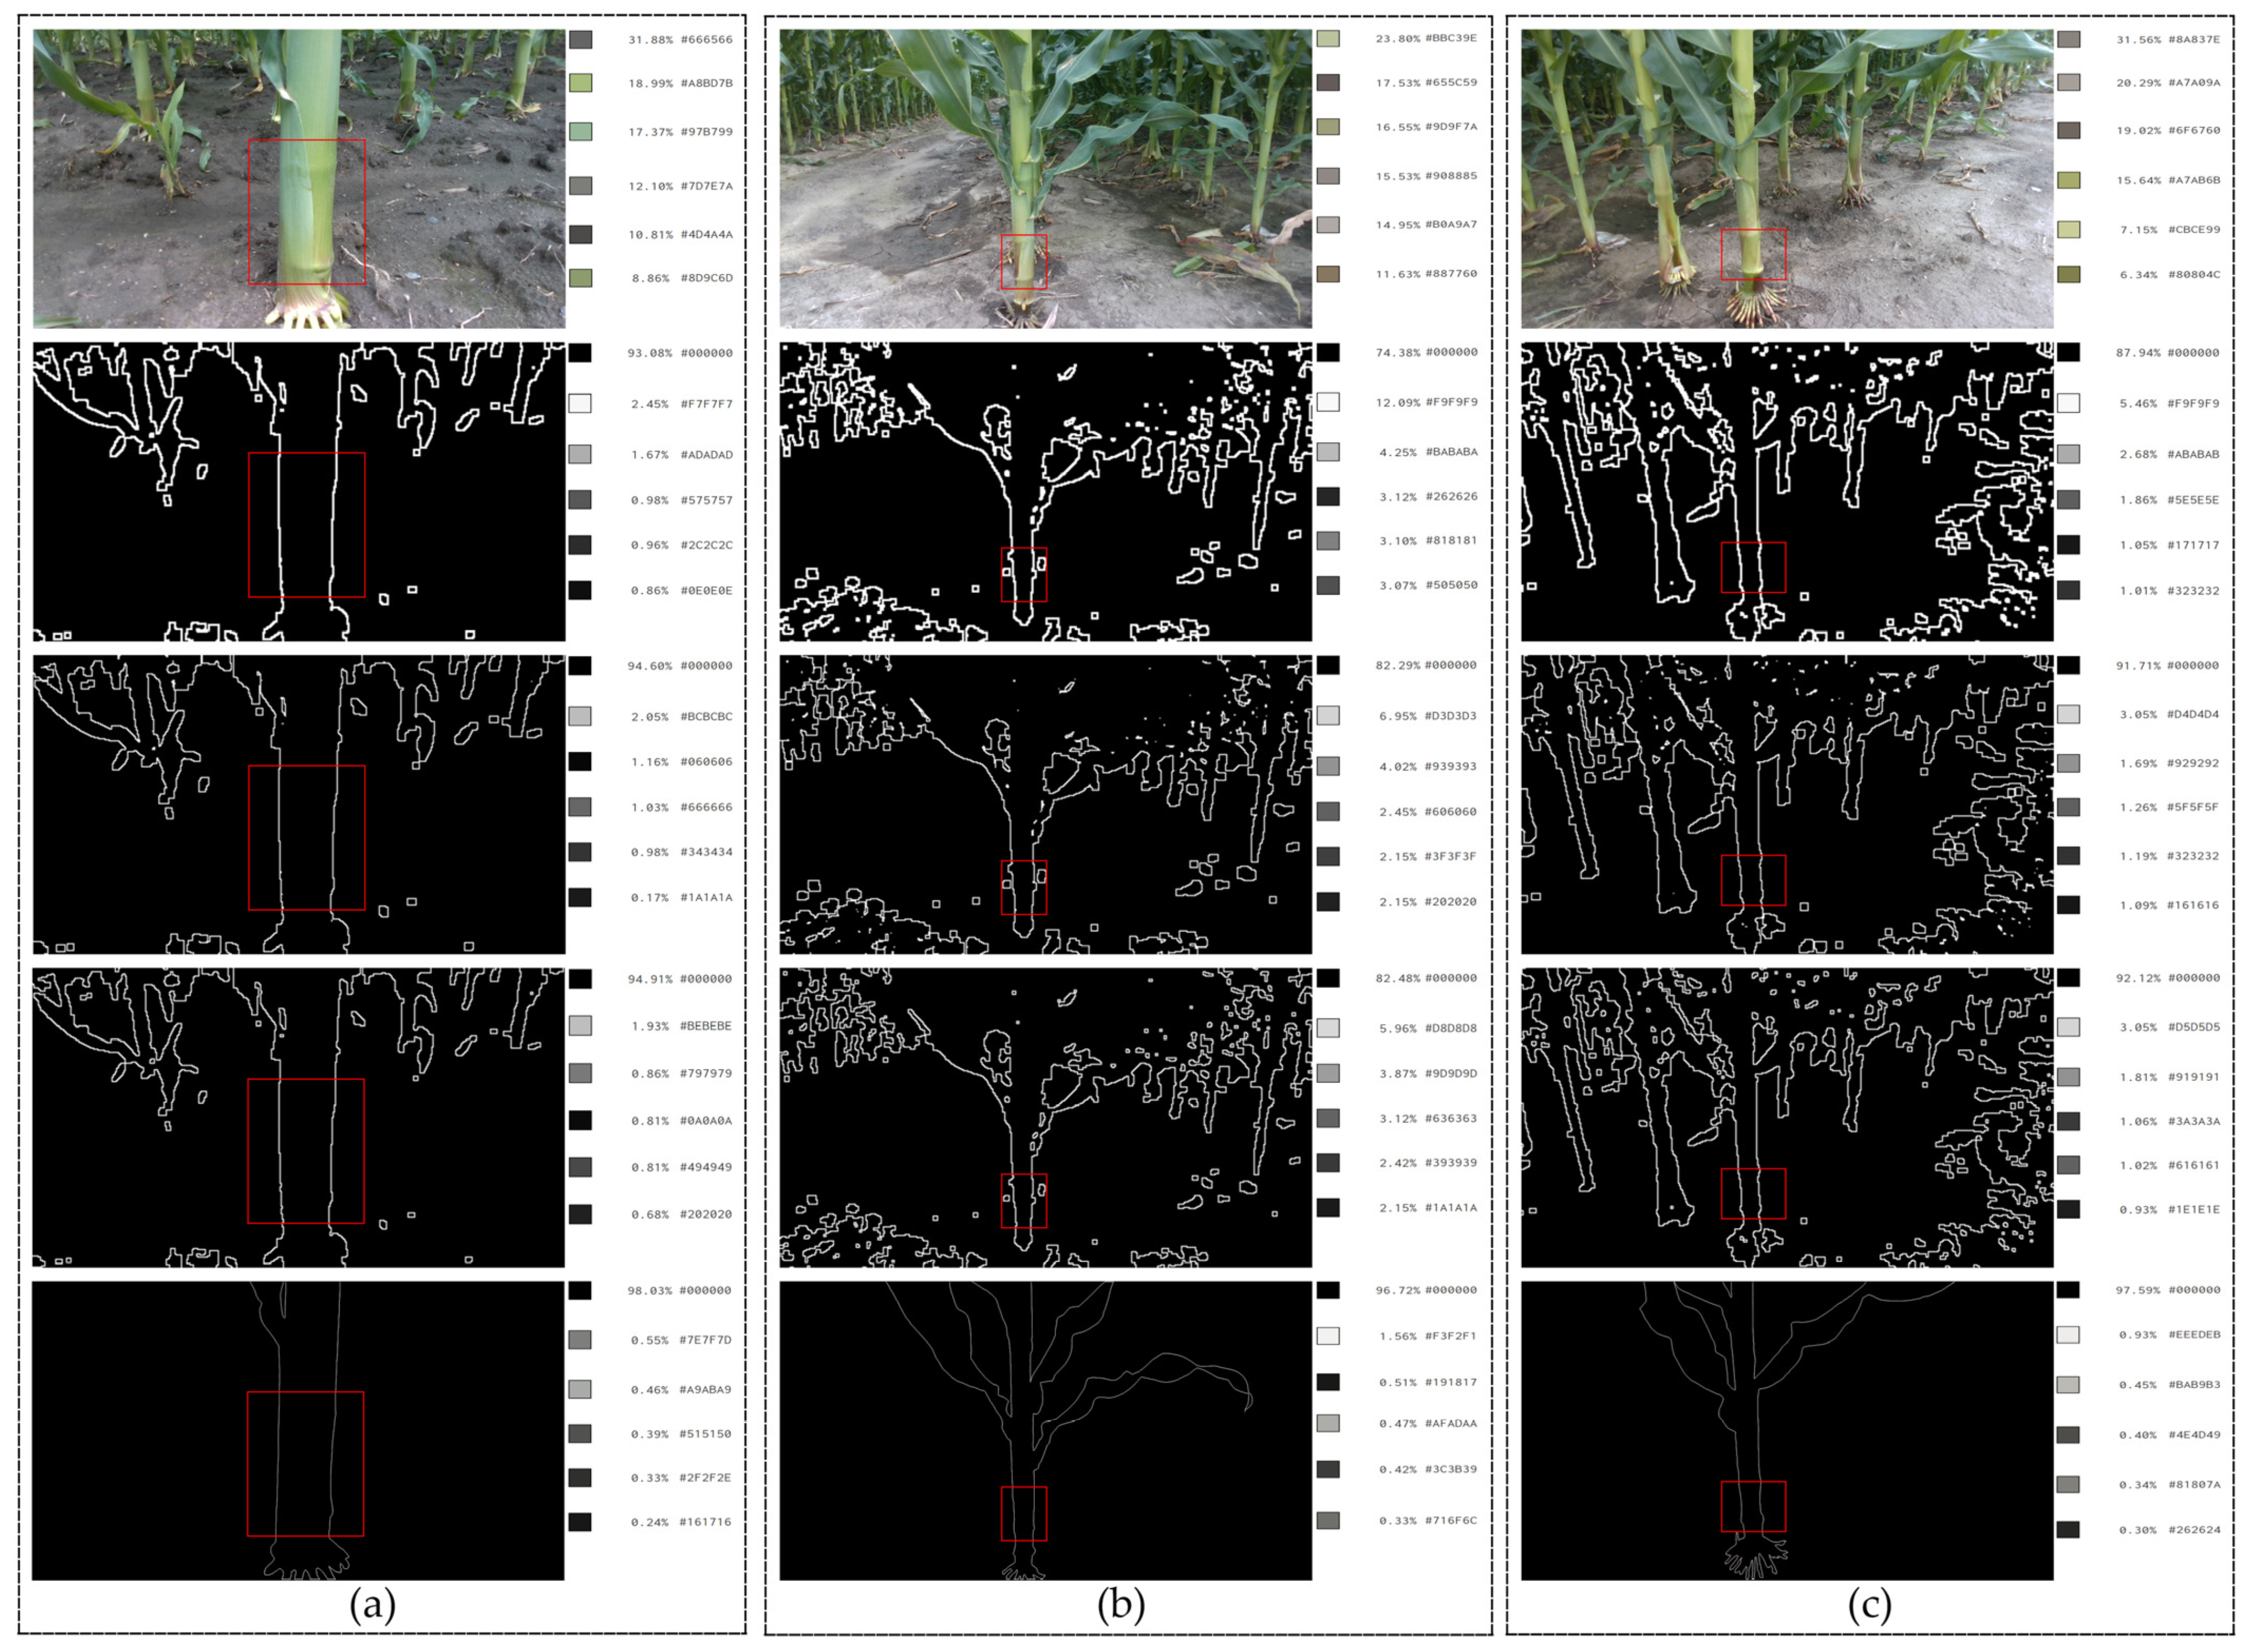
2.6.1. Pixel Proportion Extraction

In the field of computer vision, pixel proportion extraction is commonly employed to facilitate the identification of similar images [31]. This method was applied to determine the differences in pixel proportions of different color regions between gradient images and manually segmented images. If the difference between the two is small, it indicates that the gradient image can accurately detect the position and shape of the target region of maize stems. This method holds significant importance for the performance evaluation of the three gradient algorithms.

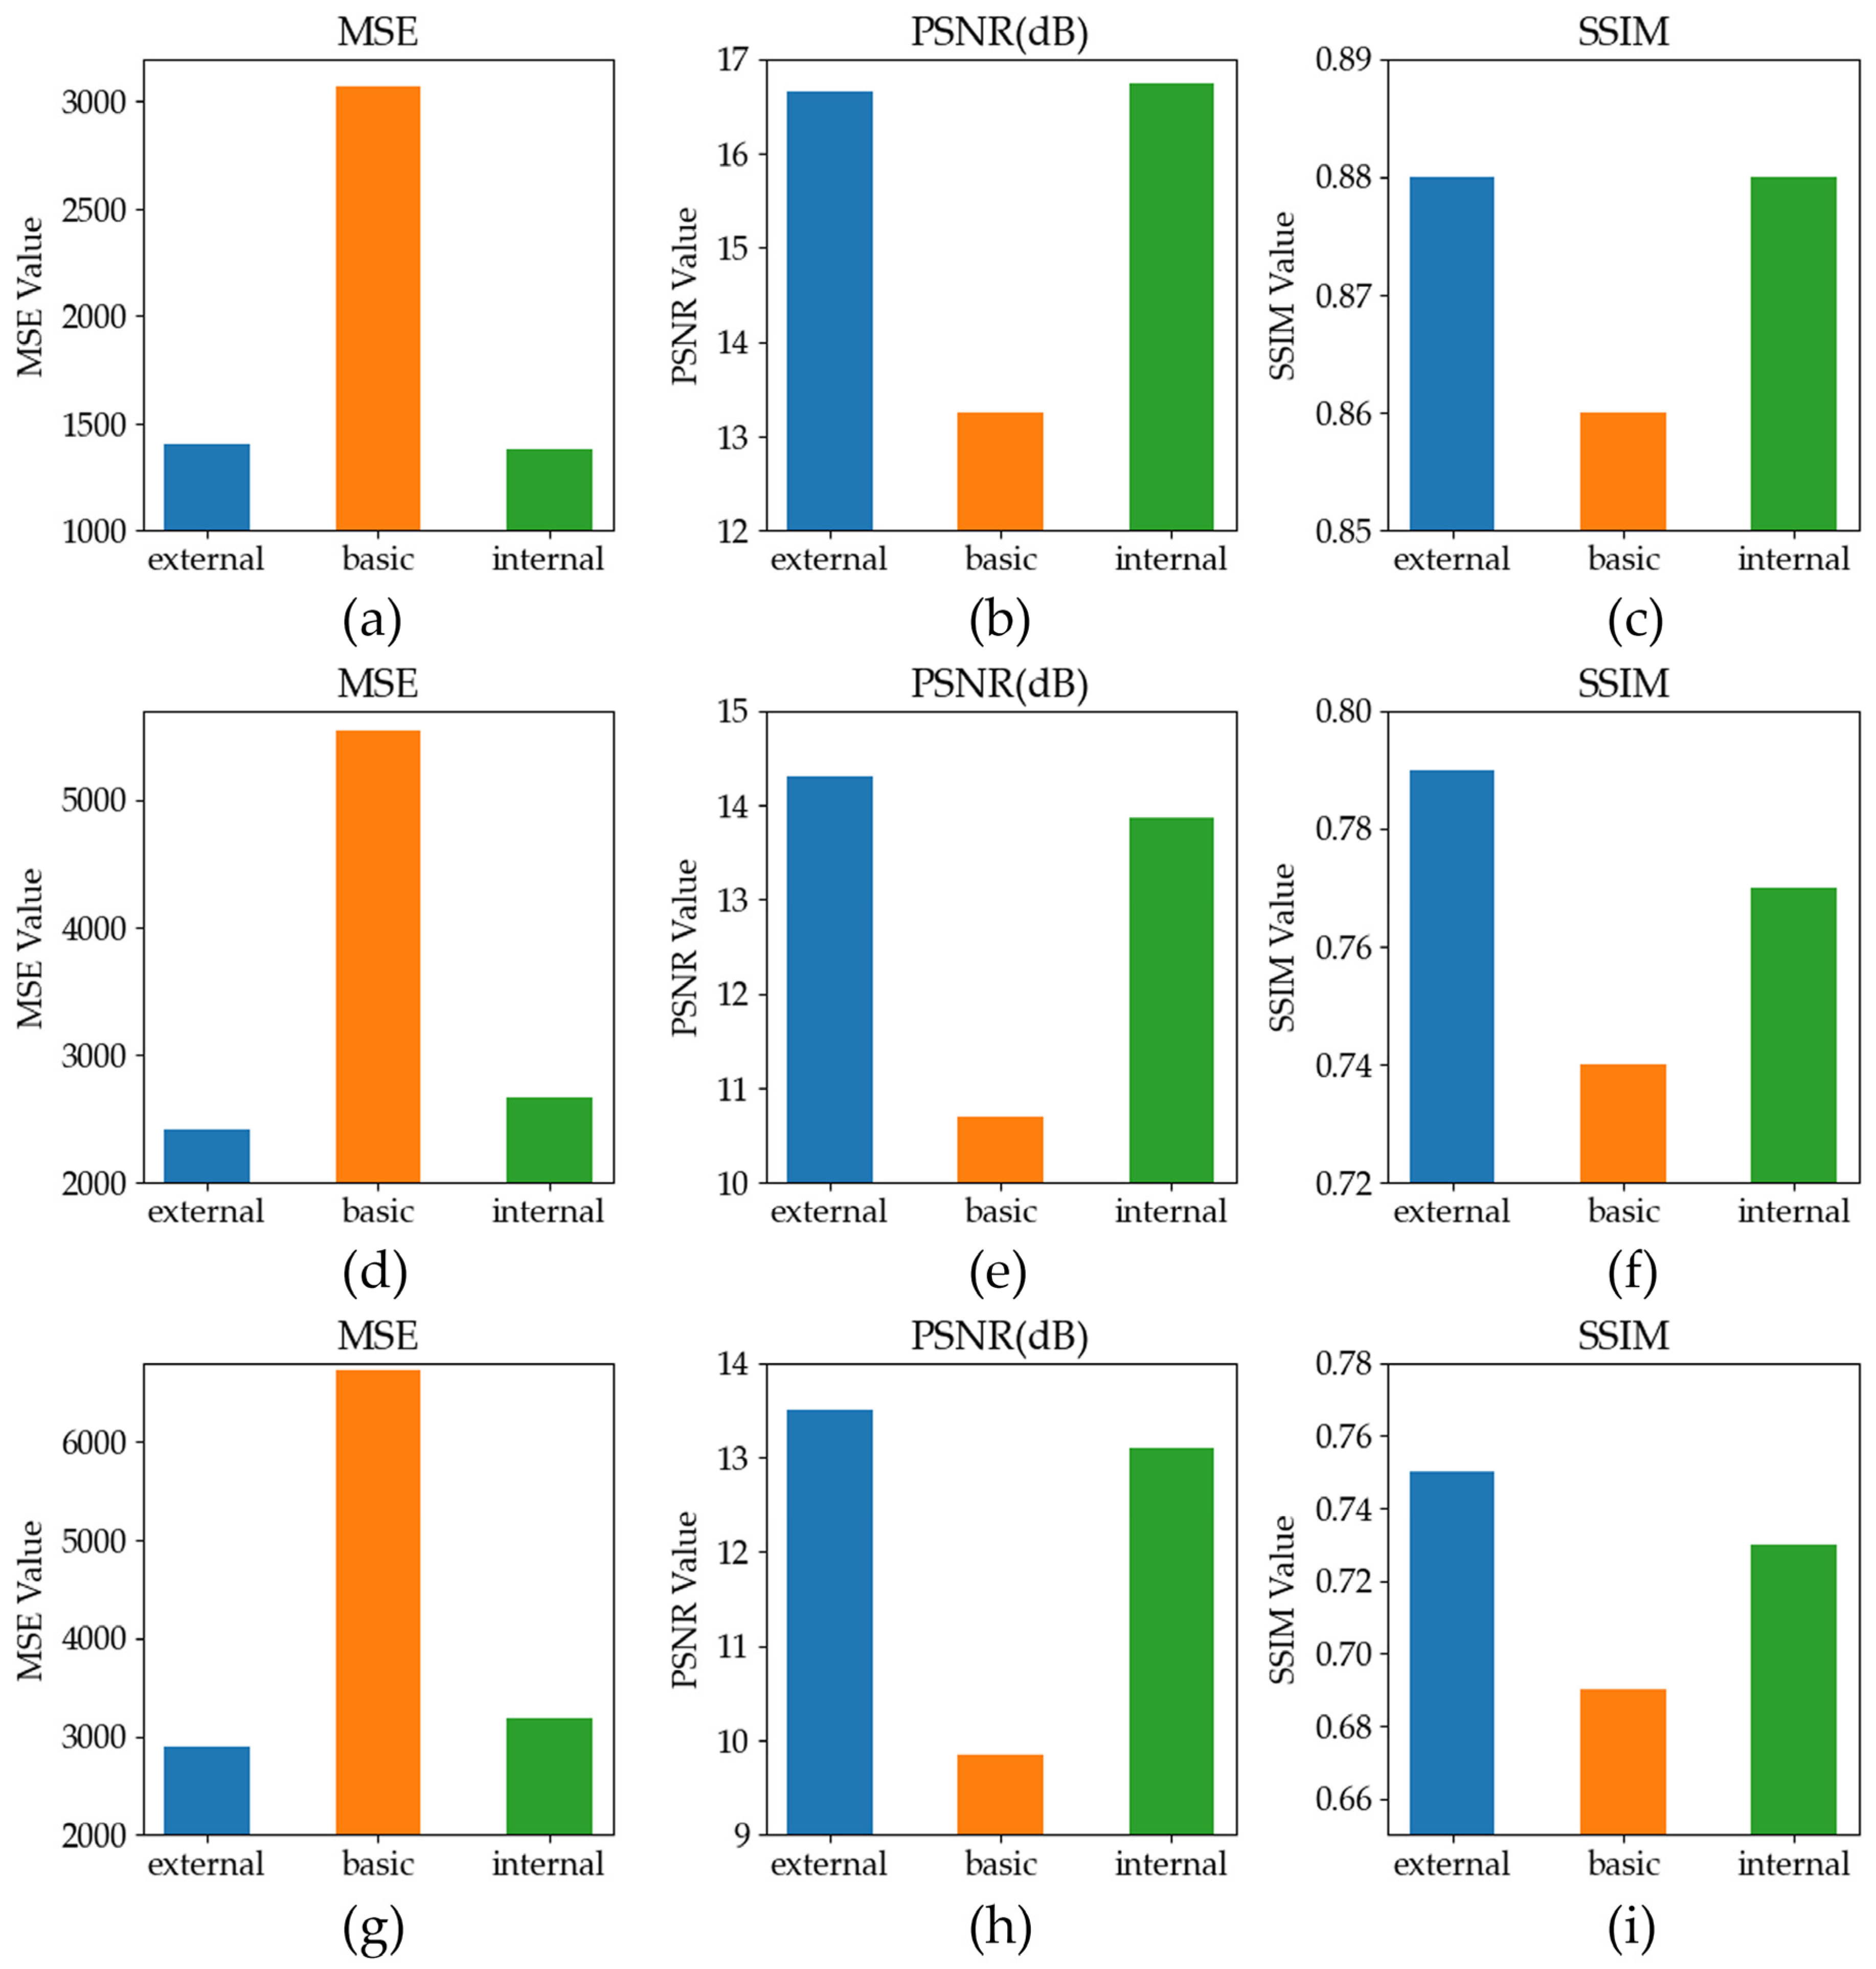
2.6.2. Image Quality Evaluation Metrics

Mean square error (MSE), peak signal-to-noise ratio (PSNR), and structural similarity index (SSIM) are three metrics for evaluating image quality. They aid in assessing the similarity or differences between two images. MSE can be utilized to calculate the pixel differences between gradient images and manually segmented images, evaluating the distortion between them. The closer the MSE value is to 0, the smaller the difference between the gradient image and the manually segmented image, and the greater the similarity between the two images. PSNR is used to evaluate the relative error between gradient images and manually segmented images. The higher the PSNR, the greater the similarity between the two images. SSIM effectively simulates human perception of image quality and is employed to evaluate the structural similarity between two images. The SSIM values range from 0 to 1, representing no similarity to perfect consistency. Different metrics can evaluate model performance from various perspectives, and combining multiple metrics allows for a more comprehensive assessment of the model’s performance. The formulas for MSE, PSNR, and SSIM are as follows:
M S E = 1 M × N i = 0 M 1 j = 0 N 1 I ( i , j ) K ( i , j ) 2
P S N R = 10 log 10 255 2 M S E
S S I M ( x , y ) = 2 μ x μ y + c 1 2 σ x y + c 2 μ x 2 + μ y 2 + c 1 σ x 2 + σ y 2 + c 2
Here, M and N are the height and width of the test image, respectively. I(i, j) and K(i, j) are the grayscale values of the test image and the original image at point (x, y), respectively. For two images x and y, μx and μy denote the average values of x and y, respectively; σxy represents the covariance of x and y; and σx and σy are the standard deviations of x and y, respectively.

2.7. Evaluation Metrics for Stem Diameter Error

Mean absolute error, mean absolute percentage error (MAPE), root mean square error (RMSE), and coefficient of determination (R²) serve as metrics for evaluating the accuracy of maize stem diameter measurements. The formulas for MAPE, RMSE, and R² are as follows:
M A P E = 1 m i = 1 m L i S i L i × 100 %
R M S E = 1 m i = 1 m L i S i 2
R 2 = 1 i = 1 m L i S i 2 i = 1 m L i L ¯ 2
Here, m represents the number of maize plant samples, Si represents the measured stem diameter, Li represents the true stem diameter, and L ¯ represents the average of true stem diameters.

3. Results

3.1. Analysis of Pixel Proportion Extraction Results

To reduce the interference from the ground and adjacent plants, the second internode of maize stems was selected as the evaluation region. The pixel proportion extraction results for the evaluation regions of three groups of original maize images, basic gradient images, external gradient images, internal gradient images, and manually segmented images are shown in Figure 7.
A comparison between the three types of gradient images and manually segmented images reveals that the proportion of black pixels in the manually segmented images is 98.03%. The proportions of black pixels in the basic gradient, external gradient, and internal gradient images for the first group of maize are 93.08%, 94.60%, and 94.91%, respectively. For the second group of maize, these proportions are 87.94%, 91.71%, and 92.12%, respectively. For the third group of maize, the proportions are 74.38%, 82.29%, and 82.48%, respectively. Consequently, the proportion of non-black pixels in internal gradient images is closer to that in the manually segmented images.

3.2. Analysis of Image Quality Evaluation Results

The quality evaluation results for the three groups of maize basic gradient images, external gradient images, and internal gradient images are shown in Figure 8.
In the first group of maize basic gradient, external gradient, and internal gradient images, the MSE values are 3069.78, 1405.72, and 1378.63, respectively. The PSNR values are 13.26 dB, 16.65 dB, and 16.74 dB, respectively. The SSIM values are 0.86, 0.88, and 0.88, respectively. For the second group of maize, the MSE values are 5542.73, 2414.32, and 2668.17, respectively. The PSNR values are 10.69 dB, 14.3 dB, and 13.87 dB, respectively. The SSIM values are 0.74, 0.79, and 0.77, respectively. For the third group of maize, the MSE values are 6725.16, 2901, and 3187.7, respectively. The PSNR values are 9.85 dB, 13.51 dB, and 13.1 dB, respectively. The SSIM values are 0.69, 0.75, and 0.73, respectively. Thus, compared to basic gradient images, the internal gradient images and external gradient images are more similar to the manually segmented images.
Both gradient image evaluation methods have confirmed that internal gradient images and external gradient images are closer to manually segmented images, with no significant difference between them. However, the external gradient algorithm eliminates some pixels from the external edge contour of maize stems, affecting the smoothness of the maize stem edge contour and the accuracy of stem diameter measurement. In contrast, the internal gradient algorithm retains the pixels of the external edge contour of maize stems, only eliminating some pixels from the interior, without substantially altering the diameter of the maize stem target region. Therefore, the internal gradient algorithm is more suitable for extracting the target region of maize stems.

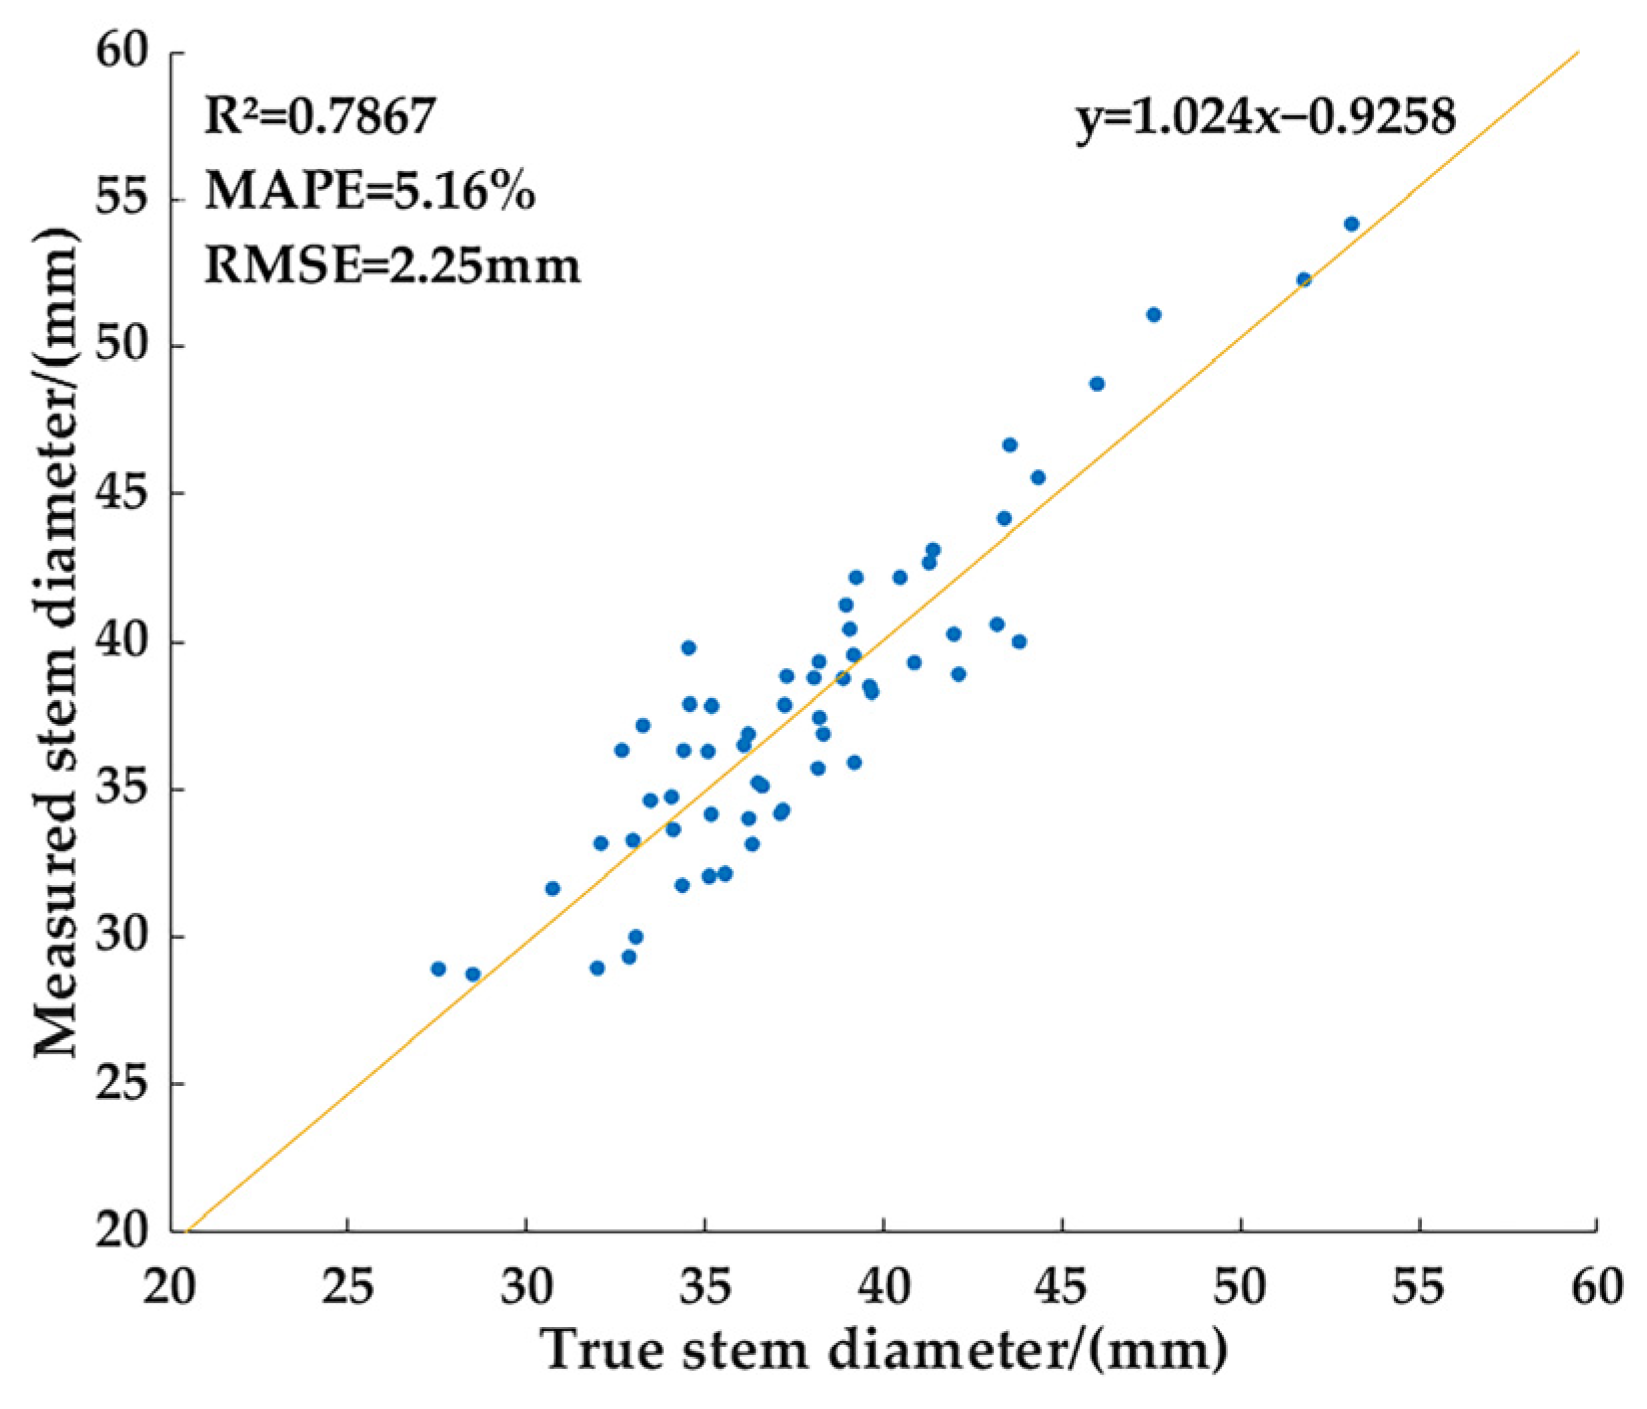
3.3. Error Analysis of Stem Diameter Measurement

In order to verify the accuracy of the internal gradient algorithm, 60 groups of field maize images were selected for error analysis, with the results shown in Table 1.
According to the data presented in Table 1, the mean absolute error for maize stem diameter measurements is 1.92 mm, the MAPE is 5.16%, and the RMSE is 2.25 mm. The complex conditions encountered during image acquisition in field environments may yield detrimental effects on the measurement outcomes. Firstly, the irregularity of the field surface may result in discrepancies between the real and predetermined angles of the imaging equipment, subsequently influencing the precision of the stem diameter measurements. Moreover, situating the camera directly on the shooting platform to obtain maize images lacks sufficient stability. Wind interference may cause the shifts in the camera’s position, resulting in increased measurement inaccuracies. To mitigate these concerns, a future design will incorporate an aluminum alloy mobile platform as a substitute for the existing imaging platform. A stable universal joint is mounted on the aluminum alloy bracket of the mobile platform, with the camera secured to the joint using screws. This not only reduces measurement errors caused by uneven ground but also ensures the stability of the imaging equipment.
In order to more intuitively present the relationship between the measured stem diameter and the true stem diameter, a linear regression analysis was conducted in this paper, and the results shown in Figure 9. The degree of linear fitting can be observed in the figure, and the coefficient of determination (R²) was calculated to be 0.79. This result indicates that the maize stem diameter measured using the internal gradient algorithm demonstrates a relatively high level of accuracy, and there is a considerable degree of consistency between the true stem diameter and the measured stem diameter.

4. Discussion

To extract the target region and stem diameter of maize stems in field conditions, this study employed the Intel RealSense D435i camera to acquire color images of maize during the small bell stage. A phenotyping monitoring technology based on internal gradient algorithm was utilized to extract the target region of maize stems. A checkerboard served as a reference for measurement assistance, and the maize stem diameter was calculated employing the pinhole imaging principle. The experimental results demonstrate the feasibility of obtaining the target region and stem diameter of maize stems by a phenotyping monitoring technology based on internal gradient algorithm.
Firstly, the current study is compared with research that utilizes LiDAR for measuring maize stem diameter. Jin et al. [32] employed LiDAR to collect point cloud data of maize plants and used a median normalized-vector growth (MNVG) algorithm to segment maize stems and leaves, enabling the measurement of field maize height, leaf length, leaf width, stem height, stem diameter, and crown size. The R² were 0.91, 0.88, 0.81, 0.97, 0.65, and 0.96, respectively. The RMSE for stem diameter was 10 mm. Although this study demonstrated high accuracy in extracting other phenotypic parameters of maize, it showed relatively lower accuracy in measuring stem diameter. On the other hand, the current study achieved an R² of 0.79 for measuring maize stem diameter and decreased the RMSE to 5.29 mm, demonstrating higher measurement accuracy. Moreover, using the Intel RealSense D435i camera allowed the acquisition of color and texture information of maize stem that LiDAR could not obtain, thus providing more comprehensive data support for agricultural experts. Subsequently, the current study is compared with completed research. Zhou et al. [33] employed the HSV + Otsu algorithm to obtain the main stem of maize stems and measure their diameter, with mean absolute error, MAPE, and RMSE values of 4.30 mm, 10.76%, and 5.29 mm, respectively. Building on the existing algorithm, the current study employed median filtering, image binarization, and morphological opening operations to remove noise in the images. Additionally, an internal gradient algorithm was deployed to obtain the target region and diameter of maize stem. The mean absolute error, MAPE, and RMSE for stem diameter were 1.92 mm, 5.16%, and 2.25 mm, respectively. In comparison to prior research, the present study diminished measurement errors and more accurately identified the morphology and structure of maize stem.
However, several limitations of the proposed method need to be addressed. Firstly, the variety involved in this study is relatively singular. Maize includes various germplasm lines, comprising cultivated and wild varieties. Different varieties of maize exhibit differences in stem morphology and stem diameter. In this study, Ji Nong Yu 218 was selected as the experimental maize variety. However, selecting a single variety does not account for the phenotypic differences among different varieties. Therefore, future experiments will employ different maize varieties for phenotyping research and stem diameter measurements, in order to provide an important scientific foundation for maize breeding and improvement. Secondly, the observation period is relatively singular. The small bell stage is a rapid growth stage for maize and serves as a transition period between vegetative and reproductive stages. Maize at the small bell stage contains the features of both vegetative and reproductive stages. This study obtained the target region and stem diameter of maize stems only at the small bell stage using non-invasive imaging technology, without quantifying maize phenotypic parameters at other stages. However, phenotyping monitoring during vegetative and reproductive stages is crucial for improving maize yield and quality. Therefore, future research will employ the internal gradient algorithm to monitor maize phenotypes at multiple stages, assisting farmers and researchers to better formulate fertilization, irrigation, and harvesting strategies, reducing resource and labor waste, and improving maize yield and quality. Lastly, the monitored parameters are limited. This study only monitored the target region and diameter of maize stems, without obtaining growth information from other parts of the maize plant. However, phenotyping parameters such as leaf length, plant height, and leaf inclination angle are closely related to the photosynthetic efficiency, growth vigor, and water use efficiency of maize plants. Therefore, monitoring other maize phenotyping parameters will be the focus of future research. This will provide more comprehensive data support for precision agriculture and for improving the efficiency and sustainability of agricultural production.

5. Conclusions

This paper proposes a phenotyping monitoring technology based on an internal gradient algorithm for obtaining the target region and diameter of maize stems. Two image evaluation methods were used to assess the three types of target region extraction algorithms. The evaluation results indicated that the internal gradient algorithm is more suitable for obtaining the target region of maize stems. The mean absolute error for stem diameter was 1.92 mm, the MAPE was 5.16%, the RMSE was 2.25 mm, and the R² was 0.79. Since the R² value was greater than 0.7 and the MAPE was less than 6%, the stem diameter of maize can be accurately measured. Monitoring variations in maize stem contours and stem diameter during the rapid growth period can reflect soil quality conditions. This information will help researchers and agricultural practitioners develop scientific measures to improve soil quality, such as proper fertilization, plowing, and deep loosening. These scientific management methods will enhance soil fertility, consequently improving maize lodging resistance and yield.

Author Contributions

Conceptualization, J.Z.; methodology, J.Z.; software, M.C., Y.T. and Z.C.; validation, M.C. and Y.W.; formal analysis, H.T.; investigation, Y.G.; data curation, M.C.; writing—original draft preparation, J.Z., M.C. and Y.W.; writing—review and editing, L.H. and H.T.; visualization, M.C. and Y.W.; supervision, L.H. and H.T.; project administration, J.Z.; funding acquisition, J.Z. All authors have read and agreed to the published version of the manuscript.

Funding

This study was supported by the National Key R&D Program of China (2022YFD2001602), the Education Department of Jilin Province (JJKH20220336KJ), the National Innovation and Entrepreneurship Training Project for University (China) (202110193017) and the Jilin Provincial Department of science and technology (20230202042NC).

Data Availability Statement

The data presented in this study are available on request from the corresponding author.

Acknowledgments

We sincerely appreciate Jian Chen for his invaluable support during the field experiments.

Conflicts of Interest

The authors declare no conflict of interest.

References

  1. Tilman, D.; Balzer, C.; Hill, J.; Befort, B.L. Global food demand and the sustainable intensification of agriculture. Proc. Natl. Acad. Sci. USA 2011, 108, 20260–20264. [Google Scholar] [CrossRef] [PubMed]
  2. Ray, D.K.; Ramankutty, N.; Mueller, N.D.; West, P.C.; Foley, J.A. Recent patterns of crop yield growth and stagnation. Nat. Commun. 2012, 3, 1293. [Google Scholar] [CrossRef] [PubMed]
  3. Ray, D.K.; Mueller, N.D.; West, P.C.; Foley, J.A. Yield trends are insufficient to double global crop production by 2050. PLoS ONE 2013, 8, e66428. [Google Scholar] [CrossRef] [PubMed]
  4. Cobb, J.N.; DeClerck, G.; Greenberg, A.; Clark, R.; McCouch, S. Next-generation phenotyping: Requirements and strategies for enhancing our understanding of genotype–phenotype relationships and its relevance to crop improvement. Theor. Appl. Genet. 2013, 126, 867–887. [Google Scholar] [CrossRef]
  5. Li, Y.; Sun, W.; Wang, Z.; Wan, C.; Zhang, J.; Qi, X.; Zhang, J. SDG102, a H3K36-Methyltransferase-Encoding Gene, Plays Pleiotropic Roles in Growth and Development of Maize (Zea mays L.). Int. J. Mol. Sci. 2022, 23, 7458. [Google Scholar] [CrossRef] [PubMed]
  6. Reynolds, M.; Chapman, S.; Crespo-Herrera, L.; Molero, G.; Mondal, S.; Pequeno, D.N.; Pinto, F.; Pinera-Chavez, F.J.; Poland, J.; Rivera-Amado, C. Breeder friendly phenotyping. Plant Sci. 2020, 295, 110396. [Google Scholar] [CrossRef] [PubMed]
  7. Montelatto, M.B.; Villamagua-Vergara, G.C.; De Brito, C.M.; Castanho, F.; Sartori, M.M.; de Almeida Silva, M.; Guerra, S.P.S. Bambusa vulgaris leaf area estimation on short-rotation coppice. Sci. For. 2021, 49, e3394. [Google Scholar] [CrossRef]
  8. Long, W.; Li, Q.; Wan, N.; Feng, D.; Kong, F.; Zhou, Y.; Yuan, J. Root morphological and physiological characteristics in maize seedlings adapted to low iron stress. PLoS ONE 2020, 15, e0239075. [Google Scholar] [CrossRef]
  9. Minervini, M.; Scharr, H.; Tsaftaris, S.A. Image analysis: The new bottleneck in plant phenotyping. IEEE Signal Process. Mag. 2015, 32, 126–131. [Google Scholar] [CrossRef]
  10. Houle, D.; Govindaraju, D.R.; Omholt, S. Phenomics: The next challenge. Nat. Rev. Genet. 2010, 11, 855–866. [Google Scholar] [CrossRef]
  11. Nuss, E.T.; Tanumihardjo, S.A. Maize: A paramount staple crop in the context of global nutrition. Compr. Rev. Food Sci. Food Saf. 2010, 9, 417–436. [Google Scholar] [CrossRef] [PubMed]
  12. Rouf Shah, T.; Prasad, K.; Kumar, P. Maize—A potential source of human nutrition and health: A review. Cogent Food Agric. 2016, 2, 1166995. [Google Scholar] [CrossRef]
  13. Siyuan, S.; Tong, L.; Liu, R. Corn phytochemicals and their health benefits. Food Sci. Hum. Wellness 2018, 7, 185–195. [Google Scholar] [CrossRef]
  14. Liu, H.; Wang, H.; Shao, C.; Han, Y.; He, Y.; Yin, Z. Genetic Architecture of Maize Stalk Diameter and Rind Penetrometer Resistance in a Recombinant Inbred Line Population. Genes 2022, 13, 579. [Google Scholar] [CrossRef] [PubMed]
  15. Xue, J.; Xie, R.; Zhang, W.; Wang, K.; Hou, P.; Ming, B.; Gou, L.; Li, S. Research progress on reduced lodging of high-yield and-density maize. J. Integr. Agric. 2017, 16, 2717–2725. [Google Scholar] [CrossRef]
  16. Kelly, J.; Crain, J.L.; Raun, W. By-plant prediction of corn (Zea mays L.) grain yield using height and stalk diameter. Commun. Soil Sci. Plant Anal. 2015, 46, 564–575. [Google Scholar] [CrossRef]
  17. Ma, X.; Zhu, K.; Guan, H.; Feng, J.; Yu, S.; Liu, G. Calculation method for phenotypic traits based on the 3D reconstruction of maize canopies. Sensors 2019, 19, 1201. [Google Scholar] [CrossRef]
  18. Chaivivatrakul, S.; Tang, L.; Dailey, M.N.; Nakarmi, A.D. Automatic morphological trait characterization for corn plants via 3D holographic reconstruction. Comput. Electron. Agric. 2014, 109, 109–123. [Google Scholar] [CrossRef]
  19. Fan, Z.; Sun, N.; Qiu, Q.; Li, T.; Feng, Q.; Zhao, C. In situ measuring stem diameters of maize crops with a high-throughput phenotyping robot. Remote Sens. 2022, 14, 1030. [Google Scholar] [CrossRef]
  20. Vit, A.; Shani, G. Comparing rgb-d sensors for close range outdoor agricultural phenotyping. Sensors 2018, 18, 4413. [Google Scholar] [CrossRef]
  21. Ismail, S.M.; Ozawa, K. Improvement of crop yield, soil moisture distribution and water use efficiency in sandy soils by clay application. Appl. Clay Sci. 2007, 37, 81–89. [Google Scholar] [CrossRef]
  22. Han, L.; Han, A. An improved edge detection algorithm based on morphological operators and gradient. J. Comput. Theor. Nanosci. 2015, 12, 1121–1125. [Google Scholar] [CrossRef]
  23. Wu, Y.; Li, Q. The Algorithm of Watershed Color Image Segmentation Based on Morphological Gradient. Sensors 2022, 22, 8202. [Google Scholar] [CrossRef] [PubMed]
  24. Zhang, Y.; Liu, P.; Zhang, X.; Zheng, Q.; Chen, M.; Ge, F.; Li, Z.; Sun, W.; Guan, Z.; Liang, T. Multi-locus genome-wide association study reveals the genetic architecture of stalk lodging resistance-related traits in maize. Front. Plant Sci. 2018, 9, 611. [Google Scholar] [CrossRef] [PubMed]
  25. Hui, F.; Xie, Z.; Li, H.; Guo, Y.; Li, B.; Liu, Y.; Ma, Y. Image-based root phenotyping for field-grown crops: An example under maize/soybean intercropping. J. Integr. Agric. 2022, 21, 1606–1619. [Google Scholar] [CrossRef]
  26. Yang, W.; Wang, S.; Zhao, X.; Zhang, J.; Feng, J. Greenness identification based on HSV decision tree. Inf. Process. Agric. 2015, 2, 149–160. [Google Scholar] [CrossRef]
  27. Hamuda, E.; Mc Ginley, B.; Glavin, M.; Jones, E. Automatic crop detection under field conditions using the HSV colour space and morphological operations. Comput. Electron. Agric. 2017, 133, 97–107. [Google Scholar] [CrossRef]
  28. Chaves-González, J.M.; Vega-Rodríguez, M.A.; Gómez-Pulido, J.A.; Sánchez-Pérez, J.M. Detecting skin in face recognition systems: A colour spaces study. Digit. Signal Process. 2010, 20, 806–823. [Google Scholar] [CrossRef]
  29. Hamuda, E.; Glavin, M.; Jones, E. A survey of image processing techniques for plant extraction and segmentation in the field. Comput. Electron. Agric. 2016, 125, 184–199. [Google Scholar] [CrossRef]
  30. Meyer, G.E.; Neto, J.C. Verification of color vegetation indices for automated crop imaging applications. Comput. Electron. Agric. 2008, 63, 282–293. [Google Scholar] [CrossRef]
  31. Sun, Y.; Mu, Y.; Feng, Q.; Hu, T.; Gong, H.; Li, S.; Zhou, J. Deer body adaptive threshold segmentation algorithm based on color space. Comput. Mater. Contin. 2020, 64, 1317–1328. [Google Scholar] [CrossRef]
  32. Jin, S.; Su, Y.; Wu, F.; Pang, S.; Gao, S.; Hu, T.; Liu, J.; Guo, Q. Stem–leaf segmentation and phenotypic trait extraction of individual maize using terrestrial LiDAR data. IEEE Trans. Geosci. Remote Sens. 2018, 57, 1336–1346. [Google Scholar] [CrossRef]
  33. Zhou, J.; Wu, Y.; Chen, J.; Cui, M.; Gao, Y.; Meng, K.; Wu, M.; Guo, X.; Wen, W. Maize Stem Contour Extraction and Diameter Measurement Based on Adaptive Threshold Segmentation in Field Conditions. Agriculture 2023, 13, 678. [Google Scholar] [CrossRef]
Figure 1. Maize stem information collection: (a) field maize image; (b) field maize image with a checkerboard; (c) digital Vernier caliper measurement.
Agronomy 13 01185 g001
Figure 2. Flow chart of maize stem diameter measurement.
Agronomy 13 01185 g002
Figure 3. Image segmentation process: (ac) original maize images; (df) hue saturation value (HSV) color space images; (gi) HSV + maximum between-class variance (Otsu) images.
Agronomy 13 01185 g003
Figure 4. Image filtering process: (ac) median filtered images; (df) binarized images; (gi) images subjected to morphological opening operations.
Agronomy 13 01185 g004
Figure 5. Image gradient process: (ac) basic gradient images; (df) external gradient images; (gi) internal gradient images.
Agronomy 13 01185 g005
Figure 6. Coordinate acquisition process: (a) coordinate extraction of the checkerboard; (b) coordinate extraction of the maize stem contour.
Agronomy 13 01185 g006
Figure 7. Pixel proportion extraction results: (ac) Pixel proportions of three groups of maize original images, three types of gradient images, and manually segmented images.
Agronomy 13 01185 g007
Figure 8. Image quality evaluation results based on three evaluation metrics: (ac) Similarity between the three gradient images and manually segmented images for the first group of maize plants; (df) Similarity between the three gradient images and manually segmented images for the second group of maize plants; (gi) Similarity between the three gradient images and manually segmented images for the third group of maize plants.
Agronomy 13 01185 g008
Figure 9. Linear regression between true and measured maize stem diameters.
Agronomy 13 01185 g009
Table 1. Comparison of true and measured maize stem diameters.
NumberTrue Stem
Diameter/
mm
Measured Stem
Diameter/
mm
Absolute Error/mmNumberTrue Stem
Diameter/
mm
Measured Stem Diameter/
mm
Absolute Error/mm
136.0936.500.413134.4036.321.92
234.1133.630.483233.0630.003.06
331.9828.943.043339.2342.192.96
427.5328.911.383434.0634.740.68
537.2938.831.543534.3631.762.60
638.2037.430.773643.8040.003.80
734.5439.795.253738.1635.712.45
835.0836.291.213832.8729.323.55
932.0833.161.083935.1232.053.07
1030.7331.650.924039.6138.481.13
1138.0538.770.724140.8639.291.57
1236.2234.002.224239.0540.431.38
1337.1134.182.934342.10 38.893.21
1432.6736.333.664436.4835.221.26
1544.3345.561.234532.9833.260.28
1635.1734.151.024638.3136.881.43
1736.6035.111.494736.3233.133.19
1828.5028.730.234836.2136.880.67
1941.9740.261.714939.1639.550.39
2045.9848.752.775039.6738.281.39
2138.1939.321.135137.2337.860.63
2247.5751.083.515237.1834.292.89
2341.2842.691.415338.9541.252.30
2451.7852.270.495435.5632.143.42
2539.1835.913.275538.8738.750.12
2653.11 54.171.065643.3844.170.79
2741.3943.131.745734.5737.893.32
2843.1840.592.595833.2637.173.91
2940.4642.191.735935.1837.832.65
3043.5446.673.136033.4734.621.15
Disclaimer/Publisher’s Note: The statements, opinions and data contained in all publications are solely those of the individual author(s) and contributor(s) and not of MDPI and/or the editor(s). MDPI and/or the editor(s) disclaim responsibility for any injury to people or property resulting from any ideas, methods, instructions or products referred to in the content.

