1. Introduction
The concept of ecosystem services (ES) has emerged as a framework to communicate the importance of enhancing natural capital conservation, protection and restoration for sustaining human livelihoods [
1,
2]. The Millennium Ecosystem Assessment (MEA) represents an important milestone in examining the environment through the ES framework, offering the widest consensus view to assess the linkages between natural capital, ES, and human well-being [
3]. Among the four major typologies of ES, i.e., provisioning, regulating, cultural, and supporting services, the MEA reports how changes in ecosystems influence social and economic dimensions [
4,
5], thereby emphasising the importance of ES internationally. The MEA represents an important process of building a common assessment capacity for ES and serves as a valuable starting point for developing appropriate actions to reverse the degradation of natural capital [
6,
7]. Furthermore, the assessment also identifies areas where information is lacking, and further research questions need to be explored for classifying, quantifying, mapping, and valuing ES. Considering the complexity of the recovery of socio-ecological systems and the growing demand for evidence-based policies to support drastic natural capital recovery actions, scholars converge on the need for more research on the interpretation and integration of these concepts among the scale, spatial pattern, and dynamics of the systems analysed, which has substantial implications for management and policy.
The core of the evaluation literature distinguishes between monetary and non-monetary methods that span across sectors with interdisciplinary and multi-scale approaches (see [
8,
9] for a review of the two approaches). According to [
10], a correct understanding of the trade-offs and synergies among the different ES by land use management is a precondition to implementing strategies to enhance and restore natural capital and avoid ecosystem losses. Furthermore, [
9] have attempted to emphasize and value different ES and emphasized the importance of further research to fully integrate the ES concept into landscape research and decision-making processes.
After the seminal work of [
9], a growing body of literature has attempted to assess ES in relation to landscapes and land use management. The ability of landscapes to provide multiple functions or services is often equated with ecosystem functions or services [
9]. Authors of [
9] posited that understanding the multi-functionality of landscapes is a prerequisite for assessing ES in a landscape context. Studies have focused on agricultural management, investigating synergies and conflicts between landscape functions and different land uses. Through various functions, rural landscapes can contribute to numerous ES [
11]. Therefore, sustainable management of rural areas has received significant attention in Europe, where land use change is promoted to combat climate change and preserve biodiversity [
12], while also providing notable recreation and cultural benefits [
13]. While there is no consensus on a universal definition of landscape, the literature generally describes the physical attributes that distinguish landscape features. Thus, a landscape can be defined as an assemblage of physical attributes that society can identify, including altimetry, geology, land use (such as crops or forests and forest types), water, colour, adjacent scenery, and cultural modifications [
14]. Thus, a landscape may be presented as a mosaic of these attributes [
14,
15], with varying degrees of anthropic alteration of natural space, exceeding the realm of only land use management [
10,
16]. A recent review by [
17] argues that the proportion of natural or anthropised areas, landscape connectivity and aggregation, and landscape heterogeneity are the primary parameters to consider when assessing the provision of ES. Other studies [
10,
15,
17,
18] have demonstrated the heterogeneous provision of ES arising from diverse landscape processes and structures derived from different spatial distributions of alternative land uses (such as natural ecosystems, intensive croplands, pasture, and rangelands). Despite a growing body of literature on the linkages between ES and landscapes [
19,
20,
21], little is known about the trade-offs, synergies and disservices in the provision of these services by different landscapes.
This study aims to investigate the relationships between ES and alternative rural landscapes, providing a comprehensive understanding that considers the ecological, economic, and socio-cultural values of landscapes. We employ empirical analysis to assess the trade-offs and synergies among ES provided by rural landscapes. Fuzzy multi-criteria analysis is applied to relevant rural landscapes in the Tuscany Region of Italy. The primary novelty of this paper is the use of morphotypes adopted by the Italian regional administration to identify the ‘invariants’ that distinguish the rural landscape.
The paper is structured as follows: The next section provides an overview of the materials and methods used, including case study descriptions and landscape definitions. This is followed by a description of the methodology employed. Subsequently, we present the results, and finally, we discuss the conclusions.
2. Materials and Methods
2.1. Case Study AREA
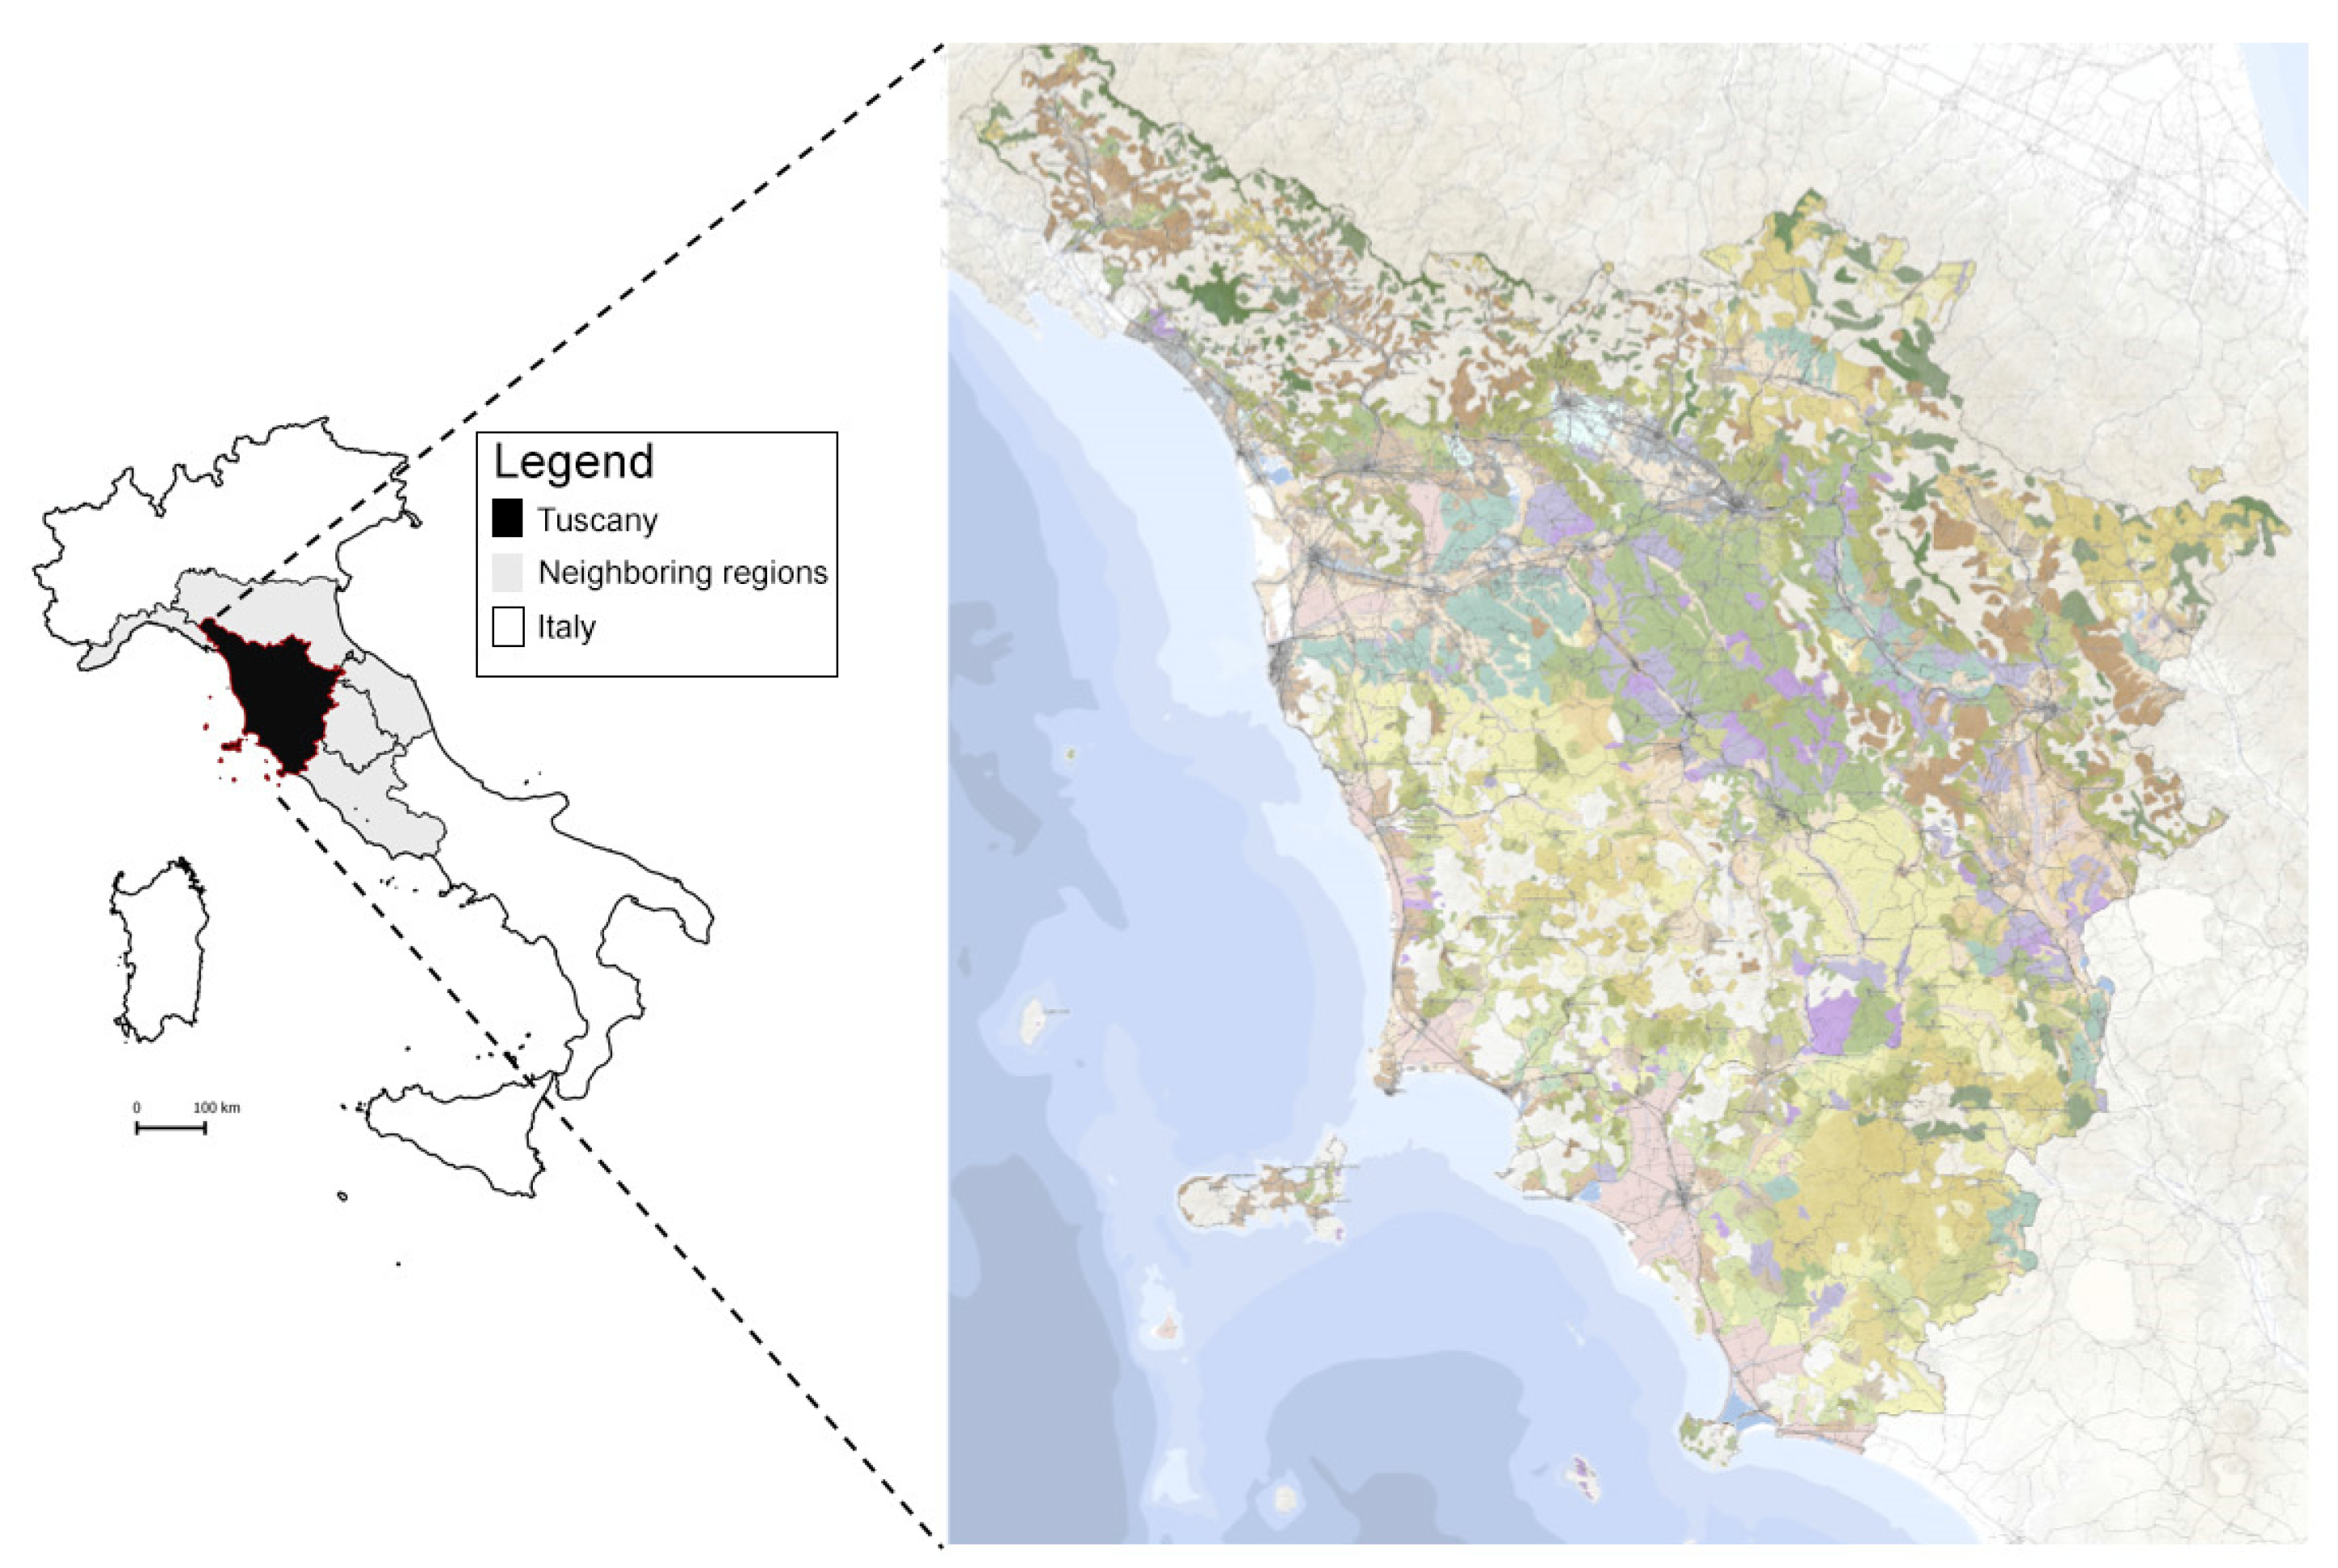
Tuscany is one of the 20 Italian NUTS2 regions located in the western part of Italy, covering an area of approximately 23,000 square kilometres. The region is distinguished by three primary landscapes, with the majority of the surface occupied by hills (66%) and mountains (25%), while the remaining portion is flat (see
Figure 1).
Although Tuscany is situated in a temperate climatic area, the region’s different altitudes and locations near the Tyrrhenian Sea (stretching along 663 km of coast) give rise to very diverse climatic zones, including hot temperate, sub-coastal temperate, sub-continental temperate, continental temperate, and cold temperate zones [
18]. The anthropisation process has taken place to varying degrees throughout the region. High levels of anthropisation are observed in the plain areas, characterised by continuous urban sprawl along the main river, the Arno River, which flows from the mountainous northeastern part to the Tyrrhenian coast in the centre–western region. This area exhibits the highest urban density and strong competition for land use among different sectors, including agriculture, urbanization, and infrastructure. Conversely, internal regional areas are characterised by a strong process of abandonment, specifically in the mountainous northern areas and the hilly areas of the southern part [
22,
23]. The hilly area of the central region experience high demand for land, specifically in relation to rural tourism development and investment in vineyards [
24,
25].
Based on the national devolution process, NUTS2 regions are responsible for land use planning, which includes designing rural development and landscape plans. Although regions have some autonomy in landscape planning, there are other centralised regulations and programmes that affect regional landscapes. These include, for example, the protection of national parks, the Natura 2000 directive, the Common Agricultural Policy (CAP) National Strategic Plan and the National Framework Program for the Forest Sector regulations [
26].
2.2. Morphotypes of the Tuscany Rural Landscape
In this paper, we utilised the concept of landscape morphotype to differentiate between various landscape typologies [
27]. A morphotype is defined as a particular form of a location that characterises its identity and can be identified or classified in various contexts.
The concept describes the differences in the endowment of territorial attributes, including hydro-morphological features, agricultural aspects and attributes of the long-term settlement system as well as infrastructural configuration, constituting each rural landscape [
28]. Thus, it can ultimately describe the identity of a rural community [
29]. The rural morphotype has been conceptualised as a territorial structure resulting from the interaction between the morphological characteristics of the territory, cultural aspects, and characteristics of the settlement system, which can be associated with different forms and methods of agricultural management.
In accordance with the regional landscape plan, six rural morphotypes have been classified along a gradient from simpler, as defined by the grade and type of human settlement in the territory and the present crops, to more complex connections, which entail a deep interplay between culture, rural infrastructure, and the relations that exist between various landscape factors). The description of regional landscape planning and the applied process to create the region’s landscape morphotypes is beyond the paper’s scope (see [
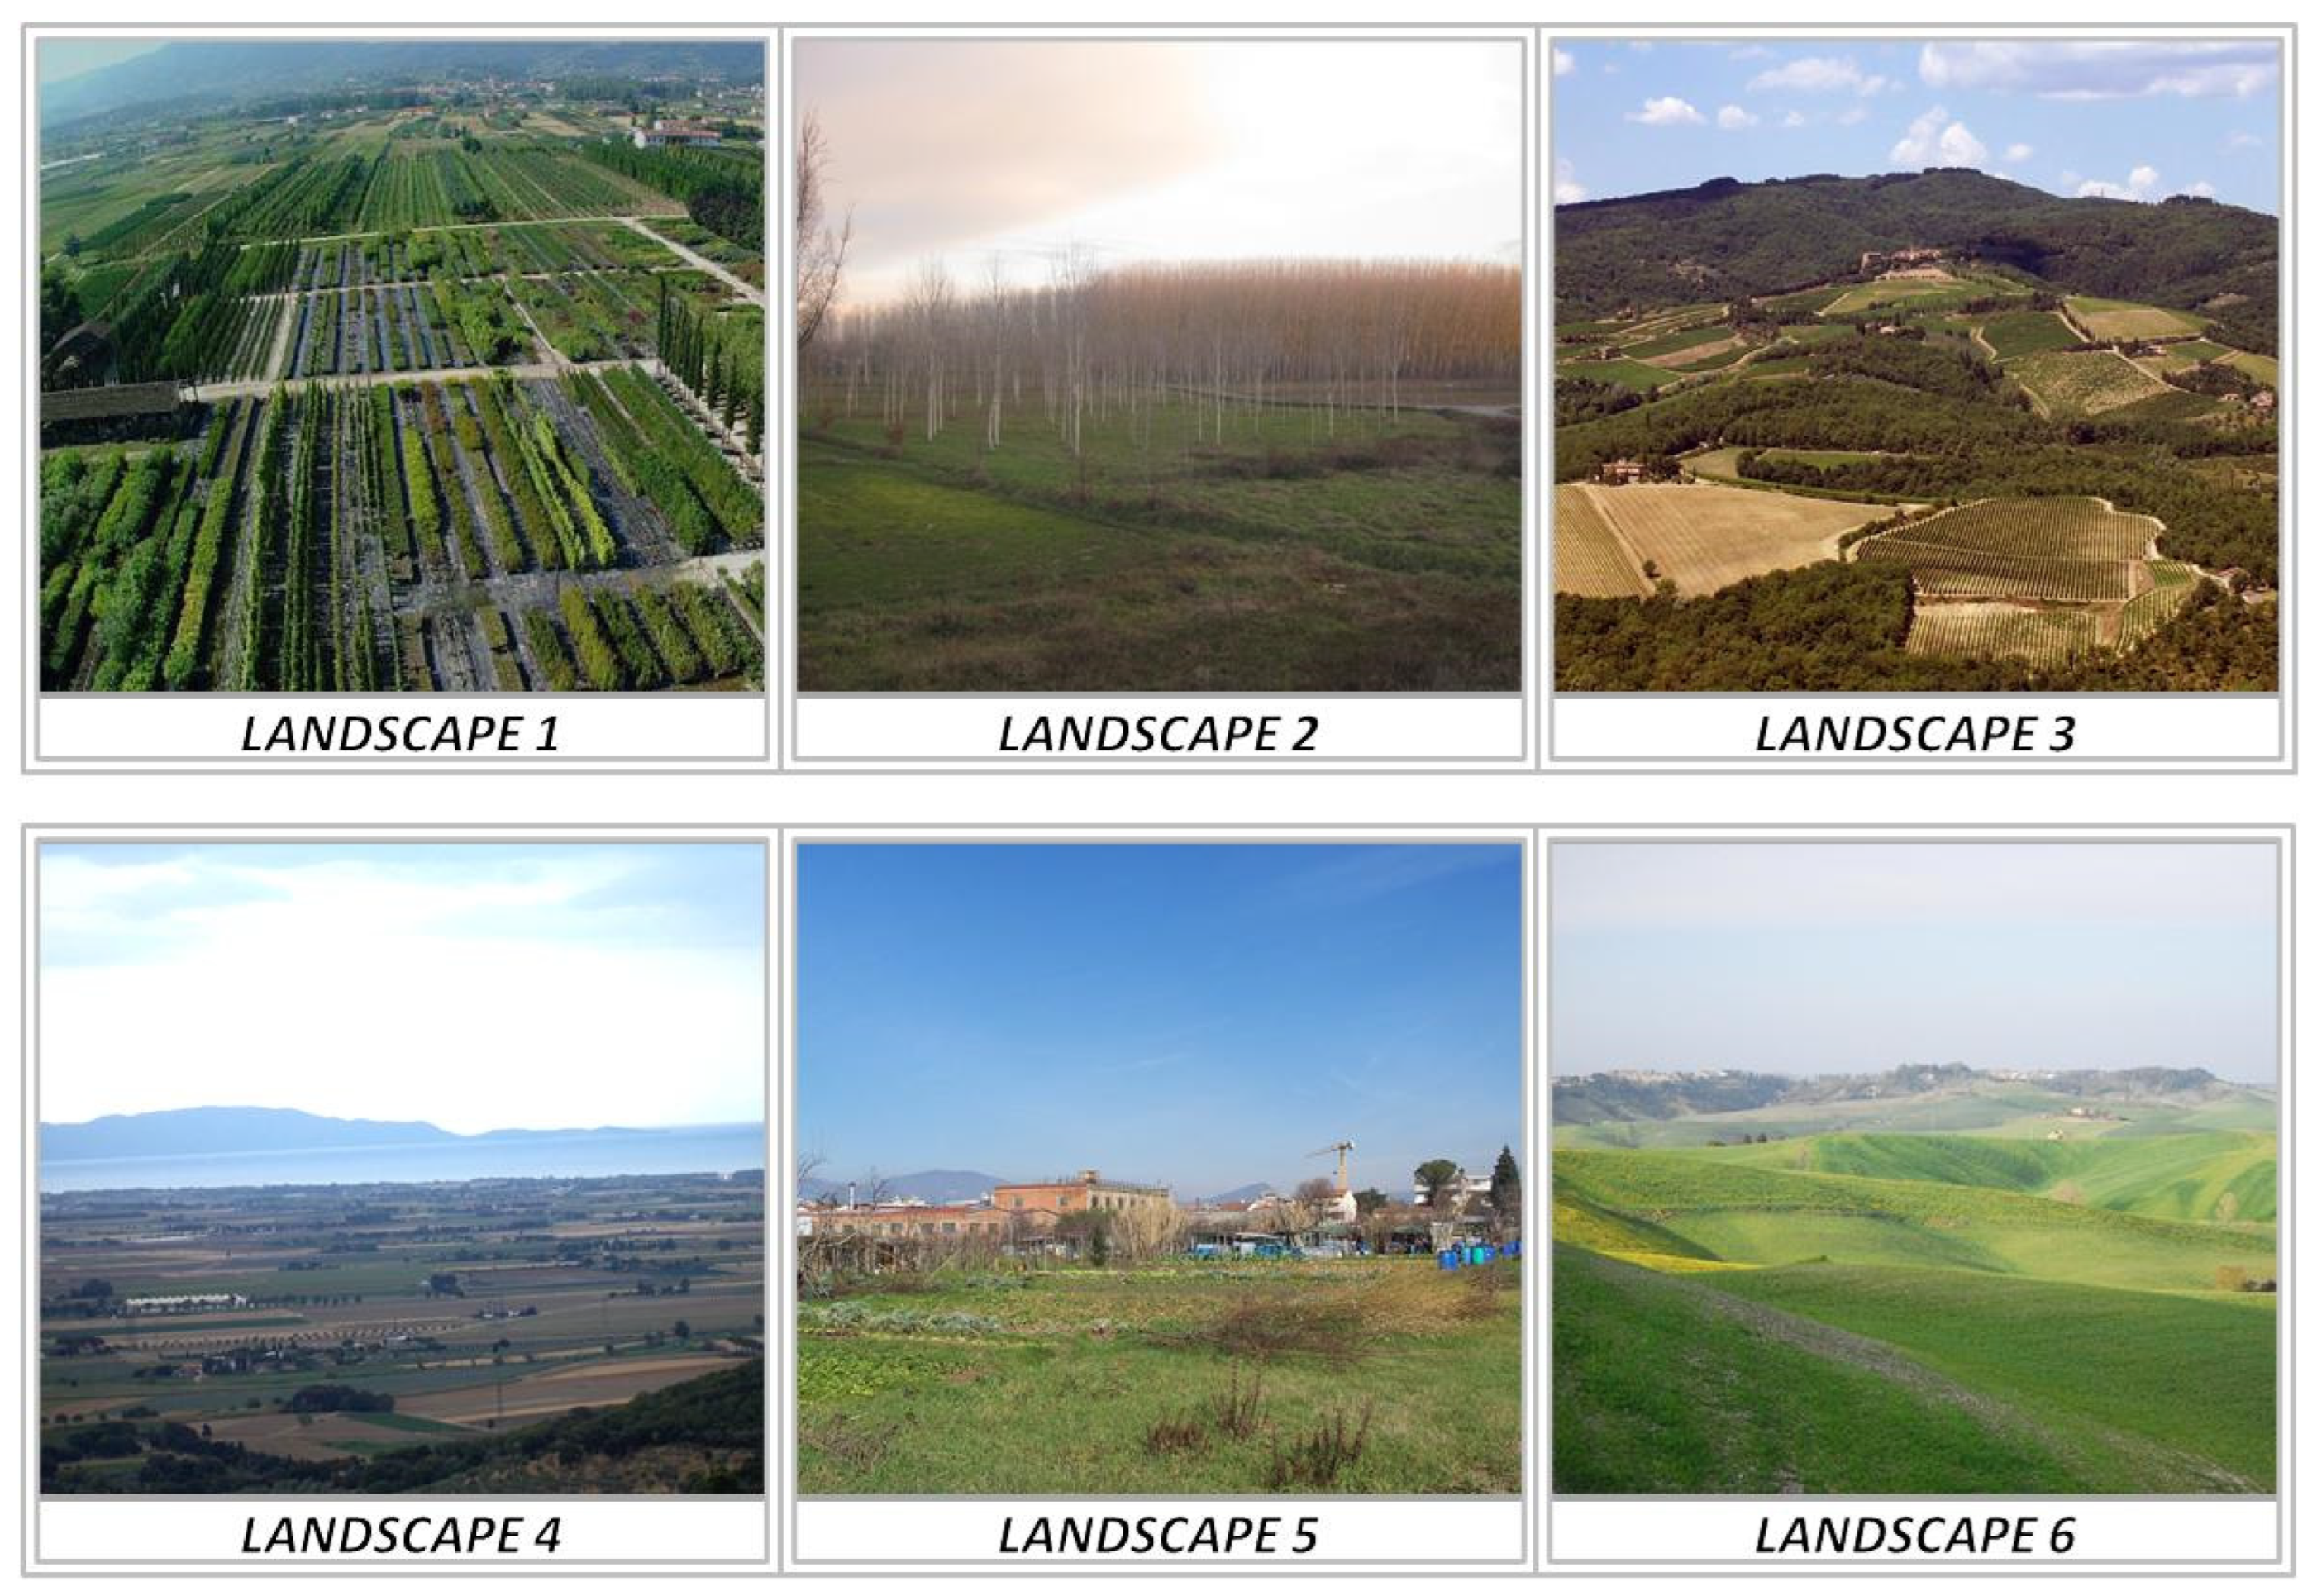
30] for a comprehensive analysis of these processes in the case study region). The visual identification of the regional rural morphotypes is presented in
Appendix A,
Figure A1.
The first morphotype, referred to as the plant nursery (L1), describes an artificial landscape dominated by intensive agricultural production systems, specifically plant and tree nurseries. This landscape is often perceived as a vast garden, appreciated for its orderliness and rich vegetation. The morphotype is characterised by a high level of technological capital investment, including features such as drainage, plotted crops, drip irrigation and homogenous fields. However, it also features a low level of ecological infrastructure. Settlements of this type often result from growth processes occurring over the past 60 years, resulting in widespread and heavily branched development that has altered the historical territorial structure and contributed to urban sprawl.
The agroforestry landscape, characterised by the association between arable crops and poplar or fruit trees, is classified as the second morphotype (L2). This landscape is commonly found in plain or valley areas where water is readily available for irrigation. The fields within this landscape exhibit low standardisation in terms of shape and dimensions. The agroforestry landscape is perceived as a unique and distinctive landscape, where the open skyline of the arable land alternates with a dense weave of tall trees, characterised by their density and verticality.
The third morphotype (L3) comprises a mosaic of hilly vineyards, olive groves, and arable land. In some instances, vineyards vary between the primary crops, whereas fields are small and possess indistinct boundaries in other cases. Incorporating landscape elements such as hedgerows or small forests enhances system diversification and contributes to significant ecological infrastructure. Small historical villages are common human settlements in this morphotype.
The arable crops in lowland areas with alluvial deposits represent the fourth morphotype (L4), which is shaped by land reclamation activities in coastal regions. The invariant elements of this landscape include the geometrical form of the fields, the regularity of the plots and a combination of land and buildings as well as complex irrigation and drainage systems. Settlement density can vary from very low, with minimal alteration to the historical structure, to higher and connected to widespread urbanisation. The degree of ecological infrastructure depends on the variable presence of hedges and rows of trees in the field.
The interplay between buildings and open spaces in the peri-urban area constitutes the fifth morphotype (L5). The peri-urban area is characterised by urban settlements, such as residential and industrial buildings and infrastructure. The main crop mix in this area consists of arable areas with alfalfa or grassland crops, resulting from a simplification process [
31]. Although this morphotype exhibits a rich endowment of ecological infrastructure, it is quite fragmented due to the urban sprawl process.
The final morphotype (L6) is composed of arable crops with essential traditional landscape structures, including regularly arranged fields, gently rolling hills, and areas with elongated rows of trees. The level of ecological infrastructure is heterogeneous, with a predominance of field margins featuring landscape elements such as hedges.
2.3. Methodology
This paper evaluates the trade-offs and synergies of ES in the rural landscape of Tuscany, Italy. Specific attention was given to the mapped typification of the rural landscape in Tuscany as a methodology. This work is an important knowledge base and provides guidelines for policies aimed at protecting the regional agricultural landscape. Despite being available in textual and iconographic forms, this work captures significant landscape-structural, functional, and managerial aspects in terms of values and criticalities, including various landscape quality objectives.
Building on our previous experience and relatively broad information base, we found that choosing a non-monetary methodology for estimating trade-offs among different ES and relying on expert knowledge instead of physical indicators were particularly favourable. These cost-effective methods allow for linking evaluations to points of broad consensus at the regional level based on the formed vision around the morphotypes used. Both monetary and non-monetary methods can be used for research purposes. Monetary techniques are used to measure the value of ES and disservices by assessing the willingness to pay for an increased level of ES or the willingness to accept a reduction in these services. While this technique is widely adopted [
32], it has conceptual and empirical weaknesses that restrict its application to single-ecosystem service assessments, particularly for use-value services such as biomass or recreation and tourism. Furthermore, this technique is not suited for other services such as cultural, aesthetic, and regulation services, and it is not effective for assessing trade-offs among different categories of ES [
33,
34,
35].
Conversely, non-monetary approaches estimate the provision of ES using indicators other than monetary value [
36]. These indicators can be physical or state indicators or verbal scales that express expert judgement. Both approaches have advantages and disadvantages. Physical indicators provide accurate measures, but require controlling for exogenous parameters that affect the indicator score, making comparisons among different contexts complex. Additionally, accurate indicators are often costly or require adopting proxy indicators with varying levels of information [
37]. Furthermore, physical indicators are not suitable for multi-criteria comparisons because the normalisation process requires defining a utility function for each indicator, which relies on arbitrary assumptions about minimum, maximum, and tipping points [
35,
38]. However, as previously mentioned, non-physical indicators offer considerable flexibility and cost-effectiveness; however, the reliance on expert knowledge is influenced by the level and quality of information and the cognitive and social basis of the experts [
16]. However, despite these limitations, an information system such as the one based on regional morphotypes, the result of decades of systematic research on Tuscan landscapes, along with information on land use, has been particularly accessible and favourable for experts. This system has been tested and used for the development of the regional landscape plan.
Additionally, ref. [
39] argues that although expert elicitation contains uncertainties and subjectivities, empirical findings indicate a monotonic relationship between the experts’ elicitation and the quantitative indicators. Other authors [
39,
40,
41] have stressed the need to use participatory approaches, incorporating expert and rural actors’ knowledge, when addressing complex problems such as sustainability, biodiversity collapse, and climate change. This can enhance the pluralism approach and the legitimacy of policy actions [
42]. Hence, a broad consensus view of experts can be an important contribution to decision-making. Furthermore, the research question does not require mapping exercises since it is based on the idealisation of the landscape features in morphotypes, which constitutes a widely accepted representation of the typologies, extent, and diffusion of the key landscapes of the region [
7].
Based on the assumptions above, we employ a fuzzy multi-criteria approach to assess the trade-offs and benefits generated by diverse landscapes by mimicking the decision-maker’s utility function by aggregating semi-qualitative indicators of different ES [
43,
44]. Several multi-criteria methods can be classified as compensatory or outranking methods [
34,
44,
45]. The former uses weight to compare alternatives/options, while the latter is based on dominance rules [
44,
46]. We adopt a fuzzy weighted sum to quantify the trade-offs and synergies of the relevant Tuscany landscape on ES. Although the weighted sum is a well-established method, the integration of fuzzy is quite novel in this context. This approach can deal with uncertainties and disagreements in subjective judgements during appraisal [
47,
48]. Therefore, the proposed method can enable the control of different levels of uncertainties and define the degree of alignment of experts with their preferences.
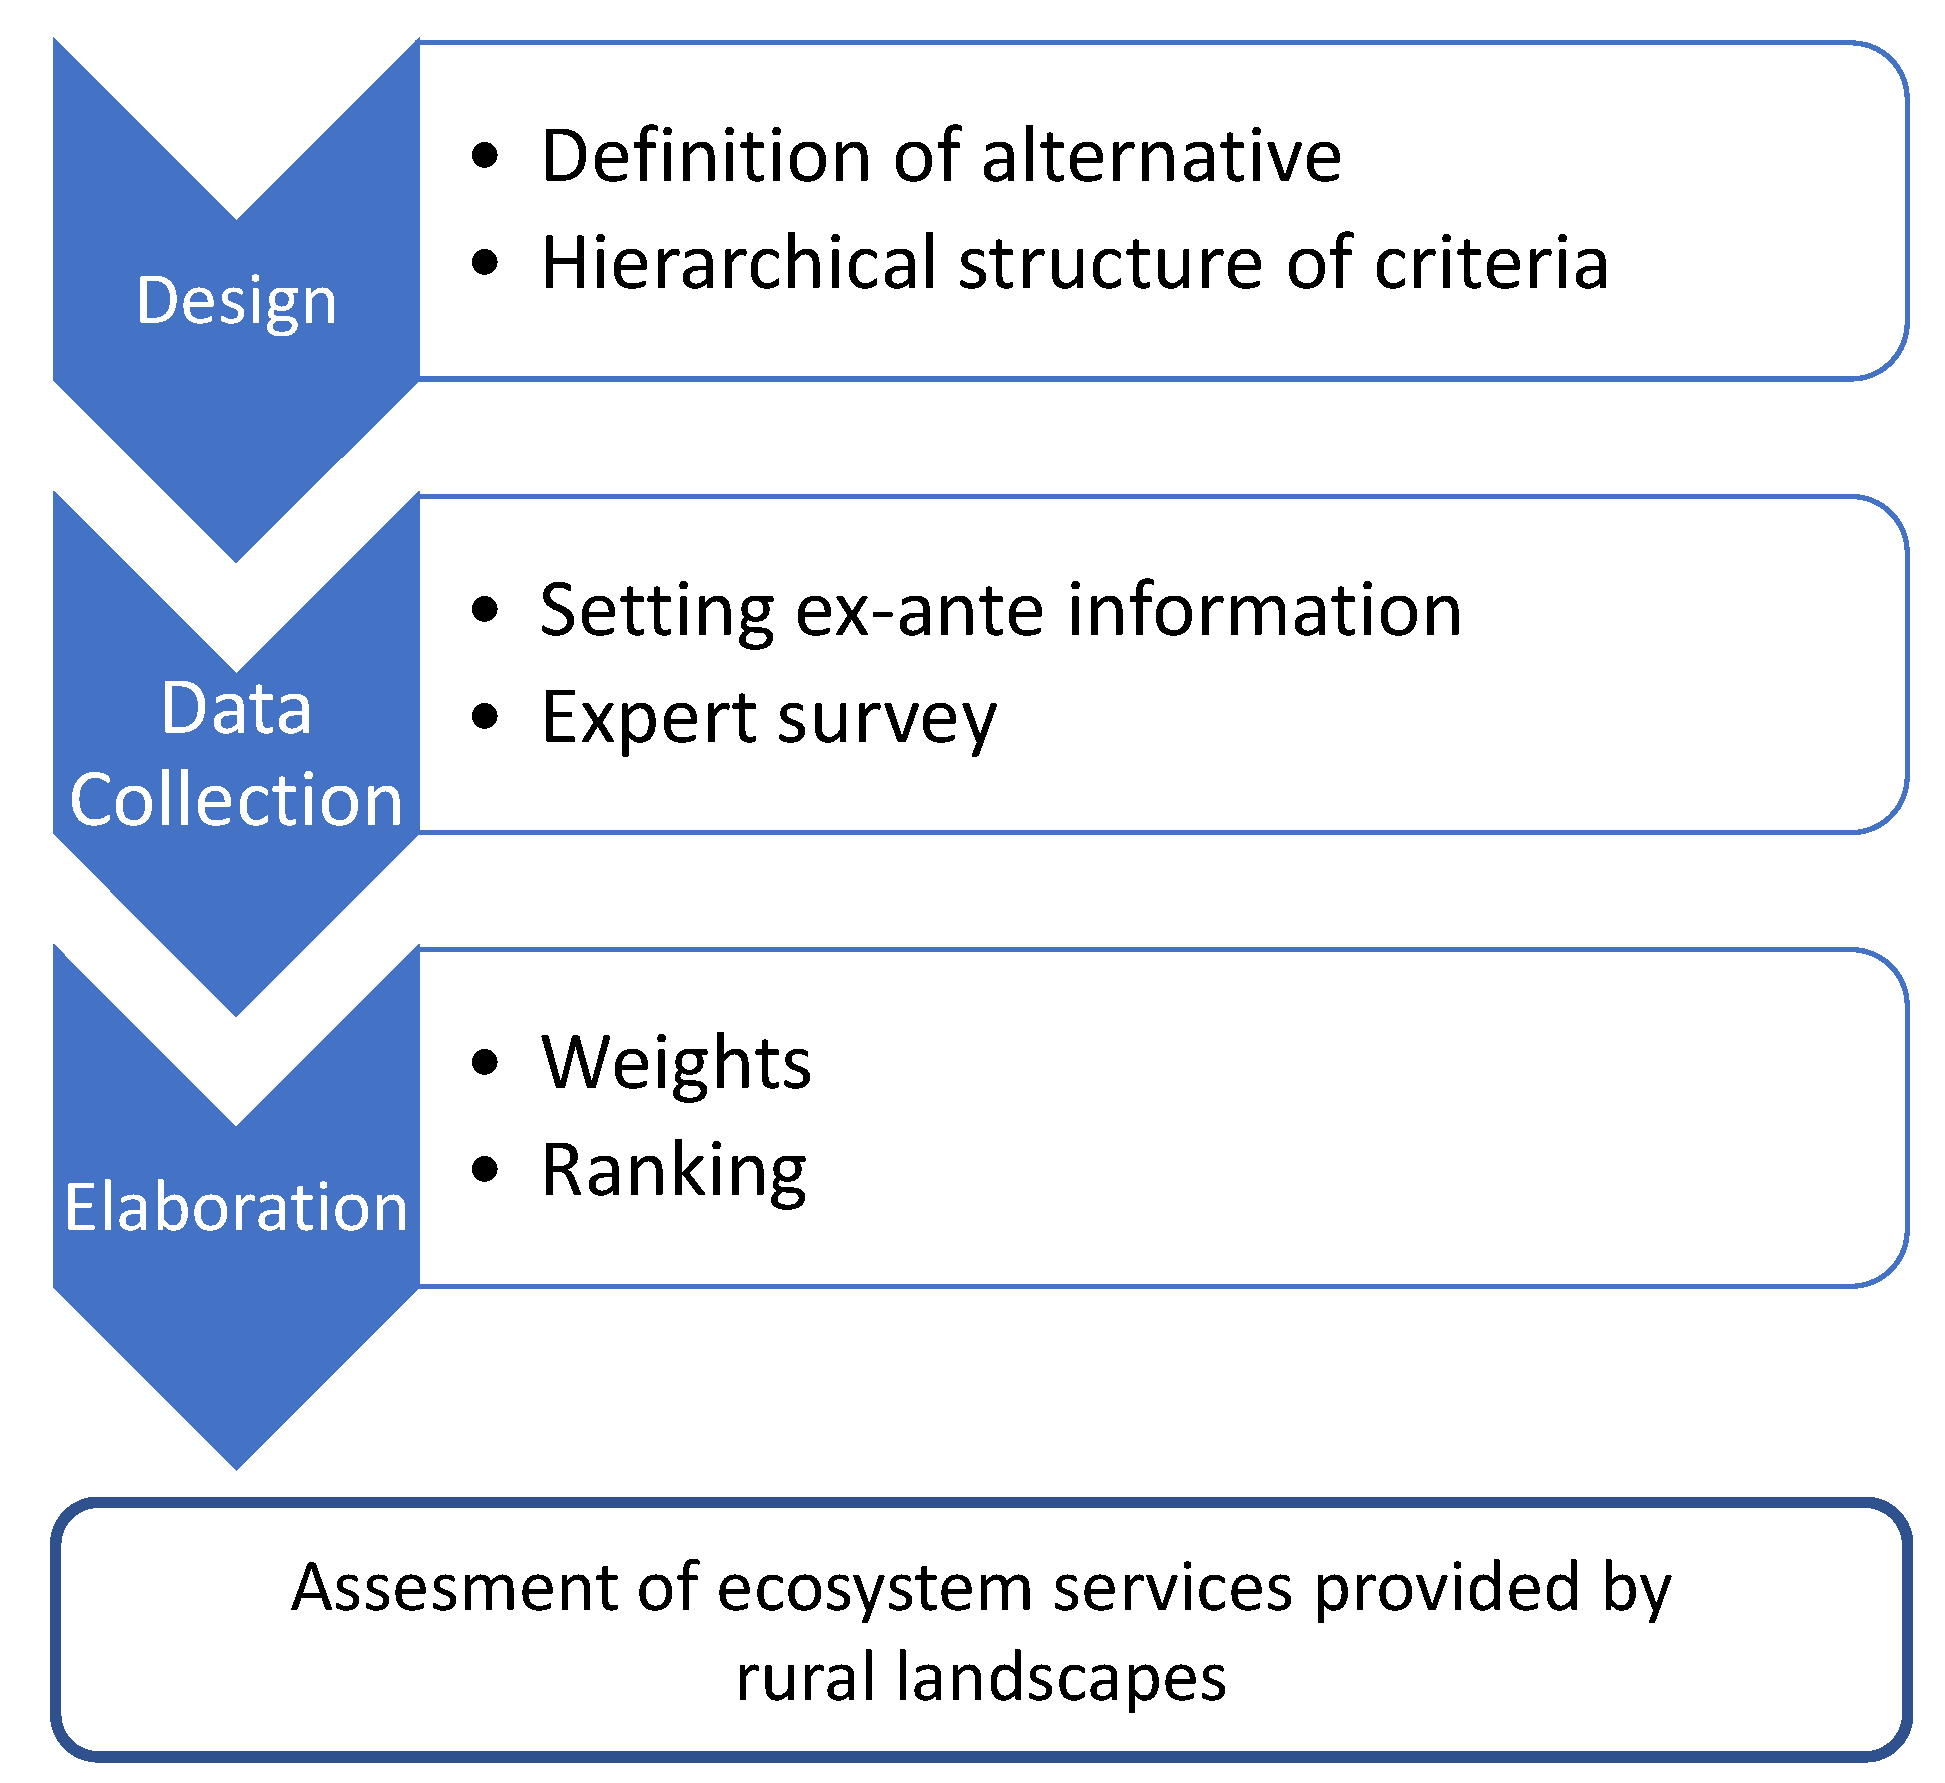
The methodology is based on the following steps (
Figure 2): (a) experimental design, (b) data collection, and (c) elaboration and quantification.
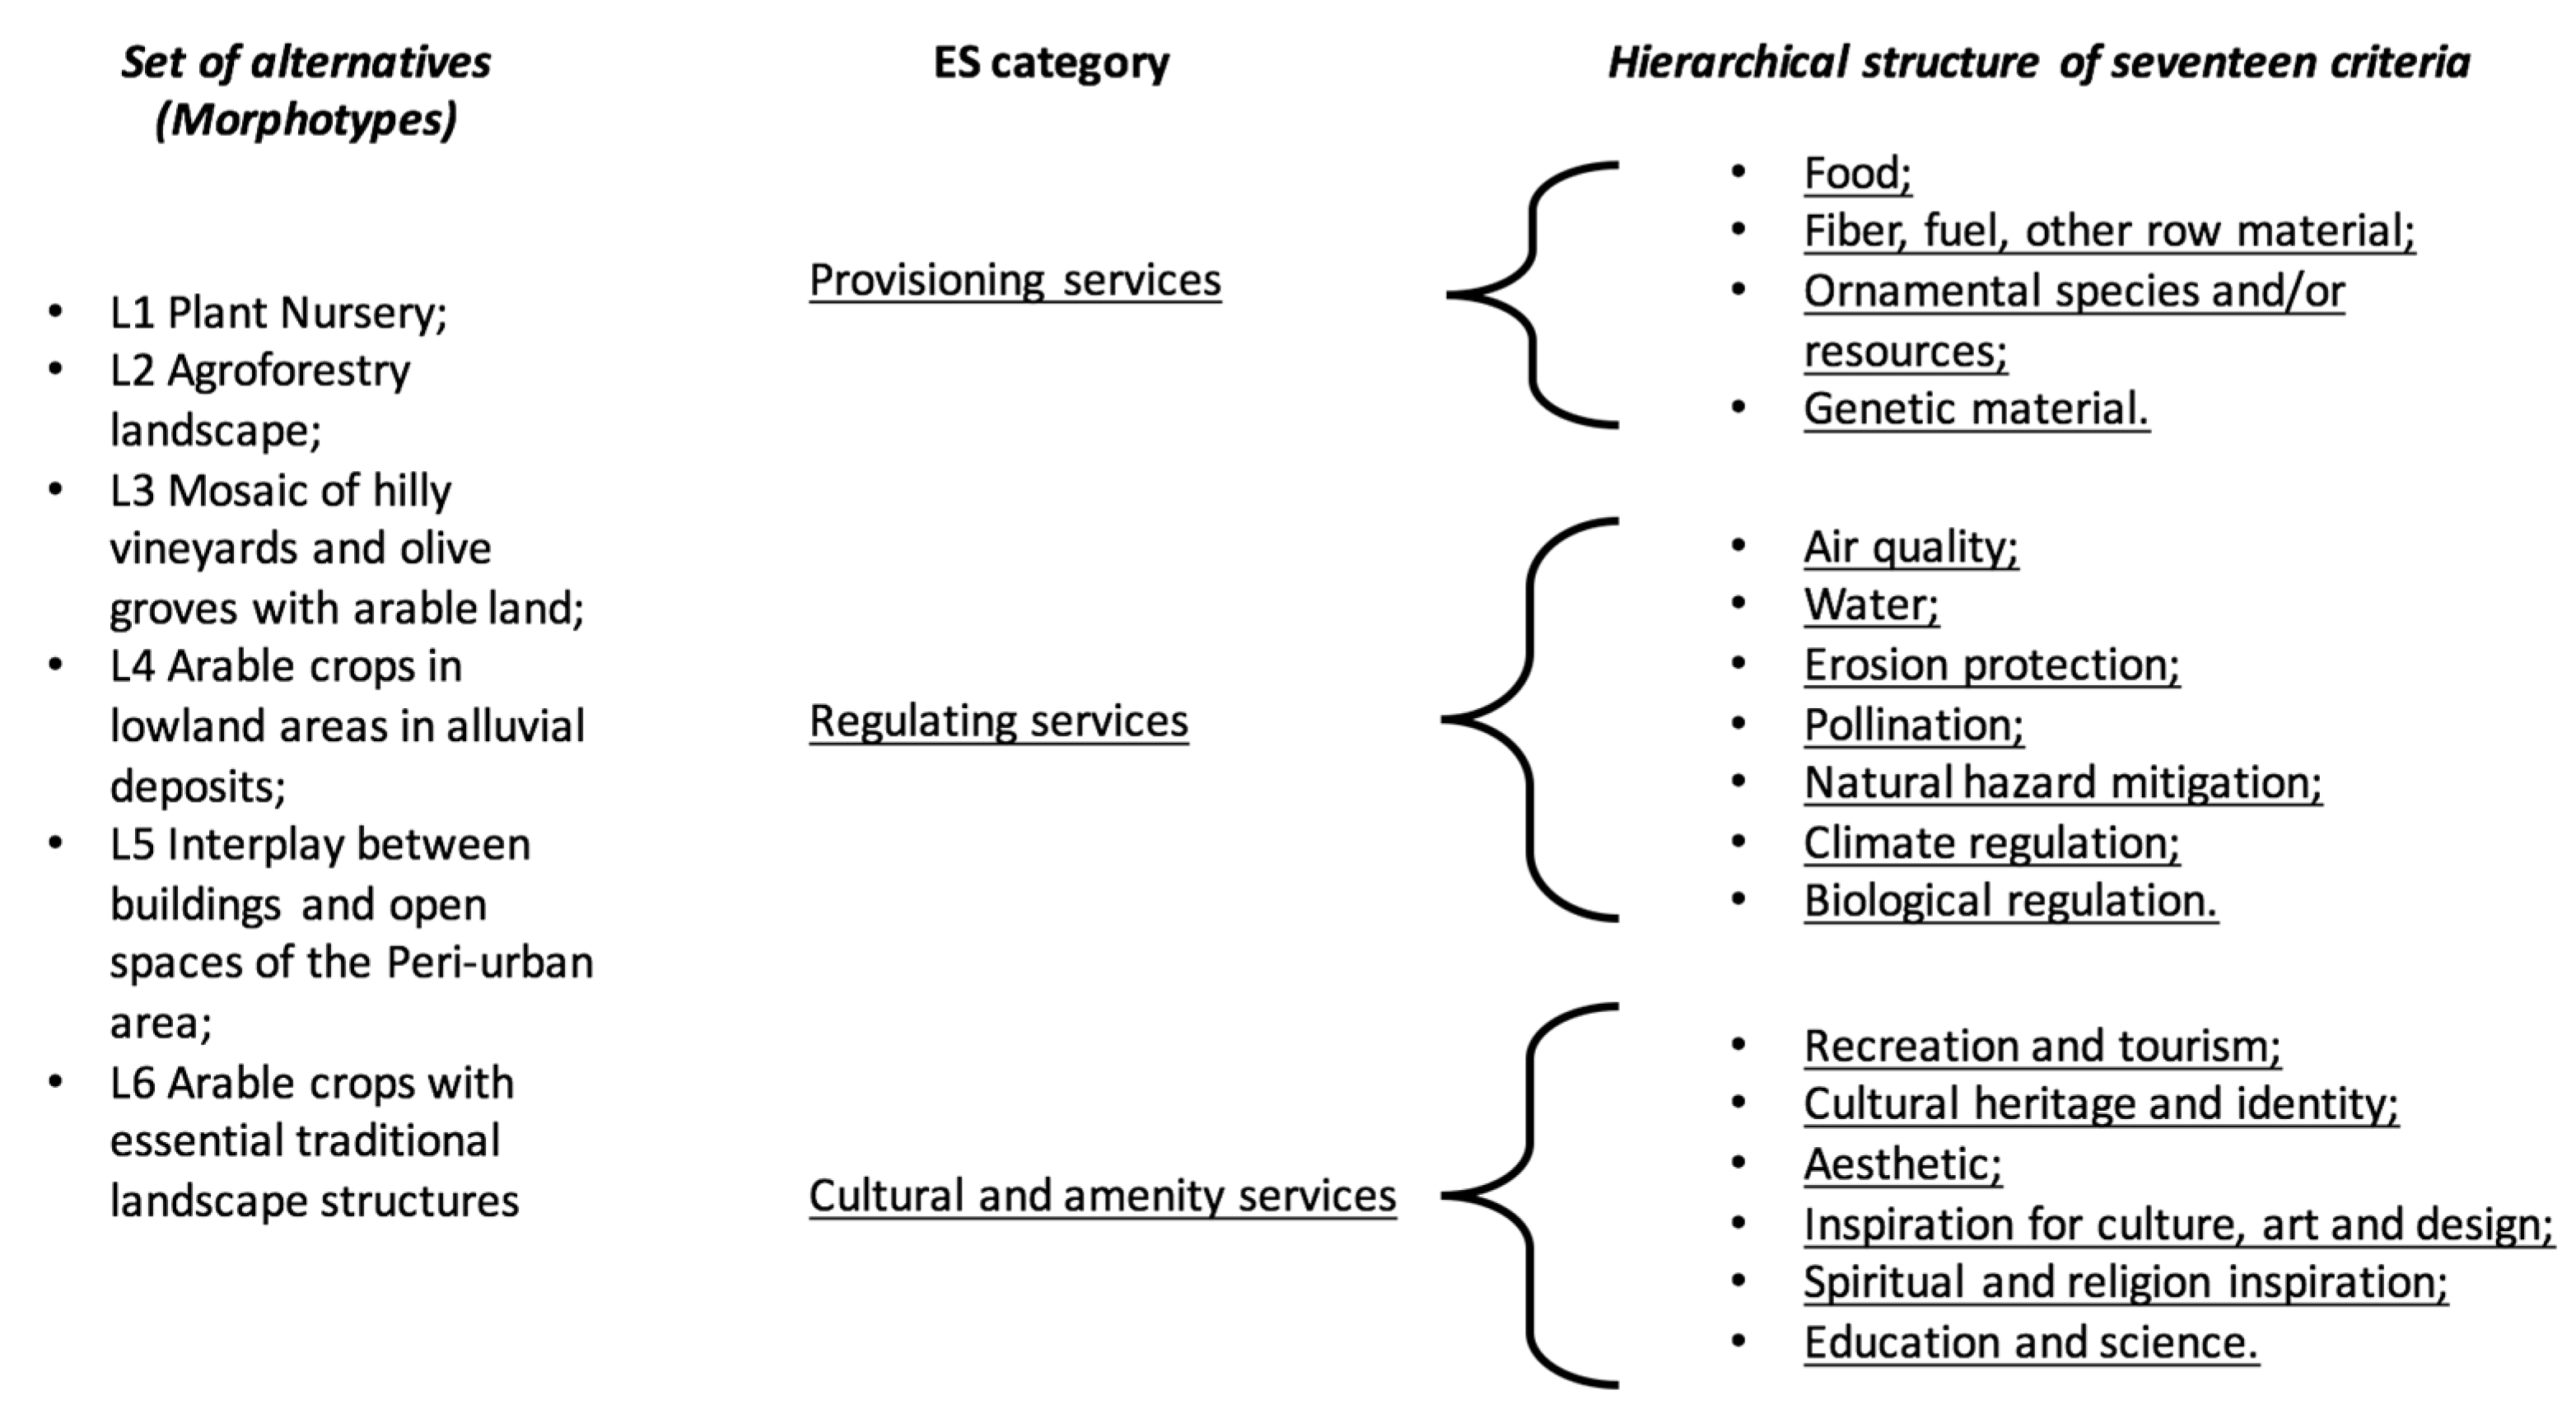
The first step in our study involves designing a decision-making structure, selecting morphotypes (i.e., alternatives to be assessed) and establishing criteria for comparing ES. Based on regional morphotypes, we selected six typologies that form rural landscapes as alternatives. Next, we considered the hierarchical structure of ES proposed by [
49], with some ES reduced based on both literature review and expectations about high subjectivities in expert appraisal. Supporting services, provision of water, provision of biochemical and medical resources, and waste treatment were excluded since they are expected to be marginally affected by the six landscape typologies and require high sectoral expertise. This step aims to obtain a set of six alternatives (morphotypes) and a hierarchical structure of 17 criteria, with four belonging to provisioning services such as (a.1) food; (b.1) fibre, fuel, and other raw material; (c.1) ornamental species and/or resources; (d.1) genetic material, seven to regulation service (i.e., a.2) air quality; (b.2) water; (c.2) erosion protection; (d.2) pollination; (e.2) natural hazard mitigation; (f.2) climate regulation; (g.2) biological regulation), and the remaining six to cultural and amenity services such as (a.3) recreation and tourism; (b.3) cultural heritage and identity; (c.3) aesthetics, (d.3) inspiration for culture, art and design; (e.3) spiritual and religious inspiration; and (f.3) education and science. Please refer to
Figure 3 for a visual representation of the design phase.
The second step involves estimating the level of ES provided by each morphotype. We used expert opinions to assess the relative contribution of each landscape morphotype to ES. Data were collected through an expert survey involving 28 experts with a background in agricultural, environmental, and ecosystem sciences who were involved in regional landscape planning. The questionnaire consisted of two main parts. In the first section, after providing a detailed description of the ES, we asked for the relative priority of each ecosystem service in the region, using a hierarchical questionnaire that included two levels (i.e., category and indicator levels) of relative importance (weights).
The second section addressed the contribution of each morphotype in affecting the provision of ES. For each pair of landscape–ES, experts estimated the benefit using a Likert scale ranging from zero (no effect) to nine (main contribution). We provided experts with a visual card containing text and pictures used by the Tuscany region in the landscape plan to describe the morphotypes (see
Appendix A). This methodological choice of using cards with photography instead of descriptions or physical indicators is widely used in assessing the opinions of consumers, citizens, and experts to support planning and decision-making in landscape and rural policy. It is also consistent with the definition of morphotypes [
50,
51].
The third step involves eliciting weights and ranking based on expected ecosystem service provision for each of the six landscape morphotypes. The weights represent the relative importance of ES and can be utilised to aggregate the expected value of ES based on the hierarchical structure illustrated in
Figure 3.
The ranking method used in this study is based on the fuzzy weighted sum aggregation method, which is a commonly used approach in environmental impact evaluation [
52,
53]. Specifically, the value of ES provided by morphotype (
) for service (
) is expressed as
with consideration for the relative importance of each ecosystem service (i.e., weight) expressed as
. The total score of ES for the
i-th morphotype (
) is calculated as follows:
Equation (1) describes a scenario with no uncertainties, representing an ideal situation where all respondents have no disagreement. We apply fuzzy logic to the weighted sum to account for heterogeneity in subjectivity judgements. Fuzzy logic is a calculation method based on truth values, which is the opposite of Boolean logic. Following this approach, each expert judgement can be converted into a continuous variable between completely true and false statements. Using fuzzy logic, each value of the ecosystem service can be converted into a triangular fuzzy number by considering the level of agreement or disagreement among all 28 experts. Based on this logic, each appraisal can be expressed by three different values: the central value (), which represents a certain value and the lower and upper values () that represent the regions, where the statement remains true. Furthermore, represents the average value obtained from the surveys and by adding and subtracting the standard deviation of the central value (), we obtained the lower and upper values. The lower value is given by , while the upper value is given by .
Thus, by applying fuzzy logic, we can include a membership function that considers a progressive level of uncertainty applied to the estimation process [
27].
Following [
54,
55], the membership function
for the set of triangular numbers
is expressed as follows:
The membership function enables a probability distribution around the central value and between the lower and upper values. The triangular numbers for the low level of ES are aggregated at the upper level using the relative weights elicited previously. Given an arbitrary level of membership function (), for two generic landscape alternatives () and (), alternative dominates the alternative for generic ecosystem service () when .
Finally, we implemented a Student’s t-test to detect significant differences in the average value. Therefore, these significant values indicate a robust difference compared to the other morphotypes.
3. Results and Discussion
First, we present the contribution of each landscape to a low category of ES (see
Table 1), describing the evident trade-offs among diverse morphotypes and ES. We then focus on the synergies by presenting the landscape benefits using upper aggregations (refer to
Figure 1,
Figure 2 and
Figure 3).
Based on the proposed methodology,
Table 1 presents the central value of the landscape contribution to each ES (
). The values of ES range from zero to one, where a value close to one (or zero) indicates that experts consider the ES provided by the landscape to be very high (or low), respectively. The results presented in
Table 1 reveal a highly heterogeneous provision of ES across the regional morphotypes.
This heterogeneity is a reflection of the diverse and extensive types of the Tuscan rural landscape, which are influenced by both the physiographic characteristics of the territory, specifically the geomorphological ones, and the processes of territorial construction. These processes have been historically conditioned by factors such as the urban influence on the countryside, the expansion of sharecropping and the prevalence of small-scale peasant property in sharecropping estates. The results of this study confirm the high heterogeneity among provisioning services, including food, feed, and other services, which have been a focus of landscape actions and territorial transformation processes at the regional level for an extended period.
For the provisioning services, high values are observed among the morphotypes of central Tuscany (L3, L4), which are concentrated around the Arno basin, known as the ‘land of cities’ due to the diffusion of sharecropping. This sharecropping has historically shaped the landscape and created a functional relationship between the settlement system and the cultivated fabric, resulting in the persistence of historical rural infrastructure. The central morphotype L3 also significantly contributes to regulating services such as soil erosion, pollination, and natural hazard mitigation.
As anticipated, perceptions regarding the loss of provisioning services are more prevalent in marginal areas, reflecting a trade-off resulting from the abandonment of agricultural and breeding activities. For instance, traditional grazing landscapes are increasingly impacted by land abandonment, and in areas undergoing re-naturalisation, experts attribute higher values to regulation and cultural services.
Another type of trade-off is also relevant for four out of the six landscapes, which have a higher value for the provision of ornamental species, fibre and food; conversely, these landscapes exhibit a low contribution to provisioning services.
The landscapes L3 (mosaic of hilly vineyards and olive groves with arable land), L5 (enclosed agricultural areas) and L6 (arable crops with essential traditional landscape structures) significantly differ from the average value in terms of regulation services. L5 (enclosed agricultural areas) is the morphotype most affected by the phenomena of simplification of the agricultural network and settlement diffusion, scoring lower in the expert perception of all services. This morphotype presents the most altered landscape assets, characterised by medium–large or large agrarian networks resulting from agricultural restructuring and land reunification operations that dismantled historical rural infrastructure and are almost always associated with widespread urbanisation. Conversely, L6 (arable crops with a simple traditional structure) contributes more to air quality and water quality regulating services. This morphotype is associated with central–southern and southern Tuscany (Val di Cecina, Colline metallifere, Colline di Siena, Valdorcia, and Maremma), all areas with low population density and settlements. The hilly landscape is stripped of woody crops and the agricultural grid expands, softening itself on softened morphologies punctuated by isolated building episodes of an extremely rarefied settlement system.
Cultural and amenity services exhibit the highest degree of heterogeneity among the various landscape morphotypes. Consistent with expectations, Landscapes L1 (plant nursery), L2 (agroforestry landscape), and L5 (enclosed agricultural areas) exhibit lower performance due to a lack of historical-architectural elements. For instance, the Pescia plain is predominantly occupied by nursery crops, primarily grown in greenhouses, and features a widely dispersed settlement pattern.
Overall, the results demonstrate that L2 (association between arable crops and monoculture trees) and L5 (enclosed agricultural areas) exhibit higher heterogeneity across ES. These morphotypes show a variable level of ecological and landscape infrastructure depending on the context. Although the other landscapes show overall similarity in the provision of ES, the varying endowments in ecological infrastructure reveal differences in the provision of ES within the set of services provided (e.g., provision of food or provision of cultural heritage).
Our results are consistent with previous studies wherein alternative land use and rural area management were reported to impact the provision of ES, with trade-offs, synergies and disservices present in different landscapes [
13,
20]. Furthermore, our findings indicate that the proportion of natural areas versus non-cropland affects all services, while landscape connectivity and ecological infrastructure endowment impact the regulation and maintenance of services. These results are consistent with previous studies [
1]. In contrast, cultural services show an inverse correlation with Urbanised territories, areas subject to abandonment, or those with less typical aspects of vine and olive crops, which instead shape the morphotypes where cultural services show higher values.
In the following figures, we present the aggregation of ES. As explained in the methodology section, the aggregation was performed using the weights estimated during the survey.
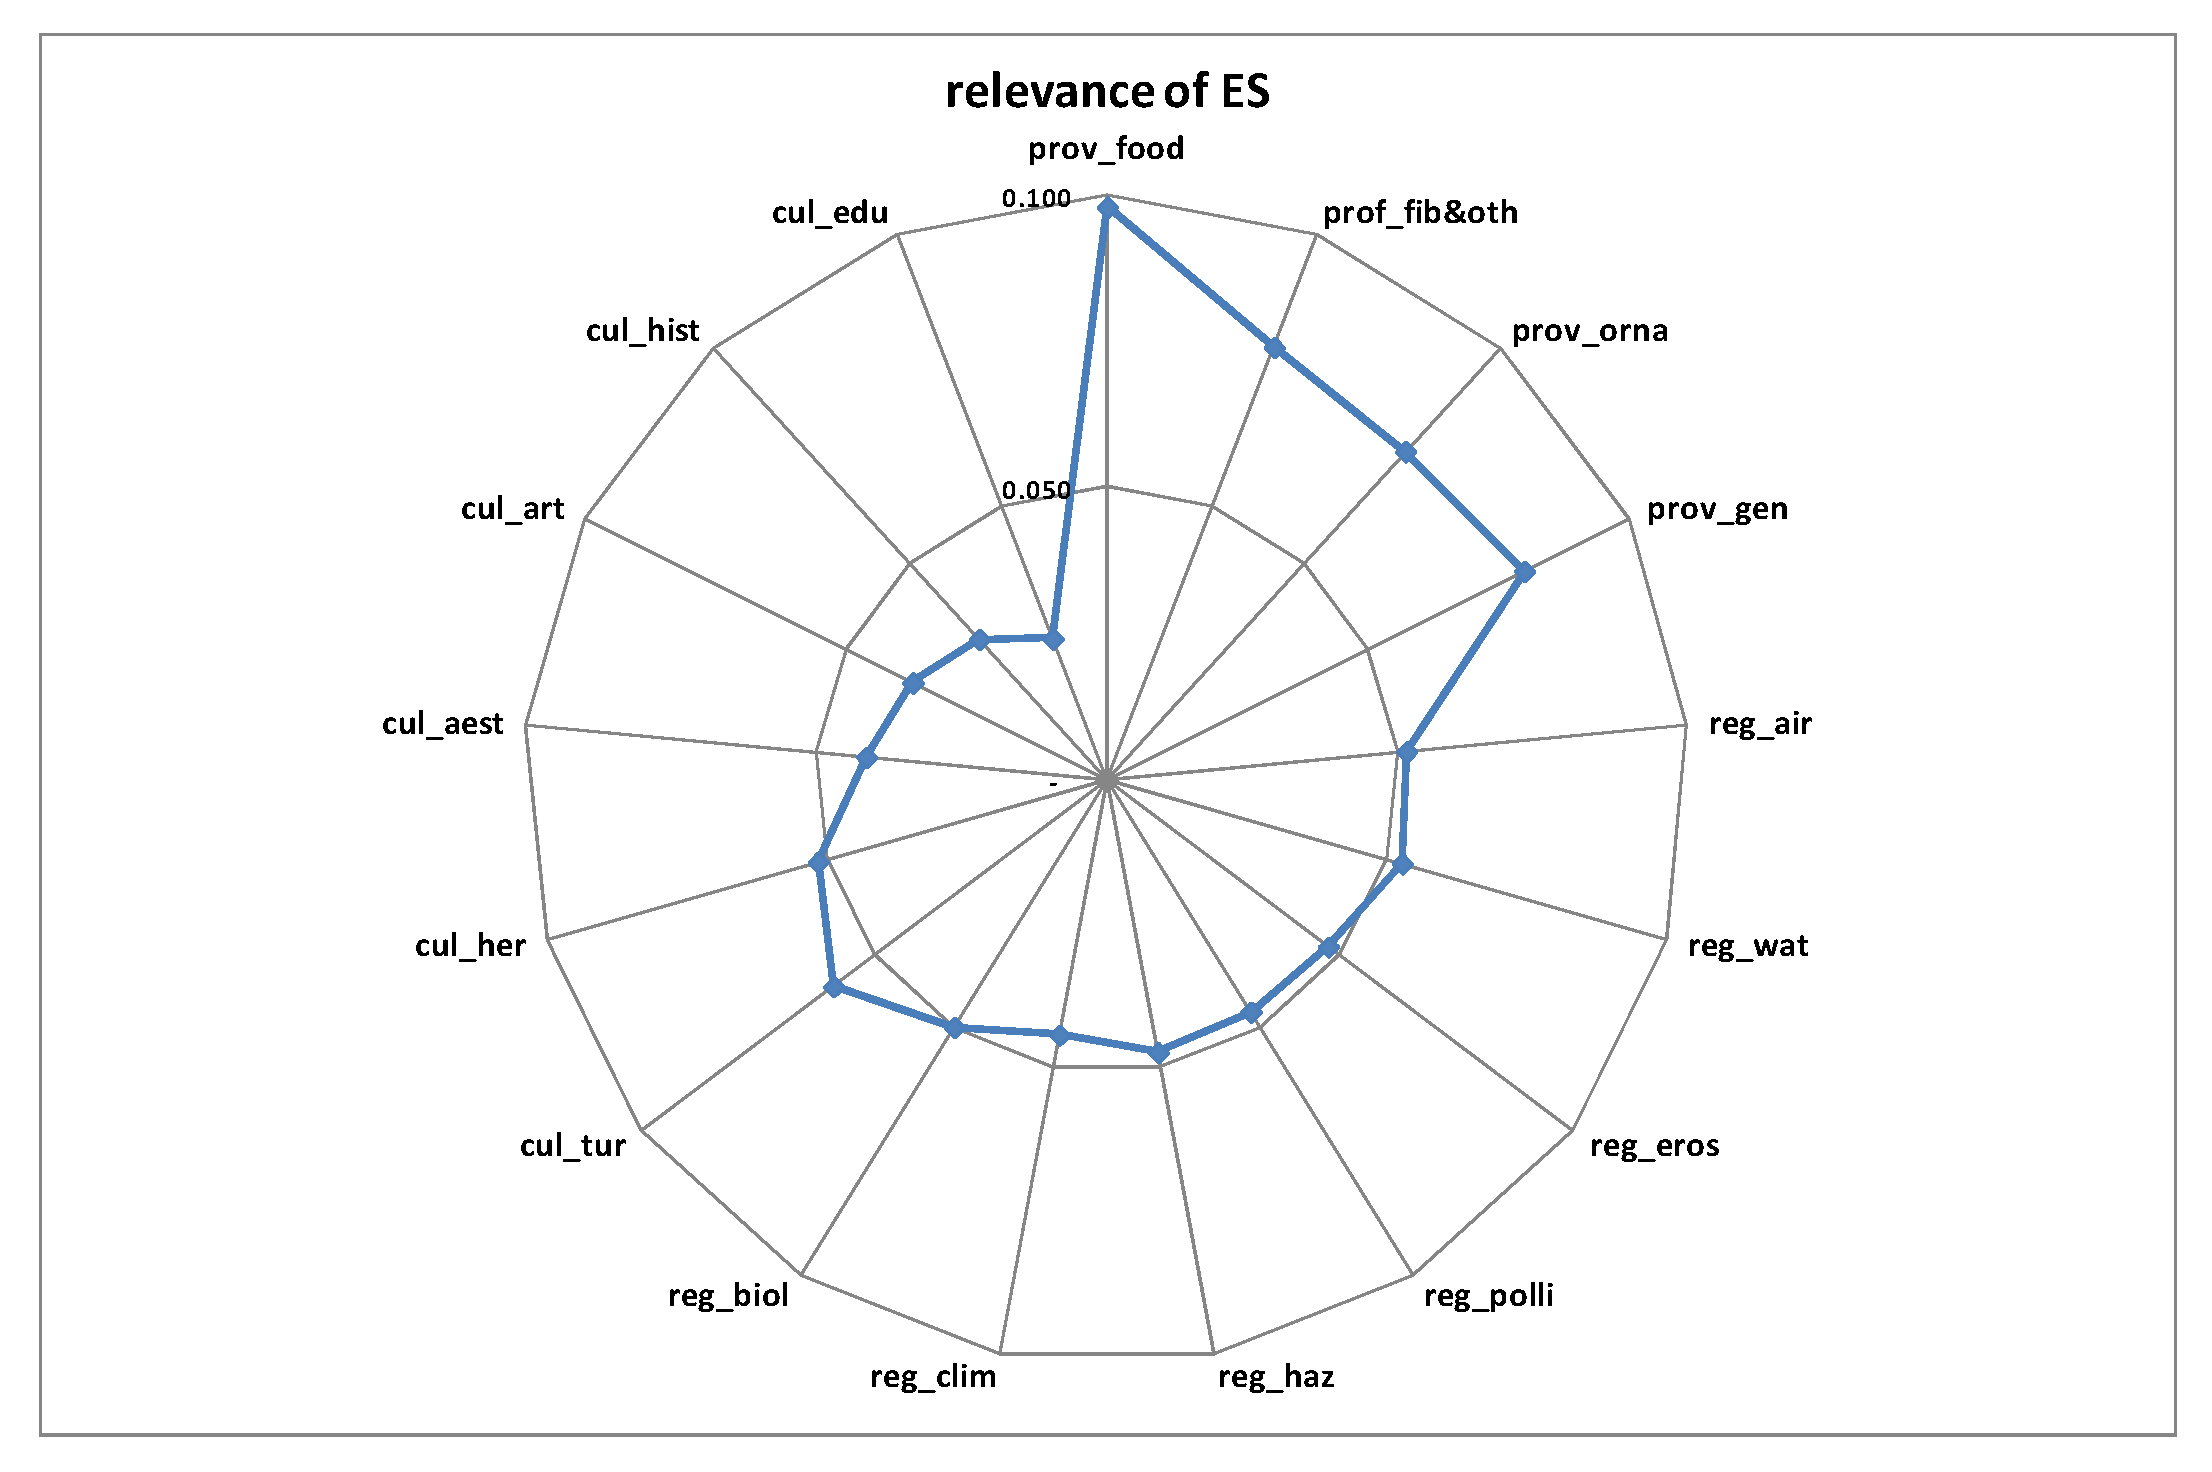
Figure 4 illustrates the appraisal of the relative importance (weights) of ES in the Tuscany region.
The relative importance of each ecosystem service was computed by considering the hierarchical structure of ES (refer to
Figure 3). The provision of food exhibited higher relative importance (0.1) than other ES within the same group, which showed similar and lower relevance (0.08). Among the regulating services, ES showed comparable relevance values (0.03 and 0.05). Respondents assigned greater relevance to regulate water quality and air quality. In the cultural and amenities ES group, recreation and tourism services were most important, followed by cultural and heritage identity.
The weighting structure reflects the importance of sharecropping in the landscape of Tuscany, where agricultural surface area is a function of food production and urban development depends on it. Sharecropping has contributed to the development of the most urbanised and populated areas in the region, which are predominantly hilly and devoted to the cultivation of vines, olive trees, and cereals. The union between sharecropping and the art cities of Florence, Siena, Arezzo, and others has made tourism one of the main economic activities in the region today. Expert judgement is in line with this key characteristic of the regional territory and the cultural services that can be derived from it.
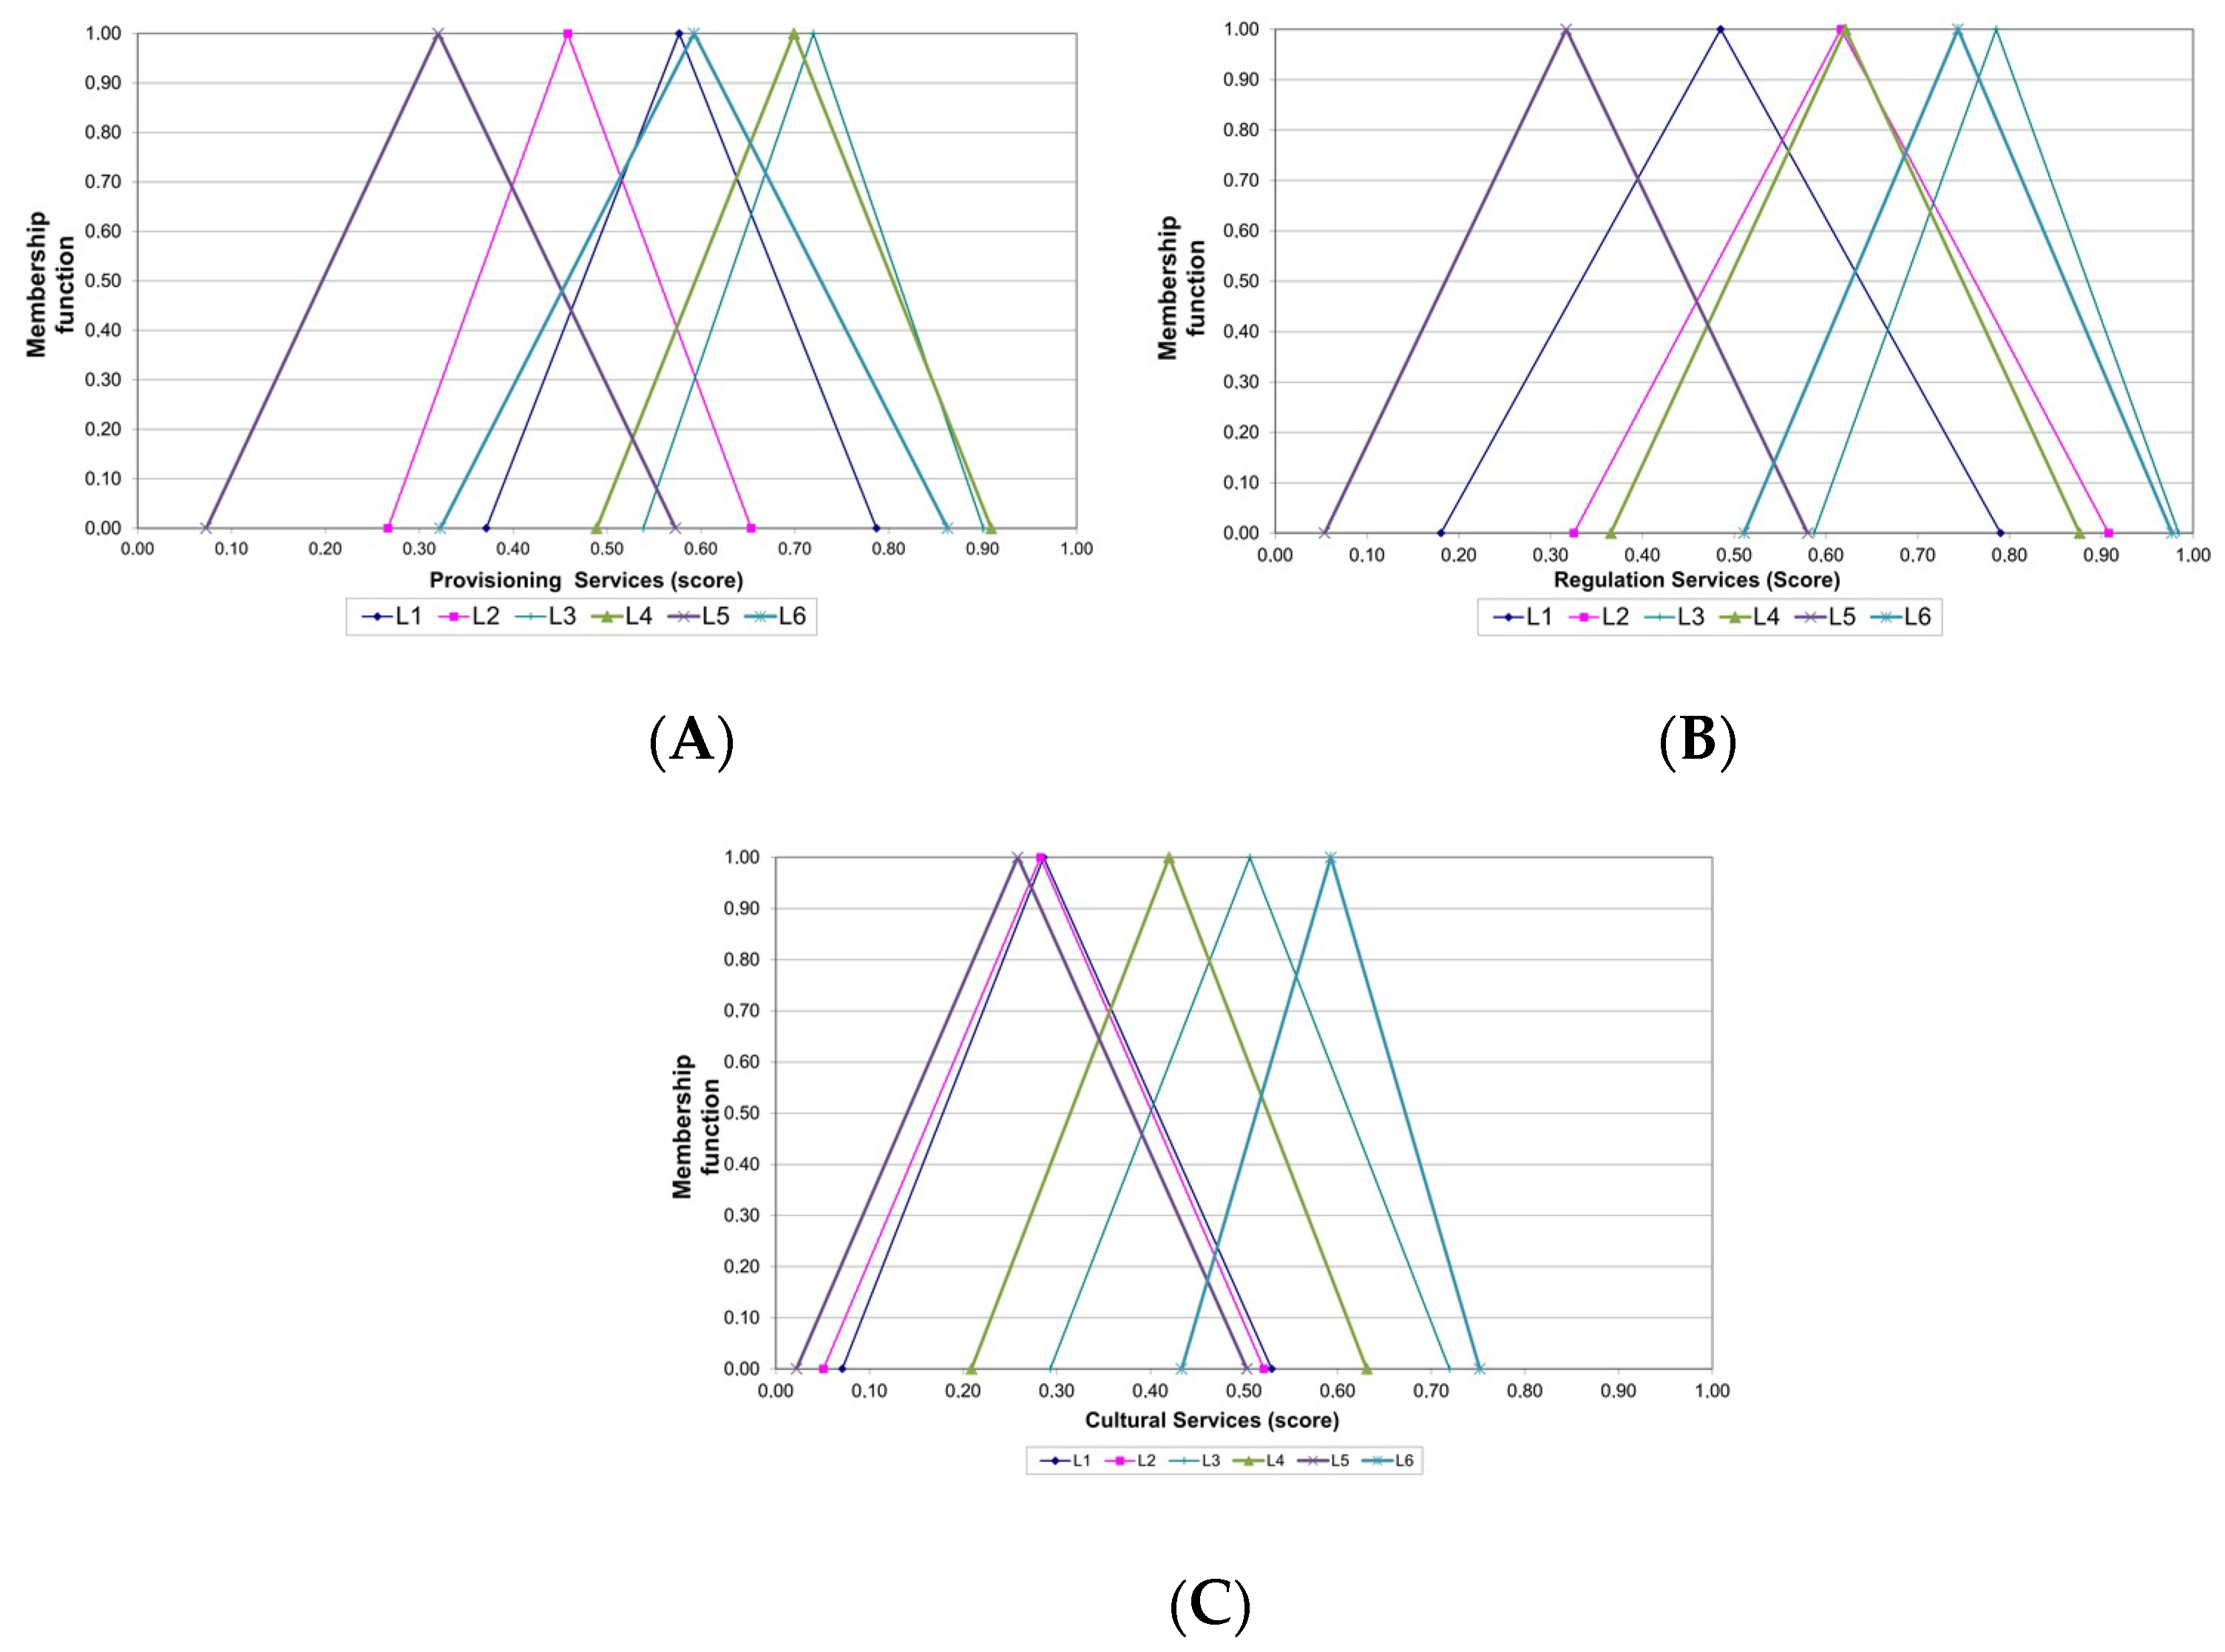
Figure 5 and
Figure 6 depict distinct aggregations of the benefits provided by the Tuscany landscape.
Figure 5 showcases the benefits categorised based on the upper level of service, including provisioning, regulation, cultural, and amenity services.
Figure 6 illustrates the aggregated benefits of all ES.
Figure 5 comprises three components that assess the contribution of each landscape to provisioning services (A), regulation services (B), and cultural and amenities services (C). Panel ‘A’, which uses an α-cut higher than 0.8, highlights a set of dominant landscapes, including the hilly mosaic and the prevalent vineyard and olive grove landscape (L3) and the arable crops of land reclamation (L4). With higher uncertainty (
), L6 (simple arable crops with traditional structure) and L1 (plant nursery) also provide similar benefits for provisioning services. Conversely, L2 (association between arable crops and monoculture trees) and L5 (peri-urban enclosed agricultural areas) show the opposite contribution. Therefore, even with high uncertainty, enclosed agricultural areas (L6) remain dominated by all other landscapes.
Panel ‘B’ enables the identification of the dominant landscape typology concerning regulation services. The landscape’s performance shows a similar pattern to previous figures, but the final ranking differs. The results highlight the dominance of L3 (association between arable crops and monoculture trees) and L6 (arable crops of simple traditional structure) when considering a relatively high level of uncertainty (. Furthermore, L5 (peri-urban enclosed agricultural areas) and L1 (plant nursery) yield a low score due to the absence of ecological infrastructure and intensive farming practices that may produce low regulation potential (i.e., low land cover over the years and low biodiversity).
Regarding the provision of cultural and amenity services (as shown in
Figure 5—panel C), our results demonstrate a more homogeneous assessment of different landscapes due to less uncertainty in the judgement. The predominant landscape types observed were hilly mosaics of vineyards and olive groves (L3), arable crops with simple traditional structures (L6), and arable crops on reclaimed land (L4), all of which scored highly in comparison to other landscape types. These three landscape types exhibited uniformity when evaluated.
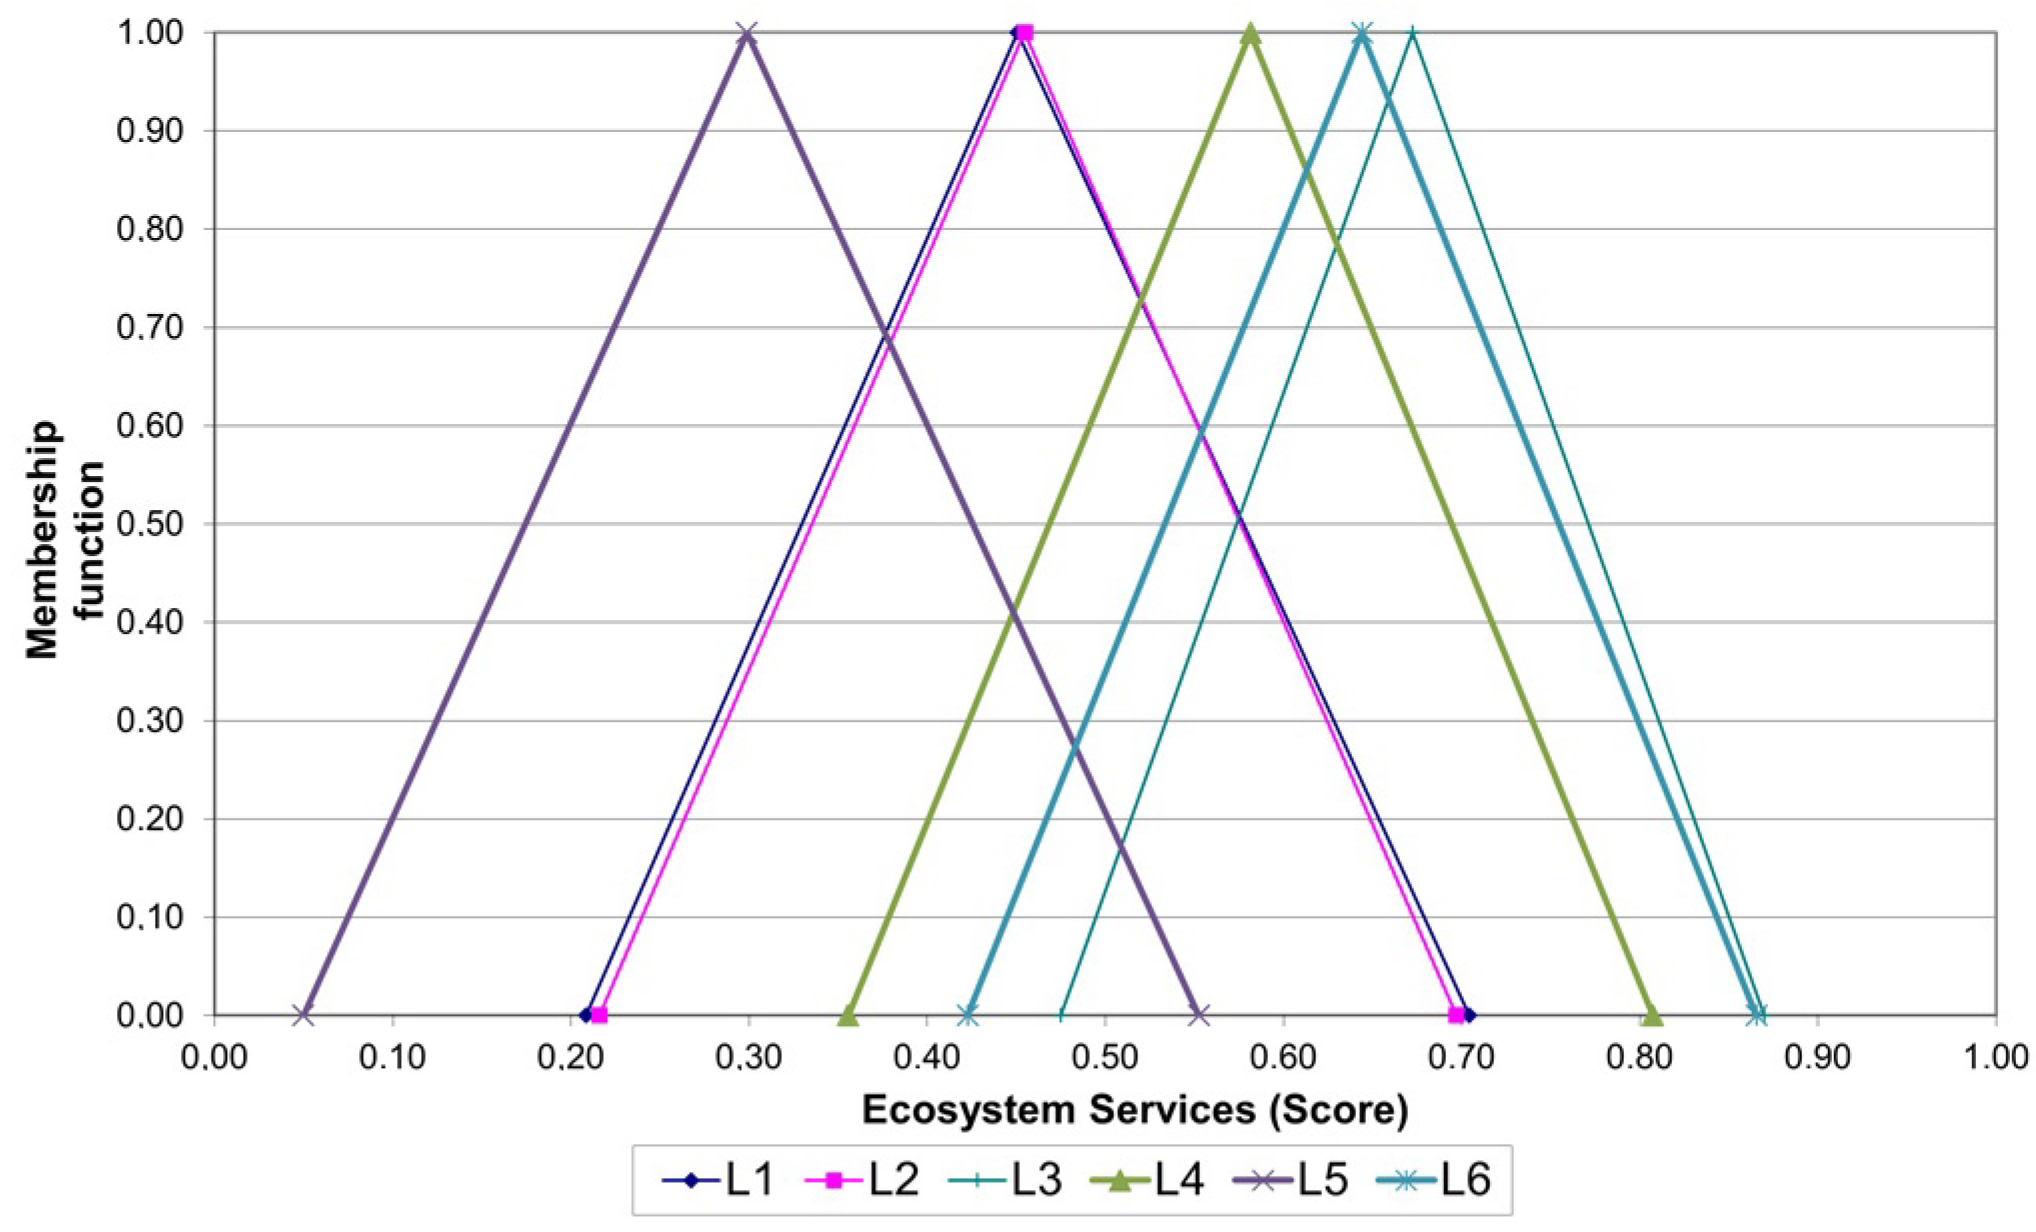
Figure 6 presents the aggregated ranking for the selected Tuscany landscape.
The Figure illustrates the benefits generated by selected landscapes grouped into three clusters. The group with the highest benefits consists of arable crops, the simple traditional structure landscape (L6), the arable crops of land reclamation landscape (L4), and the hilly mosaic of vineyards and olive groves prevalent landscape (L3), which provide similar benefits. The results indicate that landscapes composed of the association between arable crops and monocultures (L2) and plant nursery landscapes (L1) have comparable ecosystem service benefits and similar uncertainties. Despite having a relatively low value of
, the peri-urban enclosed agricultural area landscape (L5) exhibits poor performance and is completely dominated by other landscapes. The continuous anthropisation of the most productive areas and the abandonment of agricultural and grazing practices in the most challenging and remote regions emphasise the need for innovative landscape management that integrates the assessment of ES provided by these areas [
56].
4. Conclusions
This paper aims to support better-informed rural planning by providing advanced knowledge of the interplay between rural landscapes and ES. Despite the plethora of existing evaluation approaches, the literature highlights a gap in understanding the trade-offs, synergies, and disservices in the provision of these services by different landscapes, which hinders evidence-based landscape planning [
57]. Therefore, this study aims to fill this gap by applying an empirical analysis of ES provided by the rural landscape in Tuscany. Building on the taxonomy of regional rural landscapes used for the Regional Landscape Plan of Tuscany, known as rural morphotypes, we offer an alternative and non-monetary method for quantifying, visualising and valuing ES and their trade-offs and synergies. Our methodology applies a fuzzy multi-criteria analysis to the perceptions of 28 regional experts about the combination of six regional morphotypes of the rural landscape against 17 criteria for ES. Our analysis of the weights structure reveals the predominance of provisioning services such as food, tourism, and cultural services. The iconic landscape of Tuscan sharecropping and the typical elements of local history and culture emerge as important factors in the provision of these services. Furthermore, our analysis of the aggregation of the benefits of the Tuscan landscape confirms the centrality of traditional landscapes in the region for provisioning, regulating, cultural, and amenity services.
Thus, the use of regional morphotypes represents a novel approach in the analysis of ES and has demonstrated its potential in increasing consensus among various landscape stakeholders regarding structural, functional, management, service provision, and values. Our results confirm existing literature findings regarding trade-offs and synergies in providing ES by different agroecosystems [
19,
37]. Furthermore, our results highlight the importance of sub-categorical ecosystem equivalence, which enables balanced territorial management with an equilibrium among ES. The observed trade-offs and synergies emphasise the relevance of landscape transformation dynamics, which can be captured through the analysis of morphotypes. On the one hand, the dynamics of abandonment affect the supply of services related to food production; however, on the other hand, there are possibilities for recovery of regulation services, depending on accessibility and the potential for agricultural use. However, in some landscapes, the creation of large, specialised vineyards or those integrated into areas that also include arable land or olive groves act in the opposite direction, limiting the supply of regulation services in the face of an increase in provisioning. Widespread urbanisation also has a negative impact, as landscapes confined between different urban settlements generally obtain very low scores for all the services analysed. The assessment of ES provided by different management practices in rural areas is an increasingly relevant topic in academic debate, as the policy–science interface can support a new paradigm in rural planning [
58]. Evidence-based policy-making requires renewed policy–science dialogue to support more accurate planning and rural intervention with new knowledge [
30,
59].
The enhancement of ES provided by agriculture through rural area management is a policy priority for the upcoming Common Agricultural Policy 2023–27 [
24,
60]. Therefore, assessing ES and their connections with agricultural systems and ecological infrastructure endowments that differentiate landscapes is becoming increasingly important for policy evaluation purposes. This also aligns with the policy objective of providing information, promoting communication, and enhancing acceptance. Our study’s findings suggest that various landscapes significantly influence society’s perception of benefits and, can consequently serve as a basis for justifying policy interventions, specifically when these benefits are not internalised by the market.
The current form of direct payments under the first pillar of the EU Common Agricultural Policy fails to effectively link certain direct ecological services, resulting in limited benefits for conservation. However, significant potential exists to mobilise farmers in restoring ES and natural capital by more closely linking farming subsidies to societal benefits, such as rewarding ES, under the second pillar of the EU CAP. This would require adopting more integrative, cross-sectoral viewpoints and nature-based solutions as well as mechanisms for policy integration and integrated support across sectoral boundaries, such as landscape planning and rural development. These efforts would enable effective protection and restoration of natural capital in rural areas while ensuring that ESs in rural areas are adequately considered in decision-making.
This study employs multi-criteria analysis, a common method for evaluating policy impacts and widely used for alternative land use management valuation. However, a major limitation of this method is the high level of subjectivity in expert judgement, which may result in overestimation or underestimation of impacts. This is particularly relevant in assessing regulation services, where technical expertise is necessary to evaluate the contribution of the landscape to ES, and appraisal difficulties may arise. Moreover, the small sample size of experts in this study reflects the exploratory nature of the approach, and future analyses should consider different combinations of rural actors and expand the sample size.


