Article

Predicting Long-Term Effects of Alternative Management Practices in Conventional and Organic Agricultural Systems on Soil Carbon Stocks Using the DayCent Model

by
Caio Fernandes Zani
1,*,
Mohamed Abdalla
2,
Geoffrey Denis Abbott
1,
James Arnold Taylor
3,
Marcelo Valadares Galdos
4,5,
Julia Mary Cooper
1,6 and
Elisa Lopez-Capel
1
1
School of Natural and Environmental Sciences, Newcastle University, Newcastle upon Tyne NE1 7RU, UK
2
Institute of Biological and Environmental Sciences, School of Biological Sciences, University of Aberdeen, Aberdeen AB24 3UU, UK
3
INRAE, Institut Agro, Université de Montpellier, ITAP, Montpellier 34000, France
4
Institute for Climate and Atmospheric Science, School of Earth and Environment, University of Leeds, Leeds LS2 9JT, UK
5
Sustainable Soils and Crops, Rothamsted Research, Harpenden AL5 2JQ, UK
6
Organic Research Centre, Trent Lodge, Cirencester GL7 6JN, UK
*
Author to whom correspondence should be addressed.
Agronomy 2023, 13(4), 1093; https://doi.org/10.3390/agronomy13041093
Submission received: 28 February 2023 / Revised: 1 April 2023 / Accepted: 6 April 2023 / Published: 11 April 2023
(This article belongs to the Special Issue Advance in Grassland Productivity and Sustainability)

Abstract

:
Recently, many countries have introduced policies that promote sustainable agricultural practices, such as reducing synthetic nitrogen fertiliser and promoting diversified crop rotation. While such management changes might represent an opportunity for the agricultural sector to mitigate the impacts of climate change through carbon (C) sequestration in soils, there are still uncertainties due to the scarcity of reliable long-term data to prove this assumption. In this study, we applied the DayCent model using empirical data from a farm-scale study and an experimental trial study at Nafferton farm in the UK, to assess the long-term effects of contrasting agricultural systems (conventional vs. organic), grazing regimes (non-grazed vs. grazed), arable systems with ley phases, mineral vs. compost fertility sources and conventional vs. organic crop rotation on soil C stocks (0–0.20 m depth). The simulations showed that grazing and higher ley time proportions can increase soil C stocks for a period of at least 30 years, regardless of the agricultural system used (average increase in rates of 0.25 ± 0.02 Mg ha−1 yr−1). Compost fertiliser promoted soil C accumulation for the same period (average increase in rates of 0.3 Mg ha−1 yr−1), but its magnitude was dependent on the choice of crops in the rotation. However, ley time proportions higher than 40% of the full crop rotation did not improve soil C accumulation further. We conclude that the DayCent model can be used to identify the quantity of and the effective period for which management practices can be used to target mitigation efforts, but the balance between sustainability and productivity aspects warrants further research.

1. Introduction

Continuous changes in soil carbon (C) storage have contributed to the increased atmospheric concentration of greenhouse gases (GHGs), exacerbating global concerns about their impact on climate change [1]. According to the IPCC [2], the agricultural sector contributes 14% of total GHG emissions, including 56% of anthropogenic non-CO2 emissions. To design a sustainable agricultural sector and inform land use policy, it is therefore vital to identify mitigation strategies.
Soil C accumulation in agricultural soils has been posited as a strategy for mitigating climate change, particularly through the adoption of the so-called sustainable recommended management practices [3]. These include, but are not limited to, the adoption of the organic system and its associated practices, e.g., the return of plant and animal residues as organic fertilisers and the implementation of more diversified crop rotations with the inclusion of legumes and grass–clover ley periods [4], as well as the use of mixed (arable/livestock) farming systems and reduced tillage [5]. All these practices have been suggested as strategies to achieve efficient nutrient cycling and preserve natural resources and the environment [6]. However, the relative impacts of these systems and management practices on soil C stocks, i.e., the absolute quantity of C held within the soil, are still contentious, raising uncertainties regarding their sustainability [7]. Part of this uncertainty is due to the limited availability of reliable long-term field data.
Soil C stocks are closely linked to and dependent on farming practices, including, for instance, the length of a temporary grass–clover ley in a crop rotation (referred to in this study as ley time proportion) and whether the ley is used for hay meadow cutting (non-grazed) or livestock grazing [8]. Furthermore, it has been noted that different rotation strategies, conventional vs. organic, with the former characterised by cereal intensive crops and the latter based on a more diverse and legume-rich cycle, and fertilisation sources (mineral vs. compost), are likely to play a key role in soil C stocks and stabilisation [9]. Depending on the magnitude of nutrient cycling into and out of a given agricultural system and considering interactions with climate (temperature and rainfall) and different applied management practices, an agroecosystem can either be a sink or a source of C. Therefore, before wide-scale deployment of such practices is undertaken, it is important to understand the long-term soil C stock changes that are not only due to conventional and organic systems as a whole but also to the specific management practices implemented within these systems.
Previous empirical studies have shown that intensive crop production systems have led to soil C losses [10], while management practices that add high amounts of biomass to the soil with minimal soil disturbance have resulted in soil C gains [5,7,11]. However, changes in soil C stocks, particularly the accrual of C into the soil, can take decades to occur and are difficult to note by the empirical research of soil C dynamics, which only provides a single snapshot in time, unless carried out over many years. In this sense, long-term experiments are key, but although efforts have been made to maintain long-term experiments and measurement intensity, there are still discrepancies in findings regarding soil C stocks. This is particularly true for the comparison between conventional and organic systems, with empirical studies showing mixed results: some showed an increase [7,12,13,14], whereas others indicated no increase or even reductions in topsoil C stocks [15,16]. It is also important to highlight that soil C cycling is highly complex and dependent on interactions among many factors, including management practices, plant growth processes, soil water dynamics, climate, etc., which makes the interpretation of results from empirical studies challenging. In this sense, complementing empirical measurements with simulation models is a reliable, feasible and cost-effective alternative to appraisal of the long-term effects of agricultural systems and alternative management practices on soil C stocks.
Mechanistic models represent a powerful option for understanding the processes responsible for the production, consumption and transport of soil C over long time scales [17]. In general, mechanistic models that were developed to predict the quantities of C in soil consider similar regulating factors (i.e., among others: soil physics, decomposition, plant growth and soil organic matter (SOM) dynamics) but with varying levels of complexity and, in some cases, using different algorithms to represent such factors [18]. Such models can be used to predict soil C changes from current management practices to future alternative scenarios, including different agricultural systems and management practices in different soil types, crop rotations, nutrient sources, etc., [19]. In addition, mechanistic models for soil C can be applied at either local or regional scales, being used to extrapolate results from experimental plots across spatial and temporal scales, and to assess past and future C changes [20,21]. Ultimately, mechanistic models can help to address uncertainties regarding the long-term effects of the adoption of alternative management practices within conventional and organic systems on soil C stocks, thus contributing to policies and decision making on the long-term goal of achieving a sustainable agricultural system.
Among the mechanistic models, DailyCentury (DayCent) is an agroecosystem model designed to simulate C, N and other nutrients in the atmosphere, vegetation and soil interface [22,23]. The DayCent model includes sub-models for the representation of plant productivity, phenology, decomposition of dead plant material and SOM, soil water and temperature dynamics, and GHG fluxes. The model requires reasonable data inputs, including soil properties (i.e., soil texture, field capacity, wilting point, bulk density and pH), climate data (i.e., temperature and rainfall) and land use/management information (i.e., grazing intensity, fire, tillage, fertiliser inputs, irrigation and sowing and harvest dates). Its use has proven to be suitable for simulations at a range of temporal and spatial scales depending on its configuration. Although it was originally developed for grassland in the Great Plains region in North America [24], DayCent has been widely used across the world, including Brazil [25], China [26], Canada [27,28] and Europe [29,30,31,32,33], and across a range of ecosystems, including grasslands, cropland and forests. Nevertheless, when using a model for a region different from where it was originally developed, it is always important to take some precautions [34]. One of the main recommended procedures is to carry out a sensitivity analysis so that potential critical parameters that may cause a direct effect on the outcomes might be identified. The identification of such parameters can also help to reduce uncertainties in the model simulations by careful consideration of those parameters and ultimately deliver a better understanding of the model that will improve its future application.
This study was designed with the following aims: (i) to simulate soil C stocks in mixed (arable/livestock system) agricultural fields, which are distinguished by alternative management practices, including conventional vs. organic systems, non-grazed vs. grazed regimes, arable systems with ley phases, mineral vs. compost fertility sources and conventional vs. organic crop rotation using the DayCent model; (ii) to assess the reliability and the sensitivity of the DayCent model using empirical measurements from [8,9]; and (iii) to explore the long-term effects on soil C stocks of alternative management practices in the conventional and organic system.

2. Materials and Methods

2.1. Experimental Farm Site and Treatments

The data used in this study were obtained from a farm-scale study [8] and an experimental trial comparison [9]. The farm-scale study was conducted at Newcastle University’s Nafferton farm, a mixed (arable/livestock system) commercial farm located 12 miles west of Newcastle-upon-Tyne in Northeast England (54°59′09′′ N; 1°43′56′′ W, 60 m a.s.l), where the total farm area (~320 ha) was divided, in 2001, into 50% conventional system (CONV), operated to current UK conventional farming best practices [35], and 50% organic system (ORG), following certified organic production practices [36]. In turn, the experimental trial, namely Nafferton Factorial Systems Comparison (NFSC), is a long-term experimental field located at Nafferton farm, where the components of conventional and organic agricultural systems (e.g., crop rotation, fertility sources and crop protection) are studied in a split-plot factorial design. A full detailed description of the farm and the NFSC trial, including soil type and mineralogy, crop history, rates of fertilisation and crop protection, as well as other management details, has previously been published [6,8,9].
Briefly, for the farm-scale study, twelve commercial-sized representative agricultural fields (6 study fields under CONV system and 6 under ORG system) were sampled in February–March 2017, where alternative management practices, including grazing regimes (non-grazed-NG vs. grazed-GG) and different proportions (0 to 100%) of temporary grass–clover leys in arable rotations (referred to in this study as ley time proportion; LTP), were implemented within each agricultural system. Soil sampling strategy and preparation procedures can be found in [8]. A summary of treatments of each one of the twelve study fields is provided in Table S1.
For the NFSC trial, the effects of crop rotation (conventional rotation—CONV-RT and organic rotation—ORG-RT) and fertility sources (mineral—MINE and compost—COMP) were considered within the same crop protection treatment (conventional) and over one complete crop rotation cycle (8 years). Soil sampling strategy and preparation procedures can be found in Zani et al. [9].

2.2. The DayCent Model

The DayCent model [22,23] was built based on the biochemical ecosystem Century model [24]. As with the Century model, DayCent simulates C, nitrogen (N), phosphorus (P), and sulphur (S) cycles among the atmosphere, vegetation, and soil, but operating on a daily rather than a monthly timestep. The DayCent model also differs from Century in the processes regulating GHG emissions, particularly N gas fluxes, where processes such as nitrification and denitrification are explicitly represented. Due to the finer timescale resolution and because of its rapid response to abiotic factors, the DayCent model is generally considered more precise in its performance compared to the Century model.
The DayCent model can be used to evaluate the C dynamics of different ecosystems (e.g., grassland, agricultural crop, forest or savanna) in response to changes in climate as well as type and timing of management practices, such as tillage, fire, plant harvest (including variable residue removal), grazing intensity, cultivation, irrigation, and organic matter or fertiliser additions. Overall, simulations in DayCent are based on species-specific measured/estimated data for phenology, net primary production (NPP), shoot–root ratio and biomass C:N ratio of plant components. The model consists of different sub-models including SOM formation and decomposition, mineralisation of nutrients, soil water and temperature dynamics, plant production and allocation of NPP as well as N gas fluxes. Soil water and temperature are simulated for each horizon by the land surface sub-model. In the soil water sub-model, water content and fluxes, including runoff, leaching, evaporation and transpiration, are simulated as a function of water inputs through rainfall, irrigation or snowmelt, that can either lead to saturated or unsaturated water flows in the soil profile. Plant growth is estimated by DayCent according to species-specific data, soil/air temperature, soil water availability and actual plant-specific nutrient requirements and availability. Based on the plant type and phenology, NPP is partitioned into leaves, branches, large wood, fine roots and large root compartments. The shoot–root ratio of the NPP is calculated as a function of soil water content and nutrient availability, and dead plant materials are divided into structural (high C:N ratio) and metabolic (low C:N ratio) components. The DayCent model uses all these plant partitions and processes to determine the quantity and quality of plant residue added to the litter and soil pools, meaning that plant production sub-models are directly linked to the SOM sub-model. This interaction between plant production routines and soil modules leads to allocation, transferring and partitioning of the SOM into three conceptual pools with different turnover times controlled by specific decomposition rates ((1) active, fast turnover, (2) intermediate, medium turnover, (3) passive, slow turnover). In this sense, soil C, N and nutrient fluxes are controlled by the amounts in these conceptual pools as well as by the abiotic temperature and soil water factors and soil physical properties, e.g., soil texture. Soil C is simulated for the upper 0–0.20 m layer based on the sum of the dead plant matter and SOM pools while considering the mineralisation of the litter and the SOM. Litter and SOM mineralisation are controlled by several factors including substrate availability, substrate quality (lignin content, C:N ratio), water and temperature stress, soil texture and tillage intensity.
The main required input parameters for DayCent simulation are soil data (including soil texture, bulk density (BD) and pH), current and historical land use, and daily maximum and minimum temperature and precipitation. A full description of the DayCent model can be found in [22,23]. In this study, a previously parameterised and calibrated version of the DayCent model for UK conditions was used [30,37,38].

2.3. Model Set-Up, Initialisation, Simulation and Validation

The DayCent model was initialised using an average of the measured/estimated site-specific features viz. soil texture, BD, pH, field capacity (FC), wilting point (WP) and hydraulic conductivity (HC), between all the study fields in the farm-scale study [6,8] (sampled in 2017) and the treatments in the NFSC trial [9] (Table S2). Briefly, soil texture was determined by a low angle laser light scattering technique (Laser diffraction), BD was measured using the core method and a volumetric steel ring of 0.03 m inner diameter [39] and pH was measured in H2O (1:2.5 soil–solution). A full description of soil preparation, laboratory procedures and analyses are given in [6,8,9]. Estimations of FC, WP and HC were calculated from texture and organic matter using pedotransfer functions [40]. Long-term meteorological measurements including daily maximum and minimum average temperature and precipitation for the period between 1900 and 2020 were taken from the combination of three different weather stations. From 1900 to 2002, data were collected from the historical weather stations of Durham and Albemarle, ~30 and 4 km away from Nafferton farm, respectively (http://www.metoffice.gov.uk; accessed on 7 February 2023). On site weather measurements were used from 2003 to 2020, from a weather station located at Nafferton farm (Figure S1).
Since there were no historical data of the SOM pools for Nafferton farm, historical land uses were first run to establish a modern-day baseline [41,42]. The initial soil C stock (~60 Mg ha1) was set using previously published data for the arable system for the whole UK [43,44,45,46], distributing the total value into the three different SOM pools. This initialisation approach was performed following procedures described previously [47]. The modern-day baseline was simulated based on historical records of the UK, and whenever possible local records, by interviewing local experts and consulting published literature [48,49,50]. In this sense, the following approach was conducted: (i) “three-field rotation system” based on carbohydrates, protein and grazed fallow with no artificial fertiliser application; simulated rotation of wheat/peas/grazed fallow (years 1 to 1850); (ii) “Norfolk four-course rotation”, a four-field rotation system with also no artificial fertiliser application but including a fertility building phase, simulated rotation of wheat/barley/potatoes/grazed grass–clover (years 1851 to 1950); and (iii) “intensification and simplification”, a post-war period characterised by the use of agricultural systems with a more cash-crop-based system and replacing the fertility building phase and livestock by artificial fertiliser applications (50 kg N ha1 and maintaining minimum residues), simulated rotation of wheat/wheat/barley/potato (years 1951 to 1980). Due to a scarcity of site-specific data, this approach was assumed to be identical for all study sites up to 1980.
From 1981 onwards a slightly different approach was conducted for the farm-scale study and for the NFSC trial. For the farm-scale study, for the period between 1981 and 2007, we attempted to use more specific land uses of the Northumberland region [48], along with historical land cover maps of Nafferton farm available in the Digimap dataset [51,52]. In this case, the rotation system of each study field was either still focused on cash crop but also including a compulsory set-aside practice and oilseed rape as a break crop (simulated rotation of barley/set-aside grass–clover/wheat/oilseed rape/wheat) [48] or it was converted to permanent grassland. For the NFSC trial, the same approach was conducted but only for the period between 1981 and 2000. For both cases, nitrogen and phosphorus fertiliser application rates were based on historical data [53,54,55], while the cattle stocking rates were estimated based on census data for the UK available in Britain [56].
From 2008 to 2018 (for the farm-scale study) and from 2001 to 2018 (for the NFSC trial), simulations were scheduled according to the site-specific land uses and type and timing of management practices implemented, including the exact day and rates of fertiliser application, tillage operations, grazing or silage (non-grazed) events and application of organic amendments (manure, farmyard manure and/or slurry). For these periods, simulations were based on Nafferton farm records (published in [6,8,9]).
For all simulation periods, default parameterised values specified in the DayCent model along with a few previously parameterised and calibrated values for the UK conditions [30,37,38] were employed. Whenever necessary, crop production levels were further calibrated by adjusting the biomass production crop parameter (PRDX) following previously described procedures [42] to reflect national yield figures reported by Defra every year since the 1890s. Once adjusted, the PRDX crop parameter was left unchanged across all simulations, so that differences in the model outputs were only due to changes in the agricultural system and/or management practices [37,38]. Soil texture, BD, pH, FC, WP and HC were kept constant across all the study fields considered in the farm-scale study and treatments assessed in the NFSC trial (Table S2).
Soil C stock measurements in three different years (2011, 2017 and 2018), which were not used in the initialisation phase, were used for model validation. Soil C concentration was determined by dry combustion method [57] using an Elementary Vario Macro Cube analyser. Previous analysis of these samples [9] showed that there were low carbonates present; therefore, total soil C concentration can be assumed to be total soil organic C. Soil C stocks per unit of area (Mg ha1) were calculated on an equivalent soil mass basis [58]. Since measured and simulated soil C stocks were evaluated at different depth intervals (0–0.15 and 0.15–0.30 m in 2017 and 2018; 0–0.30 m in 2011; 0–0.20 m in the model output), the 0–0.20 m soil C stocks were calculated by an average of 75% of those accumulated at 0–0.30 m depth [33]. Subsequent checks were also performed to ensure that simulated yields were in line with measured data from other published studies [59,60].

2.4. Statistical Analyses

Model simulation performance for soil C stocks was undertaken following the statistical methods described in [61] by using the MODEVAL worksheet. This involved several statistical metrics including correlation coefficient (r), root mean square error (RMSE), mean difference (M), relative error (E) and lack of fit (LOFIT), shown below as Equations (1)–(5).
r = i = 1 n ( O i O ¯ )   ( P i P ¯ ) [ i = 1 n ( O i O ¯ ) 2 ] [ i = 1 n ( P i P ¯ ) 2 ]
R M S E = 100 O ¯ × i = 1 n ( O i P i ) 2 n
M = i = 1 n ( O i P i ) n
E = 100 O ¯ i = 1 n ( O i P i ) n
L O F I T = i = 1 n m i ( O i P i ) 2
where O ¯ , P ¯ , O i , P i , m i and n are the average of all measured values, the average of all simulated values, the measured value, the simulated value, the number of replicates of the measurement and the number of the measurements, respectively.
The R-value represents the correlation between measured and simulated values, and therefore it evaluates the overall performance of the model to capture potential variabilities; RMSE, M, E and LOFIT are tests of the coincidence or differences between measured and simulated values. The significance of these tests was evaluated as follows: r was tested using F-value at p = 0.05; RMSE and E were tested at 95% confidence limit (RMSE95% and E95%, respectively); M was evaluated using Student’s t-test (two-tailed, critical at 2.5%); LOFIT was evaluated by F critical at 5%. All these metrics were carried out between measured and simulated soil C stocks separately for the farm-scale study (sampled in 2017) and the NFSC trial (sampled in 2011 and 2018).

2.5. Sensitivity Analysis

A systematic model sensitivity analysis was conducted for a total of five input parameters: two climatic (daily air temperature and precipitation) and three soil properties (soil clay content, BD and pH). Sensitivity analysis was performed to identify which model input parameter(s) might exert the most influence on the model results. In this study, it also helped to capture how sensitive the model was to variations in environmental covariates and soil characteristics as well as to identify potential critical parameters that might need special attention and/or site-specific calibration for effective simulation of soil C stocks [34]. Since in our simulations an overall average of soil clay content, BD and pH were used for all cases (see Section 2.3 for more details), the sensitivity analysis also helped to identify potential variability in our predictions, i.e., detect what could be the range in soil C stocks as a result of potential variations in these input parameters. All the target input parameters were tested by changing one at a time while the other parameters were kept with their original values. Daily air temperature and pH were checked by changing the target input parameter by a factor of ±1, i.e., ±1 °C and ±1 pH unit, respectively, whereas daily precipitation, soil clay content and BD were examined by changing the target input parameter by a factor ±10%. Sensitivity analysis results were presented as a percentage change in soil C stocks compared to the original base simulation over the last simulation period, i.e., from 2008 to 2018.

2.6. Long-Term Scenarios

Validated simulations from all the farm-scale study fields and treatments assessed in the NFSC trial were extended beyond the 2017/18 measurement date up to 2050. This approach was conducted to allow enough time for each study field situation and the treatments in the NFSC trial to show potential differences in soil C stocks that were not captured by the empirical measurements in 2017/18 (i.e., the year of measurements).
Furthermore, 11 additional scenarios were simulated for each agricultural system (CONV and ORG), totalling 22 long-term hypothetical scenarios (Table 1).
For all long-term hypothetical scenarios, the average of soil texture, BD, pH, FC, WP and HC across the whole farm was used (40, 43 and 17% for sand, silt and clay respectively and 1.15 Mg m3 BD, 6.3 pH; Table S2). Furthermore, the historical (1900–2020) average of meteorological data condition was considered, assuming no climate change or variation in atmospheric CO2 concentrations. The initial soil C stock for the hypothetical long-term scenarios was set based on the average of the actual empirical measured (2017) stocks (0–0.20 m) across each agricultural system; 51.01 and 48.81 Mg ha1 for the conventional and organic system, respectively. Although this approach might represent a simplified simulation exercise, it is important to highlight that it does not intend to disregard important interactions between soil properties and quality aspects, climate and the dynamics of different agricultural systems. While the long-term simulations focused mainly on capturing the effects of the implementation of alternative management practices on different agricultural systems, it is expected that together with the sensitivity analysis (see Section 2.5 for more details), the results can also provide a perception of how likely those parameters are to influence soil C stocks in the long-term.

3. Results

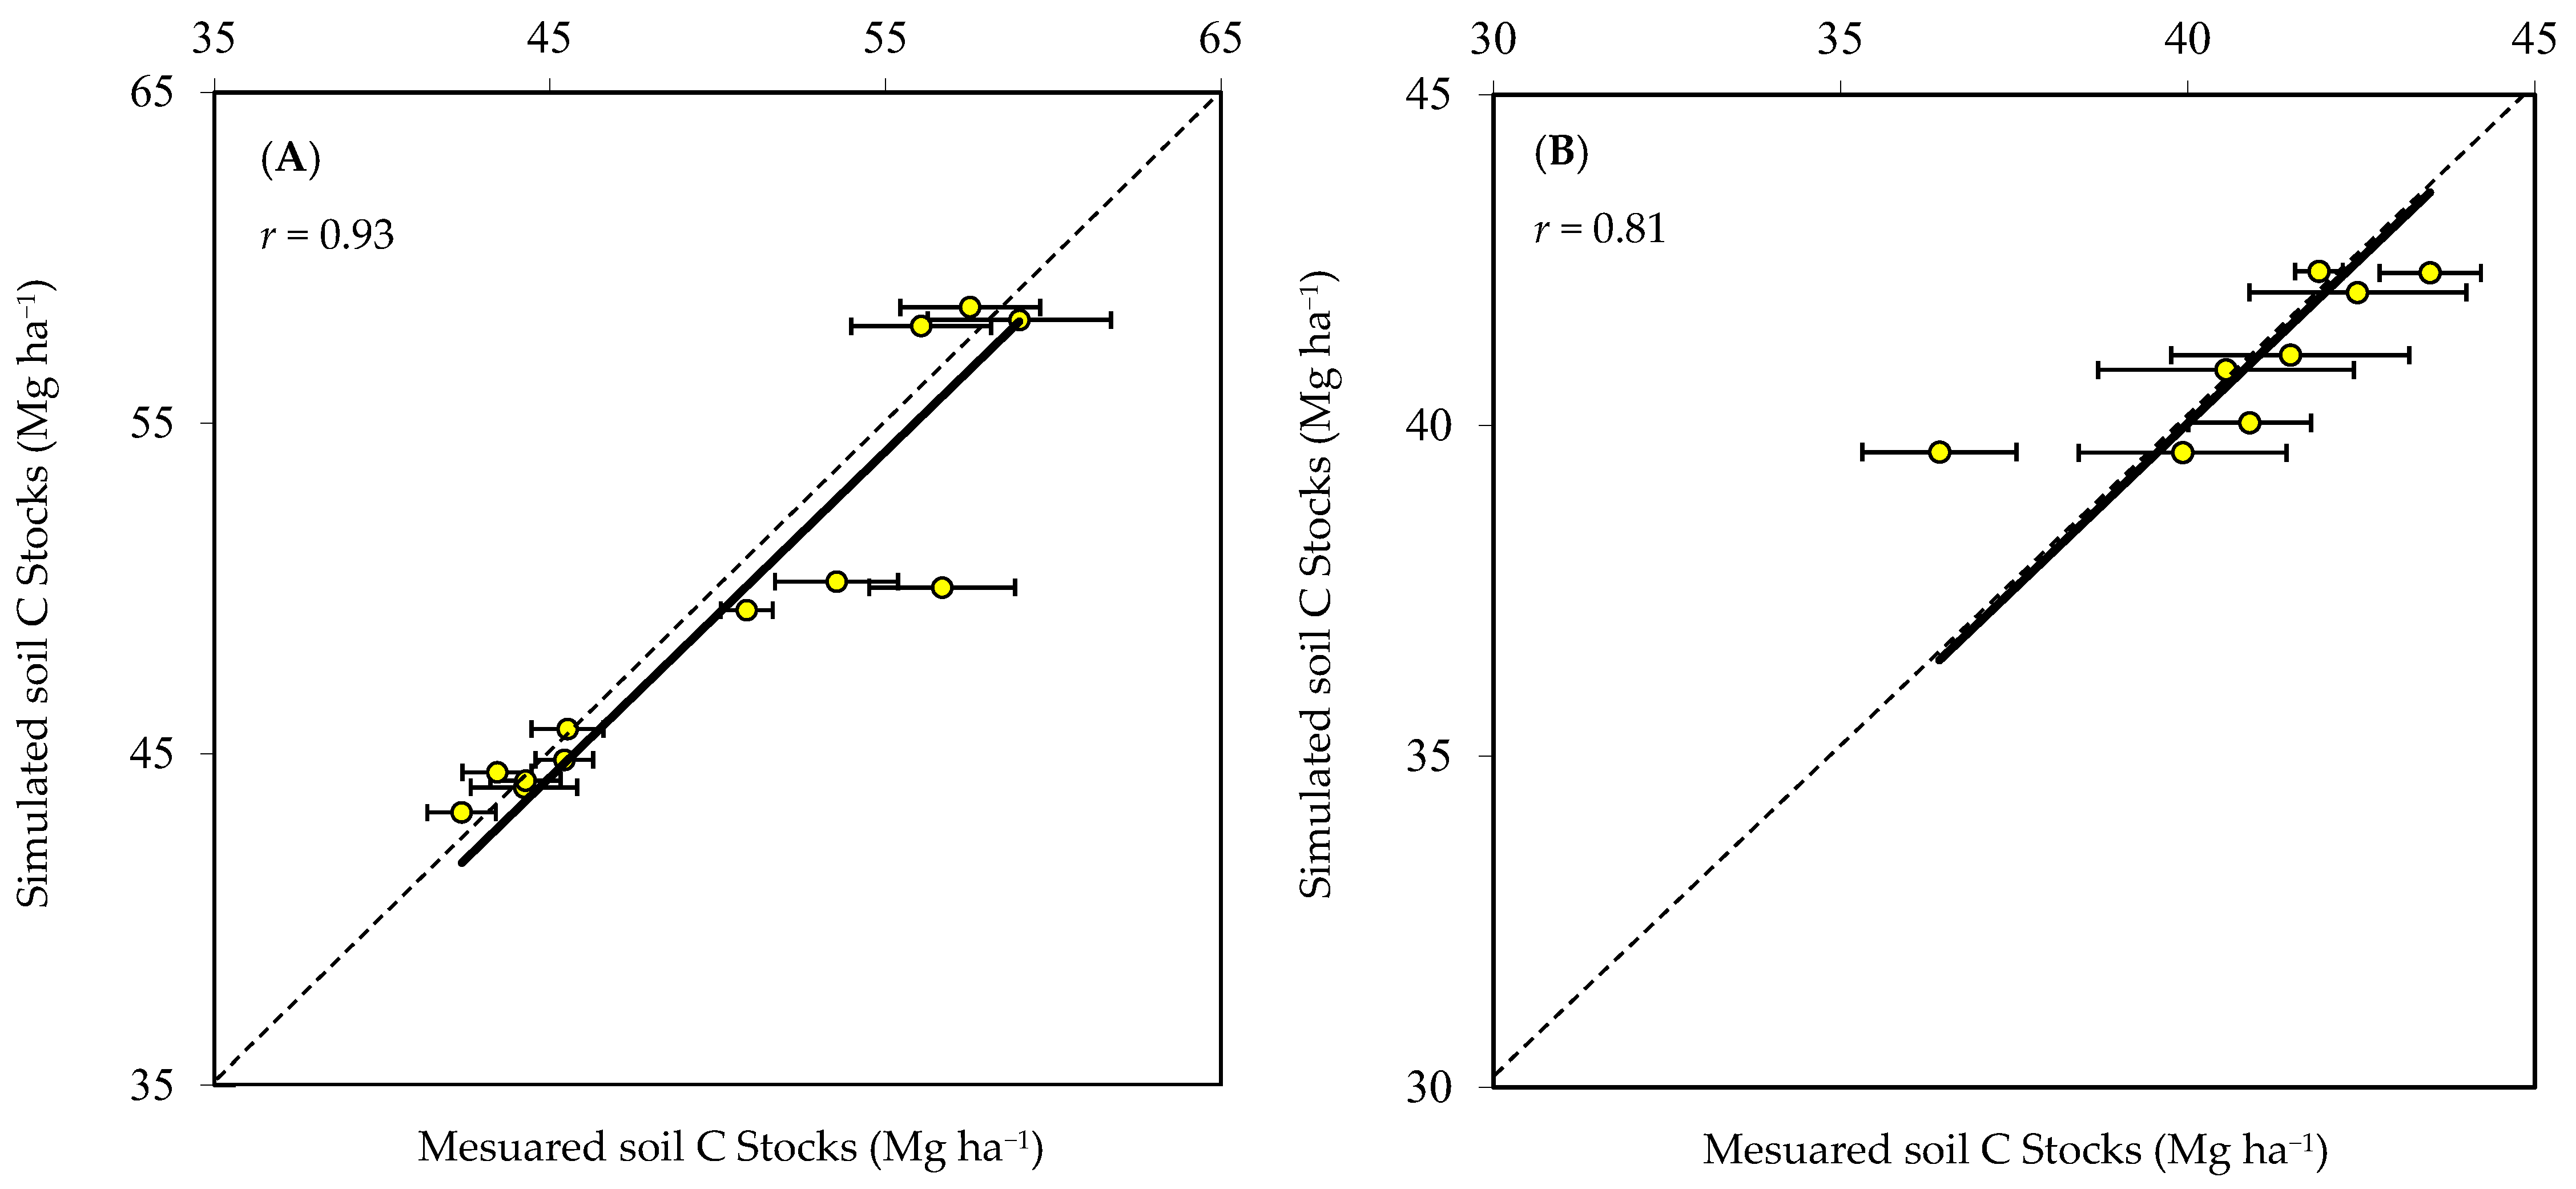
3.1. DayCent Performance and Sensitivity in Simulating Soil C Stocks

DayCent simulations showed a good fit between measured and simulated values of soil C stocks (0–0.20 m depth) for both the farm-scale study and the NFSC trial (Table 2 and Figure 1). In the farm-scale study, the measured soil C stock differences between agricultural systems (conventional—CONV vs. organic—ORG) and grazing regimes (non-grazed—NG vs. grazed—GG) were also observed in the model simulations. Both the measured and simulated soil C stocks of the CONV system and GG regime were higher compared to the ORG system and NG regime. Nevertheless, the model slightly underestimated the soil C stocks in the ORG system and the GG regime by 3.13 ± 1.32 and 3.50 ± 1.11%, respectively. Conversely, the model marginally overestimated the simulated values of the CONV system and NG regimes by 0.46 ± 1.59 and 1.13 ± 0.39%, respectively (Table 2). The model simulations also reflected the measured soil C stocks in terms of different proportions of temporary grass–clover leys in crop rotations (LTP). An increased LTP positively increased soil C stocks regardless of whether the system was conventionally or organically managed (Figure S2).
In the NFSC trial, the differences between measured and simulated values were even lower compared to the farm-scale (less than 2%) (Table 2). Nonetheless, not all the differences observed in the measured soil C stocks between the treatments were reflected in the simulated values. The exception was for the fertility source treatment, which showed higher measured values for the MINE compared to the COMP (41.19 ± 0.69 and 40.59 ± 0.85 Mg ha1, respectively), but an opposite trend for the simulated values (40.67 ± 0.54 and 41.26 ± 0.66 Mg ha1, respectively). For the crop rotation and year of sampling, both measured and simulated soil C stocks of the ORG-RT and 2018 samples were higher than the CONV-RT and 2011 samples (Table 3).
Overall, despite the few differences between the measured and simulated values, the statistical metrics indicated that the DayCent model simulated soil C stock changes under alternative management practices and agricultural systems with good accuracy (Table 3). For both cases (farm-scale study and NFSC trial), the model showed good association (indicated by a significant correlation coefficient, i.e., F-value calculated from the r greater than the critical F-value at p = 0.05), RMSE within the 95% confidence limit (i.e., non-significant differences between measured and simulated values), lack of significant bias in the simulated values (represented by the values of M and E), and a good fit and degree of coincidence (indicated by the non-significant error of LOFIT values; that is, the model error is not greater than the error in the measurements) between the measured and simulate soil C stocks (Table 3).
Model simulations of soil C stocks showed an overall low sensitivity to the five input parameters tested over the 10-year time span (Table 4). In general, the model showed the same pattern of sensitivity for the same parameters both for the farm-scale study and the NFSC trial. Among the five parameters tested, simulations of soil C stocks showed a sensitivity >1% for changes in daily precipitation, pH and clay contents, whereas sensitivity was <1% for changes in daily air temperature and BD. A change in pH by −1 unit, clay content by +10% and daily precipitation by −10% resulted in an increase in simulated soil C stocks on average by 7, 3 and 2%, respectively. On the other hand, changing pH by +1 unit, clay content by −10% and daily precipitation by +10%, negatively affected soil C stocks by 2% on average for all cases relative to its original base simulation. Changes in daily air temperature of ±1 °C and soil BD ± 10% showed a negligible effect on the simulated soil C stocks for all the treatments, the changes averaged 0.3, −0.2, −0.1 and 0.3%, respectively (Table 4).

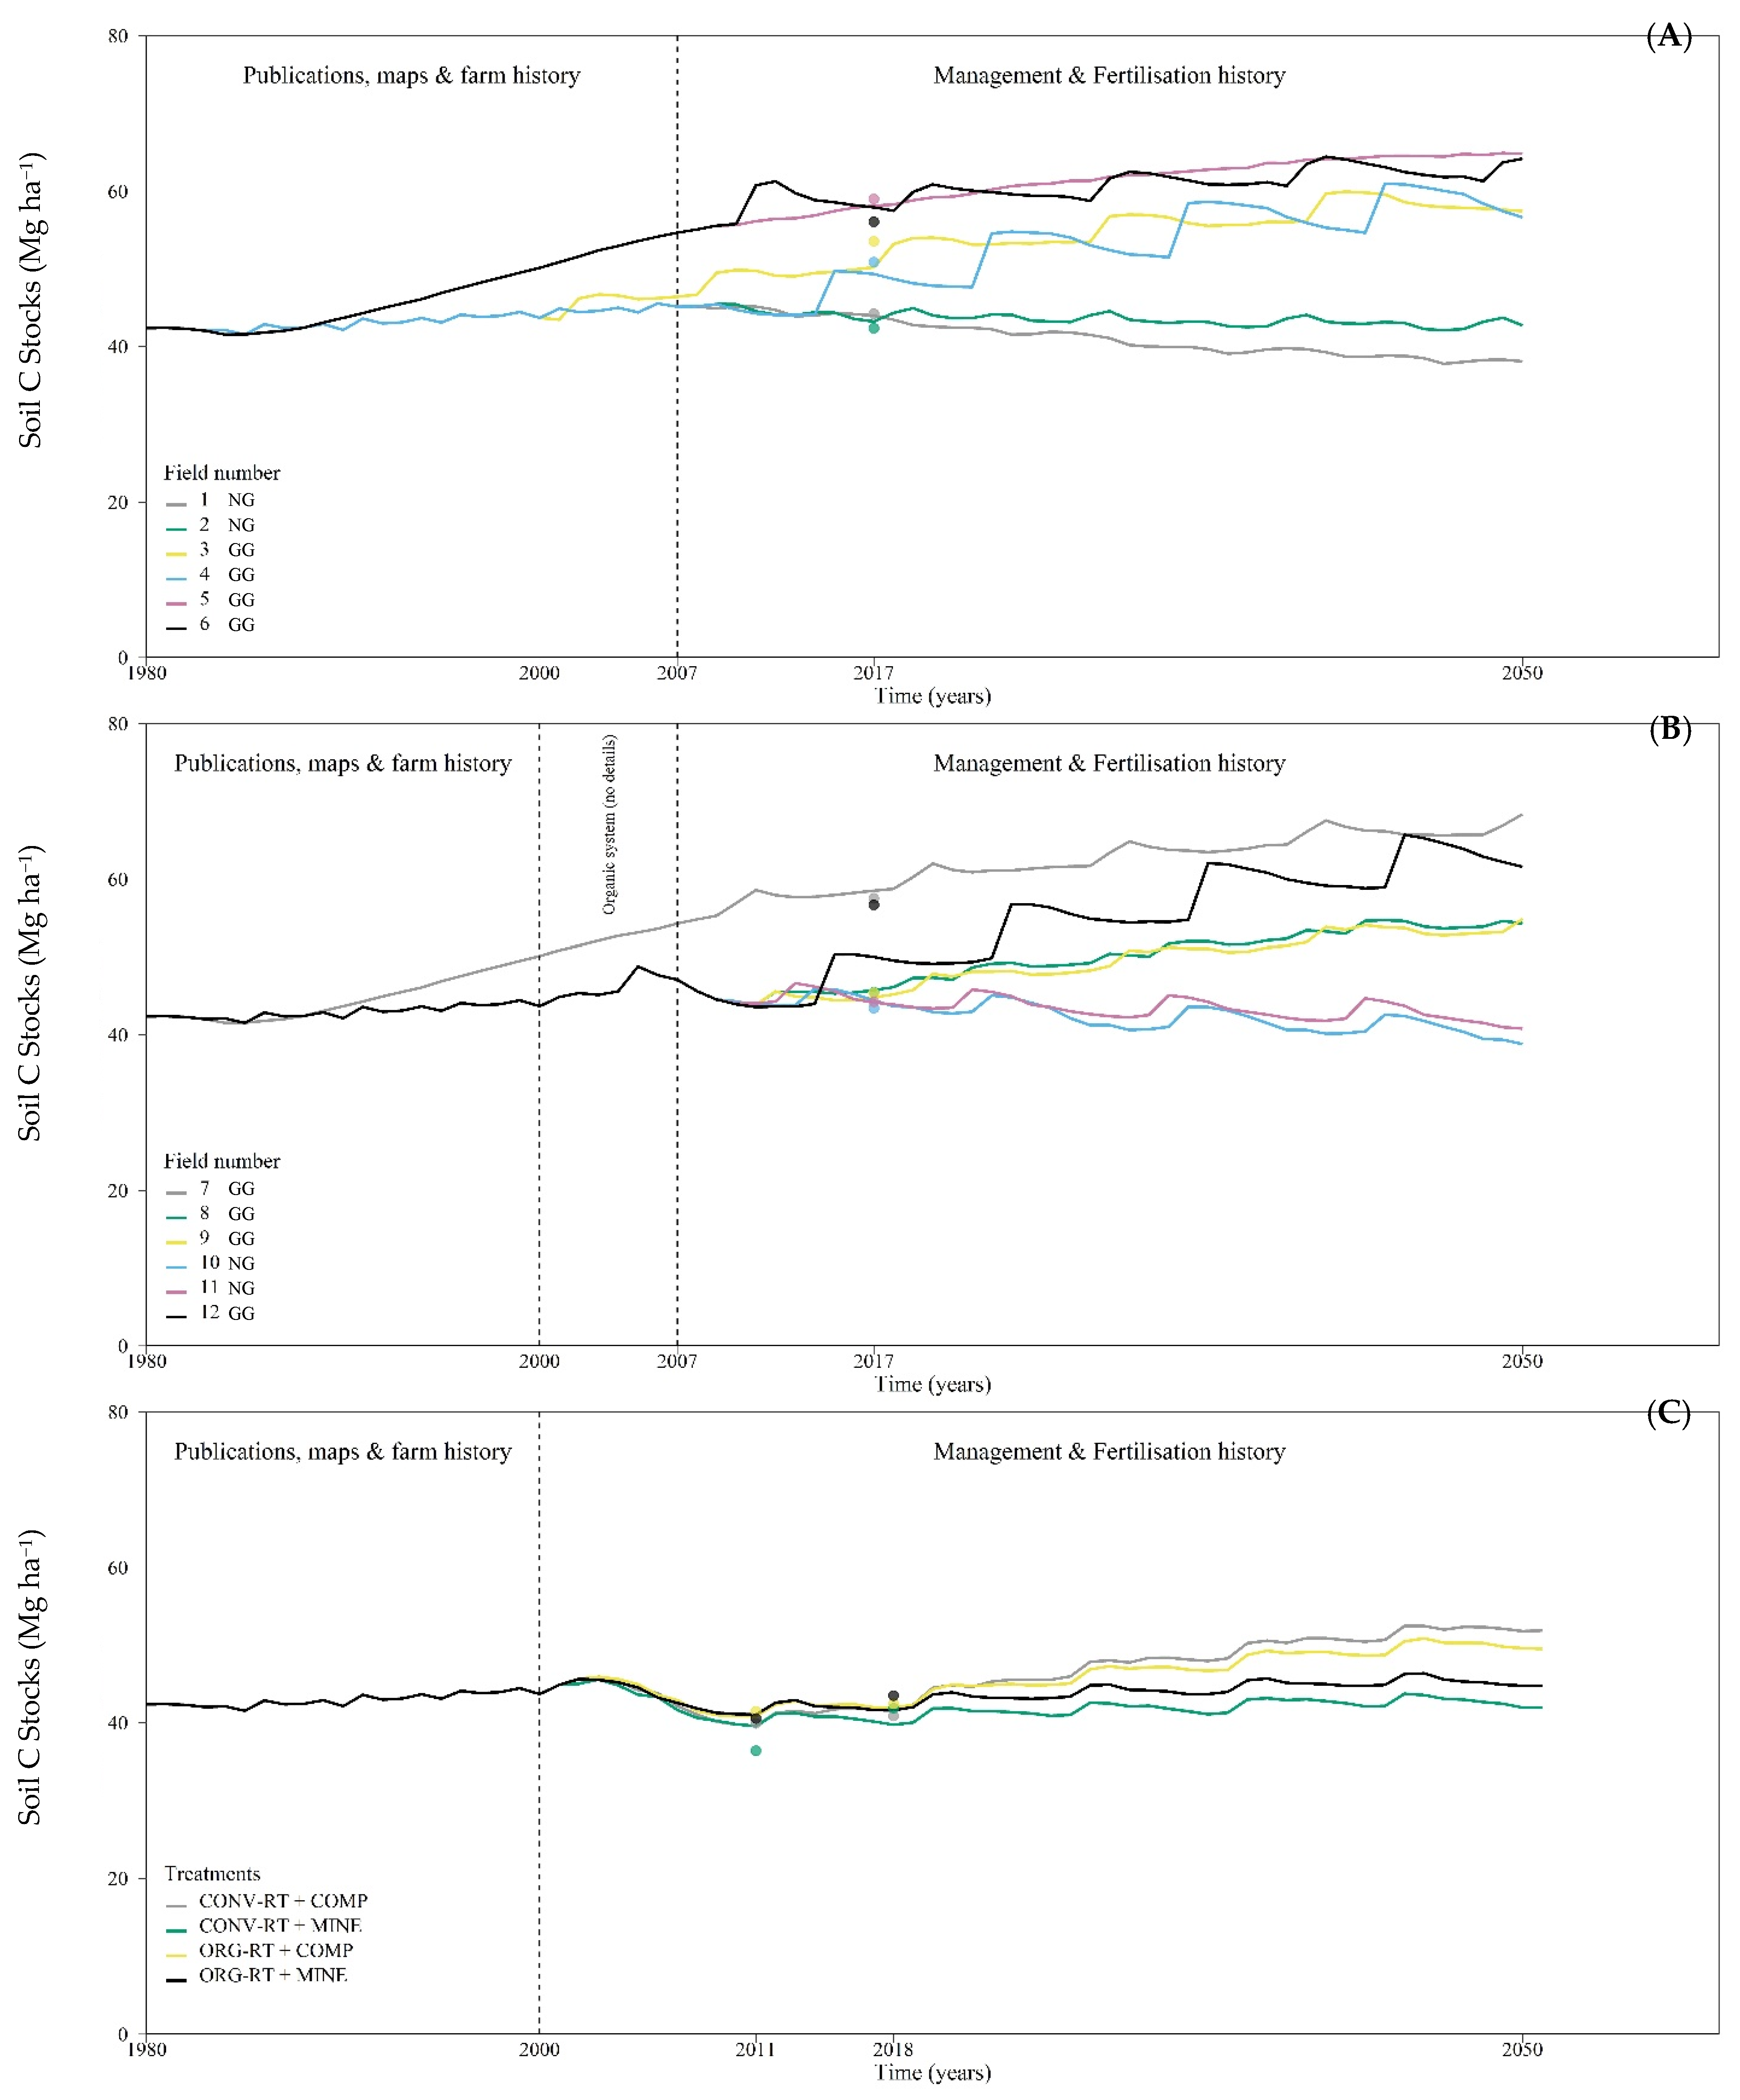
3.2. Soil C Stock Changes from the Historical Period up to the Measurement Date

Model simulations, considering the initial soil C stock of ~60 Mg ha1, indicated that the use of the “three-field rotation system” for a 50-year period led to soil C loss at a rate of 0.30 Mg ha1 yr1 (Figure S3). Subsequently, the model estimated that the use of “Norfolk four-course rotation” for a 100-year period (from 1850 to 1950) kept soil C stocks relatively stable with a partial recovery rate of 0.01 Mg ha1 yr1. The third period (referred to as “intensification and simplification”), simulated from 1951 to 1980, led to soil C stock losses at a rate of 0.05 Mg ha1 yr1. Overall, the model predicted that the soil C stock after the 180-year period of modelled historical land use would be approximately 72% of the initial 60 Mg ha1 (Figure S3).
Between 1981 and 2000, both sides of the farm (conventional and organic) were simulated without site-specific details (Figure 2A,B). However, the few resources available, including publications, maps and land use history from the farm archives, indicated that the study fields were divided into two distinctive land use groups: a cash-crop-based system and another in permanent grassland. Study fields under the cash-crop-based system resulted in soil C stock gains of only 0.06 Mg ha1 yr1, whereas study fields converted to a permanent grassland increased soil C stocks at a rate of 0.31 Mg ha1 yr1.
Simulations for the farm-scale study fields from 2001 (year of agricultural management change across half of the farm area) to 2017 (year of the measurements) showed a similar overall trend under conventional and organic study fields. In general, study fields under the GG regime and a higher LTP (≥40%, e.g., study fields 3, 4, 5, 6, 7, 8, 9 and 12) increased soil C stocks at an average of 0.35 ± 0.04 and 0.25 ± 0.10 Mg ha1 yr1 in the CONV and ORG system, respectively (Figure 2A,B). The opposite response was observed when the study fields were under an NG regime with a lower LTP (<40%, e.g., study fields 1, 2, 10 and 11), with soil C stock losses of 0.08 ± 0.02 and 0.03 ± 0.01 Mg ha1 yr1 in the CONV and ORG system, respectively (Figure 2A,B). The variations observed in the measured soil C stocks between the study fields within each agricultural system were also reflected in the model simulations (Figure 2A,B). For the same period (i.e., 2001–2017), and taking into consideration the agricultural systems only (CONV vs. ORG), soil C stocks in the conventionally managed soils were enhanced at a rate of 0.21 ± 0.10 Mg ha1 yr1, while the organically managed soils showed gains of 0.17 ± 0.08 Mg ha1 yr1.
In the NFSC trial, simulations from 2001 (year of the establishment of the experiment) to 2011 and 2018 (years of measurements) confirmed the variations observed in the measured soil C stocks for the treatments (Figure 2C). From the establishment of the experiment (2001) to the last measurement date (2018), simulations predicted soil C stock losses of ~0.20 ± 0.03 Mg ha1 yr1 for all assessed treatments. However, it was observed that from 2011 to 2018, i.e., the second cycle of the rotation, there was a consistent increase in soil C stocks in all treatments. This increase was observed to be modest when MINE fertility sources were applied in either CONV-RT or ORG-RT; soil C gains of 0.02 and 0.07 Mg ha1 yr1, respectively, whereas the COMP fertiliser application led to soil C stock gains of 0.25 and 0.15 Mg ha1 yr1 under CONV-RT and ORG-RT, respectively (Figure 2C).
The 33-year projection from 2017 to 2050 for each study field in the farm-scale study confirmed the differences observed in the year of the measurement (Figure 2). The long-term projections showed that regardless of the agricultural system, study fields under the GG regime and with higher LTP continued to increase soil C stocks for another 33 years before they attenuated towards a new equilibrium state (study fields 3, 4, 5, 6, 7, 8, 9 and 12; average of 0.25 ± 0.02 Mg ha1 yr1). Although differences in soil C stocks were still evident between the study fields in the farm-scale and treatments in the NFSC trial in 2050, the rate of increase suggested that it was minimal between study fields with LTP ≥ 40% (average rates of increase of 0.23 ± 0.01 and 0.28 ± 0.02 Mg ha1 yr1 in the CONV and ORG system, respectively) (Figure 2A,B). For the same period, the NG regime and lower LTP (<40%) fields continued to decrease soil C stocks by an average of 0.11 ± 0.03 Mg ha1 yr1 regardless of whether the system was conventionally or organically managed. The use of NG regime and lower LTP also appeared to rapidly reach a near-equilibrium state, but at a slower pace in study fields with a minimum of 10% of LTP.
Extending simulations for an additional 32 years (from 2018 to 2050) in the NFSC trial also showed a continuous increase in soil C stocks for all treatments (Figure 2C). As noted for the results up to the year of the measurement (2018), there was a modest rate of increase in soil C stocks for the period between 2018 and 2050 when MINE fertility sources were applied (0.06 and 0.08 Mg ha1 yr1 in CONV-RT and ORG-RT, respectively), while the use of COMP for the same period led to higher gains under both CONV-RT and ORG-RT (0.29 and 0.22 Mg ha1 yr1 respectively). Overall, the combination of CONV-RT and MINE fertility sources resulted in the lowest simulated soil C stocks (41.95 Mg ha1), while COMP application in the same rotation showed the highest simulated soil C stocks in 2050 (51.89 Mg ha1). The differences in simulated soil C stocks for the period between 2018 and 2050 were 1.91, 9.56, 2.79 and 7.22 Mg ha1 for CONV-RT + MINE, CONV-RT + COMP, ORG-RT + MINE and ORG-RT + COMP, respectively (Figure 2C).
The 11 hypothetical scenarios run under both agricultural systems (conventional vs. organic) indicated that the use of a four-year arable rotation (scenario 1) sharply decreased soil C stocks (0.50 and 0.32 Mg ha1 yr1 in the CONV and ORG system, respectively), while the permanent grazed grass–clover (scenario 11) resulted in higher soil C stocks than all other scenarios by 2050 (increase rate of 0.36 and 0.42 Mg ha1 yr1 in the CONV and ORG systems, respectively) (Figure 3). Nearly all scenarios under the CONV system indicated an overall decrease in soil C stocks between 2018 and 2050, except for scenarios 9, 10 and 11 (Figure 3A,B). Conversely, all scenarios under the ORG system showed an overall increase in soil C stocks between 2018 and 2050, except when continuous arable rotations with no grass–clover leys were simulated (scenario 1) (Figure 3C,D). Comparing rates of increase between the hypothetical scenarios where different years of grass–clover were introduced into a four-year arable rotation, but excluding the effects of the latter, it was noted that both systems were alike (average rates of increase of 0.44 ± 0.03 and 0.48 ± 0.02 Mg ha1 yr1 in the CONV and ORG system, respectively). For both systems, it was observed that the implementation of a minimum of four years of grass–clover may prevent soil C stock losses caused by the use of a four-year arable rotation alone (scenario 7). Adding further years of grass–clover ley (i.e., 6 and 8 years, scenarios 4, 5, 8 and 9) in a four-year arable rotation resulted in a similar soil C stock for 2050 (Figure 3). The results further indicated that while both non-grazed and grazed grass–clover had a positive effect on soil C stocks, grazed grass–clover periods were slightly higher than the non-grazed regimes (Figure 3B,D).

4. Discussion

4.1. Simulating soil C Stocks with the DayCent Model

The ability of the DayCent model to simulate soil C stock changes under conventional and organic systems and the impacts of alternative management practices within these agricultural systems is reasonable as the simulated results reflected the main trends observed in the empirical measurements [8,9]. The only exception was for the compost-fertiliser-based treatment in the NFSC trial, which showed slightly higher simulated soil C stocks compared to the mineral-fertiliser-based treatment in contrast to the empirical measurements. This was probably because, in the experimental trial study, high rates of compost were applied to match the N rates applied in the mineral treatment, which in the model resulted in the accumulation of C mainly in the slow pool. However, it was not expected that all the C additions through compost fertilisation would go into the slow pool (even though empirical results [9] have indicated a larger contribution from more stable compounds under compost fertilisation). Despite this, all the simulated values were within the measured variability and clearly demonstrated that the simulations followed the measured trend.
The findings of this study are indeed promising as the overall predictions were reasonably accurate with a minimal need for model parameterisation. The model was not substantially changed (i.e., fully parameterised); instead, small tunings were performed. This is also consistent with previous studies that indicated DayCent is a reliable model for simulating soil C stocks even with only some site-specific parameterisation [30,31,62,63]. Similarly to this study, Begum et al. [30] adjusted only plant production parameters for an appraisal of different fertiliser and manure additions on the long-term Broadbalk experiment (Rothamsted, UK). The authors reported a high degree of association of the DayCent simulated values and the empirical measurements collected between the years 1843–2014. However, they stressed that a slight overprediction could occur under mineral fertilisation treatments as the model simulates higher yields, and therefore, also, higher C additions. This is also in agreement with another recent study conducted by Senapati et al. [33], who tested the sensitivity of the DayCent model and highlighted that it did not simulate low input regimes very well. These may also be the reasons for the marginally overestimated simulated soil C stocks in the conventional system and non-grazed regimes and the underestimated values in the organic system and the grazed regime (non-significant; p > 0.05). Spatial variations, and therefore factors such as pests, weeds, diseases, micronutrient deficiencies and topography, (i.e., factors not considered in the simulations) could also explain the very slight differences observed between the measured and simulated soil C stocks in the farm-scale study. Conversely, the smaller number of replicates in the NFSC trial compared to the farm-scale study may have generated a higher measurement uncertainty that also led to slight variations between the measured and simulated soil C stocks.
Small variations observed between the study fields and treatments with similar historic management might also be associated with differences in productivity, and therefore, soil C inputs. Georgiou et. al. [64] highlighted that simulations of soil C stocks can be quite sensitive to variations in net primary productivity even in other process-based models. Although our simulated yields were consistent with measurements reported elsewhere in the UK, site-specific yields could help provide a more detailed analysis of the relationship between soil C stocks and yields for this specific case of Nafferton farm. This is of particular importance as agricultural systems must aim for sustainability aspects (e.g., soil C sequestration) but also to be able to deliver good productivity. The approach followed in this study, i.e., adjusting NPP and standardising soil properties (soil texture, bulk density, pH, field capacity, wilting point and hydraulic conductivity) to focus on the impacts of agricultural systems and alternative management practices alone, might have contributed to these slight variations that were observed [65]. Thus, we reinforce the need for future studies to also focus on the balance between production and sustainability for different agricultural systems and management practices. Although we recognise that our approach may have driven some of these small differences between the measured and simulated values, we reiterate that, overall, DayCent was capable of capturing most of the variation in measured soil C stocks.
The finer timescale (daily time steps) that the DayCent model operates in comparison with other models (e.g., Century and/or Roth C, monthly time steps), provides a detailed representation of processes such as plant growth, decomposition of litter and soil C, nutrient flows, soil water and soil temperature, allowing the model to simulate soil C stocks under a range of scenarios [42,66]. In particular, the close relationship between plant and soil represented by the model places DayCent as one of the most comprehensive mechanistic models for soil C dynamics [67]. Sensitivity analysis of the model highlights this close relationship as changes in parameters such as pH, clay content and daily precipitation directly affected soil C stocks even under a short timescale (from 2008 to 2018, i.e., 10 years). Specifically, decreasing soil pH by 1 unit and daily precipitation by 10%, and increasing clay content by 10%, enhanced soil C stocks by 2–8%. These results are most likely to be associated with a decrease in the rate of decomposition and an increase in the physical protection of SOM without negatively affecting NPP, i.e., crop production. Conversely, increasing pH by 1 unit and daily precipitation by 10%, and decreasing clay content by 10%, diminished soil C stocks between 2–3%, which might be due to both the negative effects on crop production and the stimulation of SOM decomposition. The model showed, however, that it was less sensitive to changes in soil bulk density (±10%). This result particularly suggests that using a fixed soil bulk density value for all simulations, as was conducted in this study, did not affect the simulated soil C stocks. This potential lack of sensitivity observed here and elsewhere [30] for changes in soil bulk density by the DayCent model deserves further investigation as a model refinement might be needed to realistically simulate all the soil processes that affect soil C stocks. Additionally, although it was expected that daily air temperature (±1 °C) would be one of the main driving factors affecting soil C stocks due to its direct effect on both plant growth and microbial activity [68,69], the timespan tested here for the sensitivity analysis (from 2008 to 2018) may not have been enough for the expected increase in plant growth to offset the short-term soil C loss through soil respiration, or vice versa [70,71]. This is also emphasised by the results of other studies [30], where the sensitive analysis observed changes in soil C stocks up to approximately 5% (in contrast to ± ~2 observed here) when longer time spans (170 years) were considered for the sensitivity analysis.
Ultimately, despite a few mismatches, and acknowledging that the DayCent model can be improved, the results and trends observed here somehow reflected other studies that used different models such as RothC, ECOSSE, etc. [64,72,73]. In this sense, we concluded that the choice of a specific model depends on the research question the study aims to answer. Here, the DayCent model confirmed the overall good performance of the initialisation approach and the efficiency in simulating soil C stocks under different agricultural systems and alternative management practices. While accurate simulation of present soil C stocks is important, the main goal of using a biogeochemical model is to simulate impacts of C management practices in the future, which is discussed in detail in the next sections.

4.2. Historical Soil C Stock Changes and the Effects of Alternative Management Practices in the Conventional and Organic Agricultural System Now and into the Future

The DayCent simulations showed that the intensification of crop production over 180 years (i.e., from 1800 to 1980) resulted in a decrease in soil C stocks of approximately 30%. This amount of C lost and the annual decrease rate predicted by the DayCent model were consistent with previous studies conducted across Europe and in the UK [74,75,76]. Similar reductions in soil C stocks after a land use change from semi-natural systems to cropland were also reported by other studies conducted in the UK but using other soil C models [46]. It is well-known that the historical soil C losses after conversion from a natural/semi-natural system to agricultural systems are primarily associated with the increased oxidation of organic matter and often the occurrence of soil erosion.
After the historical period, simulations for the period between 1981 and 2007 for the farm-scale study and from 1981 to 2000 for the NFSC trial indicated that study fields used as permanent grassland resulted in higher soil C stocks compared to study fields used as cropland, which reflected the existing knowledge in the literature. Permanent grassland generally accumulates soil C stocks due to higher soil C inputs through litter deposition and enhanced soil aggregation and SOM protection as a result of the abundant fine root system with fast turnover [77,78]. This is especially true for well-managed grassland, i.e., not over-grazed and receiving regular applications of fertilisers and/or manure, as is the case at Nafferton farm. In contrast, cropland systems are associated with factors such as the lower return of plant residues (above and belowground) to the soil, the increase in mineralisation rates and soil disturbance through tillage, and consequently, a decrease in physical protection of the SOM [77,79]. Muhammed et al. [46], using an integrated modelling approach for the whole of the UK for the period between 1800 and 2010, confirmed that, under arable lands, soil C outputs through decomposition were always higher than soil C inputs by plant residues. This trend was also observed in the long-term simulations of the present study. However, it seemed to change when alternative management practices were implemented.
At the farm-scale, the implementation of grazed regimes and higher ley time proportions showed an upward trend in soil C stocks over 33 years (2017–2050) of simulations, regardless of the agricultural system. There is a lack of studies comparing the implementation of non-grazed vs. grazed regimes and ley time proportions within conventional and organic systems, especially over longer-term periods. However, it is reasonable that increasing ley time proportions in crop rotation would enhance soil C accumulation since this practice results in higher C inputs and is often combined with reduced-tillage events [8,31]. Jarvis et al. [80], in a long-term field trial in Sweden (60 years), measured topsoil soil C concentrations (0–0.10 m) in a varying proportion of grass–clover leys (1, 2, 3 or 5 years) in 6-year rotations. Similar to the simulations of the present study, the authors observed that increases in ley time proportions increased soil C concentrations and attributed this to the growth of root systems predominantly in the topsoil. Another recent empirical study conducted by Quemada et al. [11] also indicated that ley periods have the potential to maximise soil C stocks. The authors particularly attributed this finding to the increase in yields of the subsequent cash crop, which occurred especially when ley periods were composed of legumes and maintained for longer periods. Increases in topsoil root growth and in cash crop yields due to increases in ley time proportions may also be the main drivers for soil C accumulation over the 33 years (2017–2050) of our simulations. While ley periods have the potential to increase soil C stocks, they may also either increase or decrease GHG emissions due to interactions between soil N availability and the type of ley growth (e.g., legumes vs. non-leguminous species) [81]. This is crucial and indicates that further research is required to assess the trade-offs between the C accumulation benefits of leys and the impacts on GHG emissions, not only regarding the length of the ley period but also the type of ley used in the rotation. Ultimately, even though DayCent has shown good performance in simulating different proportions of ley periods with promising potential for soil C accumulation, these predictions should be considered with caution since GHG emissions were outside the scope of this study and thus not examined.
In relation to the grazed regime, the stimulation of belowground biomass and the extra inputs of C through forage residues and animal dung are probably the greatest driving forces of C accumulation [82,83,84,85]. In the DayCent model, these factors are included in the simulation. Whenever a grazing event is scheduled in the simulation, it directly affects aboveground biomass (live and standing dead) by removing a fraction of it, the return of nutrients to the soil by urine and faeces deposition (including C, N, P and S in organic forms), the lignin content of the faeces and the root–shoot ratios, all of which will depend on the grazing intensity. Although these are arguably the main mechanisms that influence soil C stocks under a grazing regime, there may also be other factors, e.g., individual plant species and plant cover as well as processes that fix C during photosynthesis [83,86]. However, not all of these factors are currently accounted for as possible extra C inputs by the DayCent model. The simulated soil C accumulation for the study fields under grazed regimes therefore mainly resulted from the potential boosted productivity and stimulation of belowground biomass as well as the excreted C in dung and urine. While dung and urine deposition may have some benefits to increase soil C stocks, other issues need to be considered, for example, GHG emission [87,88]. A further important finding is that differences in simulated soil C stocks between study fields in the farm-scale study were minimal in 2050, particularly when the ley time proportion was ≥40% and under the grazed regime. This ultimately suggests that the implementation of grazed ley periods for less than half of the period of the rotation could offset an arable-associated decline in soil C stocks.
Previous research has highlighted that changes in soil C stocks are mainly driven by differences in soil C input in the form of fertilisers and crop residues [89,90]. In this study, DayCent simulations in the NFSC trial showed positive effects to soil C stocks under compost fertiliser application, while crop rotation showed contrasting findings conditional to the fertilisation source applied. Over a projected 32 year period (2018–2050), the increase in soil C stock under compost fertiliser treatments was estimated to be approximately 0.3 Mg ha1 yr1, which exactly matches the rate of soil C stock gains reported by Begum et al. [30] in a simulation conducted in the Broadbalk experiment, one of the oldest of its kind in the world [50]. The increased rate found in our study also agrees with Smith et al. [91] who reported a range of C accumulation rates from 0.002 to a maximum of 0.30 Mg ha1 yr1 for cool moist croplands. We hypothesised that the soil C stocks’ increase was driven by increasing the amount of total C inputs as well as by the low C:N in manure as reported [15,62]. Although organic amendments are widely recognised for their capacity to enhance soil C, it is important to emphasise that it is also dependent on their decomposability [30,65,92], meaning that this finding should be considered carefully.
Regarding the crop rotation, the conventional rotation showed the highest and the lowest soil C stocks when combined with compost and mineral fertiliser, respectively, after 32 years of simulations (difference of approximately 10 Mg ha1). Similar results were observed under organic rotation but with intermediate soil C stocks and differences of only ~4 Mg ha1 between compost and mineral fertiliser after the same period (2018–2050). These results are in line with the simulations reported by Lee et al. [31] who compared conventional and organic systems in Switzerland at the regional scale also using the DayCent model. Their study suggests that the adoption of the organic systems with compost fertiliser has a higher potential to increase soil C stocks relative to conventional systems with only mineral fertiliser. However, the authors used a conventional system without cover crops in the rotation as a baseline for their comparison. In this study, although grown with different lengths of years (two- and three-years), both conventional and organic systems had grass–clover ley periods inserted into the rotation, which might have limited differences between the two rotations. Moreover, the conventional rotation was characterised by cereal intensive crops, while the organic rotation was based on a more diverse and legume-rich cycle. Ultimately, these results suggest that the magnitude of changes in soil C stocks may also be crop-specific. In the DayCent model, crops differ in terms of C allocation fraction, root biomass C, aboveground live C and crop residues, among others, thus affecting soil C accumulation.

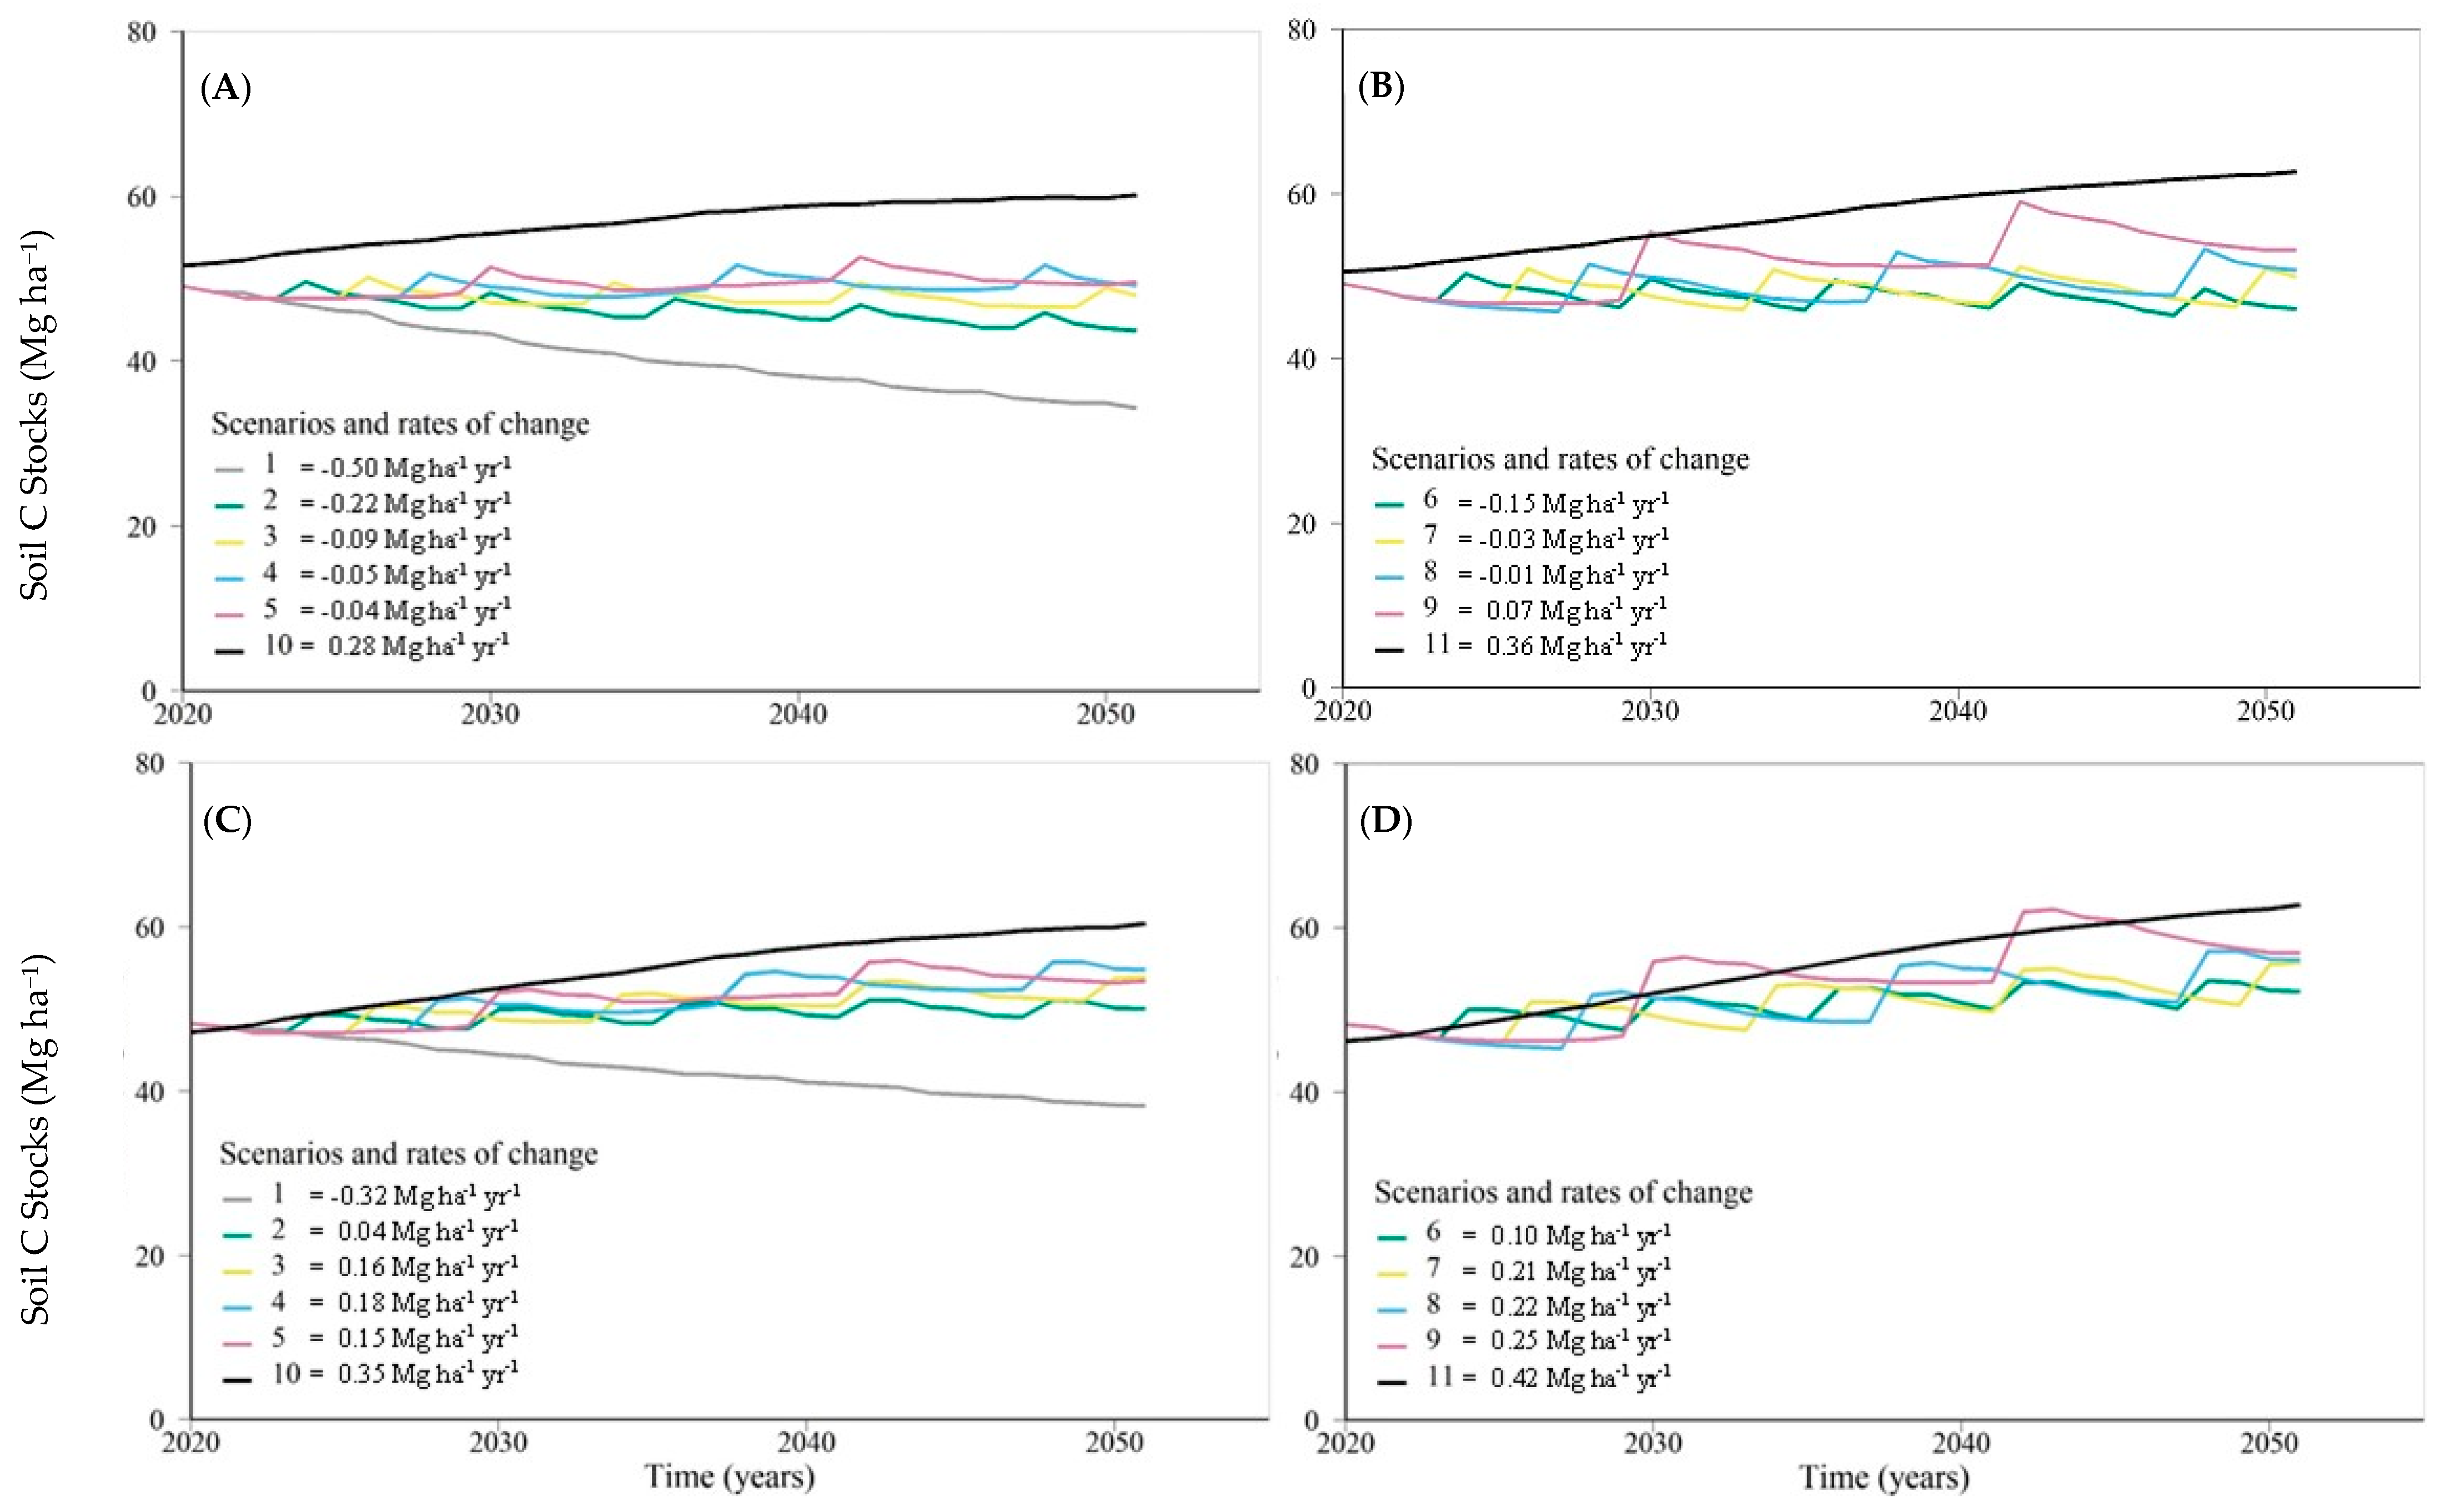
4.3. Hypothetical Scenarios Observations

The positive influences of the grazed regime, ley time proportions and compost fertiliser, as well as the effect of crop choice in rotation, on soil C stocks were all further emphasised under the hypothetical scenarios.
It was notable that higher ley time proportions resulted in a higher potential for soil C stocks to increase, albeit at a lower rate when adding more than four years of grass–clover ley periods in a four-year arable rotation and/or under the non-grazed regime. These results were observed under both conventional and organic systems, but the crop choice in the rotation of the former led to higher soil C loss compared to the latter. According to Lee et al. [31], crop choice in rotation, rates of mineral fertilisation and/or organic amendments and tillage events play a key role in simulating soil C stocks by the DayCent model. Crop choice in rotation, in particular, help to justify the slight soil C stock differences between the conventional and organic system in the hypothetical scenarios since all the other parameters (e.g., soil C inputs through fertilisation and tillage events), were kept identical during the simulations. The four-year conventional arable rotation exerts a higher decrease rate compared to the four-year organic arable rotation as a function of different crop-specific parameters defined by the DayCent model as aforementioned.
Lastly, it is worth noting that the potential soil C stock accumulation is a function of both the previous management and the initial soil C stock’s condition. Accordingly, the DayCent model simulations indicated that the implementation of alternative management practices in study fields with an initial depleted soil C storage (e.g., study fields previously under a cropland-based system) increased soil C at higher rates compared to study fields with a high initial soil C storage (e.g., study fields previously under a permanent grassland system). Yet, soil C accumulation is finite and reversible when the land use or management practice is changed. Since these aspects and others such as crop varieties, climatic variation and interactions between other management options will all impact the future performance of the alternative management practices tested here, long-term perspectives should be considered as scenarios only.

5. Conclusions

In this study, the effects of historical, current and future soil management on soil C stock changes (0–0.20 m depth) were explicitly simulated by the DayCent model. The model was able to capture the trends of decreased soil C stocks due to the historical intensification of crop production followed by a recovery when more sustainable agricultural systems and management practices were implemented. The simulations also confirmed empirical findings showing that there are benefits to soil C stocks when implementing management practices such as the grazed regime and higher ley time proportions (especially as combined practices) regardless of whether the system is conventionally or organically managed. Furthermore, model simulations showed that the application of compost fertiliser promotes soil C accumulation, although its magnitude is dependent on the choice of crops in the rotation. Long-term simulations suggested that the grazed regime, higher ley time proportions and/or compost fertiliser application can increase soil C stock for a period of at least 30 years. However, ley time proportions higher than 40% of the full crop rotation did not improve soil C accumulation further. Ultimately, it was concluded that the DayCent model can be used to identify the quantity of and the effective period for which management practices can be used to target mitigation efforts, but since productivity was not fully tested, it remains a gap that must be fulfilled by future studies (i.e., the balance between sustainability and productivity aspects). The results found in this study support its use to grasp the effects of conventional and organic systems and in the implementation of alternative management practices on soil C stocks to guide the best future land management in northern England agricultural systems.

Supplementary Materials

The following supporting information can be downloaded at: https://www.mdpi.com/article/10.3390/agronomy13041093/s1, Figure S1: Average monthly air temperature (line) and rainfall (bars) at Nafferton farm, Stocksfield, Northumberland, Northeast England, UK, between 1900 and 2020; Figure S2: Relationship between measured and simulated soil organic C stocks (SOC stock, Mg ha−1) at 0–0.20 m depth due to changes in ley time proportions (%). Each (O) symbol represents a study site SOC stock mean of a minimum of eight and a maximum of 15 spatial replications. Each (x) symbol represents the simulated SOC stock of the study site. The solid line is the linear regression line around the measured values, while the dashed line is the linear regression line around the simulated values; Figure S3: Equilibrium to modern-day baseline simulation of soil organic C stocks (SOC stocks, Mg ha−1) at 0–0.20 m depth; Table S1: Management history of the 12 study fields at Nafferton farm over 10 years (2008–2017) indicating agricultural system (S) (conventional—CONV and organic—ORG), grazing regime (G) (non-grazed—NG and grazed—GG), ley time proportion (LTP), manure application proportions (MAP) and tillage event proportion (TEP), and further details including main crops grown and fertilisation rates. LTP, MAP and TEP shown as % of years in which the field was under ley, received manure application or had activities that turned the soil over for at least 0.15 m depth prior to sampling. Data from Zani et al. (2022); Table S2: Summary of the input parameters entered in the DayCent model including climate data and general soil properties (0–0.20 m depth) encompassing the farm-scale study and the Nafferton Factorial Systems Comparison (NFSC) trial.

Author Contributions

C.F.Z., G.D.A., J.A.T., J.M.C. and E.L.-C. designed the experiment; C.F.Z. and M.V.G., conducted the modelling with input from M.A., G.D.A., J.A.T., J.M.C. and E.L.-C.; M.V.G. provided practical training of the DayCent model with contributions and validation from M.A.; C.F.Z. analysed the data and led the writing of the original manuscript with extensive input from all co-authors. All authors have read and agreed to the published version of the manuscript.

Funding

This research was funded by Newcastle University, Faculty of Science. For the mathematical modelling training, this research received external funding from Enviresearch Ltd. Newcastle upon Tyne, United Kingdom. M.A. is funded by EU Horizon 2020 programme: SuperG project number 774124.

Data Availability Statement

The data that support the findings of this study are mostly available in both the body of this paper and in the supplementary material provided. Raw data can be provided upon request from the corresponding author C.F.Z.

Acknowledgments

The authors thank the University of Leeds, School of Earth and Environment, particularly Ishwar Pun, for their help on the modelling approaches. The authors also thank Matthias Kuhnert from the University of Aberdeen for his contribution to a few steps in the model set-up and initialisation.

Conflicts of Interest

The authors declare no conflict of interest.

References

  1. Lal, R. Soil Carbon Sequestration Impacts on Global Climate Change and Food Security. Science 2004, 304, 1623–1627. [Google Scholar] [CrossRef] [Green Version]
  2. Pachauri, R.K.; Allen, M.R.; Barros, V.R.; Broome, J.; Cramer, W.; Christ, R.; Church, J.A.; Clarke, L.; Dahe, Q.; Dasgupta, P.; et al. Climate Change 2014: Synthesis Report. Contribution of Working Groups I, II and III to the Fifth Assessment Report of the Intergovernmental Panel on Climate Change; IPCC: Geneva, Switzerland, 2014; ISBN 9789291691432. [Google Scholar]
  3. Lal, R. Soil Carbon Sequestration to Mitigate Climate Change. Geoderma 2004, 123, 1–22. [Google Scholar] [CrossRef]
  4. IFOAM. The IFOAM Norms for Organic Production and Processing; Germany, B., Ed.; International Federation of Organic Agriculture Movements (IFOAM): Bonn, Germany, 2012. [Google Scholar]
  5. Krauss, M.; Wiesmeier, M.; Don, A.; Cuperus, F.; Gattinger, A.; Gruber, S.; Haagsma, W.K.; Peigné, J.; Palazzoli, M.C.; Schulz, F.; et al. Reduced Tillage in Organic Farming Affects Soil Organic Carbon Stocks in Temperate Europe. Soil Tillage Res. 2022, 216, 105262. [Google Scholar] [CrossRef]
  6. Zani, C.F.; Gowing, J.; Abbott, G.D.; Taylor, J.A.; Lopez-Capel, E.; Cooper, J. Grazed Temporary Grass-Clover Leys in Crop Rotations Can Have a Positive Impact on Soil Quality under Both Conventional and Organic Agricultural Systems. Eur. J. Soil Sci. 2021, 72, 1513–1529. [Google Scholar] [CrossRef]
  7. Gattinger, A.; Muller, A.; Haeni, M.; Skinner, C.; Fliessbach, A.; Buchmann, N.; Mäder, P.; Stolze, M.; Smith, P.; Scialabba, N.E.-H.; et al. Enhanced Top Soil Carbon Stocks under Organic Farming. Proc. Natl. Acad. Sci. USA 2012, 109, 18226–18231. [Google Scholar] [CrossRef] [PubMed] [Green Version]
  8. Zani, C.F.; Lopez-Capel, E.; Abbott, G.D.; Taylor, J.A.; Cooper, J.M. Effects of Integrating Grass-Clover Leys with Livestock into Arable Crop Rotations on Soil Carbon Stocks and Particulate and Mineral-Associated Soil Organic Matter Fractions in Conventional and Organic Systems. Soil Use Manag. 2022, 38, 448–465. [Google Scholar] [CrossRef]
  9. Zani, C.F.; Manning, D.A.C.; Abbott, G.D.; Taylor, J.A.; Cooper, J.M.; Lopez-Capel, E. Diversified Crop Rotations and Organic Amendments as Strategies for Increasing Soil Carbon Storage and Stabilisation in UK Arable Systems. Front. Environ. Sci. 2023, 11, 493. [Google Scholar] [CrossRef]
  10. Houghton, R.A. Revised Estimates of the Annual Net Flux of Carbon to the Atmosphere from Changes in Land Use and Land Management 1850–2000. Tellus Ser. B Chem. Phys. Meteorol. 2003, 55, 378–390. [Google Scholar] [CrossRef] [Green Version]
  11. Quemada, M.; Lassaletta, L.; Leip, A.; Jones, A.; Lugato, E. Integrated Management for Sustainable Cropping Systems: Looking beyond the Greenhouse Balance at the Field Scale. Glob. Chang. Biol. 2020, 26, 2584–2598. [Google Scholar] [CrossRef]
  12. Diacono, M.; Montemurro, F. Long-Term Effects of Organic Amendments on Soil Fertility. A Review. Agron. Sustain. Dev. 2010, 30, 401–422. [Google Scholar] [CrossRef] [Green Version]
  13. García-Palacios, P.; Gattinger, A.; Bracht-Jørgensen, H.; Brussaard, L.; Carvalho, F.; Castro, H.; Clément, J.-C.; De Deyn, G.; D’Hertefeldt, T.; Foulquier, A.; et al. Crop Traits Drive Soil Carbon Sequestration under Organic Farming. J. Appl. Ecol. 2018, 55, 2496–2505. [Google Scholar] [CrossRef]
  14. Krause, H.-M.; Stehle, B.; Mayer, J.; Mayer, M.; Steffens, M.; Mäder, P.; Fliessbach, A. Biological Soil Quality and Soil Organic Carbon Change in Biodynamic, Organic, and Conventional Farming Systems after 42 Years. Agron. Sustain. Dev. 2022, 42, 117. [Google Scholar] [CrossRef]
  15. Leifeld, J.; Fuhrer, J. Organic Farming and Soil Carbon Sequestration: What Do We Really Know about the Benefits? Ambio 2010, 39, 585–599. [Google Scholar] [CrossRef] [Green Version]
  16. Leifeld, J.; Angers, D.A.; Chenu, C.; Fuhrer, J.; Kätterer, T.; Powlson, D.S. Organic Farming Gives No Climate Change Benefit through Soil Carbon Sequestration. Proc. Natl. Acad. Sci. USA. 2013, 110, E984. [Google Scholar] [CrossRef] [Green Version]
  17. Powlson, D.S. Why Evaluate Soil Organic Matter Models? In Evaluation of Soil Organic Matter Models Using Existing Long-Term Datasets NATO ASI Series I: Global Environmental Change; Powlson, D.S., Smith, P., Smith, J.U., Eds.; Springer: Berlin/Heidelberg, Germany, 1996; Volume 38, pp. 3–11. [Google Scholar] [CrossRef]
  18. Dondini, M.; Abdalla, M.; Aini, F.K.; Albanito, F.; Beckert, M.R.; Begum, K.; Brand, A.; Cheng, K.; Comeau, L.P.; Jones, E.O.; et al. Projecting Soil C under Future Climate and Land-Use Scenarios (Modeling). In Soil Carbon Storage: Modulators, Mechanisms and Modeling; Academic Press: Cambridge, MA, USA, 2018; ISBN 9780128127667. [Google Scholar] [CrossRef]
  19. Smith, P.; House, J.I.; Bustamante, M.; Sobocká, J.; Harper, R.; Pan, G.; West, P.C.; Clark, J.M.; Adhya, T.; Rumpel, C.; et al. Global Change Pressures on Soils from Land Use and Management. Glob. Chang. Biol. 2016, 22, 1008–1028. [Google Scholar] [CrossRef] [PubMed]
  20. Smith, P.; Davies, C.A.; Ogle, S.; Zanchi, G.; Bellarby, J.; Bird, N.; Boddey, R.M.; McNamara, N.P.; Powlson, D.; Cowie, A.; et al. Towards an Integrated Global Framework to Assess the Impacts of Land Use and Management Change on Soil Carbon: Current Capability and Future Vision. Glob. Chang. Biol. 2012, 18, 2089–2101. [Google Scholar] [CrossRef]
  21. Chen, Z.; Wang, J.; Deng, N.; Lv, C.; Wang, Q.; Yu, H.; Li, W. Modeling the Effects of Farming Management Practices on Soil Organic Carbon Stock at a County-Regional Scale. Catena 2018, 160, 76–89. [Google Scholar] [CrossRef]
  22. Del Grosso, S.J.; Parton, W.J.; Mosier, A.R.; Hartman, M.D.; Brenner, J.; Ojima, D.S.; Schimel, D.S. Simulated Interaction of Carbon Dynamics and Nitrogen Trace Gas Fluxes Using the DAYCENT Model. In Modeling Carbon and Nitrogen Dynamics for Soil Management; Schaffer, M., Ma, L., Hansen, S., Eds.; CRC Press: Boca Raton, FL, USA, 2001; pp. 303–332. [Google Scholar]
  23. Parton, W.J.; Hartman, M.; Ojima, D.; Schimel, D. DAYCENT and Its Land Surface Submodel: Description and Testing. Glob. Planet. Chang. 1998, 19, 35–48. [Google Scholar] [CrossRef]
  24. Parton, W.J.; Schimel, D.S.; Cole, C.V.; Ojima, D.S. Analysis of Factors Controlling Soil Organic Matter Levels in Great Plains Grasslands1. Soil Sci. Soc. Am. J. 1987, 51, 1173–1179. [Google Scholar] [CrossRef]
  25. Oliveira, D.M.S.; Williams, S.; Cerri, C.E.P.; Paustian, K. Predicting Soil C Changes over Sugarcane Expansion in Brazil Using the DayCent Model. GCB Bioenergy 2017, 9, 1436–1446. [Google Scholar] [CrossRef] [Green Version]
  26. Cheng, K.; Ogle, S.M.; Parton, W.J.; Pan, G. Simulating Greenhouse Gas Mitigation Potentials for Chinese Croplands Using the DAYCENT Ecosystem Model. Glob. Chang. Biol. 2014, 20, 948–962. [Google Scholar] [CrossRef] [PubMed]
  27. Smith, W.N.; Grant, B.B.; Campbell, C.A.; McConkey, B.G.; Desjardins, R.L.; Kröbel, R.; Malhi, S.S. Crop Residue Removal Effects on Soil Carbon: Measured and Inter-Model Comparisons. Agric. Ecosyst. Environ. 2012, 161, 27–38. [Google Scholar] [CrossRef]
  28. Chang, K.-H.; Warland, J.; Voroney, P.; Bartlett, P.; Wagner-Riddle, C. Using DayCENT to Simulate Carbon Dynamics in Conventional and No-Till Agriculture. Soil Sci. Soc. Am. J. 2013, 77, 941–950. [Google Scholar] [CrossRef]
  29. Parton, W.J.; Stewart, J.W.B.; Cole, C.V. Dynamics of C, N, P and S in Grassland Soils: A Model. Biogeochemistry 1988, 5, 109–131. [Google Scholar] [CrossRef]
  30. Begum, K.; Kuhnert, M.; Yeluripati, J.; Glendining, M.; Smith, P. Simulating Soil Carbon Sequestration from Long Term Fertilizer and Manure Additions under Continuous Wheat Using the DailyDayCent Model. Nutr. Cycl. Agroecosyst. 2017, 109, 291–302. [Google Scholar] [CrossRef] [Green Version]
  31. Lee, J.; Necpálová, M.; Six, J. Biophysical Potential of Organic Cropping Practices as a Sustainable Alternative in Switzerland. Agric. Syst. 2020, 181, 102822. [Google Scholar] [CrossRef]
  32. Necpalova, M.; Lee, J.; Skinner, C.; Büchi, L.; Wittwer, R.; Gattinger, A.; van der Heijden, M.; Mäder, P.; Charles, R.; Berner, A.; et al. Potentials to Mitigate Greenhouse Gas Emissions from Swiss Agriculture. Agric. Ecosyst. Environ. 2018, 265, 84–102. [Google Scholar] [CrossRef]
  33. Senapati, N.; Chabbi, A.; Giostri, A.F.; Yeluripati, J.B.; Smith, P. Modelling Nitrous Oxide Emissions from Mown-Grass and Grain-Cropping Systems: Testing and Sensitivity Analysis of DailyDayCent Using High Frequency Measurements. Sci. Total Environ. 2016, 572, 955–977. [Google Scholar] [CrossRef] [Green Version]
  34. Smith, J.; Smith, P. Environmental Modelling. An Introduction; Oxford University Press: New York, NY, USA, 2007. [Google Scholar]
  35. Red Tractor Assurance Red Tractor Assurance Standards. 2015. Available online: www.redtractor.org.uk (accessed on 1 February 2023).
  36. Soil Association. Soil Association Standards Farming and Growing; Soil Association: Bristol, UK, 2019. [Google Scholar]
  37. Fitton, N.; Datta, A.; Smith, K.; Williams, J.R.; Hastings, A.; Kuhnert, M.; Topp, C.F.E.; Smith, P. Assessing the Sensitivity of Modelled Estimates of N2O Emissions and Yield to Input Uncertainty at a UK Cropland Experimental Site Using the DailyDayCent Model. Nutr. Cycl. Agroecosyst. 2014, 99, 119–133. [Google Scholar] [CrossRef]
  38. Fitton, N.; Datta, A.; Hastings, A.; Kuhnert, M.; Topp, C.F.E.; Cloy, J.M.; Rees, R.M.; Cardenas, L.M.; Williams, J.R.; Smith, K.; et al. The Challenge of Modelling Nitrogen Management at the Field Scale: Simulation and Sensitivity Analysis of N2O Fluxes across Nine Experimental Sites Using DailyDayCent. Environ. Res. Lett. 2014, 9, 095003. [Google Scholar] [CrossRef] [Green Version]
  39. Blake, G.H.; Hartge, K.H. “Bulk Density”, in Methods of Soil Analysis, 2nd ed.; Klute, A., Ed.; The American Society of Agronomy: Madison, WI, USA, 1986. [Google Scholar]
  40. Saxton, K.E.; Rawls, W.J. Soil Water Characteristic Estimates by Texture and Organic Matter for Hydrologic Solutions. Soil Sci. Soc. Am. J. 2006, 70, 1569–1578. [Google Scholar] [CrossRef] [Green Version]
  41. Del Grosso, S.J.; Parton, W.J.; Mosier, A.R.; Walsh, M.K.; Ojima, D.S.; Thornton, P.E. DAYCENT National-Scale Simulations of Nitrous Oxide Emissions from Cropped Soils in the United States. J. Environ. Qual. 2006, 35, 1451–1460. [Google Scholar] [CrossRef]
  42. Del Grosso, S.J.; Parton, W.J.; Keough, C.A.; Reyes-Fox, M. Special Features of the DayCent Modeling Package and Additional Procedures for Parameterization, Calibration, Validation, and Applications. Methods Introd. Syst. Model. Agric. Res. 2011, 2, 155–176. [Google Scholar]
  43. Davies, J.A.C.; Tipping, E.; Rowe, E.C.; Boyle, J.F.; Graf Pannatier, E.; Martinsen, V. Long-Term P Weathering and Recent N Deposition Control Contemporary Plant-Soil C, N, and P. Global Biogeochem. Cycles 2016, 30, 231–249. [Google Scholar] [CrossRef] [Green Version]
  44. Tipping, E.; Rowe, E.C.; Evans, C.D.; Mills, R.T.E.; Emmett, B.A.; Chaplow, J.S.; Hall, J.R. N14C: A Plant–Soil Nitrogen and Carbon Cycling Model to Simulate Terrestrial Ecosystem Responses to Atmospheric Nitrogen Deposition. Ecol. Modell. 2012, 247, 11–26. [Google Scholar] [CrossRef] [Green Version]
  45. Tipping, E.; Davies, J.A.C.; Henrys, P.A.; Kirk, G.J.D.; Lilly, A.; Dragosits, U.; Carnell, E.J.; Dore, A.J.; Sutton, M.A.; Tomlinson, S.J. Long-Term Increases in Soil Carbon Due to Ecosystem Fertilization by Atmospheric Nitrogen Deposition Demonstrated by Regional-Scale Modelling and Observations. Sci. Rep. 2017, 7, 1890. [Google Scholar] [CrossRef] [Green Version]
  46. Muhammed, S.E.; Coleman, K.; Wu, L.; Bell, V.A.; Davies, J.A.C.; Quinton, J.N.; Carnell, E.J.; Tomlinson, S.J.; Dore, A.J.; Dragosits, U.; et al. Impact of Two Centuries of Intensive Agriculture on Soil Carbon, Nitrogen and Phosphorus Cycling in the UK. Sci. Total Environ. 2018, 634, 1486–1504. [Google Scholar] [CrossRef] [PubMed]
  47. Nemo; Klumpp, K.; Coleman, K.; Dondini, M.; Goulding, K.; Hastings, A.; Jones, M.B.; Leifeld, J.; Osborne, B.; Saunders, M.; et al. Soil Organic Carbon (SOC) Equilibrium and Model Initialisation Methods: An Application to the Rothamsted Carbon (RothC) Model. Environ. Model. Assess. 2017, 22, 215–229. [Google Scholar] [CrossRef]
  48. Pullan, S. Land Use Change in Northumberland from 1800’s to Today—Lessons from Agricultural History. Asp. Appl. Biol. 2011, 108, 145–152. [Google Scholar]
  49. Avery, B.W.; Bullock, P. The Soils of Broadbalk: Morphology and Classification of Broadbalk Soils. In Rothamsted Experimental Station Report for 1968 (Part 2); Harpenden Herts, Lawes Agriccultural Trust: Harpenden, UK, 1969; pp. 63–81. [Google Scholar]
  50. Rothamsted, R. Guide to the Classical and Other Long-Term Experiments, Datasets and Sample Archive; Lawes Agricultural Trust Co., Ltd.: Harpenden, UK, 2006. [Google Scholar]
  51. Digimap, E. Historic Maps. Historical Ordnance Survey Maps of Great Britain. 2020. Available online: https://digimap.edina.ac.uk/historic (accessed on 24 November 2020).
  52. Digimap, E. Land Cover Maps. Environ. Ordnance Surv. L. Cover Data 1990, 2000, 2007 2015, All Natl. Cover. Dudley Stamp’s Maps 1930’s L. Util. Surv. Britain. 2020. Available online: https://digimapedinaacuk/os (accessed on 24 November 2020).
  53. Archer, J. Crop Nutrition and Fertiliser Use; Farming Press Ltd.: Ipswitch, UK, 1985. [Google Scholar]
  54. DEFRA. The British Survey of Fertiliser Practice—Fertiliser Use on Farm for Crops for Crop Year 2010; Department for Environment Food and Rural Affairs: London, UK, 2011.
  55. Naden, P.; Bell, V.; Carnell, E.; Tomlinson, S.; Dragosits, U.; Chaplow, J.; May, L.; Tipping, E. Nutrient Fluxes from Domestic Wastewater: A National-Scale Historical Perspective for the UK 1800–2010. Sci. Total Environ. 2016, 572, 1471–1484. [Google Scholar] [CrossRef] [PubMed] [Green Version]
  56. Britain Agriculture and Land Use. Available online: https://www.visionofbritain.org.uk/data/dds_entity_page.jsp?ent=T_LAND (accessed on 17 December 2020).
  57. Nelson, D.W.; Sommers, L.E. Total Carbon, Organic Carbon, and Organic Matter. In Methods of Soil Analysis. Part 2.2; Page, A.L., Miller, R.H., Keeney, D.R., Eds.; SSSA Book Series, 5; ASA: Madison, WI, USA, 1996; Volume 5, pp. 961–1010. [Google Scholar]
  58. Wendt, J.W.; Hauser, S. An Equivalent Soil Mass Procedure for Monitoring Soil Organic Carbon in Multiple Soil Layers. Eur. J. Soil Sci. 2013, 64, 58–65. [Google Scholar] [CrossRef]
  59. Glendining, M.J.; Bailey, N.J.; Smith, J.U.; Addiscott, T.M.; Smith, P. SUNDIAL-FRS User Guide, Version 1.0; MAFF: London, UK; IACR-Rothamsted: Harpenden, UK, 1998. [Google Scholar]
  60. Marks, H.F. A Hundred Years of British Food & Farming: A Statistical Survey; Britton, D.K., Ed.; Taylor & Francis: Abingdon, UK, 1989. [Google Scholar]
  61. Smith, P.; Smith, J.U.; Powlson, D.S.; Mcgill, W.B.; Arah, J.R.M.; Chertvoc, O.G.; Coleman, K.; Franko, U.; Frolking, S.; Jenkinson, D.S.; et al. A Comparison of the Performance of Nine Soil Organic Matter Models Using Datasets from Seven Long-Term Experiments. Geoderma 1997, 81, 153–225. [Google Scholar] [CrossRef]
  62. Bista, P.; Machado, S.; Ghimire, R.; Del Grosso, S.J.; Reyes-Fox, M. Simulating Soil Organic Carbon in a Wheat–Fallow System Using the DAYCENT Model. Agron. J. 2016, 108, 2554–2565. [Google Scholar] [CrossRef]
  63. Congreves, K.A.; Grant, B.B.; Campbell, C.A.; Smith, W.N.; Vandenbygaart, A.J.; Kröbel, R.; Lemke, R.L.; Desjardins, R.L. Measuring and Modeling the Long-Term Impact of Crop Management on Soil Carbon Sequestration in the Semiarid Canadian Prairies. Agron. J. 2015, 107, 1141–1154. [Google Scholar] [CrossRef]
  64. Georgiou, K.; Malhotra, A.; Wieder, W.R.; Ennis, J.H.; Hartman, M.D.; Sulman, B.N.; Berhe, A.A.; Grandy, A.S.; Kyker-Snowman, E.; Lajtha, K.; et al. Divergent Controls of Soil Organic Carbon between Observations and Process-Based Models. Biogeochemistry 2021, 156, 5–17. [Google Scholar] [CrossRef]
  65. Brandani, C.B.; Abbruzzini, T.F.; Williams, S.; Easter, M.; Pellegrino Cerri, C.E.; Paustian, K. Simulation of Management and Soil Interactions Impacting SOC Dynamics in Sugarcane Using the CENTURY Model. GCB Bioenergy 2015, 7, 646–657. [Google Scholar] [CrossRef] [Green Version]
  66. Del Grosso, S.J.; Parton, W.J.; Adler, P.R.; Davis, S.C.; Keough, C.; Marx, E. Daycent Model Simulations for Estimating Soil Carbon Dynamics and Greenhouse Gas Fluxes from Agricultural Production Systems. In Managing Agricultural Greenhouse Gases; Elsevier Inc.: New York, NY, USA, 2012; pp. 241–250. ISBN 9780123868978. [Google Scholar]
  67. Robertson, A.D.; Davies, C.A.; Smith, P.; Dondini, M.; Mcnamara, N.P. Modelling the Carbon Cycle of Miscanthus Plantations: Existing Models and the Potential for Their Improvement. GCB Bioenergy 2015, 7, 405–421. [Google Scholar] [CrossRef] [Green Version]
  68. Jabro, J.D.; Sainju, U.; Stevens, W.B.; Evans, R.G. Carbon Dioxide Flux as Affected by Tillage and Irrigation in Soil Converted from Perennial Forages to Annual Crops. J. Env. Manag. 2008, 88, 1478–1484. [Google Scholar] [CrossRef]
  69. Wieder, W.R.; Bonan, G.B.; Allison, S.D. Global Soil Carbon Projections Are Improved by Modelling Microbial Processes. Nat. Clim. Chang. 2013, 3, 909–912. [Google Scholar] [CrossRef] [Green Version]
  70. Zak, D.R.; Pregitzer, K.S.; King, J.S.; Holmes, W.E. Elevated Atmospheric CO2, Fine Roots and the Response of Soil Microorganisms: A Review and Hypothesis. New Phytol. 2000, 147, 201–222. [Google Scholar] [CrossRef] [Green Version]
  71. Deng, Q.; Zhou, G.; Liu, J.; Liu, S.; Duan, H.; Zhang, D. Responses of Soil Respiration to Elevated Carbon Dioxide and Nitrogen Addition in Young Subtropical Forest Ecosystems in China. Biogeosciences 2010, 7, 315–328. [Google Scholar] [CrossRef] [Green Version]
  72. Jordon, M.W.; Smith, P.; Long, P.R.; Bürkner, P.-C.; Petrokofsky, G.; Willis, K.J. Can Regenerative Agriculture Increase National Soil Carbon Stocks? Simulated Country-Scale Adoption of Reduced Tillage, Cover Cropping, and Ley-Arable Integration Using RothC. Sci. Total Environ. 2022, 825, 153955. [Google Scholar] [CrossRef]
  73. Begum, K.; Zornoza, R.; Farina, R.; Lemola, R.; Álvaro-Fuentes, J.; Cerasuolo, M. Modeling Soil Carbon under Diverse Cropping Systems and Farming Management in Contrasting Climatic Regions in Europe. Front. Environ. Sci. 2022, 10. [Google Scholar] [CrossRef]
  74. Poeplau, C.; Don, A.; Vesterdal, L.; Leifeld, J.; Van Wesemael, B.; Schumacher, J.; Gensior, A. Temporal Dynamics of Soil Organic Carbon after Land-Use Change in the Temperate Zone—Carbon Response Functions as a Model Approach. Glob. Chang. Biol. 2011, 17, 2415–2427. [Google Scholar] [CrossRef]
  75. Bellamy, P.H.; Loveland, P.J.; Bradley, R.I.; Lark, R.M.; Kirk, G.J.D. Carbon Losses from All Soils across England and Wales 1978–2003. Nature 2005, 437, 245–248. [Google Scholar] [CrossRef] [Green Version]
  76. Murty, D.; Kirschbaum, M.U.F.; Mcmurtrie, R.E.; Mcgilvray, H. Does Conversion of Forest to Agricultural Land Change Soil Carbon and Nitrogen? A Review of the Literature. Glob. Chang. Biol. 2002, 8, 105–123. [Google Scholar] [CrossRef]
  77. Six, J.; Conant, R.T.; Paul, E.A.; Paustian, K. Stabilization Mechanisms of Soil Organic Matter: Implications for C-Saturation of Soils. Plant Soil 2002, 241, 155–176. [Google Scholar] [CrossRef]
  78. Conant, R.T.; Paustian, K.; Elliott, E.T. Grassland Management and Conversion into Grassland: Effects on Soil Carbon. Ecol. Appl. 2001, 11, 343–355. [Google Scholar] [CrossRef]
  79. Franzluebbers, A.J.; Stuedemann, J.A.; Schomberg, H.H.; Wilkinson, S.R. Soil Organic C and N Pools under Long-Term Pasture Management in the Southern Piedmont USA. Soil Biol. Biochem. 2000, 32, 469–478. [Google Scholar] [CrossRef]
  80. Jarvis, N.; Forkman, J.; Koestel, J.; Kätterer, T.; Larsbo, M.; Taylor, A. Long-Term Effects of Grass-Clover Leys on the Structure of a Silt Loam Soil in a Cold Climate. Agric. Ecosyst. Environ. 2017, 247, 319–328. [Google Scholar] [CrossRef]
  81. Barneze, A.S.; Whitaker, J.; McNamara, N.P.; Ostle, N.J. Legumes Increase Grassland Productivity with No Effect on Nitrous Oxide Emissions. Plant Soil 2020, 446, 163–177. [Google Scholar] [CrossRef] [Green Version]
  82. Pineiro, G.; Paruelo, J.M.; Oesterheld, M.; Jobbágy, E.G. Pathways of Grazing Effects on Soil Organic Carbon and Nitrogen. Rangel. Ecol. Manag. 2010, 63, 109–119. [Google Scholar] [CrossRef]
  83. McSherry, M.E.; Ritchie, M.E. Effects of Grazing on Grassland Soil Carbon: A Global Review. Glob. Chang. Biol. 2013, 19, 1347–1357. [Google Scholar] [CrossRef]
  84. Assmann, J.M.; Anghinoni, I.; Martins, A.P.; de Andrade Costa, S.E.V.G.; Cecagno, D.; Carlos, F.S.; de Faccio Carvalho, P.C. Soil Carbon and Nitrogen Stocks and Fractions in a Long-Term Integrated Crop–Livestock System under No-Tillage in Southern Brazil. Agric. Ecosyst. Environ. 2014, 190, 52–59. [Google Scholar] [CrossRef]
  85. Chen, W.; Huang, D.; Liu, N.; Zhang, Y.; Badgery, W.B.; Wang, X.; Shen, Y. Improved Grazing Management May Increase Soil Carbon Sequestration in Temperate Steppe. Sci. Rep. 2015, 5, 10892. [Google Scholar] [CrossRef] [Green Version]
  86. Abdalla, M.; Hastings, A.; Chadwick, D.R.; Jones, D.L.; Evans, C.D.; Jones, M.B.; Rees, R.M.; Smith, P. Critical Review of the Impacts of Grazing Intensity on Soil Organic Carbon Storage and Other Soil Quality Indicators in Extensively Managed Grasslands. Agric. Ecosyst. Environ. 2018, 253, 62–81. [Google Scholar] [CrossRef] [Green Version]
  87. Barneze, A.S.; Mazzetto, A.M.; Zani, C.F.; Misselbrook, T.; Cerri, C.C. Nitrous Oxide Emissions from Soil Due to Urine Deposition by Grazing Cattle in Brazil. Atmos. Environ. 2014, 92, 394–397. [Google Scholar] [CrossRef]
  88. Chadwick, D.R.; Cardenas, L.M.; Dhanoa, M.S.; Donovan, N.; Misselbrook, T.; Williams, J.R.; Thorman, R.E.; McGeough, K.L.; Watson, C.J.; Bell, M.; et al. The Contribution of Cattle Urine and Dung to Nitrous Oxide Emissions: Quantification of Country Specific Emission Factors and Implications for National Inventories. Sci. Total Environ. 2018, 635, 607–617. [Google Scholar] [CrossRef]
  89. Oberholzer, H.R.; Leifeld, J.; Mayer, J. Changes in Soil Carbon and Crop Yield over 60 Years in the Zurich Organic Fertilization Experiment, Following Land-Use Change from Grassland to Cropland. J. Plant Nutr. Soil Sci. 2014, 177, 696–704. [Google Scholar] [CrossRef]
  90. Leifeld, J.; Bassin, S.; Fuhrer, J. Carbon Stocks in Swiss Agricultural Soils Predicted by Land-Use, Soil Characteristics, and Altitude. Agric. Ecosyst. Environ. 2005, 105, 255–266. [Google Scholar] [CrossRef]
  91. Smith, P.; Martino, D.; Cai, Z.; Gwary, D.; Janzen, H.; Kumar, P.; McCarl, B.; Ogle, S.; O’Mara, F.; Rice, C.; et al. Greenhouse Gas Mitigation in Agriculture. Philos. Trans. R. Soc. B Biol. Sci. 2008, 363, 789–813. [Google Scholar] [CrossRef] [Green Version]
  92. Paustian, K.; Parton, W.J.; Persson, J. Modeling Soil Organic Matter in Organic-Amended and Nitrogen-Fertilized Long-Term Plots. Soil Sci. Soc. Am. J. 1992, 56, 476–488. [Google Scholar] [CrossRef]
Figure 1. Relationship between measured and simulated soil C stocks at 0–0.20 m depth for the (A) farm-scale study; and (B) for the Nafferton Factorial Systems Comparison (NFSC) trial. Each yellow point represents a study site soil C stock mean of a minimum of four and a maximum of 15 spatial replications. The horizontal bars represent standard errors around the mean measured soil C stocks due to spatial replications (n = 8–15 for the farm-scale study and n = 4 for the NFSC trial). The dashed line is the 1:1 line and the solid line is the linear regression line.
Agronomy 13 01093 g001
Figure 2. Long-term simulations of soil C stocks at 0–0.20 m depth of the farm-scale study in (A) conventional system, (B) organic system and (C) for the Nafferton Factorial Systems Comparison (NFSC) trial. Grazing regime represented by non-grazed—NG and/or grazed—GG. Treatments in the NFSC trial include crop rotation (conventional—CONV-RT and organic—ORG—RT) and fertility sources (mineral—MINE and compost—COMP). Dots represent measured mean soil C stock values in 2017 for A and B and in 2011 and 2018 for C.3.3 Soil C stock changes in the long-term simulations and hypothetical scenarios.
Agronomy 13 01093 g002
Figure 3. Long-term simulations of soil C stocks at 0–0.20 m depth of the hypothetical scenarios under the conventional system: (A) non-grazed, (B) grazed; and organic system: (C) non-grazed, (D) grazed. The reference for rates of SOC stocks change is the average of the measured (2017) soil C stocks in the conventional system: 51.01 Mg ha1 (n = 6); and organic system: 48.81 Mg ha1 (n = 6). The numbers 1–11 represent hypothetical scenarios as described in Section 2.6 “Long-term scenarios”.
Agronomy 13 01093 g003
Table 1. Hypothetical long-term scenarios run to solely capture the effects of the implementation of alternative management practices (grazing regimes, length of grass–clover ley periods in crop rotations) in the conventional and organic agricultural system.
Scenario N°RotationLey Period in YearsGrazed
1Four-year arable cropping0No
2Four-year arable cropping2No
3Four-year arable cropping4No
4Four-year arable cropping6No
5Four-year arable cropping8No
6Four-year arable cropping2Yes
7Four-year arable cropping4Yes
8Four-year arable cropping6Yes
9Four-year arable cropping8Yes
10Permanent grass–clover-No
11Permanent grass–clover-Yes
Four-year arable rotations for each agricultural system based on the last 10-year period crops grown at Nafferton farm; conventional rotation characterised by a hypothetical rotation of winter wheat (Triticum aestivum), winter barley (Hordeum vulgare), oilseed rape (Brassica napus) and potatoes (Solanum tuberosum); organic rotation characterised by a hypothetical rotation of spring wheat, spring barley, beans (Phaseolus vulgaris) and potatoes; grass–clover leys characterised by white (Trifolium repens), red clover (Trifolium pratense) and perennial ryegrass (Lolium perenne), regardless of the agricultural system; ley periods in the non-grazed scenarios simulated with three harvests for silage events per year; ley periods in the grazed scenarios simulated with light cattle stocking rates (1–1.5 livestock units ha−1); grazing activities simulated from the beginning of May to end August; typical tillage operations (ploughing and disking) were simulated between each arable crop in both agricultural systems.
Table 2. Measured and simulated soil C stocks at 0–0.20 m depth for the farm-scale study, encompassing agricultural system (conventional—CONV and organic—ORG) and grazing regime (non-grazed—NG and grazed—GG), and for the Nafferton Factorial Systems Comparison (NFSC) trial treatments, including crop rotation (conventional—CONV-RT and organic—ORG-RT), fertility source (mineral—MINE and compost—COMP) and year of sampling (2011 and 2018).
TreatmentsSoil C StockDeviation between Measured and Simulated
MeasuredSimulatedDifference
Farm-scaleMg ha−1%
Agricultural system
CONV50.24 (1.03)50.47 (2.64)−0.23 (0.81)0.46 (1.59)
ORG49.51 (1.05)47.96 (2.28)1.55 (0.62)−3.13 (1.32)
Grazing regime
GG53.72 (0.86)51.84 (1.98)1.88 (0.56)−3.50 (1.11)
NG43.48 (0.60)43.97 (0.26)−0.49 (0.17)1.13 (0.39)
NFSC trial
Crop rotation
CONV-RT39.78 (0.71)40.39 (0.65)−0.61 (0.03)1.53 (0.09)
ORG-RT41.99 (0.63)41.55 (0.36)0.44 (0.14)−1.05 (0.32)
Fertility source
MINE41.19 (0.69)40.67 (0.54)0.52 (0.07)−1.26 (0.17)
COMP40.59 (0.85)41.26 (0.66)−0.67 (0.09)1.65 (0.25)
Year
201139.60 (0.86)40.27 (0.39)−0.67 (0.24)1.69 (0.60)
201842.18 (0.50)41.67 (0.55)0.51 (0.03)−1.21 (0.07)
The data are measured and simulated mean values for the farm-scale study, n = 67 for conventional system, n = 59 for organic system, n = 47 for non-grazed regime and n = 79 for grazed regime, for the NFSC trial, n = 32 for crop rotation, fertility source and year of sampling. The standard error of the mean is in parentheses.
Table 3. Statistical metrics, including correlation coefficient (r), root mean square error (RMSE), mean difference (M), relative error (E) and lack of fit (LOFIT), applied for the validation between measured and DayCent model-simulated soil C stocks (0–0.20 m) for the farm-scale study and the Nafferton Factorial Systems Comparison (NFSC) trial.
Statistical MetricsFarm-ScaleNFSC Trial
r = correlation coefficient0.930.81
F = ((n − 2) r2)/(1 − r2)64.1411.79
F-value at p = 0.054.965.99
RMSE = root mean square error of model0.050.03
RMSE95% (Confidence limit)0.080.14
M = mean difference0.70−0.08
t = Student’s t of M1.050.17
t value critical at 2.5% (two-tailed)2.232.45
E = relative error1.40−0.20
E95% (confidence limit).7.0412.72
LOFIT = lack of fit588.7751.76
F = MSLOFIT/MSE *1.570.95
F critical at 5%1.912.42
* MS = mean squared; MSE = mean squared error.
Table 4. Model sensitivity in the simulation of soil C stocks for the farm-scale study, encompassing agricultural system (conventional—CONV and organic—ORG) and grazing regime (non-grazed—NG and grazed—GG), and for the Nafferton Factorial Systems Comparison (NFSC) trial treatments, including crop rotation (conventional—CONV-RT and organic—ORG-RT), fertility source (mineral—MINE and compost—COMP) and year of sampling (2011 and 2018), to different input parameters.
TreatmentsVariables/Parameters
Daily Air TemperatureDaily PrecipitationpHClay ContentBulk Density
−1 °C+1 °C−10%+10%−1 Unit+1 Unit−10%+10%−10%+10%
Farm-scale% change
Agricultural system
CONV−0.97 (0.91)0.95 (0.77)1.88 (0.17)−1.40 (0.18)6.48 (0.25)−1.76 (0.06)−2.90 (0.13)3.85 (0.11)0.09 (0.06)0.06 (0.02)
ORG−0.86 (1.05)0.97 (0.59)1.52 (0.04)−1.35 (0.02)6.51 (0.20)−1.76 (0.05)−2.87 (0.13)3.99 (0.13)0.44 (0.07)−0.09 (0.03)
Grazing regime
GG−1.86 (0.54)1.71 (0.49)1.55 (0.04)−1.38 (0.07)6.23 (0.15)−1.70 (0.03)−3.05 (0.08)3.84 (0.12)0.25 (0.04)−0.06 (0.02)
NG0.99 (0.45)−0.53 (0.33)2.00 (0.23)−1.37 (0.25)7.03 (0.09)−1.90 (0.02)−2.57 (0.06)4.07 (0.06)0.29 (0.21)−0.03 (0.08)
NFSC trial
Crop rotation
CONV-RT1.41 (0.08)−1.11 (0.09)3.41 (0.22)−3.15 (0.12)8.23 (0.09)−2.29 (0.03)−2.01 (0.06)2.39 (0.05)0.20 (0.02)0.07 (0.02)
ORG-RT0.25 (0.18)−0.28 (0.19)3.29 (0.07)−2.63 (0.08)7.91 (0.08)−2.20 (0.01)−1.71 (0.11)2.32 (0.05)0.52 (0.04)−0.10 (0.03)
Fertility source
MINE0.85 (0.41)−0.69 (0.32)3.63 (0.16)−2.94 (0.16)8.16 (0.11)−2.27 (0.03)−1.75 (0.11)2.36 (0.04)0.40 (0.09)−0.04 (0.05)
COMP0.81 (0.31)−0.70 (0.24)3.06 (0.82)−2.84 (0.19)7.98 (0.13)−2.22 (0.03)−1.97 (0.08)2.36 (0.07)0.31 (0.10)0.01 (0.02)
Year
20111.02 (0.27)−0.92 (0.19)3.85 (0.73)−3.04 (0.16)8.10 (0.09)−2.25 (0.03)−1.84 (0.07)2.28 (0.07)0.39 (0.11)−0.06 (0.06)
20180.64 (0.41)−0.46 (0.29)3.84 (0.56)−2.74 (0.15)8.05 (0.15)−2.24 (0.04)−1.88 (0.15)2.43 (0.04)0.32 (0.08)0.02 (0.05)
Disclaimer/Publisher’s Note: The statements, opinions and data contained in all publications are solely those of the individual author(s) and contributor(s) and not of MDPI and/or the editor(s). MDPI and/or the editor(s) disclaim responsibility for any injury to people or property resulting from any ideas, methods, instructions or products referred to in the content.

