Article

Predicted Soil Greenhouse Gas Emissions from Climate × Management Interactions in Temperate Grassland

by
Arlete S. Barneze
1,2,3,*,
Mohamed Abdalla
4,
Jeanette Whitaker
2,
Niall P. McNamara
2 and
Nicholas J. Ostle
1
1
Lancaster Environment Centre, Lancaster University, Lancaster LA1 4YQ, UK
2
UK Centre for Ecology & Hydrology, Lancaster Environment Centre, Library Avenue, Bailrigg, Lancaster LA1 4AP, UK
3
Soil Biology Group, Wageningen University & Research, P.O. Box 47, 6700 AA Wageningen, The Netherlands
4
Institute of Biological and Environmental Sciences, School of Biological Sciences, University of Aberdeen, 23 St. Machar Drive, Aberdeen AB24 3UU, UK
*
Author to whom correspondence should be addressed.
Agronomy 2022, 12(12), 3055; https://doi.org/10.3390/agronomy12123055
Submission received: 26 August 2022 / Revised: 20 November 2022 / Accepted: 23 November 2022 / Published: 2 December 2022
(This article belongs to the Special Issue Advance in Grassland Productivity and Sustainability)

Abstract

:
Grassland management practices and their interactions with climatic variables have significant impacts on soil greenhouse gas (GHG) emissions. Mathematical models can be used to simulate the impacts of management and potential changes in climate beyond the temporal extent of short-term field experiments. In this study, field measurements of nitrous oxide (N2O), carbon dioxide (CO2), and methane (CH4) emissions from grassland soils were used to test and validate the DNDC (DeNitrification-DeComposition) model. The model was then applied to predict changes in GHG emissions due to interactions between climate warming and grassland management in a 30-year simulation. Sensitivity analysis showed that the DNDC model was susceptible to changes in temperature, rainfall, soil carbon and N-fertiliser rate for predicting N2O and CO2 emissions, but not for net CH4 emissions. Validation of the model suggests that N2O emissions were well described by N-fertilised treatments (relative variation of 2%), while non-fertilised treatments showed higher variations between measured and simulated values (relative variation of 26%). CO2 emissions (plant and soil respiration) were well described by the model prior to hay meadow cutting but afterwards measured emissions were higher than those simulated. Emissions of CH4 were on average negative and largely negligible for both simulated and measured values. Long-term scenario projections suggest that net GHG emissions would increase over time under all treatments and interactions. Overall, this study confirms that GHG emissions from intensively managed, fertilised grasslands are at greater risk of being amplified through climate warming, and represent a greater risk of climate feedbacks.

1. Introduction

Grassland ecosystems are a major regulator of biosphere greenhouse gases (GHG), with emissions often linked to prescribed management practices [1]. Depending on the magnitude of GHG emissions into and out of grasslands, and considering interactions between climate and management, they can either be a net source or sink for GHGs. Therefore, understanding the future trajectory of grassland soil GHG emissions is important for developing mitigation options in a warming world.
Rising global annual temperatures could alter grassland carbon (C) and nitrogen (N) cycling through impacts on soil processes with feedbacks to plant growth and soil C sequestration. This will in turn affect the rate and direction of GHG exchanges with the atmosphere. Warming is expected to increase CO2 emissions and reduce methane (CH4) uptake due to greater soil microbial activity and decomposition of soil organic C and N [2,3]. Warming is likely to accelerate soil N cycling, resulting in higher nitrous oxide (N2O) emissions [4,5]. However, variations in the warming effect on grassland soil nutrient cycling could result from interactions between temperature and different management practices including mineral N-fertiliser application and grazing/cutting.
The combined effect of mineral N-fertiliser application and warming has the potential to accelerate N mineralisation with synergetic interactive effects on plant available N [6], and microbial N2O production. It may also increase soil respiration rates due to raised metabolic cycling [7], and decrease CH4 uptake by inhibiting methanotrophs [8]. The interactive effect of clipping and mineral N-fertiliser application are likely to augment N2O emissions and soil respiration due to increase rhizodeposition [9,10]. Previous work has shown the interactive effects of climate and management on GHGs emissions in the field [11], however, the significance of these effects in the longer term is still uncertain.
Studies have demonstrated considerable variations in temporal and spatial GHG emissions, especially for N2O, from a range of managed systems including grasslands [12,13]. However, over the last decade progress has been made using mathematical models to simulate soil processes responsible for production, consumption and transport of GHGs, e.g., DNDC, Daycent, ECOSSE [4,14,15]. These models can be used to predict grassland GHG emissions and simulate alternative scenarios such as changes in climate grazing intensity or nutrient management [16]. Mathematical models can be applied in different ways including at the site-scale to interpolate missing measurements, to extrapolate spatially and dynamically results from experimental plots, and to look at past and future time periods [17]. These models include similar components (e.g., soil physics, decomposition, plant growth and N transformations), using algorithms to represent these key processes.
The DeNitrification DeComposition (DNDC) model is a process-oriented simulator of soil C and N biogeochemistry at a sub-daily time step, developed to assess N2O, NO, N2 and CO2 emissions from agricultural soils [18,19,20]. It was originally developed in the USA, but it has been used to study ecosystems in China [21], Canada [22] and across Europe [4,23]. It has been applied to grassland [24,25,26,27], cropland [28,29,30] and forest ecosystems [31,32]. The model has reasonable data requirements and is suitable for simulations at a range of temporal and spatial scales depending on its configuration (i.e., site-specific [33], landscape DNDC [34]).
The aims of this study were: (i) to assess the reliability of the DNDC-model for estimating GHG (N2O, CO2 and CH4) emissions from a temperate grassland under different management and climate warming treatments; (ii) to explore the long-term effects of management, climate and their interactions, on grassland GHG emissions in a 30-year simulation.

2. Materials and Methods

2.1. Description of Field Experiment and DNDC Model

A field experiment was established in 2015 in a managed grassland in northern England using a full-factorial design for evaluating the interactive effects of warming, N addition and cutting on grassland net GHG emissions totalling eight treatment combinations with five replicates across five blocks. A non-N-fertiliser, non-warmed and non-AGB removal treatment was assigned as the control. Where we refer to non-N-fertilised treatments in the text we are referring to all treatments that did not receive N-fertiliser regardless if it was warmed and/or if the AGB was removed. Warming was achieved using open-top passive warming chambers [35], which increased air temperatures by on an average of 2 °C according to estimated increase in the average surface temperature by the end of the century [36]. Nitrogen addition was applied as ammonium nitrate (NH4NO3) at a rate of 100 kg N ha−1 y−1, and cutting was carried out when plants reached 5 cm height (total of six times per year). Measurements of GHG emissions (using dark static chambers), microclimate and soil properties were taken over a 2 year time period, more intensively during both 2015 and 2016 growing seasons. More information and details about the field experiment can be found in Barneze et al. [11]. The DNDC model (version 9.5, University of New Hampshire, Durham, NH, USA; www.dndc.sr.unh.edu (accessed on 22 November 2022)) was tested against the data obtained from the Hazelrigg grassland field experiment [11] and then used to predict future scenarios for 30-year changes for the interactions between climate warming and grassland management.
The DNDC model contains four main sub-models: soil climate, crop growth, decomposition and denitrification [18,37]. The soil climate sub-model calculates hourly and daily soil temperature and moisture as water-filled pore space (WFPS). The crop growth sub-model simulates crop biomass accumulation and partitioning; the decomposition sub-model calculates decomposition, nitrification, NH3 volatilisation and CO2 production (heterotrophic and autotrophic respiration). The denitrification sub-model tracks the sequential biochemical reduction from nitrate (NO3) to NO2, NO, N2O and N2 based on soil redox potential and dissolved organic C.

2.2. DNDC-Model Calibration, Validation and Sensitivity Tests

The model was calibrated using site-specific features including soil texture, bulk density, pH and soil organic C (SOC) from the site. Meteorological parameters including daily temperature (°C; minimum and maximum), daily precipitation (mm) and wind speed (m s−1) were obtained from a co-located weather station at Hazelrigg for the period from 1977 to 2016. Details of climate and soil property input data for the DNDC model are listed in Table 1.
The model was initialised (pre-run) for 30 years under the historic site management, i.e., 30 sheep per hectare. Following this initialisation step, simulation scenarios were carried out to reflect the management strategy from each experimental treatment (warming, N addition, cutting and interactions) for the field measurement years of 2015 and 2016. The model was run with perennial grassland specified using default vegetation parameters (e.g., grass yield, root fraction, water demand) from the DNDC model.
The DNDC model was validated using the data collected over the 2015 and 2016 growing seasons. This comprised 14 GHG measurement campaigns over the two years. The model testing was conducted by: (1) comparing the measured and modelled temporal pattern of N2O, CO2 and CH4 emissions, and (2) comparing the measured and modelled cumulative GHG emissions. Seasonal cumulative emissions were calculated as the sum of daily measured/modelled emissions over the same period [28].
In order to test the general behaviour of the DNDC model a sensitivity analysis as described in Li et al. [18] was executed. The response of the model and its constituent sub models to a range of model parameters were tested by varying a single parameter whilst fixing others during one cycle of the model. The tested parameters were air temperature, rainfall, initial SOC and N-fertiliser application rate.

2.3. Long-Term Scenarios

In order to project forward over a longer time series than measured in this study, and to test the range of interactions, a climate dataset from Hazelrigg weather station (1977–2016) was obtained. For this projection historic daily air temperature and rainfall were used, assuming no climate change or variation in atmospheric CO2 concentrations. The climate conditions (air temperature and rainfall) in the long-term scenario considered the average of each day of the year from 1977–2016. This component of the work predicted 30-year changes (up to 2047) in GHG’s (N2O, CO2 and CH4) emissions under management (cutting and N addition) with interactions with climate warming (increase in temperature by average of 2 °C). Emissions of N2O and CH4 were converted to use the concept of global warming potential (GWP), where the GWP value for N2O is 273 and for CH4 (based on a 20 and 100-yr time horizon) is 81.2 and 27.9, respectively [39]. SOC model change was used instead of CO2 emissions to calculate GWP.

2.4. Statistical Analysis

The DNDC model accuracy and performance were evaluated by calculating the root mean square error (RMSE), relative deviation (RD) and regression coefficient (r2) between measured and simulated values. The RMSE measured absolute prediction error as suggested by Smith et al. [40], but in a quadratic sense, and is, therefore, more sensitive to outliers (Equation (1)). The RD of the simulated flux from measured flux values was calculated by the following Equation (2).
RMSE = i = 1 n   ( P i O i ) 2 n
RD = ( P i O i ) O i × 100
where Oi are the observed values, Pi are the simulated values, n are the total number of observations and i the current observation.

3. Results

3.1. Simulation of GHG (N2O, CO2 and CH4) Emissions from the Full-Factorial Field Experiment over Two Growing Seasons

Daily N2O emissions from the field treatments were described by the DNDC-model (Figure 1, Figure 2, Figure 3 and Figure 4 and Figures S1–S4) with an r2 between simulated and measured of 0.4, and RMSE (g N2O-N ha−1 d−1) of 3.2. The cumulative N2O emissions showed a better fit (Table 2, r2 = 0.87, RMSE = 206), although the r2 may be overestimated due to a higher noise in the data (lower and higher values), leading to overfitting the modelled values.
The direction of deviation was different between 2015 and 2016, and this is likely because the model under-estimated N2O emissions in 2015 when measured emissions were much higher (Table 2). The simulation of N2O with N-fertiliser treatments (100 kg N ha−1) gave a relative deviation from measured data of −48 and 51% for 2015 and 2016, respectively. Emissions from the no-N-fertiliser plots were poorly described by the DNDC-model, with relative deviations from the measured ranging from −102% to 65% (Table 2). The average relative variation for all fertilised treatments was 2%, while for all non-N-fertilised treatments it was −26%.
Simulation of soil respiration was consistent with field measurements prior to 200 Julian days but then overestimated after cutting the hay meadow which took place on the 195 (14 July 2015) and 185 Julian days (3 July 2016) (Figure 1, Figure 2, Figure 3 and Figure 4 and Figures S1–S4, Table 3, r2 = 0.34, RMSE = 6.1). Differences between measured and simulated seasonal emissions for all treatments ranged from −1.68 to 9.83 kg CO2-C ha−1. Modelling output for CO2 emissions for all treatments was overestimated by an average of 34 and 28% for the 2015 and 2016 seasons, respectively. Differences in the temporal pattern of CO2 emissions between measured and simulated values were also particularly large after cutting hay meadow in both years.
The DNDC model predicted low or negative CH4 emissions, which agree with the field measurements (Figure 1, Figure 2, Figure 3 and Figure 4 and Figures S1–S4, Table 4, r2 = 0.21, RMSE = 3.6) regardless of the treatment effect. Differences between measured and simulated seasonal emissions for all treatments ranged from 6.15 to 2.03 g CH4-C ha−1. Model output predicted a higher CH4 sink compared to measured values and the difference between measured and simulated seasonal emissions for all treatments was −2.68 g CH4-C ha−1. Differences in seasonal CH4 emissions were larger under warming treatments, but in agreement with measured values.

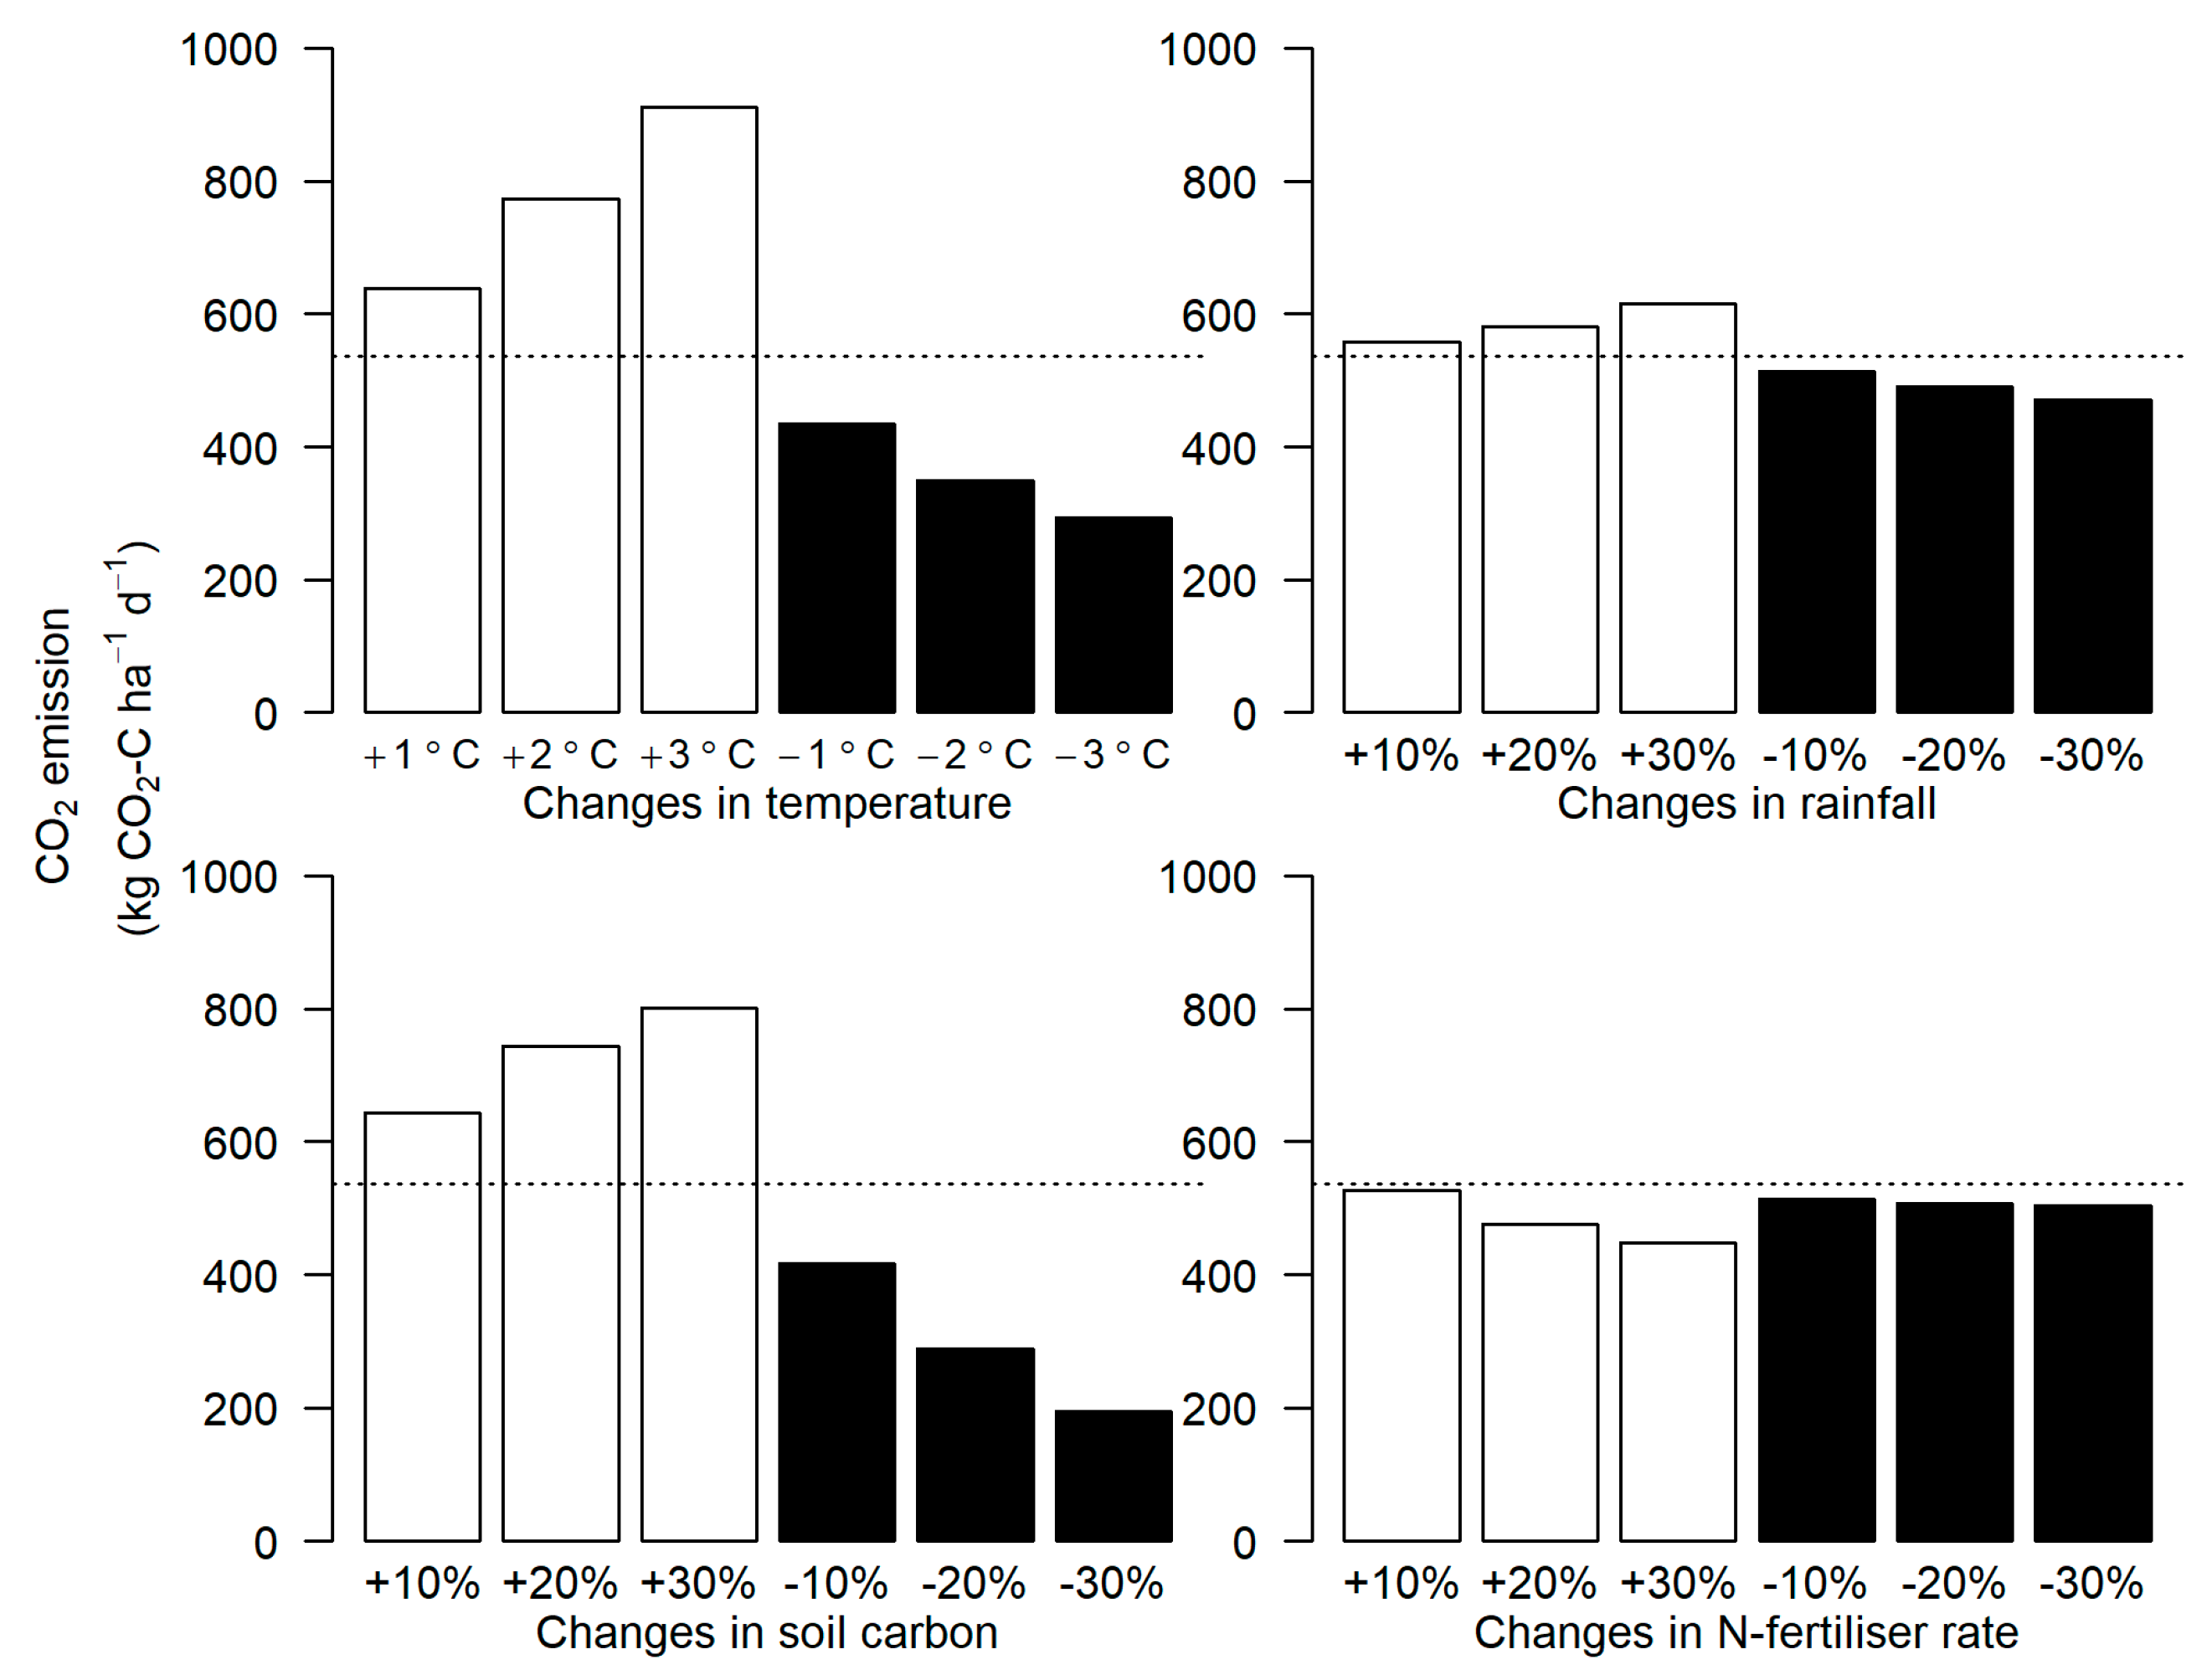
3.2. Sensitivity Analysis to GHG Emissions

The DNDC model was highly sensitive to changes in these input parameters for predicting N2O and CO2 emissions (Figure 5 and Figure 6); however, it was not sensitive for net CH4 emission. Increases in air temperature by 3 °C doubled N2O emissions while a decrease of 3 °C reduced emissions by 33%. Changes in rainfall were the most influential parameter (Figure 5) with a 73% increase in N2O emissions when rainfall was increased by 30% and a decrease of 46% when rainfall was reduced by 30%. SOC was also important parameter promoting changes in N2O emissions. An increase of 30% in SOC doubled N2O emissions, while the same decrease reduced emissions by 40%. An increase of N-fertiliser rate application of 30%, augment N2O emissions by 46%, however, a decrease of 30% reduced it only by 26%.
Plant and soil respiration was sensitive to changes in air temperature and SOC but largely invariant with changes to N-fertilisation and rainfall (Figure 6). An increase of 3 °C increased CO2 emissions by 70%, while a decrease of 3 °C reduced it by 50%. As expected, changes in SOC strongly influenced CO2 emissions; an increase of 30% in SOC increased emissions by 49%, while the corresponding decrease reduced emissions by 63%. Changes in rainfall did not significantly alter CO2 emissions; increasing or decreasing rainfall by 30% led to changes in CO2 emissions by +14% and −12%, respectively. Increases of the N-fertiliser application rate by 30% reduced emissions by 16% and decreasing N-fertiliser application rate by the same amount had a negligible effect.

3.3. Simulation of Long-Term GHG Changes under Field Treatments

The DNDC model was used to estimate GHG (N2O, CH4), SOC and net GHG emissions under a long-term (30-year) simulation for all field treatments (Table 5). Results showed that under all treatments, the net GHG emission was increased over time (Table 5). The warming treatment, with a 2 °C increase in air temperature, increased only 1% the net GHG emissions compared to the control treatment. The effect of N-fertiliser application had the greatest impact on the net GHG emissions for the main effect treatments. Changes in the net GHG emissions in the cutting treatment were 23% higher when compared to the control treatment. Interactive effects showed greater increases in the net GHG emissions compared to singular main effect treatments. Here, the net GHG emissions from interaction between N addition and warming increased by 20%, from cutting and N addition decreased by 7% and that from the three-way interaction increased by 23% compared to the N-fertiliser treatments. Additionally, net GHG emissions from interaction between cutting and warming increased by 38% compared to the control treatment (Table 5). Emissions of N2O were the greatest determinant of changes in net GHG emissions, and showed that when N is interacting with climate (warming) or management (cutting) the net emissions of N2O was greater (1.2 and 1.5 t CO2 eq ha−1 y−1, respectively, Table 5). Similarly for warming (0.147 t CO2 eq ha−1 y−1) or cutting (0.109 t CO2 eq ha−1 y−1) versus warming or cutting + interaction (0.164 t CO2 eq ha−1 y−1).

4. Discussion

4.1. DNDC Effectiveness for Simulating GHG Emissions

Seasonal emissions of N2O from the N-fertilised treatments were fairly described by the DNDC-model, with differences between measured and modelled values ranging from 3.14 to 242 g N ha−1 and with simulations over and underestimating emissions (Table 2). There was a large variation in the non-N-fertilised treatments which can be related to the very low N concentration in the soil. The average relative variation between measured and simulated emissions for the N-fertilised treatments was −2%. Similar deviations using the DNDC model have been reported for grassland by Hsieh et al. [41] (337 kg N ha−1; 33% deviation) and by Abdalla et al. [4] for medium and high N-fertiliser input scenarios in arable fields (79 kg N ha−1; 20% deviation and 159 kg N ha−1; 6% deviation). The deviations between simulated and measured annual N2O emissions from managed European grasslands were also high being approximately 100% [42]. Deviations increase significantly, as fertiliser input is reduced [4]. No studies to date have tested how well the DNDC model predicts GHG emissions from interactive treatments, i.e., climate warming and grassland management.
In general, the temporal pattern of N2O emissions was different between measured and simulated data; DNDC extended the influence of added N-fertiliser over a wider time-period and produced smaller peaks. In most cases the model captured N2O peaks but these often occurred earlier than in the observed data (1–2 days before). This difference in peak times can be explained in part due to the representation of WFPS in the model, which was overestimated in parts of the growing season of 2015. The differences between measured and simulated WFPS were 26% and 3% for 2015 and 2016, respectively (Table S1). WFPS is a critical determinant of N2O emissions after N-fertiliser application [43], as it affects the microbial activity in the soil, affecting aerobic-anaerobic processes. Denitrification is considered the major process of N2O production in soils [44] with higher WFPS (>70%), while nitrification is the main process when the WFPS decreases to 60% [45]. Similar discrepancies between DNDC simulations and field measurements of soil water content were also observed by others (Abdalla et al. [4], Kröbel et al. [46] and Chirinda et al. [47]). Sensitivity analysis of the model highlights the importance of soil moisture in driving N2O emission with a 20% increase in rainfall approximately doubling the N2O emissions and most likely associated with the stimulation of denitrification [48]. Denitrification is also known to be highly sensitive to changes in temperature, as an increase in 3 °C in air temperature doubled N2O emissions. Increases in temperature can enhance soil respiration and microbial activity, leading to an increase of anaerobic sites, which favour the denitrification process [48]. Nitrification is also affected by temperature and has a close relationship with the seasonal variations in soil and air temperature; N2O emissions have been observed to increase exponentially with increasing soil temperature [49]. Overall, changes in soil moisture and temperature have been shown to explain up to 95% of the temporal changes in N2O emissions [48].
In the non-N-fertilised treatments, the small range of emissions (0.01 to 0.92 g N2O-N ha−1) was weakly described by the DNDC model (RD = −26%). Part of the reason for these observed differences may be associated with the DNDC model not predicting negative emissions, which may lead to an overestimation in the modelled N2O flux. These results are similar to other studies where larger RD has been observed between measured and simulated emissions under unfertilised conditions [4,50]. Nevertheless, on occasions, the model was very effective in simulating smaller N2O peaks.
N-fertilised treatments were the greatest driving force of N2O flux from soils and this was reflected in the outputs of the DNDC-model. Annual emissions increased by 20% when N-fertiliser was increased by 10%, and by 42% when the rate of N-fertiliser was 30% higher. Similarly, N2O emissions decreased with a reduction in N-fertiliser application rate. The application of N-fertiliser directly influences the amount of NH4+ and NO3 available in the soil, reflecting on N2O emissions from soils. The model was also sensitive to SOC [4]; with a 20% increment in SOC corresponding to a 40% increase in N2O emissions. This agrees with findings from Beheydt et al. [51] who found a difference on average of 20% in N2O emissions between the highest (+15%) and lowest (15%) SOC content. The availability of soil C has a great impact on the activities of microorganisms, consequently affecting cycling and turnover of nutrients and linking to N2O emissions from soils.
The DNDC model simulated changes in CO2 emissions over time and across the field treatments fairly well, but overestimated them by on average 21% compared to measured data. The simulated and measured CO2 emissions were higher in the year 2015 compared to 2016. The differences between simulated and measured were 30% in 2015 and 23% in 2016. This might be due to the increase in simulated soil temperature causing consumption of organic matter by microbes, increasing microbial and root activity [52]. Temperature was important for driving changes in CO2 emissions (3 °C increase, increased emissions by 70%; Abdalla et al. [53]) no matter how other input parameters were modified. Likewise, soil moisture was an important driver for CO2 emissions, e.g., a 14% increase in CO2 flux after a 30% increase in rainfall. It is likely that soil moisture might impact C mineralisation, by optimising the condition for microbial activities, increasing microbial oxygen consumption and CO2 production from the soil [54].
Differences between measured and simulated CH4 emissions were marginal and consistent with the overall low CH4 emissions observed in the field experiment for all treatments. Cumulative CH4 differences between measured and simulated were particularly higher under warming treatments compared to the other treatments. As pointed out previously, a higher simulated soil temperature compared to the measured data may be the reason for the difference in CH4 uptake in soils. Although there is a lack of correlation between soil temperature and CH4 uptake, many measurements show that CH4 oxidation is sensitive to temperature variation [55]. However, the warming treatment simulation did not consider the potential changes in the measured soil moisture. Therefore, the differences between measured and simulated CH4 uptake might be due to the indirect effect of warming (decreases in soil water content).

4.2. Long-Term Effect of the Interactions between Grassland Management and Climate Warming

Whilst DNDC showed some limitations by over-/under-estimating absolute values of GHG emissions under the various treatments it is still a very useful tool for exploring long-term scenarios. In this context, the model was used to estimate longer-term effects of the treatments on GHG emissions over 30 years into the future. The net GHG emissions estimated for Hazelrigg grassland soils range between 0.04 to 1.5 t CO2 eq ha−1 y−1. By extrapolating to the UK grassland cover area, this is equivalent to a CO2 source of 7.2 Mt CO2 eq. y−1, i.e., 7.5% of the UK energy supply emissions based on 2019 estimation [56]. This extrapolation needs to be interpreted with caution, as there are large uncertainties in the modelling values, for example estimations do not taking impacts of animal grazing into account, so may be underestimated. Grazing animals are estimated to emit 24 and 3.5 Mt CO2- eq. [57] via enteric fermentation and deposition of urine and faeces to the soil, respectively. The N2O emissions estimated for the long-term simulation (0.11 t CO2 eq. ha−1 y−1) are similar to other grasslands soils in Europe (0.14 t CO2 eq. ha−1 y−1, Soussana et al. [58]) and in the UK (0.13 t CO2 eq. ha−1 y−1, Levy et al. [26]).
Warming effects per se decreased net GHG emissions by 15% in 2047, contradicting studies which suggest that an increase in air temperature would increase CO2 emissions [59,60], although these contradicting studies indicated a reduction in above-ground productivity over nine years of warming [61]. However, there are large uncertainties around this result, as the simulation does not account for differences in rainfall events and consequently, changes in soil moisture under warming treatments which might have a larger impact on N2O emissions [5]. Further, recent studies [62,63,64] demonstrate an acclimation of ecosystems whereby microbes over-ride the increase in temperature, limiting substrate mineralisation and consequently soil respiration.
N-fertilised treatments caused a greater increase in net GHG emissions over 30 years of simulation compared to non-N-fertilised treatments, especially in relation to N2O emissions, agreeing with findings of Hsieh et al. [41]. Similar results were also found by Saggar et al. [27] who showed that N2O remained elevated in N-fertilised treatments for 10 years, even after ceasing N-fertiliser application. The simulations indicated that a long-term N-fertiliser application had a longer impact on N2O emissions compared to a short-term effect [65]. The N2O emissions have a threshold response to N, i.e., the amount of N lost to the atmosphere depends on the N uptake by plants [66].
Interestingly, an increase in the frequency of cutting per year did not have a significant long-term effect on the simulated net GHG emissions (+6%), although observed changes were found for CO2 and N2O emissions in the field measurements [11]. Similarly, LeCain et al. [67] did not find any changes in photosynthetic, soil respiration and net CO2 exchange rates in grazed compared to non-grazed pastures. In a 30-year simulation study, Kang et al. [68] found a reduction of 17% in CO2 emissions with a moderate grazing. The authors related this to a reduction in above-ground litter input directly affecting soil respiration (decreased by 34%). Although mowing or grazing would have a pronounced impact at a large temporal-spatial scale, Li et al. [69] did not find that these were sensitive parameters for soil N storage. According to Han et al. [70], grazing acted as a net source in a 29-year of GHG simulation in China. Our experiment did not take into consideration different types of grassland (permanent or sown grasslands) and/or management intensity, which definitely might have various impact on overall greenhouse gas emissions in the long-term [71]. Therefore, the effect of cutting/grazing on long-term carbon dynamics is still a knowledge gap as well as its interaction with future climate.
Seasonally significant differences were found in the interactions between management and climate (N addition × warming, and cutting × N addition) over 2015 and 2016 [11]. Here, longer-term simulations showed that interactive effects were synergistic compared to singular treatments (in particular for the N treatments). Interactive effects, mainly relating to N-fertiliser application and the increase of air temperature, had greater impacts on N2O, CH4 emissions and SOC changes. This is an important outcome as it reflects real-world scenarios where many drivers co-occur.
IPCC research has produced emission scenarios for directing global models to simulate climate change scenarios taking into account the industrialisation activity and population growth, and determining temperature-sensitive scenarios described as low, medium, and high [72]. Studies have demonstrated that there are small differences between these scenarios (i.e., low and high) in relation to global GHG emissions, however they can vary about 3 to 17% compared to baseline scenarios [33,53,73]. The DNDC model is a means to compare different climate scenarios under different grassland management strategies. DNDC output interpretation should be cautious as the model needs to be further improved, especially with respect to the parameterisation of the crop module. Nonetheless, this work demonstrates the potential for interactions between climate and temperate grassland management to increase predicted GHG emissions with implications for future policy and practice.

5. Conclusions

This study shows that the DNDC-model was able to satisfactorily estimate GHG emissions from a temperate grassland, however some discrepancies for specific treatments and growing seasons did occur. These were mainly related to DNDC-model limitations (i.e., the need for model parameterisation), the use of unmeasured default values as inputs for the model and the great variability in the measured data. The model is very sensitive to changes in air temperature, rainfall, N-fertiliser rates and SOC parameters when simulating N2O and CO2 emissions. The long-term scenarios showed that intensively managed fertilised grasslands under a warming climate will lead to enhanced GHG emissions. Future studies should concentrate on simulating the long-term impact of different management scenarios and their interactions with climate warming. This will help decision-makers to advise on the most appropriate management strategies for mitigating GHG emissions and reducing the impact of managed grasslands on climate change.

Supplementary Materials

The following supporting information can be downloaded at: https://www.mdpi.com/article/10.3390/agronomy12123055/s1, Figure S1: Measured (filled circle) and simulated (solid line) N2O, CO2 and CH4 emissions from soils of the control treatments from the growing season of 2015 and 2016. Error bars are standard deviations for 5 replicates; Figure S2: Measured (filled circle) and simulated (solid line) N2O, CO2 and CH4 emissions from soils of the interaction between nitrogen and cutting treatment from the growing season of 2015 and 2016. Error bars are standard deviations for 5 replicates.; Figure S3: Measured (filled circle) and simulated (solid line) N2O, CO2 and CH4 emissions from soils of the interaction between warming and cutting treatment from the growing season of 2015 and 2016. Error bars are standard deviations for 5 replicates; Figure S4: Measured (filled circle) and simulated (solid line) N2O, CO2 and CH4 emissions from soils of the interaction between warming, cutting and nitrogen treatment from the growing season of 2015. Error bars are standard deviations for 5 replicates; Table S1: Measured and DNDC-simulated WFPS (%) for the full factorial experiment over two growing seasons.

Author Contributions

A.S.B., M.A., J.W., N.P.M. and N.J.O. designed the experiment; A.S.B., M.A., conducted the modelling with input from J.W., N.P.M. and N.J.O. and A.S.B. analysed the data and wrote the manuscript with extensive input from M.A., J.W., N.P.M. and N.J.O. All authors have read and agreed to the published version of the manuscript.

Funding

This research was funded by CAPES Foundation—Brazil (Science without Borders program), grant number 1263/2013-07. M.A. is funded by EU Horizon 2020 programme: SuperG project number 774124. UKCEH were supported by the Natural Environment Research Council award number NE/R016429/1 as part of the UK-SCAPE programme delivering National Capability.

Data Availability Statement

Not applicable.

Acknowledgments

The authors thank Pete Smith and his group at the University of Aberdeen for the help on the modelling approaches.

Conflicts of Interest

The authors declare no conflict of interest.

References

  1. Abdalla, M.; Smith, P.; Williams, M. Emissions of Nitrous Oxide from Agriculture: Responses to Management and Climate Change. In Understanding Greenhouse Gas Emissions from Agricultural Management; Guo, L., Gunasekara, A., McConnell, L., Eds.; American Chemical Society: Washington, DC, USA, 2011; Volume 1072, pp. 343–370. ISBN 9780841226548. [Google Scholar]
  2. Wang, X.; Liu, L.; Piao, S.; Janssens, I.A.; Tang, J.; Liu, W.; Chi, Y.; Wang, J.; Xu, S. Soil Respiration under Climate Warming: Differential Response of Heterotrophic and Autotrophic Respiration. Glob. Chang. Biol. 2014, 20, 3229–3237. [Google Scholar] [CrossRef] [PubMed]
  3. Dijkstra, F.A.; Morgan, J.A.; Follett, R.F.; Lecain, D.R. Climate Change Reduces the Net Sink of CH4 and N2O in a Semiarid Grassland. Glob. Chang. Biol. 2013, 19, 1816–1826. [Google Scholar] [CrossRef] [PubMed] [Green Version]
  4. Abdalla, M.; Wattenbach, M.; Smith, P.; Ambus, P.; Jones, M.; Williams, M. Application of the DNDC Model to Predict Emissions of N2O from Irish Agriculture. Geoderma 2009, 151, 327–337. [Google Scholar] [CrossRef]
  5. Bai, E.; Li, S.; Xu, W.; Li, W.; Dai, W.; Jiang, P. A Meta-Analysis of Experimental Warming Effects on Terrestrial Nitrogen Pools and Dynamics. New Phytol. 2013, 199, 431–440. [Google Scholar] [CrossRef] [PubMed]
  6. Rustad, L.E.; Campbell, J.L.; Marion, G.M.; Norby, R.J.; Mitchell, M.J.; Hartley, A.E.; Cornelissen, J.H.C.; Gurevitch, J. Gcte-News A Meta-Analysis of the Response of Soil Respiration, Net Nitrogen Mineralization, and Aboveground Plant Growth to Experimental Ecosystem Warming. Oecologia 2001, 126, 543–562. [Google Scholar] [CrossRef] [PubMed]
  7. Graham, S.L.; Hunt, J.E.; Millard, P.; McSeveny, T.; Tylianakis, J.M.; Whitehead, D. Effects of Soil Warming and Nitrogen Addition on Soil Respiration in a New Zealand Tussock Grassland. PLoS ONE 2014, 9, e91204. [Google Scholar] [CrossRef] [Green Version]
  8. Blankinship, J.C.; Brown, J.R.; Dijkstra, P.; Hungate, B.A. Effects of Interactive Global Changes on Methane Uptake in an Annual Grassland. J. Geophys. Res. Biogeosci. 2010, 115. [Google Scholar] [CrossRef] [Green Version]
  9. Guitian, R.; Bardgett, R.D. Plant and Soil Microbial Responses to Defoliation in Temperate Semi-Natural Grassland. Plant Soil 2000, 220, 271. [Google Scholar] [CrossRef]
  10. Bahn, M.; Knapp, M.; Garajova, Z.; Pfahringer, N.; Cernusca, A. Root Respiration in Temperate Mountain Grasslands Differing in Land Use. Glob. Chang. Biol. 2006, 12, 995–1006. [Google Scholar] [CrossRef]
  11. Barneze, A.S.; Whitaker, J.; McNamara, N.P.; Ostle, N.J. Interactions between Climate Warming and Land Management Regulate Greenhouse Gas Fluxes in a Temperate Grassland Ecosystem. Sci. Total Environ. 2022, 833, 155212. [Google Scholar] [CrossRef]
  12. Imer, D.; Merbold, L.; Eugster, W.; Buchmann, N. Temporal and Spatial Variations of Soil CO2, CH4 and N2O Fluxes at Three Differently Managed Grasslands. Biogeosciences 2013, 10, 5931–5945. [Google Scholar] [CrossRef] [Green Version]
  13. Rees, R.M.; Augustin, J.; Alberti, G.; Ball, B.C.; Boeckx, P.; Cantarel, A.; Castaldi, S.; Chirinda, N.; Chojnicki, B.; Giebels, M.; et al. Nitrous Oxide Emissions from European Agriculture—An Analysis of Variability and Drivers of Emissions from Field Experiments. Biogeosciences 2013, 10, 2671–2682. [Google Scholar] [CrossRef] [Green Version]
  14. Abdalla, M.; Richards, M.; Pogson, M.; Smith, J.U.; Smith, P. Estimating the Effect of Nitrogen Fertilizer on the Greenhouse Gas Balance of Soils in Wales under Current and Future Climate. Reg. Environ. Chang. 2016, 16, 2357–2368. [Google Scholar] [CrossRef] [Green Version]
  15. Fitton, N.; Datta, A.; Cloy, J.M.; Rees, R.M.; Topp, C.F.E.; Bell, M.J.; Cardenas, L.M.; Williams, J.; Smith, K.; Thorman, R.; et al. Modelling Spatial and Inter-Annual Variations of Nitrous Oxide Emissions from UK Cropland and Grasslands Using DailyDayCent. Agric. Ecosyst. Environ. 2017, 250, 1–11. [Google Scholar] [CrossRef] [Green Version]
  16. Smith, P.; House, J.I.; Bustamante, M.; Sobocká, J.; Harper, R.; Pan, G.; West, P.C.; Clark, J.M.; Adhya, T.; Rumpel, C.; et al. Global Change Pressures on Soils from Land Use and Management. Glob. Chang. Biol. 2016, 22, 1008–1028. [Google Scholar] [CrossRef]
  17. Smith, P.; Davies, C.A.; Ogle, S.; Zanchi, G.; Bellarby, J.; Bird, N.; Boddey, R.M.; McNamara, N.P.; Powlson, D.; Cowie, A.; et al. Towards an Integrated Global Framework to Assess the Impacts of Land Use and Management Change on Soil Carbon: Current Capability and Future Vision. Glob. Chang. Biol. 2012, 18, 2089–2101. [Google Scholar] [CrossRef]
  18. Li, C.; Frolking, S.; Frolking, T.A. A Model of Nitrous Oxide Evolution from Soil Driven by Rainfall Events: 1. Model Structure and Sensitivity. J. Geophys. Res. Atmos. 1992, 97, 9759–9776. [Google Scholar] [CrossRef]
  19. Li, C.; Frolking, S.; Harriss, R. Modeling Carbon Biogeochemistry in Agricultural Soils. Glob. Biogeochem. Cycles 1994, 8, 237–254. [Google Scholar] [CrossRef]
  20. Li, C.S.; Aber, J.; Stange, F.; Butterbach-Bahl, K.; Papen, H. A Process-Oriented Model of N2O and NO Emissions from Forest Soils: 1. Model Development. J. Geophys. Res. Atmos. 2000, 105, 4369–4384. [Google Scholar] [CrossRef]
  21. Li, C.; Zhuang, Y.; Cao, M.; Crill, P.; Dai, Z.; Frolking, S.; Moore, B.; Salas, W.; Song, W.; Wang, X. Comparing a Process-Based Agro-Ecosystem Model to the IPCC Methodology for Developing a National Inventory of N2O Emissions from Arable Lands in China. Nutr. Cycl. Agroecosystems 2001, 60, 159–175. [Google Scholar] [CrossRef]
  22. Smith, W.N.; Grant, B.B.; Desjardins, R.L.; Worth, D.; Li, C.; Boles, S.H.; Huffman, E.C. A Tool to Link Agricultural Activity Data with the DNDC Model to Estimate GHG Emission Factors in Canada. Agric. Ecosyst. Environ. 2010, 136, 301–309. [Google Scholar] [CrossRef]
  23. Kesik, M.; Brüggemann, N.; Forkel, R.; Kiese, R.; Knoche, R.; Li, C.; Seufert, G.; Simpson, D.; Butterbach-Bahl, K. Future Scenarios of N2O and NO Emissions from European Forest Soils. J. Geophys. Res. Biogeosci. 2006, 111. [Google Scholar] [CrossRef] [Green Version]
  24. Brown, L.; Jarvis, S.C.; Headon, D. A Farm-Scale Basis for Predicting Nitrous Oxide Emissions from Dairy Farms. Nutr. Cycl. Agroecosystems 2001, 60, 149–158. [Google Scholar] [CrossRef]
  25. Giltrap, D.L.; Li, C.; Saggar, S. DNDC: A Process-Based Model of Greenhouse Gas Fluxes from Agricultural Soils. Agric. Ecosyst. Environ. 2010, 136, 292–300. [Google Scholar] [CrossRef]
  26. Levy, P.E.; Mobbs, D.C.; Jones, S.K.; Milne, R.; Campbell, C.; Sutton, M.A. Simulation of Fluxes of Greenhouse Gases from European Grasslands Using the DNDC Model. Agric. Ecosyst. Environ. 2007, 121, 186–192. [Google Scholar] [CrossRef]
  27. Saggar, S.; Giltrap, D.L.; Li, C.; Tate, K.R. Modelling Nitrous Oxide Emissions from Grazed Grasslands in New Zealand. Agric. Ecosyst. Environ. 2007, 119, 205–216. [Google Scholar] [CrossRef]
  28. Cai, Z.C.; Sawamoto, T.; Li, C.S.; Kang, G.D.; Boonjawat, J.; Mosier, A.; Wassmann, R.; Tsuruta, H. Field Validation of the DNDC Model for Greenhouse Gas Emissions in East Asian Cropping Systems. Glob. Biogeochem. Cycles 2003, 17. [Google Scholar] [CrossRef] [Green Version]
  29. Li, Z.; Yang, J.Y.; Drury, C.F.; Yang, X.M.; Reynolds, W.D.; Li, X.; Hu, C. Evaluation of the DNDC Model for Simulating Soil Temperature, Moisture and Respiration from Monoculture and Rotational Corn, Soybean and Winter Wheat in Canada. Ecol. Model. 2017, 360, 230–243. [Google Scholar] [CrossRef]
  30. Li, H.; Wang, L.-G.; Qiu, J.-J. Estimation of CO2 and N2O emissions from farmland soils in Hebei Province in Huang-Huai-Hai Plain. Chin J Appl Ecol 2007, 18, 1994–2000. [Google Scholar]
  31. Lu, X.Y.; Cheng, G.W.; Xiao, F.P.; Huo, C.F. Simulating Carbon Sequestration and GHGs Emissions in Abies Fabric Forest on the Gongga Mountains Using a Biogeochemical Process Model Forest-DNDC. J. Mt. Sci. 2008, 5, 249–256. [Google Scholar] [CrossRef]
  32. Tang, X.-L.; Zhou, G.-Y.; Liu, S.-G.; Zhang, D.-Q.; Liu, S.-Z.; Li, J.; Zhou, C.-Y. Dependence of Soil Respiration on Soil Temperature and Soil Moisture in Successional Forests in Southern China. J. Integr. Plant Biol. 2006, 48, 654–663. [Google Scholar] [CrossRef]
  33. Abdalla, M.; Jones, M.; Williams, M. Simulation of N2O Fluxes from Irish Arable Soils: Effect of Climate Change and Management. Biol. Fertil. Soils 2010, 46, 247–260. [Google Scholar] [CrossRef]
  34. Molina-Herrera, S.; Haas, E.; Klatt, S.; Kraus, D.; Augustin, J.; Magliulo, V.; Tallec, T.; Ceschia, E.; Ammann, C.; Loubet, B.; et al. A Modeling Study on Mitigation of N2O Emissions and NO3 Leaching at Different Agricultural Sites across Europe Using LandscapeDNDC. Sci. Total Environ. 2016, 553, 128–140. [Google Scholar] [CrossRef] [PubMed]
  35. Marion, G.M.; Henry, G.H.R.; Freckman, D.W.; Johnstone, J.; Jones, G.; Jones, M.H.; Levesque, E.; Molau, U.; Molgaard, P.; Parsons, A.N.; et al. Open-Top Designs for Manipulating Field Temperature in High-Latitude Ecosystems. Glob. Chang. Biol. 1997, 3, 20–32. [Google Scholar] [CrossRef]
  36. IPCC. Climate Change 2014: Synthesis Report. Contribution of Working Groups I, II and III to the Fifth Assessment Report of the Intergovernmental Panel on Climate Change; Pachauri, R.K., Meyer, L.A., Eds.; IPCC: Geneva, Switzerland, 2014. [Google Scholar]
  37. Li, C.S. Modeling Trace Gas Emissions from Agricultural Ecosystems. Nutr. Cycl. Agroecosystems 2000, 58, 259–276. [Google Scholar] [CrossRef]
  38. Neal, C.; Skeffington, R.; Neal, M.; Wyatt, R.; Wickham, H.; Hill, L.; Hewitt, N. Rainfall and Runoff Water Quality of the Pang and Lambourn, Tributaries of the River Thames, South-Eastern England. Hydrol. Earth Syst. Sci. 2004, 8, 601–613. [Google Scholar] [CrossRef] [Green Version]
  39. IPCC. Climate Change 2021: The Physical Science Basis. Contribution of Working Group I to the Sixth Assessment Report of the Intergovernmental Panel on Climate Change; Cambridge University Press: Cambridge, UK, 2021. [Google Scholar]
  40. Smith, P.; Smith, J.U.; Powlson, D.S.; McGill, W.B.; Arah, J.R.M.; Chertov, O.G.; Coleman, K.; Franko, U.; Frolking, S.; Jenkinson, D.S.; et al. A Comparison of the Performance of Nine Soil Organic Matter Models Using Datasets from Seven Long-Term Experiments. Geoderma 1997, 81, 153–225. [Google Scholar] [CrossRef]
  41. Hsieh, C.-I.; Leahy, P.; Kiely, G.; Li, C. The Effect of Future Climate Perturbations on N2O Emissions from a Fertilized Humid Grassland. Nutr. Cycl. Agroecosystems 2005, 73, 15–23. [Google Scholar] [CrossRef]
  42. De Vries, W.; Kros, J.; Kuikman, P.J.; Velthof, G.L.; Voogd, J.C.H.; Wieggers, H.J.J.; Butterbach-Bahl, K.; Denier Van Der Gon, H.A.C.; Van Amstel, A.R. Use of Measurements and Models to Improve the National IPCC Based Assessments of Soil Emissions of Nitrous Oxide. Environ. Sci. 2005, 2, 217–233. [Google Scholar] [CrossRef]
  43. Dobbie, K.E.; Smith, K.A. The Effects of Temperature, Water-Filled Pore Space and Land Use on N2O Emissions from an Imperfectly Drained Gleysol. Eur. J. Soil Sci. 2001, 52, 667–673. [Google Scholar] [CrossRef]
  44. Saggar, S.; Jha, N.; Deslippe, J.; Bolan, N.S.; Luo, J.; Giltrap, D.L.; Kim, D.G.; Zaman, M.; Tillman, R.W. Denitrification and N2O:N2 Production in Temperate Grasslands: Processes, Measurements, Modelling and Mitigating Negative Impacts. Sci. Total Environ. 2013, 465, 173–195. [Google Scholar] [CrossRef]
  45. Ruser, R.; Flessa, H.; Russow, R.; Schmidt, G.; Buegger, F.; Munch, J.C. Emission of N2O, N2 and CO2 from Soil Fertilized with Nitrate: Effect of Compaction, Soil Moisture and Rewetting. Soil Biol. Biochem. 2006, 38, 263–274. [Google Scholar] [CrossRef]
  46. Kröbel, R.; Sun, Q.; Ingwersen, J.; Chen, X.; Zhang, F.; Müller, T.; Römheld, V. Modelling Water Dynamics with DNDC and DAISY in a Soil of the North China Plain: A Comparative Study. Environ. Model. Softw. 2010, 25, 583–601. [Google Scholar] [CrossRef]
  47. Chirinda, N.; Kracher, D.; Lægdsmand, M.; Porter, J.R.; Olesen, J.E.; Petersen, B.M.; Doltra, J.; Kiese, R.; Butterbach-Bahl, K. Simulating Soil N2O Emissions and Heterotrophic CO2 Respiration in Arable Systems Using FASSET and MoBiLE-DNDC. Plant Soil 2011, 343, 139–160. [Google Scholar] [CrossRef]
  48. Butterbach-Bahl, K.; Baggs, E.M.; Dannenmann, M.; Kiese, R.; Zechmeister-Boltenstern, S. Nitrous Oxide Emissions from Soils: How Well Do We Understand the Processes and Their Controls? Philos. Trans. R Soc. Lond. B Biol. Sci. 2013, 368, 20130122. [Google Scholar] [CrossRef]
  49. Liu, C.; Wang, K.; Meng, S.; Zheng, X.; Zhou, Z.; Han, S.; Chen, D.; Yang, Z. Effects of Irrigation, Fertilization and Crop Straw Management on Nitrous Oxide and Nitric Oxide Emissions from a Wheat–Maize Rotation Field in Northern China. Agric. Ecosyst. Environ. 2011, 140, 226–233. [Google Scholar] [CrossRef]
  50. Rafique, R.; Peichl, M.; Hennessy, D.; Kiely, G. Evaluating Management Effects on Nitrous Oxide Emissions from Grasslands Using the Process-Based DeNitrification–DeComposition (DNDC) Model. Atmos. Environ. 2011, 45, 6029–6039. [Google Scholar] [CrossRef]
  51. Beheydt, D.; Boeckx, P.; Sleutel, S.; Li, C.; Van Cleemput, O. Validation of DNDC for 22 Long-Term N2O Field Emission Measurements. Atmos. Environ. 2007, 41, 6196–6211. [Google Scholar] [CrossRef]
  52. Bond-Lamberty, B.; Thomson, A. Temperature-Associated Increases in the Global Soil Respiration Record. Nature 2010, 464, 579. [Google Scholar] [CrossRef]
  53. Abdalla, M.; Hastings, A.; Helmy, M.; Prescher, A.; Osborne, B.; Lanigan, G.; Forristal, D.; Killi, D.; Maratha, P.; Williams, M.; et al. Assessing the Combined Use of Reduced Tillage and Cover Crops for Mitigating Greenhouse Gas Emissions from Arable Ecosystem. Geoderma 2014, 223–225, 9–20. [Google Scholar] [CrossRef]
  54. Jabro, J.D.; Sainju, U.; Stevens, W.B.; Evans, R.G. Carbon Dioxide Flux as Affected by Tillage and Irrigation in Soil Converted from Perennial Forages to Annual Crops. J. Environ. Manag. 2008, 88, 1478–1484. [Google Scholar] [CrossRef] [PubMed]
  55. Zhuang, Q.; Chen, M.; Xu, K.; Tang, J.; Saikawa, E.; Lu, Y.; Melillo, J.M.; Prinn, R.G.; McGuire, A.D. Response of Global Soil Consumption of Atmospheric Methane to Changes in Atmospheric Climate and Nitrogen Deposition. Glob. Biogeochem. Cycles 2013, 27, 650–663. [Google Scholar] [CrossRef]
  56. BEIS. 2019 UK Greenhouse Gas Emissions; BEIS: London, UK, 2019. [Google Scholar]
  57. BEIS. 2015 UK Greenhouse Gas Emissions; BEIS: London, UK, 2017. [Google Scholar]
  58. Soussana, J.F.; Tallec, T.; Blanfort, V. Mitigating the Greenhouse Gas Balance of Ruminant Production Systems through Carbon Sequestration in Grasslands. Animal 2010, 4, 334–350. [Google Scholar] [CrossRef] [PubMed] [Green Version]
  59. Emmett, B.A.; Beier, C.; Estiarte, M.; Tietema, A.; Kristensen, H.L.; Williams, D.; Penuelas, J.; Schmidt, I.; Sowerby, A. The Response of Soil Processes to Climate Change: Results from Manipulation Studies of Shrublands across an Environmental Gradient. Ecosystems 2004, 7, 625–637. [Google Scholar] [CrossRef] [Green Version]
  60. Fang, C.; Moncrieff, J.B. The Dependence of Soil CO2 Efflux on Temperature. Soil Biol. Biochem. 2001, 33, 155–165. [Google Scholar] [CrossRef]
  61. Wu, Z.T.; Dijkstra, P.; Koch, G.W.; Hungate, B.A. Biogeochemical and Ecological Feedbacks in Grassland Responses to Warming. Nat. Clim. Chang. 2012, 2, 458–461. [Google Scholar] [CrossRef]
  62. Crowther, T.W.; Bradford, M.A. Thermal Acclimation in Widespread Heterotrophic Soil Microbes. Ecol. Lett. 2013, 16, 469–477. [Google Scholar] [CrossRef]
  63. Kirschbaum, M.U.F. Soil Respiration under Prolonged Soil Warming: Are Rate Reductions Caused by Acclimation or Substrate Loss? Glob. Chang. Biol. 2004, 10, 1870–1877. [Google Scholar] [CrossRef]
  64. Yuste, J.C.; Ma, S.; Baldocchi, D.D.; Curiel Yuste, J.; Ma, S.; Baldocchi, D.D. Plant-Soil Interactions and Acclimation to Temperature of Microbial-Mediated Soil Respiration May Affect Predictions of Soil CO2 Efflux. Biogeochemistry 2010, 98, 127–138. [Google Scholar] [CrossRef] [Green Version]
  65. Schmid, M.; Neftel, A.; Riedo, M.; Fuhrer, J. Process-Based Modelling of Nitrous Oxide Emissions from Different Nitrogen Sources in Mown Grassland. Nutr. Cycl. Agroecosystems 2001, 60, 177–187. [Google Scholar] [CrossRef]
  66. McSwiney, C.P.; Robertson, G.P. Nonlinear Response of N2O Flux to Incremental Fertilizer Addition in a Continuous Maize (Zea mays L.) Cropping System. Glob. Chang. Biol. 2005, 11, 1712–1719. [Google Scholar] [CrossRef]
  67. LeCain, D.R.; Morgan, J.A.; Schuman, G.E.; Reeder, J.D.; Hart, R.H. Carbon Exchange and Species Composition of Grazed Pastures and Exclosures in the Shortgrass Steppe of Colorado. Agric. Ecosyst. Environ. 2002, 93, 421–435. [Google Scholar] [CrossRef]
  68. Kang, X.M.; Hao, Y.B.; Cui, X.Y.; Chen, H.; Li, C.S.; Rui, Y.C.; Tian, J.Q.; Kardol, P.; Zhong, L.; Wang, J.Z.; et al. Effects of Grazing on CO2 Balance in a Semiarid Steppe: Field Observations and Modeling. J. Soils Sediments 2013, 13, 1012–1023. [Google Scholar] [CrossRef]
  69. Li, R.H.; Li, X.B.; Li, G.Q.; Wen, W.Y. Simulation of Soil Nitrogen Storage of the Typical Steppe with the DNDC Model: A Case Study in Inner Mongolia, China. Ecol. Indic. 2014, 41, 155–164. [Google Scholar] [CrossRef]
  70. Han, Q.F.; Luo, G.P.; Li, C.F.; Xu, W.Q. Modeling the Grazing Effect on Dry Grassland Carbon Cycling with Biome-BGC Model. Ecol. Complex. 2014, 17, 149–157. [Google Scholar] [CrossRef]
  71. Graux, A.-I.; Lardy, R.; Bellocchi, G.; Soussana, J.-F. Global Warming Potential of French Grassland-Based Dairy Livestock Systems under Climate Change. Reg. Environ. Chang. 2012, 12, 751–763. [Google Scholar] [CrossRef]
  72. IPCC Special Report on Emission Scenarios. In A Special Report of Working Group III of the Intergovernmental Panel on Climate Change; Nakicenovic, N.; Swart, S. (Eds.) Cambridge University Press: Cambridge, UK, 2000; 599p. [Google Scholar]
  73. Gulzari, S.O.; Aby, B.A.; Persson, T.; Hoglind, M.; Mittenzwei, K. Combining Models to Estimate the Impacts of Future Climate Scenarios on Feed Supply, Greenhouse Gas Emissions and Economic Performance on Dairy Farms in Norway. Agric. Syst. 2017, 157, 157–169. [Google Scholar] [CrossRef]
Figure 1. Measured (filled circle) and simulated (solid line) N2O, CO2 and CH4 emissions from soils of the cutting treatment for 2015 and 2016 growing seasons. Error bars are standard deviations for 5 replicates.
Agronomy 12 03055 g001
Figure 2. Measured (filled circle) and simulated (solid line) N2O, CO2 and CH4 emissions from soils of the nitrogen treatment for 2015 and 2016 growing seasons. Error bars are standard deviations for 5 replicates.
Agronomy 12 03055 g002
Figure 3. Measured (filled circle) and simulated (solid line) N2O, CO2 and CH4 emissions from soils of the warming treatment for 2015 and 2016 growing seasons. Error bars are standard deviations for 5 replicates.
Agronomy 12 03055 g003
Figure 4. Measured (filled circle) and simulated (solid line) N2O, CO2 and CH4 emissions from soils of the interaction between nitrogen and warming treatment for 2015 and 2016 growing seasons. Error bars are standard deviations for 5 replicates.
Agronomy 12 03055 g004
Figure 5. Sensitivity of the DNDC-model to changes in climate (temperature and rainfall), soil characteristics (soil carbon) and management practice (nitrogen fertiliser rate) on N2O emissions. Dotted line represents the baseline threshold (annual average maximum temperature = 12.8 °C, average daily precipitation = 4 mm, soil carbon = 0.0038 kg C kg−1 soil and N-fertiliser rate applied = 100 kg N ha−1).
Agronomy 12 03055 g005
Figure 6. Sensitivity of the DNDC-model due to changes in climate (temperature and rainfall), soil characteristics (soil carbon) and in management practice (nitrogen fertiliser rate) on CO2 emissions. Dotted line represents the baseline threshold (annual average maximum temperature = 12.8 °C, average daily precipitation = 4 mm, soil carbon = 0.0038 kg C kg−1 soil and N-fertiliser rate applied = 100 kg N ha−1).
Agronomy 12 03055 g006
Table 1. DNDC model input parameters.
Input Parameters
Climate data
Latitude (degree)54°1′ N
Mean annual air temperature (°C)9.75
Mean annual precipitation (mm)1333
N concentration in rainfall (mg N L−1)2 a
Atmospheric CO2 concentrations (ppm)385 *
Annual increase rate of atmospheric CO2 concentration (ppm y−1)2
Soil properties (0–10 cm)
Vegetation typeMoist pasture
Soil textureClay loam
Bulk density (g cm−3)1.06
Clay fraction (0–1)0.41 *
Soil pH5.3
Initial organic C content at surface soil (kg C kg−1)0.038
ManagementSheep grazing/hay cutting
WFPS at field capacity0.57 *
WFPS at wilting point0.27 *
a [38]. * Defaults values. WFPS is water-filled pore space.
Table 2. Measured and DNDC-simulated cumulative N2O emissions (g N2O-N ha−1) for the full factorial experiment over two growing seasons (2015 and 2016).
TreatmentsCumulative N2O Emissions (g N2O-N ha−1)Relative Deviation between Measured and Simulated Emissions (%)
MeasuredSimulatedDifference
2015 season
Control0.330.28−0.05−15
Cutting (D)1.630.57−1.06−65
Warming (W)0.320.28−0.03−11
Nitrogen (N)252.11132.38−119.74−47
N × W141.6773.99−67.68−48
D × N488.22245.94−242.28−50
D ×W0.840.920.0810
D × N × W245.09132.82−112.26−46
2016 season
Control−0.300.010.31>100
Cutting0.010.010.00−5
Warming0.230.330.1041
Nitrogen1.211.710.5042
N × W3.044.711.6755
D × N5.135.840.7114
D × W0.840.33−0.51−61
D × N × W3.346.483.1494
Table 3. Measured and DNDC-simulated cumulative CO2 emissions (kg CO2-C ha−1) for the full factorial experiment over two growing seasons (2015 and 2016).
TreatmentsCumulative CO2 Emissions (kg CO2-C ha−1)Relative Deviation between Measured and Simulated Emissions (%)
MeasuredSimulatedDifference
2015 season
Control16.3022.215.9136
Cutting (D)15.6722.216.5442
Warming (W)20.5330.369.8348
Nitrogen (N)22.0522.900.864
N × W26.7127.330.622
D × N16.3522.906.5540
D × W16.3226.009.6859
D × N × W19.4827.337.8540
2016 season
Control15.8718.312.4415
Cutting11.7418.316.5756
Warming20.3422.992.6513
Nitrogen19.8822.993.1116
N × W26.9525.27−1.68−6
D × N15.9519.833.8824
D × W14.8522.998.1455
D × N × W16.9525.278.3249
Table 4. Measured and DNDC-simulated cumulative CH4 emissions (g CH4-C ha−1) for the full factorial experiment over two growing seasons.
TreatmentsCumulative CH4 Emissions (g CH4-C ha−1)Relative Deviation between Measured and Simulated Emissions (%)
MeasuredSimulatedDifference
2015 season
Control−2.10−3.70−1.6076
Cutting (D)−2.47−3.90−1.4358
Warming (W)−2.41−5.86−3.45>100
Nitrogen (N)−3.53−3.69−0.175
N × W−5.84−6.21−0.376
D × N−2.13−3.69−1.5673
D × W−0.15−6.30−6.15>100
D × N × W−2.17−5.46−3.29>100
2016 season
Control−6.75−7.06−0.305
Cutting−4.06−6.46−2.4059
Warming−5.30−11.17−5.87>100
Nitrogen−8.79−6.752.03−23
N ×W−4.68−9.00−4.3292
D × N−4.28−6.75−2.4758
D × W−5.53−11.04−5.5099
D × N × W−4.13−10.08−5.95>100
Table 5. Long-term DNDC-estimated (30 years) mean annual GHG (N2O, CH4), SOC emissions and net GHG emissions for each field treatment including interactions.
TreatmentsN2O (GWP100)CH4 (GWP100)CH4 (GWP20)SOCThe Net GHG Emissions (GWP100)The Net GHG Emissions (GWP20)
t CO2eq ha−1 y−1
Control (C)0.106−0.068−0.1980.0120.050−0.080
Cutting (D)0.109−0.069−0.2000.0120.052−0.079
Warming (W)0.147−0.080−0.231−0.0250.043−0.109
Nitrogen (N)1.111−0.065−0.1890.0201.0660.942
N × W1.463−0.077−0.223−0.0021.3851.238
D × N1.119−0.066−0.1920.0201.0730.947
D × W0.164−0.080−0.234−0.0250.059−0.095
D × N × W1.502−0.078−0.228−0.0021.4211.272
Publisher’s Note: MDPI stays neutral with regard to jurisdictional claims in published maps and institutional affiliations.

