Article

Temporal and Spatial Evolution of Rice Productivity and Its Influencing Factors in China

1
School of Economics, Shandong University of Finance and Economics, Jinan 250014, China
2
School of Economics, Shandong Normal University, Jinan 250014, China
3
Faculty of Economics, Chiang Mai University, Chiang Mai 50200, Thailand
*
Author to whom correspondence should be addressed.
Agronomy 2023, 13(4), 1075; https://doi.org/10.3390/agronomy13041075
Submission received: 14 March 2023 / Revised: 1 April 2023 / Accepted: 5 April 2023 / Published: 7 April 2023
(This article belongs to the Topic Novel Studies in Agricultural Economics and Sustainable Farm Management)
(This article belongs to the Section Farming Sustainability)

Abstract

:
Ensuring sustainable levels of rice yield has become a significant concern in recent years. To improve yields in rice production, it is essential to increase factor inputs and productivity. However, current research primarily focuses on general grain productivity, rather than rice. In this study, utilize the DEA-Malmquist index to present a comprehensive temporal and spatial analysis of rice productivity and its determinants in China. Our findings reveal that the overall efficiency of rice production in China exhibits a fluctuating upward trend, with technological progress being the primary driver of improvement in production efficiency. Moreover, rice production efficiency demonstrates a distribution pattern that decreases from east to west, with resource endowment, production conditions, socioeconomic development levels, and the political system being crucial factors influencing efficiency. This study proposes novel ideas for structural adjustments and regional divisions within China’s rice industry and provides a theoretical foundation for governments to develop evidence-based policies.

1. Introduction

Under the influence of climate change, water scarcity, and urbanization, global food security faces major challenges [1,2,3,4]. In recent years, the decline in sustainability of cereal production in China has been a major issue [5,6,7,8]. In rice, the use of production factors and improving their productivity are important factors for increasing yield [9,10]. With the urbanization in China, the resources of cultivated land are decreasing. In terms of rice production, the supply of cultivated land has reached its limit [11,12,13,14]. It is necessary to secure rice yield by improving production efficiency. Therefore, this paper aims to comprehensively measure rice production efficiency and its influencing factors.
Currently, research on the efficiency of rice production focuses on two aspects: the measurement of production efficiency and the factors affecting production efficiency. As for the measurement of production efficiency, the traditional production function method, stochastic frontier analysis (SFA) and data envelopment analysis (DEA) are the three most commonly used methods. The traditional production function method is mainly used to evaluate production efficiency [15,16]. The most common methods are stochastic frontier analysis and data envelopment analysis. Stochastic frontier analysis assumes that the production frontier follows a certain functional form, which can avoid the influence of random disturbances on inefficiency. DEA can effectively avoid model setting errors and is suitable for multiple input and multiple output analyzes. Considering the advantages of the DEA model, many researchers use this model to measure agricultural production efficiency. Chavas et al. [17] used the DEA model and found that Colombia has high technical efficiency in agriculture. James [18] used the method of combining SFA and DEA, to show that technical efficiency is an important factor in increasing grain production. Watto and Mugera [19] believe that the most effective factor to improve technical efficiency is to use better quality production factors. In recent years, many scholars have measured the efficiency of grain production in China. Chen and Zhao [20] used the SFA model to show that the important factors for increasing grain production include land, fertilizer and labor. From the perspective of financial support, Zhang et al. [7] used the DEA model to find that grain production efficiency in China decreases from the center to the east to the west. Huang et al. [21] measured the eco-efficiency of farms growing rice using both the life cycle assessment (LCA) and DEA methods based on survey data from 370 farms in China.
Academic circles have also looked at the factors influencing the efficiency of grain production. Raghbendra et al. [22] used India as an example and found that farm size is positively correlated with production efficiency. The level of schooling and household size influence technical efficiency of the farmers [23,24,25]. McCloud and Kumbhakar [26] drawing on data from EU countries, find that agricultural subsidies will significantly increase agricultural productivity. Agricultural subsidy policy can alleviate the decline of agricultural comparative advantage, and it is the source power to promote agricultural development [27,28,29]. The cropland is a key factor in improving food production efficiency [30,31,32]. Land circulation helps to transfer farmland from households with low APE to households with high APE, thus improving the efficiency and fairness of land allocation [33,34]. Some researchers concluded that food production efficiency can be improved by expanding water and transportation infrastructure in agriculture [35,36]. In addition, studies have shown that biotechnology contributes greatly to agricultural production [37,38]. Currently, there are few studies that have investigated the efficiency of rice production and its influencing factors in China. This paper aims to make a useful attempt and supplement this research gap.
This paper examines 23 major rice-producing provinces in China from 2007 to 2018 as research objects. The primary objective is to use the DEA-Malmquist index to comprehensively measure the efficiency of rice production and identify factors that influence it. Additionally, we conduct heterogeneity analyses on different regions and rice varieties to measure rice production efficiency. The ultimate policy goal is to provide new insights for structural adjustment and regional division of the rice industry, as well as to enhance food security and reduce poverty by narrowing the rice yield gap in China.

2. Materials and Methods

2.1. Research Methods

2.1.1. Data Envelopment Analysis (DEA)

Data Envelopment Analysis (DEA) was firstly proposed by Charnes in 1978 [39], which estimates the effective production frontier based on a set of observations on inputs and outputs, and determines the efficiency status of each point of the possible production concentration based on the distance from each point to the production frontier, thus providing an effective evaluation of the decision making unit (DMU). Suppose there are i (i = 1, 2, 3, …, m) decision units, each with k input elements xi1, xi2, …, xik and r outputs yi1, yi2, …, yir, and each input and output is greater than 0, the basic model of DEA is:
m i n θ ε e 1 T S + e 2 T S + s . t . i = 1 m λ i x i + s = θ X 0 i = 1 m λ i y i s + = Y 0 i = 1 m λ i = 1 λ i 0 ,   i = 1 , 2 , 3 m s 0 ,   s + 0
where θ represents the comprehensive efficiency value of the decision unit, S and S + are slack variables, S represents the redundancy value of production factor input, and S + denotes the full output value of input factor. ε is a non-Archimedean infinitesimal parameter value, if θ = 1 and S = S + = 0 , it means that the decision DEA is effective, if θ = 1 and S 0 or S + 0 , it means that the decision unit DEA is weakly effective, if 0 < θ < 1, it indicates that the decision-making unit is non-DEA effective, that is, the inefficiency of decision-making unit leads to resource waste. xi and yi respectively represent the amount of input and output of the ith decision unit, and λ i denotes the weight of decision-making unit.

2.1.2. Malmquist Index

The Malmquist Productivity Index method is based on the DEA model and is a non-parametric method for measuring the trend of dynamic efficiency changes. When the data type is panel data, the Malmquist index can be used to measure the change in total factor productivity. According to Färe et al. [40], x t , y t is the input-output vector in period t and x t + 1 , y t + 1 is the input-output vector in period t + 1 . The Malmquist index is calculated as:
T F P 0 t , t + 1 x t + 1 , y t + 1 , x t , y t = D 0 t x t + 1 , y t + 1 D 0 t x t , y t × D 0 t + 1 x t + 1 , y t + 1 D 0 t + 1 x t , y t = D 0 t + 1 x t + 1 , y t + 1 D 0 t x t , y t × D 0 t x t + 1 , y t + 1 D 0 t + 1 x t + 1 , y t + 1 × D 0 t x t , y t D 0 t + 1 x t , y t = E f f c h × T e c h
where T F P 0 t , t + 1 x t + 1 , y t + 1 , x t , y t represents the Malmquist productivity index, which can be decomposed into the product of the change in technical efficiency (Effch) and the change in technical progress (Tech). Effch represents the change in technical efficiency, and refers to the ratio of the distance between the actual level of output the respective optimal level of output in different periods with constant returns to scale, with Effch > 1 indicating an improvement in technical efficiency and vice versa, while Tech represents the change in technical progress, and refers to the ratio of the optimal output levels of the same input in different periods. Tech > 1 indicates technological progress and vice versa. Further, Färe et al. [40] proposed that in the case of variable returns to scale, technical efficiency changes can be decomposed into pure technical efficiency (Pech) and scale efficiency (Sech). Pech is the capacity of input factor use efficiency. Pech > 1 indicates an increase in pure technical efficiency and vice versa. Sech reflects the effectiveness of production scale in the case of variable returns to scale. Sech >1 indicates an increase in scale efficiency and vice versa. Ultimately, the composition of production efficiency is given by the formula:
TFP = Effch × Tech = Pech × Sech × Tech
A TFP greater than 1 indicates an increase in production efficiency, less than 1 indicates a decrease in production efficiency, and equal to 1 indicates no change in production efficiency.

2.2. Data Sources and Explanations

2.2.1. Sample Selection and Data Source

In this paper, 23 major rice-producing provinces (autonomous regions and municipalities directly under the Central Government) in China from 2007 to 2018 were selected as the study sample. The rice-growing provinces were classified into three regions: eastern (Jiangsu, Liaoning, Hebei, Shandong, Zhejiang, Fujian, Guangdong, Guangxi, and Hainan), central (Heilongjiang, Jilin, Henan, Hubei, Hunan, Anhui, Jiangxi, and Inner Mongolia), and western (Chongqing, Sichuan, Yunnan, Guizhou, Shaanxi, and Ningxia). The input-output data of each province from 2007 to 2018 were mainly obtained from the National Compilation of Information on Cost and Benefits of Agricultural Products in previous years, and the data on per capita arable land area, education level of rural residents, amount of employees per mu, agricultural planting structure, effective irrigation rate, agricultural machinery density, disaster rate, urbanization rate, per capita disposable income of rural residents and financial support for agriculture are obtained from the China Rural Statistical Yearbook [41], and information from the National Bureau of Statistics [42].

2.2.2. Explained Variables

The explanatory variable in this study was rice productivity efficiency measured using DEA-Malmquist index method. This paper constructs 2 primary indicators of inputs and outputs, and 3 secondary indicators of direct cost, labor input and rice output (Table 1), and selects the main output value of rice in each province in the corresponding year as the output indicator (specifically expressed as the main output value of rice per unit area (unit: yuan/mu)), and the input indicators include direct cost and labor input. Among them, the direct cost includes the sum of seed cost, fertilizers, pesticides, agricultural films, rental operations per unit of rice production (unit: yuan/mu), and the labor input is expressed as the labor cost consumed per unit area of rice production (unit: yuan/mu).

2.2.3. Explanatory Variables

At present, there is no standard model on the factors influencing production efficiency. Established studies have found that the farmers’ education level, income level and disaster impacts are important factors affecting rice production efficiency [43,44]. In addition, Srisompun and Boontang [45] argued that production efficiency is determined by farmer traits, land characteristics and farmland management. Considering the characteristics and data limitations of rice production in China, this paper analyzes resources endowment, production conditions, socioeconomic development level and policy system. For resource endowment, per capita cultivated land (PCL) is selected to characterize land resources and education level of farmers (ELF) to characterize human capital. For production conditions, we have used amount of employees per mu (AEP) where “mu” is a Chinese unit of land measurement equivalent to 666.7 square meters commonly used in agriculture. Agricultural planting structure (APS), effective irrigation rate (EIR), agricultural machinery density (AMD) and disaster rate (DIR) are also selected as indicators. For socioeconomic development level, urbanization rate (URR) and per capita disposable income of rural residents (PDI) are selected as indicators. For policy system, fiscal support for agriculture (FSA) is selected as a measure. The specific indicators are set as follows:
Per capita cultivated land area (PCL). Land factor inputs directly affect food productivity efficiency [46]. The increase in per capita cultivated land is conducive to the expansion of planting scale and has a positive impact on production efficiency. However, in the case of limited cultivated land resources, the increase of land factor in “crude” production may have a negative impact on production efficiency. In this paper, the ratio of cultivated land area to total population in each provinces is used to characterize the cultivated land area per capita.
Education level of farmers (ELF). The level of education of farmers an important determinant of productivity improvement [47]. We measure the number of years of education per capita in the rural areas in each province, and the formula is as follows: (Population of primary school education × 6 + junior high school × 9 + high school × 12 + college or above × 16)/total population over six years old.
Amount of employees per mu (AEP). Higher labor input in rice cultivation means that it can benefit from the mastery of various skills, which is conducive to improving efficiency [48]. However, a large labor input may also indicate a low technical input in rice cultivation. Due to the uncertainty of its impact, the amount of employee per mu is selected.
Agricultural Planting Structure (APS). Agricultural production efficiency is closely related to sown area and layout adjustment. The ratio of rice planting area to the total crop planting area in each province is used to measure the agriculture planting structure.
Effective irrigation rate (EIR). Water availability is a determinant of agricultural production [49], and an increase in effective irrigated area implies the full utilization of water resources, which is conducive to improving rice production efficiency. The effective irrigation rate is measured as the ratio of effective irrigated area to cultivated area in each province.
Agricultural mechanization Density (AMD). The application of technology in the agricultural production process has a significant impact on production efficiency [50], and mechanized agricultural production can fill the gap of labor withdrawal and thus enhance rice production efficiency. The ratio of total agricultural machinery power to rice planting area in each province is used to measure agricultural mechanization density.
Disaster Rate (DIR). Agricultural natural disasters greatly constrain food production [51]. The ratio of rice disaster area to rice planting area is chosen to measure the disaster rate.
Urbanization Rate (URR). In the urbanization process caused soil pollution and the productivity of land cultivation was negatively affected [52]. The urbanization level is measured by choosing the proportion of urban population to total population in each province.
Per capita disposable income of farmers (PDI). Higher disposable income of farmers implies that households have sufficient funds to purchase production materials and equipment, which helps to increase the efficiency of rice production. However, an increase in per capita disposable income of farmers may come from an increase in non-agricultural income, which can bring about a decrease in production efficiency [16]. The specific measure selected for this paper is the logarithm of disposable income per rural resident in each province (in thousands of yuan).
Financial support for agriculture (FSA). The intensity of government intervention in agricultural production is an important influencing factor of production efficiency. We choose the proportion of fiscal agricultural expenditure to total fiscal expenditure in each province to measure the intensity of fiscal support to agriculture.

2.2.4. Tobit Model

In this paper, the DEA-Malmquist index was used to measure the production efficiency and its decomposition index. Mostly values concentrate between 0 and 2. The estimation results of OLS for such limited dependent variables may be biased, and the Tobit model using the maximum likelihood estimation (MLE) method can improve the validity and robustness. In order to explore the factors influencing rice production efficiency and the degree of influence, this paper uses a random effects Tobit model, which is set as follows:
T F P i . t = α 0 + α i 1 t X i , t + ε i , t
where T F P i , t is the explanatory variable in this paper, α 0 is a constant term, X i , t is a series of factors affecting rice production efficiency, including per capita cultivated land (PCL), education level of farmers (ELF), Amount of employees per mu (AEP), agricultural planting structure (APS), effective irrigation rate (EIR), agricultural mechanization density (AMD), disaster rate (DIR), urbanization rate (URR), per capita disposable income of farmers (PDI), and financial support for agriculture (FSA). ε i , t is the error term. Since the random effects Tobit model estimates do not reflect individual and period differences, this paper adds year dummy variables and province dummy variables for control in the model regressions. The descriptive statistics for each variable are shown in Table 2.

3. Results

3.1. Basic Characteristics of Overall Rice Production Efficiency in China

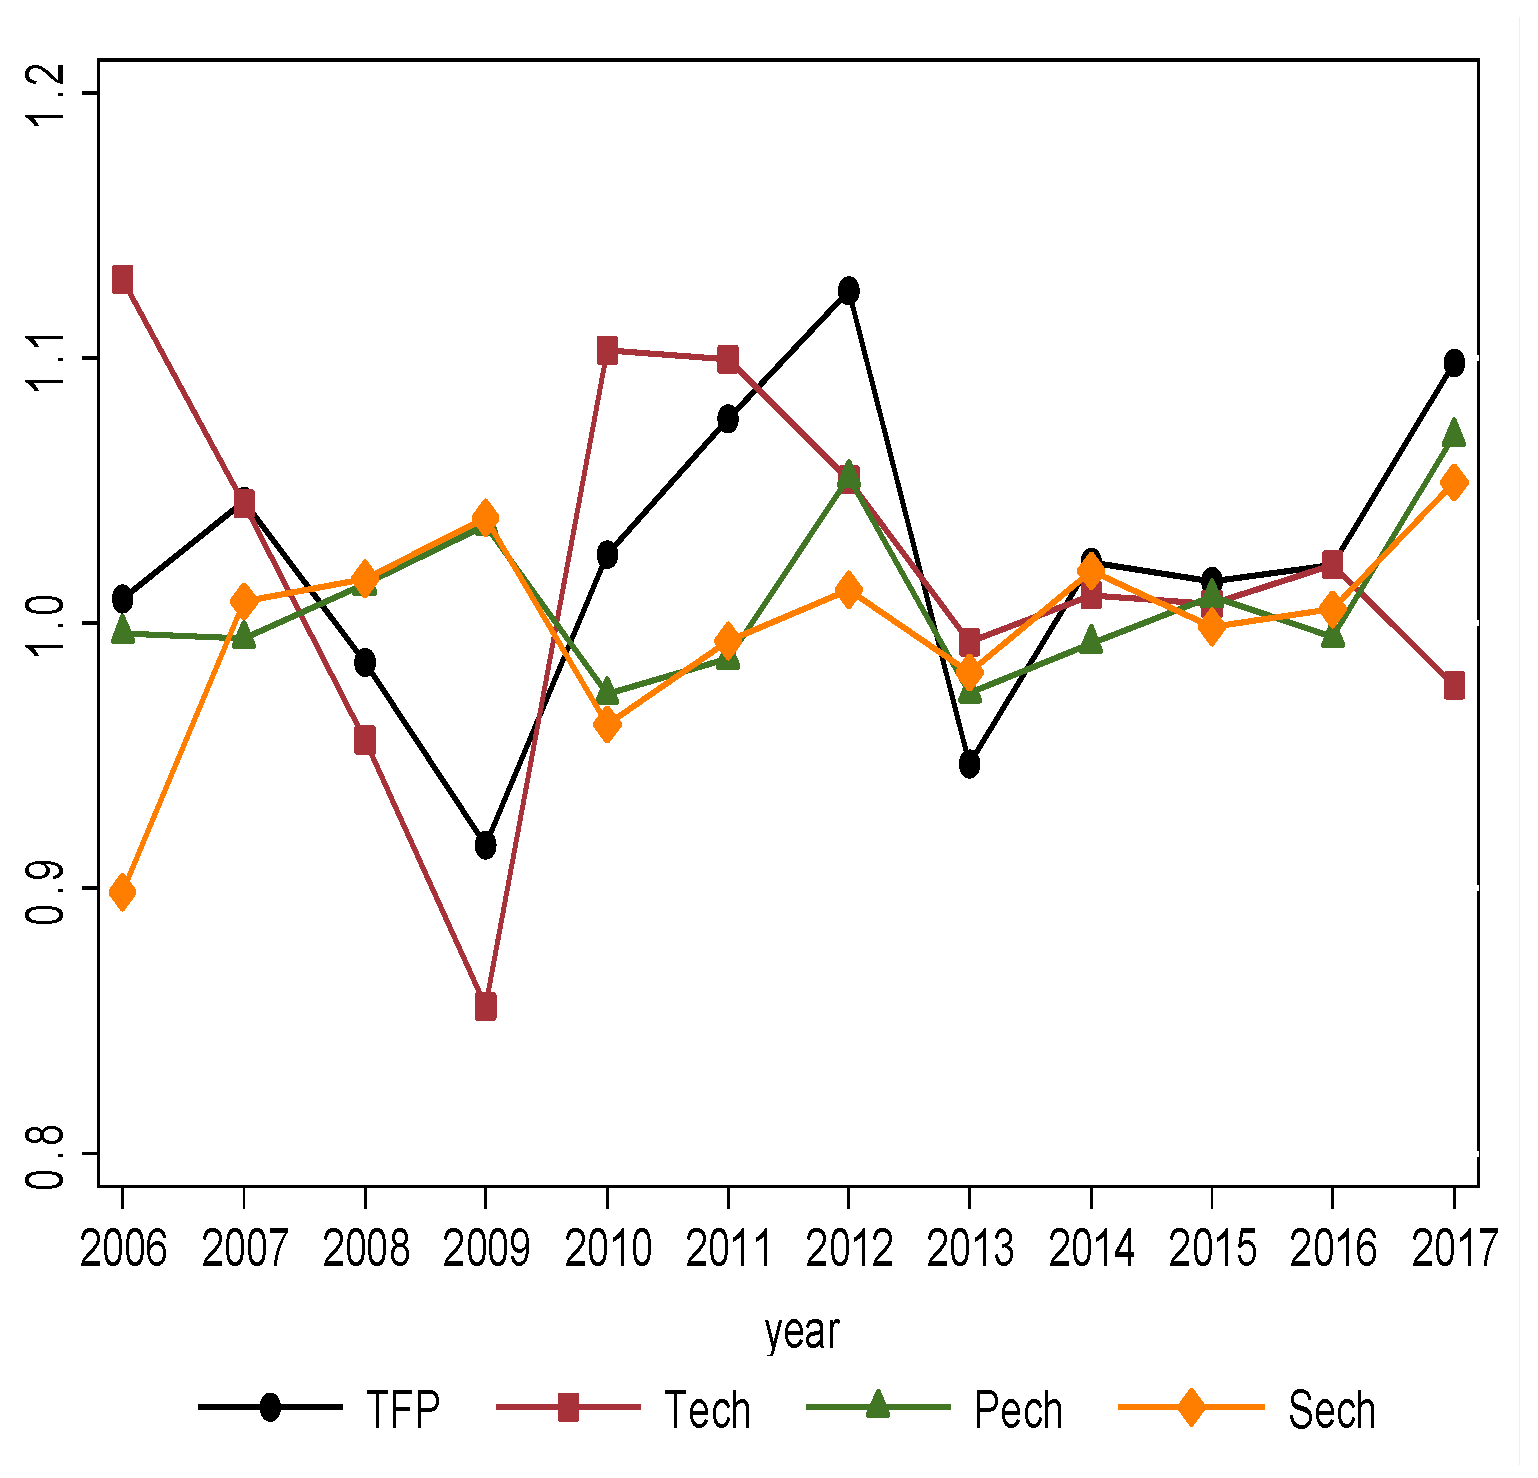
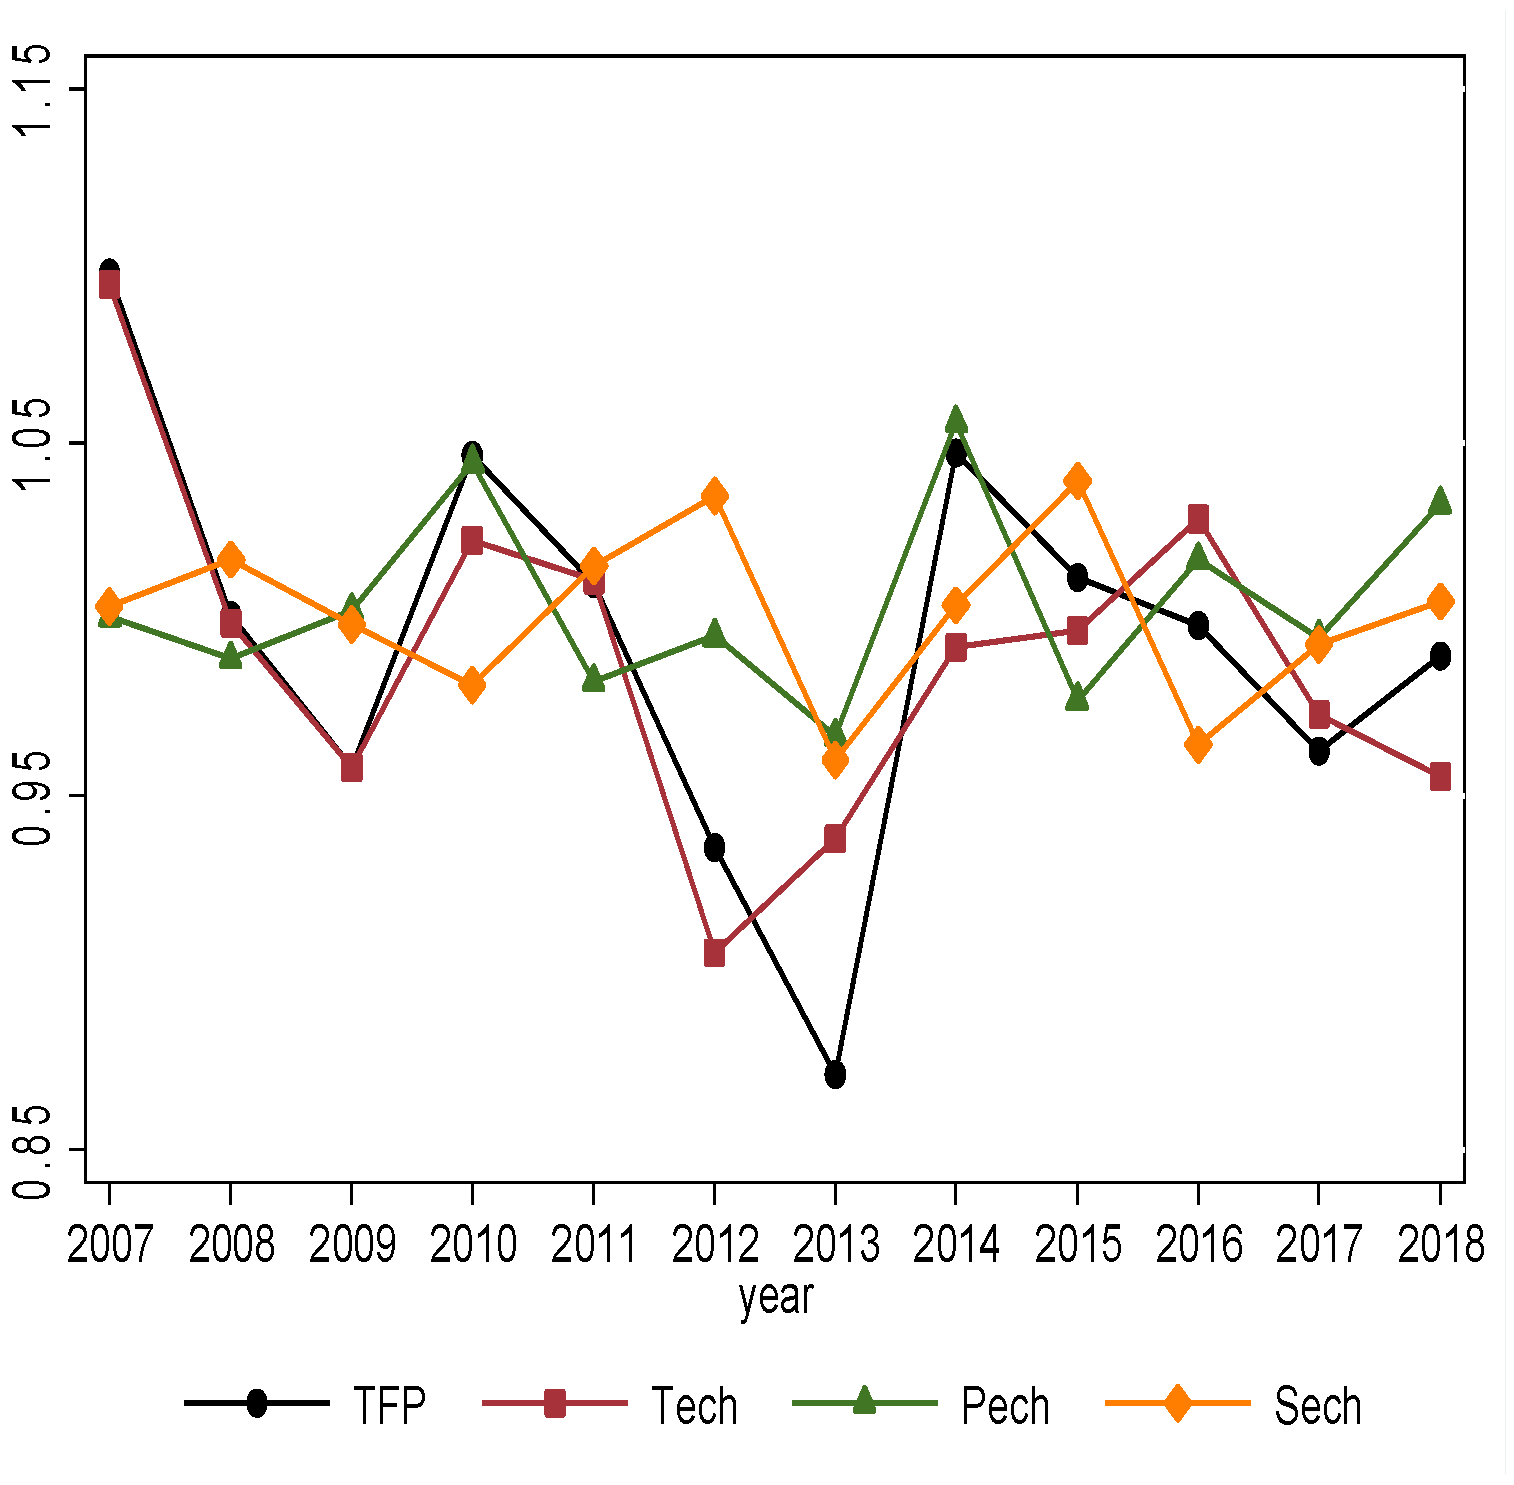
The trend of rice production efficiency, technical progress change, pure technical efficiency change and scale efficiency change in 23 provinces of China from 2007 to 2018 are shown in Figure 1. In general, rice production efficiency in China is in a fluctuating change, especially between 2007 and 2014, and then the fluctuation of rice production efficiency becomes less. In terms of specific trends, changes in rice production efficiency have certain phase characteristics. It showed a sharp decline from 2008 to 2010, experienced a large increase in rice production efficiency from 2011 to 2013, experienced a short decline in 2014 and maintained a growth trend after 2015. A decomposition of the source of rice production efficiency growth reveals that the decline in rice production efficiency in 2008–2010 was mainly due to the regression of the technological frontier (Tech < 1). The rapid growth in 2011–2013 was mainly due to the changes in technological progress, particularly to the improvements in pure technical efficiency. During 2015–2017, the fluctuations in production efficiency, changes in technological progress, pure technical efficiency and scale efficiency were still consistent. Therefore, changes in rice production efficiency in China are mainly influenced by technical progress, and the key to improving rice production efficiency is to promote technological progress.
Table 3 shows the results of production efficiency and its decomposition indexes of 23 major rice producing provinces in China from 2007 to 2018 based on output-oriented measurements. The national average value of Malmquist index is 1.0242, indicating that rice production efficiency shows a gradual improvement trend. The technical progress index and pure technical efficiency are both greater than 1. And the change in technical progress (1.0210) is significantly higher than the change in pure technical efficiency (1.0081), indicating that the improvement of rice production efficiency in China from 2007 to 2018 was mainly driven by technological progress.
At the sub-provincial level, the Malmquist index of Jiangsu and Jiangxi Provinces was less than 1, and the rice productivity shown a decreasing trend. All provinces except Jiangsu and Jiangxi have achieved DEA effective. From the decomposition index, all 23 Chinese provinces have technical progress changes greater than 1 and achieved DEA effective status. Basically, all provinces had technological progress index greater than pure technical efficiency changes. So scale efficiency progress plays a key role in rice production efficiency improvement.

3.2. Analysis of Factors Influencing Rice Production Efficiency

Table 4 reports the baseline results, with column (1) showing the influences of rice production efficiency (TFP) as the explanatory variable. Columns (2)–(4) show the results of the technical progress change (Tech), pure technical efficiency change (Pech) and scale efficiency change (Sech) as the explanatory variables, respectively.
First, the effect of resource endowment on rice production efficiency. Cultivated land area per capita had a significant negative effect on TFP and insignificant effects on Tech, Pech and Sech. The reason is that the rigid constraint of cultivated land resources, increasing cultivated land area to enhance rice production efficiency is not available. The increase in cultivated land area per capita is not beneficial for technical efficiency improvement. The influence of education level of rural residents on TFP as well as Pech was positive, implying that the higher education level of farmers, the more capabilities they have in terms of production skills, which help promote technological progress and production efficiency of rice production.
Second, we must consider the effect of production conditions on rice production efficiency. The amount of employees per mu negatively impacted TFP and Pech, while this negative effect was not significant for Tech and Sech. A greater labor inputs per mu indicate a lower technology application level during production, which hinders the efficiency of rice production. The agricultural planting structure was found to have a positive effect on TFP and Pech, indicating that increasing the proportion of land area would involve deepening the specialization, thereby helping to enhances the efficiency of rice production. Additionally, although the positive effect of effective irrigation rate on TFP, Tech, Pech, and Sech is not statistically significant, but it implies that increasing the irrigation level would help to promote rice production efficiency. More attention should be paid to irrigation to improve water use efficiency. Agricultural mechanization density had a positive effect on TFP and a positive, but non-significant, effect on Tech, Pech and Sech. This is because the level of agricultural mechanization provides powerful technical support for rice production, and the application of new agricultural technology has a positive effect on improving rice production efficiency. Finally, the disaster rate had a significant negative impact on TFP and Tech. Natural disasters such as floods and droughts can cause serious damage to crops including rice, which in turn has a negative effect on rice production efficiency.
Third is the effect of the socioeconomic development level on rice production efficiency. The urbanization rate had a positive effect on TFP, Tech and Pech, while it had a negative effect on Sech. However, none of them, passed the significance test. This result suggests that improving the level of urbanization can partially enhance the efficiency of resource allocation and technological progress. However, urbanization has also resulted in a shortage of farmland resources, which hinders the improvement of scale efficiency. The per capita disposable income of farmers significantly contributes to TFP and Pech. An increase in farmers’ incomes levels means they can afford to purchase production materials, such as seeds, chemical fertilizers, pesticides, and mechanical equipment, and invest more in technology, leading to an enhancement in rice production efficiency.
Next is the impact of the policy systems on rice production efficiency should also be considered. The level of financial support for agriculture had a significant positive effect on TFP, Pech, and Sech, whereby, the financial support and input of agricultural public goods will promote production efficiency. With an increase in financial support for agriculture, investment in public agricultural products are found to incease. Improvement to infrastructure favor the application of technology in the rice production process, thus promoting efficiency.

3.3. Heterogeneity Analysis

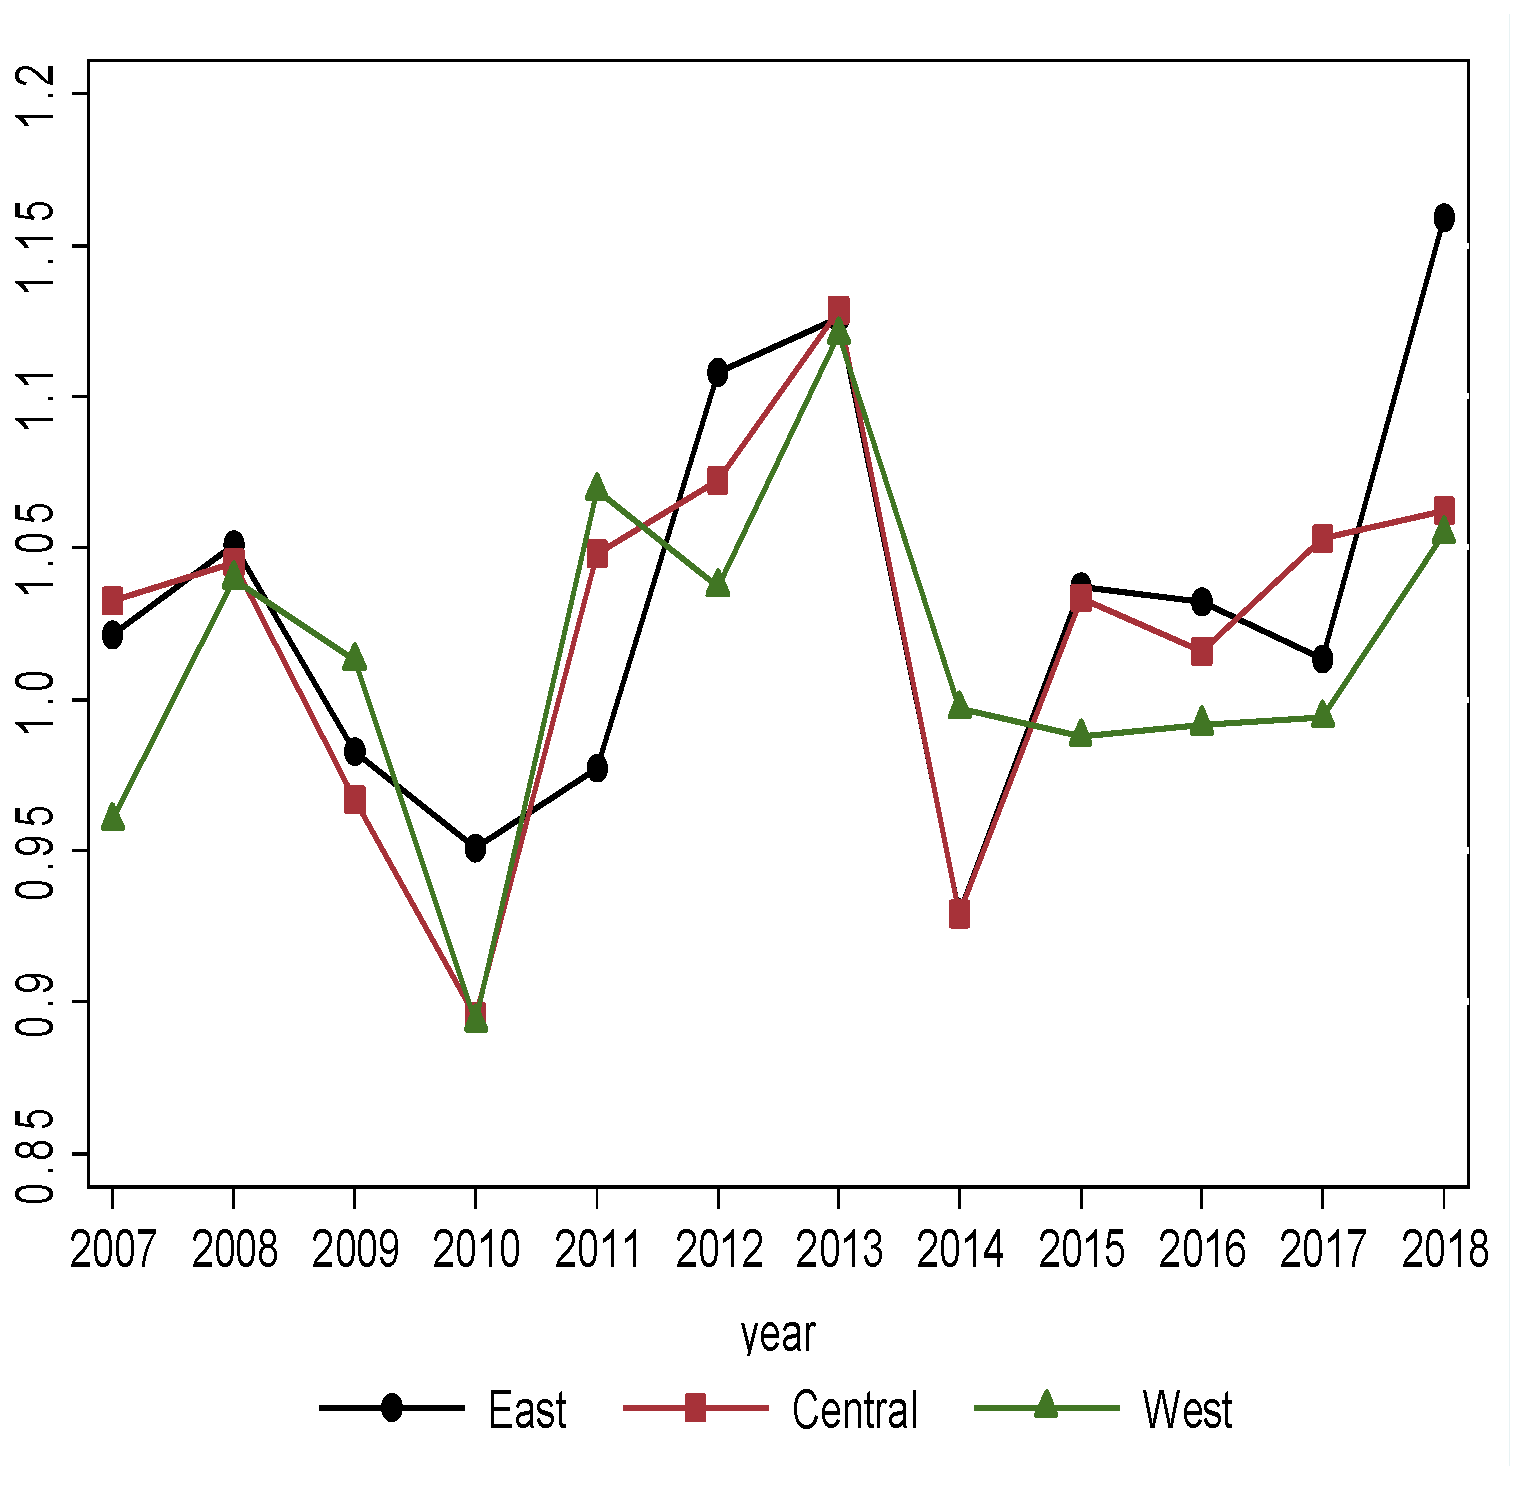
China is a vast country, and the differences in resource endowments among provinces lead to differences in rice production efficiency changes and their influencing factors in different regions. According to geographical location, the samples were divided into eastern regions (Jiangsu, Liaoning, Hebei, Shandong, Zhejiang, Fujian, Guangdong, Guangxi, Hainan), central regions (Heilongjiang, Jilin, Henan, Hubei, Hunan, Anhui, Jiangxi, Inner Mongolia) and western regions (Chongqing, Sichuan, Yunnan, Guizhou, Shaanxi, Ningxia) respectively. 
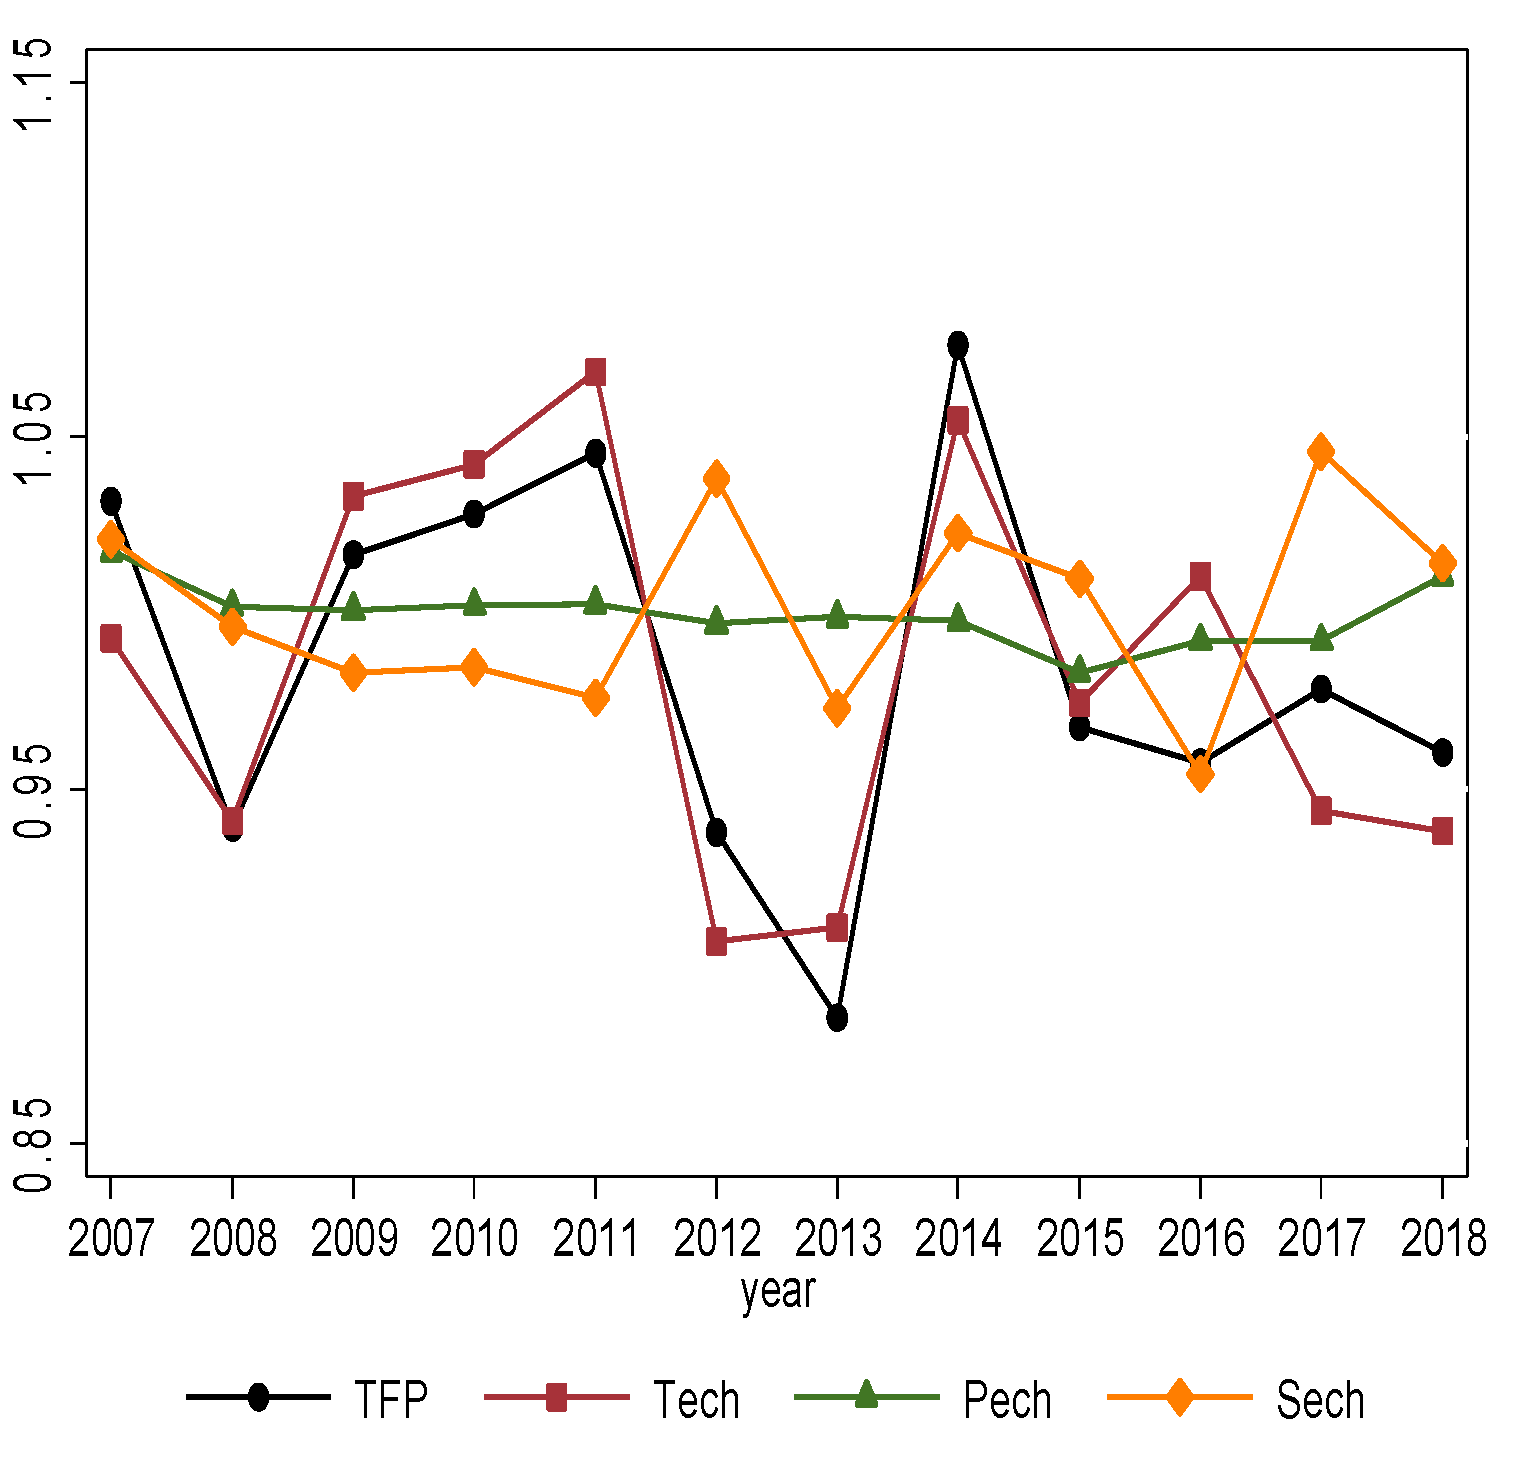
Figure 2 shows the variation trend of rice production efficiency in eastern, central and western China from 2007 to 2018. In general, rice production efficiency is in constant change. The three major regions have basically the same magnitude of change. The order of average rice production efficiency is eastern, central and western. Specifically, the rice production efficiency showed a decreasing trend between 2008 and 2010, and the average production efficiency of the three major regions increased continuously between 2010 and 2013. After a brief decrease in rice production efficiency in 2014, the production efficiency of each region showed a fluctuating upward trend since 2015.
Table 5 reports the results of heterogeneity analysis of factors influencing rice production efficiency. Farmers’ education level significantly contributed to the eastern and central regions, but the western region is opposite. These probably due to farmers in the eastern and central regions have higher education levels and more advantages in agricultural knowledge and production skills. The amount of labor employed per mu significantly inhibited the rice production efficiency in the eastern region. Compared to the central and western regions, excessive labor inputs were not good for rice production efficiency in the eastern region, where the level of technology application in the agricultural production process is higher. The contribution of agricultural machinery density to TFP is significant only in the eastern region, implying that the insufficient level of agricultural mechanization leads to the under utilization of rice production resources and hinders the improvement of rice production efficiency in central and western regions. Per capita disposable income of farmers had a positive effect on rice production efficiency in the three regions, however it was significant only in the western region. Which may be explained by the fact that rice production in the western region is still mainly “crude”, and the influence of factor input on rice yield increased, and the per capita disposable income had more significant effect on TFP in the western region. Financial support for agriculture significantly contributed rice production only efficiency in the eastern region, indicating higher support for agricultural production in the eastern region had a more pronounced contribution to production efficiency.

3.4. Analysis of Production Efficiency of Different Rice Species

The current rice types in China include four types: japonica rice, early indica rice, medium indica rice and late indica rice. Indica rice is suitable for cultivation at low latitudes, low altitudes and humid heat regions, of which early indica rice is mainly planted in Zhejiang, Anhui, Fujian, Jiangxi, Hubei, Hunan, Guangdong, Guangxi and Hainan. Medium indica rice is mainly distributed in Jiangsu, Anhui, Fujian, Henan, Hubei, Hunan, Chongqing, Sichuan, Guizhou, Yunnan and Shaanxi, while late indica rice is mainly concentrated in Zhejiang, Anhui, Fujian, Jiangxi, Hubei, Hunan, Guangdong, Guangxi and Hainan. Japonica rice with its long growth cycle and high cold tolerance, is mainly planted in high altitude area of middle latitude, and the main planting provinces include Hebei, Inner Mongolia, Liaoning, Jilin, Heilongjiang, Jiangsu, Zhejiang, Anhui, Shandong, Henan, Hubei, Yunnan and Ningxia. In this paper, the DEA-Malmquist index was applied to measure the production efficiency of four rice varieties and to investigate the factors influencing the production efficiency.

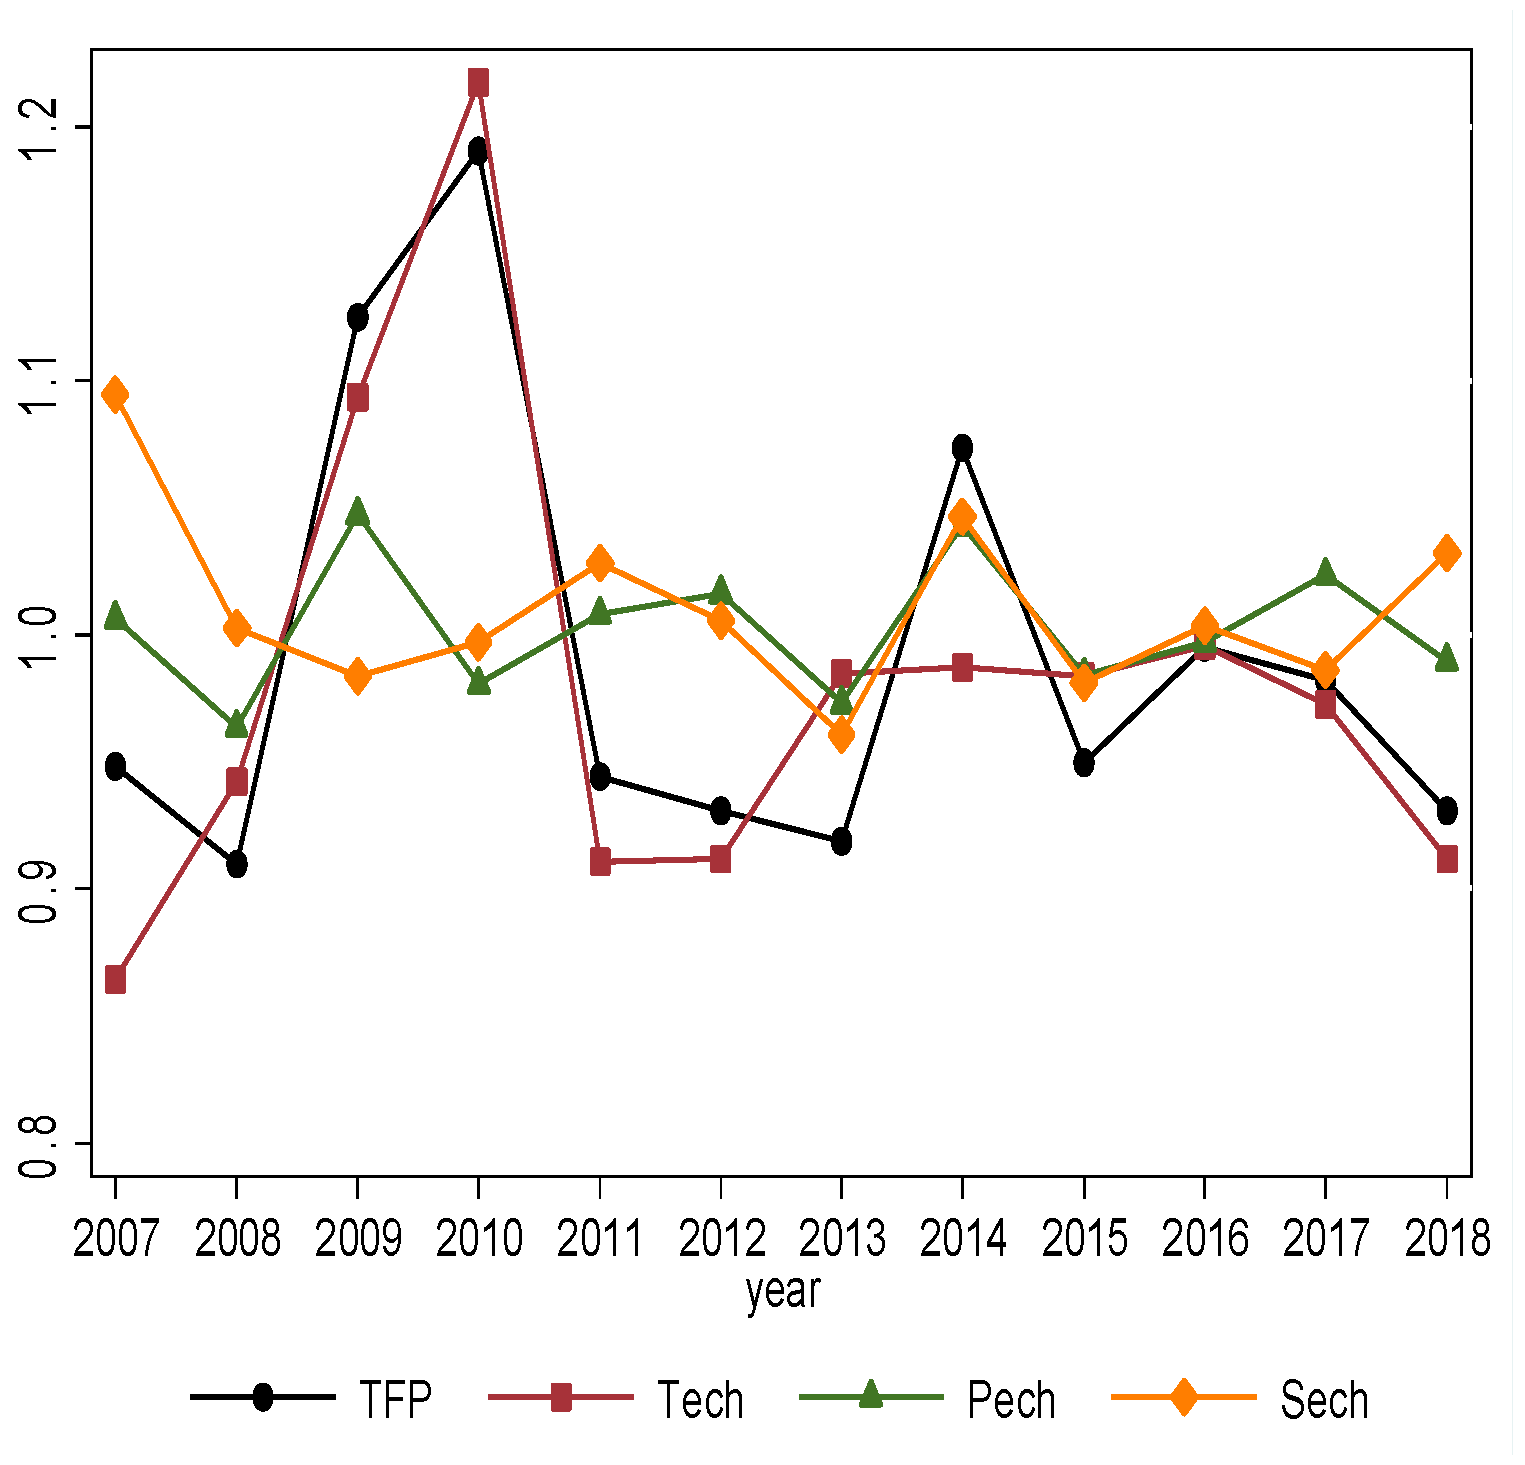
3.4.1. Changes in Production Efficiency of Japonica Rice and Influencing Factors

Figure 3 shows the production efficiency of japonica rice in China and its decomposition during 2007 to 2018, and it can be found that the production efficiency of japonica rice decreases in fluctuation. Specifically, the production efficiency of japonica rice from 2008 to 2013 showed a tendency of increasing significantly and decreasing rapidly, and the trend of technological progress was consistent with it. From 2014 to 2018, the production efficiency of japonica rice decreased in fluctuation, and the trend of change in technical progress was consistent with it, suggesting that the change in production efficiency of japonica rice was mainly affected by the change of technological progress.
Table 6 shows the regression results of the factors influencing the production efficiency of japonica rice. Per capita disposable income had a negative effect on the production efficiency and pure technical efficiency in the main producing provinces of japonica rice. Because japonica rice was mainly distributed in the northern part of the Yellow River basin, the northeast and the higher altitude areas in the south, and food production in these provinces occupied a larger share in there. With the increase of the per capita income level, the consumption structure of agricultural products has changed greatly, and the demand for grain such as rice decreases significantly, while the demand for vegetables and fruits, meat and egg milk has gradually increased. Farmers’ enthusiasm for traditional crops such as rice is reduced, which restricts the growth of production efficiency. In addition, financial support for agriculture contributed to the change of rice production efficiency and scale efficiency, because the financial support for agriculture improved agricultural infrastructure and rural road reconstruction, which played an incentive role in improving rice production efficiency.

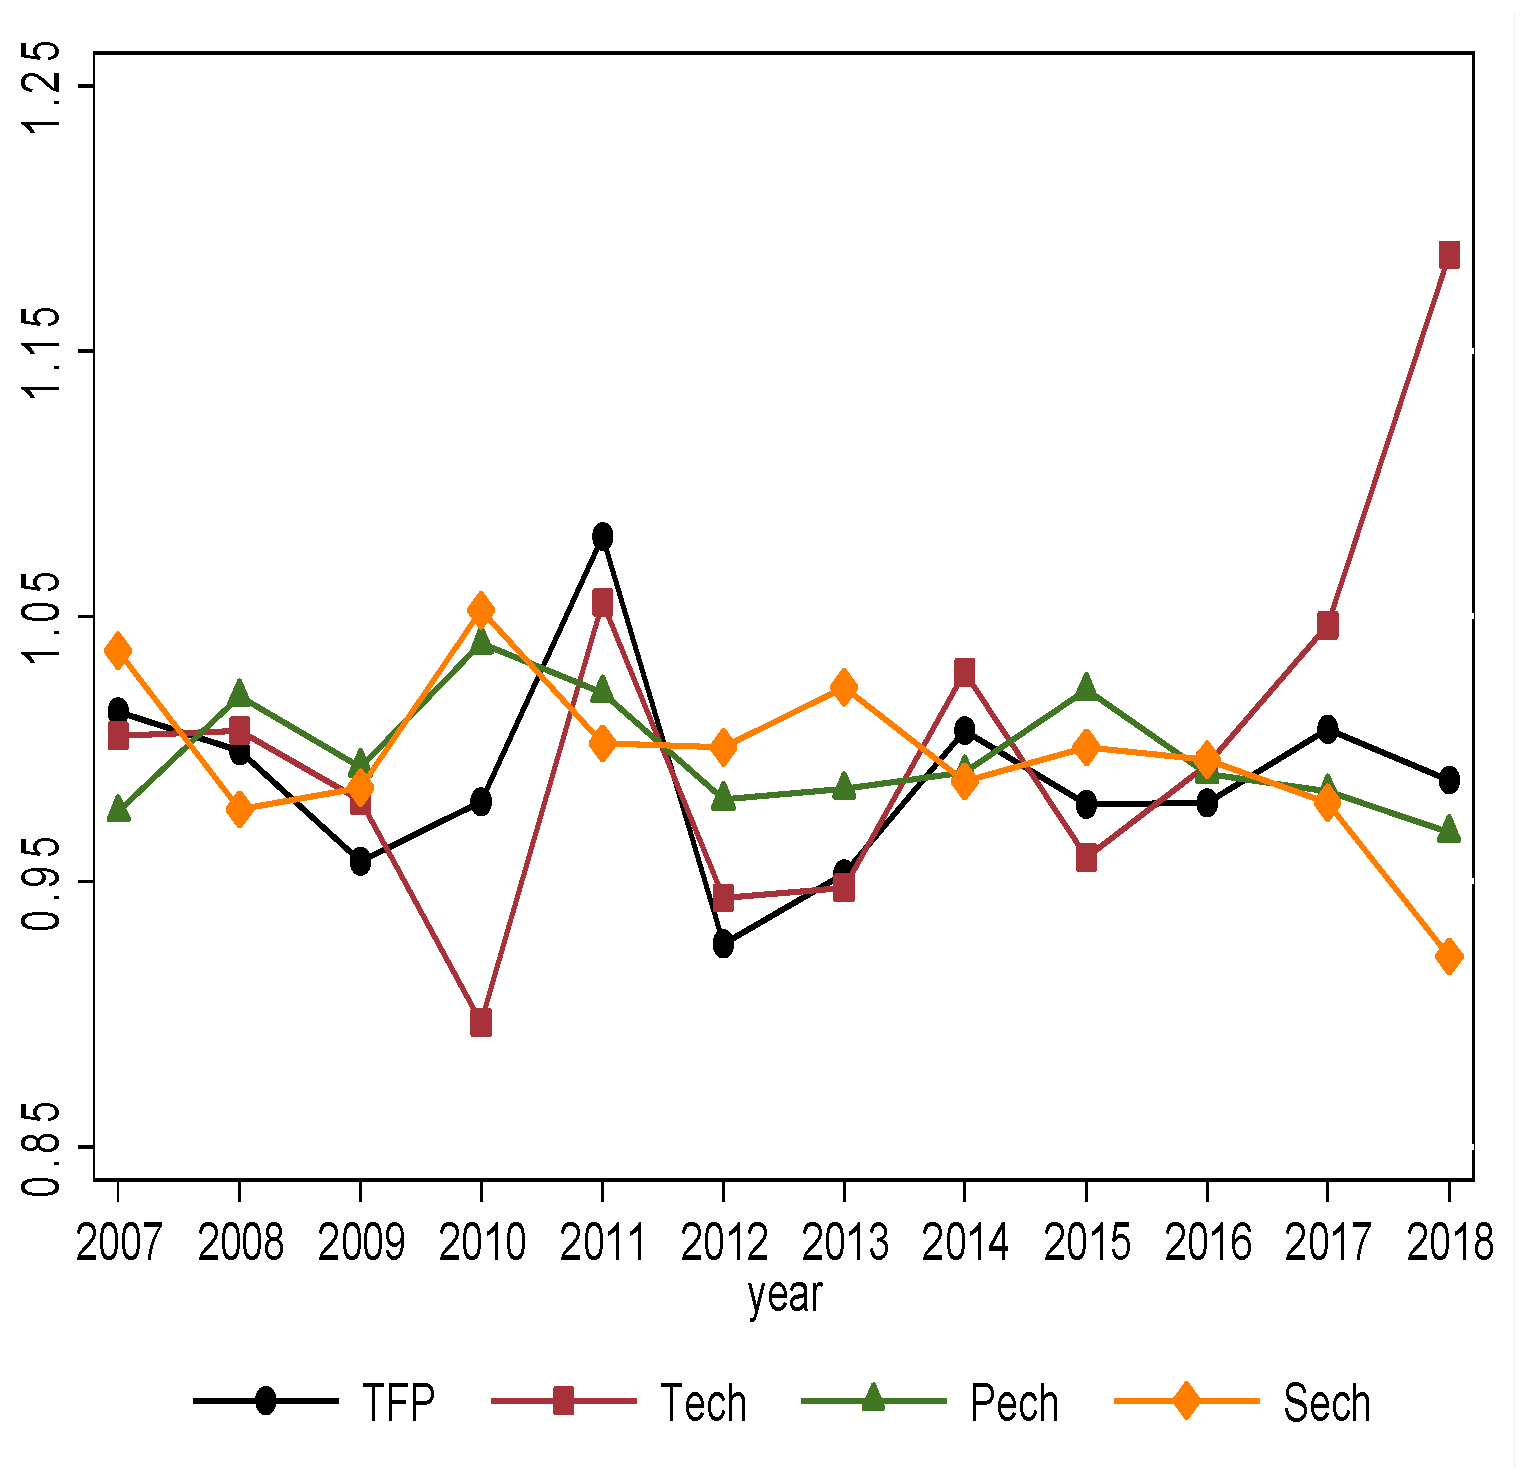
3.4.2. Production Efficiency Change and Influencing Factors of Early Indica Rice

Figure 4 shows the production efficiency of early indica rice in China and its decomposition from 2007 to 2018. It can be found that the production efficiency of early indica rice is at a low level, and the production efficiency index is less than 1 in most years. From 2011 to 2012, the production efficiency of early indica rice gradually deteriorated, and the technical progress efficiency index is in a declining state. After a brief increase in 2013, the production efficiency of early indica rice has been deteriorated from 2014 to 2016, mainly due to the decline in technical progress efficiency. It is noteworthy that the technical progress efficiency of early indica rice achieved a significant increase in 2018, while the production efficiency decreased. This is because the scale efficiency has dropped significantly in the same year.
Table 7 demonstrates the regression results of factors influencing the productivity of early indica rice. The disaster rate has a significant negative effect on production efficiency of early indica rice. Disasters caused by unstable meteorological factors such as floods and droughts can directly affect the total factor productivity. Furthermore, the promotion effect of agricultural machinery density on production efficiency, although not significant, had a p-value of 0.112, indicating that the improvement of agricultural mechanization level was helpful to promote rice production efficiency.

3.4.3. Changes in Productivity and Factors Influencing Production Efficiency of Medium Indica Rice

Figure 5 displays the production efficiency of medium indica rice and its decomposition during the period 2007 to 2018. It can be found that similar to early indica rice, the production efficiency of medium indica rice is at a low level, and the productivity index of most years is less than 1 in most years. From the trend of change, the general trend of production efficiency and technical progress changes were consistent. Medium rice production efficiency also experienced a significant decline in 2010–2013. The decline in the efficiency of technical progress was the main reason. Since the production efficiency experienced a brief growth in 2014, both production efficiency and technical progress changes showed a trend of decline in fluctuation from 2015 to 2018.
Table 8 exhibits the regression results of the factors influencing production efficiency of medium indica rice. The amount of labor employees per mu influenced the change in production efficiency, technical progress and scale efficiency of medium indica rice. These suggested the increase in laborers per mu input enhanced the technical and managerial ability, which significantly promoted the production efficiency of medium indica rice.

3.4.4. Changes in Production Efficiency and Factors Influencing Late Indica Rice

Figure 6 shows the production efficiency of late indica rice in China and its decomposition from 2007 to 2018. The production efficiency of late indica rice gradually decreases from 2011 to 2013, while the technical progress index was also in a declining state. During 2013 to 2014, the production efficiency of late indica rice in China appeared a substantial increase. Since 2016, the Malmquist index was less than 1, indicating that the productivity of late indica rice decreased. In general, late indica rice production efficiency is consistent with the technical progress index, and the relative progress of technology is the determinant of the change of production efficiency.
Table 9 reveals the regression results of factors influencing the production efficiency of late indica rice productivity. The rice planting structure had a significant negative effect on production efficiency. It was different from the baseline regression results. In addition, the disaster rate had negative effect, too. Non-agricultural income improved the production efficiency of japonica rice. Both the per capita disposable income and financial support for agriculture limited the production efficiency of late indica rice. These suggest that the increase of per capita income level reduces the farmers’ demand for rice and other grains, thus restraining farmers’ enthusiasm and investment in traditional cropping industries such as rice. In addition, financial support for agriculture significantly inhibited the efficiency of rice production. This was on account of the low utilization rate of financial support for agriculture.

4. Discussion

From 2007 to 2018, rice production efficiency increased, and technological progress aligned with this trend. Moreover, the production efficiency of rice in the main rice-growing regions of China has shown an uneven regional development, gradually declining from the eastern to the central and western regions. This finding is consistent with previous research [53], which discussed the changing trend of Chinese grain production efficiency. Our study analyzed the changes in production efficiency from a more detailed perspective.
The important role of the education level in rice production efficiency was also confirmed by existing research [47], which investigated the factors affecting rice production efficiency in Nepal and found that the education level of farmers was an important determinant.
Huang et al. [52] studied China’s urbanization and grain production patterns and found that urbanization has a significant negative impact on grain production. In our study, the influence of urbanization on rice production efficiency in China is positive but not significant. Urbanization has led to a shortage of cultivated land, which makes it difficult to manage grain production extensively and is not conducive to improving production efficiency.
Natural disasters can limit food production [51]. Our results demonstrate that disaster rates significantly inhibit the production efficiency of early and late indica rice. Additionally, disasters caused by unstable meteorological factors such as floods and droughts, can directly reduce total factor productivity.
Table 8 shows that the amount of employees per mu significantly promoted the TFP of medium indica rice. This result is in line with Abdulai and Eberlin [48], who cited Nicaragua as an example of the positive effect of labor input on maize and bean production efficiency.
The Per capita disposable income significantly increased rice production efficiency in China, which conflicts with the results of Tesema [43], who studied the factors affecting maize production efficiency in Ethiopia and found that the rise in farmers’ per capita disposable income mainly came from non-farm income. This, in turn, leads to farmers spending a lot of time on non-farm activities, resulting in a decrease in production efficiency. In contrast to Ethiopia, the rising income level of Chinese farmers means that those farmers have higher capital to purchase production inputs such as seeds, fertilizers, pesticides, and mechanical equipment, and can invest in technology to a greater extent, which is conducive to improving rice production efficiency.

5. Conclusions and Policy Implications

5.1. Research Conclusions

In this study, we used the DEA-Malmquist method to measure the comprehensive efficiency of rice production in China and discussed the relevant influencing factors. Our findings reveal that from 2007 to 2018, China’s rice production efficiency showed a fluctuating upward trend with significant periodic and regional differences. During 2007 to 2014, rice production efficiency greatly fluctuated. The fluctuation range of rice production efficiency decreased over time, and the changes were mainly influenced by technical progress. The trend in different regions was basically the same, showing a decreasing pattern from east to west. Farmers can improve the efficiency of rice production by acquiring more agricultural knowledge and applying modern cultivation techniques.
Different factors have different effects on the comprehensive efficiency of rice production. For example, the level of education, planting structure, machine density, urbanization, and financial support have all effectively improved the efficiency of rice production, while per capita arable land area, employees per mu, and disaster rate hindered the improvement of rice production efficiency. Therefore, farmers could also improve their rice production capacity through education and training and do a good job in rice management to support and stabilize seedlings, accelerate plant growth and reduce disaster losses.
Our results also revealed that the production efficiency of different rice varieties (japonica rice, early indica rice, medium indica rice, and late indica rice) was found to be low and improvements were mainly due to technological progress. The production efficiency of japonica rice was mainly positively influenced by financial policy. While the production efficiency of indica rice was mainly negatively affected by the disaster rate. Therefore, farmers should pay attention to rice management and mitigate disaster losses to improve the production efficiency of indica rice.

5.2. Policy Implications

First, promoting agricultural technological progress and improving rice production efficiency from a technical perspective is highly recommended. Additionally, the spatial and temporal distribution pattern of rice production efficiency in China indicates evident regional spatial differentiation. Therefore, the Chinese government should plan the rice production layout according to local conditions and increase policy support for the central and western regions to enhance rice production efficiency.
Second, it is crucial to take targeted measures based on different rice species. On the one hand, the Chinese government should increase financial support for major japonica-rice-producing provinces to increase grain yield per unit area. On the other hand, farmers in major indica-rice-producing provinces could be actively guided and encouraged to participate in large-scale activities to help them resist the negative impacts of natural disasters.
Third, it is essential to promote the development of agricultural machinery and irrigation technology and gradually shift agricultural technology progress to ensure the sustainability of rice in improving production efficiency. Furthermore, other rice-growing countries can learn from China’s experience and could make greater efforts to improve farmers’ education and achieve agricultural mechanization.

Author Contributions

Conceptualization, J.L. (Jia Li); methodology, X.W. and J.L. (Jia Li); software, J.S. and J.L. (Jiaojiao Li); validation, Y.C.; formal analysis, J.L. (Jianxu Liu); investigation, J.L. (Jiaojiao Li) and Y.C.; resources, J.L. (Jianxu Liu); data curation, J.S.; writing—original draft preparation, X.W.; writing—review and editing, J.L. (Jiaojiao Li); visualization, J.L. (Jia Li); supervision, X.W. and S.S.; funding acquisition, J.L. (Jianxu Liu) and S.S. All authors have read and agreed to the published version of the manuscript.

Funding

This research received no external funding.

Institutional Review Board Statement

Not applicable.

Informed Consent Statement

Not applicable.

Data Availability Statement

All data can be obtained by email from the corresponding author.

Acknowledgments

This work has been assisted by the China-ASEAN High-Quality Development Research Center at Shandong University of Finance and Economics and the “The-oretical Economics Research Innovation Team” of the Youth Innovation Talent Introduction and Education Plan of Colleges and Universities in Shandong Province for financial support, as well as the Faculty of Economics and the Centre of Excellence in Econometrics at Chiang Mai University.

Conflicts of Interest

The authors declare no conflict of interest.

References

  1. Chen, J. Rapid Urbanization in China: A Real Challenge to Soil Protection and Food Security. Catena 2007, 69, 1–15. [Google Scholar] [CrossRef]
  2. Wheeler, T.; Braun, J.V. Climate Change Impacts on Global Food Security. Science 2013, 341, 508–513. [Google Scholar] [CrossRef] [PubMed]
  3. Rosegrant, M.W.; Ringler, C.; Zhu, T. Water for Agriculture: Maintaining Food Security under Growing Scarcity. Annu. Rev. Environ. Resour. 2009, 34, 205–222. [Google Scholar] [CrossRef]
  4. Laborde, D.; Martin, W.; Swinnen, J.; Vos, R. COVID-19 Risks to Global Food Security. Science 2020, 369, 500–502. [Google Scholar] [CrossRef]
  5. Imran, M.A.; Ali, A.; Ashfaq, M.; Hassan, S.; Culas, R.; Ma, C. Impact of Climate Smart Agriculture (CSA) hrough Sustainable Irrigation Management on Resource Use Efficiency: A Sustainable Production Alternative for Cotton. Land Use Policy 2019, 88, 104113. [Google Scholar] [CrossRef]
  6. He, W.; Liu, Y.; Sun, H.; Taghizadeh, F. How does Climate Change Affect Rice Gield in China? Agriculture 2020, 10, 441. [Google Scholar] [CrossRef]
  7. Zhang, Q.; Zhang, F.; Wu, G.; Mai, Q. Spatial Spillover Effects of Grain Production Efficiency in China: Measurement and scope. J. Clean. Prod. 2021, 278, 121062. [Google Scholar] [CrossRef]
  8. Ma, L.; Long, H.; Tang, L.; Tu, S.; Zhang, Y.; Qu, Y. Analysis of the Spatial Variations of Determinants of Agricultural Production Efficiency in China. Comput. Electron. Agric. 2021, 180, 105890. [Google Scholar] [CrossRef]
  9. Gong, B. Agricultural Reforms and Production in China: Changes in Provincial Production Function and Productivity in 1978–2015. J. Dev. Econ. 2018, 132, 18–31. [Google Scholar] [CrossRef]
  10. Coluccia, B.; Valente, D.; Fusco, G.; De, L.F.; Porrini, D. Assessing Agricultural Eco-efficiency in Italian Regions. Ecol. Indic. 2020, 116, 106483. [Google Scholar] [CrossRef]
  11. Tan, M.H.; Li, X.B.; Xie, H.; Lu, C.H. Urban Land Expansion and Arable Land Loss in China—A Case Study of Beijing-Tianjin-Hebei region. Land Use Policy 2005, 22, 187–197. [Google Scholar] [CrossRef]
  12. Liu, Y.; Li, Y. Revitalize the world’s countryside. Nature 2017, 548, 275–277. [Google Scholar] [CrossRef] [PubMed] [Green Version]
  13. Wang, J.; Li, Y.; Huang, J.; Yan, T.; Sun, T. Growing Water Scarcity, Food Security and Government Responses in China. Glob. Food Secur. 2017, 14, 9–17. [Google Scholar] [CrossRef]
  14. Long, H.; Zhang, Y.; Tu, S. Rural Vitalization in China: A Perspective of Land Consolidation. J. Geogr. Sci. 2019, 29, 517–530. [Google Scholar] [CrossRef] [Green Version]
  15. Lin, J.Y. Rural Reforms and Agricultural Growth in China. Am. Econ. Rev. 1992, 82, 34–51. [Google Scholar]
  16. Fan, S.; Pardey, P.G. Research, Productivity, and Output Growth in Chinese Agriculture. J. Dev. Econ. 1997, 53, 115–137. [Google Scholar] [CrossRef]
  17. Chavas, J.P.; Petrie, R.; Roth, M. Farm Household Production Efficiency: Evidence from The Gambia. Am. J. Agric. Econ. 2005, 87, 160–179. [Google Scholar] [CrossRef] [Green Version]
  18. James, O. Measuring Technical Efficiency and Productivity Growth: A Comparison of SFA and DEA on Norwegian Grain Production Data. Appl. Econ. 2007, 39, 2617–2630. [Google Scholar]
  19. Watto, M.A.; Mugera, A. Measuring Efficiency of Cotton Cultivation in Pakistan: A Restricted Production Frontier Study. J. Sci. Food Agric. 2014, 94, 3038–3045. [Google Scholar] [CrossRef]
  20. Chen, F.; Zhao, Y. Determinants and Differences of Grain Production Efficiency between Main and Non-Main Producing Area in China. Sustainability 2019, 11, 5225. [Google Scholar] [CrossRef] [Green Version]
  21. Huang, M.; Zeng, L.; Liu, C.; Li, X.; Wang, H. Research on the Eco-Efficiency of Rice Production and Its Improvement Path: A Case Study from China. Int. J. Environ. Res. Public Health 2022, 19, 8645. [Google Scholar] [CrossRef] [PubMed]
  22. Raghbendra, J.; Puneet, C.; Santanu, G. Productivity, Technical and Allocative Efficiency and Farm Size in Wheat Farming in India: A DEA Approach. Appl. Econ. Lett. 2000, 7, 1–5. [Google Scholar]
  23. Ogundari, K.; Ojo, S.O. The Determinants of Technical Efficiency in Mixed Crop Food Production in Nigeria: A Stochastic Parametric Approach. East Afr. J. Rural Dev. 2005, 21, 15–22. [Google Scholar] [CrossRef]
  24. Wu, L.; Hu, Q.; Wang, J.; Zhu, D. Empirical Analysis of the Main Factors Influencing Rice Harvest Losses Based on Sampling Survey Data of Ten Provinces in China. China Agric. Econ. Rev. 2017, 9, 287–302. [Google Scholar] [CrossRef]
  25. Xie, K.; Guo, J.; Ward, K.; Luo, G.; Shen, Q.; Guo, S. The Potential for Improving Rice Yield and Nitrogen Use Efficiency in Smallholder Farmers: A Case Study of Jiangsu, China. Agronomy 2020, 10, 419. [Google Scholar] [CrossRef] [Green Version]
  26. McCloud, N.; Kumbhakar, S.C. Do Subsidies Drive Productivity? A Cross-Country Analysis of Nordic Dairy Farms. Adv. Econom. 2008, 23, 245–274. [Google Scholar]
  27. Liang, L.; Ridoutt, B.G.; Wu, W.; Lal, R.; Wang, L.; Wang, Y.; Li, C.; Zhao, G. A Multi-indicator Assessment of Peri-urban Agricultural Production in Beijing, China. Ecol. Indic. 2019, 97, 350–362. [Google Scholar] [CrossRef]
  28. Li, J.; Li, Y. Influence Measurement of Rapid Urbanization on Agricultural Production Factors Based on Provincial Panel Data. Socio-Econ. Plan. Sci. 2019, 67, 69–77. [Google Scholar] [CrossRef]
  29. Saravia-Matus, S.L.; Hörmann, P.A.; Berdegué, J.A. Environmental Efficiency in the Agricultural Sector of Latin America and the Caribbean 1990–2015: Are Greenhouse Gas Emissions Reducing While Agricultural Production is Increasing? Ecol. Indic. 2019, 102, 338–348. [Google Scholar] [CrossRef]
  30. Zhu, H.Y.; Li, X.B.; Xin, L.J. Intensity Change in Cultivated Land Use in China and Its Policy Implications. J. Nat. Resour. 2007, 22, 907–915. [Google Scholar]
  31. Koirala, K.H.; Mishra, A.; Mohanty, S. Impact of Land Ownership on Productivity and Efficiency of Rice Farmers: The Case of the Philippines. Land Use Policy 2016, 50, 371–378. [Google Scholar] [CrossRef]
  32. Zhao, Y.Z.; Jiang, Q.X.; Wang, Z.L. The System Evaluation of Grain Production Efficiency and Analysis of Driving Factors in Heilongjiang Province. Water 2019, 11, 1073. [Google Scholar] [CrossRef] [Green Version]
  33. Deng, X.; Gibson, J. Improving Eco-efficiency for the Sustainable Agricultural Production: A Case Study in Shandong, China. Technol. Forecast. Soc. Chang. 2019, 144, 394–400. [Google Scholar] [CrossRef]
  34. Yin, G.; Lin, Z.; Jiang, X.; Yan, H.; Wang, X. Spatiotemporal Differentiations of Arable Land Use Intensity—A Comparative Study of two Typical Grain Producing Regions in Northern and Southern China. J. Clean. Prod. 2019, 208, 1159–1170. [Google Scholar] [CrossRef]
  35. Wallace, J.S. Increasing Agricultural Water Use Efficiency to Meet Future Food Production. Agric. Ecosyst. Environ. 2000, 82, 105–119. [Google Scholar] [CrossRef]
  36. Teruel, R.G.; Kuroda, Y. Public Infrastructure and Productivity Growth In Philippine Agriculture, 1974–2000. J. Asian Econ. 2005, 16, 555–576. [Google Scholar] [CrossRef]
  37. Ito, J. Inter-regional Difference of Agricultural Productivity in China: Distinction between Biochemical and Machinery Technology. China Econ. Rev. 2010, 21, 394–410. [Google Scholar] [CrossRef]
  38. Villano, R.; Bravo-Ureta, B.; Solís, D.; Fleming, E. Modern Rice Technologies and Productivity in the Philippines: Disentangling Technology from Managerial Gaps. J. Agric. Econ. 2015, 66, 129–154. [Google Scholar] [CrossRef] [Green Version]
  39. Charnes, A.; Cooper, W.W.; Rhodes, E. Measuring the Efficiency of Decision Making Units. Eur. J. Oper. Res. 1978, 2, 429–444. [Google Scholar] [CrossRef]
  40. Färe, R.; Shawna, G.; Marie, E.; Norris; Zhang, Z. Productivity Growth, Technical Progress, and Efficiency Change in Industrialized Countries: Comment. Am. Econ. Rev. 1994, 84, 66–83. [Google Scholar]
  41. China Rural Statistical Yearbook. Available online: http://cnki.nbsti.net/CSYDMirror/trade/yearbook/Single/N2021120010?z=Z009 (accessed on 24 December 2022).
  42. National Bureau of Statistics. Available online: https://data.stats.gov.cn/easyquery.htm?cn=C01 (accessed on 24 December 2022).
  43. Tesema, T. Determinants of Production Efficiency of Maize-Dominated Farmers in Western Parts of Ethiopia in Gudeya Bila District: Evidence under Shifting Cultivation Area. Sci. World J. 2022, 2022, 3355224. [Google Scholar] [CrossRef] [PubMed]
  44. Tian, W.M.; Wan, G.H. Technical Efficiency and Its Determinants in China’s Grain Production. J. Product. Anal. 2000, 13, 159–174. [Google Scholar] [CrossRef]
  45. Srisompun, O.; Boontang, S. Production Efficiency and Its Determinants of Cassava Farms in Maha Sarakham, Thailand. J. Int. Soc. Southeast Asian Agric. Sci 2020, 26, 73–85. [Google Scholar]
  46. Yan, Z.X.; Zhou, W.; Wang, Y.Y.; Chen, X. Comprehensive Analysis of Grain Production Based on Three-Stage Super-SBM DEA and Machine Learning in Hexi Corridor, China. Sustainability 2022, 14, 8881. [Google Scholar] [CrossRef]
  47. Piya, S.; Kiminami, A.; Yagi, H. Comparing the Technical Efficiency of Rice Farms in Urban and Rural Areas: A Case Study from Nepal. Trends Agric. Econ. 2012, 5, 48–60. [Google Scholar] [CrossRef] [Green Version]
  48. Abdulai, A.; Eberlin, R. Technical Efficiency during Economic Reform in Nicaragua: Evidence from Farm Household Survey data. Econ. Syst. 2001, 25, 113–125. [Google Scholar] [CrossRef]
  49. Wang, X.; Li, X.; Xiao, X.; Fan, L.; Zuo, L. Changes in the Water-Energy Coupling Relationship in Grain Production: A Case Study of the North China Plain. Int. J. Environ. Res. Public Health 2022, 19, 9527. [Google Scholar] [CrossRef]
  50. Tian, X.; Yi, F.; Yu, X. Rising Cost of Labor and Transformations in Grain Production in China. China Agric. Econ. Rev. 2020, 12, 158–172. [Google Scholar] [CrossRef]
  51. Chunlin, W.; Yufei, X. Analysis of Agricultural Meteorological Disasters in Shaanxi Province from 1981 to 2018 and Their Impact on Grain Production. E3S Web Conf. 2020, 204, 01002. [Google Scholar] [CrossRef]
  52. Huang, H.; Hou, M.; Yao, S. Urbanization and Grain Production Pattern of China: Dynamic Effect and Mediating Mechanism. Agriculture 2022, 12, 539. [Google Scholar] [CrossRef]
  53. Zhang, D.; Wang, H.; Lou, S.; Zhong, S. Research on Grain Production Efficiency in China’s Main Grain Producing Areas from the Perspective of Financial Support. PLoS ONE 2021, 16, e0247610. [Google Scholar] [CrossRef] [PubMed]
Figure 1. Variation Characteristics of Rice Production Efficiency in China from 2007 to 2018.
Agronomy 13 01075 g001
Figure 2. Trends in Rice Production Efficiency by Regions, 2007–2018.
Agronomy 13 01075 g002
Figure 3. Trends in Production Efficiency of Japonica Rice from 2007 to 2018.
Agronomy 13 01075 g003
Figure 4. Trends in Production Efficiency of Early Indica Rice from 2007 to 2018.
Agronomy 13 01075 g004
Figure 5. Trends in Production Efficiency of Medium Indica Rice from 2007 to 2018.
Agronomy 13 01075 g005
Figure 6. Trends in Production Efficiency of Late Indica Rice from 2007 to 2018.
Agronomy 13 01075 g006
Table 1. Index System of Rice Production Efficiency.
ClassificationVariableMeanStdMinMax
Input indexDirect cost715.3485401.7618160.261920.17
Labor input726.9291472.1947138.212188.44
Output indexRice yield2125.2791111.323559.265478.01
Table 2. Descriptive Statistics.
VariableMeanStdMinMax
TFP1.02420.11750.67601.9343
Tech1.02100.09050.73641.3777
Pech1.00810.09540.68211.8900
Sech0.99910.06620.71891.3910
PCL1.09790.83520.23284.1877
ELF8.59250.65556.594010.1049
AEP2.57480.54951.08183.6677
APS0.30620.26800.00050.9997
EIR0.51880.20430.16441.4976
AMD0.76240.45540.04562.4787
DIR0.25710.16420.00180.9894
URR0.51010.09360.27460.6985
PDI0.68260.72930.17153.8834
FSA0.10820.02870.01390.1897
Table 3. Production Efficiency and Decomposition of Rice in 23 Major Rice Production Provinces in China from 2007 to 2018.
DMUTFPTechPechSechDMUTFPTechPechSech
Yunnan1.01521.00841.00051.0085Henan1.02691.01421.01341.0014
Inner
Mongolia
1.04891.03711.00781.0029Zhejiang1.02971.03601.00001.0137
Jilin1.03591.02561.00451.0041Hainan1.04151.02161.03450.9937
Sichuan1.01181.01031.00001.0036Hubei1.01751.02631.00000.9953
Ningxia1.02631.01801.01700.9911Hunan1.04251.02411.03400.9883
Anhui1.00171.02820.99980.9835Fujian1.01901.01261.00611.0040
Shandong1.01771.02960.99400.9964Guizhou1.00401.01100.99711.0002
Guangdong1.02931.02041.01920.9945Liaoning1.02301.02961.00530.9946
Guangxi1.08171.02051.07520.9905Chongqing1.00291.00840.97571.0212
Jiangsu0.99921.01380.99740.9965Shaanxi1.01861.01001.00011.0088
Jiangxi0.97571.01580.98180.9852Heilongjiang1.03881.03221.00001.0072
Hebei1.04941.02841.02390.9933Nation wide1.02421.02101.00810.9991
Table 4. Factors Affecting Rice Production Efficiency and Its Decomposition Index.
(1)(2)(3)(4)
TFPTechPechSech
PCL−0.0488 *−0.0060−0.0171−0.0198
(0.0289)(0.0165)(0.0260)(0.0158)
ELF0.1226 *−0.00280.0979 *0.0347
(0.0635)(0.0362)(0.0570)(0.0347)
AEP−0.2027 ***−0.0195−0.1585 ***−0.0121
(0.0651)(0.0371)(0.0584)(0.0355)
APS0.1114 *0.00950.1147 *0.0112
(0.0675)(0.0384)(0.0605)(0.0368)
EIR0.07720.01330.03090.0346
(0.0949)(0.0540)(0.0851)(0.0518)
AMD0.0779 **0.00630.04800.0256
(0.0339)(0.0193)(0.0304)(0.0185)
DIR−0.0951 **−0.0467 *−0.05190.0043
(0.0480)(0.0273)(0.0430)(0.0262)
URR0.26320.27770.0897−0.0669
(0.5069)(0.2886)(0.4545)(0.2766)
PDI0.2522 ***0.04380.1853 ***0.0202
(0.0739)(0.0421)(0.0663)(0.0403)
FSA1.5370 ***−0.29361.0392 **0.6784 **
(0.4831)(0.2751)(0.4332)(0.2636)
constant−0.66630.7955−0.00390.4256
(0.9012)(0.5131)(0.8081)(0.4917)
YearYesYesYesYes
ProvinceYesYesYesYes
Log Likelihood259.37414.83289.47426.59
Wald test probability0.0000.0000.0040.000
Standard errors in parentheses * p < 0.1, ** p < 0.05, *** p < 0.01.
Table 5. Heterogeneity Analysis of Factors Affecting Rice Production Efficiency.
(1)(2)(3)
EastCentralWest
PCL−0.22100.03520.0586
(0.2424)(0.0527)(0.2109)
ELF0.2684 **0.2158 **−0.2430 **
(0.1269)(0.1037)(0.0988)
AEP−0.2789 **−0.1760−0.1531
(0.1299)(0.1553)(0.1007)
APS−0.00810.03430.0355
(0.0051)(0.0319)(0.0450)
EIR0.0250−0.12980.0551
(0.1551)(0.1921)(0.1753)
AMD0.1053 **0.08190.1151
(0.0489)(0.0807)(0.0725)
DIR−0.0811−0.1374−0.2224 **
(0.0730)(0.0961)(0.0973)
URR0.06471.1534−0.4254
(0.8977)(0.8199)(1.7822)
PDI0.19060.33050.3673 ***
(0.1745)(0.3821)(0.1010)
FSA2.7358 ***1.06150.8192
(1.0105)(0.8498)(1.0695)
constant−0.8755−0.81523.0919 *
(1.7438)(1.8538)(1.8559)
YearYesYesYes
ProvinceYesYesYes
Log Likelihood105.9397.5488.49
Wald test probability0.0000.0000.000
Standard errors in parentheses * p < 0.1, ** p < 0.05, *** p < 0.01.
Table 6. Factors Influencing the Production Efficiency of Japonica Rice and Its Decomposition Index.
(1)(2)(3)(4)
TFPTechPechSech
PCL0.00070.0146−0.02780.0163
(0.0389)(0.0187)(0.0314)(0.0265)
ELF−0.05950.0088−0.0205−0.0480
(0.0815)(0.0393)(0.0660)(0.0556)
AEP0.06380.01870.0591−0.0097
(0.0725)(0.0350)(0.0587)(0.0494)
APS−0.0289−0.03650.0110−0.0055
(0.1192)(0.0575)(0.0965)(0.0812)
EIR0.0240−0.01480.1070−0.0712
(0.1526)(0.0736)(0.1235)(0.1040)
AMD−0.0226−0.0082−0.02390.0088
(0.0417)(0.0201)(0.0338)(0.0284)
DIR−0.00670.00930.0069−0.0130
(0.0652)(0.0314)(0.0528)(0.0445)
URR−0.3233−0.1425−0.41630.2419
(0.5965)(0.2875)(0.4828)(0.4066)
PDI−0.1505 **−0.0188−0.1371 **0.0115
(0.0750)(0.0361)(0.0607)(0.0511)
FSA0.1049 ***0.0252−0.02600.1185 ***
(0.0390)(0.0188)(0.0316)(0.0266)
constant1.31131.0158 *0.53121.7601 **
(1.1852)(0.5713)(0.9593)(0.8079)
YearYesYesYesYes
ProvinceYesYesYesYes
Log Likelihood165.46279.30198.45225.25
Wald test probability0.0000.0000.0000.000
Standard errors in parentheses * p < 0.1, ** p < 0.05, *** p < 0.01.
Table 7. Factors Influencing the Production Efficiency of Early Indica Rice and Its Decomposition Index.
(1)(2)(3)(4)
TFPTechPechSech
PCL−0.08270.0587−0.0763−0.0607
(0.1019)(0.0973)(0.1040)(0.1128)
ELF−0.0253−0.02330.0344−0.0471
(0.0620)(0.0592)(0.0629)(0.0683)
AEP0.07880.05660.1741−0.0572
(0.1470)(0.1404)(0.1470)(0.1595)
APS−0.0435−0.1963 *−0.01590.2084 *
(0.1120)(0.1069)(0.1017)(0.1104)
EIR−0.0391−0.0774−0.07140.0691
(0.0931)(0.0889)(0.0951)(0.1032)
AMD0.06600.02130.0341−0.0099
(0.0416)(0.0397)(0.0413)(0.0448)
DIR−0.0904 *0.0425−0.0697−0.0374
(0.0525)(0.0501)(0.0534)(0.0579)
URR0.58270.2708−0.02200.8154
(0.7932)(0.7574)(0.7836)(0.8504)
PDI−0.0165−0.1971 *−0.04470.1262
(0.1244)(0.1188)(0.1268)(0.1376)
FSA−0.48830.15640.3557−1.1642 *
(0.6057)(0.5784)(0.6140)(0.6663)
constant1.13931.7104 *0.81220.4963
(1.0610)(1.0132)(1.0723)(1.1636)
YearYesYesYesYes
ProvinceYesYesYesYes
Log Likelihood149.80154.73148.93140.10
Wald test probability0.0000.0000.0000.000
Standard errors in parentheses * p < 0.1.
Table 8. Factors Influencing Production Efficiency and Its Decomposition Index of Medium Indica Rice.
(1)(2)(3)(4)
TFPTechPechSech
PCL−0.0786−0.0607−0.0020−0.0009
(0.1306)(0.0753)(0.0970)(0.0881)
ELF−0.0070−0.00720.0385−0.0270
(0.0759)(0.0438)(0.0562)(0.0512)
AEP0.1661 *0.0427 *0.03950.0918 *
(0.0892)(0.0215)(0.0662)(0.0602)
APS0.12090.04160.01870.0648
(0.1443)(0.0832)(0.1061)(0.0973)
EIR0.04930.0665−0.06950.0631
(0.1363)(0.0786)(0.1014)(0.0919)
AMD0.00100.0029−0.00260.0007
(0.0097)(0.0056)(0.0072)(0.0065)
DIR−0.0458−0.0458−0.0273−0.1086 **
(0.0805)(0.0464)(0.0593)(0.0543)
URR−1.2365−0.4924−0.4445−0.3704
(1.1911)(0.6871)(0.8763)(0.8032)
PDI−0.1589−0.19360.02750.0116
(0.2823)(0.1629)(0.2098)(0.1904)
FSA−0.9974−0.0103−0.4852−0.5157
(0.8333)(0.4807)(0.6197)(0.5619)
constant1.33880.77761.50550.8942
(1.4067)(0.8115)(1.0446)(0.9486)
YearYesYesYesYes
ProvinceYesYesYesYes
Log Likelihood144.95216.48186.27196.18
Wald test probability0.0000.0000.5140.199
Standard errors in parentheses * p < 0.1,** p < 0.05.
Table 9. Factors Influencing the Productivity of Late Indica Rice and Its Decomposition Index.
(1)(2)(3)(4)
TFPTechPechSech
PCL−0.0175−0.0497−0.02620.0635
(0.0851)(0.0410)(0.0469)(0.0620)
ELF−0.0349−0.0580 **−0.01850.0437
(0.0515)(0.0248)(0.0284)(0.0375)
AEP0.2119 *−0.01310.02390.1940 **
(0.1203)(0.0579)(0.0663)(0.0876)
APS−0.2712 ***−0.0312−0.0628−0.1989 ***
(0.0833)(0.0401)(0.0459)(0.0606)
EIR0.05990.04370.0554−0.0330
(0.0779)(0.0375)(0.0429)(0.0567)
AMD0.0552−0.01370.0370 **0.0379
(0.0338)(0.0163)(0.0186)(0.0246)
DIR−0.1052 **0.0209−0.0405 *−0.1313 ***
(0.0437)(0.0210)(0.0241)(0.0318)
URR0.70660.3000−0.00700.3658
(0.6416)(0.3089)(0.3536)(0.4673)
PDI−0.2162 **0.0505−0.0027−0.2701 ***
(0.1038)(0.0500)(0.0572)(0.0756)
FSA−1.6837 ***−0.1267−0.3703−1.1529 ***
(0.5027)(0.2421)(0.2770)(0.3661)
constant0.24021.0065 **0.78290.4585
(0.8779)(0.4227)(0.4838)(0.6394)
YearYesYesYesYes
ProvinceYesYesYesYes
Log Likelihood170.53249.45234.878204.76
Wald test probability0.0000.0000.4920.000
Standard errors in parentheses * p < 0.1, ** p < 0.05, *** p < 0.01.
Disclaimer/Publisher’s Note: The statements, opinions and data contained in all publications are solely those of the individual author(s) and contributor(s) and not of MDPI and/or the editor(s). MDPI and/or the editor(s) disclaim responsibility for any injury to people or property resulting from any ideas, methods, instructions or products referred to in the content.

