Article

Influence of Environmental Factors on Some Biochemical and Physiological Indicators in Grapevine from Copou Vineyard, Iasi, Romania

by
Alina Elena Marta
1,
Cristina Slabu
1,
Mihaela Covasa
1,
Iuliana Motrescu
2,3,*,
Constantin Lungoci
1 and
Carmenica Doina Jitareanu
1
1
Department of Plant Science, Iasi University of Life Sciences, 700490 Iasi, Romania
2
Department of Exact Sciences, Iasi University of Life Sciences, 700490 Iasi, Romania
3
Research Institute for Agriculture and Environment, 700490 Iasi, Romania
*
Author to whom correspondence should be addressed.
Agronomy 2023, 13(3), 886; https://doi.org/10.3390/agronomy13030886
Submission received: 15 February 2023 / Revised: 11 March 2023 / Accepted: 14 March 2023 / Published: 16 March 2023

Abstract

:
Climate factors strongly impact the growth of grapes and their flavonoid composition, especially due to heat and drought stress. Four varieties—Gelu, Moldova, Purpuriu, and Coarna Neagra—from a Copou vineyard were analyzed to assess the impact of climate change on the anthocyanin concentration in grapes and total chlorophyll content of the leaves, and find possible correlations between these parameters during the two studied years, such as to raise producer awareness regarding the climate impact on table grape vine growth. Moldova and Purpuriu show adaptation to a slight temperature increase above the normal average and also to a water deficit, with increased concentrations of anthocyanins of up to three times. The Moldova variety accumulated low amounts of chlorophyll pigments in most analyzed development phases, indicating a negative correlation between these pigments. Coarna neagra exhibited an increase of the foliar pigments, a variety that proved to be less valuable from the point of view of anthocyanin content. Positive correlations were found between the anthocyanin and chlorophyll concentrations in the case of Gelu, Moldova, and Coarna neagra cultivars during the latter phase of the fruit development, whereas the water deficit in the second year induced negative correlations during fruit development and at the time of harvest for all studied varieties except Moldova.

1. Introduction

Global warming is a serious issue impacting plant growth through modifications of temperature, water resources, atmospheric carbon dioxide, radiation, etc.; these abiotic factors have a strong influence not only on the suitability of the grape area influencing the vine growth, but also on the primary and secondary metabolites, either degrading them directly or by affecting the physiology and phenology of vine [1,2,3,4,5,6]. These abiotic factors related to the environment have crucial roles in the development of the fruit. The increased temperature and radiation impact plant physiology, influence the evapotranspiration rates, increase water necessity due to drought, and make the plants prone to salinity stress as well. During ripening, high temperatures interfere with the sugar content, the concentration of organic acid, phenolic compounds, and flavonoids responsible for the aroma [3,4,5].
Anthocyanins are a very important group of pigments found in plants, mostly in flowers and fruits. In grapes, they are synthesized in the exocarp of the berries, kept in cell vacuoles from the start of ripening, and give the color to some red cultivars that accumulate the anthocyanins in their flesh as well [7]. Anthocyanins are glycosylated polyhydroxy and polymethoxy derivatives of 2-phenylbenzopyrylium salts [8]. The most common anthocyanins found in grapes are pelargonidin, cyanidin, delphinidin, peonidin, petunidin, and malvidin, in different ratios depending on the cultivar and growing conditions, being influenced by abiotic factors, including the temperature regime [1,2,3,4,6,9]. High temperature proved to decrease the ratio between anthocyanins and sugar, which can be the result of a delay of the anthocyanins synthesis or their reduced accumulation during ripening [10,11,12]. Drought can also affect the concentrations of anthocyanins, the effects depend on the intensity of water deficit stress and the time when it impacts the vine during development. Researchers found that drought can have a benefic effect when it occurs during grape ripening (from BBCH stages 75 to 89), through an increase of the concentrations of polypropanoids and flavonoids, as well as anthocyanins, the increase being dependent on the variety as well [13,14,15,16]. Leaf chlorophyll content provides valuable information about the physiological status of the plants, and there is a need for accurate and efficient methodologies to estimate it. Changes in the photosynthetic process that could be due to the change in the photosynthetically active radiation, could result in triggering physiological and biochemical changes in plants to adjust to the reactive species produced. Thus, we underline the importance of monitoring not only antioxidant compounds such as anthocyanins but pay attention to the photosynthetic process by evaluating photosynthesis indicators such as the concentrations of chlorophyll pigments, water-use efficiency, photosynthetic active radiation, stomatal CO2, the transpiration rate, and the net photosynthetic rate.
Anthocyanins have been linked to benefic health effects such as reducing oxidative cell damage, improving DNA integrity, stimulating lipid metabolism in humans, having antimicrobial, anti-inflammatory, and anticarcinogenic activity, improving visual and neurological health, exerting cardiovascular protective effects, and so many others [17,18,19,20,21,22]. Table grapes are picked depending on their ripening degree, which depends on the vine type, and the ecological conditions in the production area. At the same time, it was shown in the case of grapes used for winemaking, that anthocyanins have an important role related to wine color and influencing its taste since during the maceration process anthocyanins and other phenolic compounds are diffusing from the fruit [22,23]. The content of antioxidant compounds is strongly influenced by the environment. Researchers found that climate factors such as temperature, solar radiation, and rainfall strongly impact the phenolic compounds and antioxidant properties of grape berries [11,12,24,25,26,27]. In this work, we focused on studying the evolution of some biochemical and physiological properties in grapevines cultivated in the Copou vineyard in Iasi, Romania in correlation with the environmental conditions during the study and assess the environmental impact. The results were meant to increase the awareness of local table grapes producers on the climate change impact and provide information related to these local varieties in the presented context.

2. Materials and Methods

Four table grapevine varieties were studied: Gelu, Moldova, Purpuriu, and Coarna neagra, which are representative of the area. The four varieties belong to the Iasi University of Life Sciences collection and are found in the Adamachi Farm (47.193° N, 27.551° E), organized in 10 rows of about 30 vines each. The Gelu variety was created at the Research and Development Center for Viticulture and Vinification in Iasi from Coarna neagra seeds irradiated with X-rays, and homologated in 1998. Coarna neagra is assumed to originate in Turkiye, being an old one vastly cultivated especially in Moldavia. Pururiu was obtained at the Institute of Research and Development for Vine and Viticulture in Valea Calugareasca, Romania, being a hybrid of Ceaus and Villard blanc, homologated in 1985. The Moldova variety was produced at the Institute for Viticulture and Vinification from Chishinau, Republic of Moldova as a hybrid of Guzali Kara and Villard blanc. The vegetation period of grapevines in our country is roughly April to November with small variations depending on the meteorological conditions of the year.
There were no treatments applied to the vine and no irrigation system, in order to study the impact of the environment on the analyzed parameters. In our country, the optimum conditions for vine growth are temperatures of about 25–30 °C for maximum intensity of photosynthesis, 500–700 mm of precipitations, and relative air humidity of 60–80%.
The soil in Adamachi farm is a cambric chernozem type with a humus content between 3 and 5.9 g/100 g soil; C/N ratio was about 12; the cationic exchange rate was 30 ± 3 mg/100 g soil in the Am horizon, and the soil base saturation was (92 ± 3)%. The pH was 7±, with a low content of mobile phosphorus of (2.6 ± 0.5), and an average (22 ± 2)% potassium content.
The meteorological data was collected in the meteorological station of the Adamachi Farm. Ombrothermic diagrams were made using the monthly average temperatures and precipitations with 20 °C corresponding to 400 mm precipitation. We also plotted the normal monthly average precipitation (which represents the average of the precipitation values in the same month over 30 years) for a better comparison. When the precipitation curve is under the temperature curve, there is a lack of precipitation.
After picking two bunches from five random vines in the field from each variety, the grapes were transferred to the laboratory, pedicels removed, and the berries were washed with pure water, dried, weighed, and the skins frozen until the extractions were performed. The processing took place in about 30–40 min from the collection, so any change in the composition of the grapes is minimum. Anthocyanins were extracted using the method described by Drdak, adapted [28].
The total monomeric anthocyanin content in the grapes was determined using the pH differential method [29]. The concentration is expressed in cyanidin-3-glucoside equivalents mg/L and is calculated according to the following relationship:
Anthocyanin   pigment = A · M W · D F · 10 3 ε · l
where   A = A 520 n m A 700 n m   pH   1.0 A 520 n m A 700 n m   pH   4.5 ,   M W is the molecular weight of cyanidin-3-glucoside 449.2 g/mol, D F is the dilution factor, l is the pathlength in cm, ε   = 26,900 L/(mol∙cm) is the molar extinction coefficient for cyanidin-3-glucoside, and 103 is due to the conversion from g to mg.
The total chlorophyll content was read in the field using CCM-200plus chlorophyll content meter from Opti-Sciences Inc., Hudson, NH, USA. The values are automatically calculated and given in CCl units (the content expressed in these units is referred to as chlorophyll content index), 1 CCl = % transmittance at 931 nm/% transmittance at 653 nm. Ten measurements were performed on different plants (five for each repetition) randomly chosen in the field, on leaves near the bunch of grapes, and the data were statistically processed and presented as average values. We studied the dynamic evolution of the total chlorophyll in four standard phenological phases: BBCH-65 corresponds with the flowering phase—full flowering with 50% of flowerheads fallen, BBCH-75 corresponds with the development of the fruits when the berries are pea-size, BBCH-79 corresponds with the latter phase of the development of the fruits, and BBCH-89 corresponds with the phase when berries are ripe for harvest [30].
The main photosynthetic physiological processes were evaluated using LCpro+ portable system. The measurements were performed in the studied BBCH phases when the other parameters were measured. The system allows the determination of photosynthetic water-use efficiency (WUE), photosynthetic active radiation (PAR), leaf and external temperatures (Tleaf and Text), stomatal CO2, transpiration rate (E), and net photosynthetic rate (A). The measurements were performed at the same time of day for BBCH-65, BBCH-75, and BBCH-79 [31].
To assess statistically significant differences between the treatments, the means were compared by unidirectional analysis of variance (ANOVA). When the results were statistically significant, we used the Tukey multiple comparison test with the main difference set at p < 0.05. IBM SPSS v14 was used for the statistical analysis. All the results are presented as averages with standard deviations. Inferential statistics (Pearson correlation) was used to find correlations between the studied parameters.

3. Results

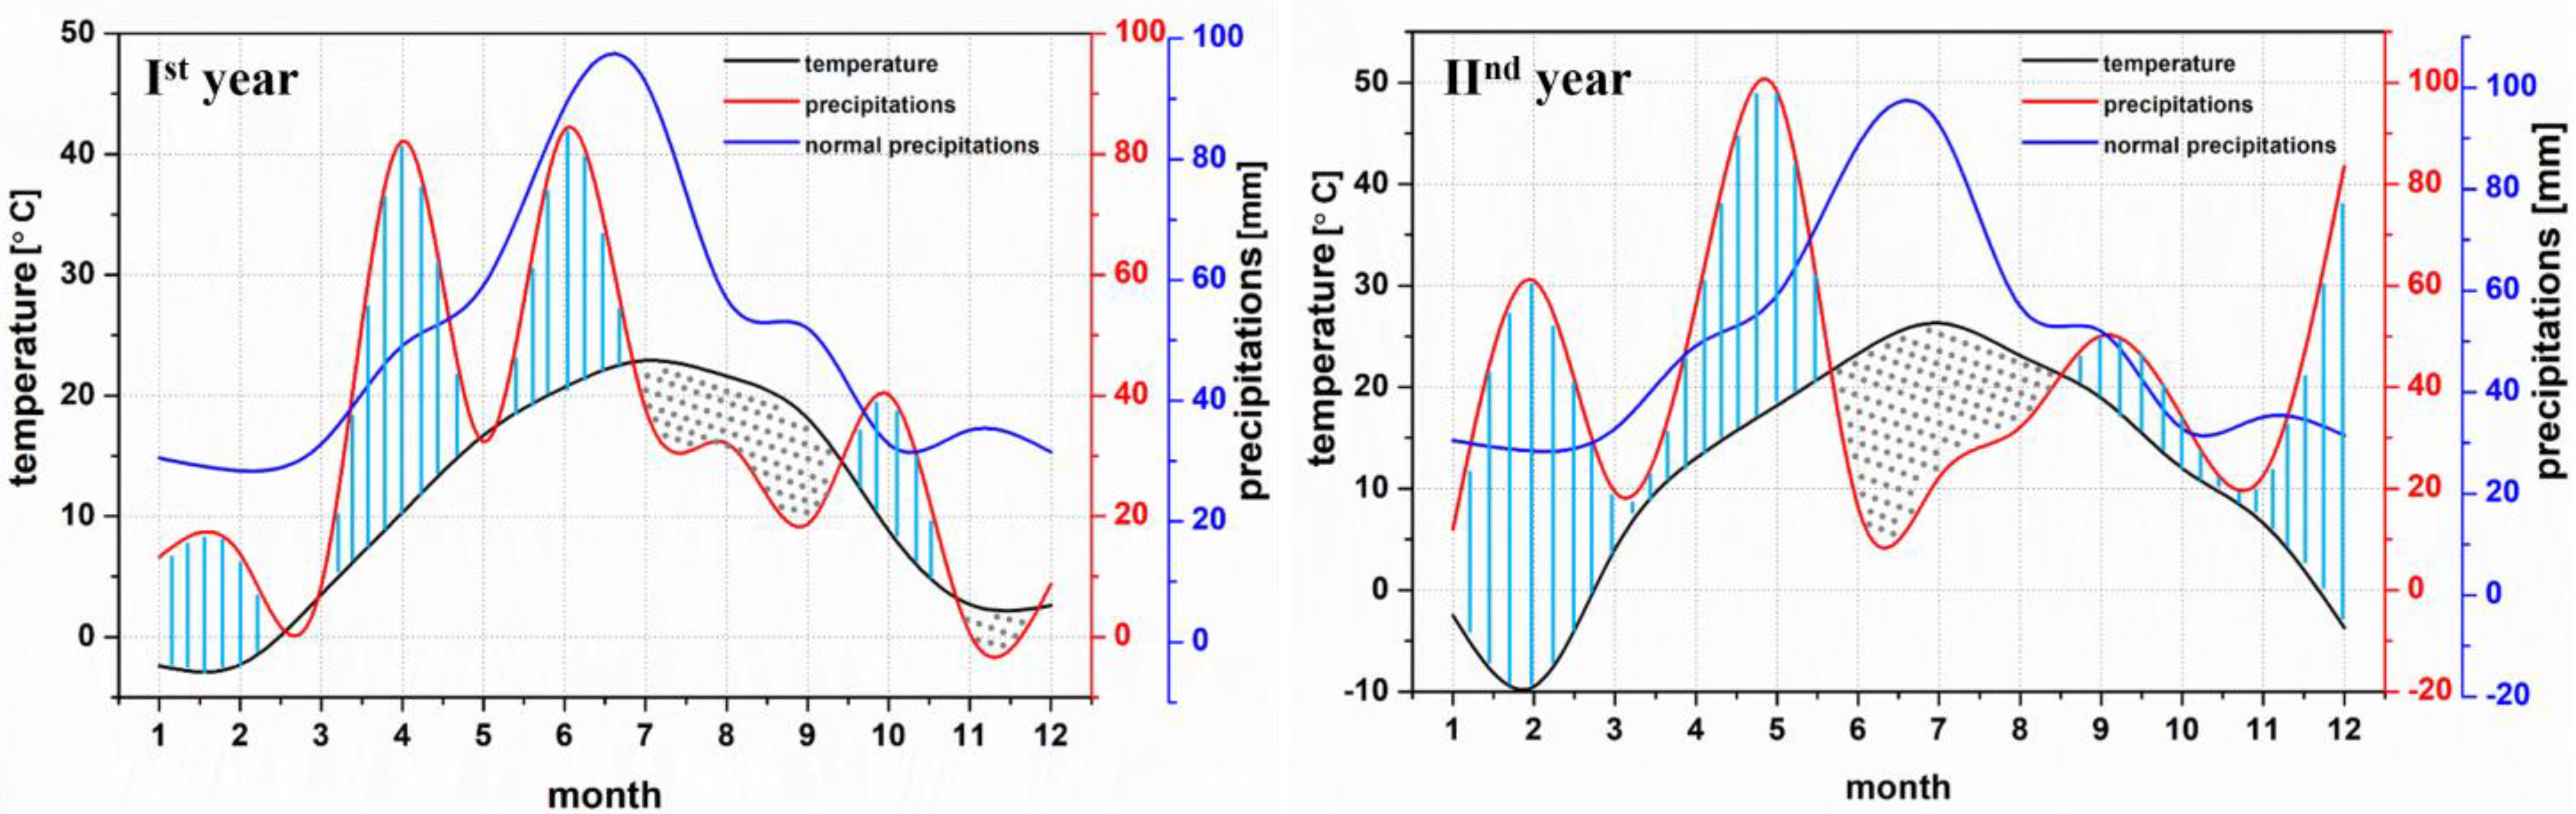
3.1. Meteorological Conditions

The temperature and precipitations corresponding with the studied area are shown in Table 1 first studied year (2020) and Table 2 for the second year (2021), respectively. The meteorological conditions in the Copou area of Iasi in the first studied year indicate climate changes, with monthly average temperatures higher by 0.4–2.3 °C, and maximal temperatures between 31.6 and 35.5 °C in the spring and summer months. During the vegetative growth, there was a water deficit starting in May (−26.8 mm), with a maximum in July (−45.0 mm). Overall, for the first year, there was a deficit of 207.7 mm of precipitation, so the year was characterized by drought.
In the second studied year, the temperature increase was even higher, with temperatures much higher than the normal multiannual averages with a maximum of +8.3 °C in February. During the vegetative growth, the values were with 1.93 to 5.1 °C higher than normal. The precipitation regime was different than in the previous year with periods of drought, especially during the summer (June −72.4 mm and July −60.6 mm), whereas in April, the precipitation was higher than normal by 33.1 mm. The yearly precipitations reached the normal values of the area with a smaller deficit than the previous year of only −72.2 mm.
For a better understanding of the meteorological conditions in the studied years, we have drawn the ombrothermic diagrams. Figure 1 shows the information for both years, also presenting the normal multiannual values of the precipitations in blue color.

3.2. Total Anthocyanin Concentrations

The total anthocyanin concentrations analyzed for the studied red grape varieties in both years are presented in Table 3 along with the values calculated per mass of the analyzed dry substance. In the first year, the average concentration of total anthocyanins in the grape skin was the highest for the Moldova variety (806.92 mg/L), high in Purpuriu (389.11 mg/L), and low in Gelu (133.06 mg/L) and Coarna neagra varieties (38.47 mg/L). In the second year, considerable differences were noticed; the total anthocyanin concentrations increase by about 48.8% for Gelu, 65.7% for Moldova, and 211.2% for Coarna neagra, whereas for Purpuriu, it decreases in the second year by about 4%.

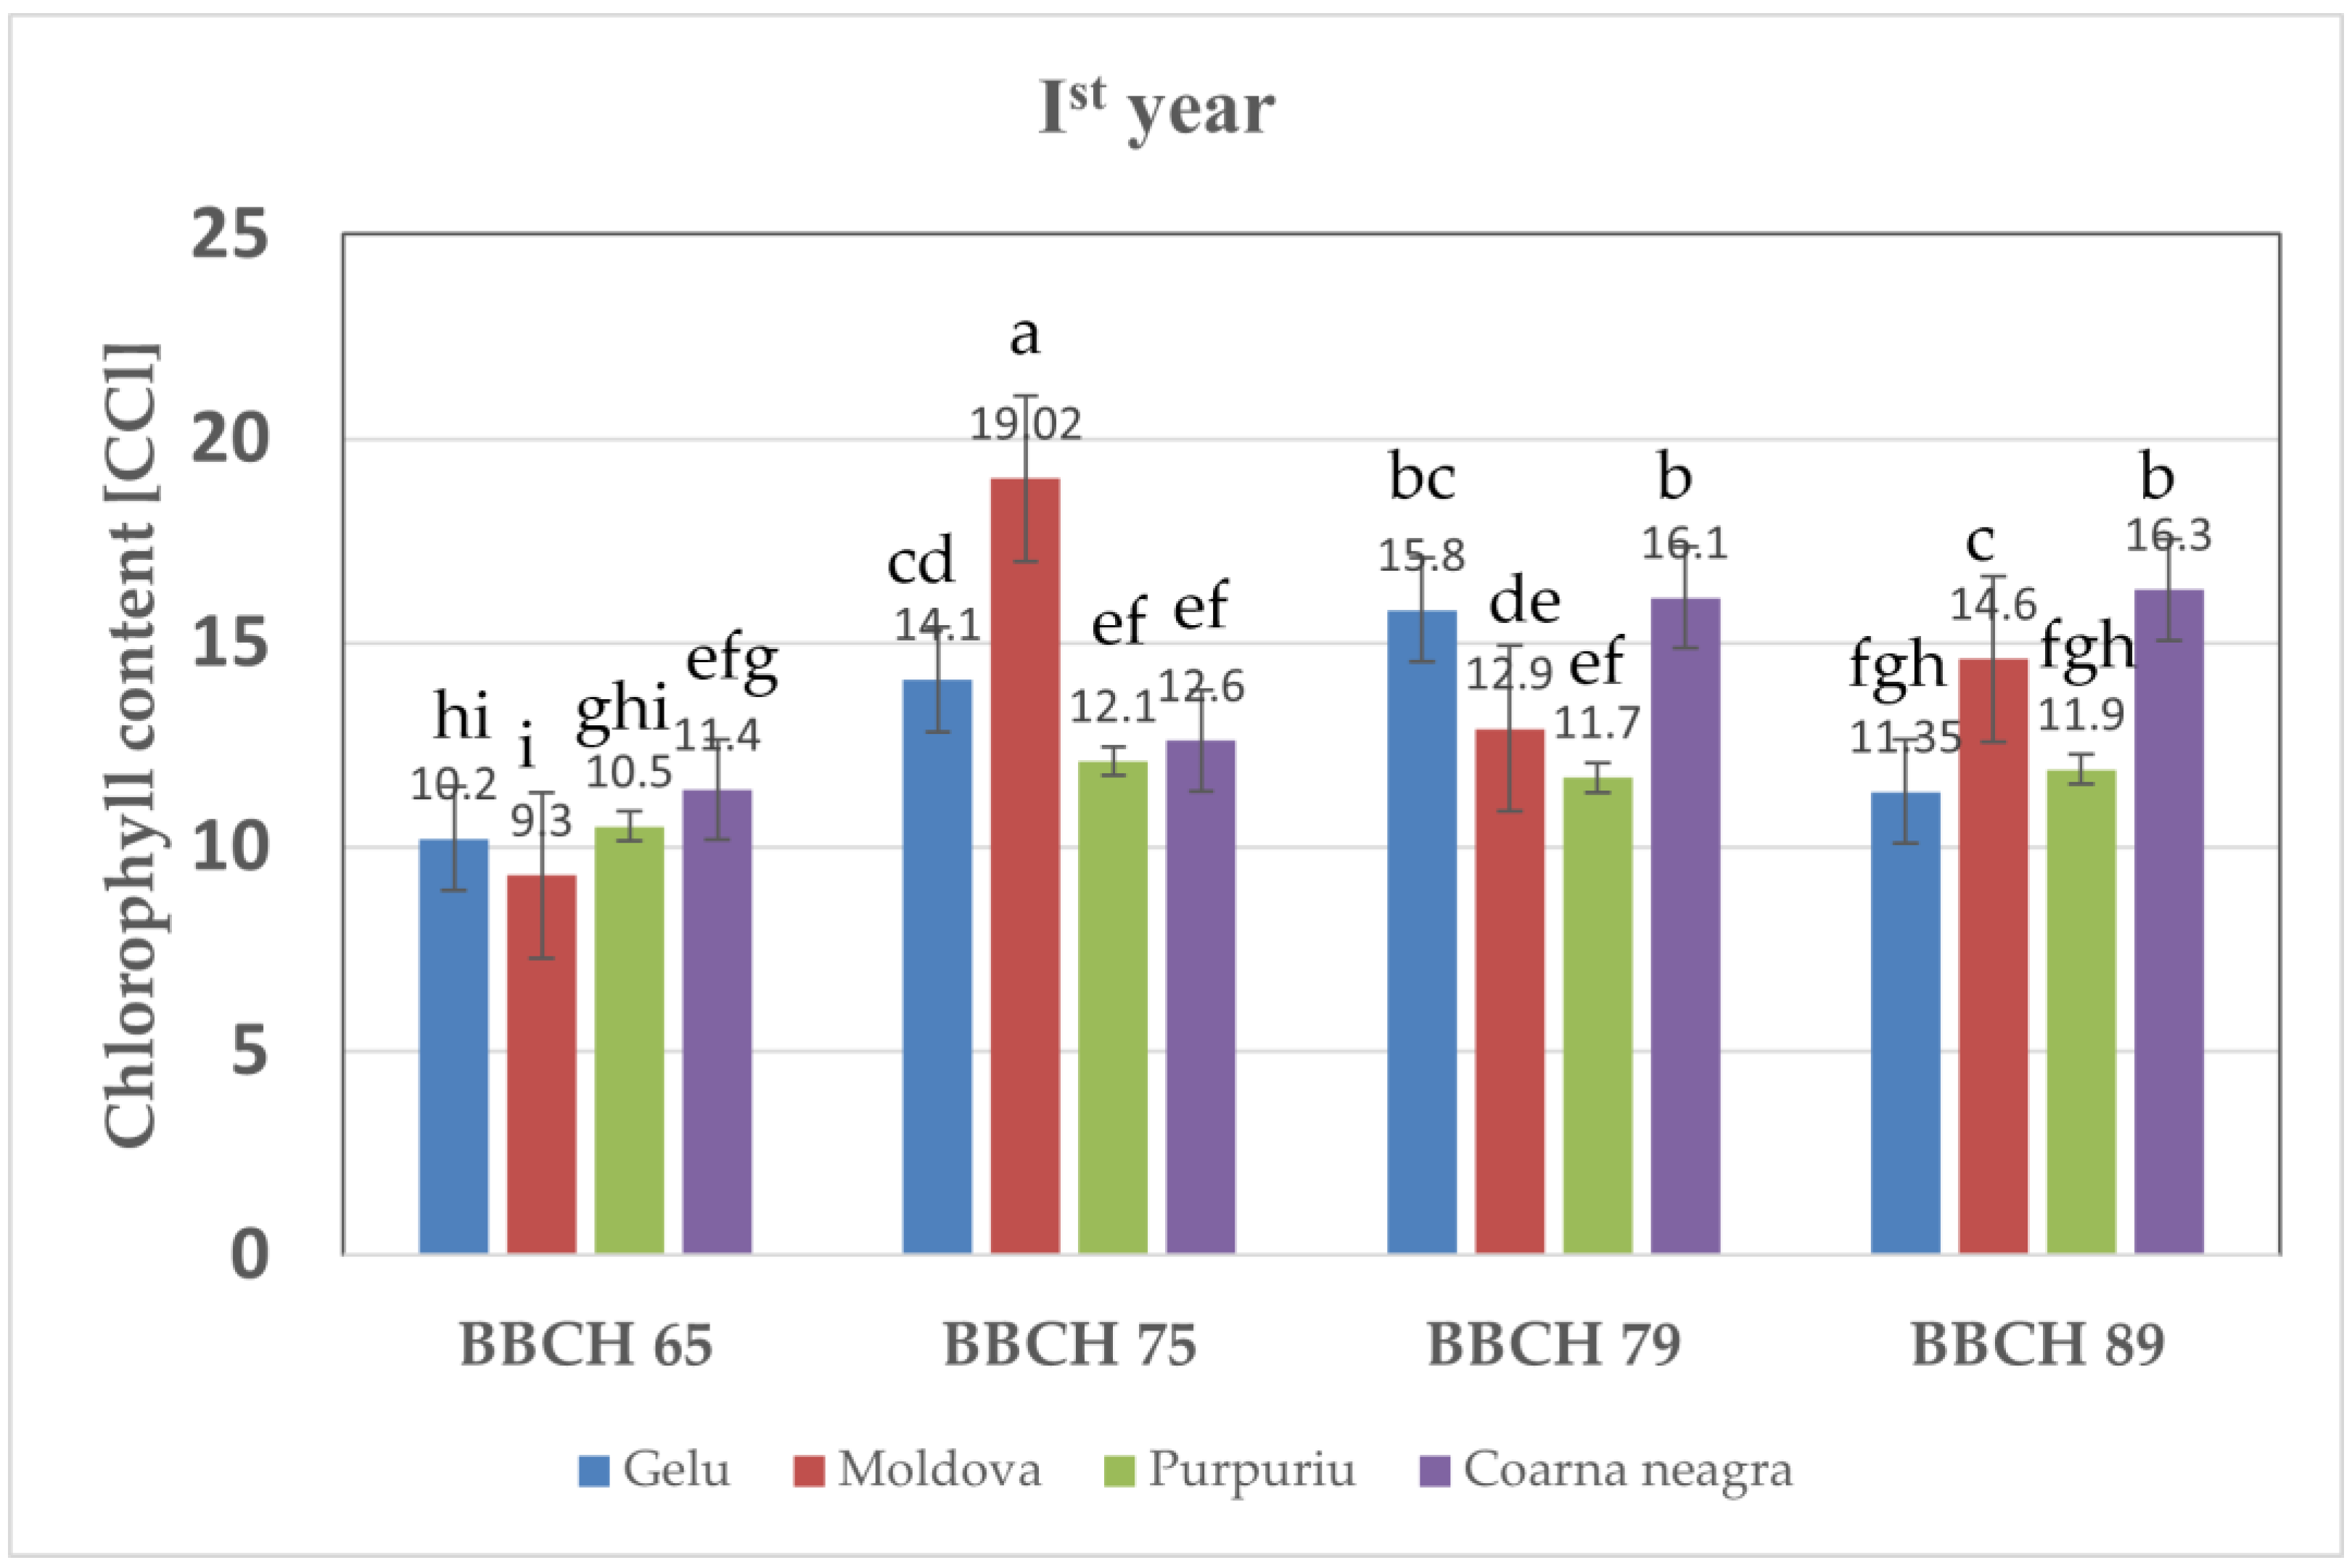
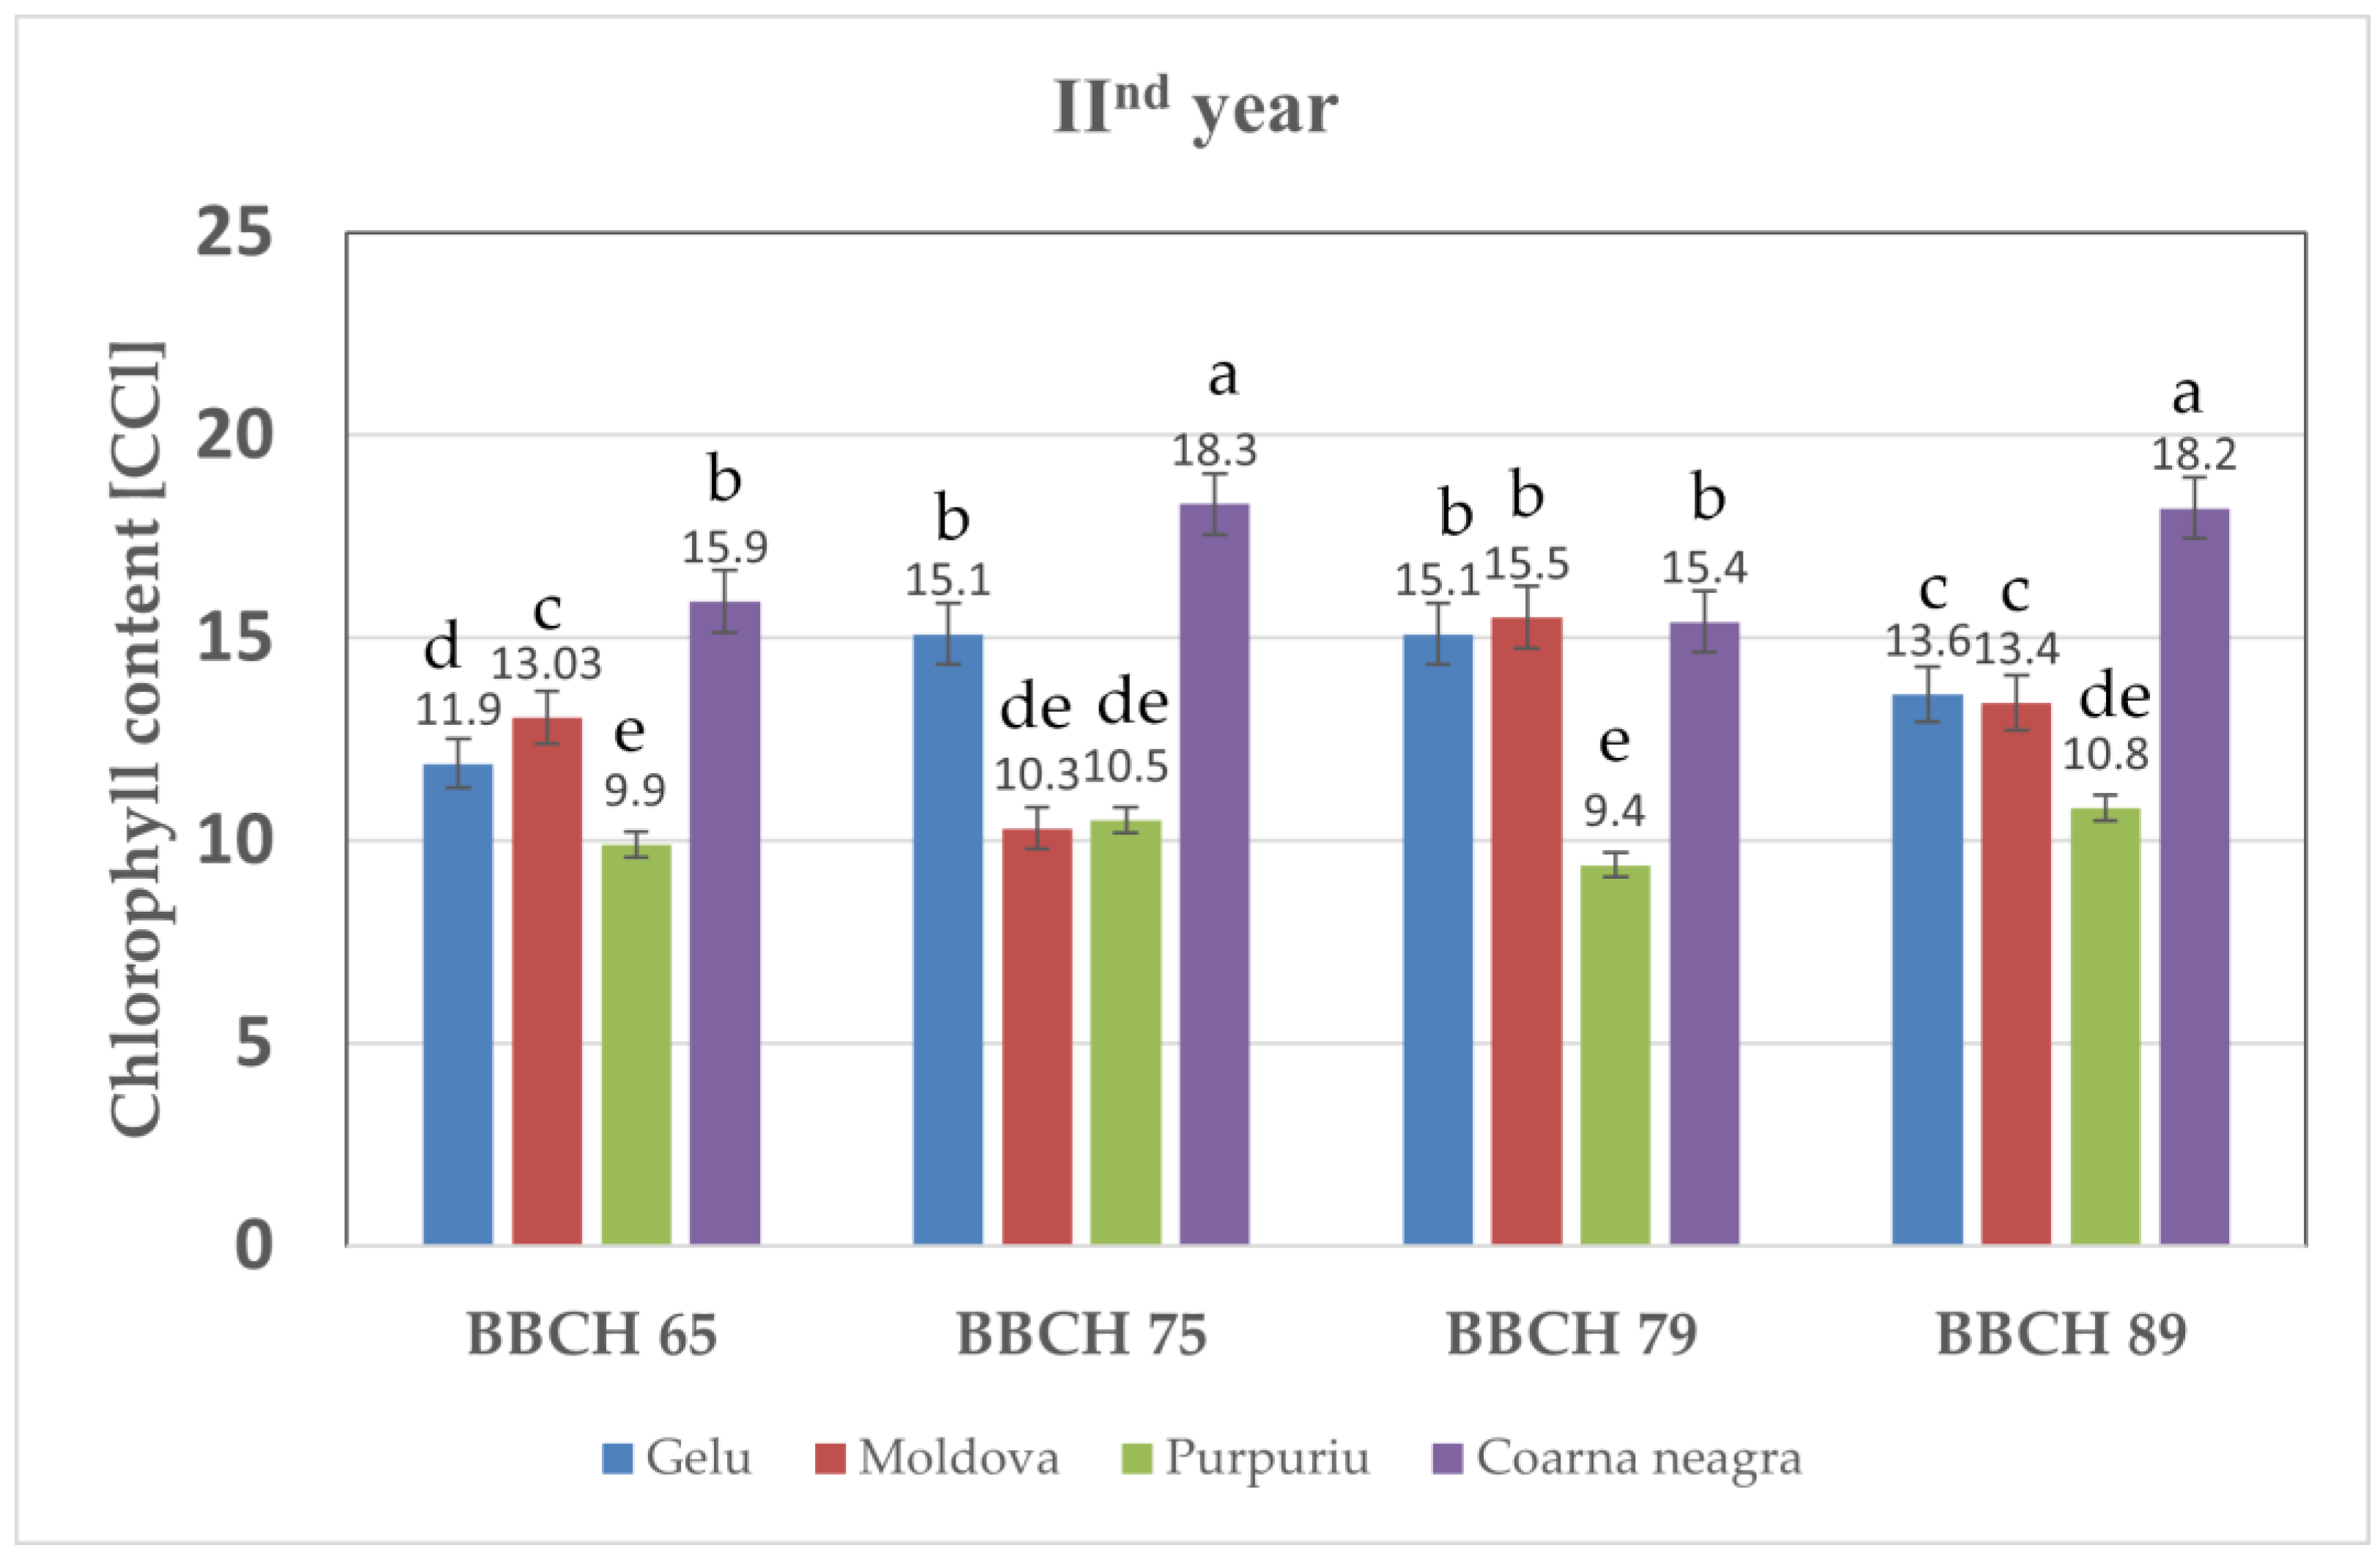
3.3. Total Chlorophyll Content

The total chlorophyll contents of the grapevine leaves of the studied varieties are shown in Figure 2 and Figure 3 for the first and the second year, respectively. It is clearly seen that the varieties behave differently from this point of view and the behavior is also different in the second year so could be due to different environmental conditions. The Moldova variety accumulated a maximum concentration of chlorophyll pigments in BBCH 75 phase in the first year, higher than all other varieties, and also higher than the concentrations in the second year. The Purpuriu variety exhibited similar behavior with the highest concentration in BBCH 75 phase in the first year, and lower values for the second year in all studied phases. Gelu reached a maximum chlorophyll concentration in the BBCH 79 phase, with similar behavior in the second year, whereas Coarna neagra had high values in both BBCH 79 and 89 phases in the first year, and 75 and 89 in the second year. The BBCH 65 phase of the second year was characterized by mostly higher chlorophyll content than the second year, except for the Purpuriu variety. Moldova and Coarna neagra had overall higher chlorophyll content in the second year compared with the first year.

3.4. LC Pro Photosynthetic Indicators

Q leaf photosynthetic active radiation analyzed during the vegetation period of the first year had the highest values in the BBCH 65 phase in all studied varieties, with a maximum for the Moldova variety, and minimum values in the BBCH 75 phase, as can be seen in the data presented in Table 4. In the second year, the photosynthetic active radiation during flowering varied within wide limits with a minimum in Purpuriu (92.09 ± 1.6 μmol∙m−2s−1) and a maximum in Gelu and Moldova (1056.8 ± 5.3 μmol∙m−2s−1, and 1072.5 ± 2.5 μmol∙m−2s−1, respectively). During the development of the fruits, PAR was much lower compared to all other studied development phases, with a minimum value of 64.23 ± 1.4 μmol∙m−2s−1 in Coarna neagra and a maximum value of 218.41 ± 1.5 μmol∙m−2s−1 in Purpuriu variety.
The transpiration rate (E) (Table 4) had maximum values for all the varieties in the first year during the flowering phase. The lowest values were found in the ripening phases. The behavior changed in the second year (Table 5) with similar values in all development stages, with slightly higher values in BBCH 75. The net photosynthetic rate (A) varied from one phase to another throughout the vegetation season. The lowest values were found for the Gelu variety in all development phases, whereas the highest values were determined for Purpuriu. The most intense carbon assimilation was registered during berry growth (BBCH 75) in all analyzed varieties. In the second year, the net photosynthetic rate in the flowering phase varied from 2.53 μmol∙m−2s−1 in Coarna neagra to up to 5.17 μmol∙m−2s−1 in Purpuriu (Table 5). It had high values in the first analyzed development stages for all the varieties with a maximum of 8.56 μmol∙m−2s−1 for Moldova.
An essential indicator of photosynthesis intensity is the amount of CO2 absorbed in the time unit by the surface unit of the leaf—photosynthesis intensifies with the increase of CO2 concentration in the environment. In the first year, stomatal CO2 had average values of around 350 ppm in all studied conditions (Table 4). The situation was very different in the second year, with a maximum of 496.9 at Gelu, 461.4 ppm in Coarna neagra, and 407.7 at Moldova during the BBCH 65 and 75 phase, with higher values in most other conditions as compared to the first year (Table 5).
Water use efficiency was high in the first year for all studied varieties during the development of the berries, whereas the lowest values were recorded in the ripening phase. The trend was different in the second year with high values during the flowering phase and lower during the other studied development stages.

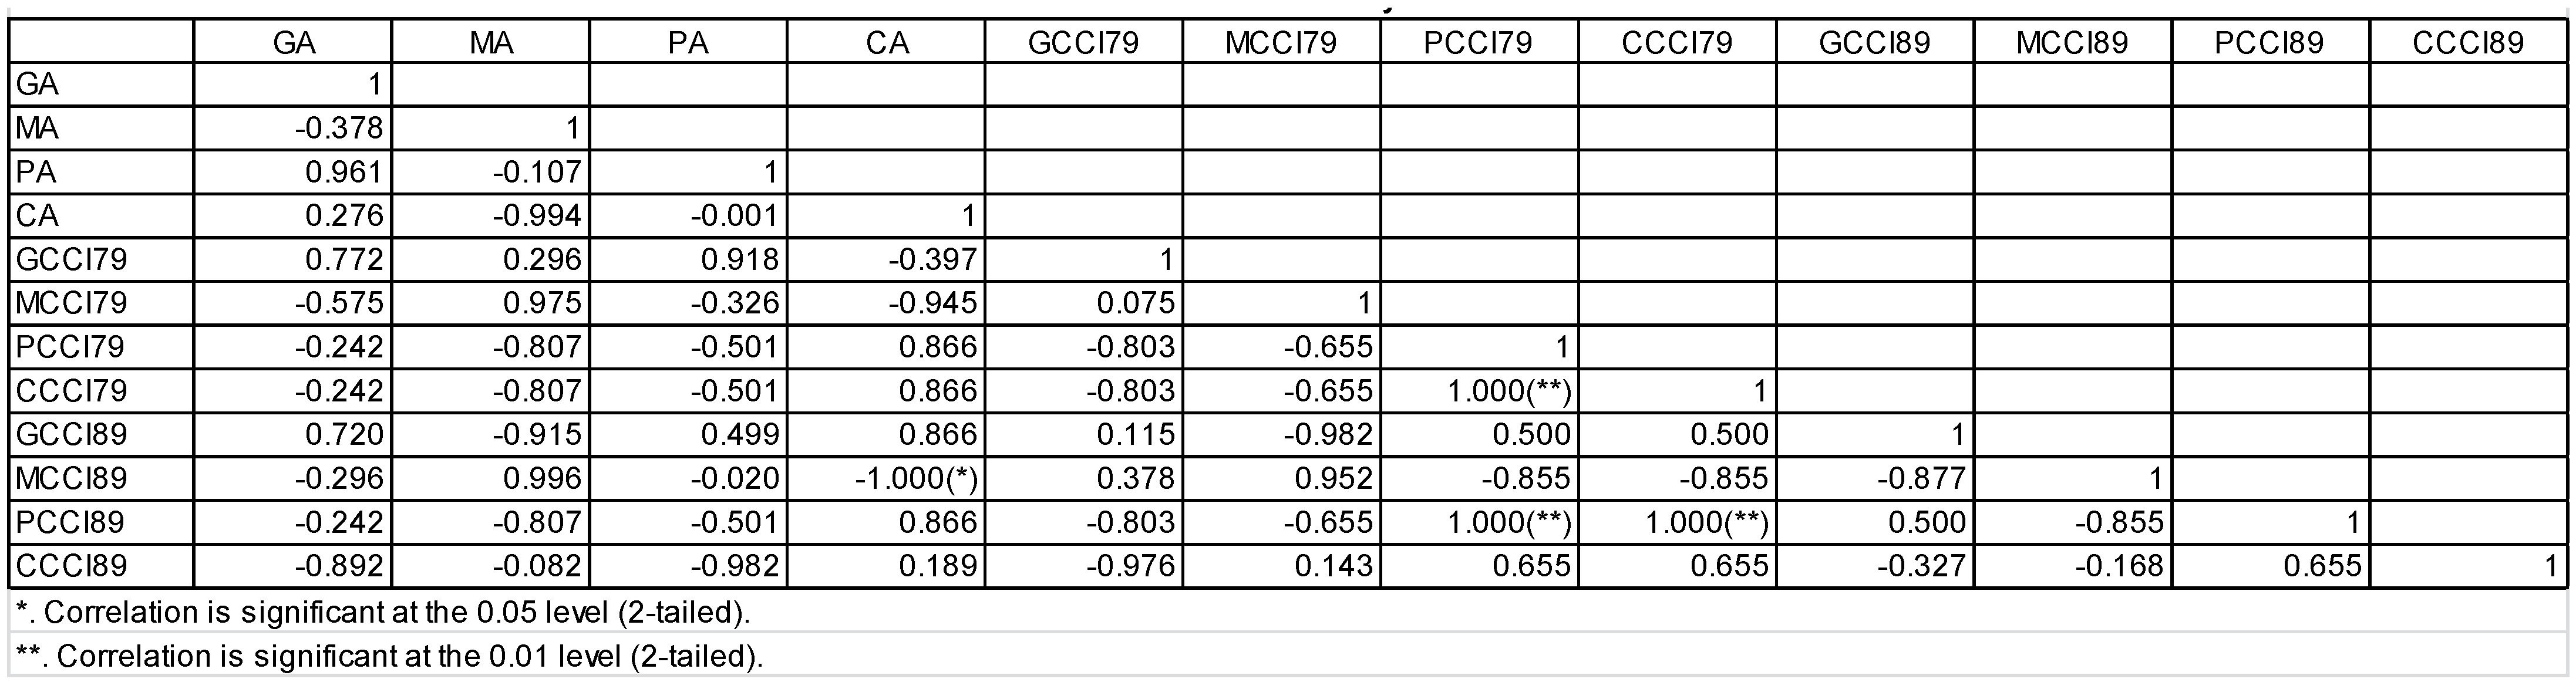
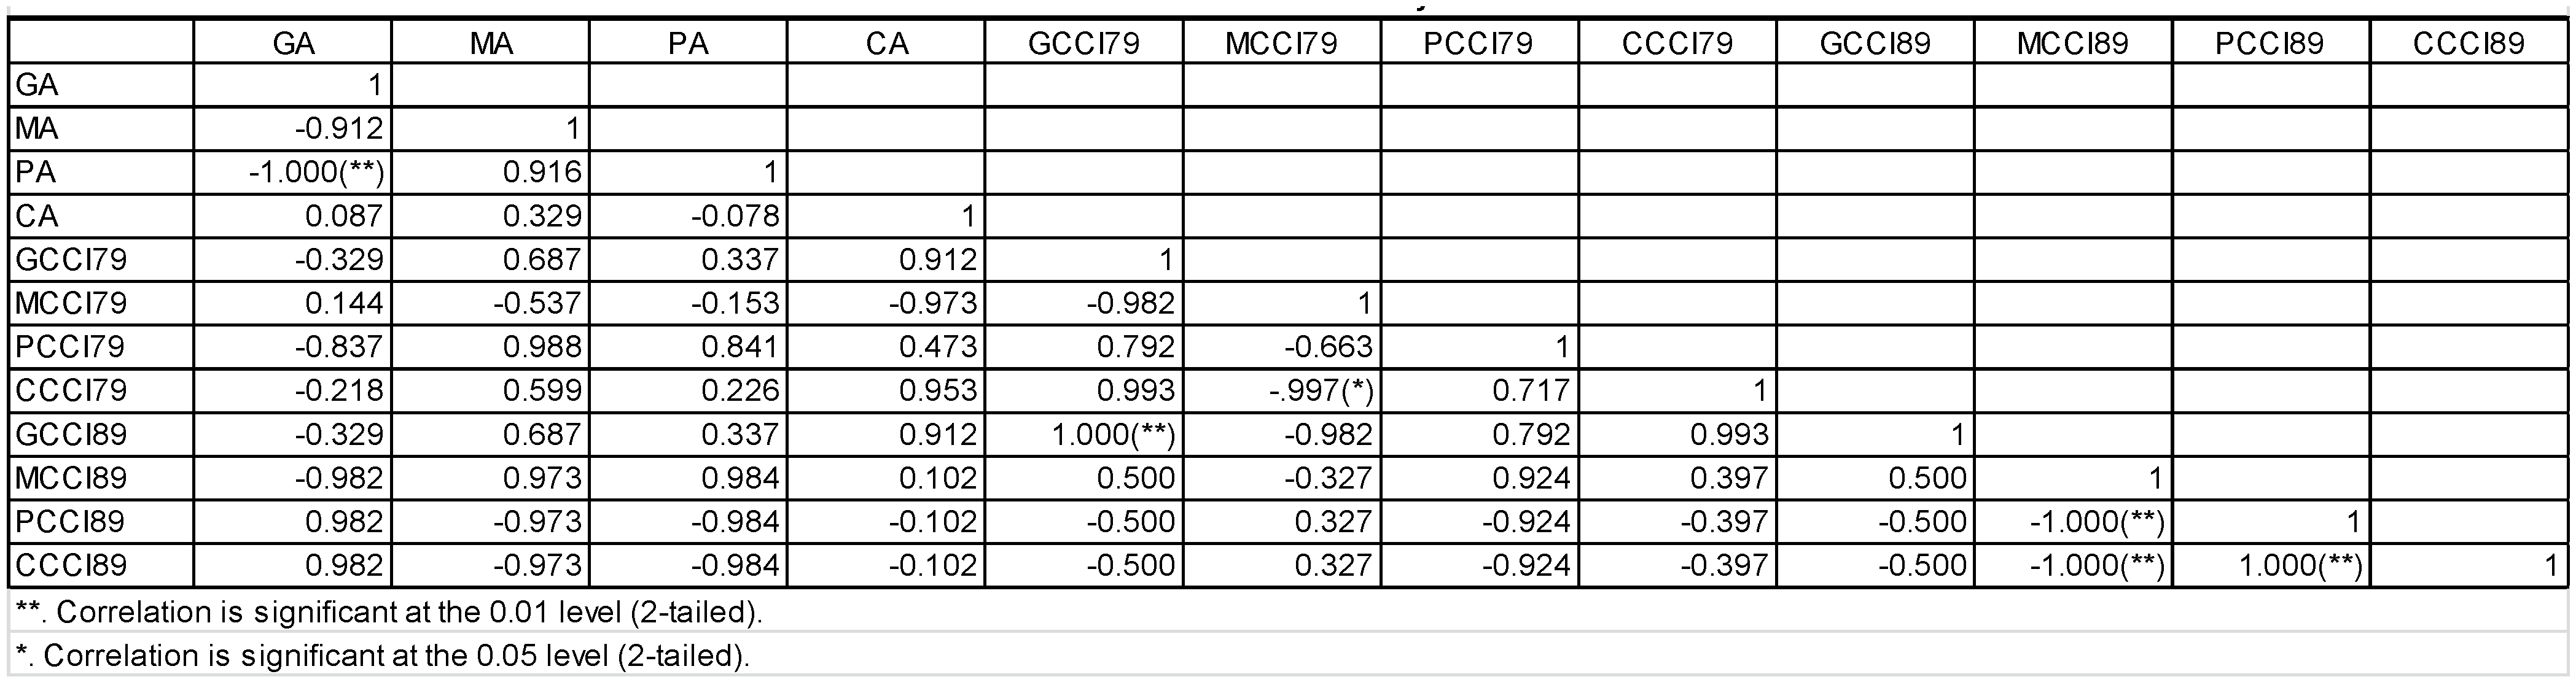
3.5. Pearson Correlation Test

For all the studied cultivars and most important photosynthetic parameters, the Pearson correlation test was performed (Supplementary Materials). The results highlight the correlation between the anthocyanin content and the physiological parameters in both analyzed years. In the Gelu variety, positive correlations were recorded for the anthocyanins content and stomatal CO2; in the first year, there were positive correlations only with the external temperature of the leaves and the water use efficiency, whereas in the second year, there were positive correlations with the chlorophyll content and PAR. Positive correlations were also obtained between the chlorophyll content, leaf temperature, stomatal CO2, and WUE, especially during BBCH 65 and BBCH 89.
The results of the Pearson correlation test performed for the total anthocyanin content of grape varieties versus the total chlorophyll content in the leaves are presented in Figure 4 for the first year, and Figure 5 for the second year, respectively. GA, MA, PA, and CA are the total anthocyanin concentrations corresponding to the studied varieties Gelu, Moldova, Purpuriu, and Coarna Neagra, respectively; GCCl, MCCl, PCCl, CCCl, are the total chlorophyll contents for the studied cultivars with the number indicating the BBCH phenological phase.
For the Moldova variety, there were positive correlations between the anthocyanins and the physiological parameters, but only in the second year when the anthocyanin content was maximum. For both years there were positive correlations between the total chlorophyll content and the other physiological indicators, especially during BBCH 65.
Even if the anthocyanin content was not so high in the Purpuriu variety compared to the others, it was positively correlated with all measured physiological parameters during both years; at the same time, the chlorophyll content had a positive correlation with leaf temperature, PAR, stomatal CO2, and WUE in all the development stages.
Coarna neagra accumulated the lowest anthocyanin content in the skin of the grapes but exhibited positive correlations with PAR, leaf, and external temperatures, especially in the first year. Similar to the Moldova variety, in the case of Coarna neagra, most correlations between the total chlorophyll content, PAR, leaf and external temperatures, stomatal CO2, and WUE were found during the BBCH 65 phase.

4. Discussion

The ombrothermic charts presented in Figure 1 indicate two important differences between the studied years: first, higher precipitations than normal averages were for the second year (January to March and April to June), and only for a short time and lower intensity (March to May) in the first year; the drought was more intense in the second year and lasted longer (end of May to end of August) compared to the first year (July to mid-September), with temperatures higher than those in the first year. The climatic conditions fit the existing published models related to climate change that predict an increase of about 2– 4 °C by the end of the century [4]. In our case, both analyzed years had average monthly temperatures during vine vegetation season with 1.93 to 5.1 °C higher than normal multiannual averages, as can be seen in the data presented in Table 1 and Table 2. Winter temperatures are also important because very low values can endanger the vine culture. For the studied years, this was not an issue with some average temperatures higher than the normal averages. The good ripening was ensured by the precipitation regime during the vegetation period, lower than normal, and many days with temperatures higher than 30 °C.
The total anthocyanin content increased considerably in the second year, by about 30% (Purpuriu) and up to about 164% (Coarna neagra), as can be observed in Table 3. The maximum content was for the Moldova variety, followed by Purpuriu. The total anthocyanin content in the dry matter was the highest in the Moldova variety, had similar values in both years for Purpuriu, and was about three times higher in Coarna neagra. Analyzing these results in the presented meteorological context, we could assume that the increase was due to the temperature values above normal averages during the summer months. At the same time, these periods were characterized by a water deficit, as shown in the ombrothermic diagrams presented in Figure 1, considering that abiotic stress can stimulate the biosynthesis of flavonoid compounds in plants [32,33,34,35,36]. If the temperatures are too high, several metabolic pathways are affected, and thus, the production of basic compounds that are critical for the grape, including anthocyanins, is perturbed. Some researchers found that the range of 20–22 °C is optimum for the synthesis of aroma compounds, and anthocyanins formation is restrained by heat stress [37,38]. The water deficit plays another important role as indicated by the negative correlations found with the Pearson test in the second year during BBCH 79 and 89 for all the studied varieties, except Moldova (Tables S5–S8). Regarding the correlation between the content of anthocyanins and the analyzed physiological parameters, in general, anthocyanins were most influenced by the external temperatures of the leaf (positive correlations) and very little by the content of chlorophyll and the water use efficiency.
The values obtained for Moldova and Purpuriu cultivars are higher than many presented in the literature for table grapes, such as some from the southeastern United States (Jumbo (4.1 mg/g d.w.), Cowart (2.6 mg/g d.w.), Carlos (0.1 mg/g d.w.)) [39]; another study on 110 cultivars found values between 0.1 and 97.5 mg/100 g fresh weight, which corresponds to amounts smaller than in our case [40]. Much higher values were found in some cultivars from South Korea with values up to 611.1 mg/100 g fresh weight in the case of Campbell Early, and most ranging above 350 mg/100 g fresh weight, probably due to the different climate conditions, such as warmer and with fewer temperature variations [41]. Similar results were reported for some table and wine grape varieties from Turkyie [41,42]. The high anthocyanin content of the Moldova variety recommends for consumption due to the high accumulation of antioxidant compounds in normal and climate-unfavorable conditions.
For the first studied year, the chlorophyll content presented in Figure 2 was the highest for all phases in Coarna neagra. During these stages, the temperature was higher by 1.1–2.3 °C. This variety has a high demand for heat, during these months with above-average temperatures accumulating maximum contents of chlorophyll in the leaves, and proving a high resistance to drought. The Moldova cultivar had a maximum chlorophyll content during the start of the fruit development phase, when temperatures were higher by 2 °C and a water deficit of 45 mm, as shown in Figure 1. In the other phases, there was no significant change. The Gelu cultivar accumulated high chlorophyll contents during BBCH 75 and 79 under relatively high temperatures and drought. Lower values of the total chlorophyll were determined for the Purpuriu variety, indicating a possible lower resistance to the meteorological conditions of the first year, with higher temperatures than normal averages and high-water deficit during the year. For the second studied year (Figure 3), Coarna neagra had the highest chlorophyll content during BBCH 75 and 89, whereas the lowest concentrations were identified for Purpuriu, probably as a result of the drought conditions. Gelu and Moldova cultivars had a similar trend regarding the chlorophyll content, with average values over all vegetation stages, except BBCH 79 when they accumulated a higher quantity of photosynthetic pigments.
An increase in the content of anthocyanins in the second year, in all the varieties analyzed, but especially in Moldova, can be related to the increase in atmospheric temperature and the deficit of precipitation in the summer months, July and August. It could be also correlated with the high values of the net photosynthetic intensity that reflects increased assimilation of carbon to fulfill the needs during the growth process of the berries. The values were highest for the Moldova variety, in view of superior production, correlated with the anthocyanin results.
Climate change is affecting the photosynthetic processes at the leaf level. One parameter that is strongly influenced is the photosynthetic water-use efficiency (WUE), representing the ratio between the net photosynthetic rate and the transpiration rate. It was reported that the increase of WUE has a positive effect, whereas an increase CO2 is benefic only under drought stress, partially due to the stomatal closure that causes a reduced transpiration rate [42]. In our case, the photosynthesis was strongly inhibited by the water deficit; during the vegetative growth the transpiration rate decreased, as well as the WUE. The water deficit directly impacts photosynthesis through the stomatal closure, decreasing also the gas exchange at the leaf level. Because water and CO2 have crucial roles in the synthesis of organic matter, vine leaves need a high humidity. The CO2 had increased values in the BBCH-89 phase, probably due to the processes taking place, the organic substances synthesized were concentrated in the fruits. In all cases, the leaf temperature had optimal levels for photosynthesis, with about 2 °C higher than the environmental temperature. Most varieties exhibited a high PAR in the flowering phase in both years, except Purpuriu. The studied parameters had a higher variation for the second year, maybe due to the water deficit, with lower transpiration rates and increased stomatal CO2. Overall, the correlations given in Pearsthe on test seem to depend on the variety, and growth phase, but also on the climate conditions. The most consistent behavior over time and varieties was recorded for BBCH-65 and may be due to the similar meteorological regime in the two studied years in the corresponding period.
Photosynthetic rates were reported to increase in other similar situations with proof of acclimation to high temperatures, but when the values of the temperature are no higher than about 35 °C [27,43]. The response to heat stress triggers some mechanisms and activates some signaling pathways that lead to physiological adaptations of the grapevines, especially under the above-mentioned temperature limit [27,41,42,43,44]. Above this temperature, a serious decline of the chlorophyll content was reported especially due to the enzymes responsible for degrading chlorophyll, and thus, chlorophyll content is a very good indicator of heat resistance in grape varieties [27,44]. We can conclude that, during the vegetation period of the two years of determinations, unfavorable climatic conditions, characterized by high temperatures and accentuated water deficit, negatively influenced the analyzed physiological parameters, by decreasing the rate of transpiration, partial or total closure of the stomata, such as and low values of water use efficiency, but increased the amount of anthocyanins in grapes.
The overall analysis of the physiological traits of the studied genotypes indicated that they could synthesize significant amounts of chlorophyll pigments, within the limits reported in the literature and, implicitly, intensify the photosynthetic activity and accumulation of assimilated necessary compounds for the biological and metabolic processes during the vegetation period.

5. Conclusions

In this study, four cultivars from the Copou vineyard in Iasi, Romania were studied to determine their behavior under different environmental conditions. The two studied years were characterized by higher temperatures than the normal regime and a lack of precipitation. The total anthocyanin content measured during four important development stages of the grapes showed an increase for some varieties (Purpuriu, Moldova) which could be related to the heat and deficit water stresses and might indicate a good adaptation of the cultivars to climate change conditions. The high anthocyanin contents also recommend these cultivars for consumption based on their potential health benefits.
The chlorophyll content measured in leaves near the grape bunches indicated a very good correlation with the anthocyanin concentrations in the grapes and was also influenced by the temperature and precipitation regime. Photosynthetic pigments had higher concentrations for Moldova and Gelu cultivars during a temperature regime higher than normal, whereas Purpuriu exhibited lower values, especially in the first year probably due to the water deficit recorded. The results show that Moldova and Purpuriu varieties exhibit adaptation behavior to climate change and high anthocyanin concentrations which recommend them for consumption. More investigations need to be done to assess the entire extent of the abiotic stress related to climate change.

Supplementary Materials

The following supporting information can be downloaded at: https://www.mdpi.com/article/10.3390/agronomy13030886/s1, Table S1: Pearson correlations between photosynthetic parameters for Gelu variety in the first year, Table S2. Pearson correlations between photosynthetic parameters for Moldova variety in the first year, Table S3. Pearson correlations between photosynthetic parameters for Purpuriu variety in the first year, Table S4. Pearson correlations between photosynthetic parameters for Coarna neagra variety in the first year, Table S5: Pearson correlations between photosynthetic parameters for Gelu variety in the second year, Table S6. Pearson correlations between photosynthetic parameters for Moldova variety in the second year, Table S7. Pearson correlations between photosynthetic parameters for Purpuriu variety in the second year, Table S8. Pearson correlations between photosynthetic parameters for Coarna neagra variety in the second year.

Author Contributions

Conceptualization, A.E.M.; methodology, A.E.M. and C.D.J.; software, M.C. and C.L.; validation, A.E.M., C.S., C.L. and I.M.; formal analysis, A.E.M., C.S., C.L., and M.C.; investigation, A.E.M.; resources, C.D.J.; data curation, A.E.M. and C.L.; writing—original draft preparation, A.E.M. and I.M.; writing—review and editing, A.E.M. and I.M.; funding acquisition, C.D.J. All authors have read and agreed to the published version of the manuscript.

Funding

This research received no external funding.

Data Availability Statement

Not applicable.

Conflicts of Interest

The authors declare no conflict of interest.

References

  1. Keller, M. Managing grapevines to optimise fruit development in a challenging environment: A climate change primer for viticulturists. Aust. J. Grape Wine Res. 2010, 16, 56–69. [Google Scholar] [CrossRef]
  2. Schultz, H.R. Global climate change, sustainability, and some challenges for grape and wine production. J. Wine Econ. 2016, 11, 181–200. [Google Scholar] [CrossRef]
  3. Reinth, M.; Vigneron, N.; Darriet, P.; Sweetman, C.; Burbidge, C.; Bonghi, C.; Walker, R.P.; Famiani, F.; Castellarin, S.D. Grape berry secondary metabolites and their modulation by abiotic factors in a climate change scenario—A review. Front. Plant Sci. 2021, 12, 643258. [Google Scholar] [CrossRef] [PubMed]
  4. De Morales-Castilla, I.; Cortazar-Atauri, I.G.; Cook, B.I.; Wolkovich, E.M. Diversity buffers winegrowing regions from climate change losses. Proc. Natl. Acad. Sci. USA 2020, 117, 2864–2869. [Google Scholar] [CrossRef]
  5. Corets-Flores, J.; Hernandez-Esquivel, K.B.; Gonzales-Rodriguez, A.; Ibarra-Maniquez, G. Flowering phenology, growth forms, and pollination syndromes in tropical dry forest species: Influence of phylogeny and abiotic factors. Am. J. Bot. 2016, 104, 39–49. [Google Scholar] [CrossRef] [Green Version]
  6. Cramer, G.R. Abiotic stress and plant responses from the whole vine to the genes. Aus. J. Grape Wine Res. 2010, 16, 86–93. [Google Scholar] [CrossRef]
  7. Gao, L.; Wang, W.; Li, H.; Li, H.; Yang, Y.; Zheng, H.; Tao, J. Anthocyanin accumulation in grape berry flesh is associated with an alternative splicing variant of VvMYBA1. Plant Physiol. Biochem. 2022, 195, 1–13. [Google Scholar] [CrossRef]
  8. Brouillard, R. Chemical structure of anthocyanins. In Anthocyanins as Food Colors; Markakis, P., Ed.; Academic Press: London, UK, 1982; pp. 1–38. [Google Scholar]
  9. He, F.; Mu, L.; Yan, G.-L.; Liang, N.-N.; Pan, Q.-H.; Wang, J.; Reeves, M.J.; Duan, C.-Q. Biosynthesis of Anthocyanins and Their Regulation in Colored Grapes. Molecules 2010, 15, 9057–9091. [Google Scholar] [CrossRef] [Green Version]
  10. Sadras, V.O.; Moran, M.A. Elevated temperature decouples anthocyanins and sugars in berries of Shiraz and Cabernet Franc. Aust. J. Grape Wine Res. 2012, 18, 115–122. [Google Scholar] [CrossRef]
  11. Sadras, V.O.; Moran, M.A.; Bonada, M. Effects of elevated temperature in grapevine. I berry sensory traits. Aust. J. Grape Wine Res. 2013, 19, 95–106. [Google Scholar] [CrossRef]
  12. Yan, Y.; Song, C.; Falginella, L.; Castellarin, S.D. Day temperature has a stronger effect than night temperature on anthocyanin and flavonol accumulation in “merlot” (Vitis vinifera L.) grapes during ripening. Front. Plant Sci. 2020, 11, 1095. [Google Scholar] [CrossRef]
  13. Theodorou, N.; Nikolaou, N.; Zioziou, E.; Kyraleou, M.; Stamatina, K.; Kotseridis, Y.; Koundouras, S. Anthocyanin content and composition in four red winegrape cultivars (Vitis vinifera L.) under variable irrigation. OENO One 2019, 53, 39–51. [Google Scholar] [CrossRef]
  14. Alatzas, A.; Theocharis, S.; Miliordos, D.-E.; Leontaridou, K.; Kanellis, A.K.; Kotseridis, Y.; Hatzopoulos, P.; Koundouras, S. The Effect of Water Deficit on Two Greek Vitis vinifera L. Cultivars: Physiology, Grape Composition and Gene Expression during Berry Development. Plants 2021, 10, 1947. [Google Scholar] [CrossRef]
  15. Barbagallo, M.G.; Vesco, G.; Di Lorenzo, R.; Lo Bianco, R.; Pisciotta, A. Soil and Regulated Deficit Irrigation Affect Growth, Yield and Quality of ‘Nero d’Avola’ Grapes in a Semi-Arid Environment. Plants 2021, 10, 641. [Google Scholar] [CrossRef]
  16. Castellarin, S.D.; Pfeiffer, A.; Sivilotti, P.; Degan, M.; Peterlunger, E.; Di Gaspero, G. Transcriptional regulation of anthocyanin biosynthesis in ripening fruits of grapevine under seasonal water deficit. Plant Cell Environ. 2007, 30, 1381–1399. [Google Scholar] [CrossRef] [Green Version]
  17. Bakuradze, T.; Tausend, A.; Galan, J.; Groh, I.A.M.; Berry, D.; Tur, J.A.; Marko, D.; Richling, E. Antioxidative activity and health benefits of anthocyanin-rich fruit juice in healthy volunteers. Free Radic. Res. 2019, 53, 1045–1055. [Google Scholar] [CrossRef]
  18. De Rosas, M.I.; Martinez, L.; Duran, M.; Malovini, E.; Cavagnaro, J.B. Anthocyanins in nutrition: Biochemistry and health benefits. In Psychiatry and Neuroscience Update; Gargiulo, P.A., Mesones Arroyo, H.L., Eds.; Springer Nature: Cham, Switzerland, 2019; pp. 143–152. [Google Scholar] [CrossRef]
  19. Khoo, H.E.; Azlan, A.; Tang, S.T.; Lim, S.M. Anthocyanidins and anthocyanins: Colored pigments as food, pharmaceutical ingredients, and the potential health benefits. Food Nutr. Res. 2017, 61, 1361779. [Google Scholar] [CrossRef] [Green Version]
  20. Smeriglio, A.; Barreca, D.; Bellocoo, E.; Trombetta, D. Chemistry, pharmacology and health benefits of anthocyanins. Phytother. Res. 2016, 30, 1265–1286. [Google Scholar] [CrossRef]
  21. Mozos, I.; Flangea, C.; Vlad, D.C.; Gug, C.; Mozos, C.; Stoian, D.; Luca, C.T.; Horbańczuk, J.O.; Horbańczuk, O.K.; Atanasov, A.G. Effects of Anthocyanins on Vascular Health. Biomolecules 2021, 11, 811. [Google Scholar] [CrossRef]
  22. Paissoni, M.A.; Segade, S.R.; Carrero-Carralero, C.; Montanini, C.; Giacosa, S.; Rolle, L. Role of anthocyanin traits on the impact of oenological tannins addition in the first stage if winegrape skin simulated maceration. Food Chem. 2020, 320, 126633. [Google Scholar] [CrossRef]
  23. Abi-Habib, E.; Vernhet, A.; Roi, S.; Carrillo, S.; Veran, F.; Ducasse, M.A.; Poncet-Legrand, C. Diffusion of phenolic compounds during a model maceration in winemaking: Role of flesh and seeds. J. Sci. Food Agric. 2022, 103, 12331. [Google Scholar] [CrossRef] [PubMed]
  24. Xu, C.; Zhang, Y.; Zhu, L.; Huang, Y.; Lu, J. Influence of growing season on phenolic compounds and antioxidant properties of grape berries from vines grown in subtropical climate. J. Agric. Food Chem. 2011, 59, 1078–1086. [Google Scholar] [CrossRef] [PubMed]
  25. Biniari, K.; Xenaki, M.; Daskalakis, I.; Rusjan, D.; Bouza, D.; Stavrakaki, M. Polyphenolic compounds and antioxidants of skin and berry grapes of Greek Vitis vinifera cultivars in relation to climate conditions. Food Chem. 2020, 307, 125518. [Google Scholar] [CrossRef] [PubMed]
  26. Cui, Z.H.; Bi, W.L.; Hao, X.Y.; Li, P.M.; Duan, Y.; Walker, M.A.; Xu, Y.; Wang, Q.C. Drought stress enhances up-regulation of anthocyanin biosynthesis in Grapevine leafroll-associated virus 3- infected in vitro grapevine (Vitis vinifera) Leaves. Plant Dis. 2017, 101, 1606–1615. [Google Scholar] [CrossRef] [Green Version]
  27. Venios, X.; Korkas, E.; Nisiotou, A.; Banilas, G. Grapevine Responses to Heat Stress and Global Warming. Plants 2020, 9, 1754. [Google Scholar] [CrossRef]
  28. Lee, J.; Durst, R.W.; Wrolstad, R.E. Determination of total monomeric anthocyanin pigment content of fruit juices, beverages, natural colorants, and wines by the pH differential method: Collaborative study. J. AOAC Int. 2005, 88, 1269–1278. [Google Scholar] [CrossRef] [Green Version]
  29. Balik, J.; Kumsta, M. Evaluation of colour content in grapes originating from south Moravia. Czech J. Food Sci. 2008, 26, S18–S24. [Google Scholar] [CrossRef] [Green Version]
  30. Meier, U. (Ed.) Growth Stages of Mono- and Dicotyledonous Plants; Julius Kuhn-Institute: Quedlinburg, Germany, 2018; pp. 93–96. [Google Scholar] [CrossRef]
  31. Douthe, C.; Medrano, H.; Tortosa, I.; Escalona, J.M.; Hernandez-Montes, E.; Pou, A. Whole-plant water use in field grown grapevine: Seasonal and environmental effects on water and carbon balance. Front. Plant. Sci. 2018, 9, 1540. [Google Scholar] [CrossRef]
  32. Jiang, W.; Li, N.; Zhang, D.; Meinhardt, L.; Cao, B.; Li, Y.; Song, L. Elevated temperature and drought stress significantly affect fruit quality and activity of anthocyanin-related enzymes in jujube (Ziziphus jujuba Mill. Cv.’Lingwuchangzao’). PLoS ONE 2020, 15, 241491. [Google Scholar] [CrossRef]
  33. Ma, D.; Sun, D.; Wang, C.; Li, Y.; Guo, T. Expression of flavonoid biosynthesis genes and accumulation of flavonoid in wheat leaves in response to drought stress. Plant Physiol. Biochem. 2014, 80, 60–66. [Google Scholar] [CrossRef]
  34. Lungoci, C.; Motrescu, I.; Filipov, F.; Jitareanu, C.D.; Teliban, G.-C.; Ghitau, C.S.; Puiu, I.; Robu, T. The Impact of Salinity Stress on Antioxidant Response and Bioactive Compounds of Nepeta cataria L. Agronomy 2022, 12, 562. [Google Scholar] [CrossRef]
  35. Hinojosa-Gómez, J.; San Martín-Hernández, C.; Heredia, J.B.; León-Félix, J.; Osuna-Enciso, T.; Muy-Rangel, M.D. Anthocyanin Induction by Drought Stress in the Calyx of Roselle Cultivars. Molecules 2020, 25, 1555. [Google Scholar] [CrossRef] [Green Version]
  36. Yamane, T.; Jeong, S.T.; Goto-Yamamoto, N.; Koshita, Y.; Kobayashi, S. Effects of temperature on anthocyanin biosynthesis in grape berry skins. Am. J. Enol. Vitic. 2006, 57, 54–59. [Google Scholar] [CrossRef]
  37. Blancquaert, E.H.; Oberholster, A.; Da-Silva, J.M.R.; Deloire, A.J. Effects of abiotic factors on phenolic compounds in the grape berry—A review. S. Afr. J. Enol. Vitic. 2019, 40, 1–14. [Google Scholar] [CrossRef]
  38. Hunag, Z.; Wang, B.; Williams, P.; Pace, R.D. Identification of anthocyanins in muscadine grapes with HLPC-ESI-MS. LWT Food Sci. Technol. 2009, 42, 819–824. [Google Scholar] [CrossRef]
  39. Liang, Z.; Wu, B.; Fan, P.; Duan, W.; Zheng, X.; Liu, C.; Li, S. Anthocyanin composition and content in grape berry skin in Vitis germplasm. Food Chem. 2008, 111, 837–844. [Google Scholar] [CrossRef]
  40. Nile, S.H.; Kim, D.H.; Keum, Y.S. Determination of anthocyanin content and antioxidant capacity of different grape varieties. Ciencia Tec. Vitiv. 2015, 30, 60–68. [Google Scholar] [CrossRef]
  41. Demir, K.; Erdinc, B. Compositional differences in phenolic compounds and anthocyanin contents of some table and wine grape (V. vinifera L.) varieties from Turkey. Oxid. Commun. 2017, 40, 648–656. [Google Scholar]
  42. Hatfield, J.L.; Dold, C. Water-use efficiency: Advances and Challenges in a Changing Climate. Front. Plant. Sci. 2019, 10, 103. [Google Scholar] [CrossRef] [Green Version]
  43. Greer, D.H. Temperature-dependent responses of the photosynthetic and chlorophyll fluorescence attributes of apple (Malus domestica) leaves during a sustained high temperature event. Plant Physiol. Biochem. 2015, 97, 139–146. [Google Scholar] [CrossRef]
  44. Luo, H.B.; Ma, L.; Xi, H.F.; Duan, W.; Li, S.H.; Loescher, W.; Wang, J.F.; Wang, L.J. Photosynthetic responses to heat treatments at different temperatures and following recovery in grapevine (Vitis amurensis L.) leaves. PLoS ONE 2011, 6, 23033. [Google Scholar] [CrossRef] [PubMed] [Green Version]
Figure 1. The ombrothermic charts for the studied years.
Agronomy 13 00886 g001
Figure 2. Dynamic evolution of the chlorophyll content (in CCl units) in the leaves of the four studied grapevine varieties in the first year with significant differences at 0.05 level indicated with letters. (BBCH65—full flowering: 50% of flower-hoods fallen; BBCH75—berries pea-sized, bunches hang; BBCH79—majority of berries touching; BBCH89—berries ripe for harvest).
Agronomy 13 00886 g002
Figure 3. Dynamic evolution of the chlorophyll content (in CCl units) in the leaves of the four studied grapevine varieties in the second year with significant differences at 0.05 level indicated with letters.
Agronomy 13 00886 g003
Figure 4. Pearson correlation test results for the first year for total anthocyanin from the grapes vs. the total chlorophyll content in the leaves (G, M, P, and C correspond with the four studied varieties Gelu, Moldova, Purpuriu, and Coarna neagra, respectively, GA, MA, PA, CA are the anthocyanin concentrations, GCCl79, MCCl79, PCCl79, CCCl79 are the chlorophyll concentrations for the four varieties corresponding with the BBCH phase 79, while GCCl89, MCCl89, PCCl89, and CCCl89 are the chlorophyll concentrations for the corresponding varieties in the BBCH—89 phase).
Agronomy 13 00886 g004
Figure 5. Pearson correlation test results for the second year for total anthocyanin from the grapes vs. the total chlorophyll content in the leaves (G, M, P, C correspond with the four studied varieties Gelu, Moldova, Purpuriu, and Coarna neagra, respectively, GA, MA, PA, and CA are the anthocyanin concentrations, GCCl79, MCCl79, PCCl79, and CCCl79 are the chlorophyll concentrations for the four varieties corresponding with the BBCH phase 79, whereas GCCl89, MCCl89, PCCl89, and CCCl89 are the chlorophyll concentrations for the corresponding varieties in the BBCH—89 phase).
Agronomy 13 00886 g005
Table 1. Climate data for the first year, 2020.
JanuaryFebruaryMarchAprilMayJuneJulyAugustSeptemberOctoberNovemberDecember
Temperature (°C)
Monthly average−2.4−2.33.510.316.720.722.921.618.18.82.72.6
Normal average−3.1−1.23.410.416.319.721.220.515.810.14.4−0.8
Difference0.7−1.10.1−0.10.41.01.71.12.3−1.3−1.73.4
Monthly minimum−16.6−13.1−15.71.53.810.710.410.24.9−3.7 −7.9−10.2
Monthly maximum10.315.321.624.731.6 34.635.533.131.928.514.315.6
Relative humidity of the air (%)
Monthly average937973676768695966778286
Normal average868378706769707074788487
Difference7−4−5−30−1−1−11−8−1−2−1
Rainfall (mm)
Monthly total13.213.78.482.232.384.137.832.118.740.20.68.7
Normal value30.528.432.849.159.188.782.856.952.032.835.131.5
Difference−17.3−14.7−24.433.1−26.8−4.6−45.0−24.8−33.37.4−34.5−22.8
Table 2. Climate data for 2021.
JanuaryFebruaryMarchAprilMayJuneJulyAugustSeptemberOctoberNovemberDecember
Temperature (°C)
Monthly average−2.5−9.54.013.018.223.326.323.118.912.06.6−3.7
Normal average−3.1−1.23.410.416.319.721.220.515.810.14.4−0.8
Difference+0.6−8.3+0.6+2.6+1.9+3.2+5.1+2.6+3.1+1.9+2.2−2.9
Monthly minimum−19.2−20.4−18.5−0.34.46.58.311.50.1−1.0−3.9−7.0
Monthly maximum10.811.318.928.631.432.132.132.931.928.016.413.2
Relative humidity of the air (%)
Monthly average858372696858535965828792
Normal average86.483.477.970.467.869.470.970.673.878.084.586.8
Difference−1.4−0.4−5.9−1.4+0.2−11.4−17.9−11.6−8.8+4.0+2.5+5.2
Rainfall (mm)
Monthly total12.061.019.456.298.216.322.232.150.134.022.583.5
Normal value30,528,432.849.159.188.782.856.952.032.835.131.5
Difference−18,5+32,6−13.4+7.1+39.1−72.4−60.6−24.8−1.9+1.2−10.3+52
Table 3. Total anthocyanin concentrations in the grape skins (mg/L) for the studied varieties in both years.
VarietypH = 1pH = 4.5Conc.* [mg/L]Average
Conc. [mg/L]
Conc. per Dry Matter [mg/g]
A520A700A520A700
1st yearGelu0.4160.0170.1250.019134.13133.06 f1.673 f
0.4140.0190.1250.019132.30
0.4170.0190.1260.018132.75
Moldova2.1030.0180.3580.023801.12806.92 b7.482 b
2.1060.020.3440.022807.53
2.1070.0210.3340.022812.11
Purpuriu1.0670.0210.2080.019392.32389.11 d5.713 d
1.0570.0230.2140.023385.91
1.0620.0230.2120.023389.11
Coarna neagra0.3710.0350.1750.03838.5438.47 h0.375 h
0.3740.0380.1760.03938.54
0.370.0380.1710.03738.34
2nd yearGelu0.7080.0140.1720.013244.91245.22 e2.491 e
0.7090.0130.170.013246.74
0.7030.0130.170.013243.99
Moldova1.9720.010.2530.0121545.391547.49 a12.399 a
1.9530.010.2390.0121540.90
1.9650.010.2340.0121556.17
Purpuriu0.7230.010.1490.01515.43511.83 c5.480 c
0.6970.0090.1490.01492.98
0.7370.010.150.01527.10
Coarna neagra0.3060.0120.0890.01299.33101.93 g1.167 g
0.3170.0130.0920.013103.00
0.3170.0130.0910.013103.45
* The concentration is presented as mg Malvidin-3-O-glucoside per liter of extracted solution. Significant differences at 0.05 level indicated with letters.
Table 4. The dynamic evolution of main photosynthetic parameters in the studied growth phases for the four analyzed varieties in the first year.
PAR (µMOL M−2S−1)Tleaf (°C)TEXT (°C)CI (PPM)E
(µMOL H2O M−2S−1)
AN
(µMOL CO2 M−2S−1)
WUEINST = A/E
GeluBBCH 65277.00 ± 1.1 b31.99 ± 0.07 ab29.72 ± 0.08 a362.00 ± 8.30 c1.28 b0.04 ef0.03 fg
GeluBBCH 75114.22 ± 1.7 h29.64 ± 0.11 cd27.44 ± 0.05 b347.20 ± 6.25 e0.60 d0.45 d0.74 e
GeluBBCH 89120.15 ± 1.5 g27.70 ± 0.12 e25.75 ± 0.07 c397.15 ± 7.23 a0.36 fg−0.02 f−0.04 h
MoldovaBBCH 65520.40 ± 2.2 a32.01 ± 0.05 ab30.28 ± 0.09 a339.30 ± 6.38 g0.79 c0.07 ef0.09 fg
MoldovaBBCH 75120.18 ± 1.7 g27.87 ± 0.09 e25.45 ± 0.10 c342.77 ± 7.98 f0.57 de0.78 c1.38 d
MoldovaBBCH 89172.50 ± 1.5 c28.90 ± 0.11 de26.70 ± 0.07 bc360.65 ± 9.20 c0.87 c0.76 c0.87 e
PurpuriuBBCH 65152.67 ± 0.9 e33.48 ± 0.08 a30.37 ± 0.12 a355.44 ± 7.24 d1.86 a0.47 d0.25 f
PurpuriuBBCH 7594.04 ± 1.2 i28.26 ± 0.14 de26.13 ± 0.09 bc331.17 ± 3.25 i0.55 d2.15 a3.89 a
PurpuriuBBCH 89156.45 ± 0.8 d28.80 ± 0.10 de26.75 ± 0.08 bc368.70 ± 2.65 b0.48 ef0.41 d0.85 e
Coarna neagraBBCH 65156.00 ± 1.4 d30.89 ± 0.11 bc29.63 ± 0.11 s316.89 ± 9.33 j0.43 ef0.72 c1.65 c
Coarna neagraBBCH 75126.42 ± 1.1 f27.92 ± 0.18 e25.90 ± 0.10 c337.32 ± 8.21 h0.36 fg1.09 b3.03 b
Coarna neagraBBCH 89119.40 ± 0.8 g28.40 ± 0.12 d26.80 ± 0.08 bc355.90 ± 10.05 d0.24 g0.17 e0.71 e
Significant differences at 0.05 level indicated with letters.
Table 5. The dynamic evolution of main photosynthetic parameters in the studied growth phases for the four analyzed varieties in the second year.
PAR (µMOL M−2S−1)Tleaf (°C)TEXT (°C)CI (PPM)E
(µMOL H2O M−2S−1)
AN
(µMOL CO2 M−2S−1)
WUEINST = A/E
GeluBBCH 65156.8 ± 5.3 e29.20 ± 0.05 ab31.00 ± 0.05 b348.1 ± 13.58 i0.7 bcd3.8 d5.43 de
GeluBBCH 75172.14 ± 2.1 d25.03 ± 0.08 de25.29 ± 0.04 cd496.94 ± 12.20 a0.64 bcd3.13 e4.89 e
GeluBBCH 89116.4 ± 1.4 i27.1 ± 0.05 cd24.80 ± 0.11 d373.9 ± 12.05 e0.5 cde0.3 i1.4 h
MoldovaBBCH 65172.5 ± 2.5 d30.77 ± 0.10 a32.72 ± 0.08 a407.07 ± 11.04 c0.49 cde2.98 f6.08 cd
MoldovaBBCH 7589.78 ± 1.3 k26.41 ± 0.05 de26.58 ± 0.10 c365.38 ± 11.25 f0.69 bc8.56 a12.41 a
MoldovaBBCH 89181.6 ± 0.9 c29.0 ± 0.05 b26.6 ± 0.07 cd329.10 ± 11.98 j1.24 a1.31 h2.17 g
PurpuriuBBCH 6592.09 ± 1.6 j30.19 ± 0.07 a30.36 ± 0.05 b348.52 ± 12.55 ih0.45 e5.17 c11.4 a
PurpuriuBBCH 75218.41 ± 1.5 b26.38 ± 0.12 de26.82 ± 0.09 c352.88 ± 13.05 d0.61 b5.76 b9.44 b
PurpuriuBBCH 89130.8 ± 2.0 f28.8 ± 0.15 b26.80 ± 0.10 cd397.7 ± 11.20 b0.43 de−0.04 j−0.13 i
Coarna neagraBBCH 65283.87 ± 1.3 a29.38 ± 0.05 ab30.06 ± 0.11 b461.49 ± 1.51 b0.4 cde2.53 g6.33 c
Coarna neagraBBCH 7564.23 ± 1.4 l26.39 ± 0.04 de26.51 ± 0.05 cd396.65 ± 1.05 d0.70 b2.58 g3.69 f
Coarna neagraBBCH 89119.4 ± 1.5 g28.4 ± 0.08 bc26.8 ± 0.07 c355.9 ± 1.35 g0.24 e0.17 i0.63 h
Significant differences at 0.05 level indicated with letters.
Disclaimer/Publisher’s Note: The statements, opinions and data contained in all publications are solely those of the individual author(s) and contributor(s) and not of MDPI and/or the editor(s). MDPI and/or the editor(s) disclaim responsibility for any injury to people or property resulting from any ideas, methods, instructions or products referred to in the content.

