Article

Transcriptome Sequencing Reveals Key Genes for Sunflower Unsaturated Fatty Acid Synthesis

1
Laboratory of Integrated Pest Management on Crops on Northwestern Oasis, Ministry of Agriculture and Rural Affairs, Institute of Plant Protection, Xinjiang Academy of Agricultural Sciences, Urumqi 830091, China
2
Institute of Economic Crops, Xinjiang Academy of Agricultural Sciences, Urumqi 830091, China
*
Author to whom correspondence should be addressed.
Agronomy 2023, 13(3), 885; https://doi.org/10.3390/agronomy13030885
Submission received: 16 February 2023 / Revised: 11 March 2023 / Accepted: 15 March 2023 / Published: 16 March 2023

Abstract

:
Sunflower (Helianthus annuus L.) is an important oil crop with rich nutrients, and genetically engineered breeding has become an important way to improve its quality. In this study, five varieties of oilseed sunflower were analyzed for fatty acid (FA) content. The seed embryos of one of the high oleic acid (OA) varieties were transcriptome sequenced at different stages. The results showed that OA synthesis dominated the unsaturated fatty acid (UFA) synthesis pathways in seed embryos. Substantially differentially expressed genes were detected at various post-flowering stages. Specifically, the up-regulated gene numbers were highest at 10 d after flowering, while most genes were down-regulated at 20 d after flowering. The enriched genes were rather consistent with almost all experimental groups exhibiting enrichment to the FAD2 gene. The expression of FAD2 was highly negatively correlated with the expressions of FAD6, FAD3, and FAD7. During seed embryo development, the expression level of FAD2 was highly negatively correlated with the final OA content and was highly positively correlated with the final linoleic acid (LA) content. This suggests that the FAD2 is a key enzyme catalyzing the OA to LA conversion.

1. Introduction

Sunflower (Helianthus annuus L.), especially the sunflower seed embryo, is rich in vegetable oil and edible protein and is one of the four major oil crops in the world [1,2,3]. It is also an ideal material for resistance breeding because of its high adaptability, drought tolerance, salinity tolerance, and barrenness [4,5,6].
With the rapid development of the economy and the steady improvement of people’s lives, more and more people are concerned about nutrition and safety brought by food. Edible oils are closely related to people’s daily lives, while vegetable oils are the most important part of edible oils [7,8]. Compared with other types of oils, the ratio of saturated fatty acids (SFAs) to unsaturated fatty acids (UFAs) in vegetable oils is more reasonable, and their consumption has gradually exceeded that of other types of oils, becoming one of the most important sources of nutrition in people’s daily diets [9,10]. It is well known that rich and diverse vegetable oils are the main nutritional elements for human beings, and they are rich in essential fatty acids (FAs), vitamins, and other substances [11]. Since FAs are the main component of vegetable oils, FA composition becomes one of the most important evaluation indicators when evaluating the quality of vegetable oils [12]. Previous studies have shown that vegetable oils contain four major FAs, of which palmitic acids (PAs) (C16:0) and stearic acids (SAs) (C18:0) are SFAs, while oleic acids (OAs) (C18:1) and linoleic acids (LAs) (C18:2) are UFAs, which have a role in fat metabolism and nutrient absorption, but there are differences between the two types of FAs [10,13]. Excessive intake of SFAs can easily lead to an increased probability of cardiovascular diseases, while UFAs can significantly reduce the level of blood lipids in the body, among which LAs have a certain function in stopping atherosclerosis [14,15].
The sunflower oils from sunflower seeds are rich in UFAs, which account for over 90% of total FAs [16]. Long-term consumption of edible oils containing high UFAs can help lower blood pressure and blood lipids and protect the cardio-cerebral vessels [14,15]. It has been shown that the position of the FA double bond and the number of double bonds is related to the nutritional level of fats and oils [17]. Researchers have divided UFAs into several categories according to the position of the first double bond: ω-3 group, ω-6 group, ω-9 group, etc. In addition, according to whether the body can synthesize them itself, FAs are divided into essential fatty acids (EFAs) and non-essential fatty acids (NFAs), and UFAs, such as linolenic acids and LAs are EFAs that the human body cannot synthesize itself [18,19,20].
Seed oil content has long been studied for sunflower quality improvement and has been the main goal and direction of breeding programs. Seven QTLs have been identified, of which two control oil content, three control OA content, and two control LA content, explaining more than 10% of the phenotypic variation, and confirming the existence of at least two additional genomic regions controlling OA and LA content in sunflower [21]. Meanwhile, genome-wide association studies (GWASs) combined with high-throughput lipidome phenotyping can identify genetic variations associated with FA content in sunflower seeds. It has been shown that GWASs revealed significant genetic associations for 11 of them based on the genotypes of 15,483 SNPs and the concentrations of 23 FAs [22]. Based on an integrated approach combining quantitative genetics, expression, and diversity data, the researchers developed an integrated gene network for oil metabolism, which showed that a total of 429 genes mapping to 125 reactions corresponding to 12 pathways were generated, 46 oil genes were identified in 32 genomic regions corresponding to previously identified QTLs for 7 oil-related traits, and successful identification of oil related candidate genes for improvement [23]. In sunflower seeds, the OAs and LAs constitute the major UFAs [12]. Functional genes related to UFA synthesis are the important determinants for the FA composition of sunflower oil [16,24]. In plants, SFAs are produced in the chloroplasts and preplastids. Among them, SAs are reduced by a stearyl-ACP dehydrogenase to form mono-unsaturated fatty acids (MUFAs), which, after forming glycerides, are reduced by fatty acid dehydrogenase (FAD) in chloroplasts and endoplasmic reticula to form the UFA-containing glycerides [25]. FAD, as a membrane integrin, reduces the initially formed FA group of glycerides to generate UFAs [26]. The composition of C18 UFAs in plants has great significance in production since it is one of the vital determinants of the quality of oils. Thus, the enzymes catalyzing further desaturation of C18 FAs and their encoding genes have always won the attention of researchers [27]. There are roughly two categories of enzymes (or genes) that catalyze the further desaturation of C18 FAs. One category is called ω-6 (or Δ12) desaturases, such as FAD2 and FAD6, and the other category is called ω-3 (or Δ15) desaturases, such as FAD3, FAD7, and FAD8. These two enzyme types vary in substrate specificity. The substrates of FAD2 and FAD6 contain a double bond, which catalyzes the conversion of OAs to LAs; in contrast, the substrates of FAD3, FAD7, and FAD8 contain two double bonds, which catalyze the conversion of LAs to linolenic acids [28]. These enzymes can also be classified into two categories depending on their intracellular location. One type, including FAD2 and FAD3, is located in the endoplasmic reticula, and the other type, including FAD6, FAD7, and FAD8, is located in the chloroplasts [29,30].
The majority of desaturase genes are under post-transcriptional control. During seed development, the expression of FAD genes is subjected to tightly spatiotemporal regulation. In the temporal aspect, the FAD6 gene expression in olive was almost zero at 13 weeks after flowering, which began to accumulate substantially from the 16th week, and exhibited the highest accumulations of transcription products in the 22nd week in the embryos and endosperms [31]. In the spatial aspect, the FAD2-2 gene was expressed in roots, stems, leaves, flowers, cotyledons, and immature seeds, with the highest expression found in leaves and the lowest expression found in immature seeds [32].
At the same time, UFAs, as one of the most basic components of living organisms, are not only an important source of nutrition for organisms, but also a component of the structure of many organisms, and are closely related to cellular recognition and tissue immunity, and have many other functions in life, such as the prevention of heat loss, resistance to cold, drought, salt, disease, and the reduction of mechanical damage to organisms [14,33,34,35]. Transcriptome sequencing technology, which allows for the RNA analysis of plants at different periods and even various plant organs, as well as the acquisition of plentiful information therefrom, offers the possibility to study the post-transcriptional regulatory information in plants [36]. At the same time, compared to traditional microarray hybridization platforms, transcriptome sequencing can detect the overall transcriptional activity of any species without the need to pre-design probes for known sequences, providing more accurate digitized signals, higher detection throughput, and a wider detection range, making it a powerful tool for the current in-depth study of transcriptome complexity. It is a powerful tool for investigating the complexity of the transcriptome. It allows researchers to target and rapidly mine valuable information in the era of big data to rationally explain relevant biological phenomena and problems [37].
In recent years, several studies on the sunflower transcriptome have been carried out. The results of crosstalk-related transcriptome mapping between sunflower and Verticillium dahliae revealed that some differentially expressed unigenes are involved in plant hypersensitive responses and salicylic acid/jasmonic acid (JA)-mediated signaling in response to V. dahlia [38]. The results of a transcriptome analysis of the sunflower variety ‘Xinkui 10’ under high salt stress at the seedling stage suggest that HaCYP93A1 may be involved in the salt tolerance pathway of sunflower by regulating JA signaling [39]. Time-course transcriptome and weighted gene co-expression network analyses revealed drought response mechanisms in two sunflower self-pollinating lines, and the top 20 Hub genes were screened using the CytoHubba plugin [5]. RNA-seq results of sunflower showed that its tolerance to water stress was associated with fine-tuning the transcriptome, and several components (NCED3, NCED5, ABI1, and PYL4), which are related to abscisic acid (ABA) synthesis and signal transduction, were associated with drought resistance [5,40]. A combination of sunflower genome-wide association studies and RNA-seq analysis identified 14 candidate genes. Four of them are ABA-related protein kinases and transcription factors, and these genes may play important roles in sunflower drought response [41]. However, most of these research results focused on the direction of sunflower resistance, and a few transcriptomic findings on sunflower quality (especially UFAs) have been reported.
In this study, large numbers of differentially expressed genes (DEGs) were classified by transcriptome sequencing using the Kyoto encyclopedia of genes and genomes (KEGG) and gene ontology (GO) enrichment approaches. Initially, an enrichment analysis was performed on the DEGs in the two differential groups, then on the clustered DEGs, and finally on the DEGs in the co-expression network. By doing so, we hoped to derive the metabolic pathways and genes that are related closely to sunflower FA synthesis and reveal the law of UFA synthesis in sunflower seeds, to lay the foundation for further research and development of high-quality sunflower seeds.

2. Materials and Methods

2.1. Experimental Design and Seed Sampling

Five sunflower hybrid varieties were used as the test materials, namely A17, 567DW, KWS303, RITOM, and TO1244 (The varieties were sourced from Xinjiang Xiya Seed Co., Changji, China and collected and preserved by the Institute of Cash Crops, Xinjiang Academy of Agricultural Sciences, Urumqi, China). Among them, A17 and RITOM were high OA varieties. For planting, three different ecological regions in Xinjiang, China were selected: Urumqi (E 87°473, N 43°945, 592 m), Yili (E 82°844, N 43°425, 829 m), and Aletai (E 87°976, N 47°274, 550 m). Three replicates were arranged at each site. Ten seed embryos (one biological replicate) were collected at 5, 10, 15, 20, 25, 30, and 35 d after flowering for the determination of FA composition. For RITOM from the Urumqi site, ten seed embryos (one biological replicate) at 10, 20, and 35 d after flowering were collected for the transcriptome sequencing analysis. Since sunflower capitulums usually open from the outer ring to the inner ring, we selected the outermost ring of the capitulums for our sampling. The procedure to complete the seed embryo separation was to place the softened seeds in a Petri dish, gently cut the seed coat with a scalpel, and then separate the seed coat from the seed embryo using forceps. Ten seed embryos after peeling the seed coat were numbered and placed in a freeze storage tube and quickly stored in liquid nitrogen.

2.2. FA Content Determination

Gas chromatography was utilized to determine the contents of various FA components.
We weighed 50 mg of the FA sample into a 10 mL measuring flask, added 1.5 mL of a mixture of petroleum ether and benzene at 50 °C (1:1), and gently shook it to dissolve the oil. Then, 1.5 mL of 0.4 mol/L potassium hydroxide-methanol solution was added and mixed well. Upon standing at room temperature for 10 min, distilled water was added to bring the entire petroleum ether benzyl ester solution up to the top of the bottle neck and was left to clarify. The supernatant was aspirated and concentrated by blowing in nitrogen, and the resulting concentrate could be used for the gas layer analysis. The measurement ramp-up method was performed by the programmed ramp-up method with a column temperature of 210–230 °C, a ramp-up rate of 10 °C/ min, the inlet temperature of the chromatograph was set at 260 °C, while the inlet pressure was 25 Pa, 25 mL/min of high purity nitrogen, 40 mL/min of hydrogen, and 400 mL/min of air. Peak areas and percentages of various FAs to total FAs were printed automatically using normalized calculations in the microprocessor.

2.3. RNA Isolation and Library Construction

RNAs were isolated from the sunflower seed embryos to detect RNA purity by agarose gel electrophoresis and OD260/280 and OD260/230 ratios. Qubit 2.0 fluorometer (Thermo Fisher Scientific, Shanghai, China) was utilized for the accurate quantification of the RNA concentrations. Agilent 2100 bioanalyzer (Agilent Technologies, Santa Clara, CA, USA) was used to examine the RNA integrity accurately, followed by the library construction. Eukaryotic mRNA was enriched with Oligo (dT) magnetic beads, and the resulting mRNA was subsequently randomly interrupted with divalent cations in NEB fragmentation buffer (10×) (provides efficient and tunable RNA fragmentation by incubation with magnesium ions at 94 °C). cDNA first strand was synthesized in the M-MuLV reverse transcriptase (E00050, GenScript, Piscataway, NJ, USA) using the fragmented mRNA as a template and random oligonucleotides as primers, followed by the degradation RNA strand with RNaseH (EN0201, Thermo Fisher Scientific, Shanghai, China), and the second strand of cDNA was synthesized with dNTPs under the DNA polymerase I system. The purified double-stranded cDNA was end-repaired, A-tailed, and connected to the sequencing junction, and the cDNA of about 200 bp was screened with AMPure XP beads, PCR was amplified, and the PCR products were purified again with AMPure XP beads to finally obtain the library. Once the library was constructed, it was initially quantified using a Qubit 2.0 fluorometer (Thermo Fisher Scientific, Shanghai, China) and diluted to 1.5 ng/μL, and then the insert size of the library was detected using an Agilent 2100 bioanalyzer (Agilent Technologies, Santa Clara, CA, USA), and after the insert size met expectations, the effective concentration of the library was accurately quantified by qRT-PCR. The effective concentration of the library was higher than 2 nM to ensure the quality of the library.

2.4. Transcriptome Sequencing and Principal Component Analysis (PCA)

Upon passing the library inspection, the libraries were pooled according to the effective concentration and the target downstream data volume and then sequenced by ILLUMINA HISEQ X sequencing platform (Illumina, San Diego, CA, USA). The sequencing mode was standard pair end sequencing, with a raw read length of 150 bp per read. Following the raw data filtering, sequencing error rate checking, and GC content distribution checking, the clean reads for subsequent analysis were obtained. The number of reads in the raw data was 26, 743, 790–29, 248, 554. The number of reads after the raw data filtering was 26, 111, 733–28, 736, 301. The number of bases after the raw data filtering was 7.83–8.62 G. The overall sequencing error rate was 0.02–0.03. The percentage of bases with Phred values greater than 20 to the total bases (Q20) was 96.47–98.08%. The percentage of bases with Phred values greater than 30 to the total bases (Q30) was 93.14–94.72%. The percentages of the four bases were 46.08–48.55%. PCA is a dimensionality reduction method and a common computational tool used to show sample-to-sample variability. We used the gmodels, ggpubr, and ggthemes packages from the R package for calculating PCA and making plots in order to show the relationship between the samples.

2.5. Reference Transcriptome, Quantification of Gene Expression Levels and Screening of DEGs

Genomic mapping analysis was carried out on the filtered sequences using HISAT software against the sunflower reference genome XRQr2.0 (https://www.heliagene.org/HanXRQr2.0-SUNRISE/, accessed on 3 June 2021) [23]. We used FeatureCounts v1.5.0-p3 software to calculate the number of reads mapped to each gene. Based on the length of the gene and the number of reads mapped to that gene, a fragments per kilobase of exon model per million mapped fragments (FPKM) was calculated for each gene. DEGs from two groups were analyzed using DESeq2 software. This program takes a DESeq normalized approach with a negative binomial distribution model for the p value calculation and Benjamini–Hochberg (BH) for the false discovery rate (FDR) calculation to determine the differential expression in the gene expression data. If log2Foldchange > 0, the differential gene is considered to be up-regulated, and conversely, if log2Foldchange < 0, the differential gene is considered to be down-regulated. Meanwhile, the FDR was controlled due to the obtained p values using the BH method for multiple hypothesis testing. The screening criteria for DEGs were log2Foldchange > 0 and corrected at p < 0.05 (Table S1).

2.6. GO and KEGG Enrichment Analysis of DEGs

The DEG sets were subjected to GO function enrichment analysis using ClusterProfiler, at a significance level of corrected p < 0.05. The KEGG is the primary public database of pathways. In the present study, the pathway significant enrichment analysis was performed in units of the KEGG pathway against the Arabidopsis reference. With the aid of a hypergeometric test, the pathways significantly enriched in DEGs relative to all annotated genes were identified. KOBAS 2.0 was used for the pathway enrichment analysis by setting the FDR parameter to BH (FDR correction with BH). Those pathways with corrected at p < 0.05 and were defined as the significantly enriched pathways in DEGs.

2.7. Quantitative Real-Time PCR (qRT-PCR) Analysis

Total RNA was extracted from all seed embryo samples using the UNIQ-10 column-based Trizol Total RNA extraction kit (SK1321, Sangon Biotech, Shanghai, China). First strand cDNA was generated using the AMV First Strand cDNA synthesis kit (SK2445, Sangon Biotech, Shanghai, China) according to the manufacturer’s instructions. The qRT-PCR reactions were performed using the AceQ Universal SYBR qPCR Master Mix (Q511-02, Vazyme Biotech, Nanjing, China) on a LightCycler480 real-time fluorescent quantitative PCR system (Roche, Basel, Switzerland). The primers used in the experiments were designed by Primer Premier 5.0 software with an internal reference gene of β-actin, and the full primer sequences are listed in Table S2. Three biological replicates were performed for each experiment. Relative expression was calculated using the 2−ΔΔCT method.

3. Results

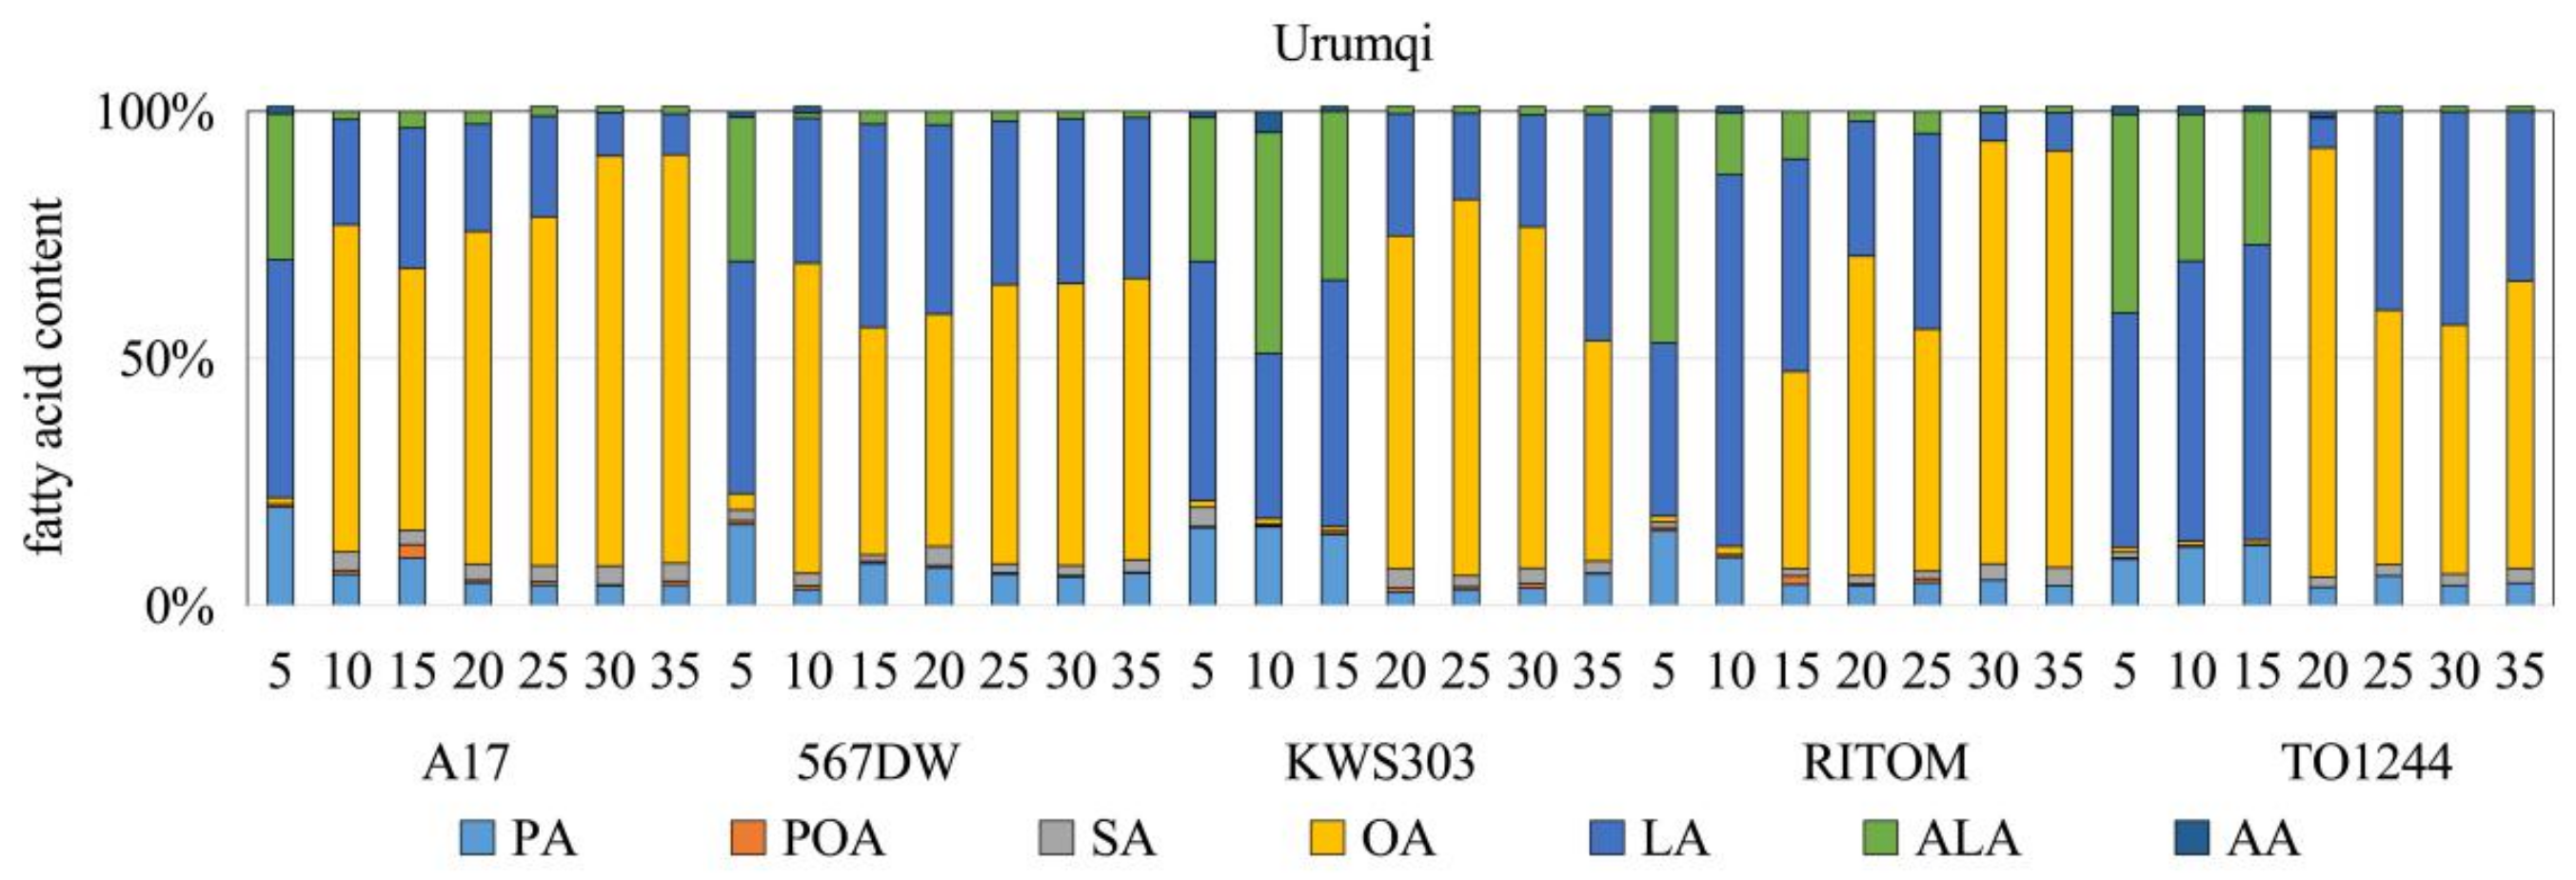
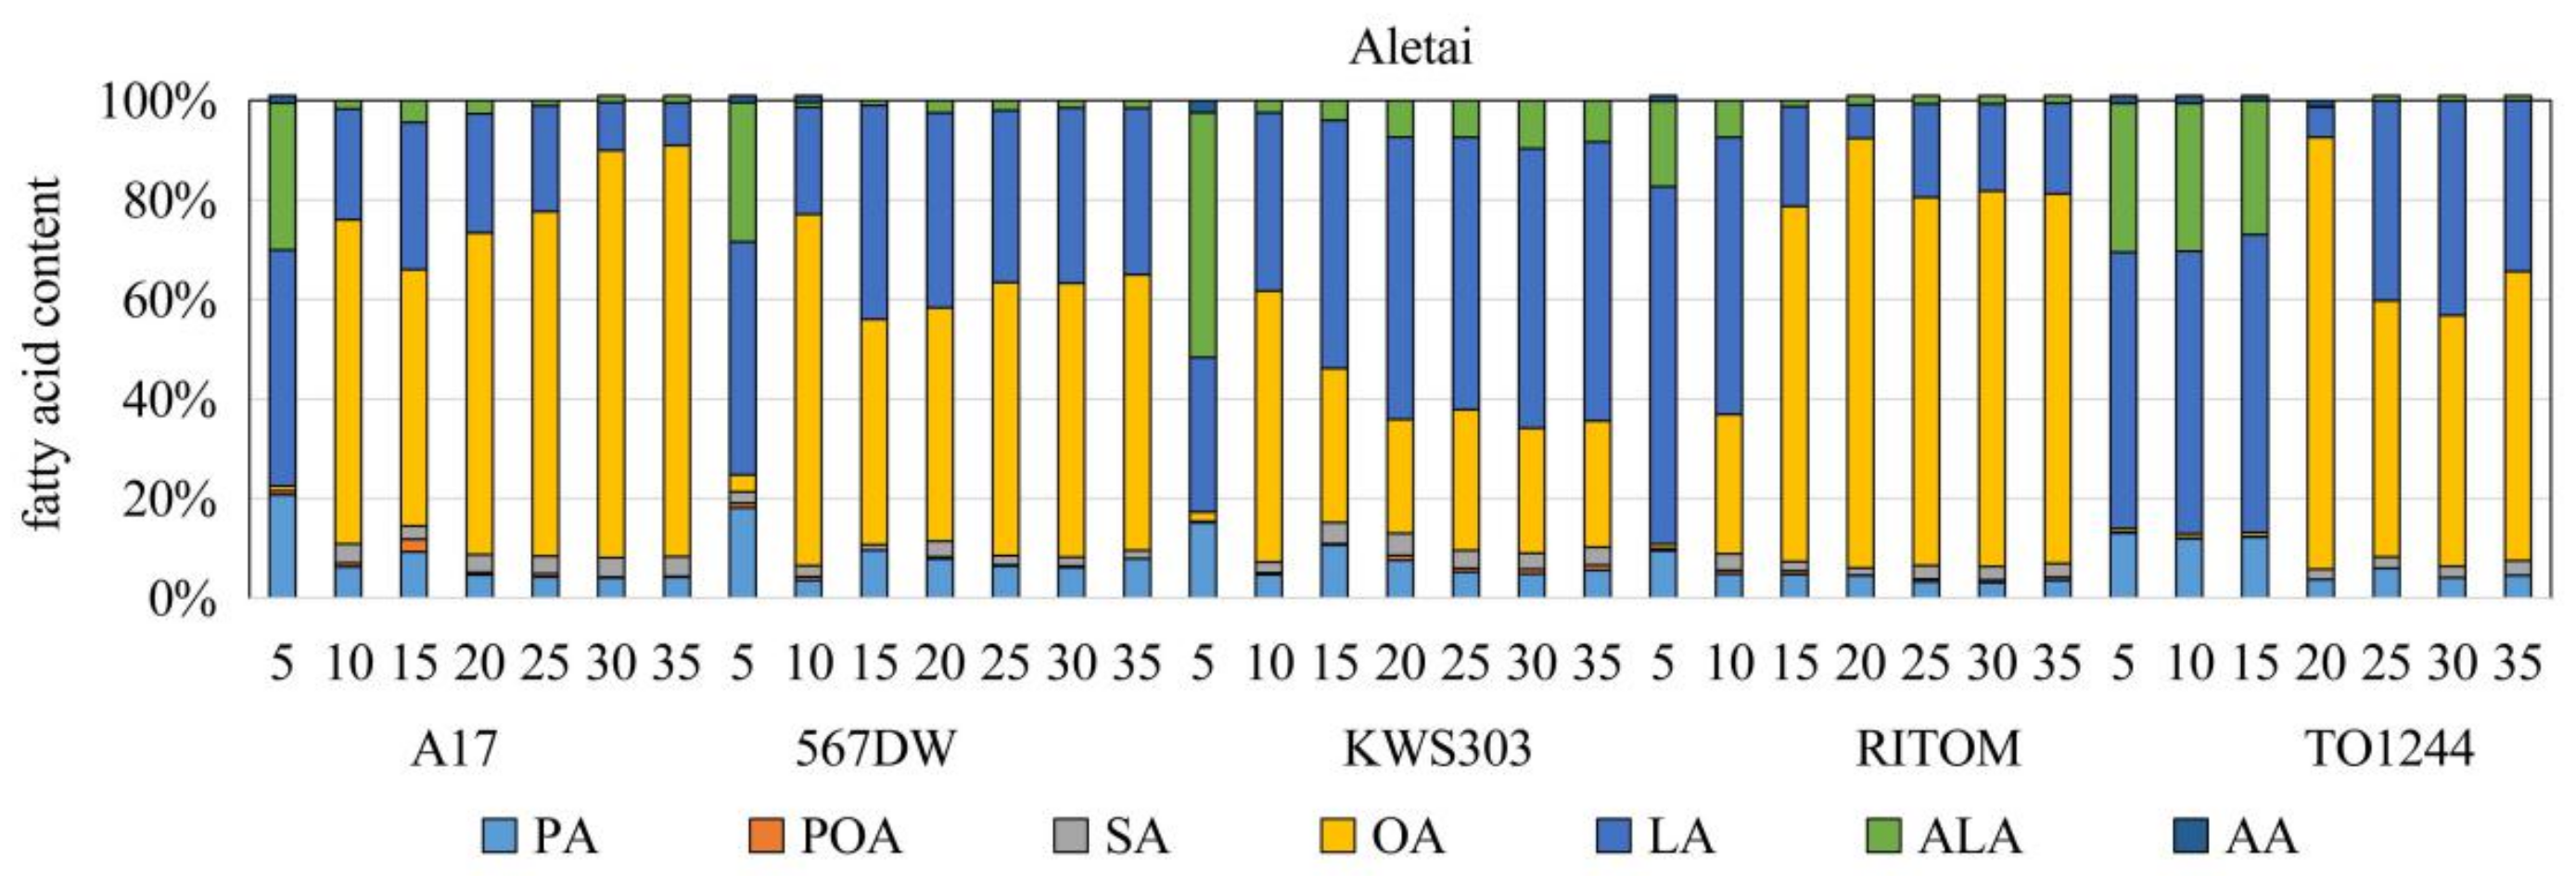
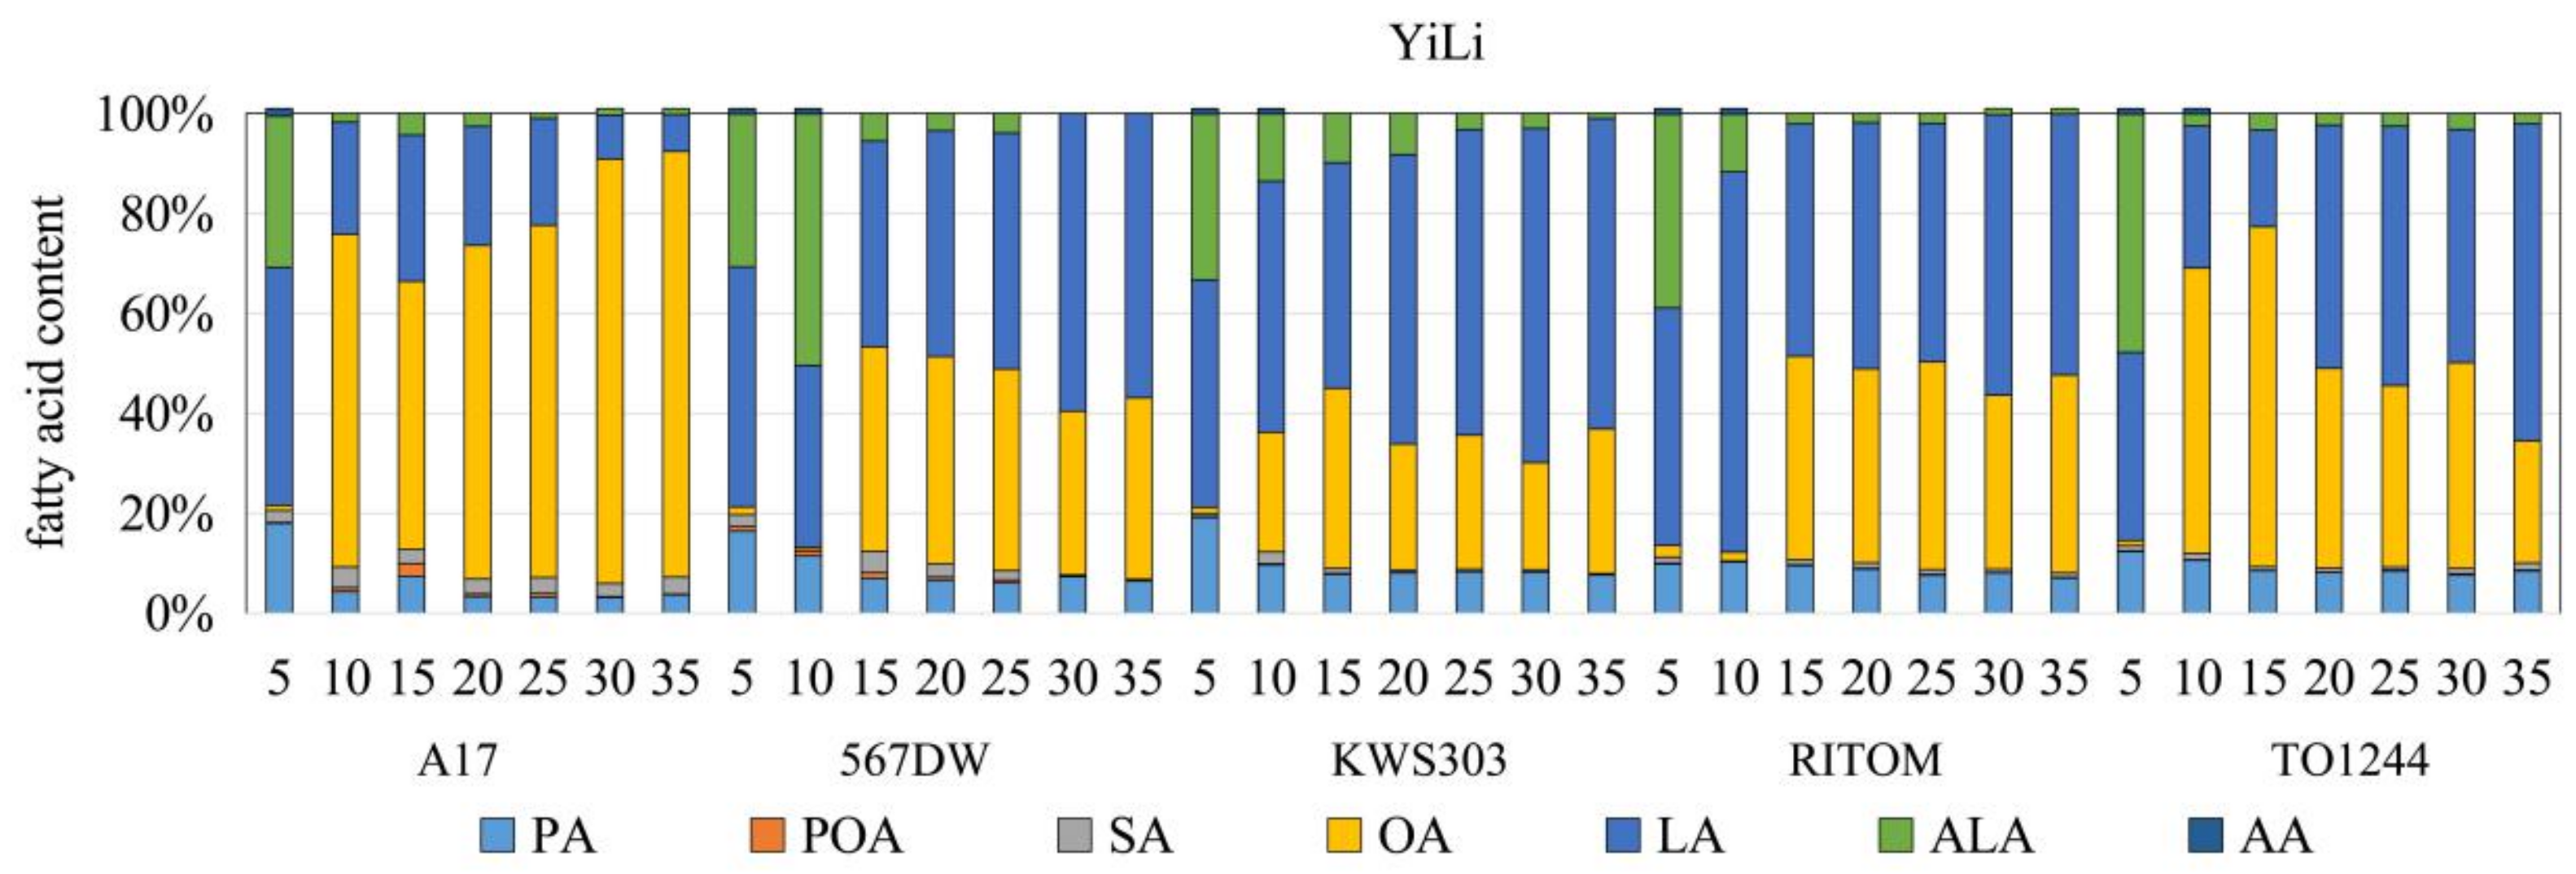
3.1. Analysis of the FA Composition and Contents

The contents of the FA components in the ten seed embryo samples of five sunflower varieties were determined over different stages (5, 10, 15, 20, 25, 30, and 35 d after flowering) at the three test sites, respectively (Figure 1, Figure 2 and Figure 3). As the results revealed, the UFA contents of five varieties all reached over 90% (Table S3). Among the UFAs, the content of OAs was the highest, followed by Las, and linolenic acid. This suggests that the OA synthesis predominated among the UFA synthesis pathways of seeds. According to the figures, the OA contents were extremely low at 5 d after flowering, and even undetected in individual cases. At 10 d after flowering, the OA contents of most varieties were heightened significantly, indicating that the OA synthesis might not begin until 5 d after flowering. It is of note that during this period, the contents of LAs presented a declining pattern, suggesting a higher rate of OA synthesis than the rate of the OA conversion to LAs. For the high OA varieties A17 and RITOM, their OA contents during 10–30 d after flowering increased progressively or maintained high levels. Comparatively, for common varieties, the OA contents increased rapidly in the earlier period, exhibited slower increases after 20 d, and even tended to decrease progressively in some cases. Moreover, the contents were all lower than the high OA varieties, suggesting that the high OA varieties probably maintained higher rates of OA synthesis in the later period.
PA, palmitic acids; POA, palmitic oleic acids; SA, stearic acids; OA, oleic acids; LA, linoleic acids; ALA, α-linolenic acids; AA, arachidic acids; the same below.

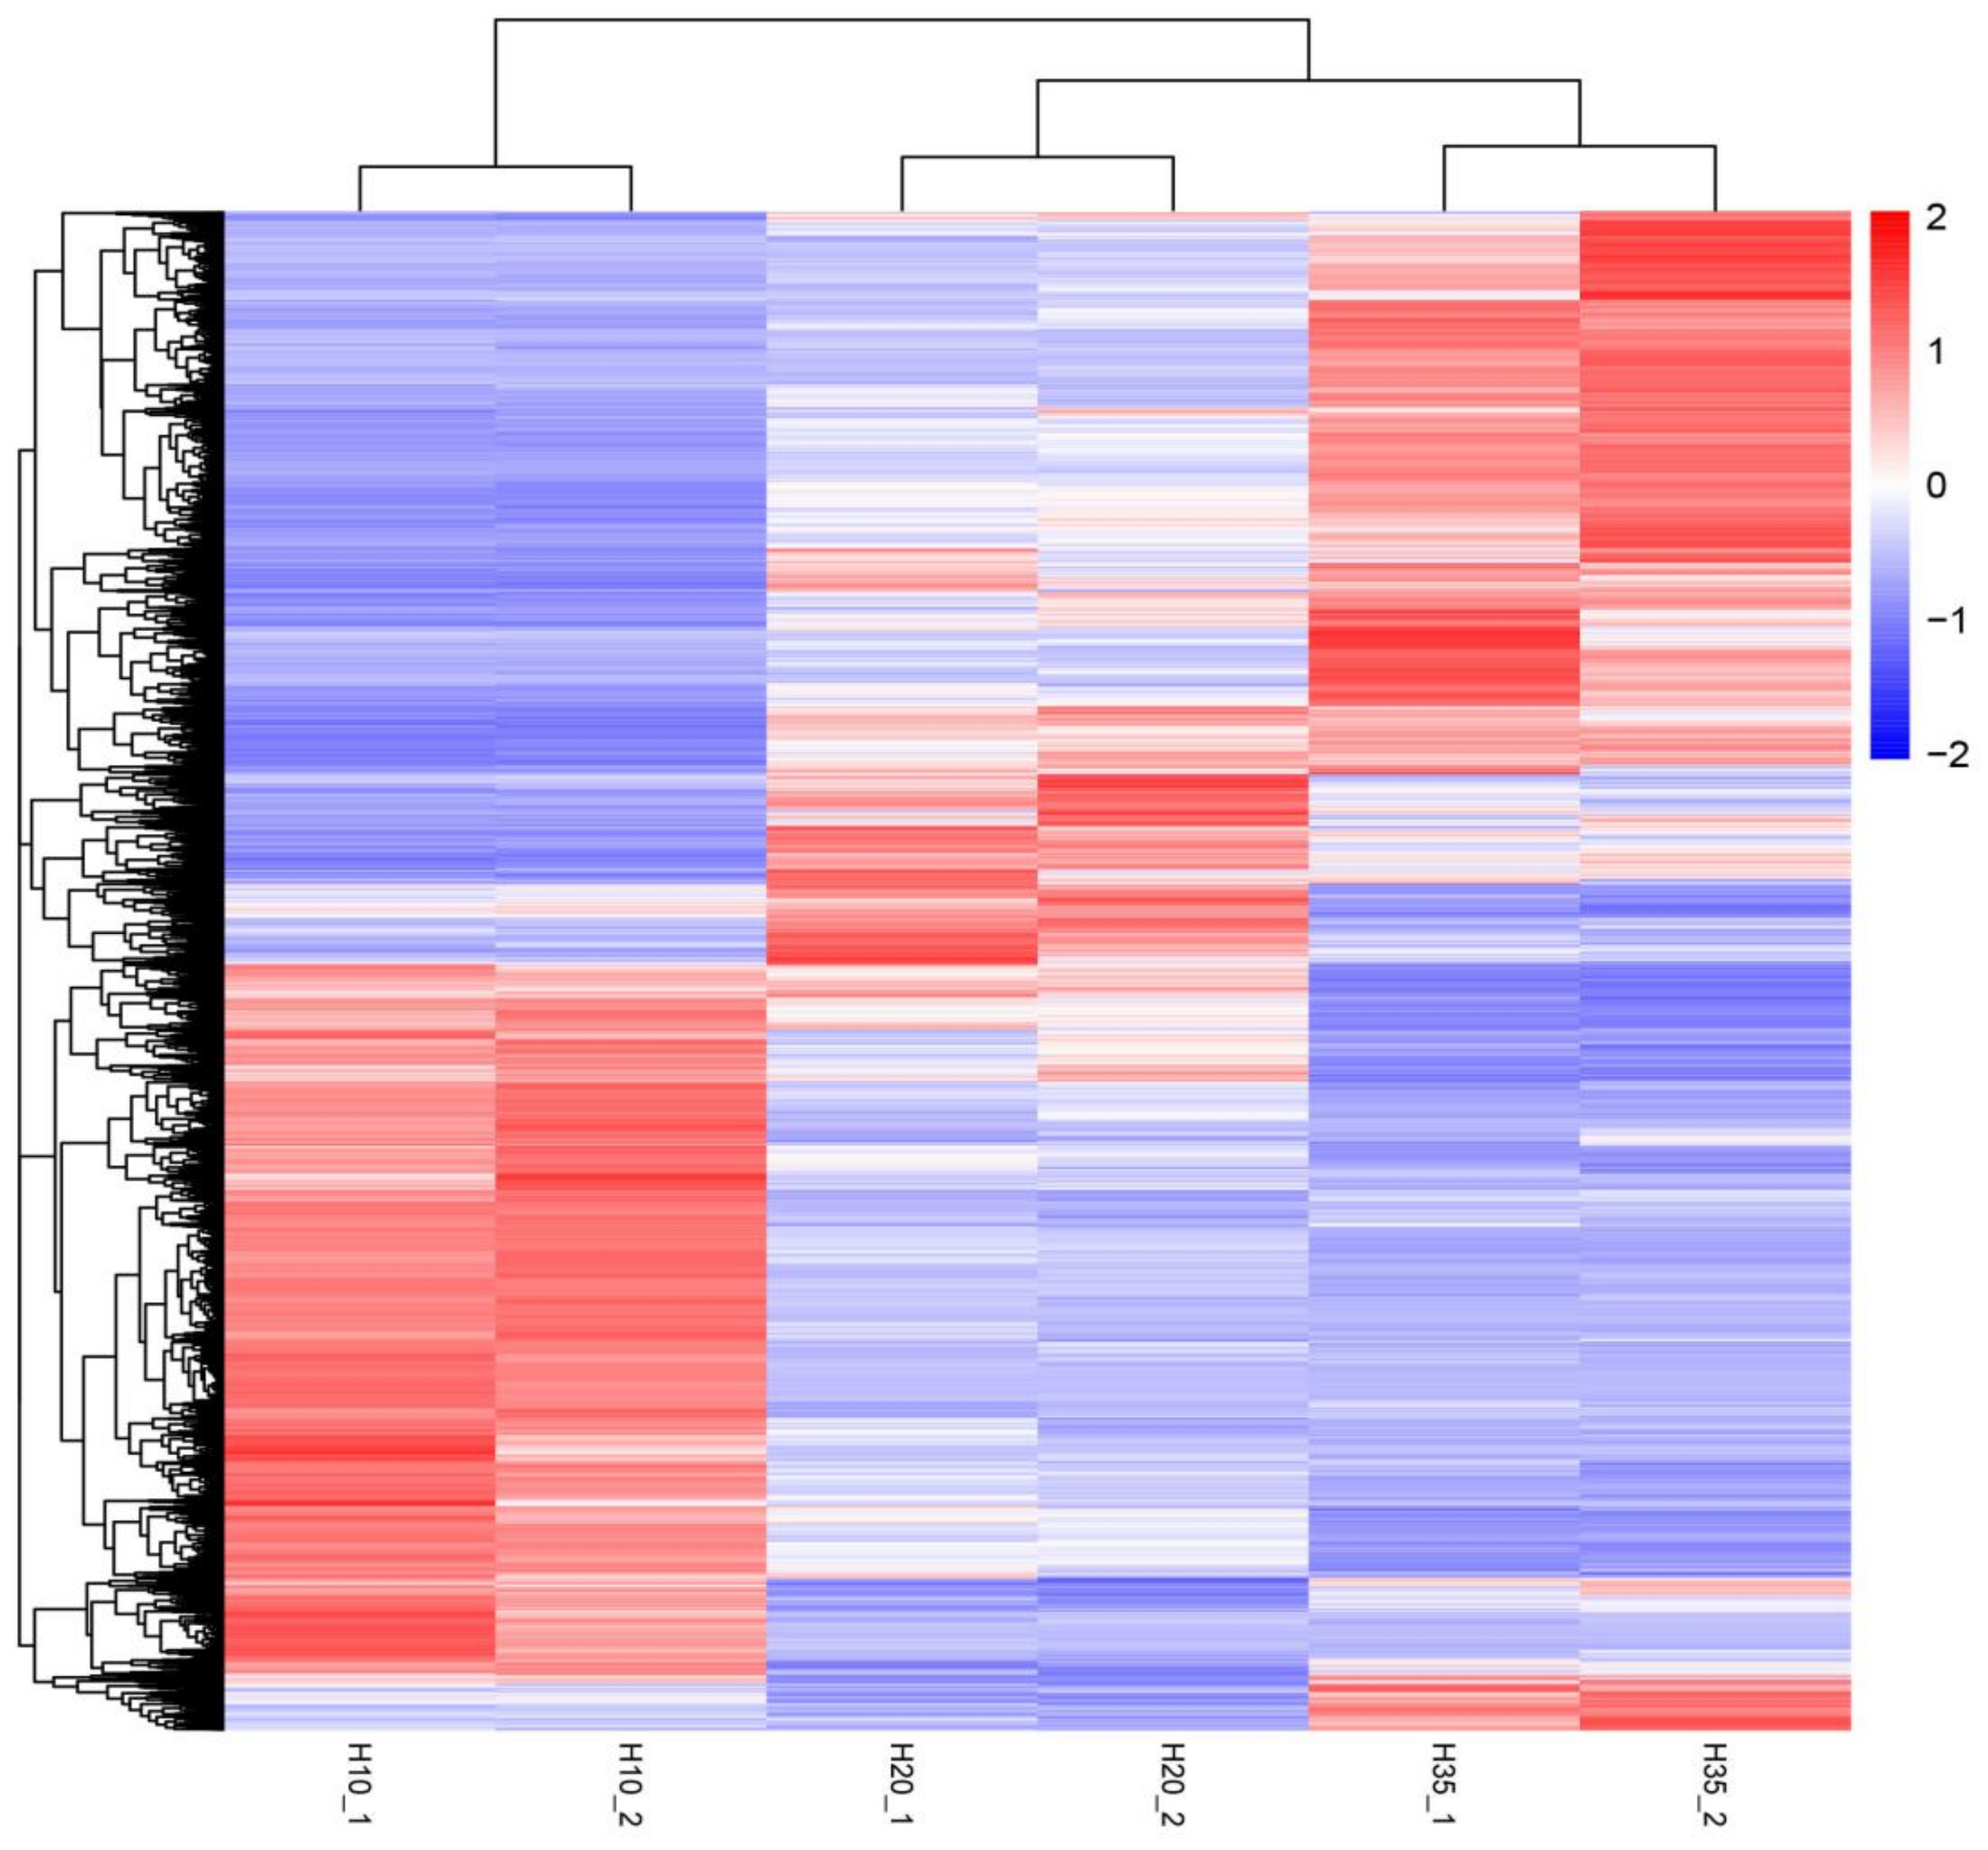
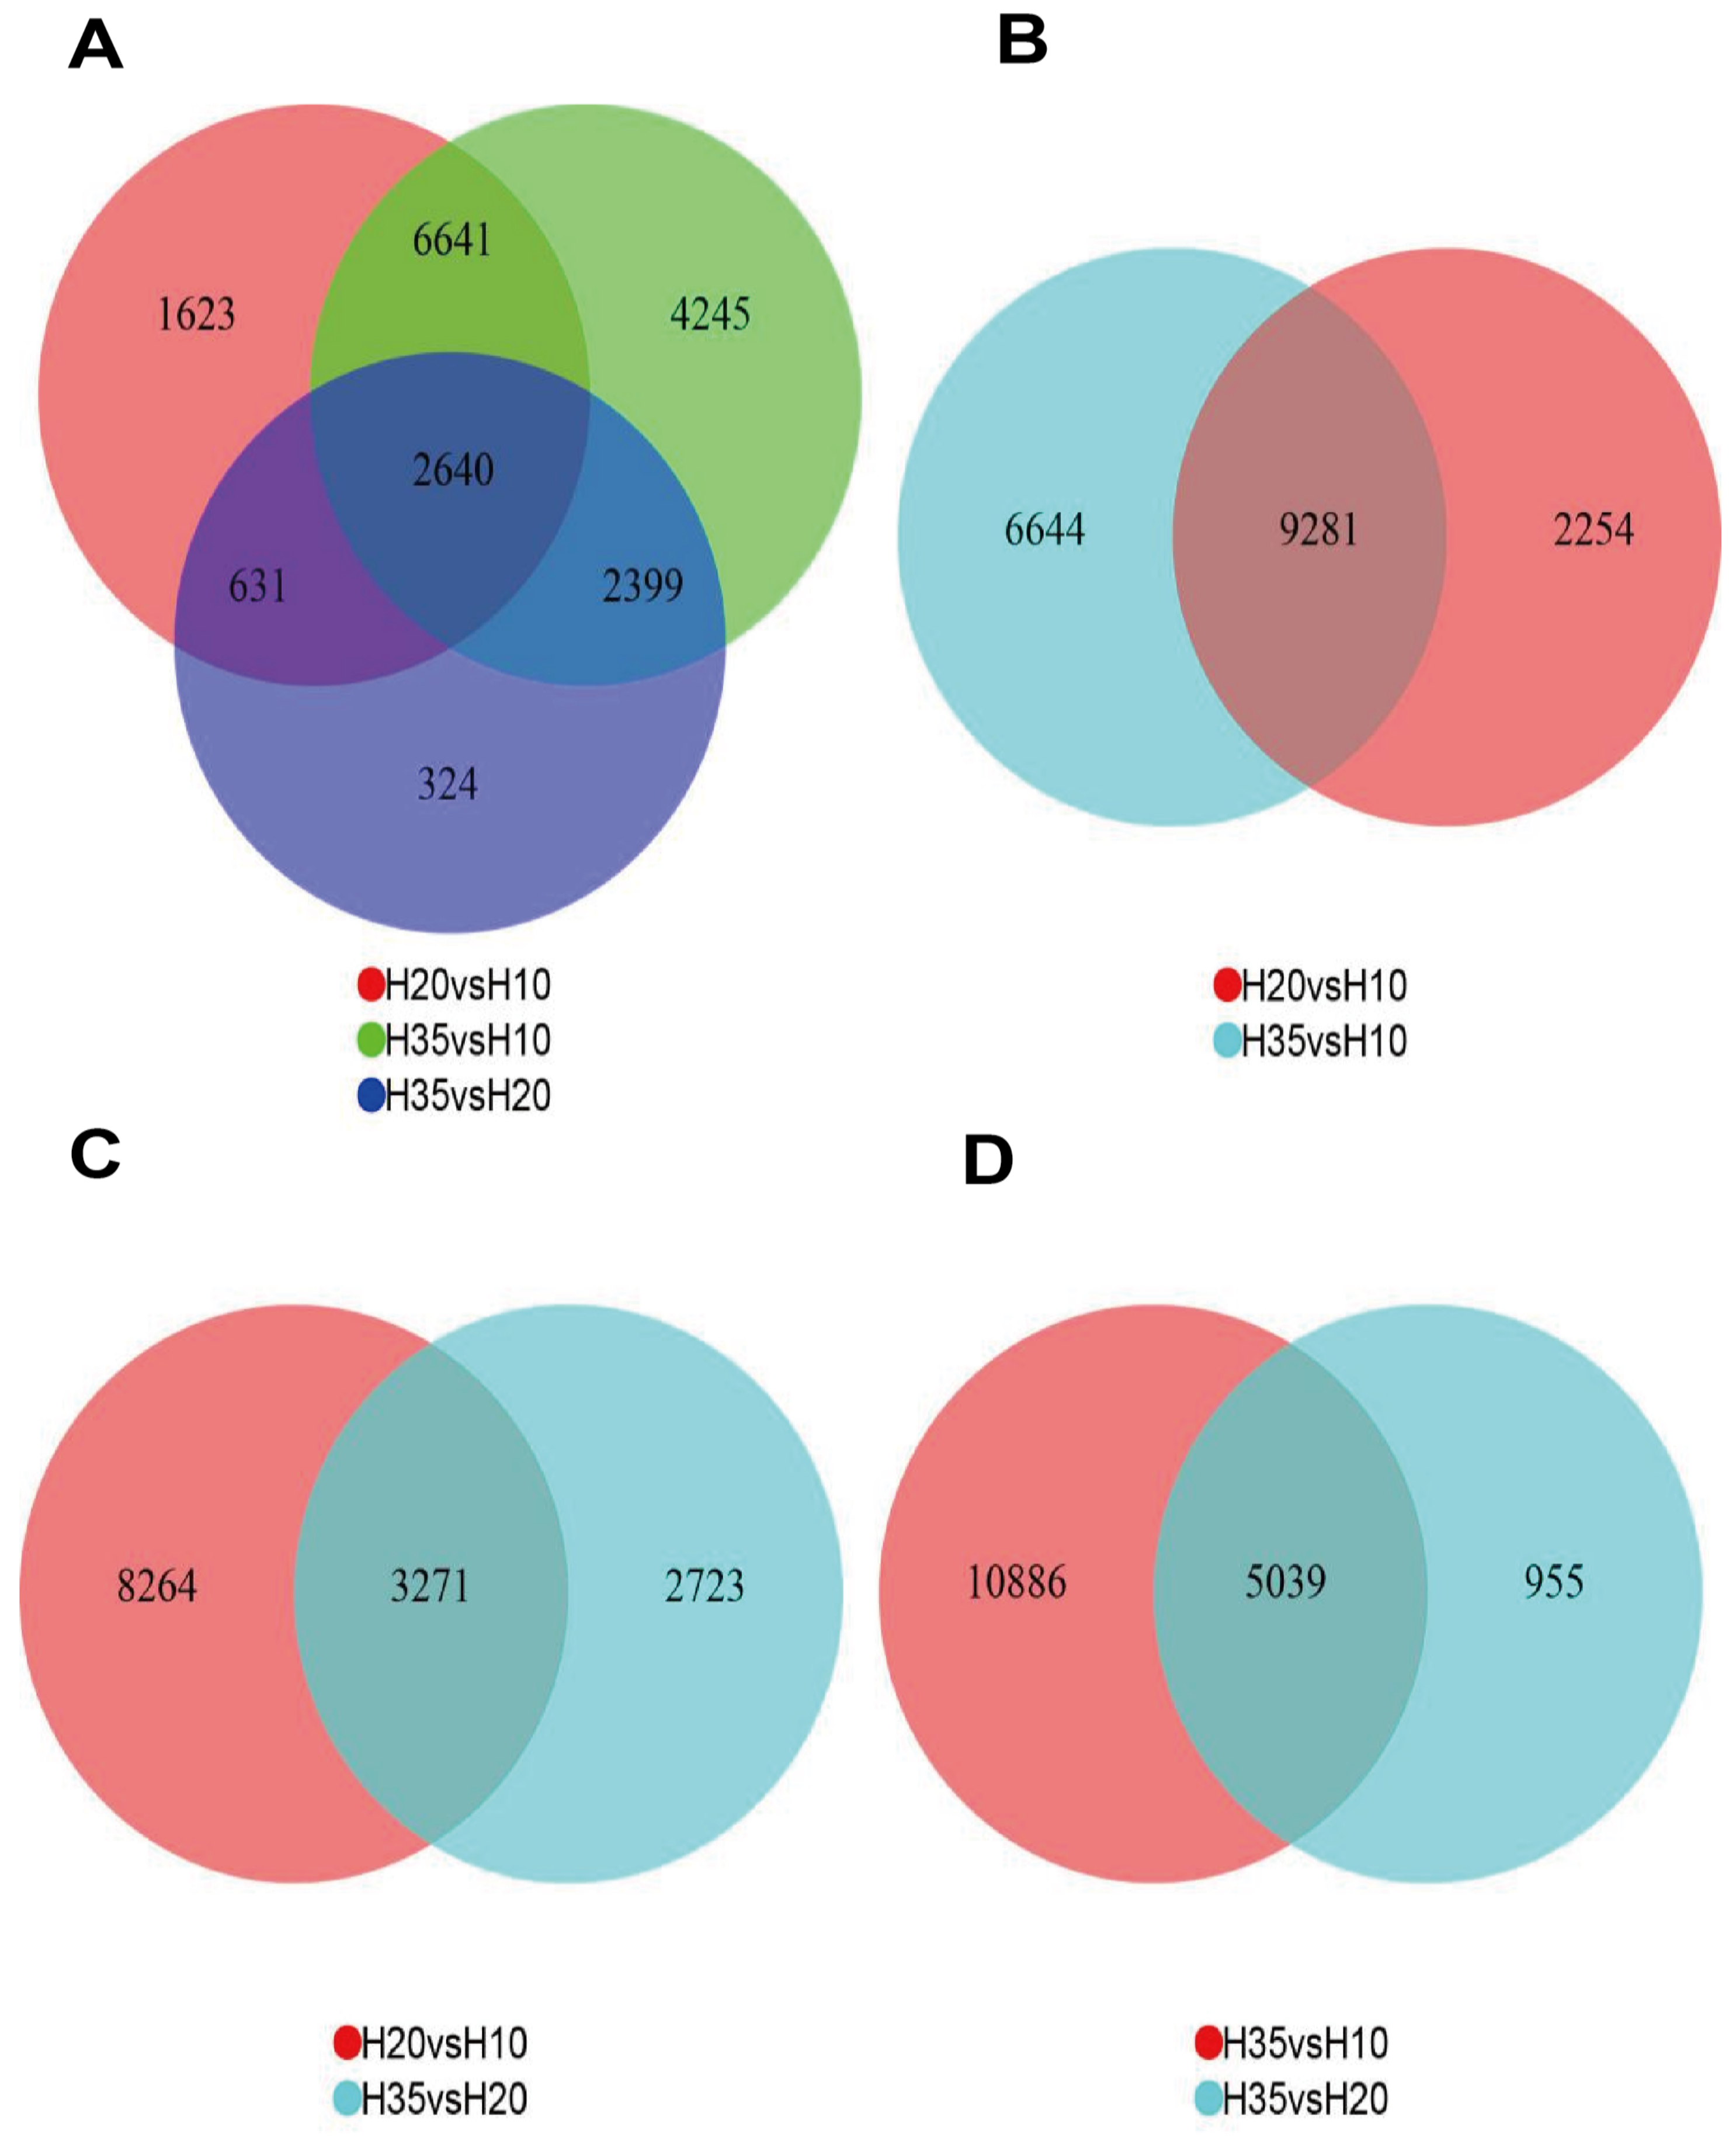
3.2. PCA and DEG Analysis at 10 d, 20 d and 35 d after Flowering

PCA reduces the complexity of the data by linear transformation and dimensional analysis, which allows for multidimensional data to be understood and visualized in a two-dimensional plane. The role in transcriptomes is to see if there are differences between sample groups, or the consistency of the samples. The PCA analysis clusters similar samples together, and the closer the distance, the higher the similarity between samples. When there is an outlier sample, the sample will deviate from the group, and the outlier can be removed as needed. We clustered the replicates by PCA, and the results showed that PC1 accounted for 54.18%, PC2 accounted for 43.87%, and there were no outlier samples, and their internal consistency was ranked from high to low as H10 > H20 > H35 (Figure S1).
Ten seed embryo samples at 10 d, 20 d, and 35 d post-flowering were used as experimental groups for transcriptome sequencing, denoted as H10, H20, and H35, respectively. The seed embryo differences between H10 and H20 can reflect the differences in the gene expression between the early and middle stages of seed embryo formation. Given the presence of biological replication of sequencing samples in this experiment, the criterion for screening DEGs was log2Foldchange > 0 and corrected at p < 0.05. According to the DEG screening results, a total of 11,535 DEGs were detected in H10 and H20. Among them, 6233 genes were highly expressed in H10 seed embryos, with the highest fold change in expression levels of 12.51 and the smallest fold change of 0.382. Meanwhile, 5302 genes were highly expressed in H20 seed embryos, with the highest fold change of 12.91 and the smallest fold change of 0.392 (Figure S2A).
The seed embryo differences between H10 and H35 can reflect the differences in gene expression between the early and late stages of seed embryo formation. According to the differential screening results, a total of 15,925 DEGs were detected in H10 and H35. Among them, 8211 genes were highly expressed in H10 seed embryos, with the highest fold change in expression levels of 12.19 and the smallest fold change of 0.39. Meanwhile, 7714 genes were highly expressed in H35 seed embryos, with the highest fold change of 15.41 and the smallest fold change of 0.37 (Figure S2B).
The seed embryo differences between H20 and H35 can reflect the differences in the gene expression between the middle and late stages of the seed embryo formation. According to the differential screening results, a total of 15,925 DEGs were detected in H20 and H35 after flowering. Among them, 2784 genes were highly expressed in H20 seed embryos, with the highest fold change in expression levels of 9.19 and the smallest fold change of 0.51. Meanwhile, 3210 genes were highly expressed in H35 seed embryos, with the highest fold change of 10.45 and the smallest fold change of 0.51 (Figure S2C).
The comparison was made on the transcriptomes of replicates H10_1, H10_2, H20_1, H20_2, H35_1, and H35_2, as shown in Figure 4. As the results revealed, the DEG expression trends between each two replicate groups were similar, indicating good repeatability of the groups, as well as the authenticity and reliability of the data. Among the different replicate groups, however, there were incredibly apparent differences in the gene expression. As can be observed from the heat map of DEGs, the number of up-regulated genes was the largest for H10, followed by H35, while it was the smallest for H20. The majority of genes in H20 were down-regulated, and H10 and H35 exhibited similar numbers of down-regulated genes. The actual presence of the differences in the gene expression between the three samples in different periods is the basis for further research into the differential genes.

3.3. Co-Expression of the DEGs and KEGG Enrichment Analysis of Common DEGs

Gene enrichment analysis is a method of studying functional changes by analyzing changes in gene profiles. The premise is that functionally related genes are assumed to be co-expressed (genes are associated with each other and no longer expressed randomly) and to jointly exercise function. Functional changes occur in the experimental group due to the presence of a set of genes that are co-expressed and do not conform to a hypergeometric distribution. Co-expressed analysis was performed on the DEGs. The results showed the coexistence of 2640 DEGs in the three datasets. The H35 vs. H10 dataset contained the highest number of specifically expressed genes at 4245. The H35 vs. H10, and H20 vs. H10 datasets had 9281 co-expressed genes, exhibiting the highest number of such genes among all dataset alignments. The H20 vs. H10 and H35 vs. H20 datasets presented 3271 co-expressed genes, while the H35 vs. H10 and H35 vs. H20 datasets presented 5039 co-expressed genes (Figure 5).
Various comparison groups were numbered (Table 1). KEGG and GO enrichment analyses were carried out on the temporally co-expressed genes in each comparison group, to understand the DEGs and metabolic pathways that were profoundly common among various groups, and to narrow the range of DEGs. The metabolism-related pathways enriched in g-w1 and g-w2 were up-regulated in the early period and down-regulated in the late period, suggesting that they are more active in the early period compared to the late period. However, the metabolism-related pathways enriched in g-w3 showed the opposite trend, which might be more active in the late period compared to the early period.
Gene enrichment analysis is a method for analyzing gene expression information. Relevant gene enrichment is the process of classifying genes according to a priori knowledge, i.e., genome annotation information. Once the genes are classified, it can help to know whether the genes found have certain aspects in common (function, composition, etc.). According to the enrichment results, the pathways significantly enriched in w1 involved ribosome, DNA replication, and TCA cycle; the metabolic pathways significantly enriched in w2 involved protein processing in the endoplasmic reticulum, amino acid biosynthesis, as well as carbon metabolism; and the metabolic pathways significantly enriched in w3 involved arginine biosynthesis, protein processing in the endoplasmic reticulum, and amino acid biosynthesis. In g-w1, the significantly enriched metabolic pathways were primarily ribosomal metabolic pathways. No significantly enriched metabolic pathways were found in g-w2 or g-w3. In w0, the significantly enriched metabolic pathways involved amino acid biosynthesis, carbon metabolism, protein processing in the endoplasmic reticulum, as well as arginine biosynthesis.
Enrichment of the UFA synthesis pathways was present in multiple experimental groups, and the enriched genes were rather consistent (Table 2). All of the experimental groups exhibited enrichment to the 110894736 (FAD2) gene. To further clarify the regulatory mechanism of the entire UFA biosynthesis pathway in sunflower oil, the genes other than FAD2, i.e., FAD3, FAD6, FAD7, and FAD8, were simultaneously subjected to qRT-PCR analysis.
The expression levels of DEGs in the UFA biosynthesis pathways were compared, which found the down-regulated expression of 110894736 in H20, as compared to H10, and in H35, as compared to H20. The latter showed a more drastic down-regulation than the former (Table 3).

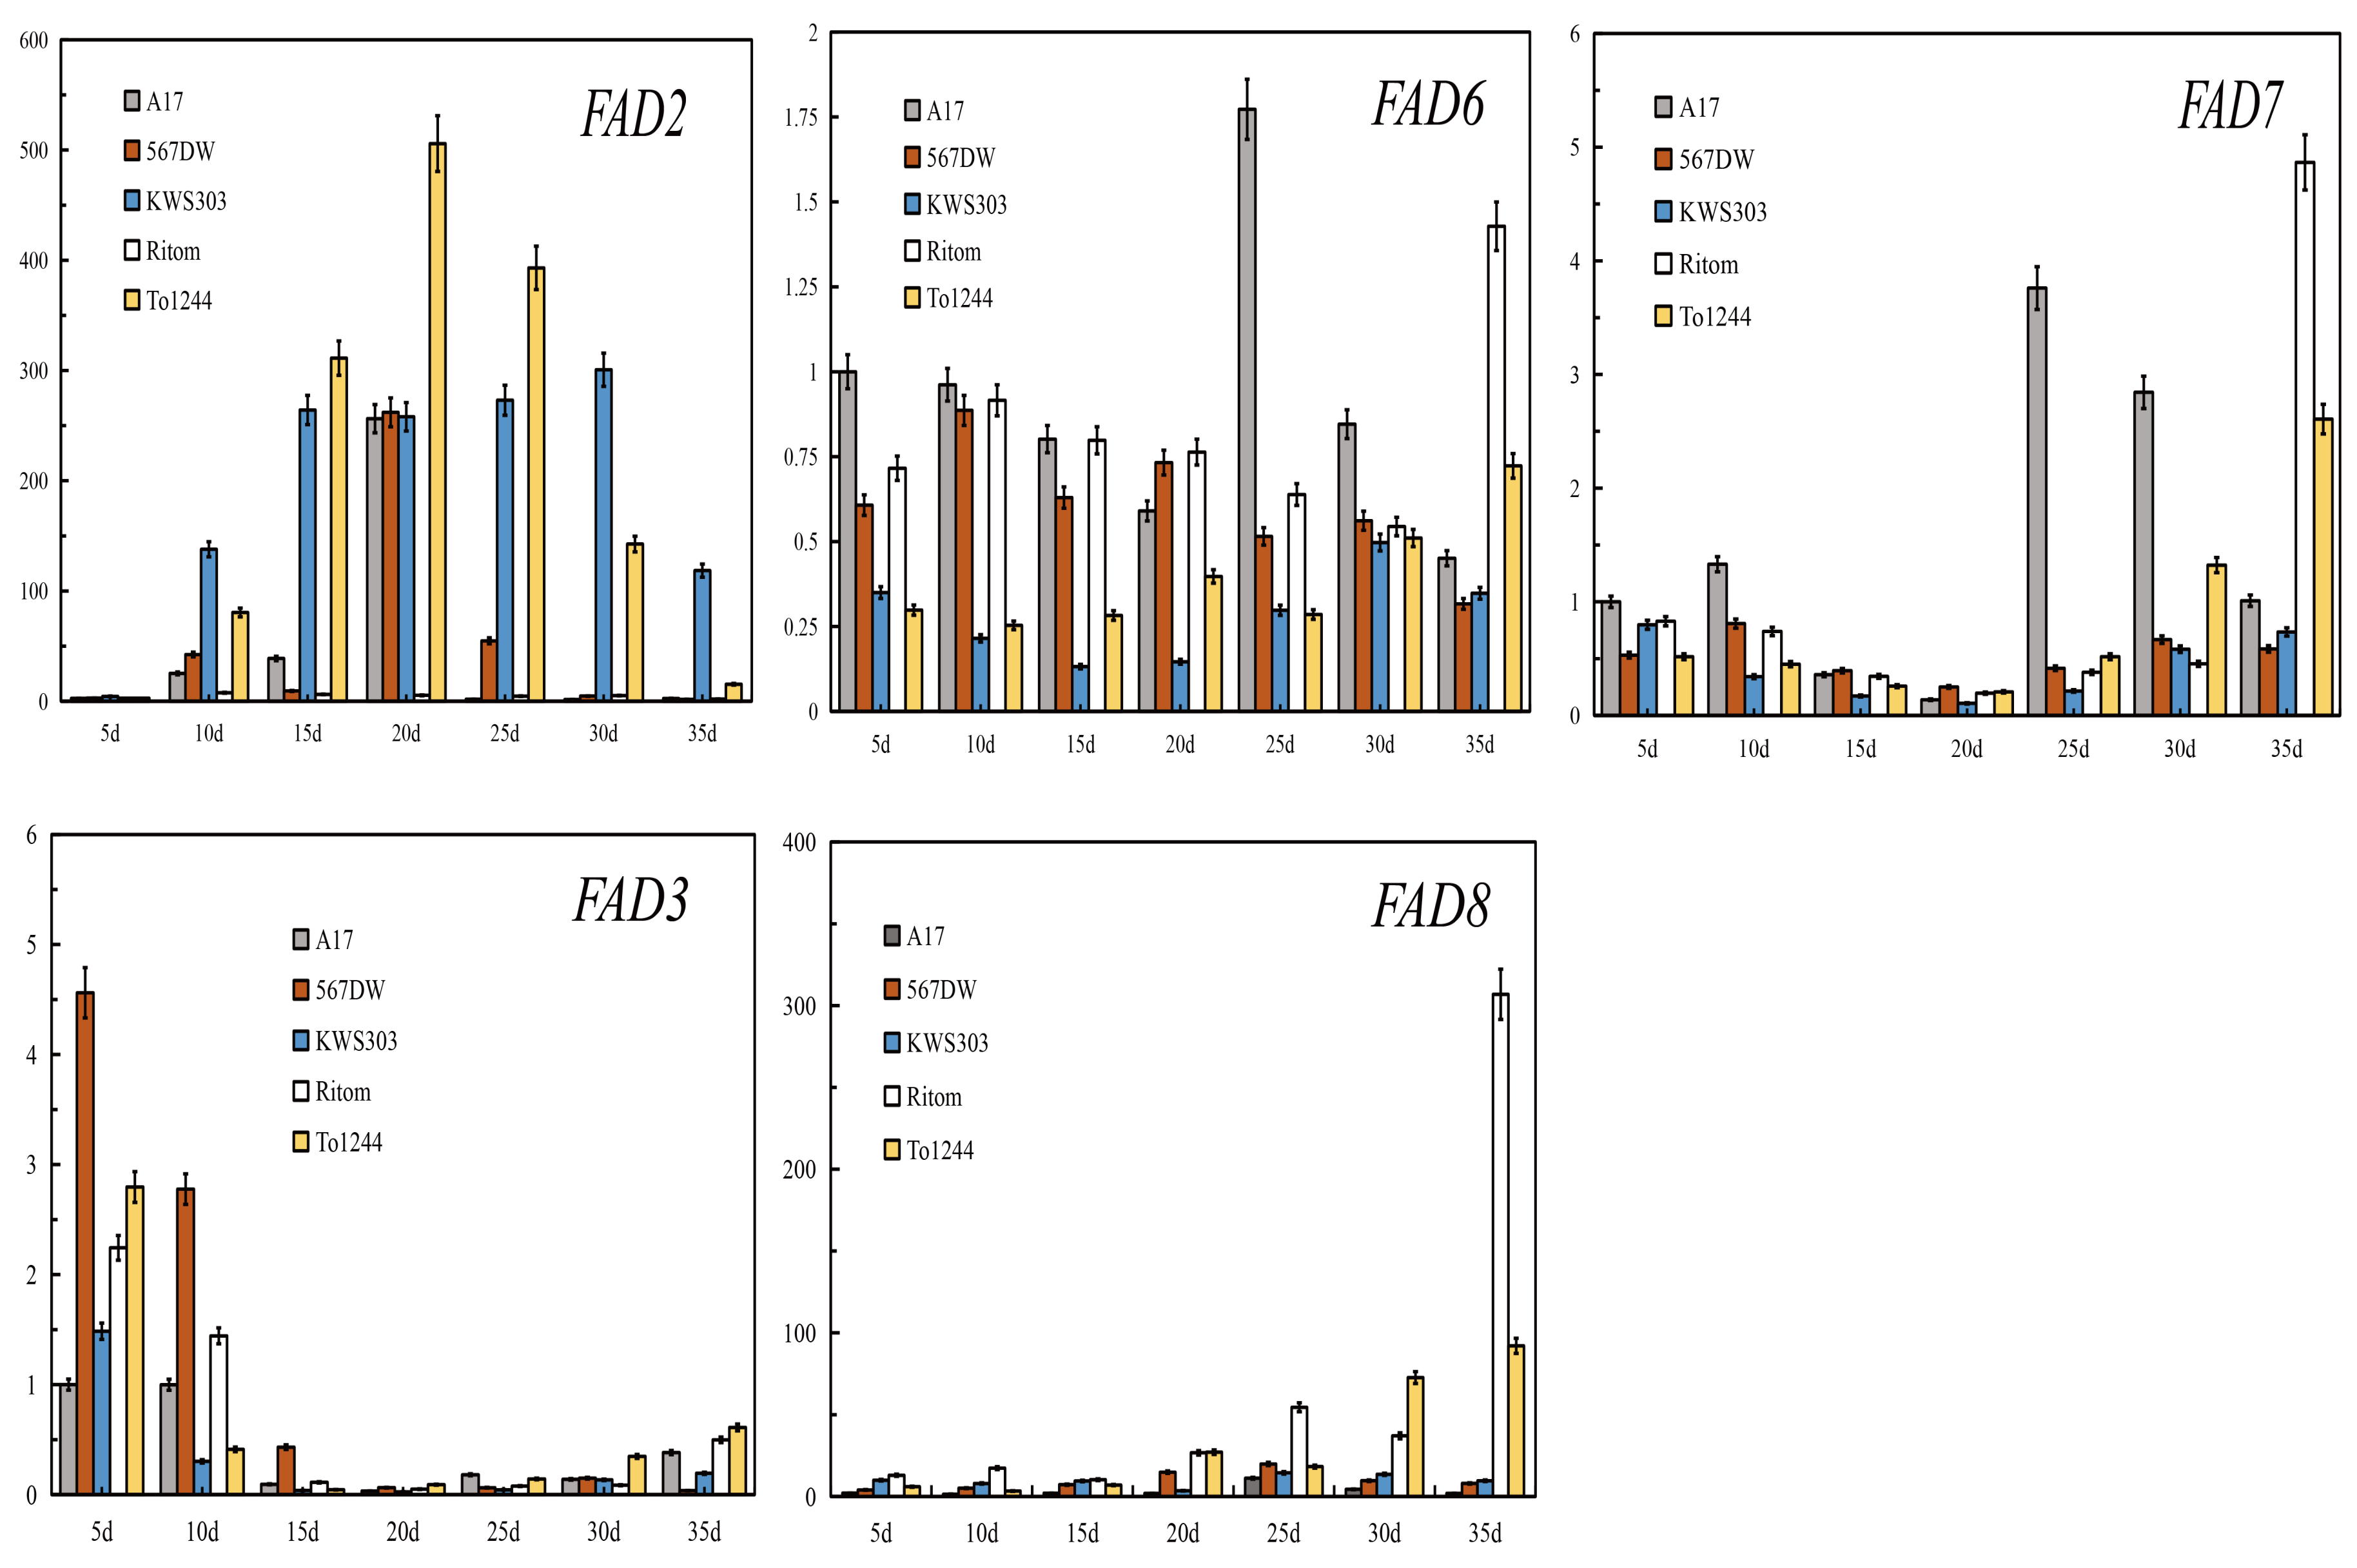
3.4. Expression Analysis of the Genes Related to the UFA Synthesis Pathways

To further explore the mechanism of UFA synthesis in samples (total RNA extracted from five seed embryos), five genes (FAD2, FAD3, FAD6, FAD7, and FAD8) in the UFA synthesis pathways were selected from the five sunflower varieties in the Urumqi site at seven stages (5, 10, 15, 20, 25, 30, and 35 d after flowering) for expression analysis (Figure 6). In terms of fold change, the expression levels of FAD2 and FAD8 genes varied widely, while the expression levels of FAD3, FAD6, and FAD7 genes varied narrowly. Regarding variation trend, in the course of seed development, the expression of the FAD2 gene tended to be higher in the middle stage and lower in the early development and maturity stages. For multiple varieties, the FAD2 expression reached the highest at 20 d. The majority of the FAD6 gene was down-regulated during the seed development period. The FAD7 expression did not change significantly before 20 d, but tended to increase gradually after 20–35 d for multiple varieties. The FAD3 expression was the highest at 5 d, which then decreased gradually.

3.5. Correlation Analysis between the UFA Synthesis Pathway Genes

To explore the relationship between the UFA synthesis genes, a correlation analysis was performed on the expression levels of the studied five genes over the seed development process. The FAD2 expression levels were significantly negatively correlated with the FAD6, FAD3, and FAD7 expression levels. The FAD6 expression levels were significantly positively correlated with the FAD7 and FAD8 expression levels. The FAD7 expression levels were significantly positively correlated with the FAD8 expression levels. This suggests that these genes have a close relationship with each other in regulating the FA synthesis (Table 4).

3.6. Correlation Analysis between the Expression Levels of the UFA Synthesis Genes and Final Contents of the FA Components

Correlation analysis was performed between the final contents of three major UFAs (OAs, LAs, and linolenic acid) and several UFA synthesis genes (Table 5). As the results demonstrated, the FAD2 expression was highly significantly negatively correlated with the final content of oleic acid during the UFA synthesis of seeds, while the FAD6 expression was just the opposite of FAD2. No significant correlation was noted between the expression level of the FAD3 gene and the final content of oleic acid. The expression levels of the FAD7 gene at five-time points (5, 10, 15, 25, and 35 d after flowering) were significantly or highly significantly positively correlated with the final oleic acid content, whereas the FAD8 expression at 5 d after flowering was significantly negatively correlated with the oleic acid content.
The FAD2 expression was positively correlated with the LA content, while the FAD6 expression was negatively correlated with the final LA content. Despite the insignificant correlation of the LA content with the FAD3 expression, it was significantly or highly significantly negatively correlated with the FAD7 expressions at the time points other than 20 and 30 d and was highly significantly positively correlated with the FAD8 expression 5 d after flowering.
The final LA content was significantly or highly significantly positively correlated with the 5, 10, and 15 d expression levels of FAD3; significantly negatively correlated with the 35 d expression level of FAD3; significantly negatively correlated with the 15 d expression level of FAD2; and significantly negatively correlated with the 30 and 35 d expression levels of FAD8.

4. Discussion

4.1. Accumulation Patterns of FAs and OAs at Different Stages of Seed Development

The FA composition changes at different stages of seed development. Initially, there are seven types of FAs, and in the middle stage of seed development, no arachidic acids (AAs) can be detected. When the seeds reach maturity, the majority of varieties exhibit almost zero contents of SAs. This shares a similarity with the accumulation pattern of FAs in rapeseed (Brassica napus), where the PAs and linolenic acids disappeared during the middle stage of seed development [42]. For oil crops, the FA contents and proportions of various acid components are important criteria for measuring their value as oils. It is of great significance to study the law of FA formation in oil crops, and the pattern of FA accumulation varies among oil crops. The accumulation patterns of total FAs in peanut (Arachis hypogaea L.) [43], camelina (Camelina sativa L.) [44], and Tartary buckwheat (Fagopyrum tataricum L. Gaertn) [45] tend to increase to the maximum first, and then decrease slightly.
According to the results of this study, the rate of the total FA synthesis is higher during the earlier period of sunflower seed formation, but is then significantly lower in the later period. This finding is similar to the accumulation pattern of FAs in the literature mentioned above. This phenomenon is attributed to the moisture loss in the later stage of seed maturation, so the nutritional transportation in the plants becomes difficult, which requires the consumption of partial oils [46,47]. Hence, it is necessary to harvest the seeds in advance appropriately after maturation. The reason why the sunflower oil content does not decline markedly is also related to the timely harvest. The OAs have high edible nutritional value, which is more stable than other UFAs. At present, high OA breeding is a hot topic in sunflower breeding. This study confirms that the OAs are synthesized faster in the earlier period of seed development than in the later period. As demonstrated by previous research, ambient temperature is significantly influential to the accumulation of OAs in seeds, with higher temperatures playing a more positive role in OA accumulation [48]. The distinct temperature drop in the later period of sunflower seed maturation is probably one of the reasons for the slowdown of OA accumulation in seeds. This study also finds a negative correlation between OA and LA contents during seed formation. According to the principal component analysis of OA factors, as the contents of PAs, LAs, linolenic acids, and AAs increase, the contents of SAs and OAs decrease accordingly. This finding suggests that an increase in OAs during the high OA breeding may result in high SAs. A more effective measure could be to elevate the OA content by lowering the PAs, LAs, linolenic acids, and AAs.

4.2. Transcriptional Expression of Key Genes during Oil Accumulation

During their formation, FAs are influenced by multiple genes and pathways. Studying FA biosynthesis at the molecular level allows for the mining of the key genes for UFA biosynthesis, thereby laying the foundation for improving the nutritional composition of oil crops utilizing plant genetic engineering [49,50].
The materials used in this study are the seed embryos of sunflowers at the filling stage after flowering. In the KEGG enrichment results, five metabolic pathways related to FA metabolism are enriched, namely FA biosynthesis, FA metabolism, FA degradation, FA extension, and UFA biosynthesis. The pathways enriched at 10 and 20 d after flowering are in turn, the FA biosynthesis, FA degradation, FA metabolism, FA extension, and UFA biosynthesis, while the pathways enriched at 20 and 35 d after flowering are in turn, the FA metabolism, UFA biosynthesis, FA biosynthesis, and FA degradation. The latter lacks the FA extension process, as compared to the former. Presumably, the process of the FA carbon chain extension in sunflower seeds may be concentrated in the earlier period of seed embryo formation. Compared to the latter, the UFA formation process comes later with the former. We speculate that the UFA desaturation of sunflower oil probably occurs mainly in the later period of seed embryo formation. In other words, during the development of sunflower seed embryos, C16:0, C18:0, C20:0, C22:0, and C24:0 are produced through the carbon chain extension of FAs first, after which C16:1, C18:1, C16:2, C18:2, etc., are produced through the action of desaturases.
Based on the metabolic pathway analysis, the key gene in this pathway is identified to be 110894736 (FAD2), which presents down-regulated expressions in both the earlier and later stages of seed embryo formation, with a more pronounced range of variation in the later stage. This further confirms the correctness of the enriched expression of the gene in g-w3 and w0.
Upon reaching the highest level at 5 d after flowering, the FAD3 expression declines in a gradual manner. This is similar to the expression pattern of FAD3 in tree peony (Paeonia section Moutan DC.), where the expression levels all decrease gradually with the maturation of seeds [51]. According to the analyses of the FA composition and contents in this study, the content of LAs decreases gradually as the seeds mature, which is considerably low in the ripe sunflower seeds. This also corroborates that FAD3 is the key gene for the further desaturation of LAs and the formation of linolenic acids.

4.3. Correlation of Key Genes during Oil Accumulation

The FAD2 expression is highly significantly negatively correlated with the expressions of FAD6, FAD3, and FAD7 genes. The FAD6 expression is highly significantly positively correlated with the expressions of FAD7 and FAD8 genes. It was found that FAD2 is the key enzyme gene that catalyzes the conversion of OAs to LAs, which is then converted to linolenic acid by FAD3. Thus, there is a negative correlation between the expression levels of FAD2 and FAD3 genes. Meanwhile, the significant negative correlation between FAD2 and FAD6 expressions may be attributed to the fact that the FAD6 gene is produced in plastids, and the weak expression of FAD6 in the seeds of various materials may be carried from the parents. The significant positive correlation of FAD6 expression with FAD7 and FAD8 expressions is probably attributed to the presence of all of these three genes in the plastids. From the gene expression perspective, however, the expression levels of FAD7 and FAD8 are rather high in the late seed maturation stage of RITOM and TO1244. Further research is needed to confirm whether this phenomenon is linked to the synthesis of UFAs.
Some findings identified two potential QTLs for OA and LA content through markers ORS 762 and HO_Fsp_b. These markers/QTLs explained more than 57.6–66.6% of the phenotypic variation and would be useful for the marker-assisted selection of breeding programs to improve oil quality [21]. Meanwhile, the researchers identified nine and 22 SNPs significantly associated with individual OA and LA content, respectively. for OA, these SNPs were located on chromosomes 9, 13, and 15, and for LA, these SNPs were located on chromosomes 3, 11, 12, 14, 15, and 17. Furthermore, a putative FAO1 gene (long-chain fatty alcohol oxidase gene) was identified on chromosome 9, which could be a candidate gene for OA abundance [22]. It has been confirmed that nine of the 46 oil genes in sunflower are highly differentiated between high- and low-oil lines, including FAD2-1, which has been shown to be under-selected during post-domestication. Another is HPPD, which has been found to co-localize with a QTL for the vitamin E precursor tocopherol, which may have been targeted by selection. The remaining seven genes are mainly localized to the biosynthetic pathways of diglycerides and LA. In particular, a member of the PAP2 superfamily was expressed mainly in seeds and co-localized with a QTL for the total oil content [23]. All previously described genes related to lipid metabolism in sunflower and SNPs in these genes may be strong candidates for further functional studies.
According to the findings of this study, the expression levels of the FAD2 gene at various seed development stages are significantly or highly significantly negatively correlated with the final content of OAs, and are significantly or highly significantly positively correlated with the final content of LAs. Existing studies have shown that the suppression of FAD2 expression by gene silencing or editing can promote the synthesis of MUFAs, and reduce the synthesis of polyunsaturated fatty acids (PUFAs) [52,53,54]. The conclusions of this study also confirm that FAD2 is the key enzyme gene for plant synthesis of polyunsaturated fatty acids. Despite the insignificant correlation of FAD3 expression with the final content of OAs or LAs, its expression levels at multiple stages are significantly or highly significantly positively correlated with the final content of linolenic acid. This further corroborates the crucial role of the FAD3 gene in the conversion of OAs to linolenic acid.

5. Conclusions

The present study showed that the synthesis rate of total FAs was higher in the early stage of sunflower seed formation, but it was significantly lower in the later stage. During seed formation, the contents of OAs and LAs were negatively correlated, and as the contents of PAs, LAs, linolenic acid, and AAs increased, the contents of SAs and OAs decreased accordingly. Meanwhile, the synthesis of OAs dominated the synthesis pathway of UFAs in seed embryos, and large amounts of DEGs were detected at different stages after flowering. During seed embryo synthesis, the expression level of FAD2 showed a highly significant negative correlation with the content of final OAs and a highly significant positive correlation with the content of final LAs. The FAD2 gene may be the key enzyme that catalyzes the conversion of OAs to LAs.

Supplementary Materials

The following supporting information can be downloaded at: https://www.mdpi.com/article/10.3390/agronomy13030885/s1, Figure S1. PCA of H10, H20, and H35 samples; Figure S2. DEG volcano plot of different groups after flowering. (A) H10 versus H20; (B) H10 versus H35; (C) H20 versus H35; Table S1. DEGs screened from different groups in the present study (H10 vs H20); Table S2. The primer sequences used in this study for qRT-PCR; Table S3. Detailed information on the UFA concentrations of the 5 species.

Author Contributions

Conceptualization, Z.L. and Q.H.; Methodology, L.X.; Software, L.Z.; Validation, Y.M.; Formal Analysis, W.L.; Investigation, W.L.; Resources, Y.M.; Data Curation, Q.H.; Writing—Original Draft Preparation, Q.H.; Writing—Review and Editing, Z.L.; Visualization, Q.H.; Supervision, L.X.; Project Administration, Q.H.; Funding Acquisition, L.Z. All authors have read and agreed to the published version of the manuscript.

Funding

This research was funded by the Open Fund of the Key Laboratory of Crop Pest Comprehensive Management of the Northwest Desert Oasis Ministry of Agriculture (KFJJ202005), the Special Fund Project for Central Guidance of Local Scientific and Technological Development (ZYYD2022C04), and the Subsidiary Subject of the Science and Technology Major Project of Xinjiang Uygur Autonomous Region, Collection of Oil Crop Germplasm Resources and Extraction of Excellent Genes (2022A03004-4).

Data Availability Statement

The transcriptome data have been uploaded to NCBI (https://www.ncbi.nlm.nih.gov/ accessed on 3 December 2022), and the accession numbers is PRJNA908723.

Conflicts of Interest

The authors declare no conflict of interest.

References

  1. Kane, N.C.; Burke, J.M.; Marek, L.; Seiler, G.; Vear, F.; Baute, G.; Knapp, S.J.; Vincourt, P.; Rieseberg, L.H. Sunflower genetic, genomic and ecological resources. Mol. Ecol. Resour. 2013, 13, 10–20. [Google Scholar] [CrossRef] [PubMed]
  2. Seiler, G.J.; Qi, L.L.; Marek, L.F. Utilization of sunflower crop wild relatives for cultivated sunflower improvement. Crop Sci. 2017, 57, 1083–1101. [Google Scholar] [CrossRef] [Green Version]
  3. Yu, S.; Zhang, Z.; Li, J.; Zhu, Y.; Yin, Y.; Zhang, X.; Dai, Y.; Zhang, A.; Li, C.; Zhu, Y.; et al. Genome-wide identification and characterization of lncRNAs in sunflower endosperm. BMC Plant Biol. 2022, 22, 494. [Google Scholar] [CrossRef] [PubMed]
  4. Rial, C.; Varela, R.M.; Molinillo, J.M.G.; Peralta, S.; Macías, F.A. Sunflower metabolites involved in resistance mechanisms against broomrape. Agronomy 2021, 11, 501. [Google Scholar] [CrossRef]
  5. Wu, Y.; Wang, Y.; Shi, H.; Hu, H.; Yi, L.; Hou, J. Time-course transcriptome and WGCNA analysis revealed the drought response mechanism of two sunflower inbred lines. PLoS ONE 2022, 17, e0265447. [Google Scholar] [CrossRef] [PubMed]
  6. Gogna, M.; Bhatla, S.C. Biochemical mechanisms regulating salt tolerance in sunflower. Plant Signal Behav. 2019, 14, 1670597. [Google Scholar] [CrossRef]
  7. Ferretti, C.A.; Spotti, M.L.; Di Cosimo, J.I. Diglyceride-rich oils from glycerolysis of edible vegetable oils. Catal. Today 2018, 302, 233–241. [Google Scholar] [CrossRef]
  8. Li, Z.; Dong, F.; Sun, Y.; Sun, Z.; Song, X.; Dong, Y.; Huang, X.; Zhong, J.; Zhang, R.; Wang, M.; et al. Qualitative and quantitative analysis of six fatty acid amides in 11 edible vegetable oils using liquid chromatography-mass spectrometry. Front. Nutr. 2022, 9, 857858. [Google Scholar] [CrossRef] [PubMed]
  9. Qiu, J.; Hou, H.-Y.; Huyen, N.T.; Yang, I.-S.; Chen, X.-B. Raman spectroscopy and 2DCOS analysis of unsaturated fatty acid in edible vegetable oils. Appl. Sci. 2019, 9, 2807. [Google Scholar] [CrossRef] [Green Version]
  10. Danov, S.M.; Kazantsev, O.A.; Esipovich, A.L.; Belousov, A.S.; Rogozhin, A.E.; Kanakov, E.A. Recent advances in the field of selective epoxidation of vegetable oils and their derivatives: A review and perspective. Catal. Sci. Technol. 2017, 7, 3659–3675. [Google Scholar] [CrossRef]
  11. Yang, R.; Zhang, L.; Li, P.; Yu, L.; Mao, J.; Wang, X.; Zhang, Q. A review of chemical composition and nutritional properties of minor vegetable oils in China. Trends Food Sci. Tech. 2018, 74, 26–32. [Google Scholar] [CrossRef]
  12. Hosni, T.; Abbes, Z.; Abaza, L.; Medimagh, S.; Ben Salah, H.; Kharrat, M.; Al-Farga, A. Biochemical characterization of seed oil of tunisian sunflower (Helianthus annuus L.) accessions with special reference to its fatty acid composition and oil content. J. Food Qual. 2022, 2022, 2875072. [Google Scholar] [CrossRef]
  13. Yelchuri, V.; Srikanth, K.; Prasad, R.B.N.; Karuna, M.S.L. Olefin metathesis of fatty acids and vegetable oils. J. Chem. Sci. 2019, 131, 39. [Google Scholar] [CrossRef] [Green Version]
  14. Czumaj, A.; Sledzinski, T. Biological role of unsaturated fatty acid desaturases in health and disease. Nutrients 2020, 12, 356. [Google Scholar] [CrossRef] [PubMed] [Green Version]
  15. Petermann, A.B.; Reyna-Jeldes, M.; Ortega, L.; Coddou, C.; Yevenes, G.E. Roles of the unsaturated fatty acid docosahexaenoic acid in the central nervous system: Molecular and cellular insights. Int. J. Mol. Sci. 2022, 23, 5390. [Google Scholar] [CrossRef]
  16. Akkaya, M.R. Prediction of fatty acid composition of sunflower seeds by near-infrared reflectance spectroscopy. J. Food Sci. Technol. 2018, 55, 2318–2325. [Google Scholar] [CrossRef] [PubMed]
  17. Dong, Z.; Olofsson, K.; Linares-Pasten, J.A.; Nordberg Karlsson, E. Investigation of structural features of two related lipases and the impact on fatty acid specificity in vegetable fats. Int. J. Mol. Sci. 2022, 23, 7072. [Google Scholar] [CrossRef] [PubMed]
  18. Zare, T.; Rupasinghe, T.W.T.; Boughton, B.A.; Roessner, U. The changes in the release level of polyunsaturated fatty acids (ω-3 and ω-6) and lipids in the untreated and water-soaked chia seed. Food Res. Int. 2019, 126, 108665. [Google Scholar] [CrossRef] [PubMed]
  19. Taipale, S.; Peltomaa, E.; Salmi, P. Variation in ω-3 and ω-6 polyunsaturated fatty acids produced by different phytoplankton taxa at early and late growth phase. Biomolecules 2020, 10, 559. [Google Scholar] [CrossRef] [Green Version]
  20. Gladyshev, M.I. Fatty Acids: Essential nutrients and important biomarkers. Biomolecules 2022, 12, 1250. [Google Scholar] [CrossRef]
  21. Premnath, A.; Narayana, M.; Ramakrishnan, C.; Kuppusamy, S.; Chockalingam, V. Mapping quantitative trait loci controlling oil content, oleic acid and linoleic acid content in sunflower (Helianthus annuus L.). Mol. Breed. 2016, 36, 106. [Google Scholar] [CrossRef]
  22. Chernova, A.I.; Gubaev, R.F.; Singh, A.; Sherbina, K.; Goryunova, S.V.; Martynova, E.U.; Goryunov, D.V.; Boldyrev, S.V.; Vanyushkina, A.A.; Anikanov, N.A.; et al. Genotyping and lipid profiling of 601 cultivated sunflower lines reveals novel genetic determinants of oil fatty acid content. BMC Genom. 2021, 22, 505. [Google Scholar] [CrossRef] [PubMed]
  23. Badouin, H.; Gouzy, J.; Grassa, C.J.; Murat, F.; Staton, S.E.; Cottret, L.; Lelandais-Brière, C.; Owens, G.L.; Carrère, S.; Mayjonade, B.; et al. The sunflower genome provides insights into oil metabolism, flowering and Asterid evolution. Nature 2017, 546, 148–152. [Google Scholar] [CrossRef] [Green Version]
  24. Jarecki, W. Effect of varying nitrogen and micronutrient fertilization on yield quantity and quality of sunflower (Helianthus annuus L.) achenes. Agronomy 2022, 12, 2352. [Google Scholar] [CrossRef]
  25. Nguyen, L.N.; Nosanchuk, J.D. The inhibitory effect of cerulenin to yeasts is fungicidal. Commun. Integr. Biol. 2011, 4, 631–632. [Google Scholar] [CrossRef] [PubMed]
  26. Lynch, J.H.; Roje, S. A higher plant FAD synthetase is fused to an inactivated FAD pyrophosphatase. J. Biol. Chem. 2022, 10, 2626. [Google Scholar] [CrossRef] [PubMed]
  27. An, J.U.; Lee, I.G.; Ko, Y.J.; Oh, D.K. Microbial synthesis of linoleate 9 S-lipoxygenase derived plant C18 oxylipins from C18 polyunsaturated fatty acids. J. Agric. Food Chem. 2019, 67, 3209–3219. [Google Scholar] [CrossRef]
  28. Hashempour, A.; Ghasemnezhad, M.; Sohani, M.M.; Ghazvini, R.F.; Abedi, A. Effects of freezing stress on the expression of fatty acid desaturase (FAD2, FAD6 and FAD7) and beta-glucosidase (BGLC) genes in tolerant and sensitive olive cultivars. Russ. J. Plant Physl. 2019, 66, 214–222. [Google Scholar] [CrossRef]
  29. Ben Ayed, R.; Chirmade, T.; Hanana, M.; Khamassi, K.; Ercisli, S.; Choudhary, R.; Kadoo, N.; Karunakaran, R. Comparative analysis and structural modeling of Elaeis oleifera FAD2, a fatty acid desaturase involved in unsaturated fatty acid composition of american oil palm. Biology 2022, 11, 529. [Google Scholar] [CrossRef] [PubMed]
  30. Wen, S.; Liu, H.; Li, X.; Chen, X.; Hong, Y.; Li, H.; Lu, Q.; Liang, X. TALEN-mediated targeted mutagenesis of fatty acid desaturase 2 (FAD2) in peanut (Arachis hypogaea L.) promotes the accumulation of oleic acid. Plant Mol. Biol. 2018, 97, 177–185. [Google Scholar] [CrossRef] [PubMed]
  31. Banilas, G.; Moressis, A.; Nikoloudakis, N.; Hatzopoulos, P. Spatial and temporal expressions of two distinct oleate desaturases from olive (Olea europaea L.). Plant Sci. 2005, 168, 547–555. [Google Scholar] [CrossRef]
  32. Salimonti, A.; Carbone, F.; Romano, E.; Pellegrino, M.; Benincasa, C.; Micali, S.; Tondelli, A.; Conforti, F.L.; Perri, E.; Ienco, A.; et al. Association study of the 5′UTR intron of the FAD2-2 gene with oleic and linoleic acid content in Olea europaea L. Front. Plant Sci. 2020, 11, 66. [Google Scholar] [CrossRef] [Green Version]
  33. Liu, S.; Wang, W.; Li, M.; Wan, S.; Sui, N. Antioxidants and unsaturated fatty acids are involved in salt tolerance in peanut. Acta Physiol. Plant. 2017, 39, 207. [Google Scholar] [CrossRef]
  34. Chen, Y.; Tian, L.; Wan, L.; Xia, J.; Liu, F.; Zhao, R.; Wang, T.; Han, C. The cold resistance of cottonseed during germination is related to the content of unsaturated fatty acids. Crop Sci. 2021, 61, 3598–3609. [Google Scholar] [CrossRef]
  35. Sui, N.; Wang, Y.; Liu, S.; Yang, Z.; Wang, F.; Wan, S. Transcriptomic and physiological evidence for the relationship between unsaturated fatty acid and salt stress in peanut. Front. Plant Sci. 2018, 9, 7. [Google Scholar] [CrossRef] [PubMed] [Green Version]
  36. Unamba, C.I.; Nag, A.; Sharma, R.K. Next generation sequencing technologies: The doorway to the unexplored genomics of non-model plants. Front. Plant Sci. 2015, 6, 1074. [Google Scholar] [CrossRef] [Green Version]
  37. Dimitrijevic, A.; Horn, R. Sunflower hybrid breeding: From markers to genomic selection. Front. Plant Sci. 2017, 8, 2238. [Google Scholar] [CrossRef] [Green Version]
  38. Guo, S.; Zuo, Y.; Zhang, Y.; Wu, C.; Su, W.; Jin, W.; Yu, H.; An, Y.; Li, Q. Large-scale transcriptome comparison of sunflower genes responsive to Verticillium dahliae. BMC Genom. 2017, 18, 42. [Google Scholar] [CrossRef] [PubMed] [Green Version]
  39. Wang, P.; Ma, L.; Li, Y.; Wang, S.a.; Li, L.; Yang, R. Transcriptome analysis reveals sunflower cytochrome P450 CYP93A1 responses to high salinity treatment at the seedling stage. Genes Genom. 2017, 39, 581–591. [Google Scholar] [CrossRef]
  40. Sarazin, V.; Duclercq, J.; Guillot, X.; Sangwan, B.; Sangwan, R.S. Water-stressed sunflower transcriptome analysis revealed important molecular markers involved in drought stress response and tolerance. Environ. Exp. Bot. 2017, 142, 45–53. [Google Scholar] [CrossRef]
  41. Wu, Y.; Shi, H.; Yu, H.; Ma, Y.; Hu, H.; Han, Z.; Zhang, Y.; Zhen, Z.; Yi, L.; Hou, J. Combined GWAS and transcriptome analyses provide new insights into the response mechanisms of sunflower against drought stress. Front. Plant Sci. 2022, 13, 847435. [Google Scholar] [CrossRef] [PubMed]
  42. Roche, J.; Mouloungui, Z.; Cerny, M.; Merah, O. Fatty acid and phytosterol accumulation during seed development in three oilseed species. Int. J. Food Sci. Technol. 2016, 51, 1820–1826. [Google Scholar] [CrossRef] [Green Version]
  43. Seo, S.H.; Jo, S.M.; Kim, J.; Lee, M.; Lee, Y.; Kang, I. Peanut sprout extracts attenuate triglyceride accumulation by promoting mitochondrial fatty acid oxidation in adipocytes. Int. J. Mol. Sci. 2019, 20, 1216. [Google Scholar] [CrossRef] [Green Version]
  44. Yu, X.H.; Cahoon, R.E.; Horn, P.J.; Shi, H.; Prakash, R.R.; Cai, Y.; Hearney, M.; Chapman, K.D.; Cahoon, E.B.; Schwender, J.; et al. Identification of bottlenecks in the accumulation of cyclic fatty acids in camelina seed oil. Plant Biotechnol. J. 2018, 16, 926–938. [Google Scholar] [CrossRef] [PubMed] [Green Version]
  45. Lv, Q.; Wang, J.; Sun, P.; Cai, F.; Ran, B.; Deng, J.; Shi, T.; Chen, Q.; Li, H. Evaluation of the composition and accumulation pattern of fatty acids in tartary buckwheat seed at the germplasm level. Agronomy 2022, 12, 2447. [Google Scholar] [CrossRef]
  46. Azarkovich, M.I. Dehydrins in orthodox and recalcitrant seeds. Russ. J. Plant Physl. 2020, 67, 221–230. [Google Scholar] [CrossRef]
  47. Abdul Rahman, S.M.; Ellis, R.H. Seed quality in rice is most sensitive to drought and high temperature in early seed development. Seed Sci. Res. 2019, 29, 238–249. [Google Scholar] [CrossRef] [Green Version]
  48. Abou Chehade, L.; Angelini, L.G.; Tavarini, S. Genotype and seasonal variation affect yield and oil quality of safflower (Carthamus tinctorius L.) under mediterranean conditions. Agronomy 2022, 12, 122. [Google Scholar] [CrossRef]
  49. He, M.; Qin, C.X.; Wang, X.; Ding, N.Z. Plant unsaturated fatty acids: Biosynthesis and regulation. Front. Plant Sci. 2020, 11, 390. [Google Scholar] [CrossRef] [PubMed] [Green Version]
  50. Liao, B.; Hao, Y.; Lu, J.; Bai, H.; Guan, L.; Zhang, T. Transcriptomic analysis of Perilla frutescens seed to insight into the biosynthesis and metabolic of unsaturated fatty acids. BMC Genom. 2018, 19, 213. [Google Scholar] [CrossRef] [Green Version]
  51. Zhang, Q.Y.; Yu, R.; Xie, L.H.; Rahman, M.M.; Kilaru, A.; Niu, L.X.; Zhang, Y.L. Fatty acid and associated gene expression analyses of three tree peony species reveal key genes for α-linolenic acid synthesis in seeds. Front. Plant Sci. 2018, 9, 106. [Google Scholar] [CrossRef] [PubMed] [Green Version]
  52. Lee, K.-R.; Kim, E.-H.; Roh, K.H.; Kim, J.-B.; Kang, H.-C.; Go, Y.S.; Suh, M.C.; Kim, H.U. High-oleic oilseed rapes developed with seed-specific suppression of FAD2 gene expression. Appl. Biol. Chem. 2016, 59, 669–676. [Google Scholar] [CrossRef]
  53. Yuan, M.; Zhu, J.; Gong, L.; He, L.; Lee, C.; Han, S.; Chen, C.; He, G. Mutagenesis of FAD2 genes in peanut with CRISPR/Cas9 based gene editing. BMC Biotechnol. 2019, 19, 24. [Google Scholar] [CrossRef] [PubMed]
  54. Xue, Y.; Zhang, X.; Wang, R.; Chen, B.; Jiang, J.; Win, A.N.; Chai, Y. Cloning and expression of Perilla frutescens FAD2 gene and polymorphism analysis among cultivars. Acta Physiol. Plant. 2017, 39, 84. [Google Scholar] [CrossRef]
Figure 1. Changes in the FA composition during the seed development in Urumqi.
Agronomy 13 00885 g001
Figure 2. Changes in the FA composition during seed development in Aletai region.
Agronomy 13 00885 g002
Figure 3. Changes in the FA composition during seed development in Yili region.
Agronomy 13 00885 g003
Figure 4. Cluster analysis of DEGs. The clustering uses the clustering package pheatmap in R. The data targeted are the concatenated sets of differential genes, and the expression level value of genes log10 (FPKM + 1) value is used for clustering. It uses the corresponding distance algorithm to calculate the distance between each gene, and then calculates the relative distance between genes by repeated iterations, and finally divides the genes into different subclusters according to their relative distances, so as to achieve hierarchical clustering. The heatmap clusters genes with similar expression patterns, which may share common functions or participate in common metabolic pathways and signaling pathways. Red indicates high expression, and blue indicates low expression.
Agronomy 13 00885 g004
Figure 5. Venn diagrams of DEGs. (A) H20 versus H10, H35 versus H10, and H35 versus H20; (B) H20 versus H10 and H35 versus H10; (C) H20 versus H10 and H35 versus H20; (D) H35 versus H10 and H35 versus H20.
Agronomy 13 00885 g005
Figure 6. The expression analysis of FAD2, FAD3, FAD6, FAD7, and FAD8.
Agronomy 13 00885 g006
Table 1. Group numbering for the enrichment analysis of co-expressed DEGs.
No.Experimental Groups
W1H20vsH10-H35vsH10
W2H20vsH10-H35vsH20
W3H35vsH10-H35vsH20
g-W1G- H20vsH10-H35vsH10
g-W2G- H20vsH10-H35vsH20
g-W3G- H35vsH10-H35vsH20
W0H20vsH10-H35vsH10- H35vsH20
Table 2. Related genes enriched in the UFA synthesis pathways.
Experimental GroupUFA Enrichment RankingRelated Enriched Gene
w1104 110894736
w269 110894736
w334 110894736
g-w321 110894736
w064110894736
Table 3. Trends of DEG expression in the UFA synthesis pathways.
IDH10_1H10_2H20_1H20_2log2FoldChangeExpression Trend
110894736269.4909340.185287.9888293.85980.067055Down-regulated
IDH20_1H20_2H35_1H35_2log2FoldChangeExpression trend
110894736200.6852205.9760.99599936.670405Down-regulated
Table 4. Correlation coefficients of the UFA synthesis genes during seed development.
FAD2
(LOC110894736)
FAD6
(LOC110886589)
FAD3
(LOC110872089)
FAD7
(LOC110885030)
FAD8
(LOC110868972)
FAD2 (LOC110894736)1.000
FAD6 (LOC110886589)−0.463 **1.000
FAD3 (LOC110872089)−0.347 **0.1181.000
FAD7 (LOC110885030)−0.354 **0.704 **0.0061.000
FAD8 (LOC110868972)−0.1240.348 **−0.0840.678 **1.000
Note: ** significant at the 0.01 level of probability.
Table 5. Correlation coefficients between the expression level of the UFA synthesis genes and the final content of the FA components.
FAsGene5 d10 d15 d20 d25 d30 d35 d
OAFAD2 (LOC110894736)−0.693 **−0.888 **−0.667 **−0.539 **−0.709 **−0.781 **−0.704 **
FAD6 (LOC110886589) 0.782 **0.692 **0.879 **0.702 *0.694 **0.587 *0.617 *
FAD3 (LOC110872089)−0.2970.172−0.084−0.1060.409−0.3430.447
FAD7 (LOC110885030)0.533 **0.721 **0.628 *0.0810.567 *0.4320.567 *
FAD8 (LOC110868972)−0.901 *0.269−0.3180.1540.498−0.0550.475
LAFAD2 (LOC110894736)0.689 *0.899 **0.709 **0.557 *0.753 **0.802 **0.706 *
FAD6 (LOC110886589) −0.823 **−0.716 **−0.903 **−0.720 **−0.725 **−0.618 *−0.575 *
FAD3 (LOC110872089)0.284−0.2160.0370.1410.3980.3840.387
FAD7 (LOC110885030)−0.548 *−0.758 **−0.660 **−0.08−0.592 *−0.444−0.518 *
FAD8 (LOC110868972)0.909 **−0.2480.344−0.107−0.4740.117−0.427
ALAFAD2 (LOC110894736)0.056−0.094−0.534 *−0.200−0.470−0.260−0.054
FAD6 (LOC110886589) 0.3190.2800.2140.3130.0500.0750.536
FAD3 (LOC110872089)0.556 *0.800 **0.884 **−0.210−0.382−0.454−0.917 **
FAD7 (LOC110885030)−0.160.2410.4520.291−0.041−0.180−0.597
FAD8 (LOC110868972)0.009−0.168−0.070−0.377−0.205−0.684 **−0.539 *
Note: * significant at the 0.05 level of probability, ** significant at the 0.01 level of probability.
Disclaimer/Publisher’s Note: The statements, opinions and data contained in all publications are solely those of the individual author(s) and contributor(s) and not of MDPI and/or the editor(s). MDPI and/or the editor(s) disclaim responsibility for any injury to people or property resulting from any ideas, methods, instructions or products referred to in the content.

