Article

National Modern Agricultural Industrial Parks: Development Characteristics, Regional Differences, and Experience Inspiration—Case Study of 200 NMAIPs in China

Institute of Agricultural Economics and Development, Chinese Academy of Agricultural Sciences (CAAS), Beijing 100081, China
*
Author to whom correspondence should be addressed.
Agronomy 2023, 13(3), 653; https://doi.org/10.3390/agronomy13030653
Submission received: 9 January 2023 / Revised: 16 February 2023 / Accepted: 20 February 2023 / Published: 24 February 2023
(This article belongs to the Topic Novel Studies in Agricultural Economics and Sustainable Farm Management)
(This article belongs to the Section Farming Sustainability)

Abstract

:
Agricultural industries are the foundation of the modernization of agricultural and rural areas in China. National Modern Agricultural Industrial Parks (NMAIPs) provides a considerable nationwide platform for agricultural industries. We take 200 NMAIPs in China as objects. Through spatial analysis, the Herfindahl–Hirschman index, and the SBM-DEA model, we analyzed the development characteristics and regional differences of NMAIPs from the muti-level perspective of national planning, provincial coordination, and county implementation to propose policy recommendations aimed at sustainable and high-quality development. The results are as follows: (1) Regarding geospatial characteristics, NMAIPs are unevenly distributed, with a decreasing gradient from east to west. The direction is east (northward) to west (southward), consistent with the direction of the Hu line. The distribution density shows that the east is dense and the west is sparse. (2) For industrial concentration, the leading industries in NMAIPs tend to be homogenous. The HHI indicates that the homogenization of leading industries is widely represented in each province. The low oligopolistic areas are in the central and eastern regions of China, while the highly oligopolistic locations are in the western and northeastern provinces. (3) In inputs–outputs efficiency, the comprehensive technical efficiency is high but not optimal, while the distribution of values is high in the south and low in the north. Ten provinces are non-effective. According to inputs and outputs, the ineffective contribution of population of townships covered, occupied area and the capital from the collective economy are development barriers, and the high output value of NMAIPs cannot fully drive the employment and income of farmers. Further improvements are needed in terms of both pure technical efficiency and scale efficiency, and adjustments to scale operations should be in response to different returns to scale. Our research results provide policy recommendations for NMAIPs, including the establishment of a multi-level management mechanism, balancing regional development, diversifying and coordinating regional leading industries, and improving the efficiency of utilization factors.

1. Introduction

The modernization of agricultural and rural areas is a crucial part of the Chinese path to modernization. To realize this target, China has taken the revitalization of agricultural industries as a key initiative, vigorously implementing a rural revitalization strategy [1]. As the main aspect of rural revitalization, agricultural industries serve as a foundation for the sustained growth of initiatives for the modernization of agricultural and rural areas, ensuring the smooth operation of the national economy and social stability [2]. The agriculture industries are now experiencing a number of increasingly prominent problems, such as the outflow of supply factors, insufficient resource development, unbalanced structure, and low scale of output value, severely needing further construction and development [3,4].
As the modernization of agricultural and rural areas requires optimizing the structure of the product industry and improving the quality and efficiency of agriculture, the modern agricultural industrial park was first proposed by the Chinese authorities in a No.1 central document in 2017. It is defined as an agricultural-industry-led park based on large-scale breeding bases and driven by industrialized leading enterprises, gathering modern production factors and integrating the vertical extension of industrial chains and horizontal expansion between industries. The park’s premise is that farmers fully participate in and benefit from it. Supporting leading industrialization, gathering input factors, and incorporating the industrial chain, it forms a multifaceted and cutting-edge national platform for the development of agriculture [5]. It aims to promote the maximum aggregation, integration, and development of agricultural industries [6]. Until now, China has established a four-level linkage system for modern agricultural industrial parks at the national, provincial, municipal, and county levels, forming a basic pattern to demonstrate and lead regional developments in agricultural and rural areas [7].
Certified by the nation, National Modern Agricultural Industrial Parks (NMAIPs) are considerable support and demonstration platforms nationwide for the construction and development of agricultural industries. Considering a new batch per year, there have now been six years of development with its own system, operation, and scale. Regarding the linkage mechanism, NMAIPs are agroindustry-oriented parks to operate large-scale planting, breeding, and processing within demonstration platforms, promoting capital, employment, improvements in technology, and other modern factors to realize the integration of the whole industrial chain of “production + processing + technology” [6]. In terms of operation and regulation, the Ministry of Agriculture and Finance collaborates with the provincial and county governments to administrate and manage NMAIPs in accordance with a top-down management system, nation, province, and county. The national government is the leader, the provincial government coordinates, and county-level party governments implement regulatory monitoring. The specific regulatory implementation units are 153 management committees or 110 service centers with investment and development operating agencies. In terms of the scale of development, by 2021, the Chinese government had arranged a total of RMB 13.1 billion in central financial subsidies to support the establishment of 200 NMAIPs (of which 130 were recognized) in 31 provinces, which had in turn sparked the growth of more than 7000 such agricultural parks in various provinces, cities, and counties [7].
NMAIPs are a kind of agricultural Park (AP). APs are an important element of metropolitan agriculture as sustainable solutions to a wide range of environmental and socio-economic problems facing the agrifood sector [8,9]. They are primarily utilized in developed countries, including the Netherlands, Spain, Italy, and the USA, and they are being further promoted in Asian countries, especially China. The concepts of APs vary in different countries [9]. By drawing on the development experience of APs in other countries, APs in China consider the country’s unique condition and complement Chinese modernization.
APs utilize and adjust the local agricultural production conditions, realizing an agglomeration of factors and creating innovative agricultural function forms. However, APs in China develop their functionality and effectiveness on the basis of more-developed countries. APs serve a wide range of functions in China. Based on APs in the Netherlands for instance, Chinese Aps exemplify the fundamental content of the synergistic collaboration between the upstream and downstream supply chains, resulting in the agglomeration and intensive utilization of agricultural factors and resources [10]. APs in China maintain a focus on the multifunctional characteristics of agriculture, including technology, ecology, industrial integration, etc., in response to varied agricultural functions [11]. Additionally, differently from others around the world, Chinese APs provide conditions for agricultural extension. For example, APs in the USA are collections of small farms, public and recreational areas, and natural habitats [8,10]. Additionally, in Italy, studies have shown that APs are geographical spaces bordering urban and rural areas, facilitating the optimal allocation of industrial structures and regional functions [12]. However, the primary purpose of AP development in China is to support regional agricultural development by maximizing demonstration and leadership roles through the large-scale and specialized development of specific functional APs [12,13].
According to their development, APs have three stages in common: planning, management, and governance [9]. Planning aims to create and modify socioeconomic and environmental development objectives so as to contribute to the efficient utilization of limited agricultural resources. The management of APs needs to combine their necessary factors and regional socioeconomic characteristics [14]. Governance is the coordination of forces with interests, and the deployment of operational mechanisms as well as industrial chains within the management unit to contribute to the successful governance of APs [15]. In China, the government is an important support for the development of APs. Based on the government’s “guidance + market” leading principle, the government has established a top-down organizational and management mechanism from the nation to the local level for supporting the development of APs by macro planning and resource allocation. Under the guidance of government policy documents, the park management committee acts as a governance platform to promote the implementation and operation of policies [16]. As a result, the concept of APs development has been explored at a deeper level in China, profoundly influencing the process of agricultural development.
NMAIPs are a distinctive and advanced form of APs developed in China that we need to focus on because the literature on NMAIPs tends to concentrate more on current outcomes and development levels. We can summarize our study from three aspects: content, perspectives, and methods.
Regarding the study content, several academics summarized the current state of NMAIPs. Based on these concerns, advanced specific policy proposals were identified. Currently, the development of NMAIPs has begun to take effect, with significant spillover effects improving the level of industrial organization and promoting industrial integration [17], highlighting the relationship between farmers and agricultural enterprises, and cooperatives in NMAIPs. However, while farmers’ employment and income levels are increasing, farmers-driven roles have regional differences [18]. Problems in NMAIPs include the clear trend of non-grain and homogenization regarding the leading industries, the necessity for further industry convergence, the low level of farmer engagement, and the use of a single approach for depositing financial capital [6]. Because these problems have a considerable impact on measures such as park planning, construction, organization, and management, particularly in terms of spatial layout, they also affect the industrial structure and market competitiveness, necessitating effective policy recommendations for the growth of agricultural industries in various regions [19,20].
When it comes to research perspectives, scholars pay more attention to the micro-perspectives of farmers and new types of agricultural businesses, mainly focusing on analyzing the operational subjects, subject linkages, and behavioral choices of NMAIPs. In research analyzing the perspective of operational subjects, namely micro-farmers, there are five different types of interest-linkage mechanisms in NMAIPs, which are “market + farmers”, “agribases + farmers”, “companies + farmers”, “companies + cooperatives + farmers”, and “double shareholding” [21]. In terms of subject linkage, Hu et al. focus on growers’ households, demonstrating how their participation in the “insurance + futures” project follows a multi-stage supply and delivery system, as well as how their decision-making behavior is influenced by how valuable they perceive the project [22]. Regarding the behavioral choice, Zhang et al. analyzed the characteristics, impacts, and causes of contractual choice based on the contractual relationship between cooperatives and farmers by constructing the concentration degree of contract selection between farmers and cooperatives [23].
Scholars use various research methods to study NMAIPs; however, descriptive qualitative analysis remains the most popular [5,6,19,20]. With the development of NMAIPs and the depth of research, econometric and quantitative research, such as the weighted TOPSIS method, has received increasing attention from scholars [18], with structural equation modeling [22], the stepwise regression method, grey correlation method, information entropy model, and hierarchical analysis method [17,23], enriching the research of NMAIPs.
We found relatively few geospatial and quantitative studies on NMAIPs. Moreover, the development of NMAIPs based on a period of construction has become a system and scale. To support the sustainable and quality development of NMAIPs, we studied the development characteristics of NMAIPs, analyzed the regional differences by using quantitative approaches and proposed policy recommendations. Our research is based on the premise that China, a large country with marked differences in the natural environment and socio-economic conditions of different regions, is becoming an agricultural power country as a result of its implementation of a rural revitalization strategy and promotion of agricultural and rural modernization. However, NMAIPs, as an important growth pole for regional agriculture, are subject to the constraints of different regions and levels of development. Therefore, we raise the following questions: What are the development characteristics of NMAIPs in China? What are these differences in different regions and levels? Based on this, what recommendations can we make to promote NMAIPs?
Therefore, we propose to take 200 NMAIPs in China as the research objects, integrating geospatial data, economic statistics, and survey data based on spatial analysis, the Herfindahl–Hirschman index, and SBM-DEA model to analyze qualitatively and quantitatively the geospatial characteristics, industrial concentration, and inputs–outputs efficiency of NMAIPs from the muti-hierarchical perspective of national planning–provincial coordination–county implementation to reveal the development characteristics and regional differences of NMAIPs. Finally, we propose policy recommendations aiming at the sustainable and high-quality development of NMAIPs on this basis so as to contribute to the worldwide development of APs.

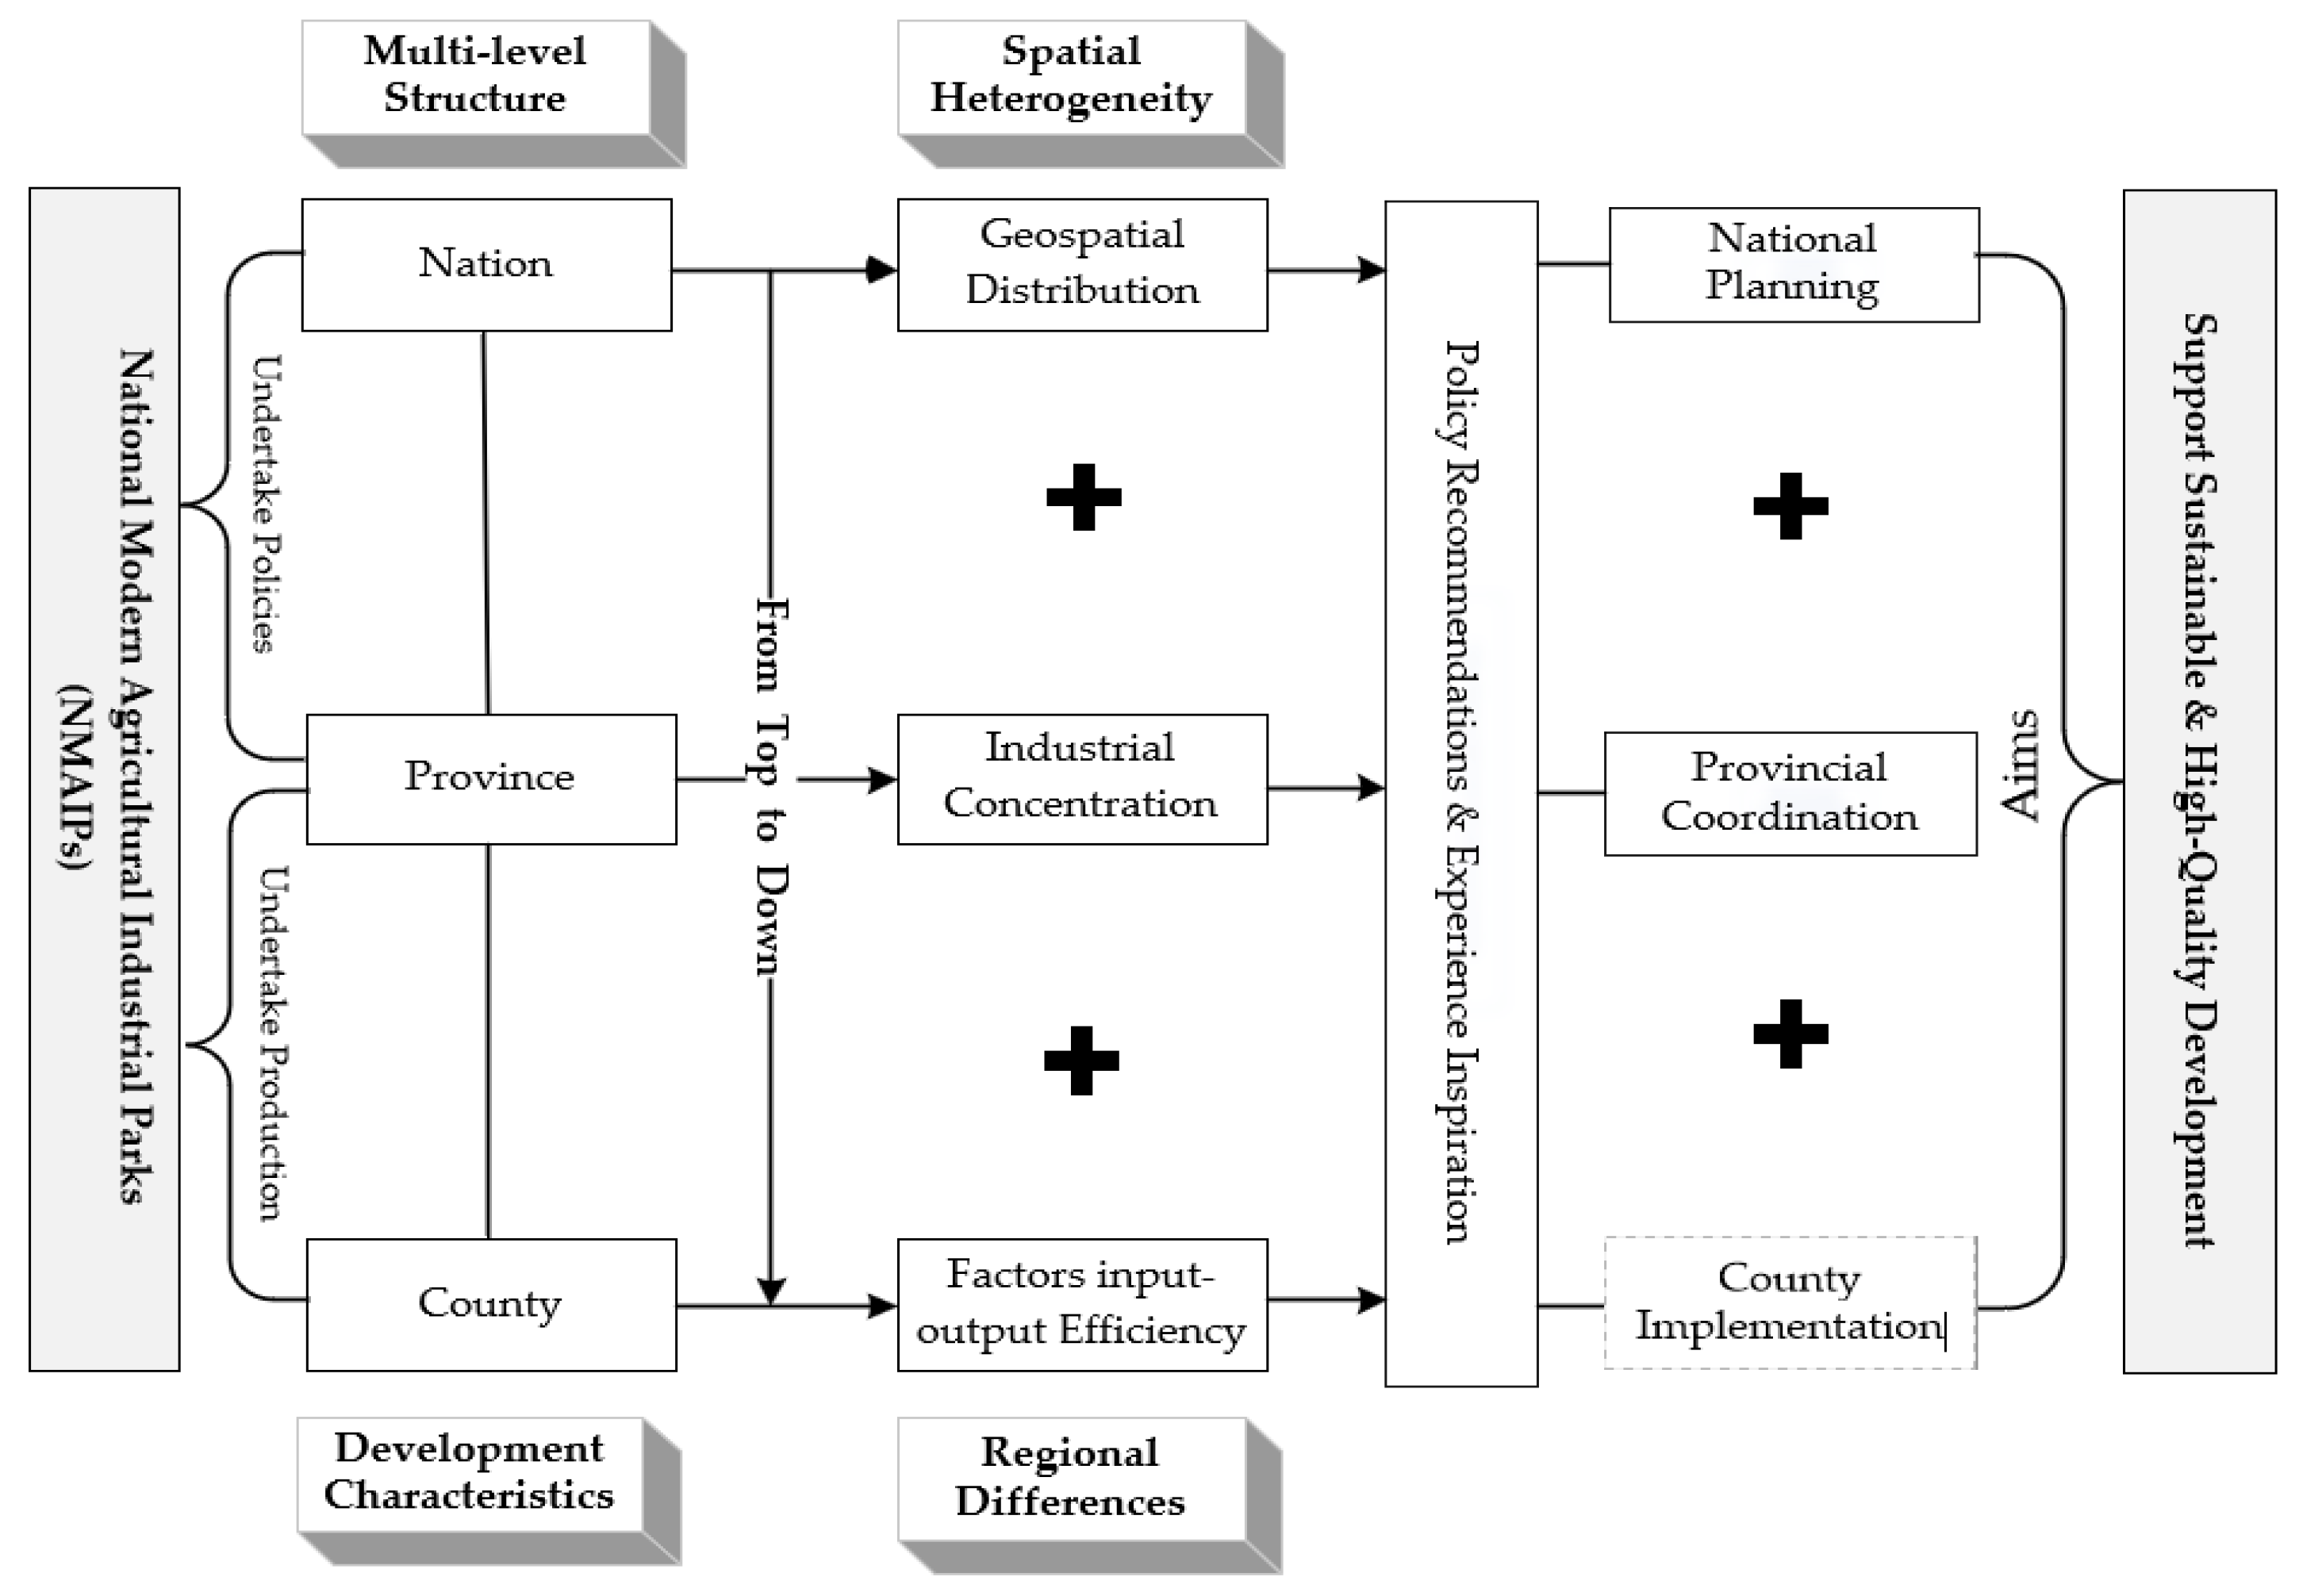
2. Theoretical Framework

Michael F. Goodchild proposed the Law of Spatial Heterogeneity, which states that multiple regions differ from one another due to spatial isolation, which causes differences between features. Spatial stratified heterogeneity is one of these kinds of differences. The multi-level structure of the objective world is addressed by the hierarchy theory, which adds to the complexity of studies on spatial heterogeneity. Each level emphasizes distinct characteristics and employs a different research methodology [24]. Elias G. Carayannis and David F.J. Campbell stated that three clusters exist in human systems: geospatial clusters, industrial sector clusters, and knowledge configuration clusters. They are able to span their own multi-level scales in the context of the internal network configurations that connect and determine the clusters [25].
NMAIPs are open entities [26]. The top-down and policy-directed operational mechanisms of NMAIPs ensure their stable and sustainable development, as well as the reasonable allocation of inputs and outputs through the involvement of external inputs and contributions in the field of agricultural production. It is essential to the park’s sustainable development and necessitates that we take the input perspective of the factors into account. As a kind of agricultural production and business entity under the guidance of the nation, NMAIPs undertake national policies for their top strategies and implement agricultural production and business activities at the bottom, which is a network connection point at all levels of agricultural and rural modernization development. They are able to efficiently realize the linkage and configuration of agricultural activities, as well as support the sustainable and high-quality development of regional agriculture. Thus, we need to focus on the development characteristics and regional differences at different levels, as well as propose policy recommendations based on these differences for the sustainable and quality development of NMAIPs: (1) At a national planning level, under the coordinated regional development strategy to realize the optimization of the layout of productive forces, geospatial characteristics are the primary concern of NMAIPs for integrated planning, adapting to local agricultural resource endowments, socio-economic development, and factor concentration conditions. (2) At the provincial management levels, intra-provincial (including the surrounding area) areas exist in a similar natural and social-economic situation. The optimal allocation of the structure of the leading industries can promote the rational development and use of regional agricultural resources, avoiding waste and excessive market competition. (3) At the county governance level, the county is the most basic administrative level for the implementation and management operation of NMAIPs policies, playing an important role in gathering factors, ensuring the rational allocation of resources, and focusing on the efficiency of input and output factors. Based on the above analysis, we can analyze the framework and mechanisms to support the sustainable and high-quality development of NMAIPs. Our study structure is as follows in Figure 1.

3. Materials and Methods

3.1. Materials

This study is based on 200 NMAIPs in 31 provincial administrative units of China, excluding Hong Kong, Macao, and Taiwan (NMAIPs have yet to start construction in these regions), with data including geospatial surveys and economic statistics.
In terms of analyzing the spatial distribution characteristics of NMAIPs, the geospatial data of NMAIPs were obtained by procuring the latitude and longitude data of each park and importing them into ArcGIS. By analyzing the industrial concentration characteristics, the leading industries of NMAIPs were classified into 12 categories, including grain, oil plants, fruits, vegetables, edible mushrooms, Chinese herbal medicine, specialty beverages, forestry and special flowers, husbandry, aquaculture, seed industry, and others (sugar, rubber, and fiber) by referring to the classification of major agricultural products in the China Rural Statistical Yearbook. In analyzing the input–output efficiency of the NMAIPs, the data included the four input indices of the labor force, land, capital, and technology, and the three output indicators of economic, social, and ecological benefits. The data types and sources are shown in Table 1.

3.2. Methods

3.2.1. Spatial Analysis

(1)
Standard deviational ellipse
A standard deviational ellipse (SDE) can quantitatively explain the characteristics of spatial morphology, including the centrality, spreading, and directionality of geographic element distribution. The use of SDE enables the analysis of the main areas and extension directions of the distribution of the NMAIPs. In this study, we determined the center of the ellipse distribution of NMAIPs using the first-level SDE of ArcGIS (covering nearly 68% of geographic elements) and then calculated its standard deviation in the X and Y directions, thus defining the axes containing the ellipse of NMAIPs, where the semi-major axis indicates the direction of the distribution, and the semi-minor axis indicates the range of the distribution [27]. The directionality of the ellipse is more obvious the more there is between the semi-major axis and semi-minor axis (the greater flattening of the ellipsoid); furthermore, the opposite also applies. This is expressed as follows:
The standard deviation of the X-axis:
σ x = i = 1 n ( w i x ˜ i cos θ w i y i sin θ ) 2 i = 1 n w i 2 The standard deviation of the Y - axis :
σ y = i = 1 n ( w i x ˜ i sin θ w i y i cos θ ) 2 i = 1 n w i 2 Mean center :
X w ¯ = i = 1 n w i x i i = 1 n w i ; Y w ¯ = i = 1 n w i y i i = 1 n w i ( x i , y i )
where ( x i , y i ) indicates the spatial location of each NMAIP; w i indicates weight; ( X w ¯ , Y w ¯ ) indicates weighted mean center; θ is the elliptic azimuth angle, and the angle formed by rotating clockwise from due north to the semi-major axis of the ellipse; x i and y i denote the deviation of the coordinates to each NMAIP’s locality to the mean center, respectively; σ x and σ y denote the standard deviation along the x and y axes, respectively [28].
(2)
The kernel density estimation
The kernel density estimation (KDE) is based on the geographic law of distance decline (closer objects are given more weight) and can be used to visually quantify the trend of spatial agglomeration to obtain a graphical representation of continuous changes in NMAIP density, with discrete points of dense peaks and scattered troughs. The method is centered on the location of the elemental points, and the kernel function determines how they decay, with the density value maximized at the center and decaying outwards to zero at the edge of the queue range, with the sum of the densities within the threshold range being the kernel density at the center [27]. This method is applied to all NMAIPs, and the densities at the same locations are superimposed to obtain the overall distribution density of the NMAIPs, which is given by:
f x = 1 n h i = 1 n k x x i h
x x i h is the kernel function, h is the bandwidth, and x x i is the distance from the estimated point x to the sample point x i . To visually represent the degree of aggregation of NMAIPs in space, a heat map of the KDE was generated by ArcGIS, classified by the Natural breaks (Jenks) as high-density, medium-density, and low-density regions.

3.2.2. Herfindahl–Hirschman Index

The Herfindahl–Hirschman index (HHI) is a common method for expressing the degree of geographic concentration of the industrial structure of economic activities within a region at the same geographic scale [28,29]. The HHI is the representation of the concentration or dispersion of NMAIP industries in the same geographical unit (provincial administrative district), which is easy to compare between regions at the same level [27]. NMAIPs are decentralized market agents with close upstream and downstream linkages, and there are only one or two leading industries in each NMAIP. So, similar agricultural products form a competitive relationship (market crowding effect) [30]. Thus, high geographic concentrations of the same categories of industries represent homogeneous competition. Based on this, our study uses the HHI to explore the characteristics of the industrial concentration of NMAIPs at the provincial level. The formula is as follows:
H H I = i = 1 n Z i 1 = i = 1 n ( X i X ) 2
HHI is used to characterize the geographic concentration of industries in the NMAIPs in the same province, X i denotes the number of the same leading industrial category i , X indicates the number of leading industries in a province, Z i 1 is the square of the proportion of the number of one leading industrial category in the total number of leading industries in the same province, and n is the number of leading industrial categories in the same province. When a leading industrial category is fully concentrated in a certain region, HII equals 1; when the industrial categories are evenly distributed, HII equals 1/n; therefore, the value of HHI is between 0 and 1. The higher the HHI, the higher the concentration of industries in the region and the greater the degree of homogenization of the leading industries.
Referring to Wei Houkai’s HHI classification (shown in Table 2), the classification was developed for the development characteristics of Chinese enterprises or industries, and it is therefore highly scientific and practical [31,32].

3.2.3. Slacks-Based Measure–Data Envelopment Analysis (SBM-DEA)

The model of data envelopment analysis (DEA) uses a linear programming approach to determine the relatively effective production frontier by keeping the outputs or inputs of the decision units constant within the defined set of production possibilities, which evaluates the relative effectiveness of the decision-making unit (DMU). It projects each DMU onto the production frontier and compares the deviation [33]. The improved SBM-DEA model puts slack variables directly into the target function and solves the problem of bias in the traditional DEA estimation-of-efficiency values; therefore, it can more accurately measure the technical efficiency of the production of the research object [34].
The non-angled SBM-DEA model (SBM-N) is expressed as:
( S B M N ) min ρ = 1 1 m k = 1 m s k x k 0 1 + 1 s r = 1 s s r + y r 0   s .   t .   x 0 = X λ + s y 0 = Y λ s + λ 0 ,   s 0 R ,   s + 0 R
where for the m inputs and s outputs produced in NMAIPs, assuming that λ is the adjustment matrix, denotes the number of inputs on the frontier, while denotes the number of outputs on the frontier. min ρ indicates the non-angled technical efficiency minimum of DMU ( x 0 , y 0 ) . Presupposing there are k inputs and kinds of r outputs, k = 1, 2, …, m and r = 1, 2, …, s. s denote the redundancy of input k, while s + denotes a shortfall in output r. 1 m k = 1 m s k x k 0 represents the inefficiency of the input variables, 1 s r = 1 s s r + y r 0 represents the inefficiency of the output variables. When s = s + = 0, ρ = 1, DMU ( x 0 , y 0 ) is on production frontiers. If a DMU is an inefficiency, therefore, efficiency improvements can be achieved by eliminating slack.
Because NMAIPs are founded on factors such as the agglomeration of supply, from the input perspectives, the technical efficiency (SBM-I) of the model can be shown as:
( S B M I ) ρ I * = min λ , s 1 1 m k = 1 m s k x k 0
ρ I * is comprehensive technical efficiency from the input perspective represented by TE, which means the comprehensive measurement and evaluation of the DMU’s ability to allocate resources and its efficiency in using resources and other aspects of capacity. The value of TE is between 0 and 1. The development of NMAIPs is consistent with the assumption of variable returns to scale, so that ρ I * is further decomposed into three components by DEA-solver pro 5:
ρ I * = T E = M I X × P T E × S E
MIX is the mixed effect of distinguishing between the radial and non-radial measure of DEA. 0 ≤ PTE ≤ 1 is pure technical efficiency affected by management and technology. 0 ≤ SE ≤ 1 is scale efficiency affected by scale, which refers to the difference between the existing scale and the optimal scale under the premise of a certain level of system and management.
As a socio-economic complex of agricultural activities, the concentration of agricultural factors are the basis for the sustainable operation of NMAIPs; therefore, there is a need to measure the efficiency of the NMAIPs. The inputs–outputs index data in this study come from 200 NMAIPs at a county level. As there are close natural resource endowments and socio-economic development conditions within each province, to analyze the issue of regional differences in the development of NMAIPs, the average of the inputs–outputs indices are calculated separately for each province, resulting in a total of 31 DMUs.

3.3. Selection of Indices

As the basis and extension of agricultural activity, NMAIPs are a highly coupled ecology–social–economic complex [5]. Fundamental inputs and accumulations are combined in individual production, working together at a certain proportion to contribute to the sustainability of agricultural activities [35,36]. With the national policy support of sustainability, NMAIPs play an active role in the agglomeration and optimal allocation of resources. Therefore, the indices of this study are multi-type, selected from the main indicators of NMAIPs monitored by the main Ministry of Agriculture and Rural Affairs. This study includes two primary indices, namely input and output at the county level. Taking into account the characteristics of China’s agricultural development and the construction of NMAIPs, and with reference to relevant research findings [11,37], the specific selection of the indices is as follows:
Input indices should relate to the basic situation of NMAIPs. Secondary indices are the most fundamental factors of agricultural activities: land for NMAIPs uses the occupied area to indicate the scale and scope of land use; labor force is a direct index of the link between NMAIPs and human agricultural production; and the whole industrial chain in NMAIPs is the local main operation activity. The population of townships is used to represent the labor contribution. Capital is key to the sustainable development and cyclical accumulation of NMAIPs, especially in China, where smallholder farmers are the main type, and capital mainly comes from social capital represented by leading agricultural enterprises and endogenous new agribusiness entities developed through adopting quantified shares of collective assets [38]. The development of technology actively promotes the transformation and upgrading of agricultural production and operation methods in NMAIPs, and the level of mechanization affects the ability to produce and supply high-quality agriculture and represents farmers’ utilization of modern agricultural technology, which is expressed by the comprehensive mechanization rate, which is main index to measure technology and equipment level. Moreover, output indices should relate to the benefits of the latest evaluation. The pursuit of economic efficiency and social development is the main objective of every production activity; however, economic development is accompanied by ecological damage. Therefore, the indices of outputs include three aspects: economic, social, and ecological. Specifically, in terms of economic benefits, the total output value reflects the overall level of the economic yield of NMAIPs. The average income of village collective enterprises reflects the level of operation of NMAIPs’ operating entities; in terms of social benefits, the total annual tax payment represents the level of contribution of NMAIPs to social welfare [39]. The per capita disposable income of farmers in the park is a manifestation of the linkage between NMAIPs and farmers’ interests, with higher values indicating stronger employment and income effects, while average per capita disposable income is the spillover impact of NMAIPs to wellbeing in the county [17]. The comprehensive utilization rate of straw illustrates the extent to which NMAIPs have a sustainable recycling effect on agricultural resources from an ecological perspective. The input–output indices are shown in Table 3.

4. Results

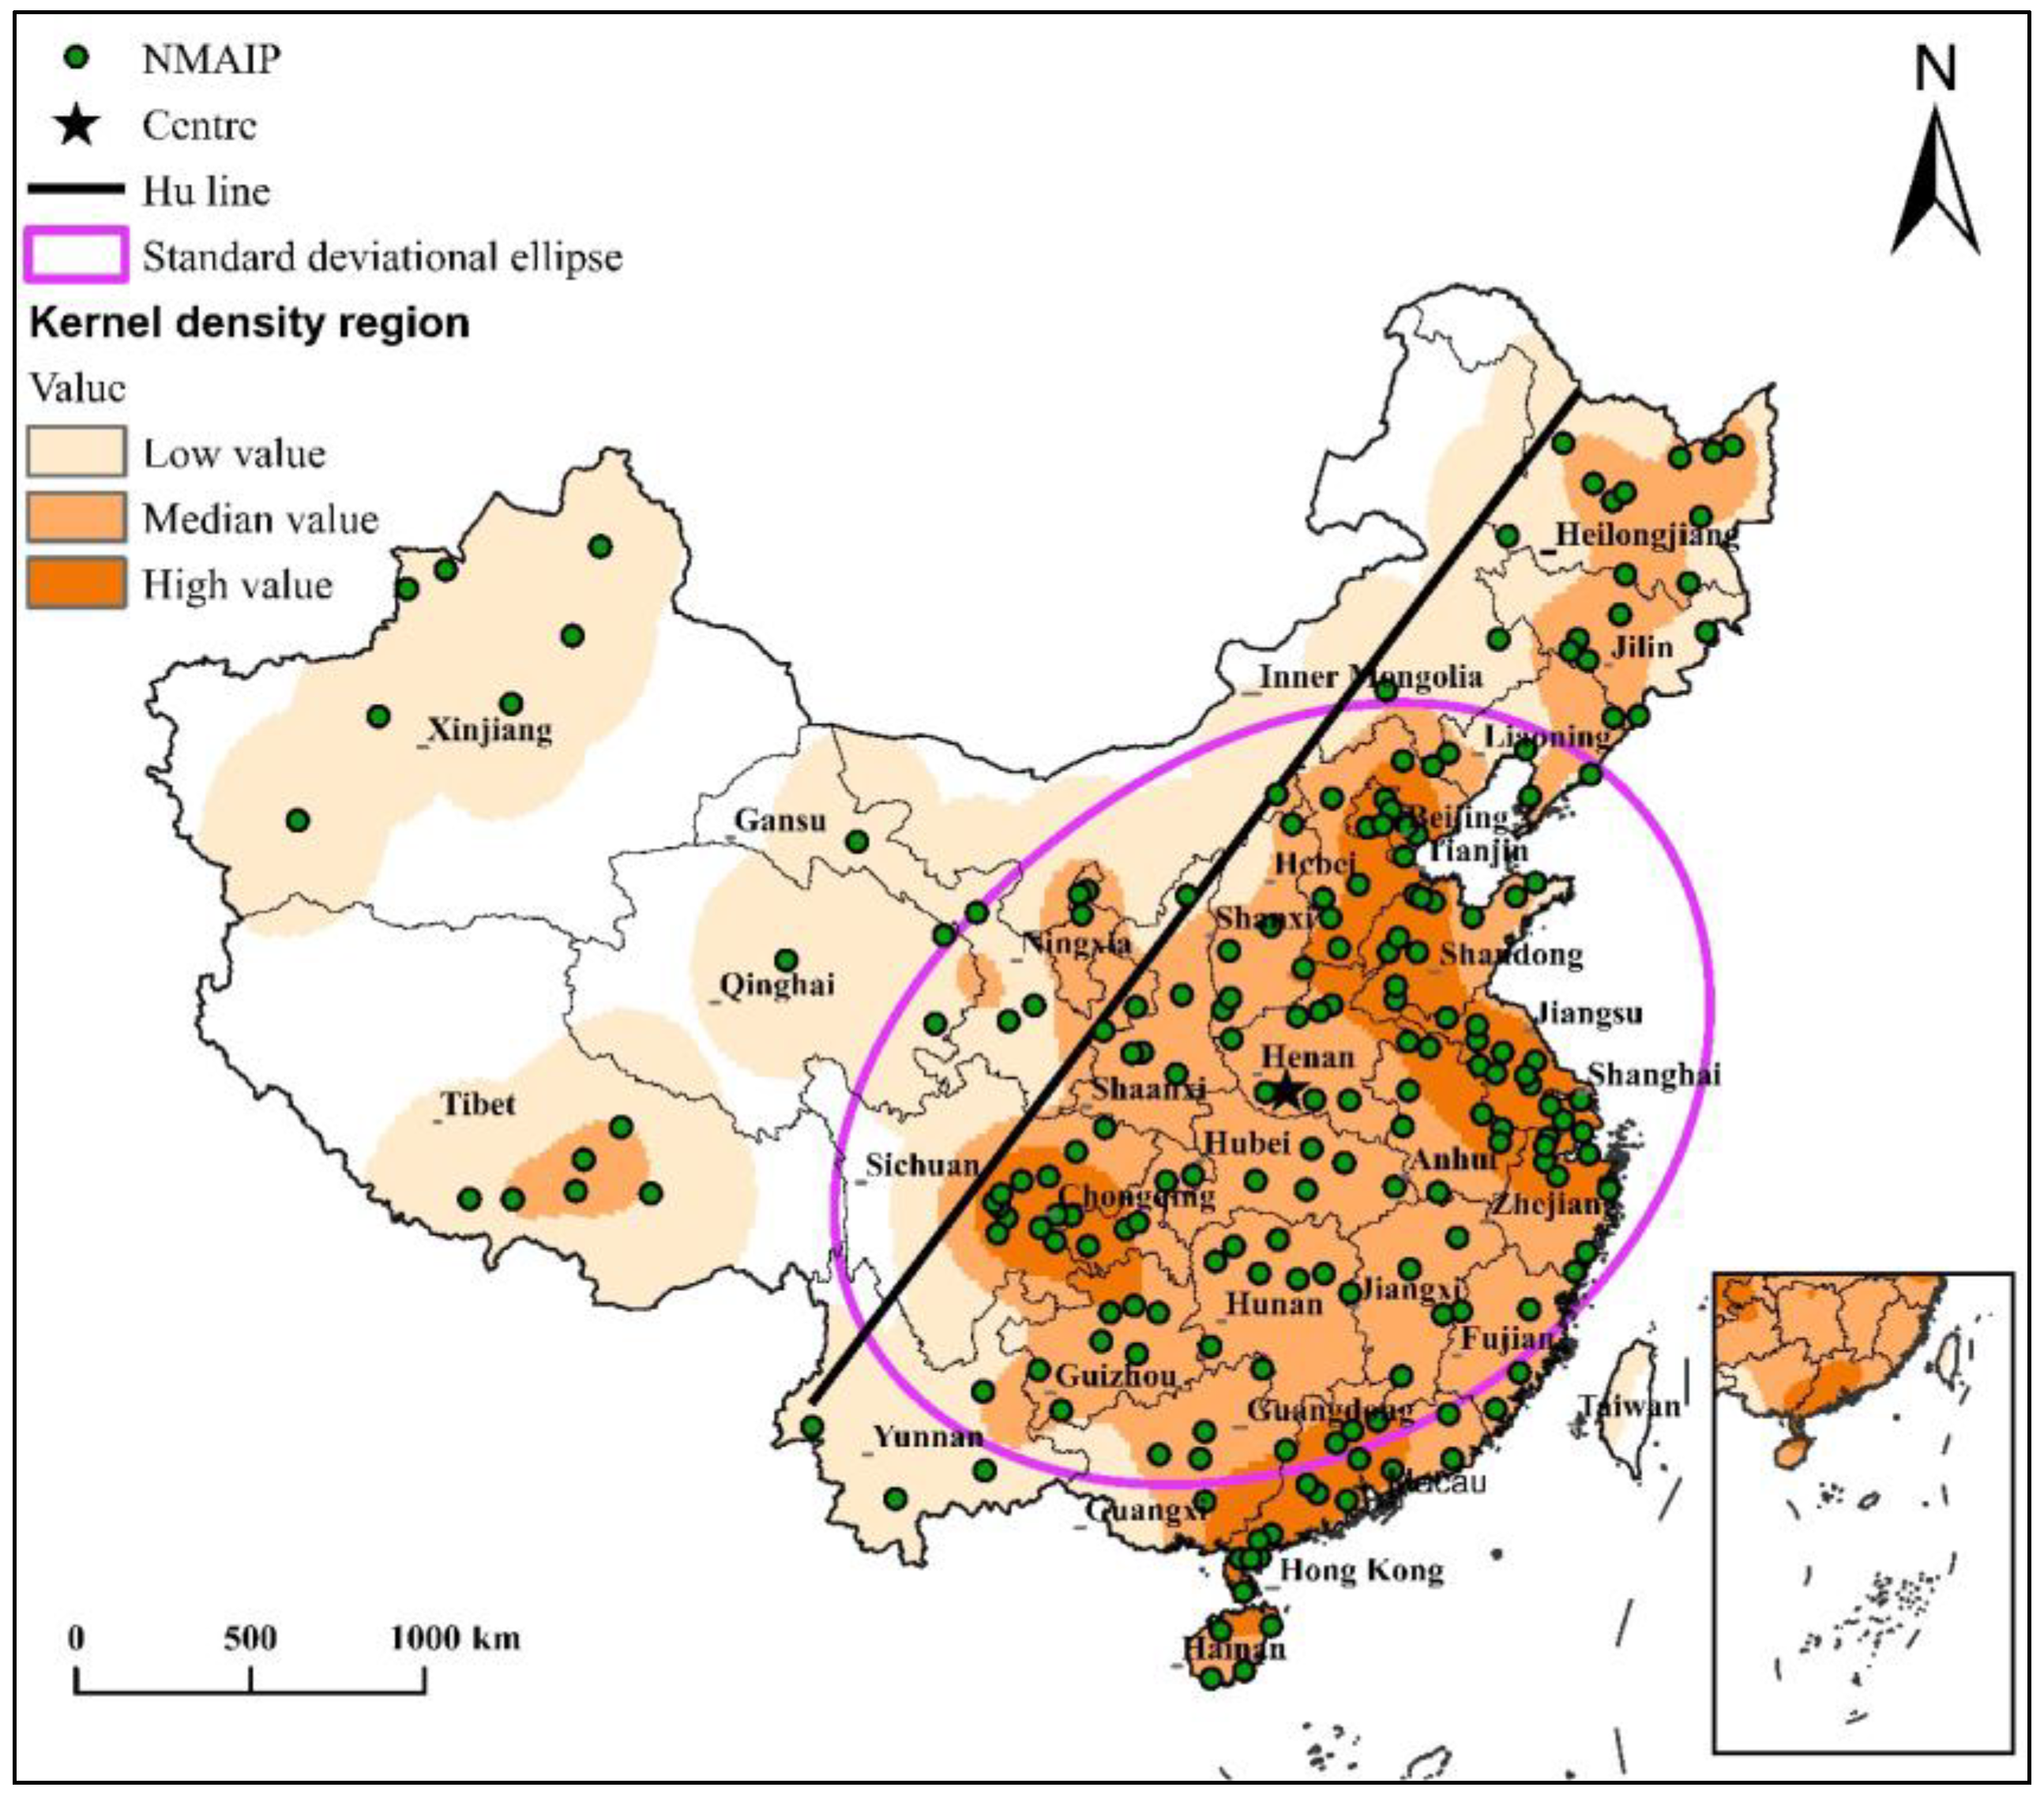
4.1. Geospatial Distribution Characteristics of NMAIPs

The Hu line is an important demarcation line for many human phenomena, such as population, society, and the economy, and the area east of this line is an important concentration area for the population and economy of the country [36,40]. NMAIPs have regular and heterogeneous geospatial distribution characteristics that show uneven agglomeration distributions divided by the Hu Line (Figure 2). Moreover, we can observe that a number of NMAIPs show characteristics of a decreasing gradient from east to west, with an average distribution of six NMAIPs in each province of China, among which Guangdong province has the largest number of NMAIPs (16), accounting for 8%. To further explore the geospatial distribution pattern of the NMAIPs, our study analyzes the geospatial distribution directionality and homogeneity.

4.1.1. Geospatial Distribution Directionality

The NMAIPs are built in a southwest–northeast direction and are mostly clustered in eastern and central China, as shown in Figure 2.
From the shape of the SDE, the distribution of NMAIPs is in the direction of the east (northward) to west (southward), and the area covering the inner part of the SDE is the main area for the development of NMAIPs, which is located in the central and southeastern part of China. The direction of the SDE is consistent with the direction of the Hu line, with 88% of the parks to the east of the Hu line and 12% to the west, indicating that the distribution range of NMAIPs is closely related to the concentration of socio-economic factors and economic development, and that there is a clear imbalance in regional development.
The center distribution of the SDE is located in the south of Henan province, which is an important agricultural production region, a center of population distribution, and a transit point for the inter-regional flow of factors in China [37], suggesting that geographical location, agricultural resource endowment, and mobility factors may be the main elements forming the centripetal force for the distribution and concentration of the NMAIPs.

4.1.2. Geospatial Distribution Homogeneity

The kernel density of NMAIPs is 0–1.28, which indicates that the spatial distribution is non-uniform. Figure 2 shows that the NMAIPs clustering trend is obvious, displaying a round-structured development state with multiple cores. This is manifested in three aspects.
First, the higher level of socio-economic development is probably the most important reason for the clustered development of the NMAIPs. From the heat map of the KDE, the clustering of NMAIPs also shows that the east is dense and west is sparse according to the Hu line. The high-density areas are concentrated to the east of the Hu line. These areas are the Yellow River Delta, the Yangtze River Delta, the Sichuan Basin area, and the Pearl River Delta area, and they are parts of the core growth pole areas of China’s economic growth, which have a high level of socio-economic development, contributing to the high-density development of NMAIPs under the factor diffusion effect. kernel values are highest in the high-density core areas, decreasing from the center to the periphery to the medium-density areas. The low-density zone is located to the west of the Hu line, concentrated in the northwestern pastoral areas and in western Sichuan, Tibet, and Yunnan, where the socio-economic factors for the development of the NMAIPs are not sufficiently dynamic. Second, specifically, the high-density zone from the Yellow River Delta to the middle and lower reaches of the Yangtze River shows striped development characteristics, probably because modern agricultural factors show a more active flow and agglomeration between the two areas. Third, the natural resource endowment of agriculture plays an important role in promoting the agglomeration and development of NMAIPs. The medium-density region in southcentral Tibet and the high-density zone in the Lei Zhou Peninsula have a high number of NMAIPs and obvious agglomeration. These areas have a low level of socio-economic development but favorable natural conditions, such as the superior sunlight, heat, and precipitation in southern Tibet. Additionally, the tropical environment products in southern Guangdong enables high-quality special agricultural conditions.

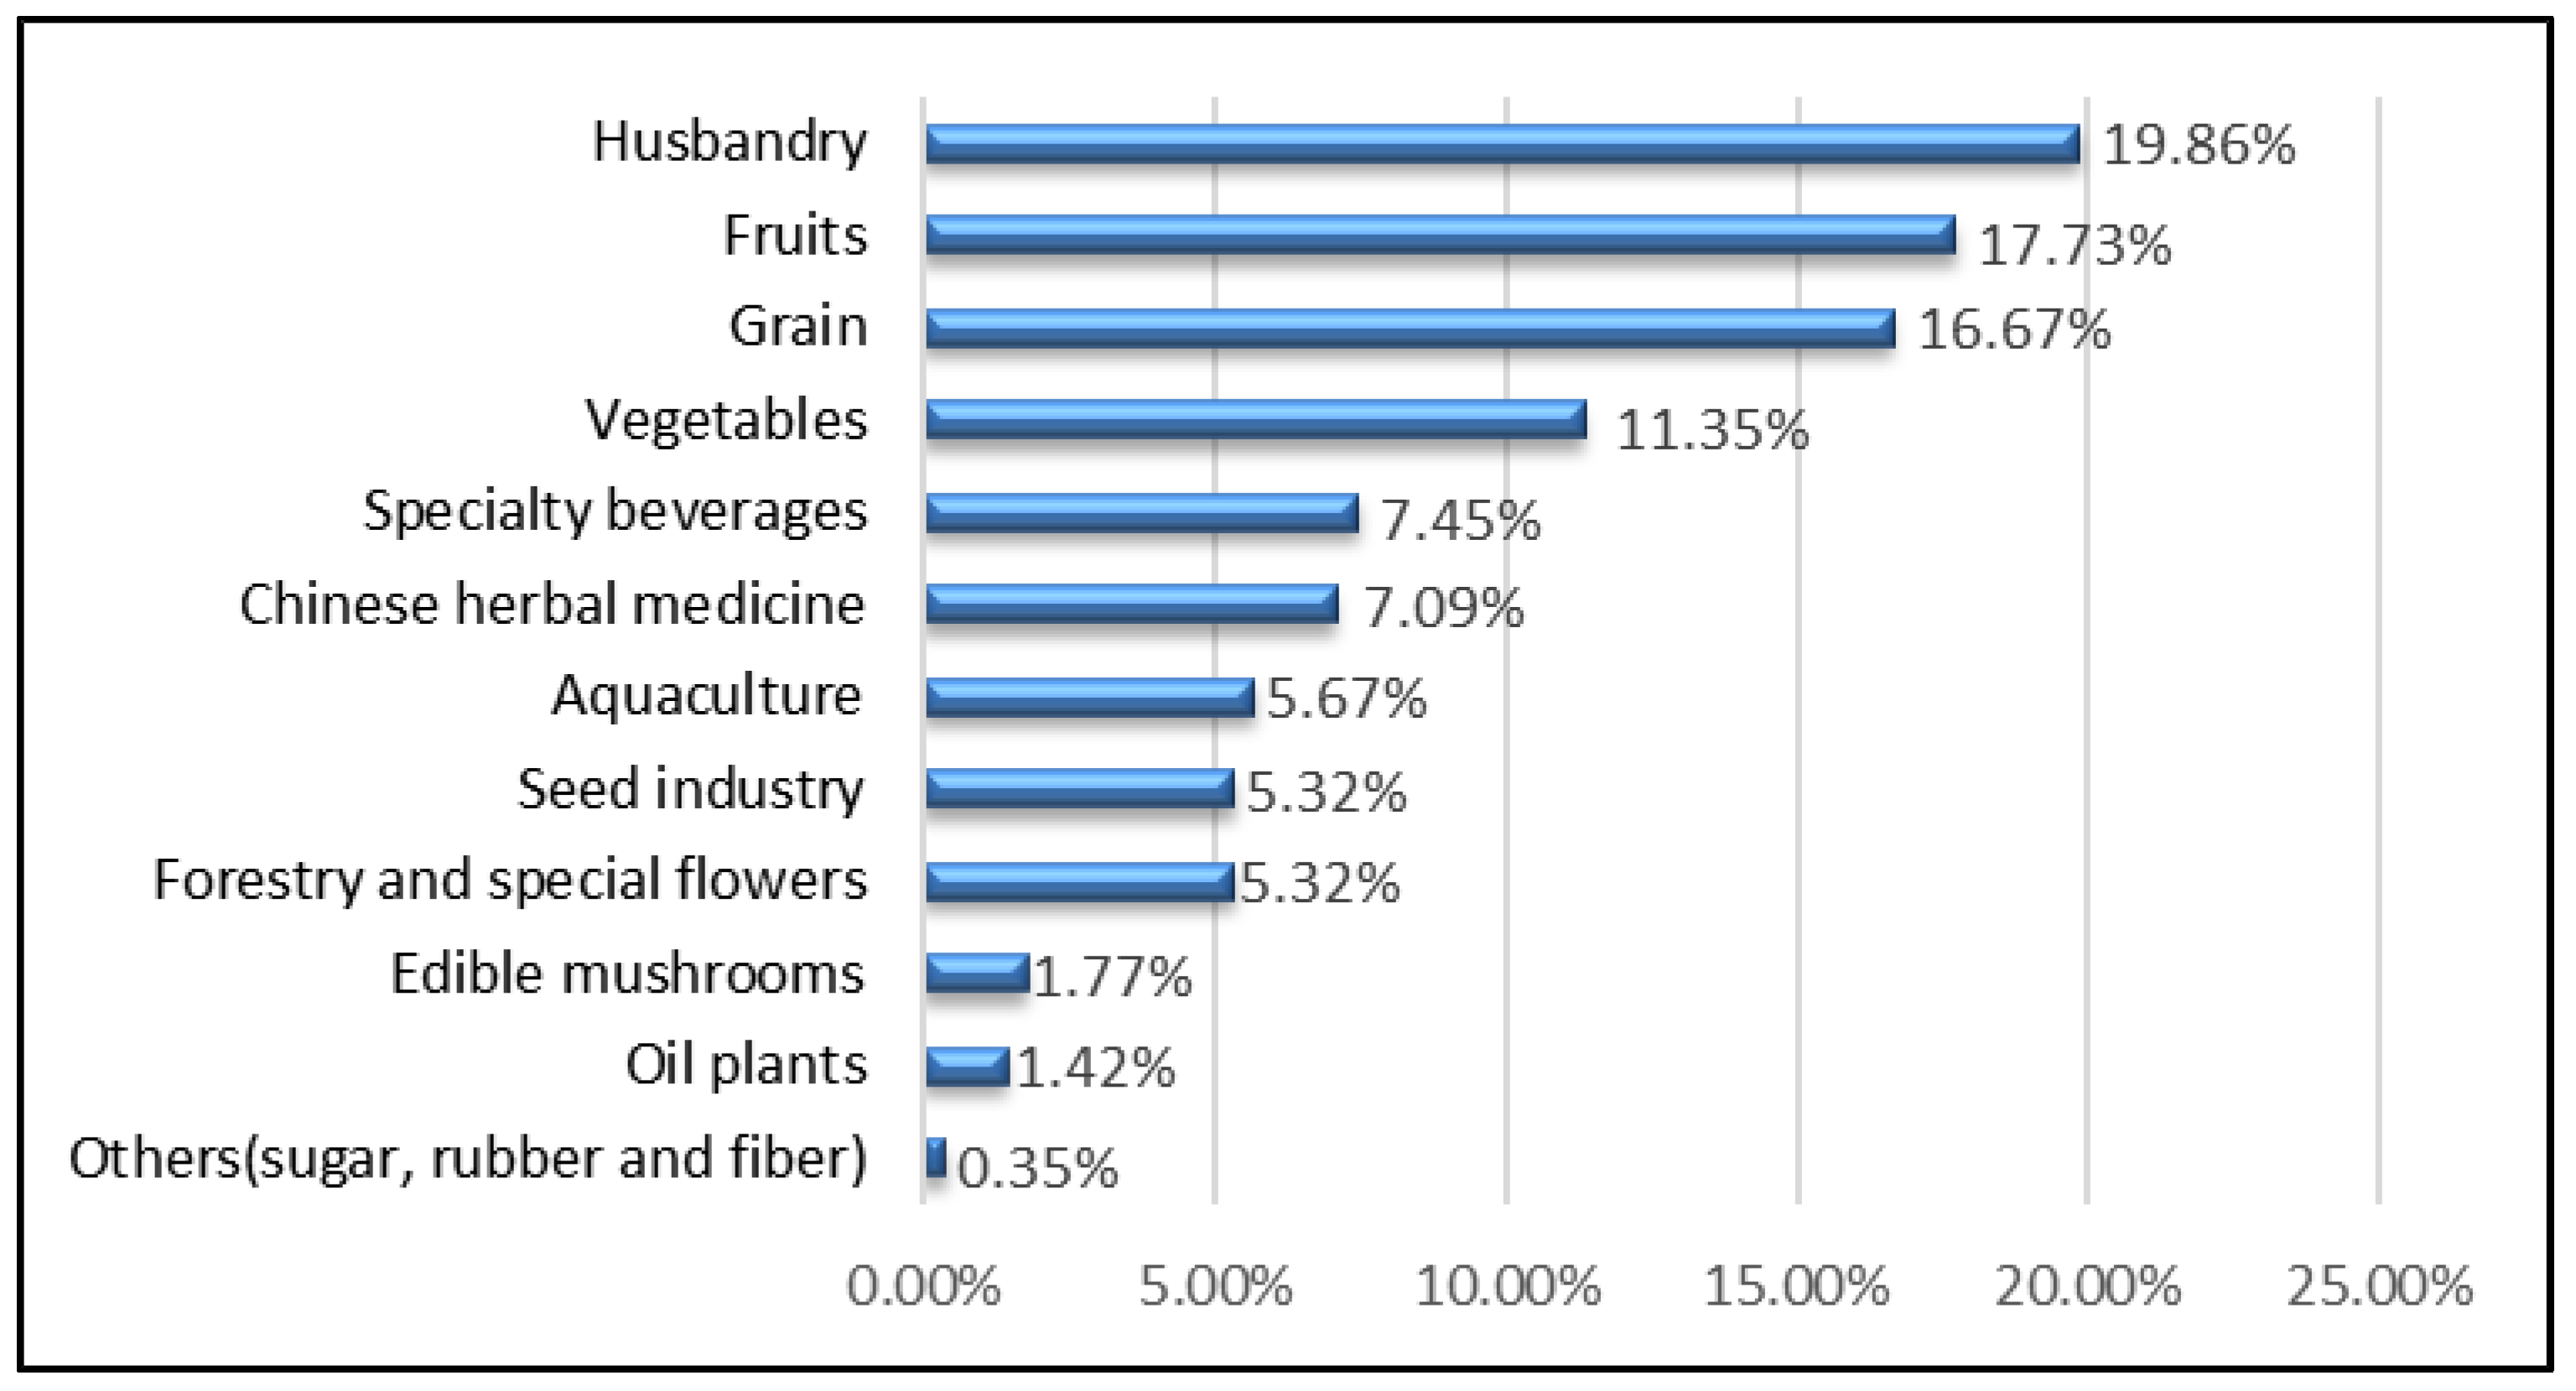
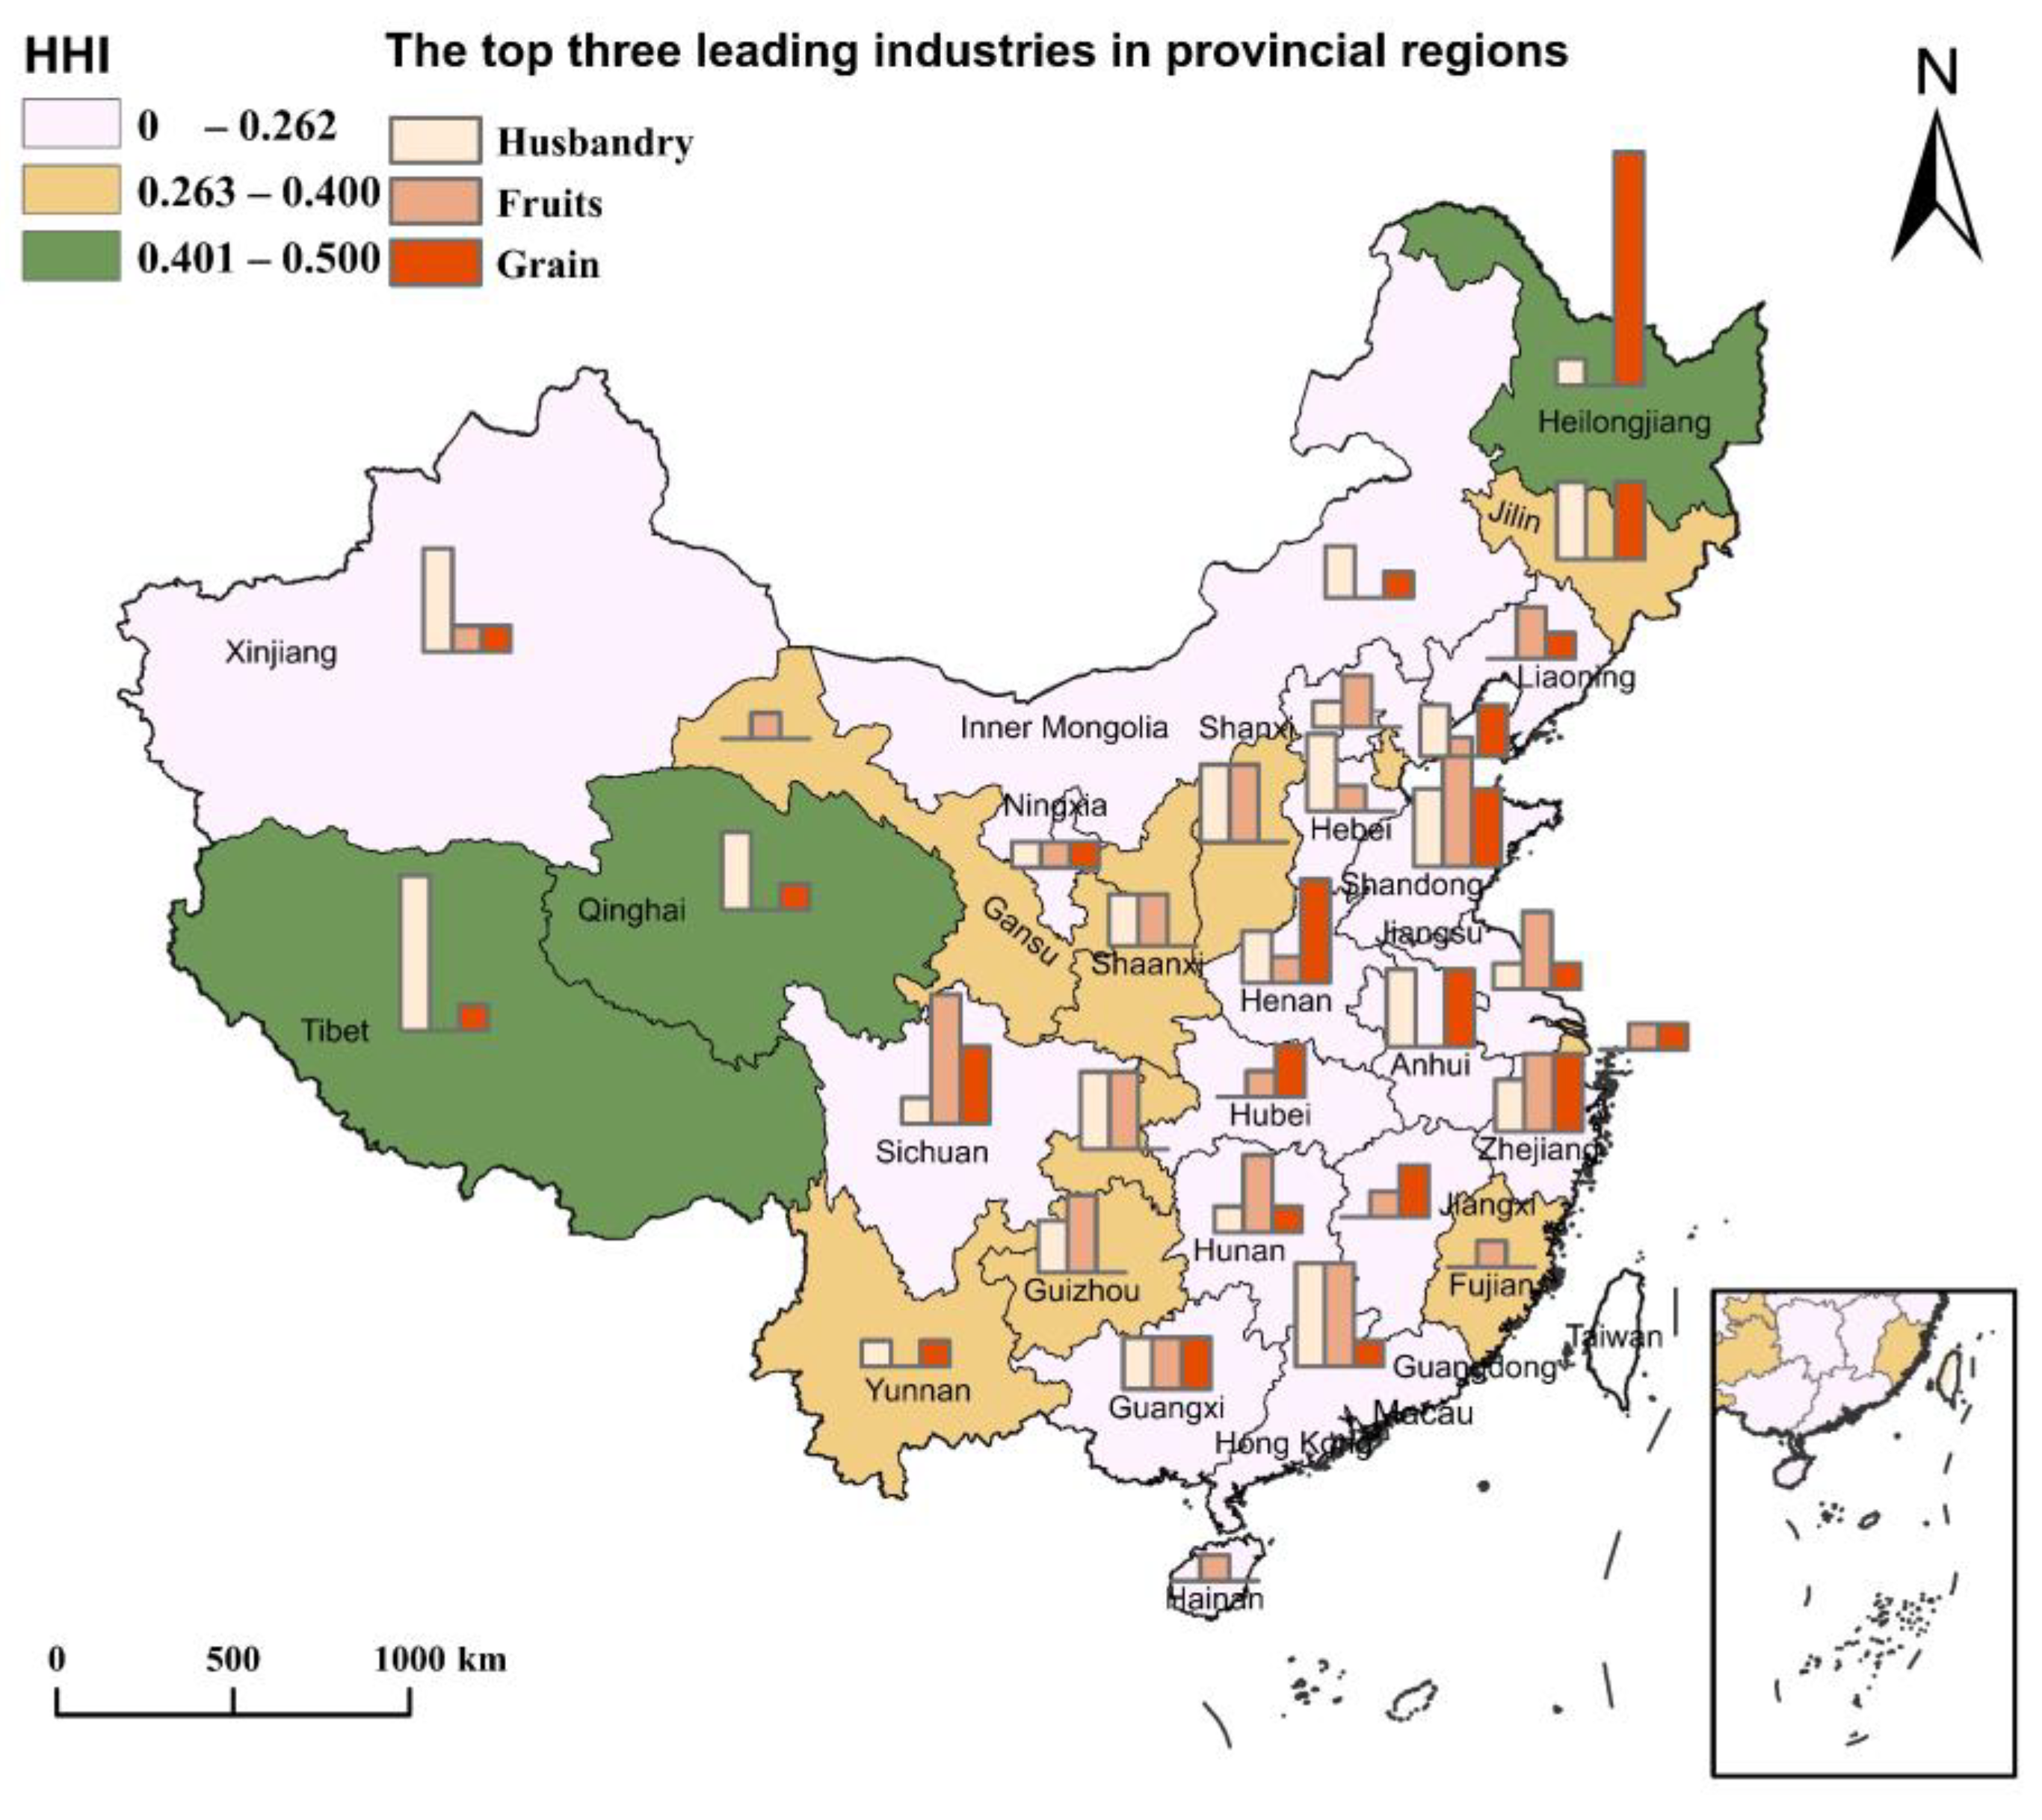
4.2. Industrial Concentration Characteristics of NMAIPs

4.2.1. Industrial Homogeneity

There is a tendency for the development of leading industries to be homogenous with NMAIPs. Figure 3 shows that the top three categories of leading industries are husbandry, fruits, and grain. There are 56 leading industries of husbandry, accounting for 19.86%; 50 NMAIPs with fruit as the leading industry, accounting for 17.73%; and 50 NMAIPs with grain as the leading industry, accounting for 16.67% of all NMAIPs.

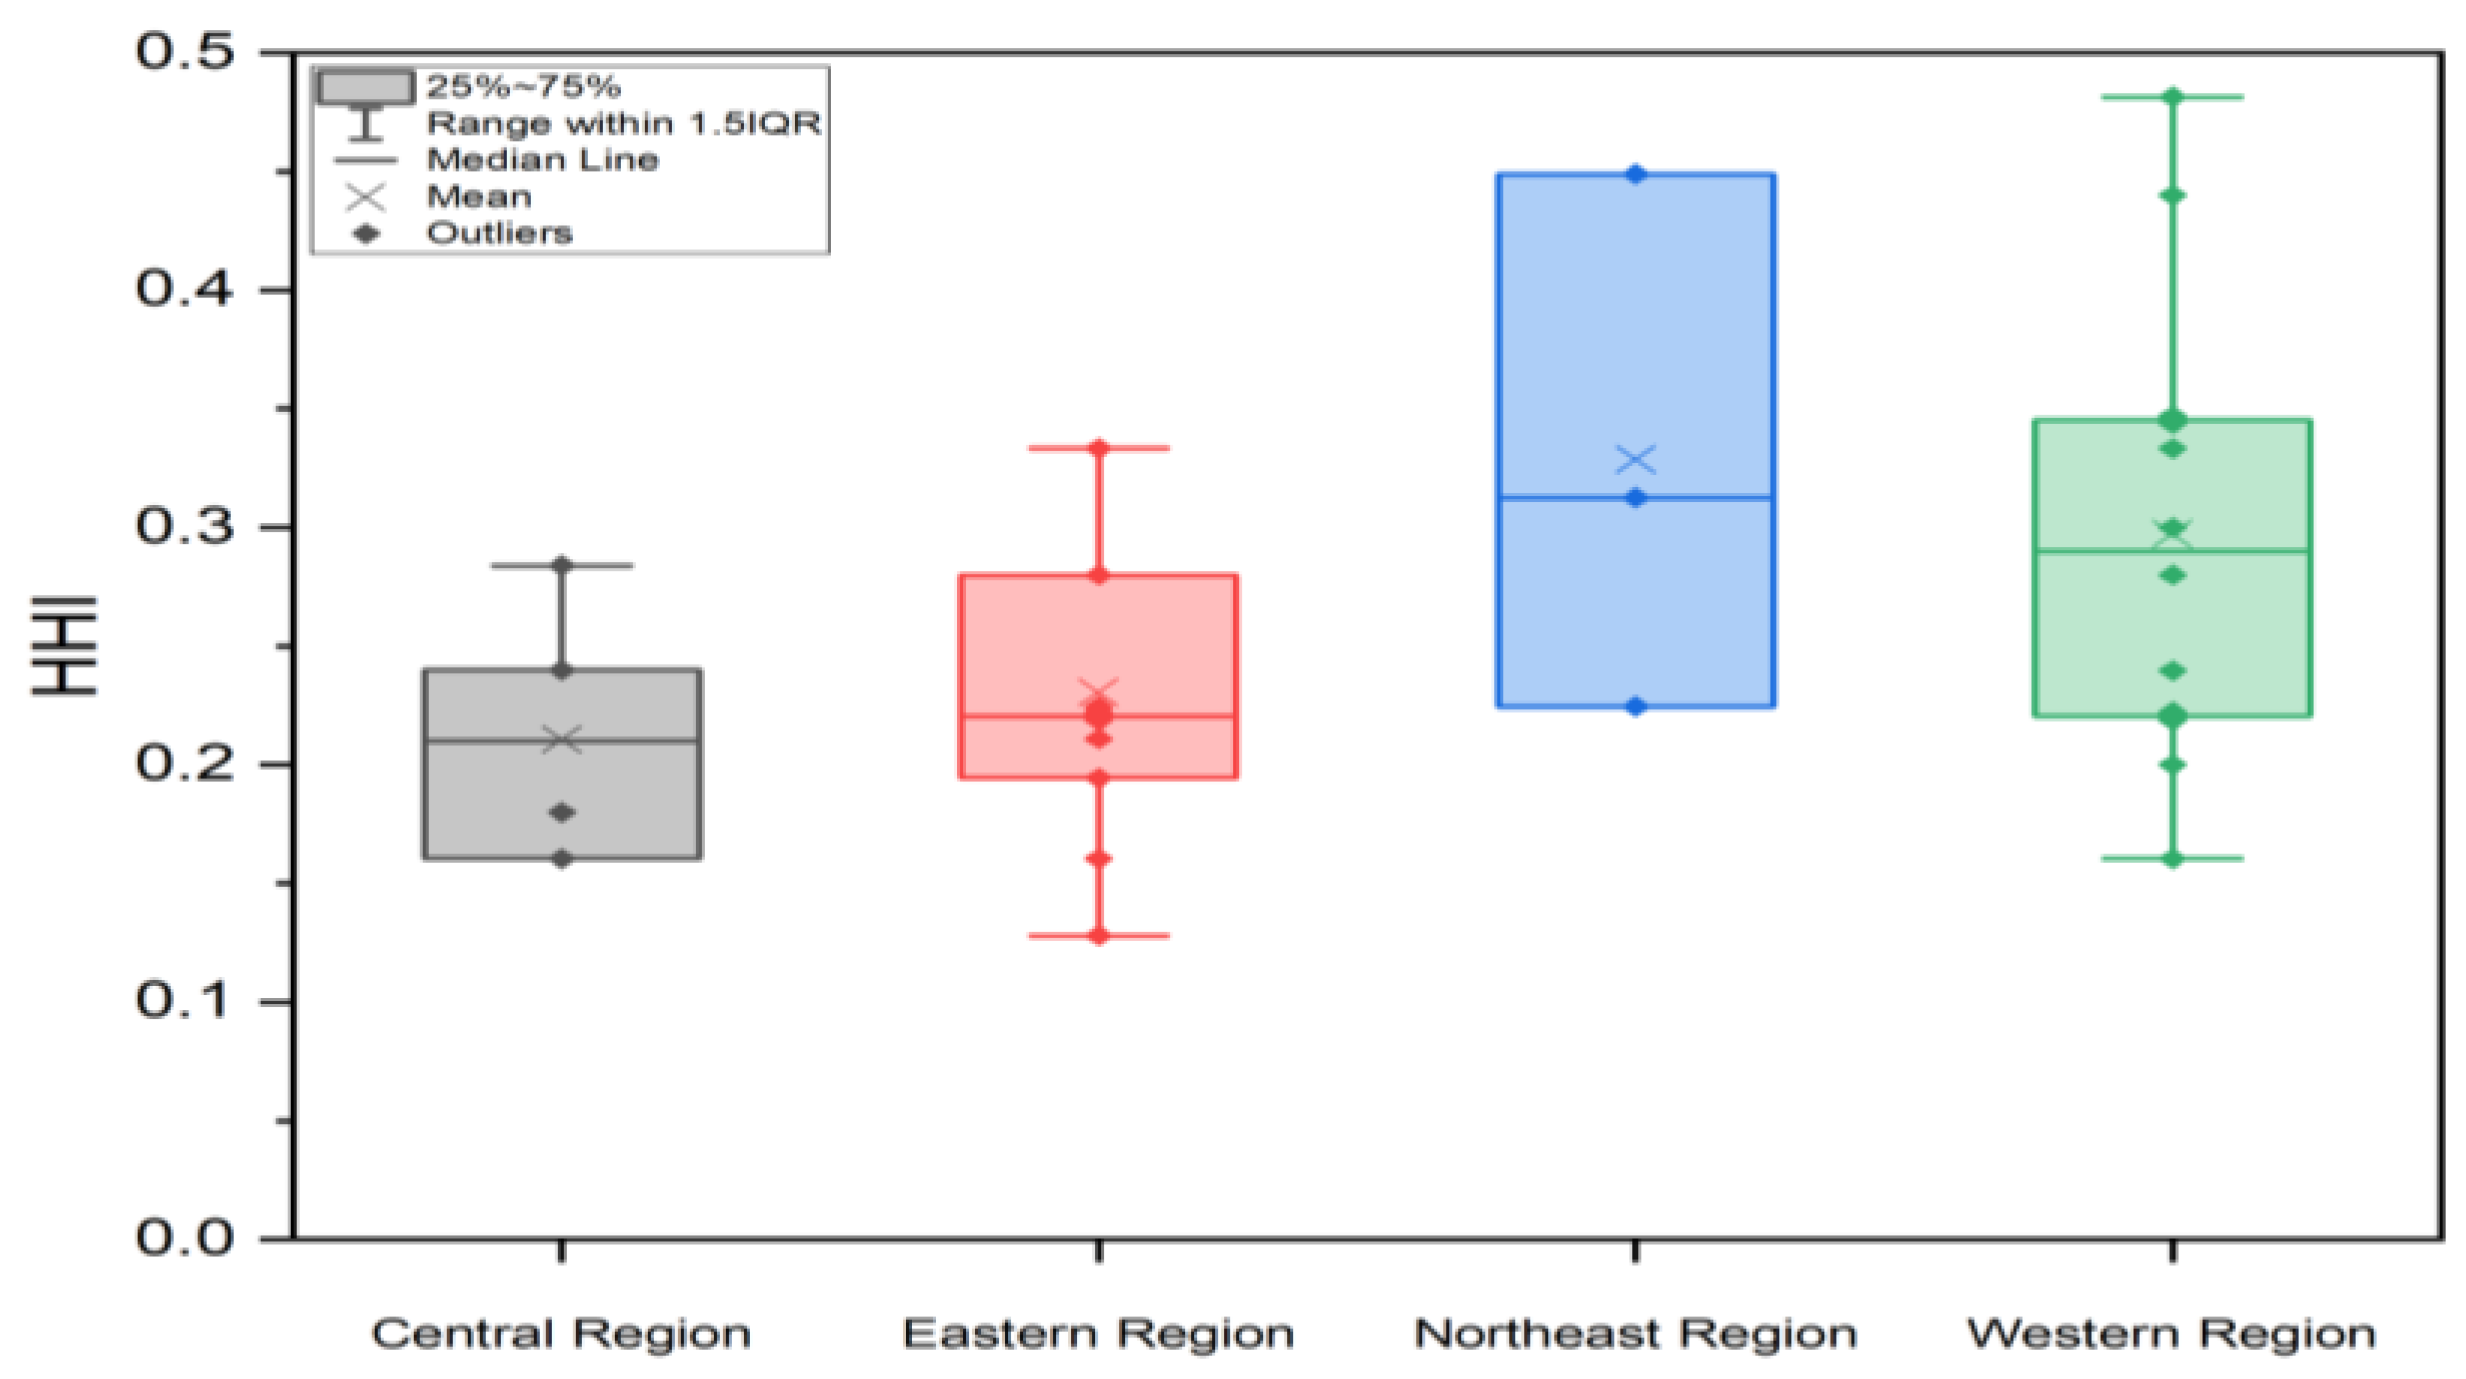
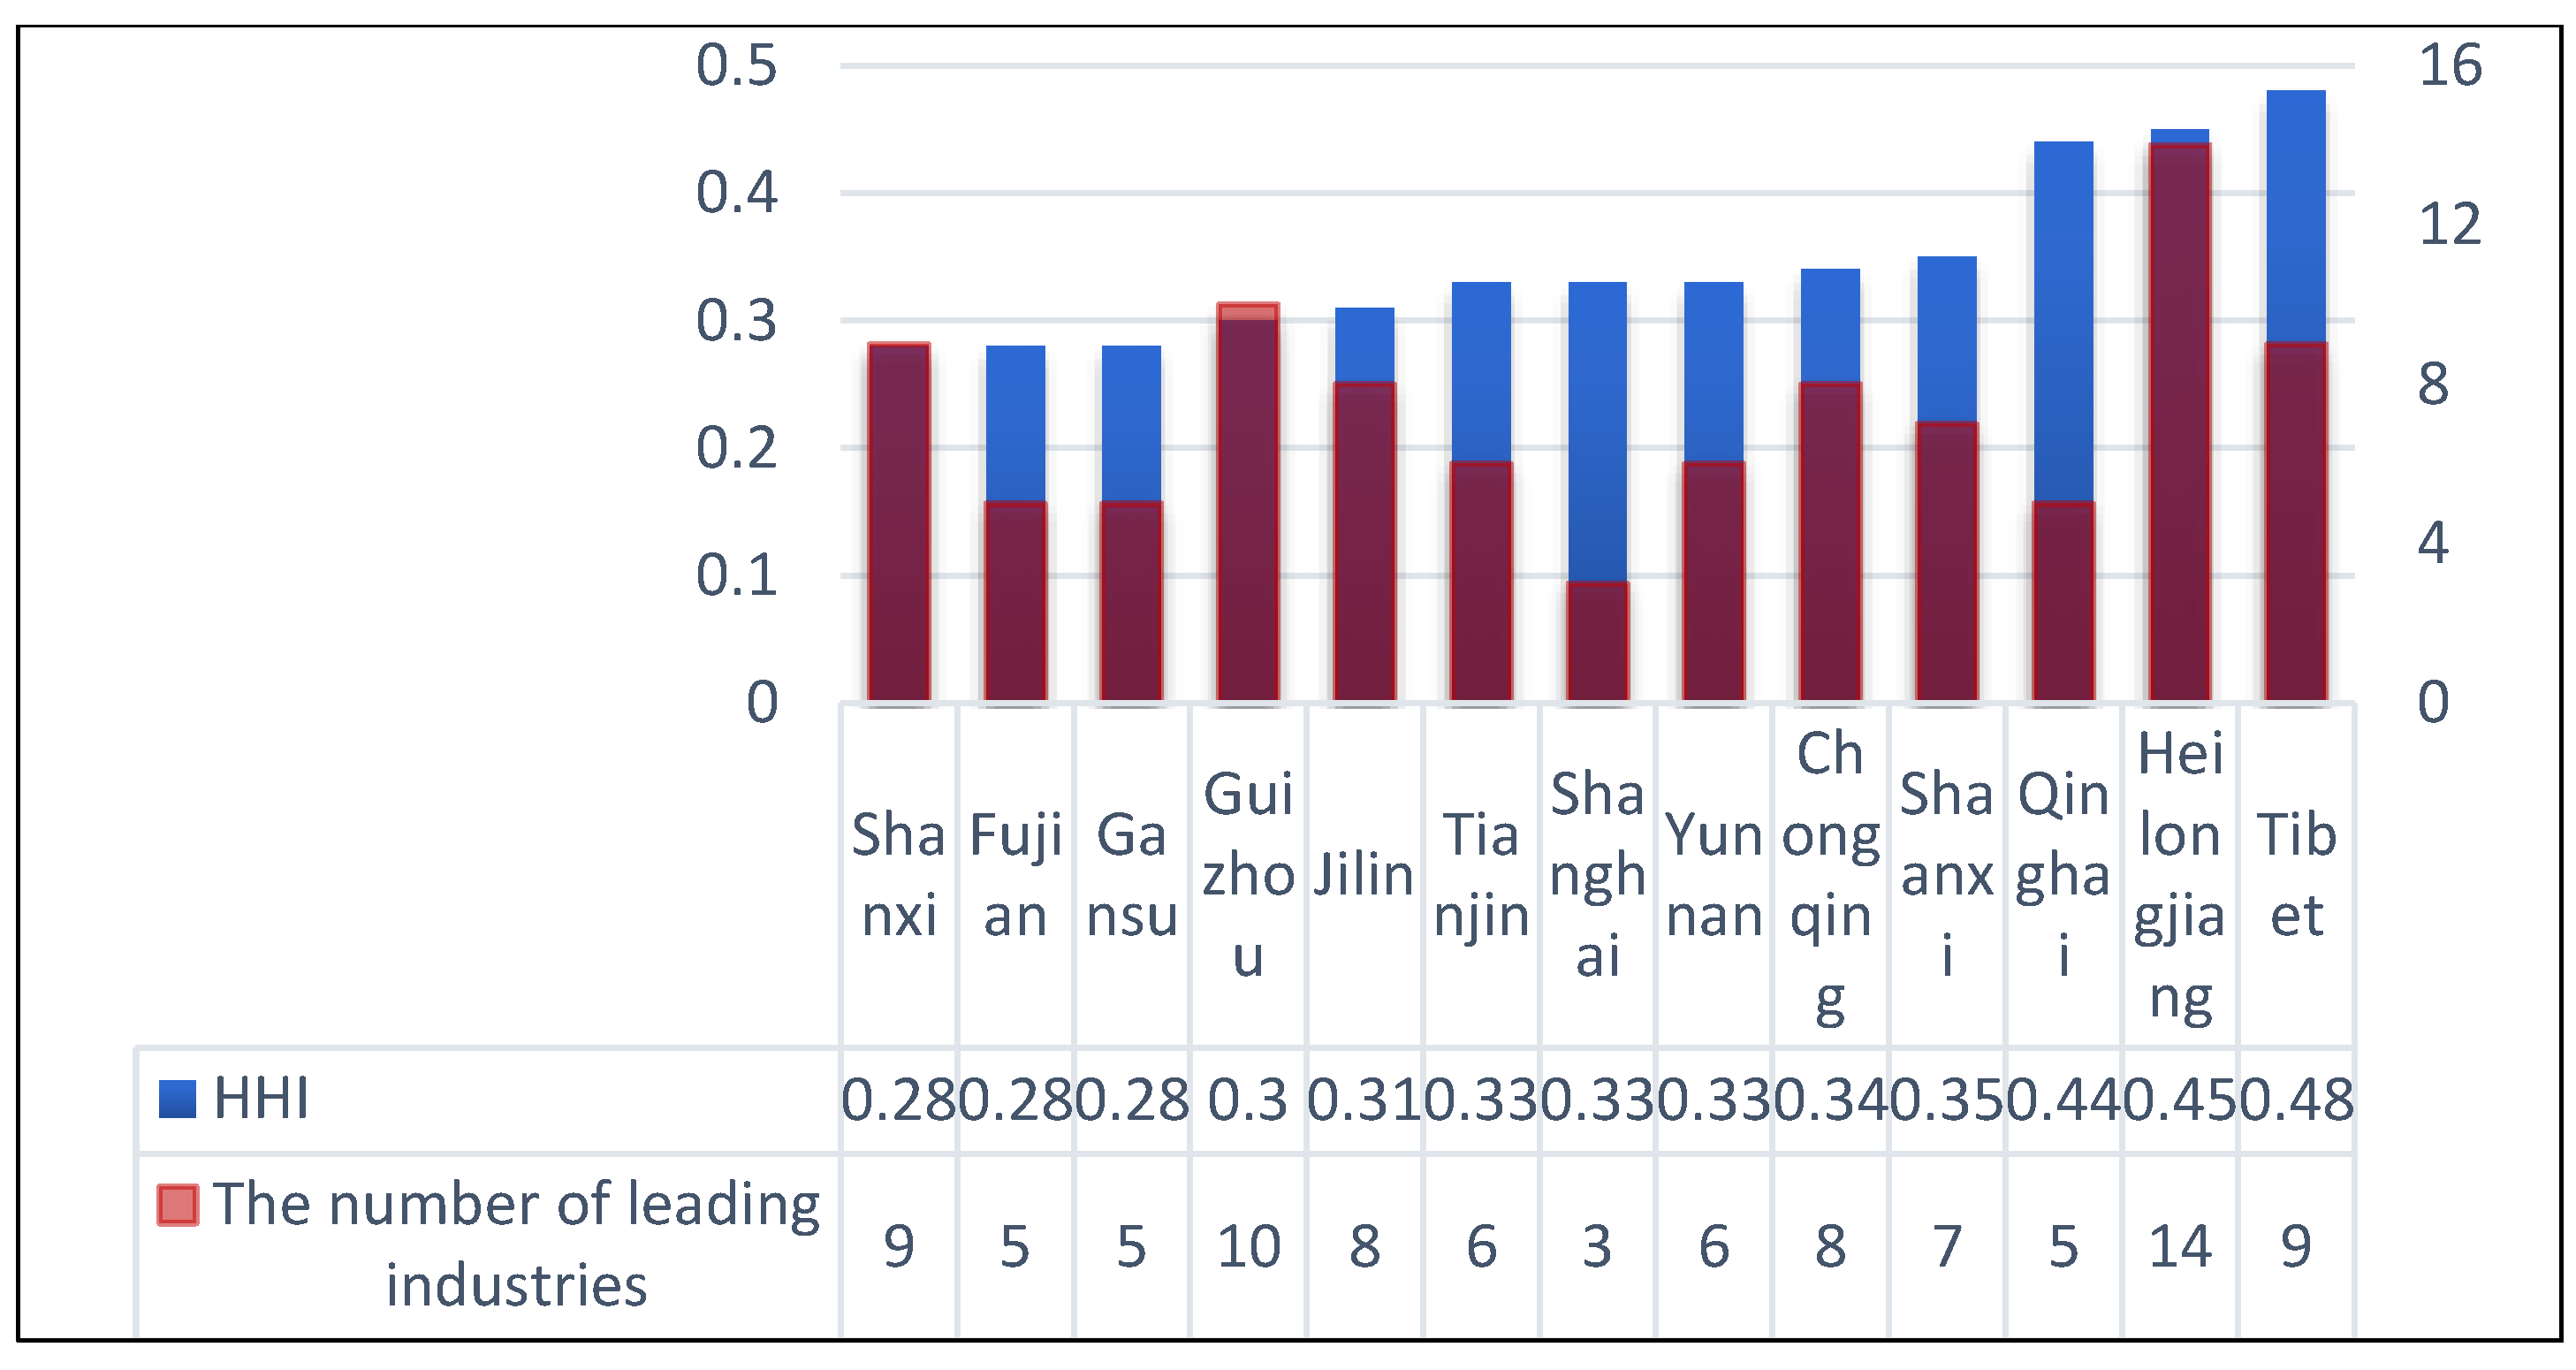
4.2.2. Geographic Concentration in HHI of Industries

The homogeneity of the leading industries in NMAIPs is widespread within each province, manifesting in a high degree of geographic concentration for industries. The HHI range in 31 provinces is 0–0.5, with a mean value of 0.262. A total of five provinces are low oligopolistic [0.10, 0.18), while 26 provinces are highly oligopolistic [0.18, 1). The province with the lowest HHI is Jiangsu province (0.128), indicating a rich variety of leading industry categories; the province with the highest HHI is Tibet (0.482), indicating a high degree of homogeneity among leading industries within that province.
First, in terms of regional differences of HHI, the low oligopolistic industries are mainly concentrated in the central and eastern regions of China, including Jiangsu, Guangdong, Hubei, Jiangxi, etc., indicating that the NMAIP industries in these regions cover a wide range of industrial categories with a low degree of industrial homogeneity, which is conducive to the diversification of regional-specialty agricultural products. The highly oligopolistic type mainly dominates the western and northeastern provinces, indicating that the NMAIP industry categories in these regions are uniform. Figure 4 shows that the western region is homogeneous regarding the fruit industry, while the northeastern region is homogeneous regarding the grain industry, with fierce competition in the same type of industry, leading to fragmentations in the use of the same elements, a lack of competitive advantages, and low differentiation between agricultural products. This drives agricultural products into low-level competition in the same region, which is not conducive to the expansion of the profit levels and market share of agricultural products or the formation of brand effects.
Second, the concentration in the top three industrial categories—husbandry, fruits, and grain—is responsible for the increase in HHI values in provincial regions. Among them, as shown in Figure 5, the provinces with an HHI greater than 0.4 are Qinghai, Tibet, and Heilongjiang, which are important pastoral and major grain-producing areas in China. The NMAIPs in these provinces effectively contribute to the functional effect of regional agriculture; however, there is a need to further exploit local agricultural resources to broaden the development path of NMAIPs. Specifically, as shown in Figure 6, there are 13 provinces with a higher HHI (above average). Among them, the number of leading industries in Tianjin, Shanghai, Fujian, Yunnan, Gansu, and Qinghai is below average, so building new parks and developing new leading industries is a way of developing NMAIP industries. Shanxi, Jilin, Heilongjiang, Chongqing, Guizhou, Tibet, and Shaanxi have a high number of leading industries, indicating a tendency toward saturation in the number of industries in these provinces. Thus, the type, structure, and development direction of the existing leading industries should be adjusted to achieve the reasonable concentration and diversified allocation of regional factors. The new NMAIPs declared for construction should explore more types of leading industries to achieve the diversified development of agricultural products, so that they create conditions for the expansion of the scale of NMAIPs.

4.3. Inputs–Outputs Efficiency Analysis of NMAIPs

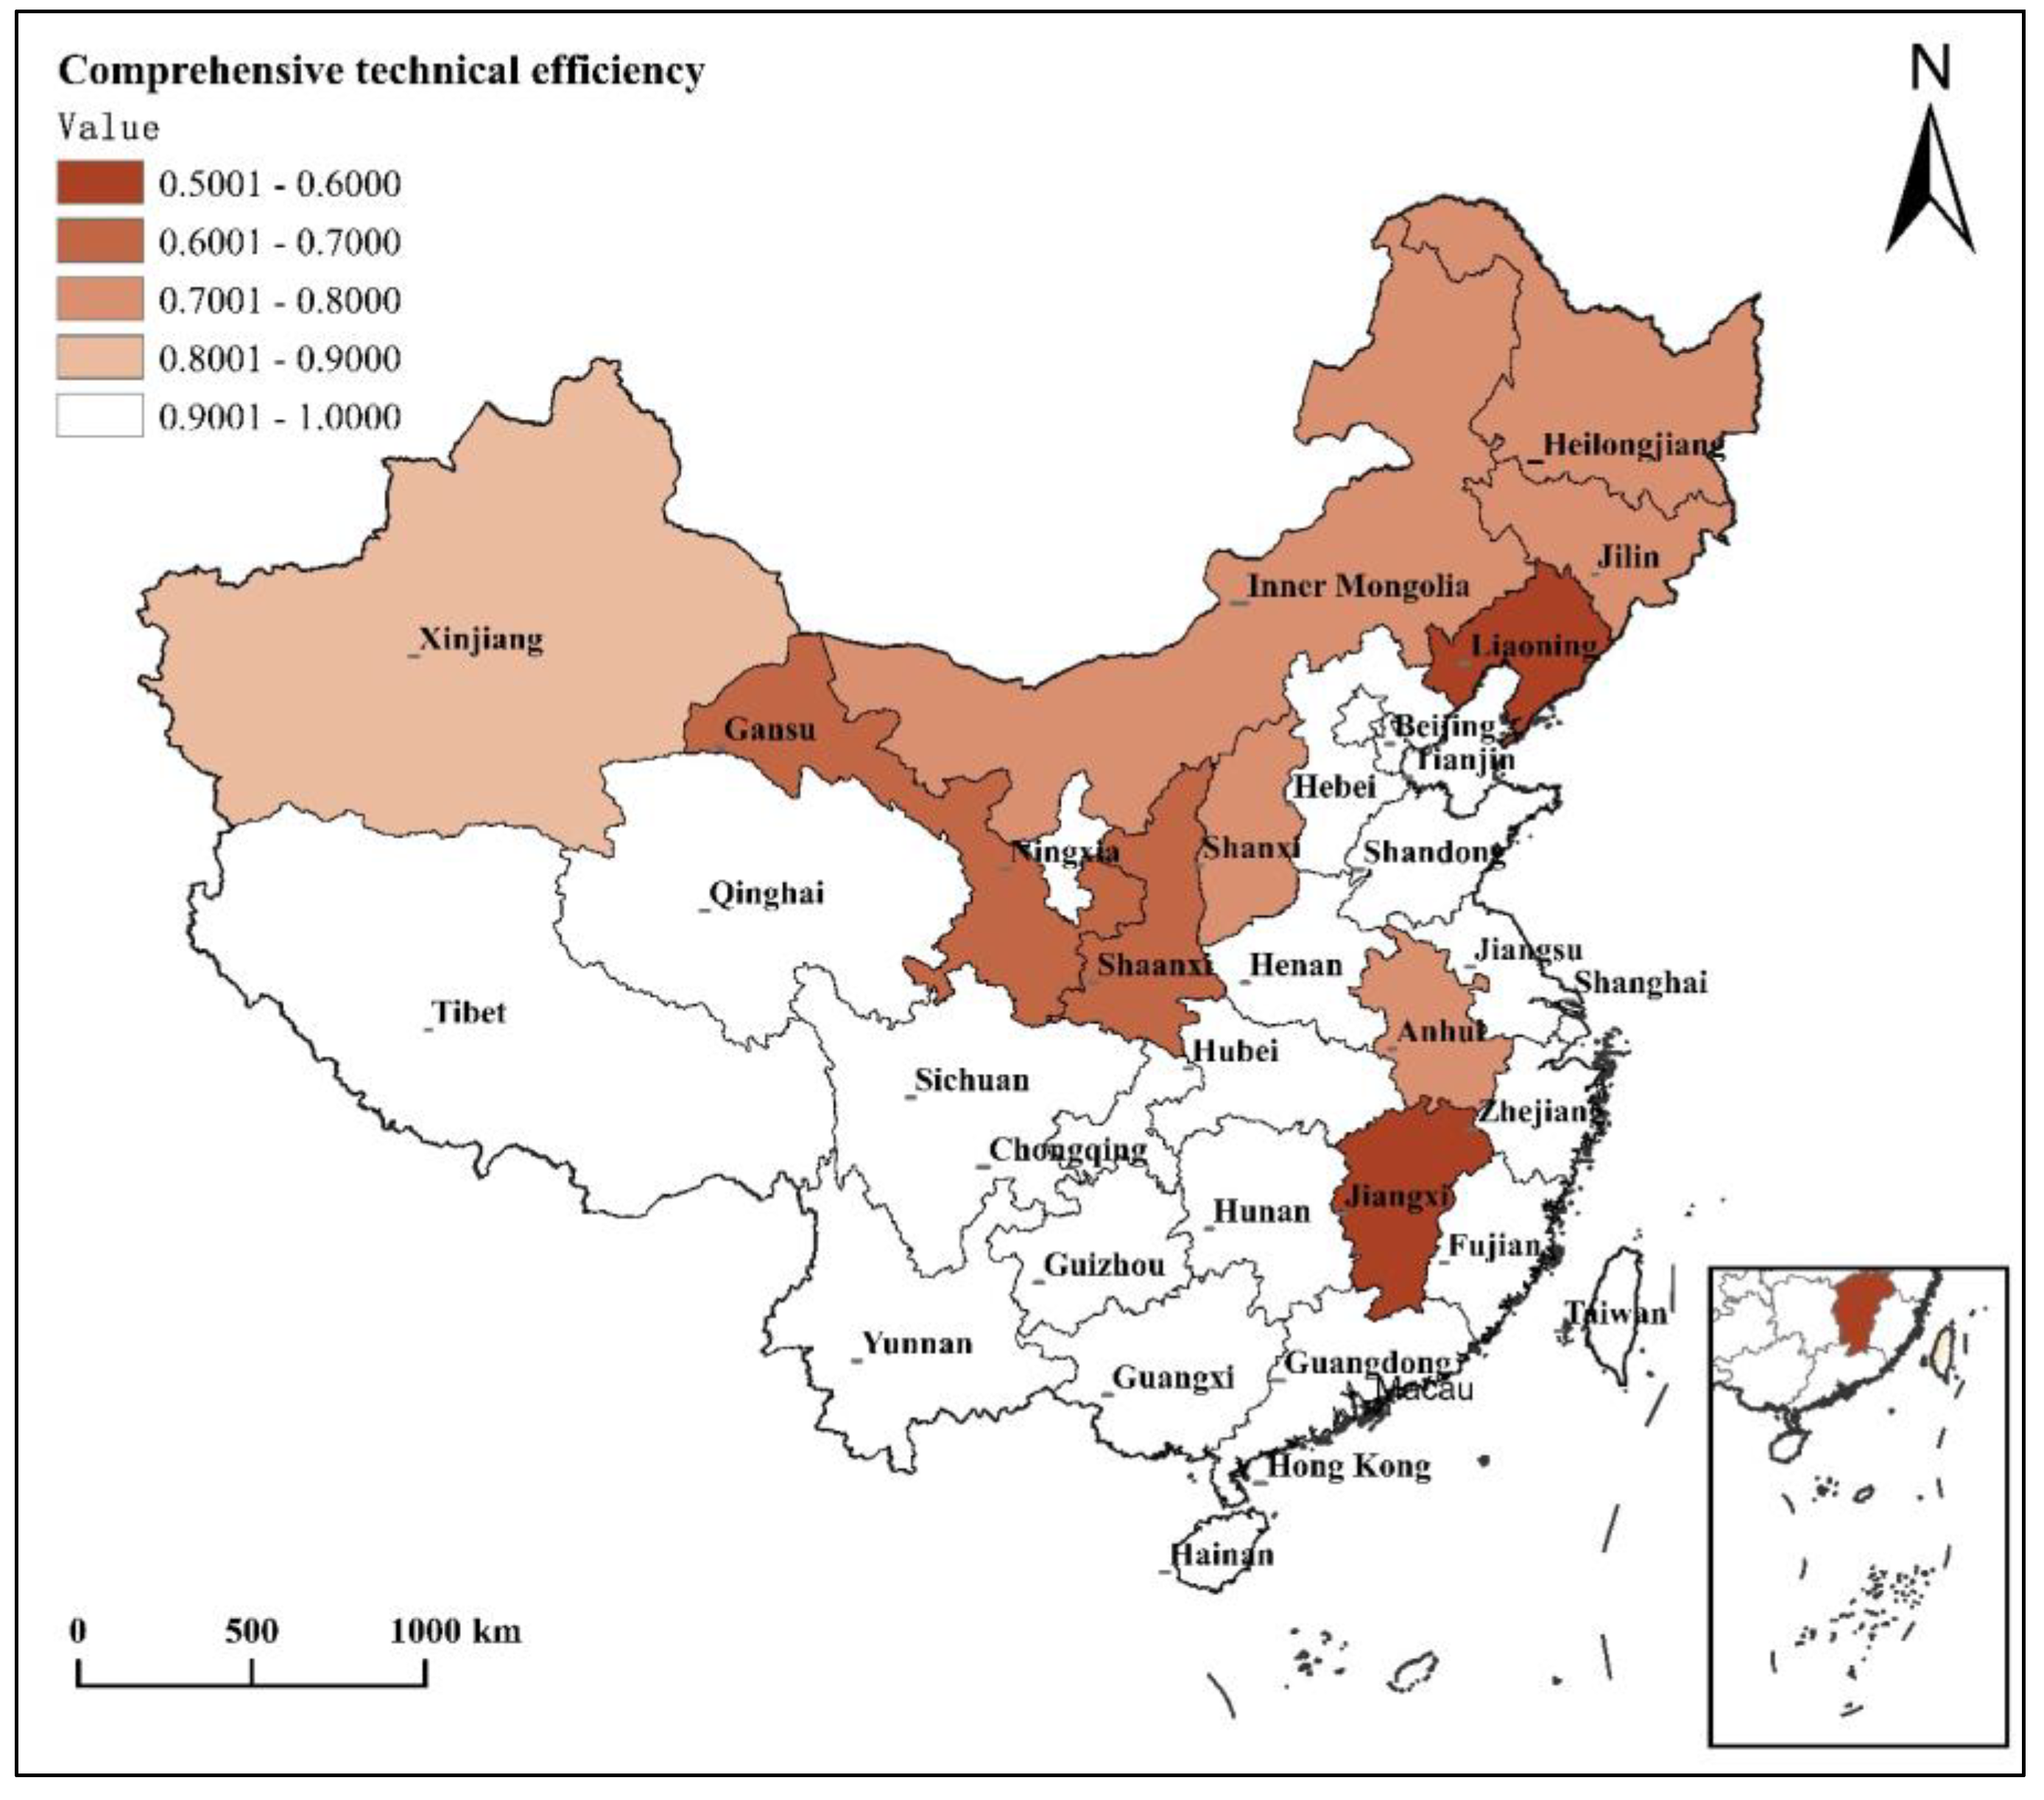
4.3.1. Analysis of Comprehensive Technical Efficiency

On the whole, the average value of the comprehensive technical efficiency (TE) value of NMAIPs is 0.90, which is high but not optimal. Among them, 21 provinces have a comprehensive efficiency value of 1.00, accounting for 67.74%, which indicates that the operation of NMAIPs in these provinces is effective. The other 10 provinces have a technical efficiency value of less than 1, accounting for 42.96%. Among them, as shown in Figure 7, the TE values of Liaoning and Jiangxi are 0.5–0.6; Gansu and Shaanxi are 0.6–0.7; Anhui, Inner Mongolia, Jilin, Shanxi, and Heilongjiang are 0.7–0.8; and the TE value of Xinjiang is higher but less than 0.9.
The distribution of TE values in the NMAIPs has obvious spatial heterogeneity and continuous regular clustering characteristics (Figure 7). In terms of distribution differences, the efficiency values of NMAIPs show an obvious spatial heterogeneity pattern that is high in the south and low in the north. The high-efficiency values are mainly concentrated in the southern provinces, while the low-efficiency values are more frequently distributed in the northern regions, indicating that the resource factors of the southern NMAIPs are reasonably allocated and less wasteful than those of the northern NMAIPs, achieving higher input–output efficiency. In terms of agglomeration areas, the agglomeration of high efficiency is highlighted in the central, southwest, south, and east areas of China, while obvious inefficient agglomeration areas appear in the northeast, north, and northwest, indicating that the NMAIPs present similar development patterns within a certain spatial region, which may be influenced by the same resource endowments and socio-economic development levels in these regions. Among them, the efficiency value of NMAIPs in Anhui and Jiangxi is less than one, which is an outlier province among high-efficiency regions, indicating that the endowment factors of the region are not sufficient to support the development of local NMAIPs; furthermore, there is an outflow of factors favorable to surrounding high-efficiency agglomerations, resulting in low levels of agglomeration factors and technological efficiency. Qinghai and Ningxia have a technical efficiency value of one among the inefficient agglomerations in northwest China, probably because, although they are underdeveloped regions in China, they have excellent agricultural resource endowments and factors, such as capital and land supported by agricultural technology, and policies have been efficiently and fully utilized and developed, hence the high technical efficiency values of the two provinces.

4.3.2. Descriptive Statistics of Input–Output Indicators

China has adopted balanced development strategies in the overall construction of NMAIPs. Table 4 shows that except for total annual tax payment, the values of inputs–outputs in NMAIPs in 31 provinces are relatively concentrated, with modest differences.

4.3.3. Analysis of Non-Effective DMUs

NMAIPs in 10 provinces, namely Shanxi, Inner Mongolia, Liaoning, Jilin, Heilongjiang, Anhui, Jiangxi, Shaanxi, Gansu, and Xinjiang, have inputs redundancy and insufficient outputs, indicating that the input and output factors of the parks in these provinces are unbalanced, which restricts resource utilization and the scale development of NMAIPs. Improvements need to be made to non-effective DMUs in both aspects (Table 5).
According to inputs, the most considerable barriers to the development of the NMAIPs are the ineffective contributions of the townships populations covered, the area occupied, and capital from the collective economy. This shows that the labor force, land, and capital used to drive the development of the NMAIPs are less efficient at the given level of production, while the technological advancements that drive the increase in productivity have not yet been developed. The NMAIPs have failed to absorb a highly qualified labor force, i.e., there is still room for improvement regarding high-quality and full employment. The supply of labor factors in nine provinces is not up to the production frontier. While the issue of ineffective collective economic participation in all non-effective DMUs emerged, making the revitalization of collective assets the key to achieving a reasonable use of capital, the number of leading agricultural industrialization enterprises in Liaoning, Anhui, Jiangxi, and some other provinces in northwest China did not reach effective levels. The main cause of the ineffective DMUs of NMAIPs is the redundancy of occupied areas, showing that excessive and irrational land use restricts the development of parks. In contrast, in areas with abundant land resources (northeast China, Inner Mongolia, and Xinjiang), the rate of comprehensive mechanization has not reached an optimal level, showing that the full exploitation of land factors needs to be matched by appropriate land use.
According to outputs, in view of economic and social outputs, the total output value of the NMAIPs is closely effective, but the average income of village collective enterprises in the park is ineffective, and this is the most important economic representation of the NMAIPs’ development, which means the high output value of NMAIPs cannot fully drive the employment and income of farmers. Additionally, it is further reflected in the insufficient social benefits (the average per capita disposable income of farmers in the county (district) and per capita disposable income of farmers in the park), as well as in the large gap between the total annual tax payments to the production frontier. This shows a lack of contribution to farmers’ wellbeing and social welfare in terms of employment, income, and social drive. Therefore, the development of NMAIPs in these regions has prioritized economic profitability and production values over farmer welfare and social contribution. Regarding ecological benefits, the comprehensive utilization rate of straw in NMAIPs is relatively high, but there is a general lack of ecological output in the NMAIPs in the northwest, most notably in Xinjiang, in which further attention regarding the economical and sustainable use of resources in production and operation is required.

4.3.4. Analysis of Pure Technical Efficiency and Scale Efficiency

There is potential to improve the pure technical efficiency (PTE) and scale efficiency (SE) of the NMAIPs shown in Table 6. Among them, 18 provinces have reached 1.00 in both the PTE and SE values of NMAIPs; 10 provinces have not reached 1.00 in both. The average value of PTE is 0.965, while SE is 0.975.
From the perspective of PTE, the NMAIPs in 21 provinces have double-optimal inputs and outputs, meaning that the utilization of production factors has maximized utility. In the case of 10 provinces, PTE is below 1.00, referring to a purely technically ineffective state, so there is a waste of inputs factors or immature agricultural technology, as well as low production efficiency. From the perspective of SE, the SE value of NMAIPs in 18 provinces is 1.00, with a reasonable scale arrangement and aggregation factors contributing to their scale efficiency. The PTE of parks development in Tianjin, Hebei, and Jiangsu reached 1.00, while the SE did not reach an effective level, suggesting that the number and scale of NMAIPs in the three regions are the most important constraints to their development. Optimal efficiency in the development of the province’s parks can be achieved through the creation of new parks and the expansion of existing ones.

4.3.5. Trend of Return to Scale

A total of 18 provinces (58.06%) are characterized by a constant return to scale (CRS) for NMAIPs, including eastern provinces, such as Beijing, Shanghai, and Zhejiang, and western provinces, such as Yunnan, Tibet, Qinghai, and Ningxia, indicating that NMAIPs in these provinces have reached a state of effective scale. There are seven provinces with increasing returns to scale (IRS) for NMAIPs, indicating that the development of parks in these provinces can appropriately increase the input of land area, technology, and other factors on the basis of existing inputs, so as to improve the scale efficiency of the parks and further increase the outputs of the NMAIPs. There are six provinces with decreasing returns to scale (DRS) for parks, mainly represented by the northeast region, indicating that the parks have too many inputs but ineffective output, and they should improve the scale efficiency by reducing inputs or improving output efficiency (Table 6).
In summary, after their development, the 200 NMAIPs in China achieved a quantitative improvement and created huge economic, social, and ecological benefits. However, the overall comprehensive operational efficiency has not yet reached its optimum. The low utilization factors are the reason for the inefficiency of the PTE of NMAIPs, requiring improvements in the utilization efficiency of land, labor force, and capital, as well as adjustments in the input–output structure. There is a gap between the actual scale of the park and the optimal scale in some provinces, necessitating the adjustment and optimization of the production scale, as well as an increase in the input of scientific and technological resources to convert them into scientific and technological innovation results, promoting technological progress.

5. Discussion

The differences in China’s natural resource endowment and socio-economic conditions require that agricultural activities be carried out in a way that is tailored to local conditions to achieve sustainable regional agricultural development [1,39]. NMAIPs, as national modern agricultural production and management entities, have specific development characteristics and regional differences.
Policies and the implementation of NMAIPs are linked in a macro- and micro-dynamics balance [41]. Policy formulation is a macro dynamic in China, characterized by a top-down approach [42]. NMAIPs follow the guidelines of government guidance and policy support to realize their construction and development. We can find the micro-dynamics at all management levels in planning, coordination, and implementation, from the top to the bottom levels, indicating development characteristics and regional differences to provide a basis for better policies and development.

5.1. Development Characteristics of NMAIPs in China Are at Three Top-Down Levels: National Planning–Provincial Management–County Governance

(1)
At the national planning level, exploring the characteristics of the geospatial distribution of NMAIPs can allow us to analyze the rationality of the planning layout of NMAIPs.
The distribution of NMAIPs is spatially regular and heterogeneous, with the number of NMAIPs being distributed in a decreasing gradient from east to west on both sides of the Hu line. NMAIPs are distributed in the direction of the east (northward) to west (southward). The distribution of NMAIPs is consistent with the Hu line. The main area of distribution is the central and southeastern regions of China, with the southern part of Henan province being the center of the distribution, indicating that the distribution of NMAIPs is related to the distribution of human factors, such as economic and social factors in China. The spatial distribution of NMAIPs shows clustering characteristics, which may be related to the level of regional socio-economic development and natural resource endowment [43].
(2)
At the provincial management level, exploring the NMAIPs’ leading industries can provide a basis for further optimizing the allocation of leading industries in the region.
There is homogeneity in the leading industry category of NMAIPs, which provides problems [4,6]. The HHI index is used to further explore the geographical concentration of the leading industries in each province. The HHI of NMAIP industries in each province ranges from 0.128 to 0.5, with types such as low oligopolistic and highly oligopolistic, indicating that the homogenization of leading industries in NMAIPs exists widely in each province. The main industrial of concentration are husbandry, fruits, and grain. The degree of competition and homogenization of the same industrial categories varies among different regions of NMAIPs. The optimal allocation of leading industries can be achieved by both increasing the number of leading industries in the park and adjusting the structure of industry categories.
(3)
At the county governance level, the agglomeration and efficient use of factor resources is a prerequisite and condition for the further development of NMAIPs, so it is necessary to evaluate the input–output efficiency factors of NMAIPs.
In terms of the spatial disparity, the distribution of the comprehensive technical efficiency values of NMAIPs has obvious characteristics of spatial heterogeneity and regular agglomeration, manifesting as high in the south and low in the north, indicating that the parks show similar development patterns within the same spatial scope. In terms of efficiency levels, the overall technical efficiency of NMAIPs is generally high, but 10 provinces still fall short of the optimum. We consider NMAIPs to be open innovation platforms at the county-implementation level [41]. They combine internal and external factors within the platform and system, but there are redundant input and output deficiencies, such as the population of the covered townships, the occupied area, and the ineffective contribution of collective economic capital in the parks are input factors that limit the development of NMAIPs. As such, attention needs to be paid to the development of the endogenous drivers of NMAIPs, such as human capital and land, to drive large-scale operations by technological means. The average income of the village collective economy, the total annual tax payment, the average per capita disposable income of farmers in the county (district) where the park is located, and the per capita disposable income of farmers in the park are the main indices of output deficiency, reflecting the deficiency of the farmer-driven role of NMAIPs, which is somewhat in line with the findings of Liu Zixuan et al. [18]. Additionally, there are 18 provinces where both the PTE and SE values of NMAIPs are effective. The ineffective provinces need to improve by enhancing their agricultural production technology or expanding the scale of their NMAIPs. Regarding the trend of return to scale, there are a total of 18 provinces with constant returns to scale in the NMAIPs, six provinces with decreasing returns to scale due to the inefficiency of unreasonable input factors, and seven provinces with increasing returns to scale due to underutilization of input factors.
Therefore, there is an imbalance between the “quantity” of production factor inputs and the “quality” of benefits and outputs [44]. It is necessary to properly coordinate the ratio of various input factors, adjust the input–output structure, and develop and utilize factor resources. At the same time, it is also necessary to gather scientific and technological innovation resources to increase the transformation of technological achievements in the NMAIPs to promote technological progress and convert scientific and technological resource inputs into scientific and technological innovation. NMAIPs need to increase their marginal output of endogenous input factors, such as land and labor, and continuously improve agricultural production efficiency.

5.2. The Following Policy Recommendations Are Proposed to Promote and Enhance the Capacity of Sustainable and High-Quality Development of NMAIPs

NMAIPs take on national agricultural development strategies by planning the national spatial arrangements and promoting the realization of coordinated development through the optimal allocation of leading industries. Implemented at the county level, the rationalization of inputs and outputs promotes technological progress and open innovation. NMAIPs as a hierarchical system are aligned to three levels simultaneously to focus on different aspects of NMAIPs’ development. Administrative departments should establish a positive interaction mechanism between multiple management levels of national guidance–provincial coordination–county implementation, to realize close links between departments at various levels, and promote the construction of a scientific, rational, and efficient institutional mechanism for NMAIPs management. Based on the results of the study on the development characteristics and regional differences of NMAIPs, the following policy recommendations are made.
(1)
National Administrative departments should optimize the interactive mechanisms of multi-level management and enhance the capacity for balanced regional development.
The national government should plan the spatial layout of NMAIPs nationwide to promote their sustainable development. Governments at higher levels must have a holistic vision and pay attention to local conditions and regional coordination [45]. Planning authorities need to take into account the actual agricultural development in different regions, conduct sufficient investigations into the resource conditions and industrial base of each region, and use this as the basis for planning the spatial layout of NMAIPs, such as actively promoting the development of NMAIPs in western China and encouraging local governments and enterprises to revitalize local resource endowments. In response to the unbalanced development of NMAIPs in various provinces, higher levels of government should formulate special programs for provinces with inefficient NMAIPs to promote technological progress and production efficiency through central financial subsidies.
(2)
Provincial authorities should cultivate and coordinate the leading industries in the NMAIPs to enhance the diversified development of regional industries.
The authorities in charge of NMAIPs in each province should attach importance to growing various categories of leading industries in NMAIPs, making better and stronger leading industries, and cultivating diversified rural industrial growth poles in the region. In view of the problems of serious homogenization and the lack of distinctive characteristics in the development of NMAIPs, improvements should be made in four areas.
In terms of exploiting leading industries, the endowed resources in the region should be fully explored to optimize the layout of the agricultural industry. The industrial structure should be adjusted, and the relationship between leading industries in each park should be coordinated to promote the formation of a clear and complementary division and industrial pattern [46]. In terms of bringing the multi-functionality of agriculture into play, the NMAIPs should clarify the role and functions of the leading industries. In addition to ensuring national food security and the effective supply of important agricultural products, it is also necessary to fully explore the contents of the agricultural industries and taking into account the interests of society and consumer demand, create special agricultural products with diversified industries, improve the competitive advantages of agricultural products, and exert brand effects [25]. In terms of the key and weak areas of development of the leading industries, the government should co-ordinate the construction of the whole industrial chain and extend the downstream industrial chain, promoting the transformation and upgrading of industries to realize the meticulous professional production of agricultural products and improve the value of agricultural products [47]. In terms of industrial construction agents, the management departments of NMAIPs should absorb and cultivate new agricultural business agents to promote the circular accumulation of value-added agricultural products in leading industries.
(3)
County governments should maximize the inputs–outputs efficiency of factor allocation and resource utilization to encourage the advancement of production technology in NMAIPs.
County-level agricultural management departments and the management entities of NMAIPs should strengthen financial and technical support, actively cultivating county resources to reasonably allocate supply factors and attract modern factors into NMAIPs.
First, NMAIPs should prioritize endogenous input factors and absorb skilled laborers to encourage the movement of human capital and support the development of open business entities [48]. NMAIPs need to direct more of the park’s profits toward farmers’ welfare and improve their wage and operational income by means of technological and operational management and institutional innovation. Second, to address the need for new technologies, local governments should look into local labor to enhance workforce quality through technical training and technology promotion, as well as incorporating outside advanced productivity. To ensure technical improvements in the agriculture industry, we should prioritize internal R&D and innovation cooperation, including giving collaboration and exchange between firms, universities, and public scientific organizations appropriate consideration [49,50]. Third, governments at all levels, as well as the entities in charge of NMAIPs, should rationalize the use of land resources and enlarge the sources of financing for the collective economy and social capital. Additionally, the intensity of production and production efficiency should be maximized through mechanization and automation. Fourth, the management of NMAIPs should increase congruence and continuous circulation and flow of inputs and outputs among stakeholders, including farmers, leading agricultural industrialization enterprises, and collective enterprises [25]. Finally, to ensure environmental protection and sustainable resource use, governments and entities should set up a long-term framework for green, low-carbon, and circular agricultural growth. Furthermore, they should focus on the efficiency of inputting scientific and technological resources to increase the contribution of technology and maximize the scale of output while also actively establishing and moderating a variety of scale enterprises.

5.3. Prospects and Limitations

The results of this study have important implications for the construction and high-quality development of national modern agricultural industrial parks (NMAIPs), but there is still potential for further research. First, this study focuses on the spatial distribution, industrial concentration, and input–output efficiency development characteristics and regional differences of the NMAIPs in a specific year (2021) without exploring the NMAIPs from a time series perspective. Second, this study infers that the natural resource endowments and socio-economic conditions of different regions are the main reasons for the differences in the developmental characteristics of NMAIPs, but the specific drivers and mechanisms of action still require continuous attention and extensive data collection to obtain more systematic and in-depth quantitative information on NMAIPs. In addition, NMAIPs are nationally led, provincially coordinated, and implemented at the county level, and the development characteristics show some similarities [40]. Regarding industrial structure, it is necessary to perform the same type of analysis with specific subsets of NMAIPs based on the types of leading industries or by HHI classification as further study. Finally, the discussion of different interest groups in this study is insufficient. The development of NMAIPs involves various factors, such as government, social capital, and farmers, and different stakeholders interact with each other to pursue optimal strategies, resulting in different ways of cooperation. This study focuses on the supply side of the development of NMAIPs, which are also a kind of supply-driven production and business entity. However, as NMAIPs develop, society and consumer demand should be considered [51].

6. Conclusions

This study of the development characteristics and differences of NMAIPs is of great significance to the construction and development of NMAIPs. Based on the spatial scales and management levels of the nation, provinces, and counties, this study uses spatial analysis (SDE and KDE), HHI, and SBM-DEA to analyze the spatial distribution, industrial concentration, and input–output efficiency factors of NMAIPs to summarize development characteristics and regional differences of NMAIPs from the muti-level perspective of national planning–provincial coordination–county implementation to propose policy recommendations aimed at sustainable and high-quality development. Our conclusions in this study are as follows: (1) In terms of the spatial distribution at the national planning level, NMAIPs have regular and heterogeneous geospatial distribution characteristics that show uneven and agglomeration distribution. The Hu line is the boundary, with NMAIP clustering characterized by a decreasing gradient from east to west and a direction from east (northward) to west (southward). Four high-density regional agglomerations are distributed in regions with high socio-economic development levels in China; however, NMAIPs also cluster in regions that are economically underdeveloped but rich in agricultural natural resource endowments. (2) In terms of industrial concentration at the provincial coordination level, the development of leading NMAIP industries has a certain homogenous tendency. In some provinces, the leading industries manifest a high HHI, which is not conducive to the diversified and branded development of agricultural products in NMAIPs in the region. (3) In terms of inputs–outputs efficiency within NMAIPs at the county implementation level, the distribution of the comprehensive technical efficiency values of the NMAIPs has obvious spatial heterogeneity and a continuous pattern of agglomeration that is high in the south and low in the north. The comprehensive technical efficiency is high but not optimal, mainly due to unreasonable inputs factor and inadequate efficiency, indicating the ineffective contribution of the township population, the area occupied, and capital from the collective economy, which are the development barriers. The total output value of the NMAIPs is closely effective, but the average income of village collective enterprises is ineffective. The insufficient social benefits mean the high output values of NMAIPs cannot fully drive the employment, income of farmers, and social welfare. This needs to be improved in terms of both pure technical and scale efficiency. An adjustment-to-scale operation of NMAIPs needs to be selected in response to different returns to scale.
The following policy recommendations are proposed to promote and enhance the sustainable and high-quality development of the NMAIPs:(1) National Administrative departments should optimize the interactive mechanism of multi-level management and enhance the capacity for balanced regional development. (2) Provincial authorities should cultivate and coordinate the leading industries in the NMAIPs to enhance the diversified development of regional industries. (3) County governments should maximize the inputs–outputs efficiency of allocation and resource utilization factors to encourage the advancement of production technology in NMAIPs.

Author Contributions

Conceptualization, X.C.; methodology, L.L.; software, L.L.; validation, S.L. and L.L.; formal analysis, L.L.; investigation, L.L.; resources, X.C. and Y.W.; data curation, L.L.; writing—original draft preparation, L.L., S.L. and J.W.; writing—review and editing, S.L., X.C. and Q.Z.; visualization, L.L.; supervision, Y.W.; project administration, X.C. All authors have read and agreed to the published version of the manuscript.

Funding

This research was funded by the National Natural Science Foundation project “Study on influencing mechanism and optimization regulation of Cultivated Land Fragmentation on Technical Efficiency of Grain Production in Fen-Wei Plain” (grant No. 42271285) and Technology Innovation Project of CAAS “Theories and Methods of Rural Planning” (grant No. ASTIP-IAED-2023-07).

Data Availability Statement

The data of 200 NMAIPs in China came from http://api.map.baidu.com/lbsapi/getpoint/ (accessed on 16 October 2022), the National Modern Agriculture Industrial Parks Construction Leading Group Office, National Bureau of statistics of the People’s Republic of China http://www.stats.gov.cn/tjsj/ (accessed on 16 October 2022), China County Statistical Yearbook (township) (2021), and the Statistics Bureau of each county.

Acknowledgments

I would like to express our gratitude to all those who helped us while writing this article.

Conflicts of Interest

The authors declare no conflict of interest.

References

  1. Yang, Z.L. Centennial exploration, theoretical connotation and future way of Chinese-style agricultural modernization. Economist 2021, 12, 117–124. [Google Scholar] [CrossRef]
  2. Liu, M.Y.; Feng, X.L.; Leng, G.X.; Qiu, H.G. From poverty-alleviation-based industry development to thriving business: Constraint factors and mode selection. Issues Agric. Econ. 2021, 10, 51–63. [Google Scholar] [CrossRef]
  3. An, X.M. The strategic orientation, realistic predicament and countermeasures for rural industry revitalization at new era. West Forum 2020, 30, 38–47. [Google Scholar] [CrossRef]
  4. Guo, Y.Y.; Yang, J.D.; Cao, B. The evolution course, characteristics, problems and countermeasures of china’s rural industrial structure since the founding of new China. Issues Agric. Econ. 2019, 10, 24–35. [Google Scholar] [CrossRef]
  5. Xiao, Q.; Luo, Q.Y. Construction status, problems and countermeasures of national modern agricultural industrial park. Chin. J. Agric. Resour. Reg. Plan. 2019, 40, 57–62. (In Chinese) [Google Scholar]
  6. Jiang, L.; Jiang, H.P.; Jiang, H. New ideas and measures to promote the development of national modern agricultural industrial park during the 14th five-year plan period. Reform 2021, 12, 106–115. (In Chinese) [Google Scholar]
  7. National Modern Agriculture Industrial Parks Construction Leading Group Office. National Modern Agriculture Industrial Parks Construction Leading Group, National Modern Agriculture Industrial Park Development Report (2021); National Modern Agriculture Industrial Parks Construction Leading Group Office: Beijing, China, 2022; pp. 2–5. [Google Scholar]
  8. Veldkamp, A.; Van Altvorst, A.C.; Eweg, R.; Jacobsen, E.; Van Kleef, A.; Van Latesteijn, H.; Mager, S.; Mommaas, H.; Smeets, P.J.A.M.; Spaans, L.; et al. Triggering transitions towards sustainable development of the Dutch agricultural sector: TransForum’s approach. Agron. Sustain. Dev. 2009, 29, 87–96. [Google Scholar] [CrossRef] [Green Version]
  9. Moratalla, A.Z.; Paul, V. What is an Agricultural Park? Observations from the Spanish Experience. Land Use Policy 2022, 10, 112. [Google Scholar] [CrossRef]
  10. SAGE, B. Urban edge agricultural parks toolkit. Berkeley 2005, 12, 137. [Google Scholar]
  11. Yun, K.; Wu, S.; Zhang, C.Y. Development process, distribution characteristics and experience of agricultural science and technology parks in Shandong province. Sci. Technol. Manag. Res. 2021, 41, 62–69. (In Chinese) [Google Scholar]
  12. Spagnoli, L.; Mundula, L. Between Urban and Rural: Is Agricultural Parks a Governance Tool for Developing Tourism in the Periurban Areas? Reflections on Two Italian Cases. Sustainability 2021, 13, 8108. [Google Scholar] [CrossRef]
  13. Smeets, P.J. Expedition Agroparks: Research by Design into Sustainable Development and Agriculture in the Network Society; Wageningen Academic Publisher: Wageningen, The Netherlands, 2011; 319p. [Google Scholar]
  14. Mao, W.; Zheng, F.T. Research on the application of power analytic hierarchy process in ecological agriculture park project construction planning. In Proceedings of the International Conference on Construction and Real Estate Management, Orlando, FL, USA, 23–24 September 2006; China Architecture & Building Press: Beijing, China, 2006. [Google Scholar]
  15. Ge, L.; Galen, M.V.; Assendonk, M.V.; Verstegen, J. Nature of agroparks: Synergy versus risk. Agribus. Int. J. 2011, 27, 509–523. [Google Scholar] [CrossRef] [Green Version]
  16. Wu, S. Research on Government Collaboration Mechanism in the Construction of National Agricultural Science and Technology Park. Ph.D. Thesis, Chinese Academy of Agricultural Sciences, Beijing, China, 16 December 2021. [Google Scholar] [CrossRef]
  17. Zhao, H.Y.; Yan, K.; Liu, Z.N. Research on the level of integrated development of modern agricultural industrial park—Empirical analysis based on 8 parks in Beijing. J. Agric. Resour. Reg. Plan. 2022, 43, 119–129. [Google Scholar] [CrossRef]
  18. Liu, Z.X.; Li, G.J.; Luo, Q.Y. Research on the level of regional differences of farmers driven in modern agricultural industrial parks—Empirical analysis based on 114 parks. China J. Agric. Resour. Reg. Plan. 2022, 1–13. Available online: https://kns.cnki.net/kcms/detail/11.3513.s.20220817.1549.002.html (accessed on 22 December 2022).
  19. Cui, Y.W. Study on the competitiveness of National Modern Agricultural Industrial Park. Agric. Econ. 2021, 02, 16–18. (In Chinese) [Google Scholar]
  20. Wang, W.; Lv, J.; Yang, X.W. Research on construction mode and key technology of modern agricultural industrial park. J. Chin. Agric. Mech. 2020, 41, 210–216. [Google Scholar] [CrossRef]
  21. Li, H.P.; Zhang, X.X. Exploring the interest linkage mechanism of modern agricultural industrial park from the perspective of farmers. Agric. Econ. 2019, 07, 119–126. (In Chinese) [Google Scholar]
  22. Hu, D.D.; Li, Q. Analysis of growers′ decision-making behaviour in participating in “insurance + futures” from the perspective of perceived value theory-a case study of a pilot zone of red dates in the national modern agricultural industrial park. Resour. Dev. Mark. 2021, 37, 1092–1098. [Google Scholar] [CrossRef]
  23. Zhang, T.Z.; Zhan, J.Z.; Zhou, L. Research on the contract selection between farmers and cooperatives in modern agricultural industrial park. J. Chin. Agric. Mech. 2022, 43, 185–195. [Google Scholar] [CrossRef]
  24. Mei, C.; Chen, F. Detection of spatial heterogeneity based on spatial autoregressive varying coefficient models. Spat. Stat. 2022, 51, 100666. [Google Scholar] [CrossRef]
  25. Elias, G.C.; David, F.J. ‘Mode 3’ and ‘Quadruple Helix’: Toward a 21st century fractal innovation ecosystem. Int. J. Technol. Manag. 2009, 46, 201–234. [Google Scholar]
  26. Chesbrough, H. Open Innovation: Where We’ve Been and Where We’re Going. Res.-Technol. Manag. 2012, 55, 20–27. [Google Scholar] [CrossRef]
  27. Fischer, M.M.; Getis, A. Handbook of Applied Spatial Analysis: Software Tools, Methods and Applications, 3rd ed.; Getis, A., Ed.; Springer: Berlin/Heidelberg, Germany, 2010; pp. 43–52. [Google Scholar]
  28. Zhao, L.; Zhao, Z.Q. Study on Economic Space Classification of China Based on Characteristic Ellipse. Sci. Geogr. Sin. 2014, 34, 980–985. [Google Scholar] [CrossRef]
  29. Long, N.V.; Soubeyran, A.J. Cost heterogeneity industry concentration and strategic trade policies. J. Int. Econ. 1997, 43, 207–220. [Google Scholar] [CrossRef]
  30. Aiginger, K.; Pfaffermayr, M. The single market and geography concentration in Europe. Rev. Int. Econ. 2004, 12, 1–15. [Google Scholar] [CrossRef]
  31. Wei, H.H. Concentration status quo of manufacturing and international comparison in China. China Ind. Econ. 2002, 1, 41–49. [Google Scholar]
  32. Wei, H.K. Market Competition, Economic Performance and Industrial Concentration: An Empirical Study of Manufacturing Concentration and Market Structure in China. Ph.D. Thesis, University of Chinese Academy of Social Sciences, Beijing, China, 14 May 2001. [Google Scholar]
  33. Cooper, W.W.; Seiford, L.M.; Tone, K. Data Envelopment Analysis, 2nd ed.; Kluwer Academic Publishers: Boston, MA, USA, 2007; pp. 367–380. [Google Scholar]
  34. Tone, K. A Slacks-based Measure of Efficiency in Data Envelopment analysis. Eur. J. Oper. Res. 2001, 130, 498–509. [Google Scholar] [CrossRef] [Green Version]
  35. Jiang, X.; Zhang, X.Q. Analysis on the evolution characteristics and influencing mechanism of economic spatial pattern in the area east of Hu Huanyong line. J. Nat. Sci. Hunan Norm. Univ. 2021, 44, 17–25. (In Chinese) [Google Scholar]
  36. Lu, Y.L.; Xu, S.S.; Shen, L. The dynamic evolution of water resources environmental carrying capacity in the Yangtze River Economic Belt based on the fluctuation of Hu Line. J. Nat. Resour. 2021, 36, 2811–2824. [Google Scholar] [CrossRef]
  37. Niu, H.; Wu, X.; Cheng, H.X. Evaluation and comparative study on high-quality agricultural development level of cities along the lower yellow river. J. Agric. Resour. Reg. Plan. 2022, 43, 19–29. (In Chinese) [Google Scholar]
  38. Liu, H. Study on the Regional Differences of Rural Development in China. Geogr. Geo-Inf. Sci. 2002, 4, 71–75. (In Chinese) [Google Scholar]
  39. Liu, Q.C.; Wang, Z. Research on geographical elements of economic difference in China. Geogr. Res. 2009, 28, 430–440. (In Chinese) [Google Scholar]
  40. Wang, Z.W.; Wang, W.X.; Yu, L.H.; Zhang, D.L. Multidimensional poverty alleviation effect of different rural land consolidation models: A case study of Hubei and Guizhou, China. Land Use Policy 2022, 123, 106399. [Google Scholar] [CrossRef]
  41. Yun, J.J.; Liu, Z. Micro- and Macro-Dynamics of Open Innovation with a Quadruple-Helix Model. Sustainability 2019, 11, 3301. [Google Scholar] [CrossRef] [Green Version]
  42. Yang, Z.J. China’s top-down policy change and its nature under the policy structure of “unification-general-implementation”. Chin. Public Adm. 2022, 5, 81–88. [Google Scholar]
  43. Zou, L.L.; Zhang, L.J.; Liang, Y.F.; Wen, Q. Scientific cognition and research framework of territorial space function in the New Era. J. Nat. Resour. 2022, 37, 60–69. [Google Scholar] [CrossRef]
  44. Ma, K.W. Value-added tax reduction, economic output and income distribution—Based on the analysis of the connection model of input-output and national income flows. J. Shanxi Univ. Financ. Econ. 2021, 43, 29–39. [Google Scholar]
  45. Milan, M.; Lucia, B.; Jana, N.; Peter, D.; Marcela, M. Sustainable Resource Management Modern Approaches and Contexts; Elsevier: Amsterdam, The Netherlands, 2021; pp. 221–240. [Google Scholar]
  46. Zhang, Z.; Wang, Y.X. The Stickiness and Optimization of Agricultural Industrial Structure in China. Soc. Sci. J. 2022, 1, 158–166. [Google Scholar]
  47. Shapiro, C. Consumer information, product quality, and seller reputation. Bell J. Econ. 1982, 13, 20–35. [Google Scholar] [CrossRef]
  48. Obiwulu, S.U.; Yunus, E.M.; Ibrahim, F.; Zuruzi, A.S. Sustaining Innovation: Creativity among Employees of Small and Medium-Sized Enterprises and Students in Higher Education Institutions in Brunei Darussalam. J. Open Innov. Technol. Mark. Complex. 2019, 5, 25. [Google Scholar] [CrossRef] [Green Version]
  49. Perkmann, M.; Walsh, K. University–industry relationships and open innovation: Towards a research agenda. Int. J. Manag. Rev. 2007, 9, 259–280. [Google Scholar] [CrossRef]
  50. Yoo, J.; Kim, J. The Effects of Entrepreneurial Orientation and Environmental Uncertainty on Korean Technology Firms’ R&D Investment. J. Open Innov. Technol. Mark. Complex. 2019, 5, 29. [Google Scholar]
  51. Xie, Y.; Qi, C. Supply and Demand Adaptation of “Vegetable Basket” Products: Mechanism, Effect and Governance Path. Issues Agric. Econ. 2021, 12, 55–68. [Google Scholar]
Figure 1. Framework and mechanisms for sustainable and high-quality development of National Modern Agricultural Industrial Parks (NMAIPs).
Agronomy 13 00653 g001
Figure 2. Map of geospatial distribution of National Modern Agricultural Industrial Parks (NMAIPs) in China (2021).
Agronomy 13 00653 g002
Figure 3. Percent share of leading industrial categories of National Modern Agricultural Industrial Parks (NMAIPs).
Agronomy 13 00653 g003
Figure 4. Regional differences in Herfindahl–Hirschman Indices (HHIs) in four regions in China. Note: Central Region: Shanxi, Henan, Anhui, Hubei, Jiangxi, and Hunan; Eastern Region: Hebei, Beijing, Tianjin, Shandong, Jiangsu, Shanghai, Zhejiang, Fujian, Guangdong, and Hainan; Northeast Region: Heilongjiang, Jilin, and Liaoning; Western Region: Chongqing, Sichuan, Shaanxi, Yunnan, Guizhou, Guangxi, Gansu, Qinghai, Ningxia, Tibet, Xinjiang, and Inner Mongolia.
Agronomy 13 00653 g004
Figure 5. Three intervals of Herfindahl–Hirschman indices (HHIs) and the number of top three leading industry categories in each province.
Agronomy 13 00653 g005
Figure 6. Provinces in China with above-average Herfindahl–Hirschman Indices (HHIs) above the overall mean of 0.262: HHIs and number of leading industries by province.
Agronomy 13 00653 g006
Figure 7. Technical efficiency values in provincial regions.
Agronomy 13 00653 g007
Table 1. Data types and sources.
Data TypesData NamesData Sources
Geospatial dataLongitude and latitude data of each NMAIPhttp://api.map.baidu.com/lbsapi/getpoint/ (accessed on 16 October 2022)
Economic statistics and survey dataCategories of leading industries of NMAIPs
Input factors
Output values
National Modern Agriculture Industrial Park Development Report (2021)
China Rural Statistical Year book (2021)
China County Statistical Year book (township) (2021)
Agricultural plate of each county statistical yearbook
Table 2. Houkai’s Herfindahl–Hirschman index (HHI) classification intervals.
HHI IntervalHoukai’s HHI Classification
[0.18, 1)Highly oligopolistic
[0.10, 0.18)Low oligopolistic
[0.05, 0.10)Low concentration of competition
[0.02, 0.05)Dispersed competition
[0.01, 0.02)Highly dispersed
[0, 0.001)Extreme dispersion
Table 3. The input–output indices and description of NMAIPs.
IndexSecondary IndexSpecific IndexCodeDescription
InputLabor forcePopulation of townships covered (10,000 people)X1Farmers directly or indirectly involved in agricultural activities in the park
LandOccupied area (km2)X2Spatial scale and scope of land use
CapitalNumber of leading agricultural industrialization enterprises in the park (number)X3Social capital input
Number of administrative villages adopting quantified shares of collective assets (number)X4Collective assets
TechnologyComprehensive mechanization rate (%)X5Comprehensive mechanization rate = machine tillage rate ∗ 0.4 + machine sowing rate ∗ 0.3 + machine harvest rate ∗ 0.3
OutputEconomic benefitAverage income of village collective enterprises in the park (CNY 10 thousand)Y1Level of management of NMAIPs’ collective entities
Total output value (CNY 100 million)Y2The overall level of economic yield
Social benefitTotal annual tax payment (CNY 10 thousand)Y3Contribution of NMAIPs to social welfare.
Average per capita disposable income of farmers in the county (district) (CNY 10 thousand)Y4Spillover impact of NMAIPs on the wellbeing of the county
Per capita disposable income of farmers in the park (CNY 10 thousand)Y5Employment and income effects of farmers’ interests
Ecological benefitComprehensive utilization rate of straw (%)Y6Utilizing agricultural resources in a cycling and sustainable way
Table 4. Descriptive statistics of input–output factor indices.
X1X2X3X4X5Y1Y2Y3Y4Y5Y6
Max25.66372.9021.0077.710.98244.58147.4156772.404.135.7099.62
Min3.2619.331.6710.140.466.9625.26788.321.311.8665.59
Average13.7290.999.3434.160.7449.6676.3315183.292.062.8390.83
SD6.0975.224.7718.220.1455.3631.2114196.400.610.827.77
Note: X1 is the population of townships covered; X2 is the occupied area; X3 is the number of leading agricultural industrialization enterprises in the park; X4 is the number of administrative villages adopting quantified shares of collective assets; X5 is the comprehensive mechanization rate; Y1 is the average income of village collective enterprises in the park; Y2 is total output value; Y3 is total annual tax payment; Y4 is average per capita disposable income of farmers in county (district); Y5 is per capita disposable income of farmers in the park; Y6 is the comprehensive utilization rate of straw.
Table 5. Adjustments for non-effective DMUs by eliminating slack from the production frontier.
Index Reduction   in   Input   Indices   s Increase   in   Output   Indices   s +
DMU X1X2X3X4X5Y1Y2Y3Y4Y5Y6
Shanxi38.2524.760.0066.040.00567.734.84219.83152.63152.130.00
Inner Mongolia26.9358.980.0013.8123.81101.3010.14104.0847.4815.650.00
Liaoning65.2939.5239.0063.1215.58999.900.00236.4556.3739.243.63
Jilin23.8019.340.0059.5723.05672.010.494.52158.22113.700.69
Heilongjiang36.8663.830.0022.3422.18265.0428.76239.0779.9484.630.00
Anhui37.0327.795.5435.2612.55451.162.64222.16110.61115.122.82
Jiangxi52.9964.3631.7066.580.00626.630.00191.8485.1082.050.26
Shaanxi37.5085.8723.3241.460.00754.587.65999.90161.43164.853.27
Gansu18.0733.6659.9871.210.00999.9073.53112.08109.74116.833.47
Xinjiang0.0033.819.9114.9817.43323.239.88667.1163.3166.5632.35
Note: s denotes redundancy of inputs; s + denotes a shortfall in outputs.
Table 6. Technical efficiency, decomposition, and returns to scale of each decision-making unit (DMU).
DMUTEPTESEReturns to ScaleDMUTEPTESEReturns to Scale
Zhejiang111CRSGuizhou111CRS
Yunnan111CRSGuangxi111CRS
Tibet111CRSGuangdong111CRS
Tianjin110.7352DRSFujian111CRS
Sichuan111CRSChongqing111CRS
Shanghai111CRSBeijing111CRS
Shandong111CRSXinjiang0.84770.93760.821IRS
Qinghai111CRSAnhui0.76370.89340.9795IRS
Ningxia111CRSInner Mongolia0.7530.92660.9358DRS
Jiangsu110.9179DRSJilin0.74850.83680.9758IRS
Hunan111CRSShanxi0.74190.95050.9888IRS
Hubei111CRSHeilongjiang0.70960.92540.9584DRS
Henan111CRSGansu0.63420.92480.9877IRS
Hebei110.9851DRSShaanxi0.62370.89150.9999IRS
Hainan111CRSJiangxi0.56870.87300.9575DRS
Liaoning0.5550.75240.9859IRS
Disclaimer/Publisher’s Note: The statements, opinions and data contained in all publications are solely those of the individual author(s) and contributor(s) and not of MDPI and/or the editor(s). MDPI and/or the editor(s) disclaim responsibility for any injury to people or property resulting from any ideas, methods, instructions or products referred to in the content.

