Article

Estimating the Reduction in Cover Crop Vitality Followed by Pelargonic Acid Application Using Drone Imagery

1
Faculty of Agricultural and Environmental Sciences, Crop Health, University of Rostock, Satower Straße 48, 18051 Rostock, Germany
2
Faculty of Agricultural and Environmental Sciences Geodesy and Geoinformatics, University of Rostock, Justus von Liebig Weg 6, 18051 Rostock, Germany
*
Author to whom correspondence should be addressed.
Agronomy 2023, 13(2), 354; https://doi.org/10.3390/agronomy13020354
Submission received: 11 December 2022 / Revised: 20 January 2023 / Accepted: 23 January 2023 / Published: 26 January 2023

Abstract

:
Cultivation of cover crops is a valuable practice in sustainable agriculture. In cover crop management, the method of desiccation is an important consideration, and one widely used method for this is the application of glyphosate. With use of glyphosate likely to be banned soon in Europe, the purpose of this study was to evaluate the herbicidal effect of pelargonic acid (PA) as a bio-based substitute for glyphosate. This study presents the results of a two-year field experiment (2019 and 2021) conducted in northeast Germany. The experimental setup included an untreated control, three different dosages (16, 8, and 5 L/ha) of PA, and the active ingredients glyphosate and pyraflufen. A completely randomised block design was established. The effect of the herbicide treatments was assessed by a visual estimate of the percentage of crop vitality and a comparison assessment provided by an Ebee+ drone. Four vegetation indices (VIs) calculated from the drone images were used to verify the credibility of colour (RGB)-based and near-infrared (NIR)-based vegetation indices. The results of both types of assessment indicated that pelargonic acid was reasonably effective in controlling cover crops within a week of application. In both experimental years, the PA (16 L/ha) and PA_2T (double application of 8 L/ha) treatments demonstrated their highest herbicidal effect for up to seven days after application. PA (16 L/ha) vitality loss decreased over time, while PA_2T (double application of 8 L/ha) continued to exhibit an almost constant effect for longer due to the second application one week later. The PA dosage of 5 L/ha, pyraflufen, and a mixture of the two exhibited a smaller vitality loss than the other treatments. However, except for glyphosate, the herbicidal effect of all the other treatments decreased over time. At the end of the experiment, the glyphosate treatment (3 L/ha) demonstrated the lowest estimated vitality. The results of the drone assessments indicated that vegetation indices (VIs) can provide detailed information regarding crop vitality following herbicide application and that RGB-based indices, such as EXG, have the potential to be applied efficiently and cost-effectively utilising drone imagery. The results of this study demonstrate that pelargonic acid has considerable potential for use as an additional tool in integrated crop management.

1. Introduction

Cultivation of cover crops is a valuable and sustainable agricultural practice that offers agroecosystems numerous benefits. However, several factors need to be considered in the management of cover crops, including the method used to desiccate them [1,2]. While being desirable in agroecosystems, many cover crops have the potential to become troublesome weeds and, thus, may reduce the yields of subsequent crops if consideration is not given to their proper desiccation [1,2]. Moreover, in climate-smart conservation tillage systems, cover crop desiccation is a tool used to prepare a weed-free seedbed [3,4].
Cover crops are either damaged or killed by frost in winter (frost-sensitive cover crops) or actively desiccated by mowing, tillage, or application of chemical herbicides. The application of a non-selective herbicide (e.g., the active ingredient glyphosate) is a common method for desiccating cover crops because, compared with other desiccation methods, it can offer suitable levels of control at almost any time or plant growth stage [4,5,6]. However, a delay in desiccating the cover crop carries risks associated with the next crop emergence, such as water moisture depletion [3,7,8] and nitrogen immobilisation [8]. Therefore, in the event of delayed desiccation (e.g., closer to the sowing time of the next crop), herbicide application is the method most commonly used due to its rapid effects [5,9]. The results of previous studies reveal that using the non-selective active ingredient glyphosate for cover crop desiccation provides the best control of grass cover crop species [10,11,12], but studies have also shown that glyphosate does not provide an adequate level of effectiveness for the desiccation of broadleaf cover crop species [10,11,12].
Furthermore, in recent years, the use of synthetic herbicides, especially glyphosate, has raised several environmental and health concerns [13,14] such that European governments, especially the German government, have announced that use of this active ingredient should be very limited or even prohibited by the end of 2023 [15]. A severe glyphosate restriction or ban means that alternatives need to be identified [16]. One of the substitutes for glyphosate is the application of bioherbicides [16] since they offer advantages, such as rapid degradation [17].
Pelargonic acid (PA) is a bio-based non-selective contact herbicide that is rapidly degraded in the soil (DT50 < 2 days) [18,19] and exhibits damage on the green tissue after 15–60 min at temperatures greater than 15 °C on a sunny day [19,20]. Its mode of action is to move through the cuticle and cell membrane, reduce intra-cellular pH, and ultimately cause rapid membrane dysfunction, leading to the loss of membrane integrity and cell death [19,21]. Owing to this mode of action, PA is recognised as an extremely rapid burndown herbicide, with plants starting to collapse between one and three hours after application [19]. Most bioherbicides are unable to provide adequate control because of a lack of aggressiveness; therefore, efficacy can be improved by mixing a bioherbicide and a chemical herbicide [22]. There is potential for enhancing PA efficacy with the addition of another active ingredient [23]. Therefore, this study investigated a mixture of pyraflufen and reduced PA dosage. Pyraflufen is a post-emergence contact herbicide used to control broadleaf weed species [24].
One approach for evaluating the effect of bio-based and chemical herbicides for cover crop desiccation is to undertake a visual evaluation [25]. Another assessment method is to use an unmanned aerial vehicle (UAV), which is a relatively new technology and a useful tool for evaluating the effectiveness of various types of crop management [26,27] (e.g., herbicide effectiveness [25,28]). The advantages of this method are its accuracy, flexibility, and cost-effectiveness [25,26,27]. Aerial images obtained by UAV can detect differences in levels of plant health that may not be possible by visual observation [25,26]. Spectral data collected by UAVs are normally evaluated in the form of vegetation indices (VIs) [26]. Evaluation of vegetation can be conducted precisely using various VIs, but this greatly depends on the experimental questions [29] because each index has its own unique characteristics and usage purposes [26]. Near infrared (NIR)- and red-edge-based indices are used to measure plant health and biotic and abiotic stresses because they are better at showing plant reaction to stress within these bands [30]. RGB-based indices, which are calculated using visible reflectance bands [31], are the simplest and most commonly used UAV method for monitoring vegetation because they do not require a special, expensive multispectral camera. Commonly derived parameters are plant cover and stress [31,32]. The important aspect regarding an assessment of plant stress or herbicide effectiveness is that the drones are equipped with multispectral sensors, which are capable of measuring different characteristics, including detailed plant vigour [29]. The introduction of a stress factor, such as herbicide application, influences sensor measurements because sensor systems analyse the plant canopy’s green colour rather than herbicide injuries on the plants [28]. Therefore, VIs calculated from these data can provide reliable information on monitored plant vitality [29]. In the present study, cover crop vitality was estimated visually by the greenness of the plants, as in the drone assessments.
There are different variables in the environment that need to be considered when using different VIs, such as limiting factors [33]. The NIR- and red-edge-based indices can be affected by low vegetation coverage due to the presence of soil in the background [34]. It should be noted that in addition to the effects of soil, some indices are sensitive to atmospheric effects [33].
Given the unique properties of various VIs, the normalised difference vegetation index (NDVI) and leaf chlorophyll index (LCI) were chosen as NIR/red-edge-based indices, and the visible atmospherically resistant index (VARI) and excess green index (EXG) were selected as RGB-based indices to evaluate herbicide treatments in this study.
Thus far, little is known about cover crop desiccation by bioherbicides. By focusing on cover crop management in the European context, this study aimed to close this knowledge gap by evaluating the herbicidal potential of pelargonic acid for cover crop desiccation compared with other chemical herbicides, using Rostock (northeast Germany) as a case study site. Owing to its rapid degradation effect, it is anticipated that PA will be used as a bio-based alternative for cover crop desiccation purposes. This study site was chosen because of its moderate maritime climate in which cover crops are not usually damaged by frost in winter.
A further objective of this research was to verify the credibility of RGB- and NIR-based vegetation indices derived from drone images to measure the effect of herbicides in cover crop desiccation at different assessment times after application. It was hypothesised that VIs derived from drone imagery can provide detailed information regarding crop vitality at different assessment times after application of herbicides and can be used as an alternative to the visual rating method.

2. Materials and Methods
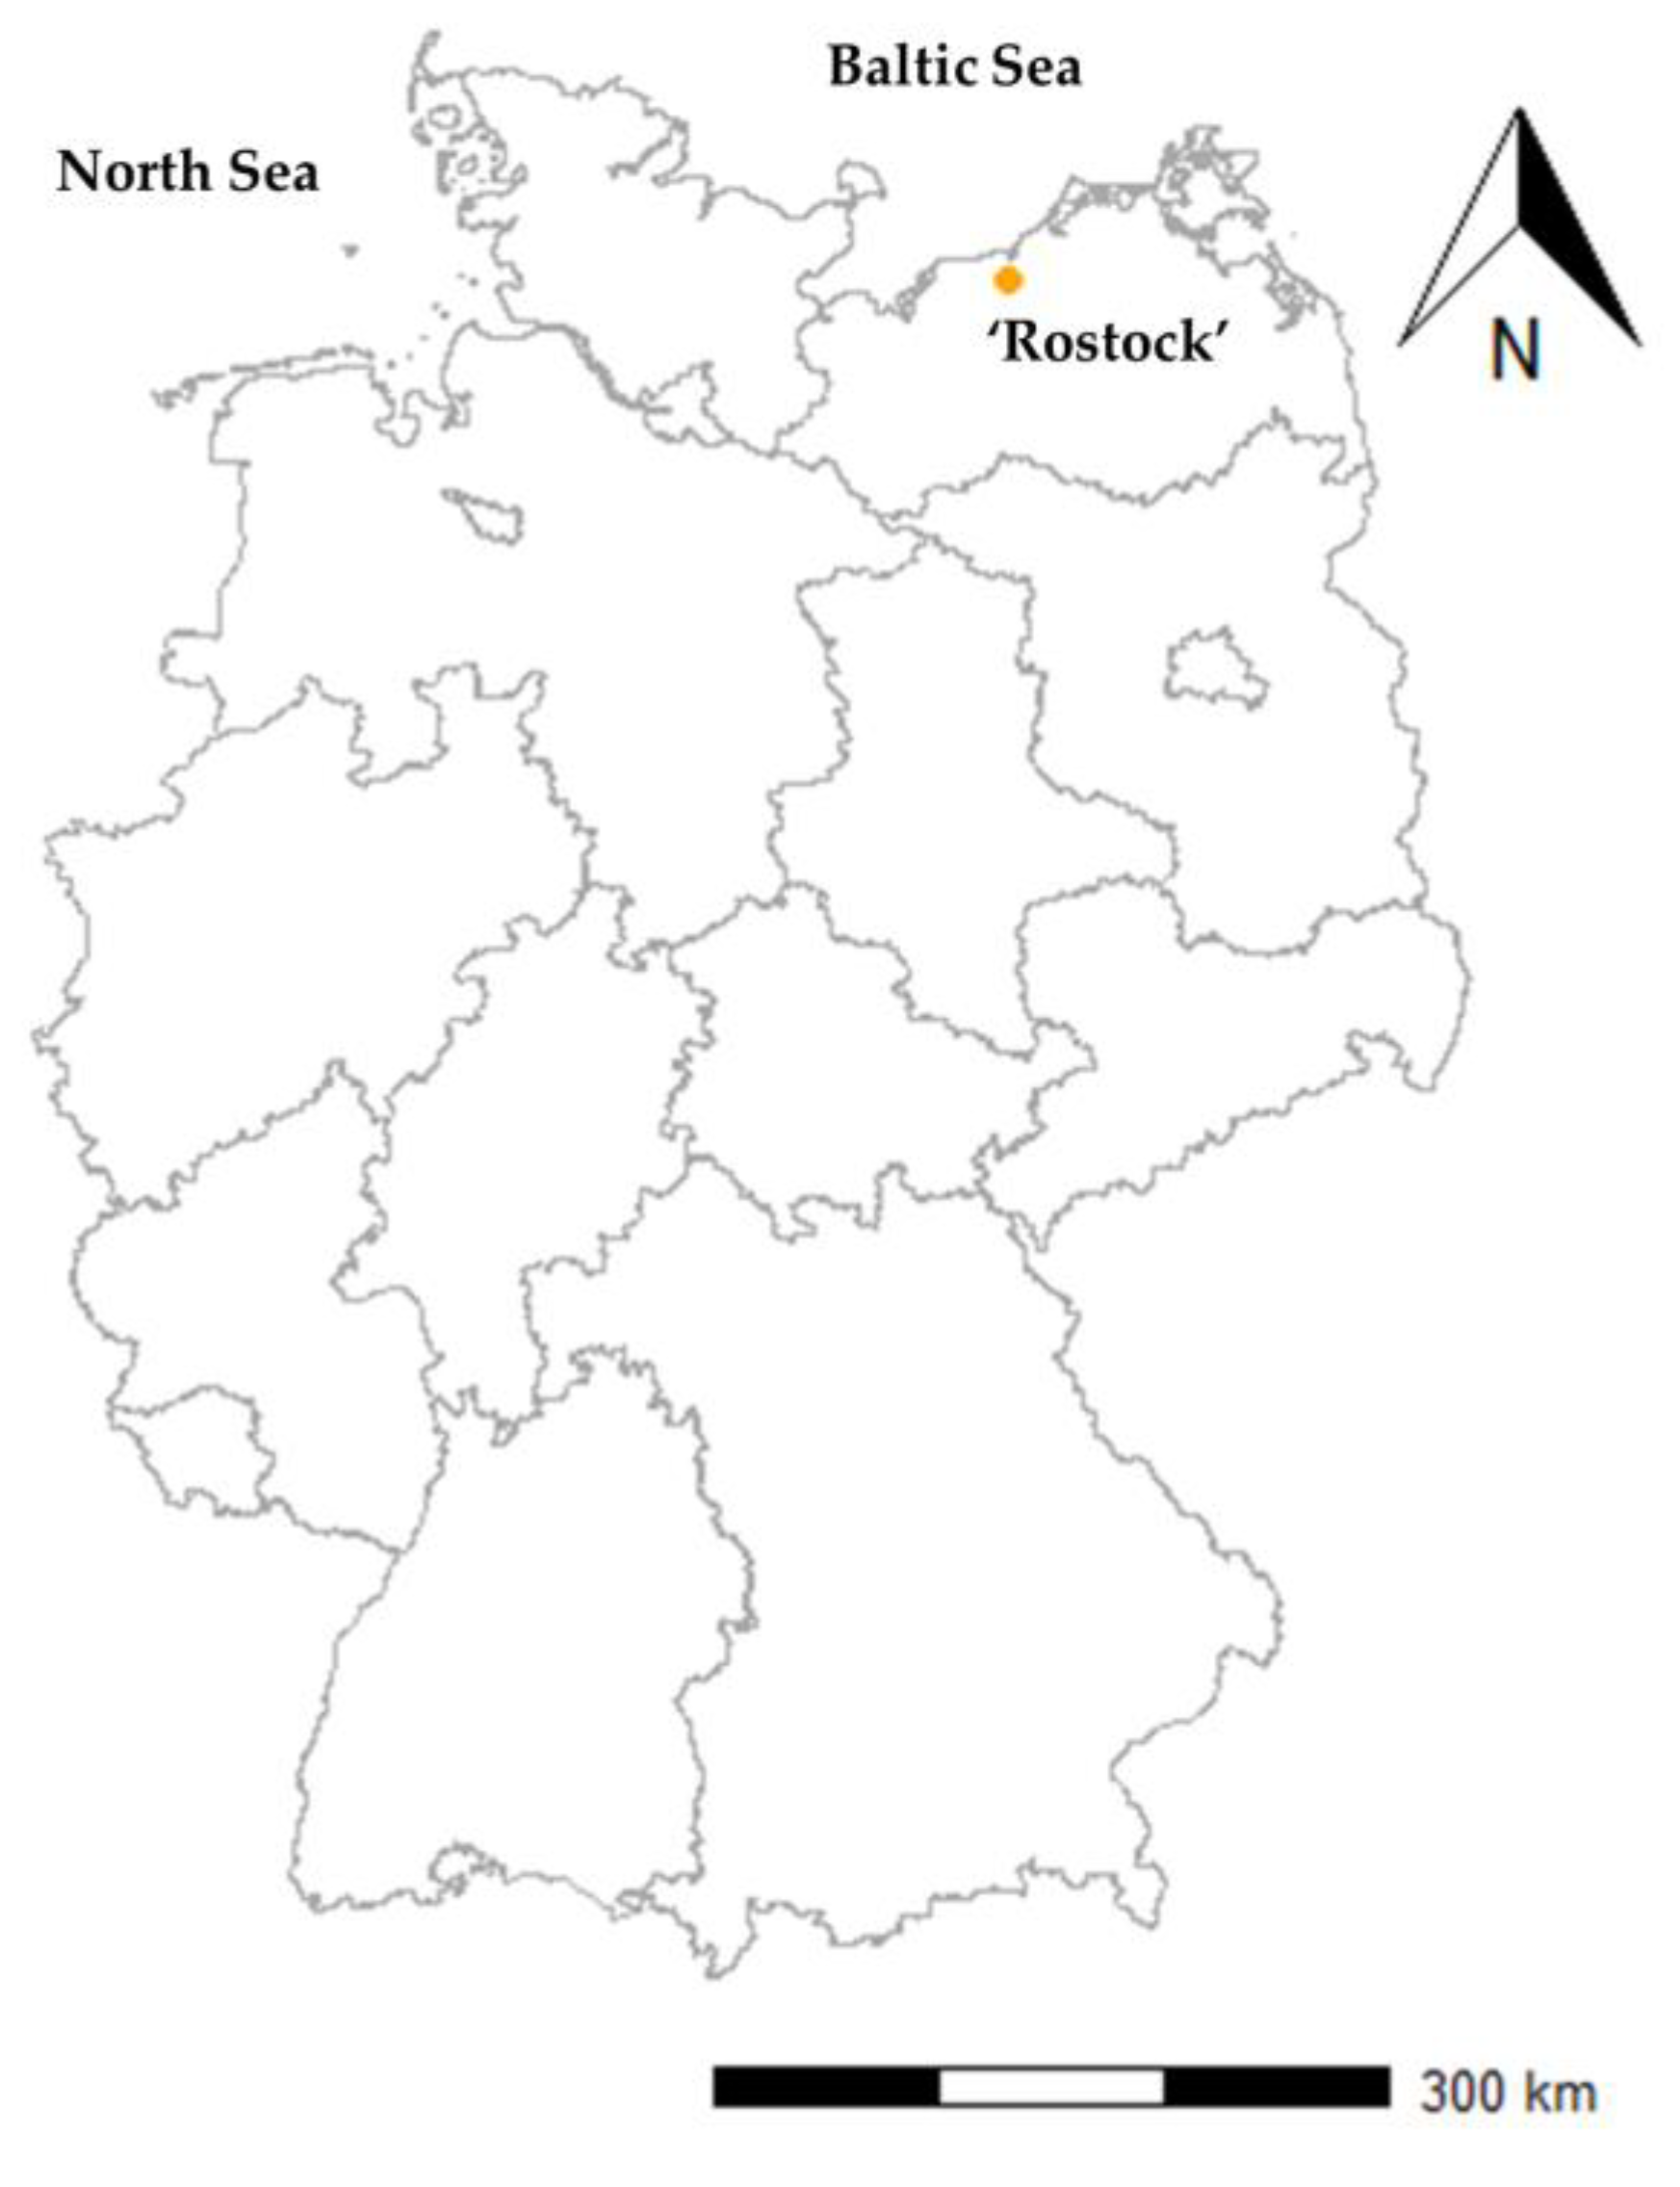
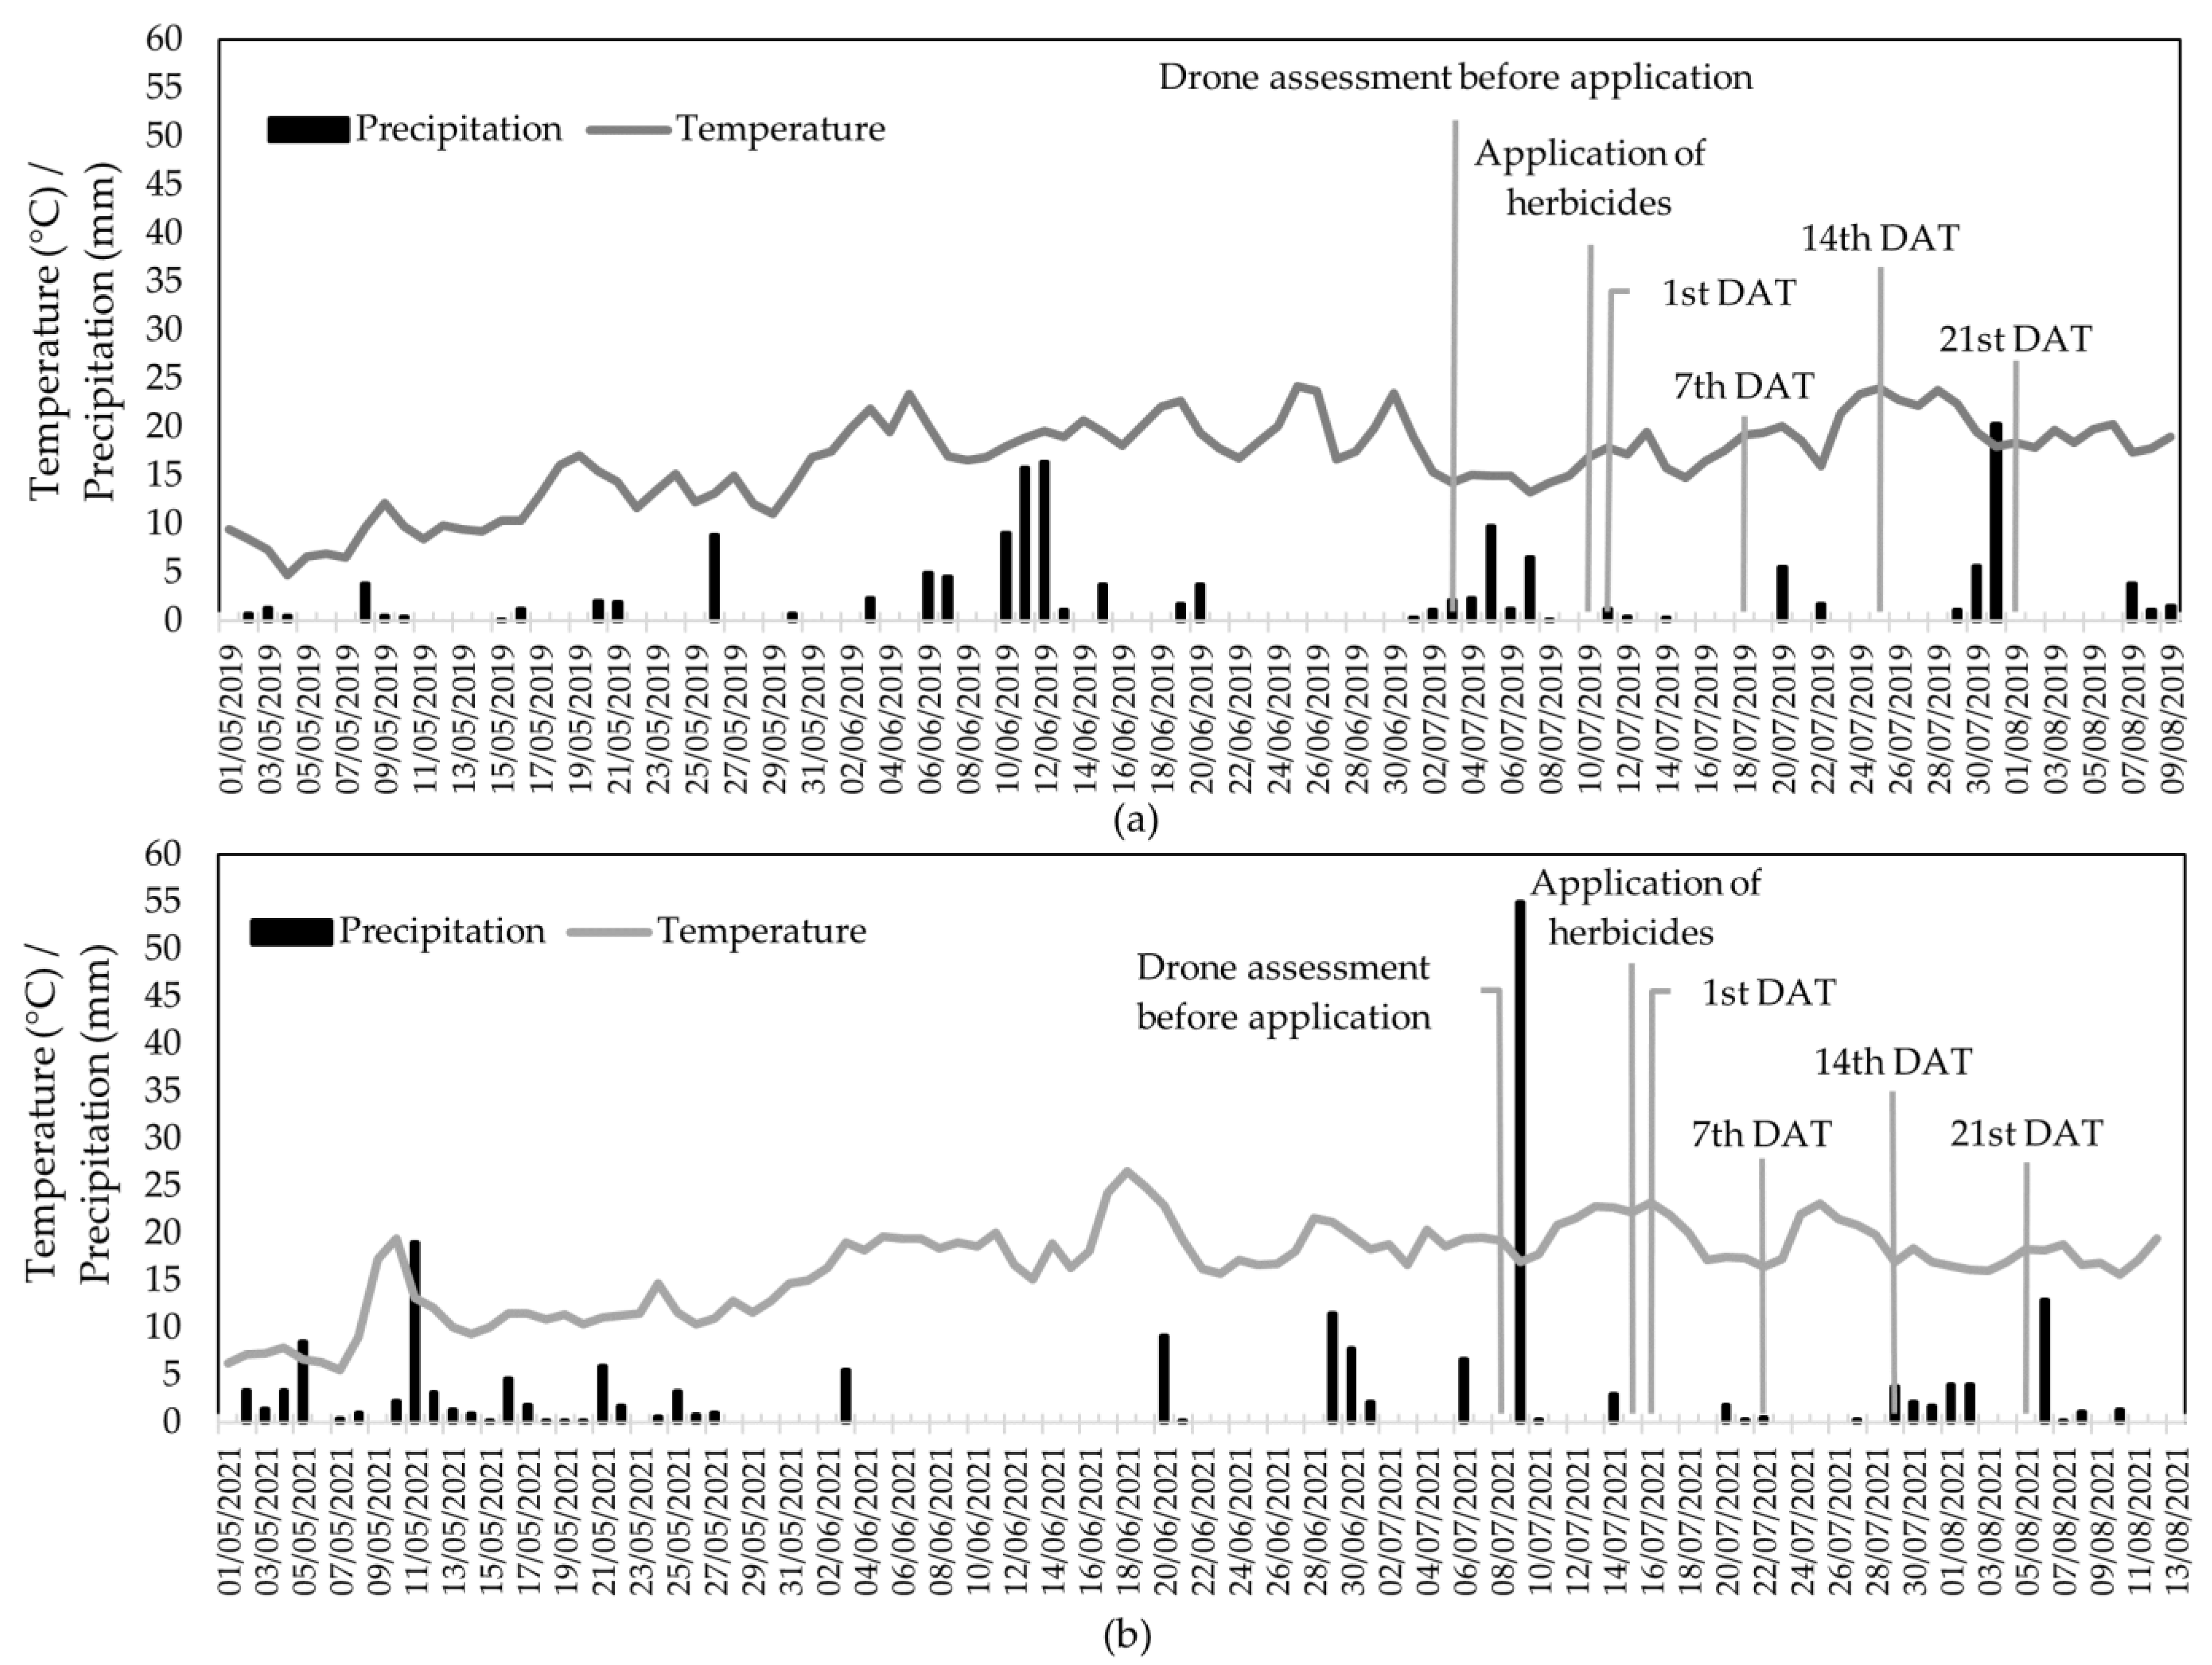
2.1. Study Site

The experiment was conducted under field conditions in the summer of 2019 and repeated in the summer of 2021 in northeast Germany (location Rostock: 54°3′39.76” N, 12°4′58.14” E) (Figure 1). In both years, the soil type in the fields was loamy sand. Local weather conditions in Rostock are favourable for arable crop production due to its moderate maritime climate. Winter cover crops are commonly used in crop rotations that include summer crops (e.g., maize, legumes, summer cereals, or root and tubers). The average air temperature for the growing season was 13.3 °C (minimum 2.4 °C and maximum 24.3 °C) in 2019 and 12.3 °C (minimum 0 °C and maximum 26.5 °C) in 2021. The total amount of precipitation in the growing season until application of the treatments was 186 mm in 2019 and 241 mm in 2021. After the experiment started, the field received an additional 24 mm and 33.8 mm more rain, respectively, in 2019 and 2021 (Figure 2).
For the experiment in 2019, clover grass (DSV COUNTRY field grass 2055) was sown in April at a rate of 20 kg/ha in 10 rows per plot with a 15 cm row space using a System Hege 34. “DSV COUNTRY field grass 2055” contains 20% perennial ryegrass (Lolium perenne), 30% red clover (Trifolium pratense), 20% timothy grass (Phleum pratense), and 30% meadow fescue (Festuca pratensis). For the experiment in 2021, the same clover grass was sown using the same method in autumn 2020 and was cut once in June 2021 (before the start of experiment) to maintain similar plant sizes and conditions as in 2019.
Figure 1. Study area of Rostock, northeast Germany.
Agronomy 13 00354 g001
Figure 2. Air temperature (°C) and precipitation during the growing season (mm) in (a) 2019 and (b) 2021. Information for both years was obtained from the research weather station of the Department of Hydrology and Applied Meteorology of the University of Rostock.
Agronomy 13 00354 g002

2.2. Experimental Setup

The experimental design for both experimental years consisted of a randomised complete block design with four replications. The size of the experimental area was approximately 460 m2 and included 28 plots of 6 m2 in four columns (blocks) and seven rows. The plant growth stage at the time of herbicide application in both years ranged from BBCH 45 to 49. The herbicide treatments applied in this experiment are provided in Table 1. The treatments included three different dosages (16, 8, and 5 L/ha) of pelargonic acid, with the 8 L/ha dosage applied twice (the second time within a week of the first application). The commercial product Beloukha® was used for treatments containing pelargonic acid. For the treatments including the active ingredient pyraflufen, Quickdown® was used. Roundup Ultra® and Roundup Powerflex® were used as glyphosate in 2019 and 2021, respectively. Treatments were applied by means of a plot-spraying device with a pressure of 2.1 bar and speed of 4 kilometres per hour. The application volume for the treatments including Quickdown® was 300 L/ha, and for the rest, it was 200 L/ha. Flat jet nozzles of sizes 02 and 03 were used for 200 L/ha and 300 L/ha application volumes, respectively.

2.3. Assessments

The effect of the herbicide treatments was assessed by estimating the percentage of crop vitality. This assessment was conducted before application and at 1, 7, 14, and 21 days after application (DAT) of the herbicide treatments by visual observation. The “Göttinger Schätzrahmen [35]” was placed three times randomly on each plot as a non-destructive sampling method and the percentage of the vitality of all plant species inside the frame was evaluated. A value of 0% vitality represented completely dead vegetation, and a value of 100% was equivalent to completely vital vegetation. In addition to the visual observation, an assessment of the herbicide treatments was conducted using drone surveys on all the above-mentioned DATs except 21st_DAT in 2021.
An Ebee+ drone from the company Sensefly was used for the recordings. The drone has an RTK system, which, in principle, allows highly accurate ground control-free georeferencing. The fixed-wing aircraft weighs approximately 1.1 kg and can carry only one payload at a time, i.e., either a colour digital camera (S.O.D.A.) with 20 MPix or a Sequoia multispectral camera manufactured by the company Parrot. Thus, two flights were carried out on each flight date: The first with the multispectral camera, followed immediately by a second with the RGB camera. Planned with a longitudinal and transversal overlap of 80% each, one flight flew over the whole of the University of Rostock’s test field, which is approximately 8 ha. The speed of the fixed wing drone Ebee+ is set to 14 m/s by default, relative to the surrounding air. Depending on the wind speed and wind direction, the ground speed may vary from 11-18 m/s. Thus, the forward lap differs by between 60 and 80%. Due to the 80% side lap, there will always be enough overlap to ensure high-quality 3D data and near-nadir viewing perspectives throughout the image blocks. The flight altitude for both flights was approximately 70 m, resulting in a ground resolution of 2 cm for the RGB images and 7 cm for the multispectral images. During postprocessing, the image data were photogrammetrically processed. The RGB data were processed using Metashape 1.5.2 software from Agisoft, while the multispectral data were processed using Pix4DMapper 4.5.2 software in order to obtain absolute reflectance values. Several permanent control points were included in the bundle block adjustment to ensure the accuracy of the georeferencing. The positional and vertical accuracy at the control points was between 1 and 2 cm. Sunlight and cloud conditions during the drone flights, collected by the authors, are provided in Table 2. The image surveys were acquired within two hours around solar noon (11:00–14:30 CEST). The sun elevation above the horizon was approximately 50–60°.

2.4. Vegetation Indices

The vegetation indices used to evaluate crop vitality after application of the treatments in these experiments were as follows:
NDVI (normalised difference vegetation index) [33], calculated as:
N D V I = N I R R N I R + R
where NIR is the near-infrared band reflectance, and R is the red band reflectance;
VARI (visible atmospherically resistant index) [36], calculated as:
V A R I = G R G + R B
where R, G, and B are the normalised red, green, and blue bands of the image, respectively;
EXG (excess green index) [37], obtained from the following formula:
E x G = 2 · G * R * B *
In this formula, to make the index more reliable and normalise the differences in image acquisition or in illumination and exposure conditions, G * , R * , and B * were used as the transformed values of the R (red), G (green), and B (blue) bands. These values were calculated as follows:
G * = G G M a x ,   R * = R R M a x ,   B * = B B M a x
where R, G, and B are the average light intensity of red, green and blue, and RMax, GMax, and BMax represent the maximum values of R, G, and B, respectively [38,39].
LCI (leaf chlorophyll index) [40], calculated using the following formula:
L C I = N I R R e d E d g e N I R + R
where RedEdge is the red-edge reflectance, and NIR and R represent the near-infrared band reflectance and red band reflectance, respectively.
The values obtained from the above formulae were considered absolute values for VIs. The relative values of each VI were then calculated using two different approaches: the relative VI values for each plot on each assessment day were calculated relative to the absolute VI values calculated before the drone flights, and then the relative VI values were calculated relative to the absolute VI values obtained from the untreated control plots on the same assessment day.

2.5. Statistical Analysis

The statistical analyses were performed using the statistics program R version 4.2.2 [41]. The distribution of visually estimated vitality data analysed by the Shapiro–Wilk normality test [42] showed that the data deviated significantly from a normal distribution (p < 0.01). Therefore, the Kruskal–Wallis test (R package ‘agricolae’ [43]) was used to compare the herbicide treatments on each assessment day. The data distribution for all calculated VIs proved to be the same (p < 0.01). Therefore, to check differences among treatments using VIs, a Kruskal–Wallis analysis was conducted on absolute VI values. These results can be found at Appendix A.
Linear and polynomial regressions were fitted to the data to investigate the relationships among all the VIs as well as between the VIs and estimated vitality on each DAT. The vitality loss of the treatments was considered to be 0% for all plots on the day before application. Due to singularities in the dataset, the coefficient of determination (R2) could not be determined to explain the relationship between VIs and estimated vitality before the application of the treatments in either year.

3. Results

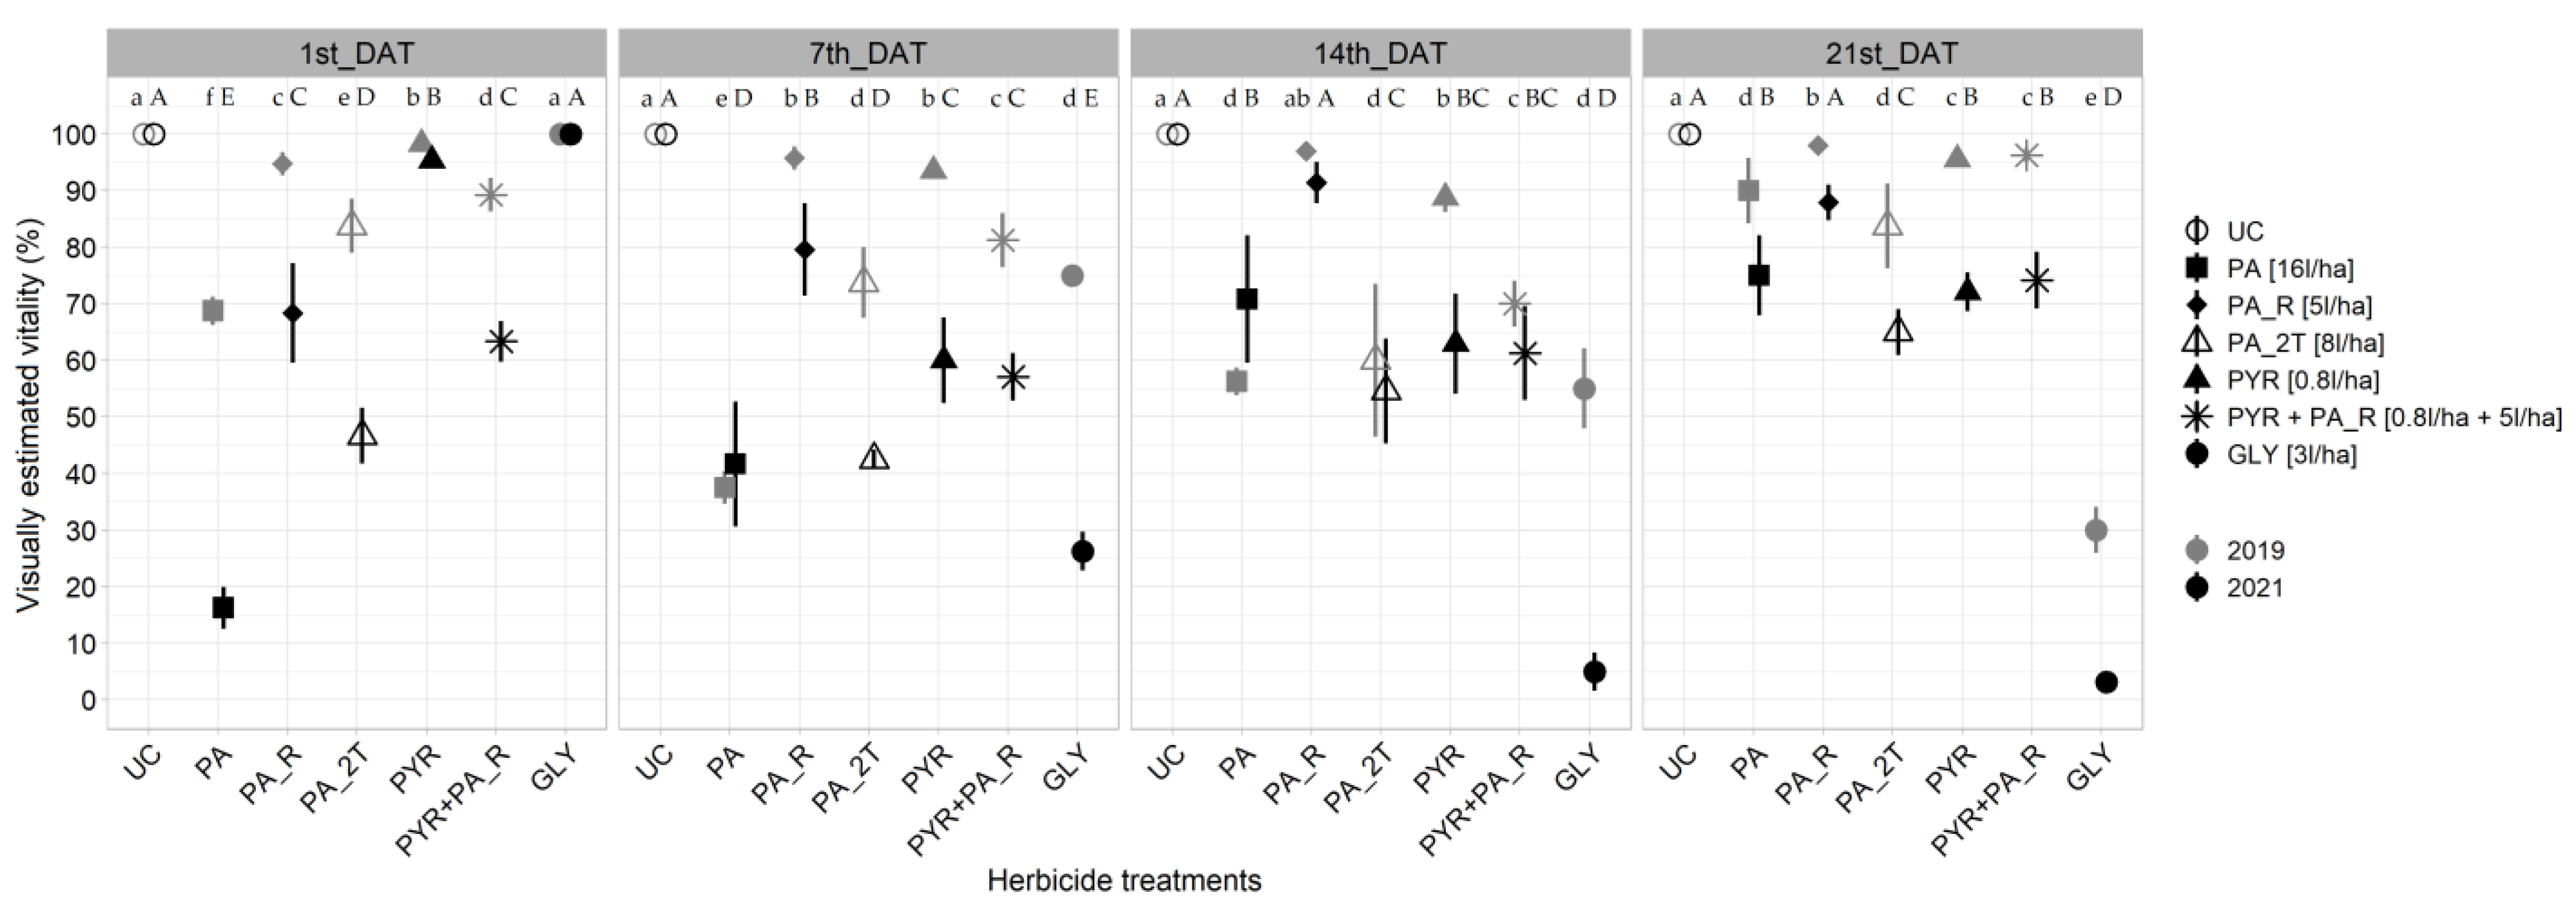
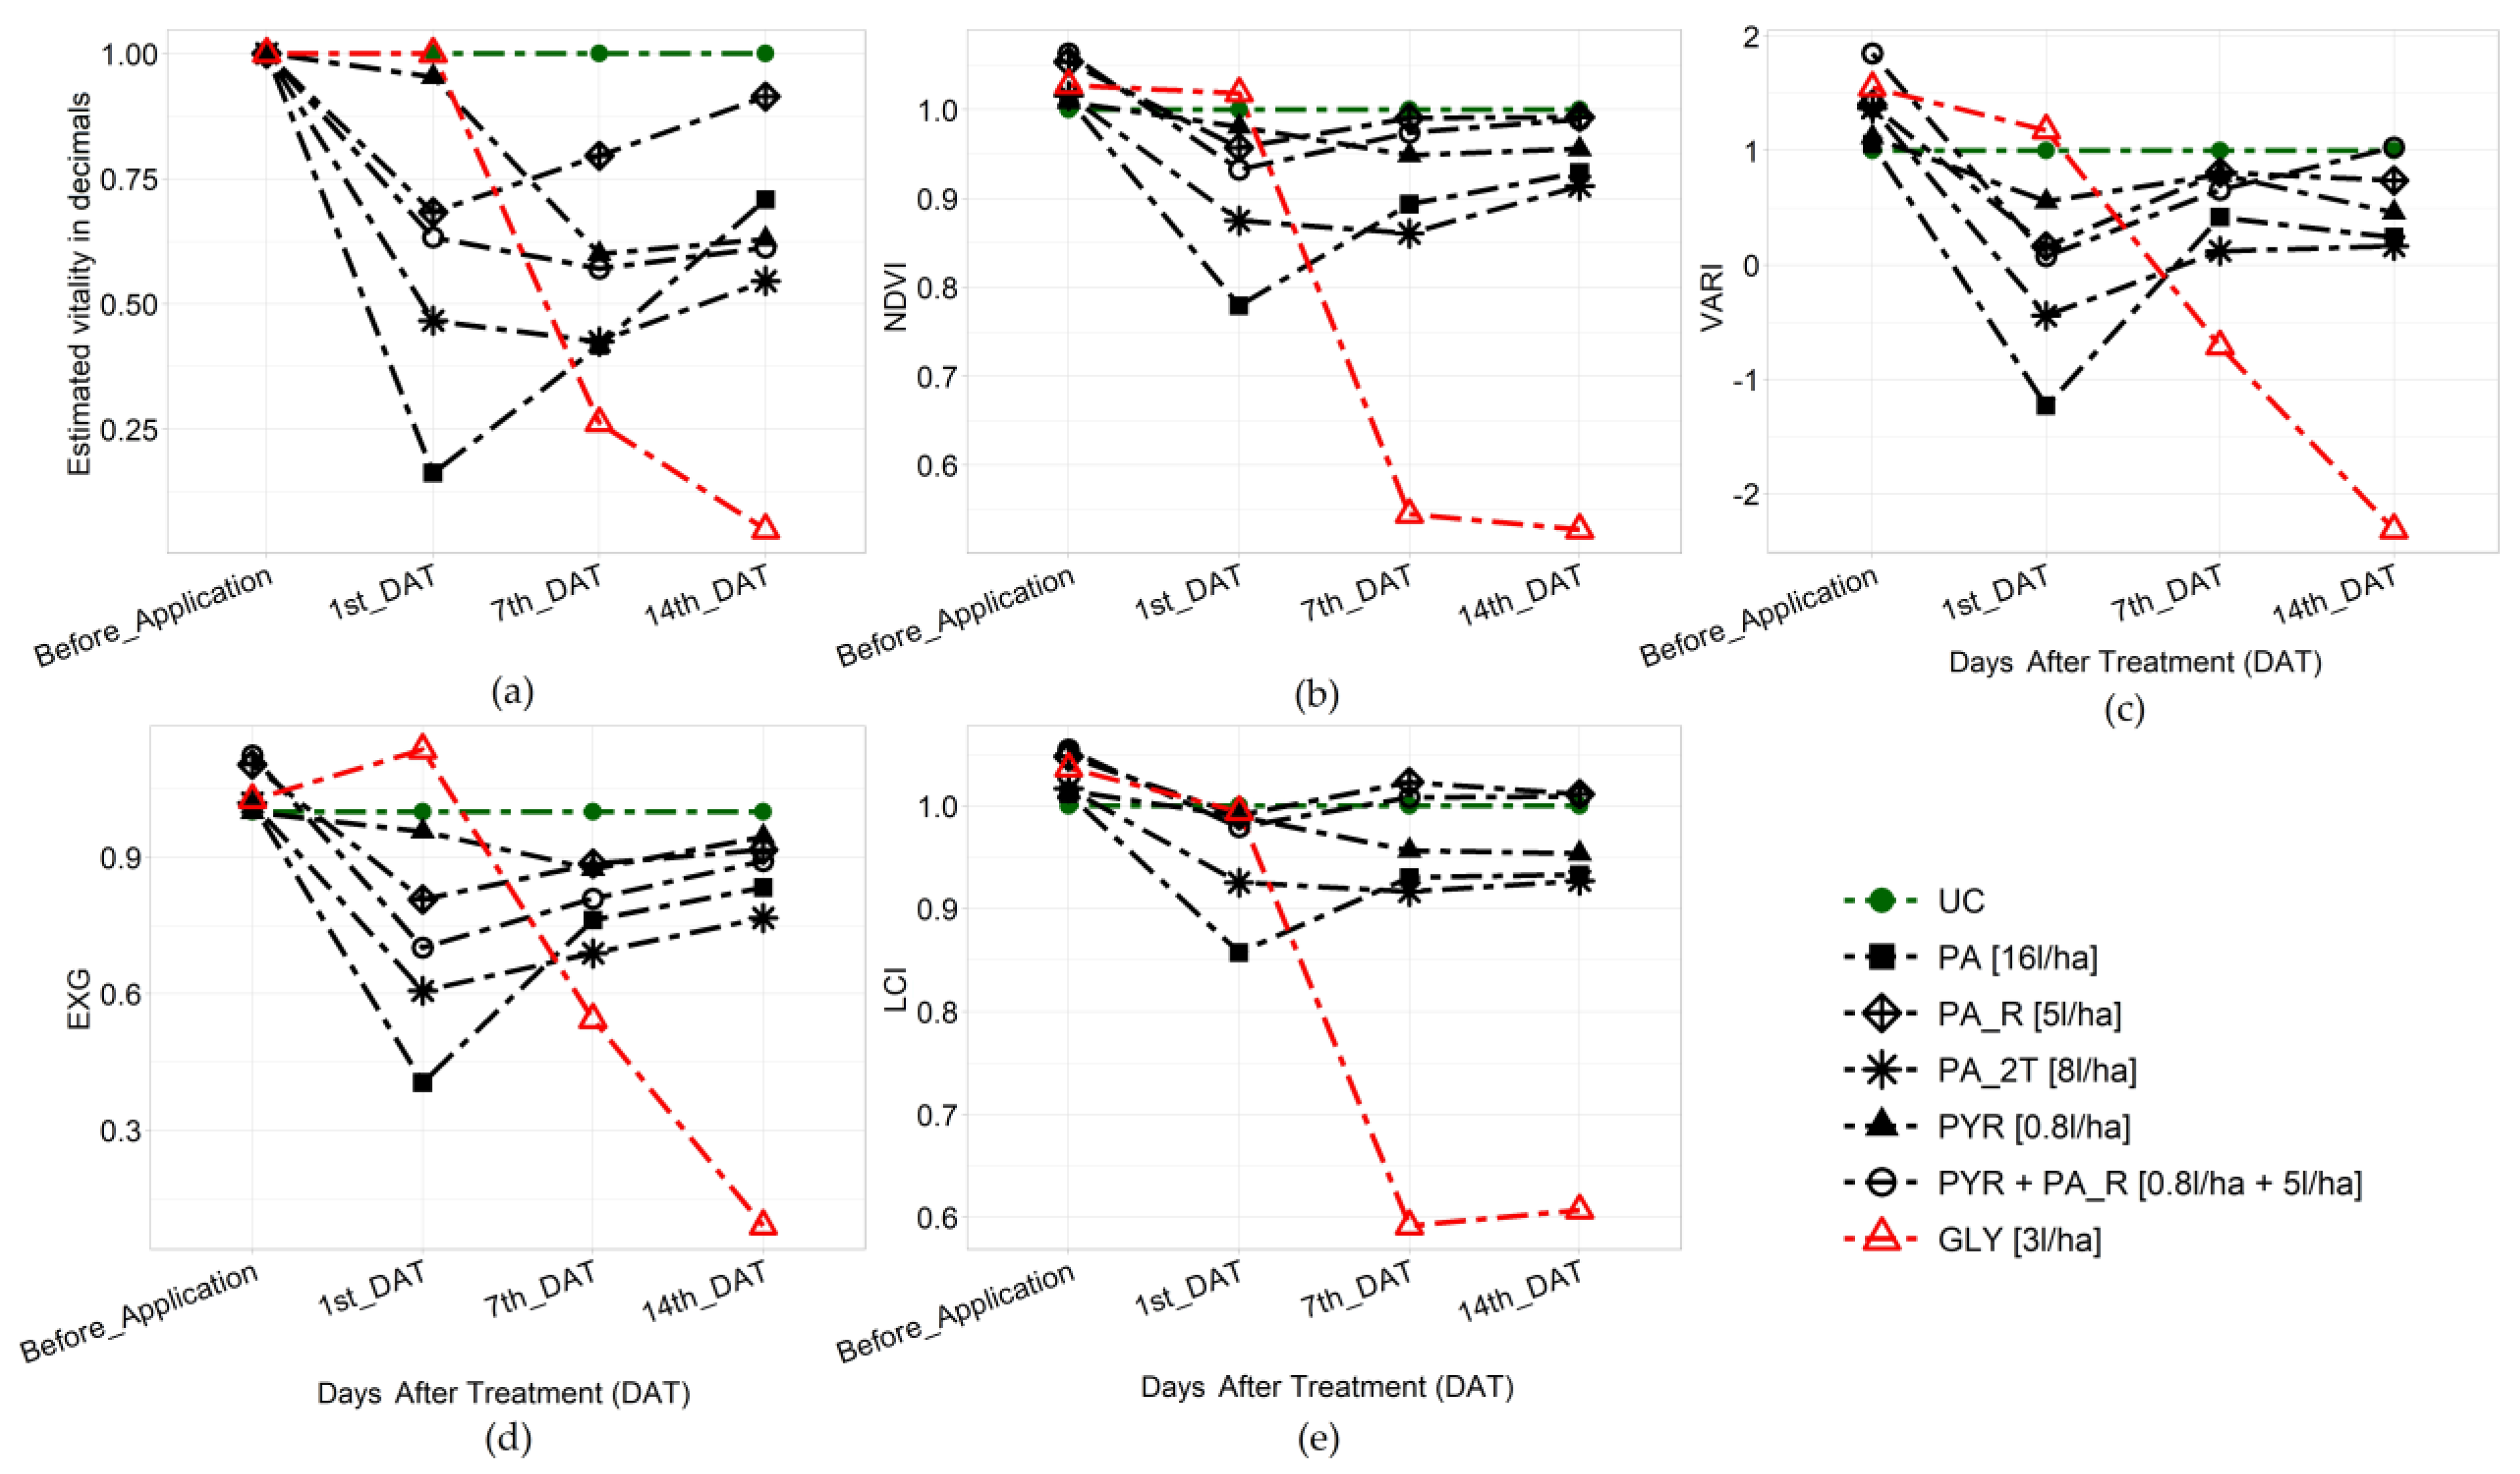
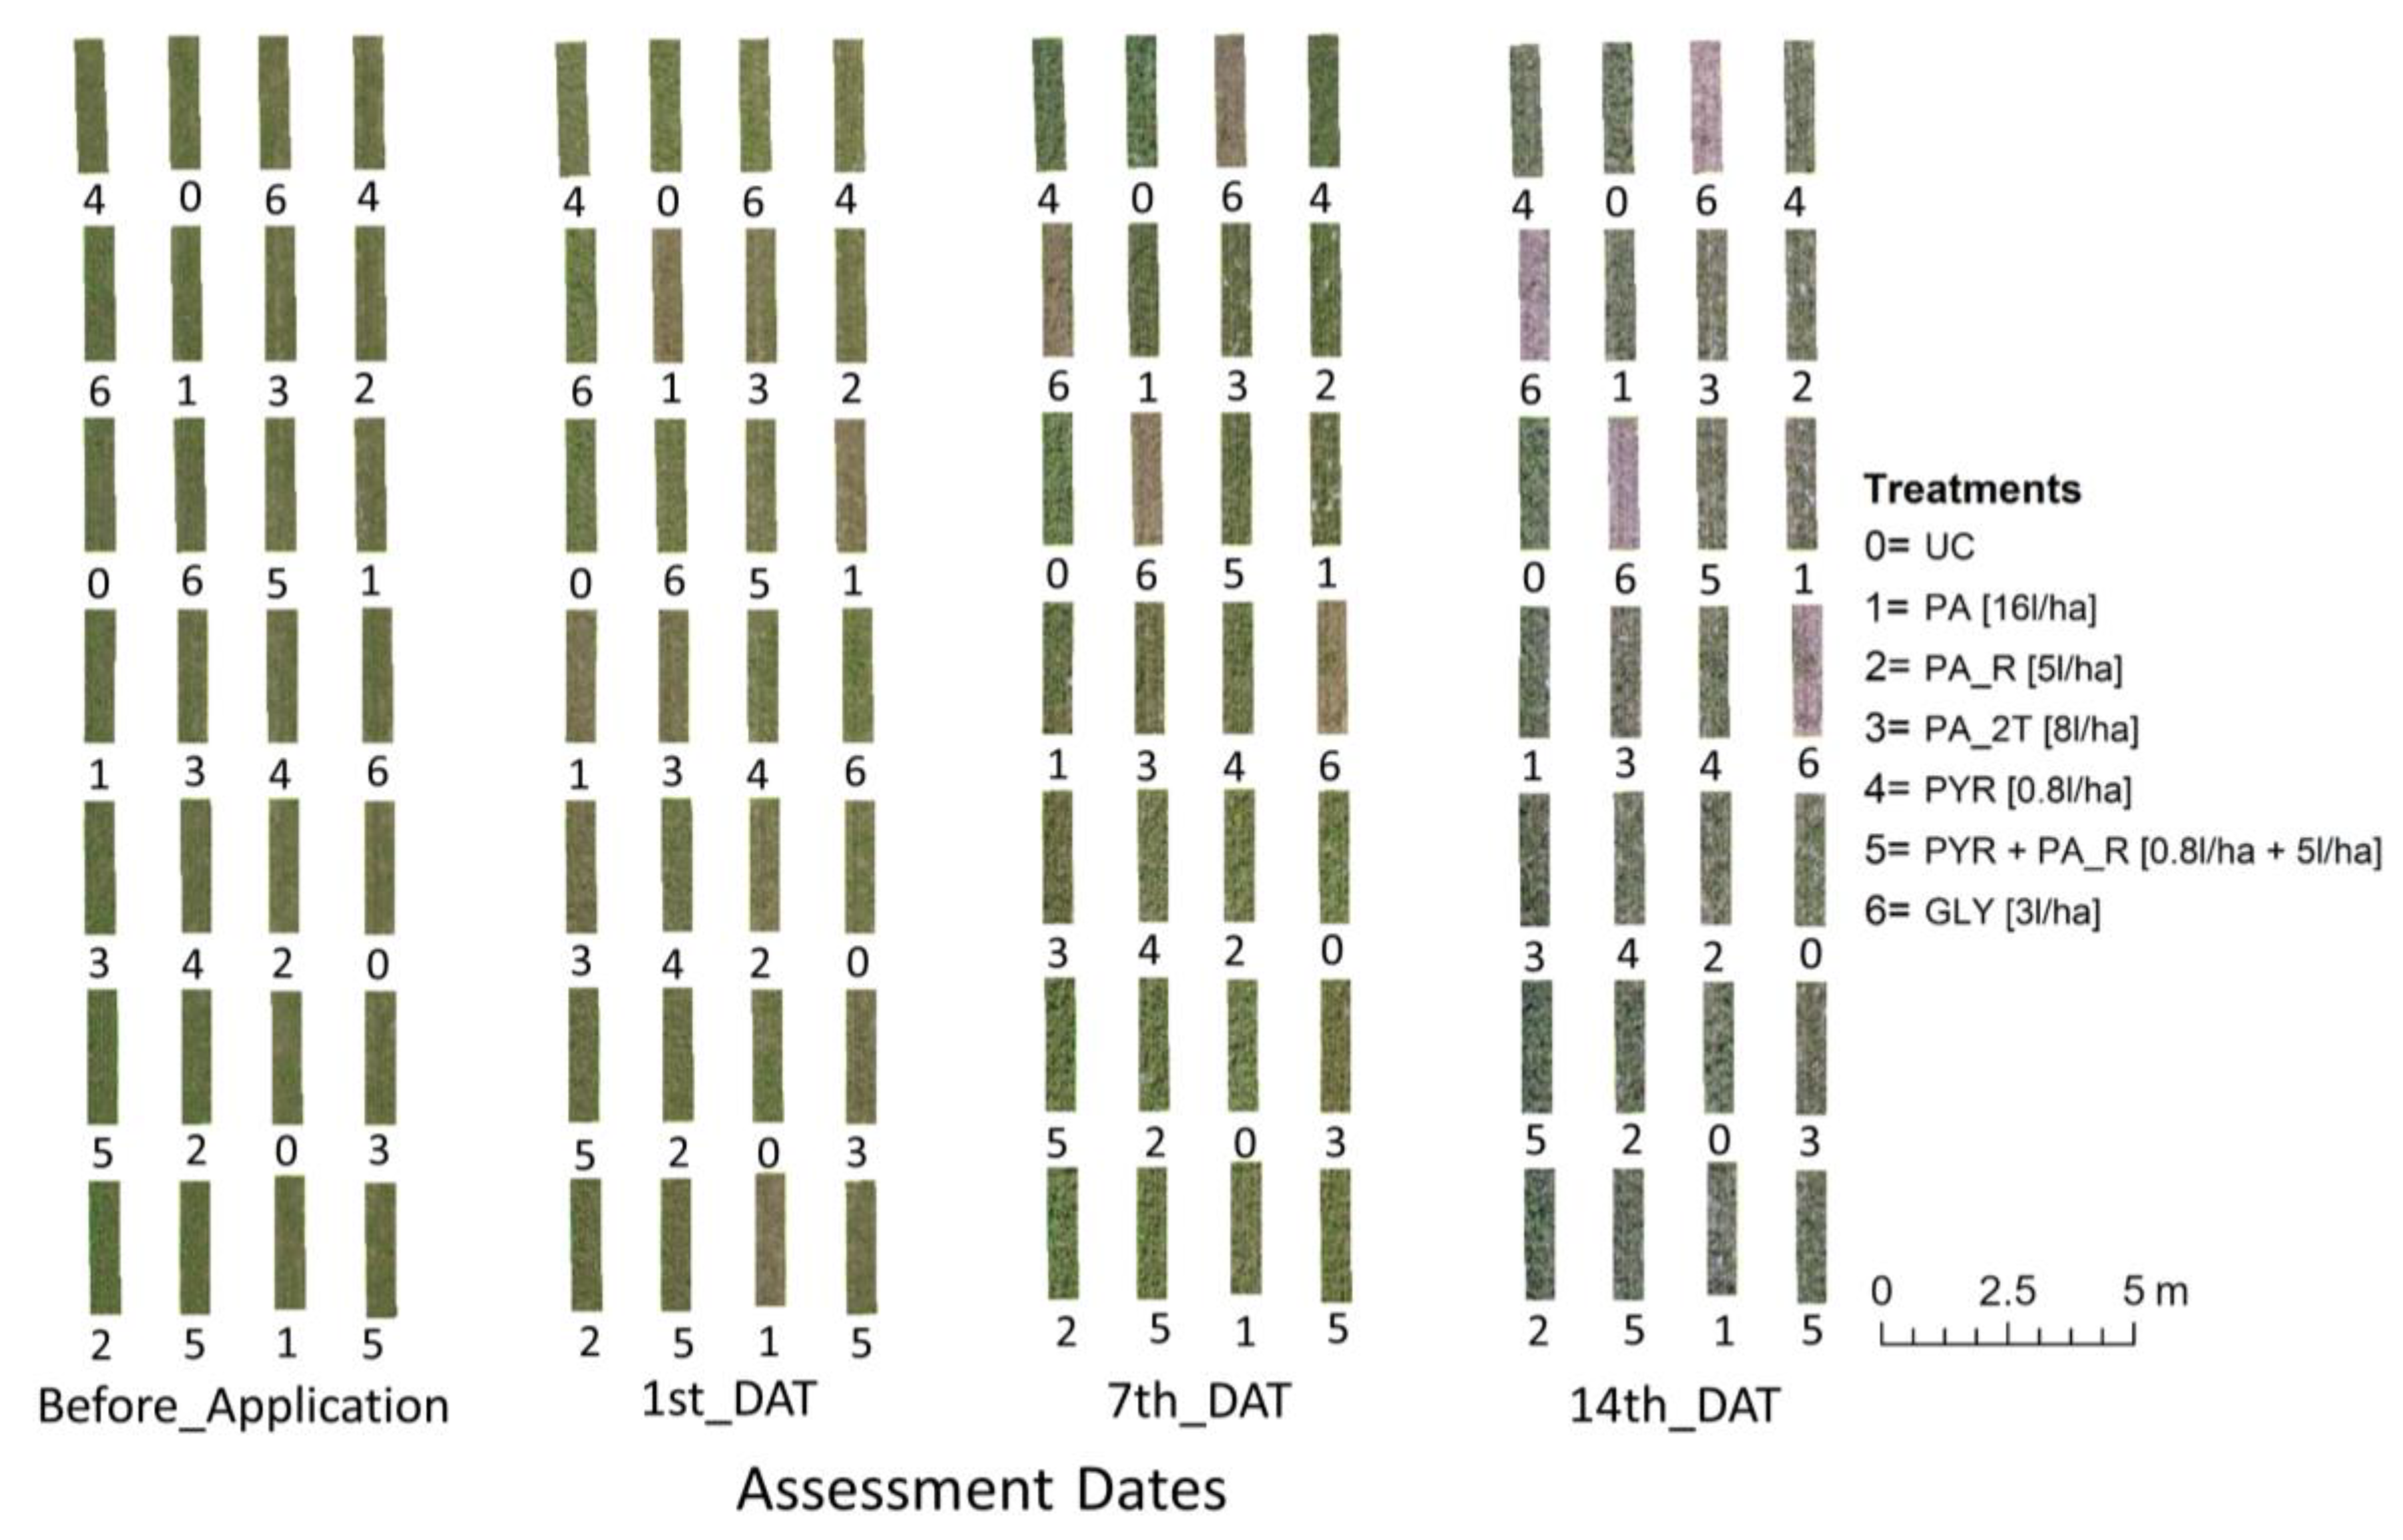
3.1. Visually Estimated Reduction in Cover Crop Vitality

At 1st_DAT in 2019, all the herbicide treatments except GLY caused vitality losses. The lowest visually estimated vitality was 68%, which was from PA (full dosage). The effect of this herbicide treatment increased over time and reached an estimated vitality of 38% at 7th_DAT, before starting to decrease until the end of the experiment (Figure 3).
The estimated vitality of the PYR+PA_R treatment showed a decremental trend from 90% to 70% until 14th_DAT. After that time, however, the trend became incremental. PA_2T exhibited the same trend as PYR+PA_R, although the vitality loss caused by PA_2T was 10%, which was significantly higher than PYR+PA_R on 14th_DAT. The estimated vitality was extremely high for the GLY and PYR treatments at 1st_DAT in 2019. The herbicidal effect of the PYR treatment increased slightly, up to 14th_DAT, but vitality loss was ≈10% at 21st_DAT (Figure 3).
At the end of the experiment, GLY showed the lowest estimated vitality (≈30%), while among other herbicide treatments, the lowest vitality (≈84%) was obtained by PA_2T. Nevertheless, during the first week following application, the vitality loss obtained by PA proved to be 40%, which was significantly higher than that obtained by GLY (Figure 3). PA_R showed the lowest vitality loss among the herbicide treatments of 2% to 5%.
The repetition of the experiment in 2021 revealed similar results. A greater vitality loss was obtained by treatments containing pelargonic acid at 1st_DAT. Except for PA_R, this herbicidal effect was visible until 14th_DAT. GLY was the only treatment that did not exhibit a significant vitality loss compared with the untreated control at 1st_DAT. The herbicidal effect of PA decreased from a loss of vitality of 83% (1st_DAT) to 58% (7th_DAT) and then to 25% at the end of experiment. The lowest vitality for PYR was 7th_DAT at 60%, which was significant. The effect of this treatment slowly decreased after that time. PA_2T displayed more than 50% vitality loss during the first week following application and later declined gradually over time. PYR+PA_R showed a similar decline during the experiment. One week after application, GLY started to exhibit a significant loss in crop vitality. The minimum vitality obtained by GLY was 2% at the end of the experiment (Figure 3).

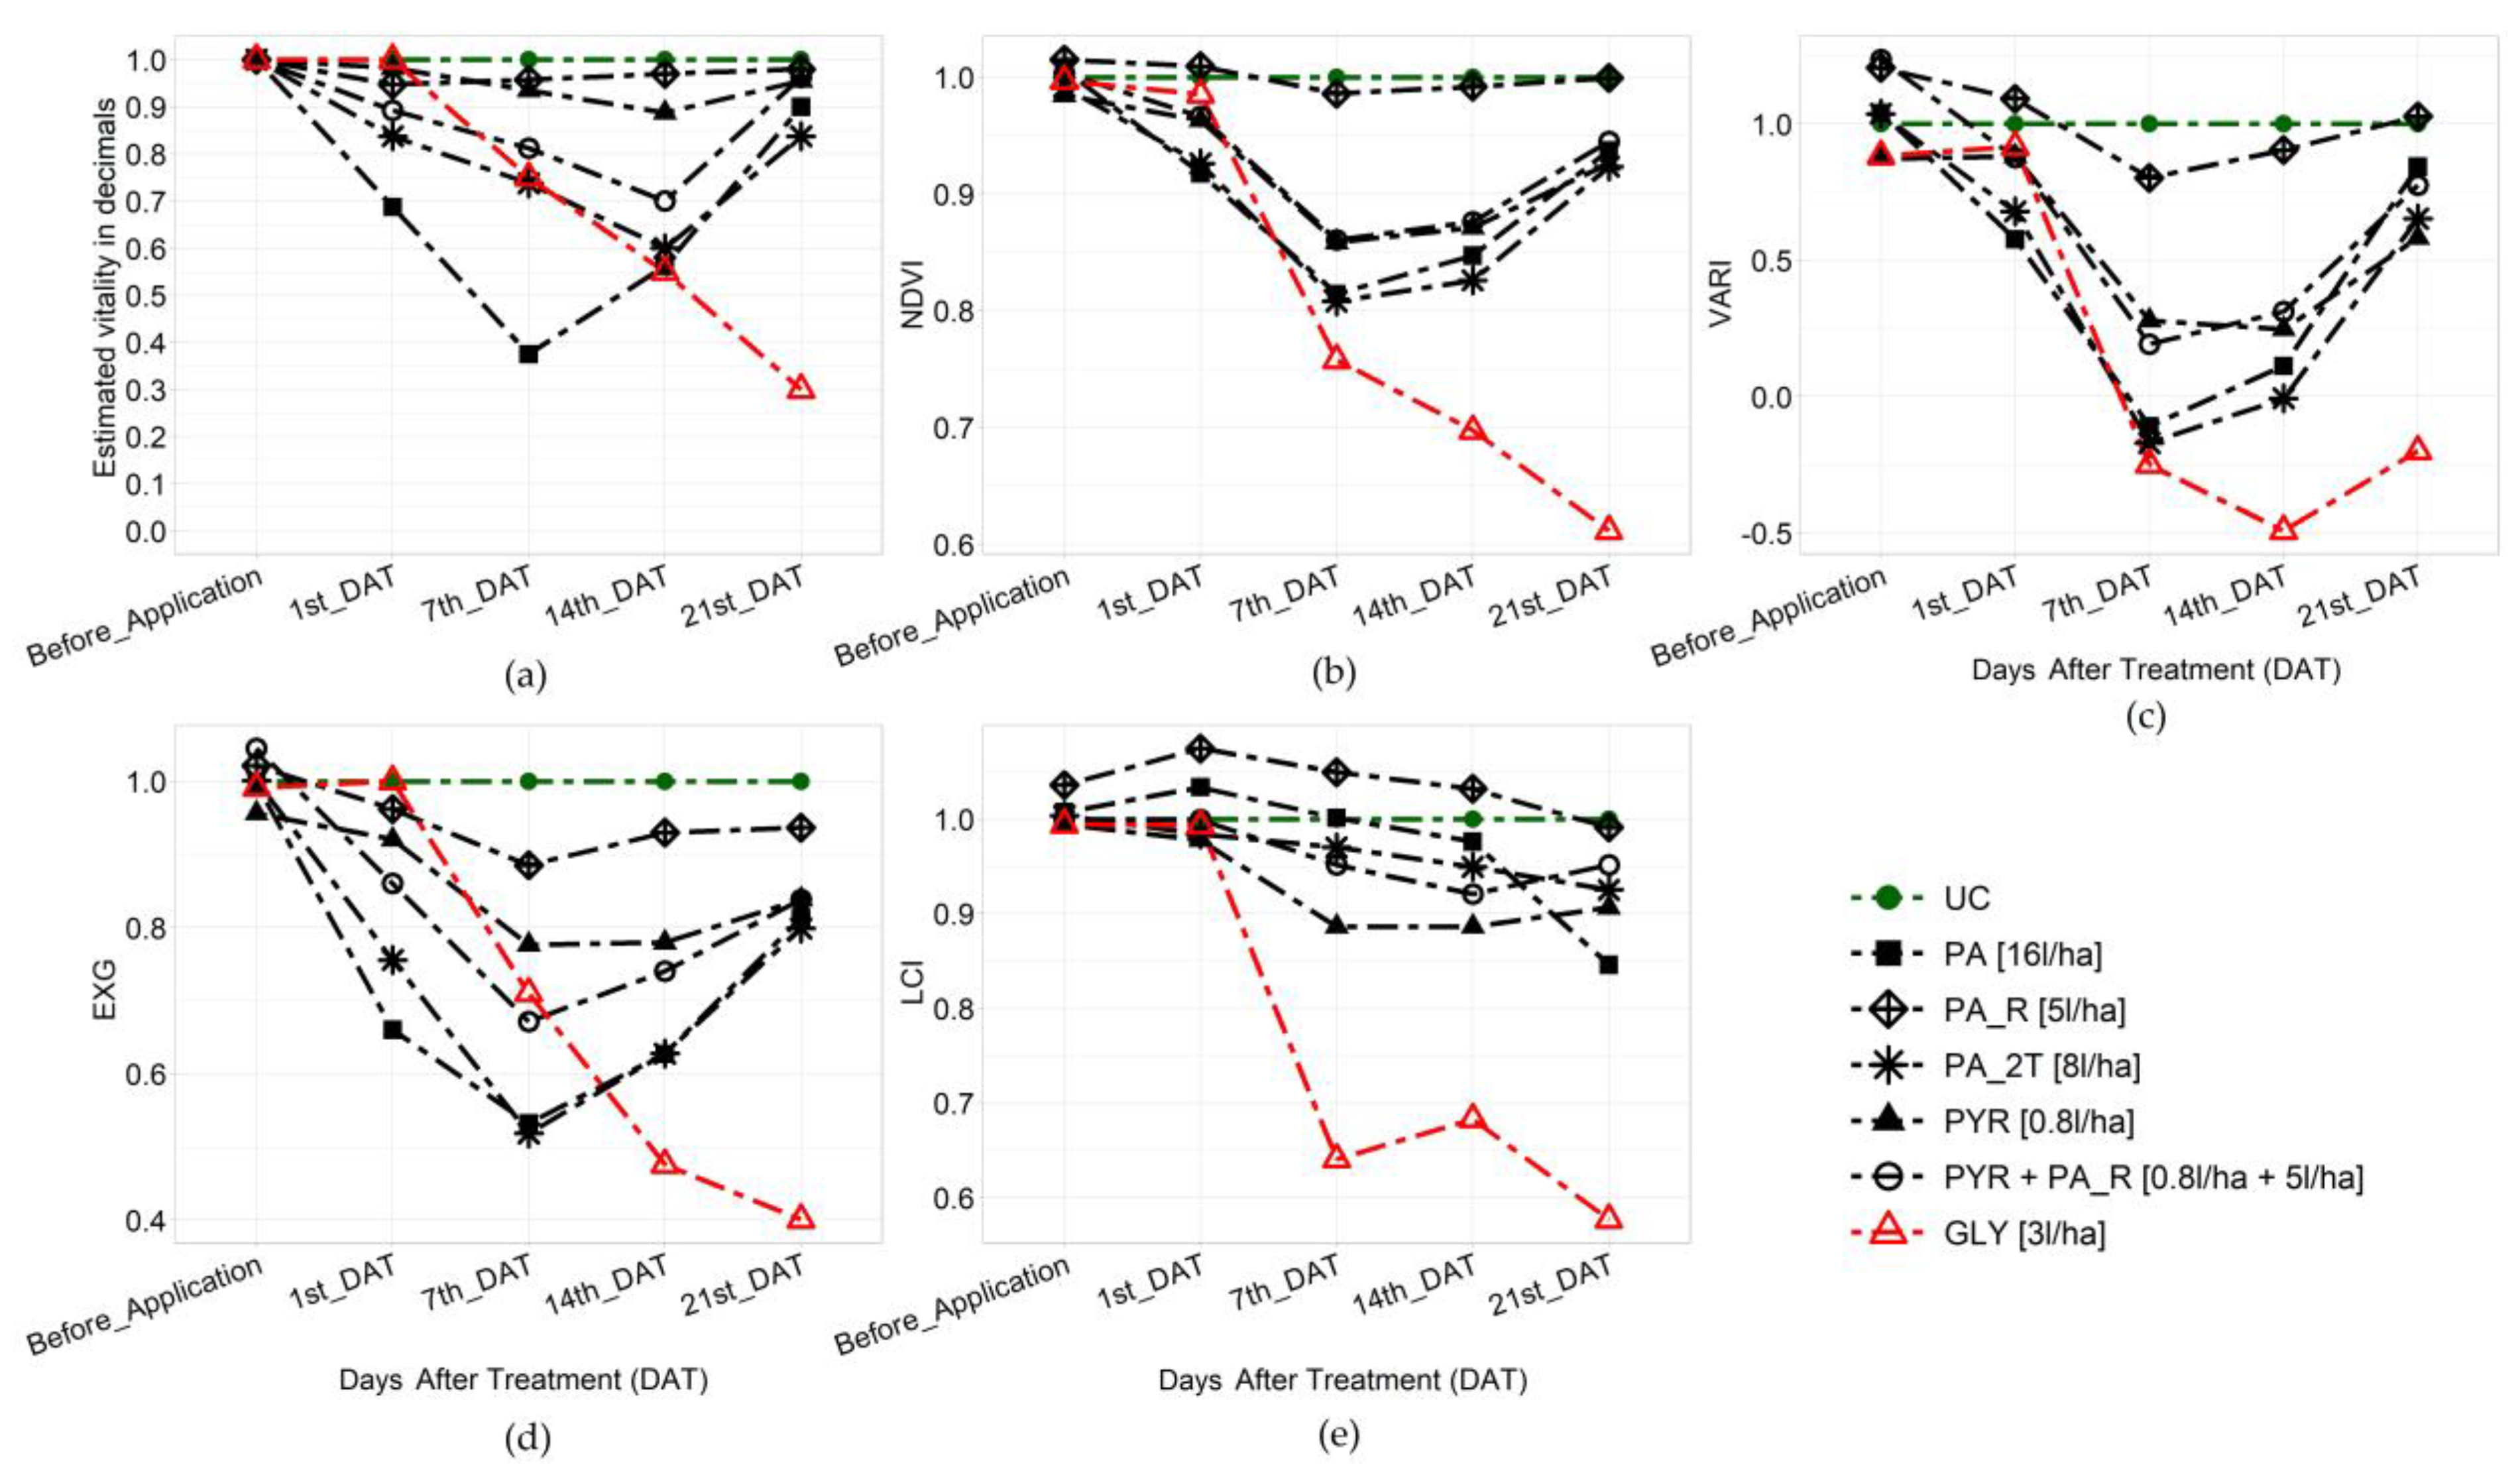
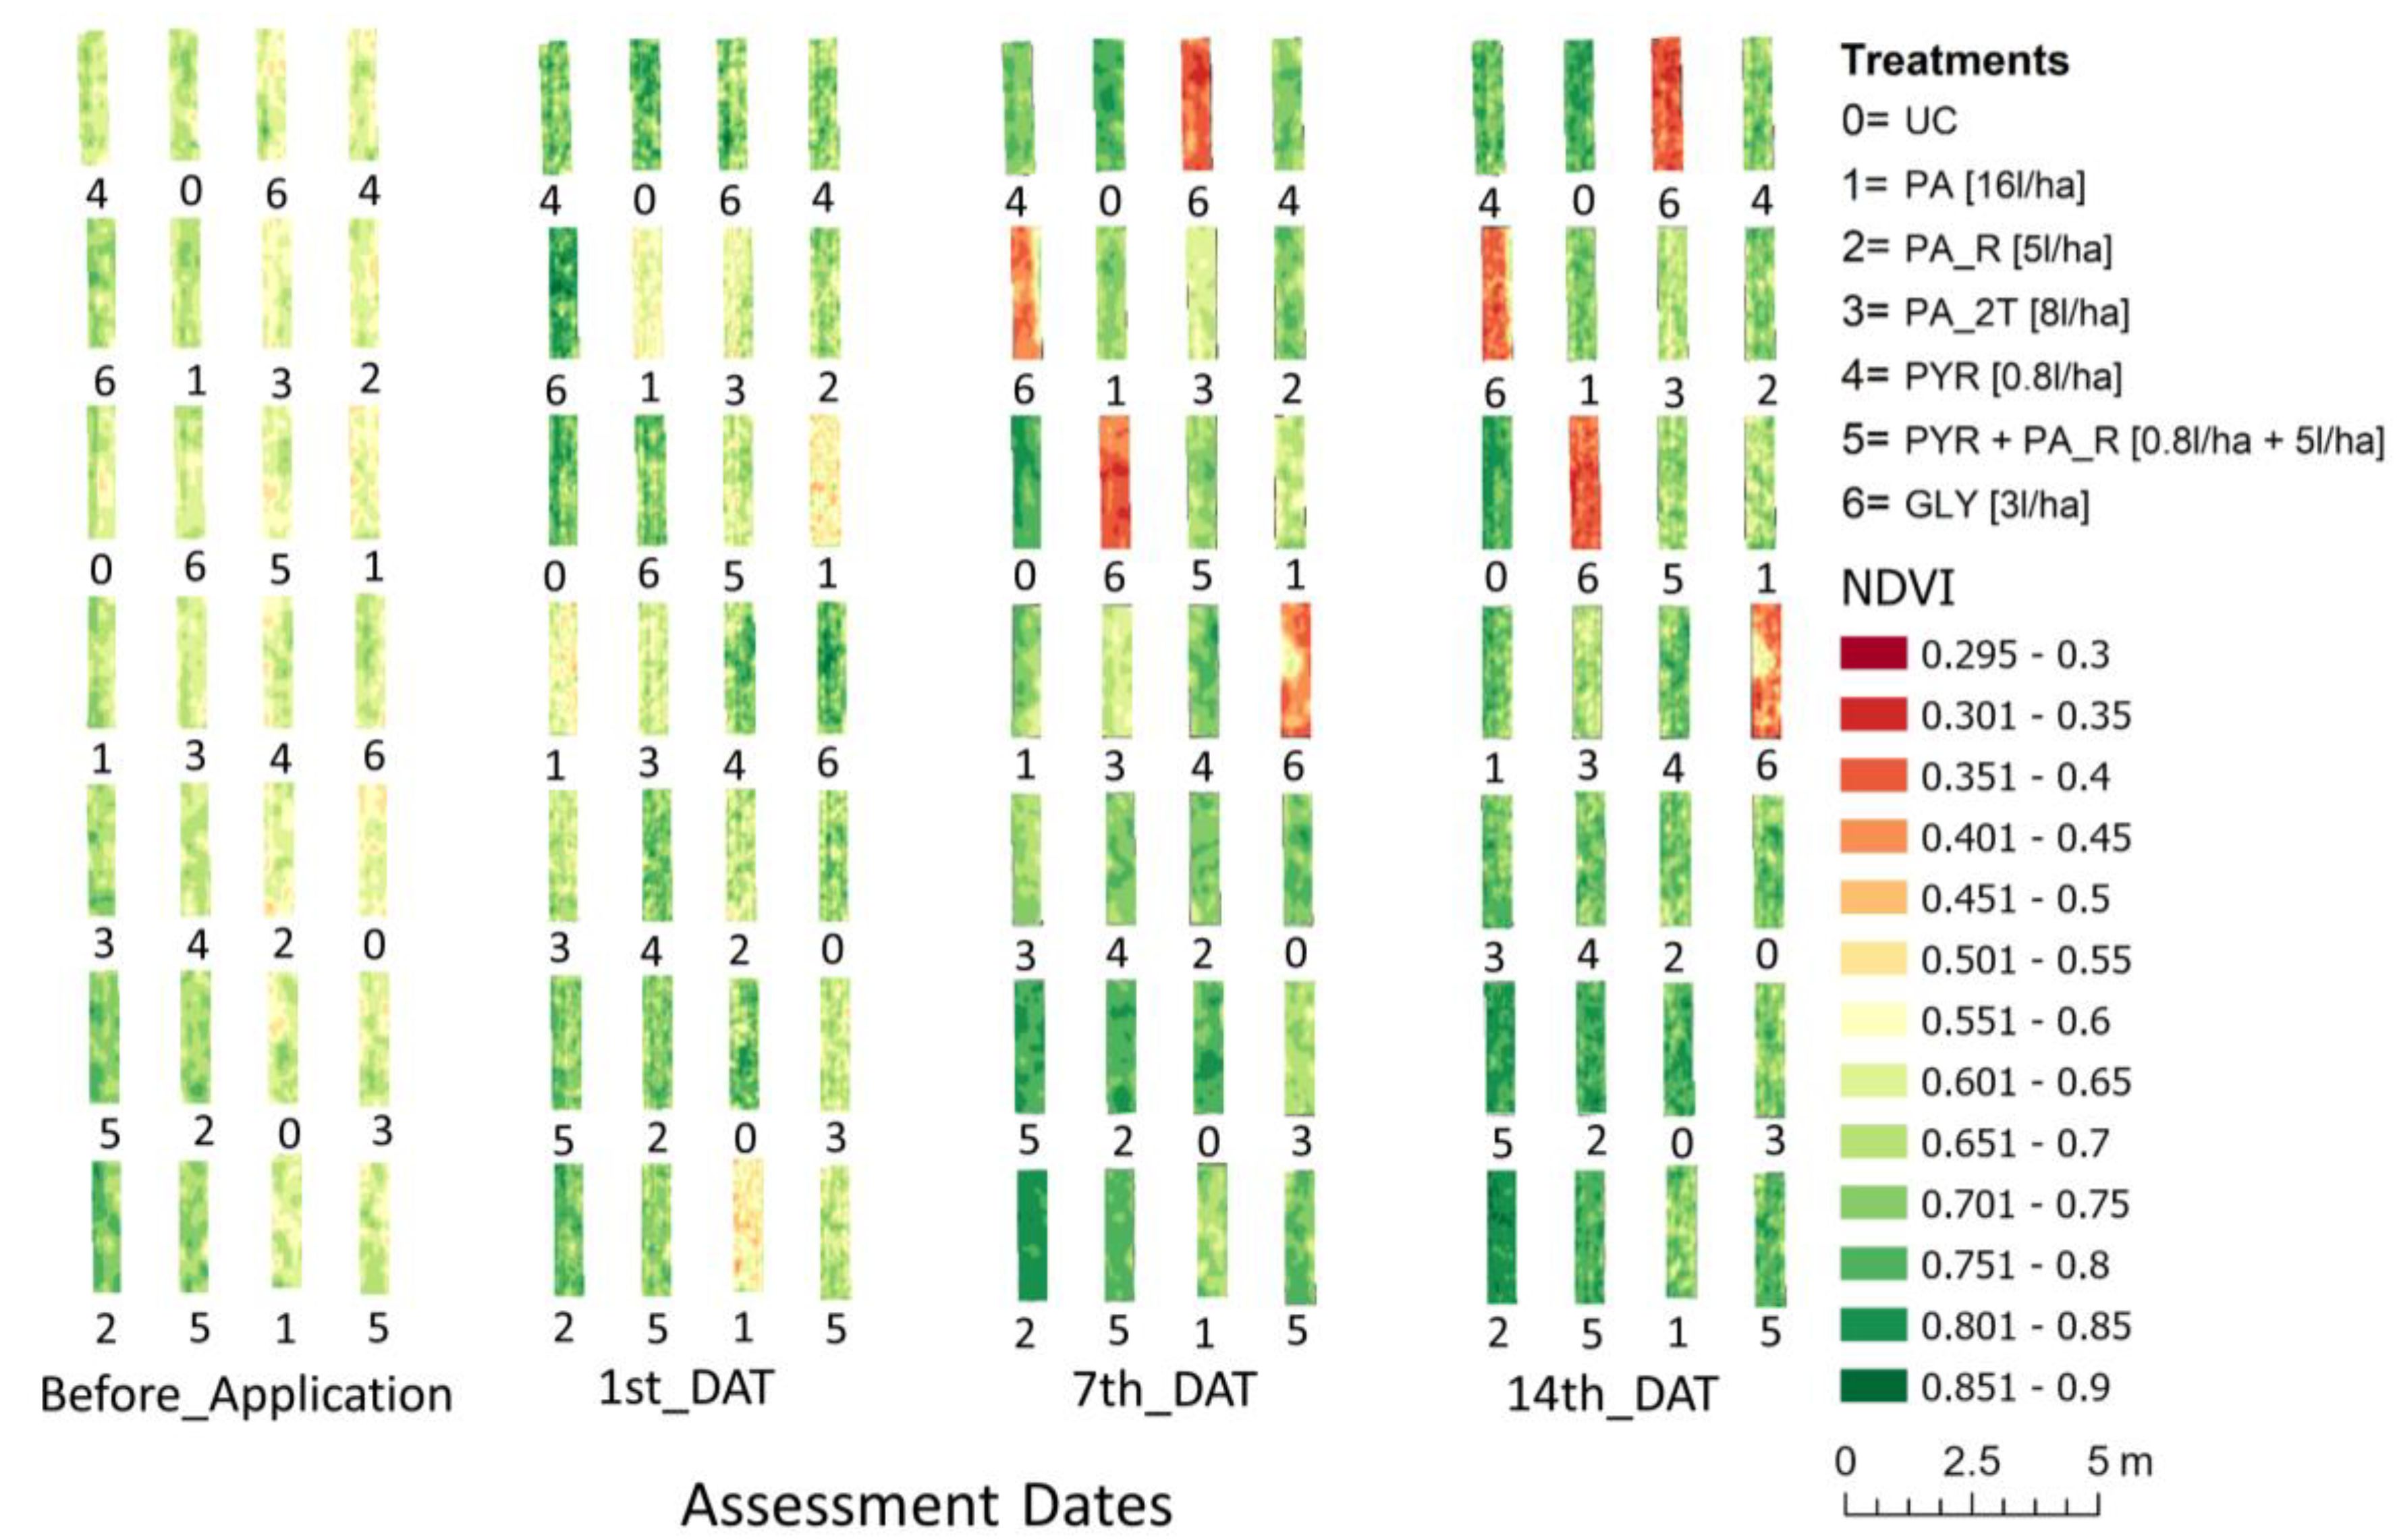
3.2. Vegetative Indices Calculated from Drone Images

To be able to compare visual observations with VIs, relative VI values compared with the untreated control plot were used. These are shown in Figure 4 and Figure 5. To render the visualisation comprehensible, the estimated vitality values were converted into decimal numbers and then used in the figures for illustration purposes. Furthermore, as these figures show, the estimated vitality obtained from visual observations and the drone-based approach (Vis) was very similar. The estimated vitality graph (Figure 4a and Figure 5a) shows that the effect of the treatments containing PA wore off over time, depending on the application rate and time of observation. In comparison, the onset of vitality loss caused by GLY came after a delay. Both experimental years showed similar results for PA and GLY. However, in 2021, PA showed a more satisfactory herbicidal effect, and the herbicidal effect of PA_2T was more constant during the experiment (Figure 4a). EXG exhibited a trend closer to the estimated vitality in both years (Figure 4 and Figure 5), while the trends for NDVI and VARI were closer to the estimated vitality in 2021 (Figure 5).
Figure 6 illustrates changes in plant vitality within the experimental plots before and after herbicide application in 2021, expressed by RGB imagery. Figure 7 shows the NDVI map of the experimental plots before and after herbicide application in 2021. In both figures, the effect of PA applied on four plots at 1st_DAT can be seen. These two figures also show the start of vitality loss in the plot treated with GLY from 7th_DAT up to the end of the experiment.

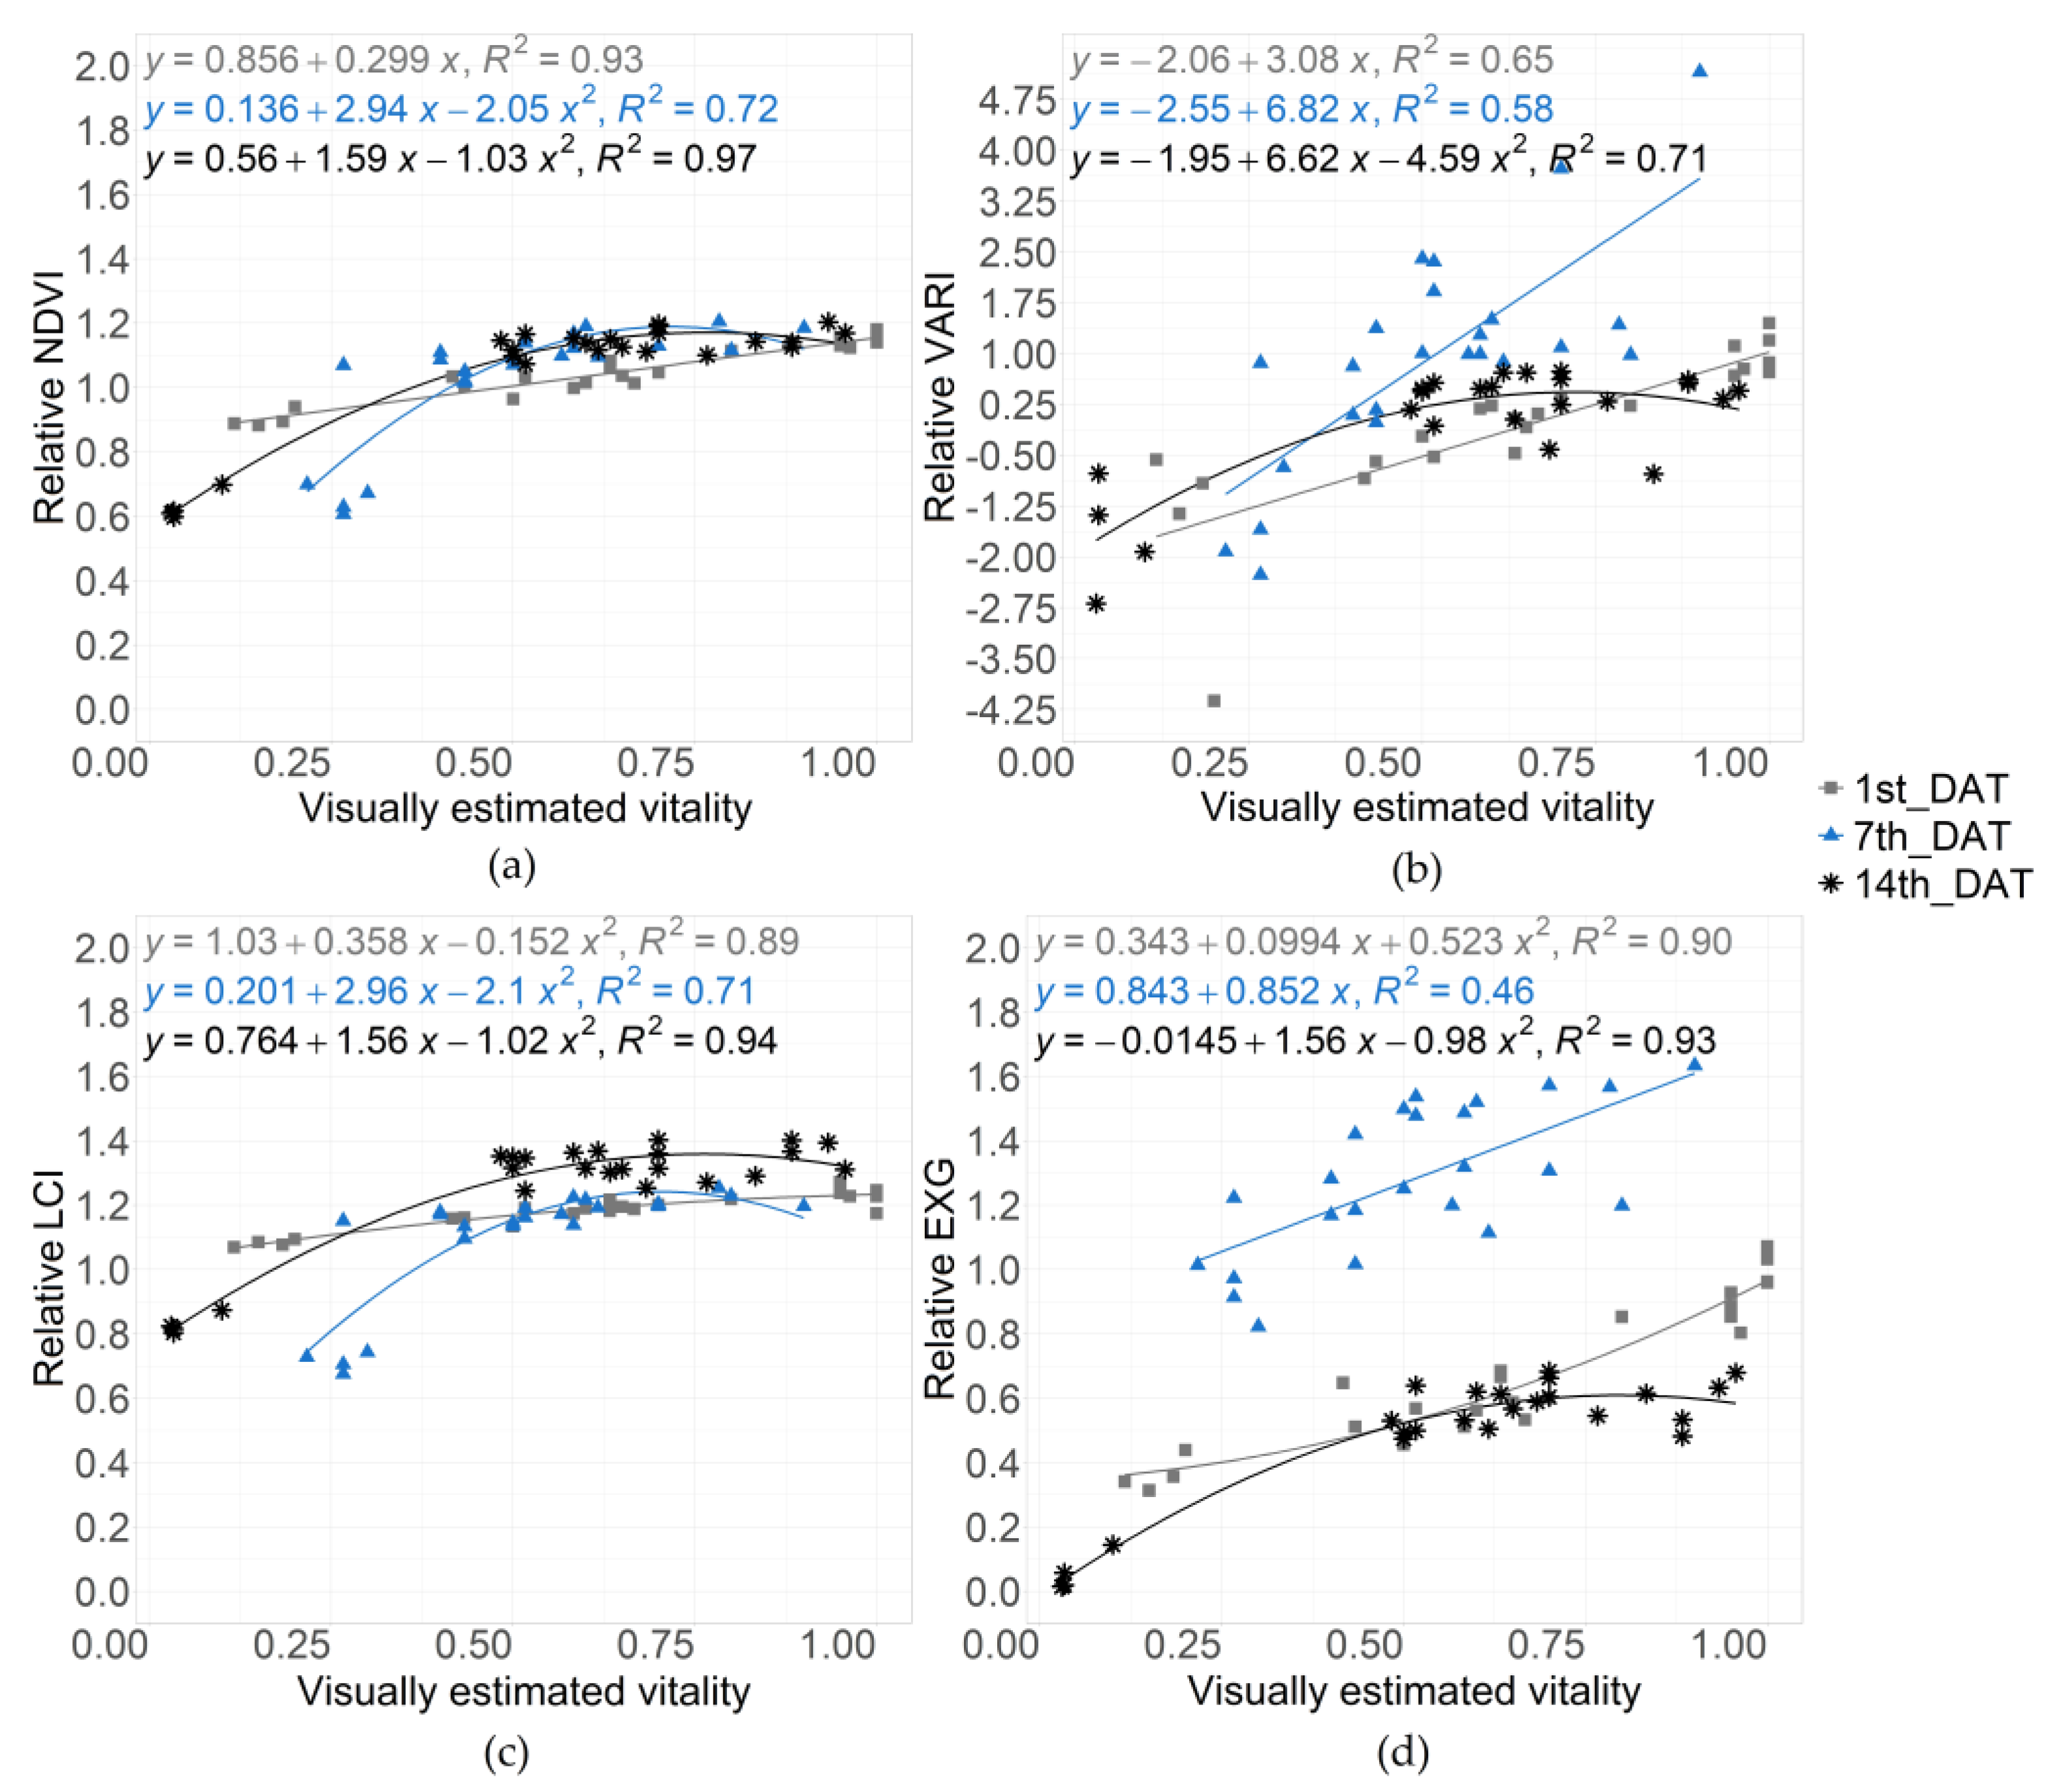
3.3. Relationship between Vegetative Indices and Visually Estimated Plant Vitality

The results of the regression analysis showed that in both years, there were significant positive relationships (p < 0.05) between NDVI and estimated visual plant vitality on all assessment days. In 2019, R2 at 21st_DAT was significantly higher than all other DATs (R2 = 0.93, p < 0.05). Coefficients of determination (R2) were 0.64 and 0.54 for 7th_DAT and 14th_DAT, respectively. The smallest correlation between these two variables occurred on 1st_DAT (Figure 8a). In 2021, the highest R2 was 0.96, which was determined for 14th_DAT (Figure 9a).
The relationship between VARI and estimated vitality was also positive in both years. The weakest relationship between these two variables occurred on 1st_DAT in 2019 (R2 = 0.35, p < 0.05). This correlation slightly improved to its strongest level at 7th_DAT (R2 = 0.68, p < 0.05) (Figure 8b). The results for 2021 showed a different relationship between VARI and estimated vitality. The strongest correlation occurred on 1st_DAT (R2 = 0.84, p < 0.05) and declined over time (Figure 9b). For 1st, 7th, and 14th_DAT, coefficient determination values for the correlation between LCI and estimated vitality were very low, with an incremental trend and change to a high correlation, with R2 of 0.61 at 21st_DAT (Figure 8c). In 2021, their relationship was significantly positive (p < 0.05) at 1st_DAT, 7th_DAT, and 14th_DAT, with R2 of 0.89, 0.67, and 0.94, respectively (Figure 9c). Regression analysis revealed a significant relationship (p < 0.05) between EXG and estimated vitality in 2019 for all assessment days (Figure 8d). In 2021, the EXG index exhibited a significantly high correlation at 1st_DAT and 14th_DAT. The R2 value for 7th_DAT was 0.46 (Figure 9d).

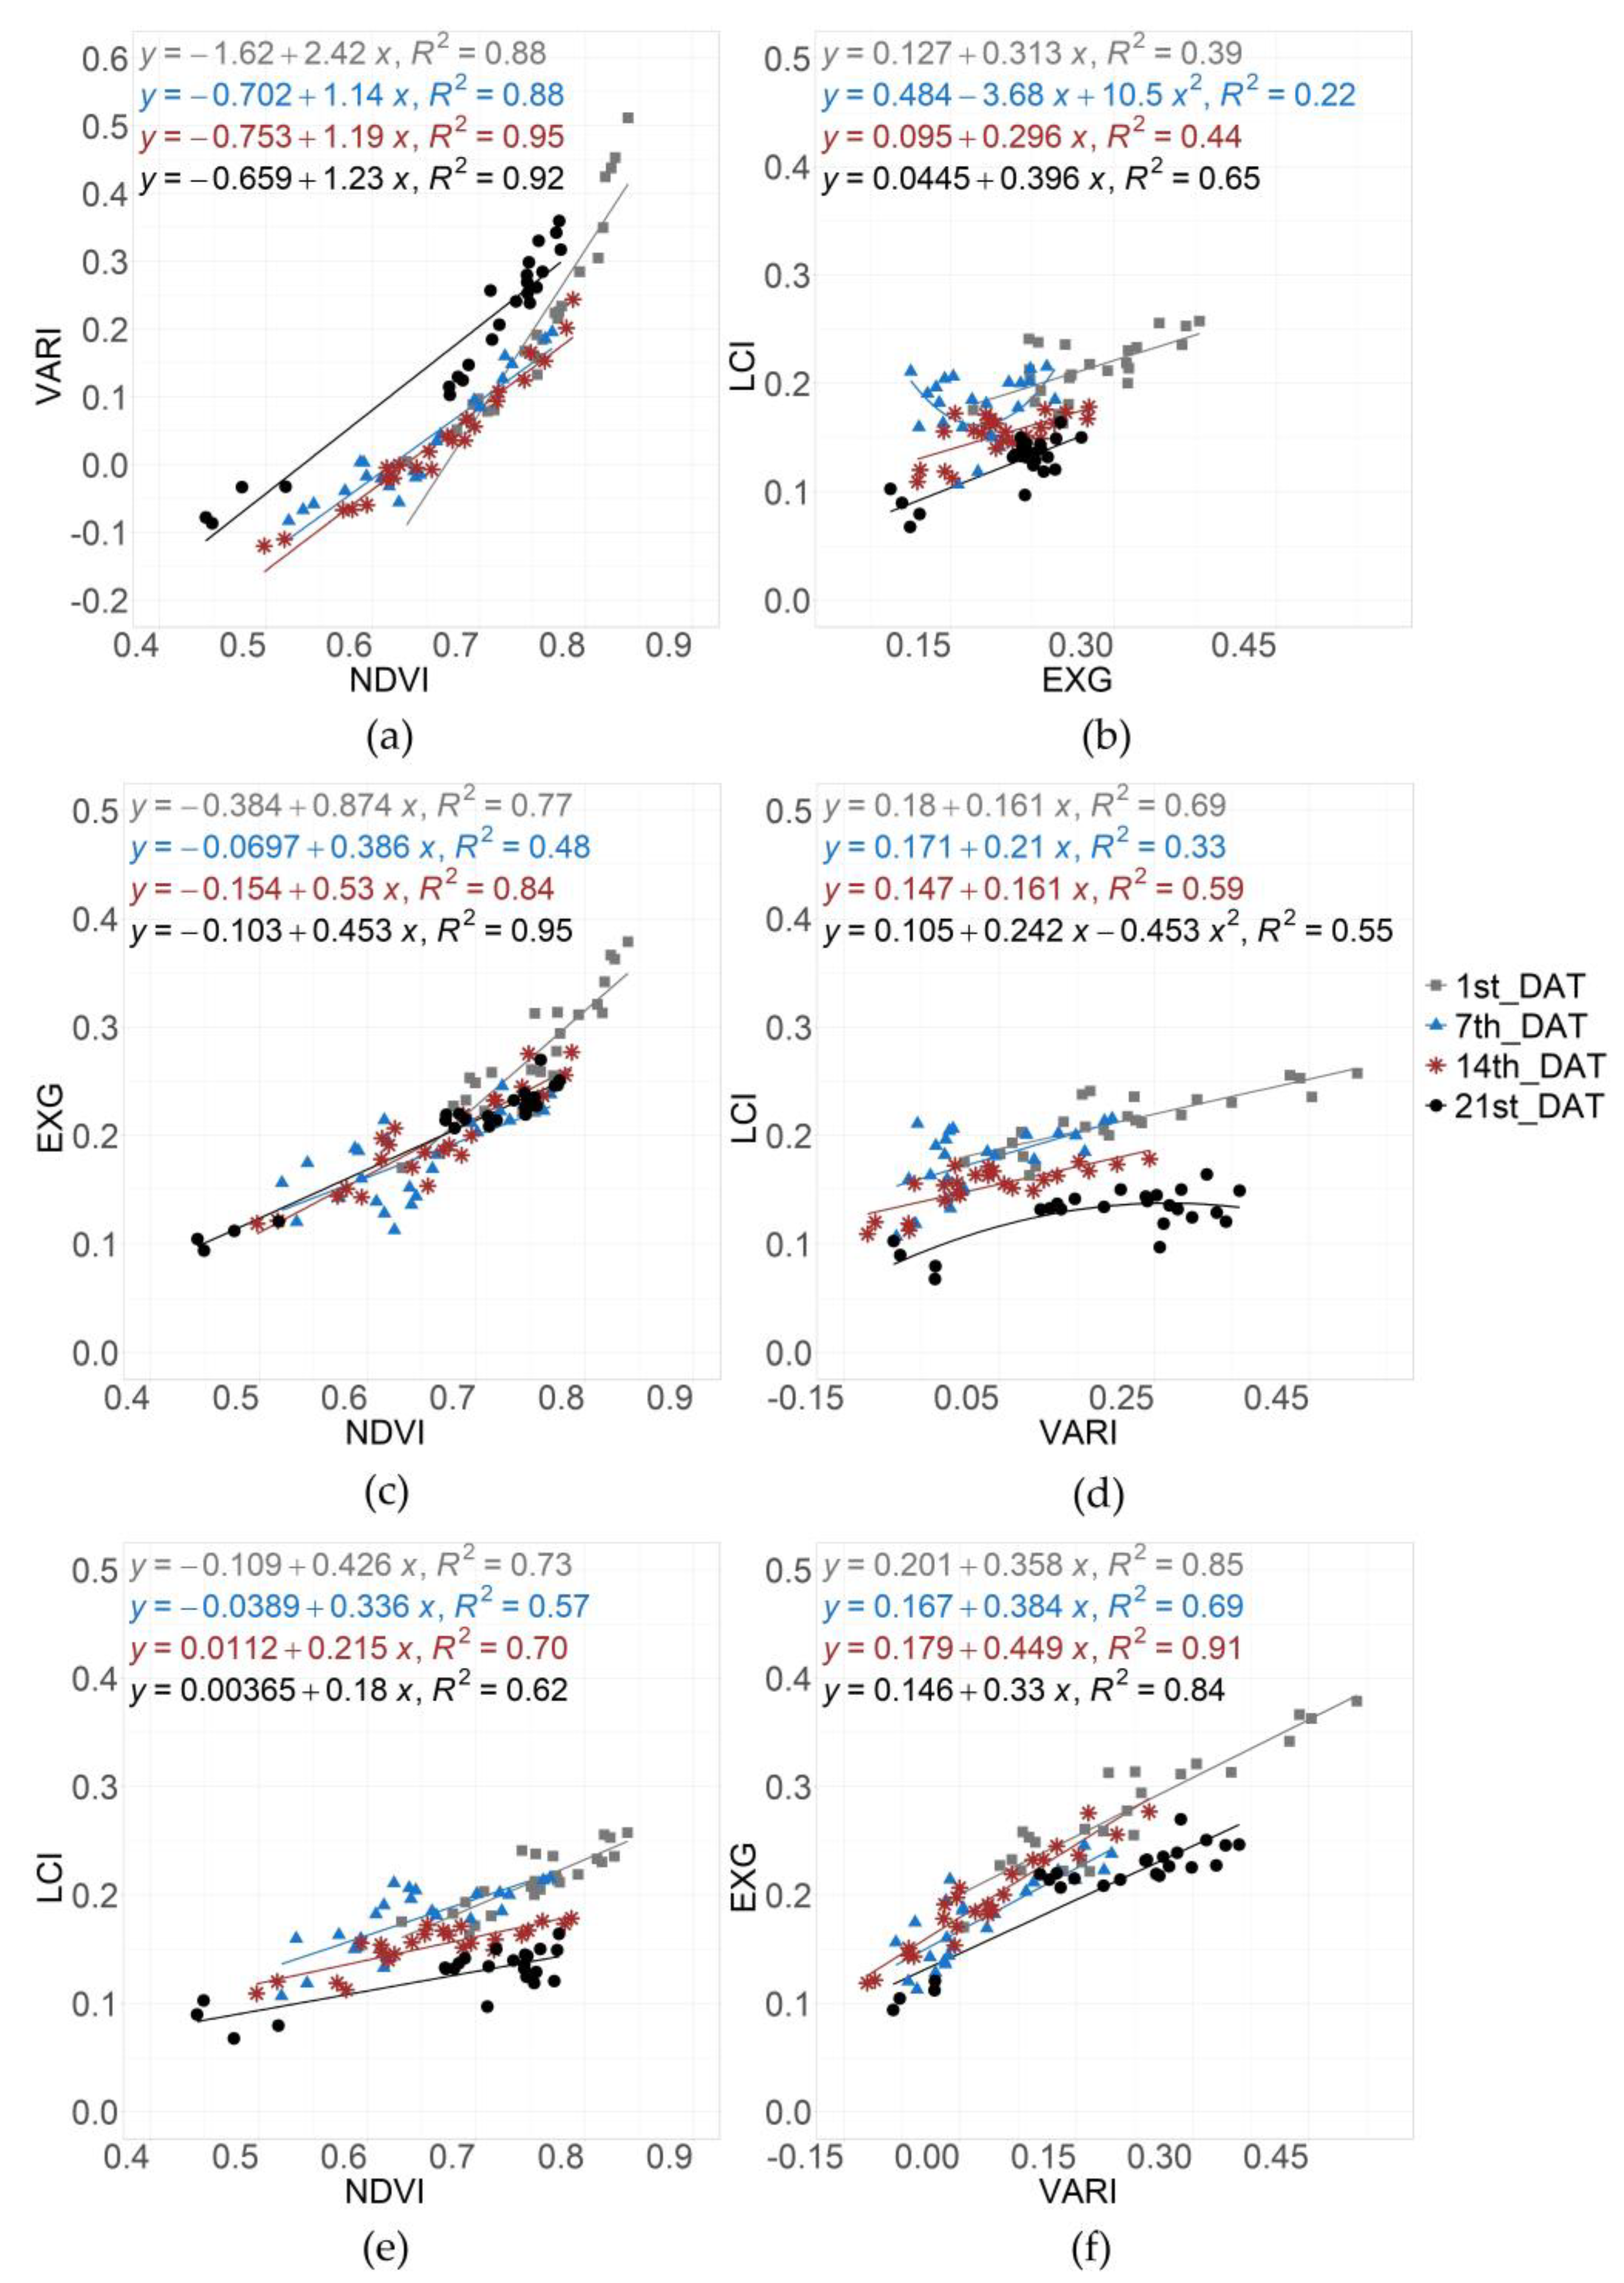
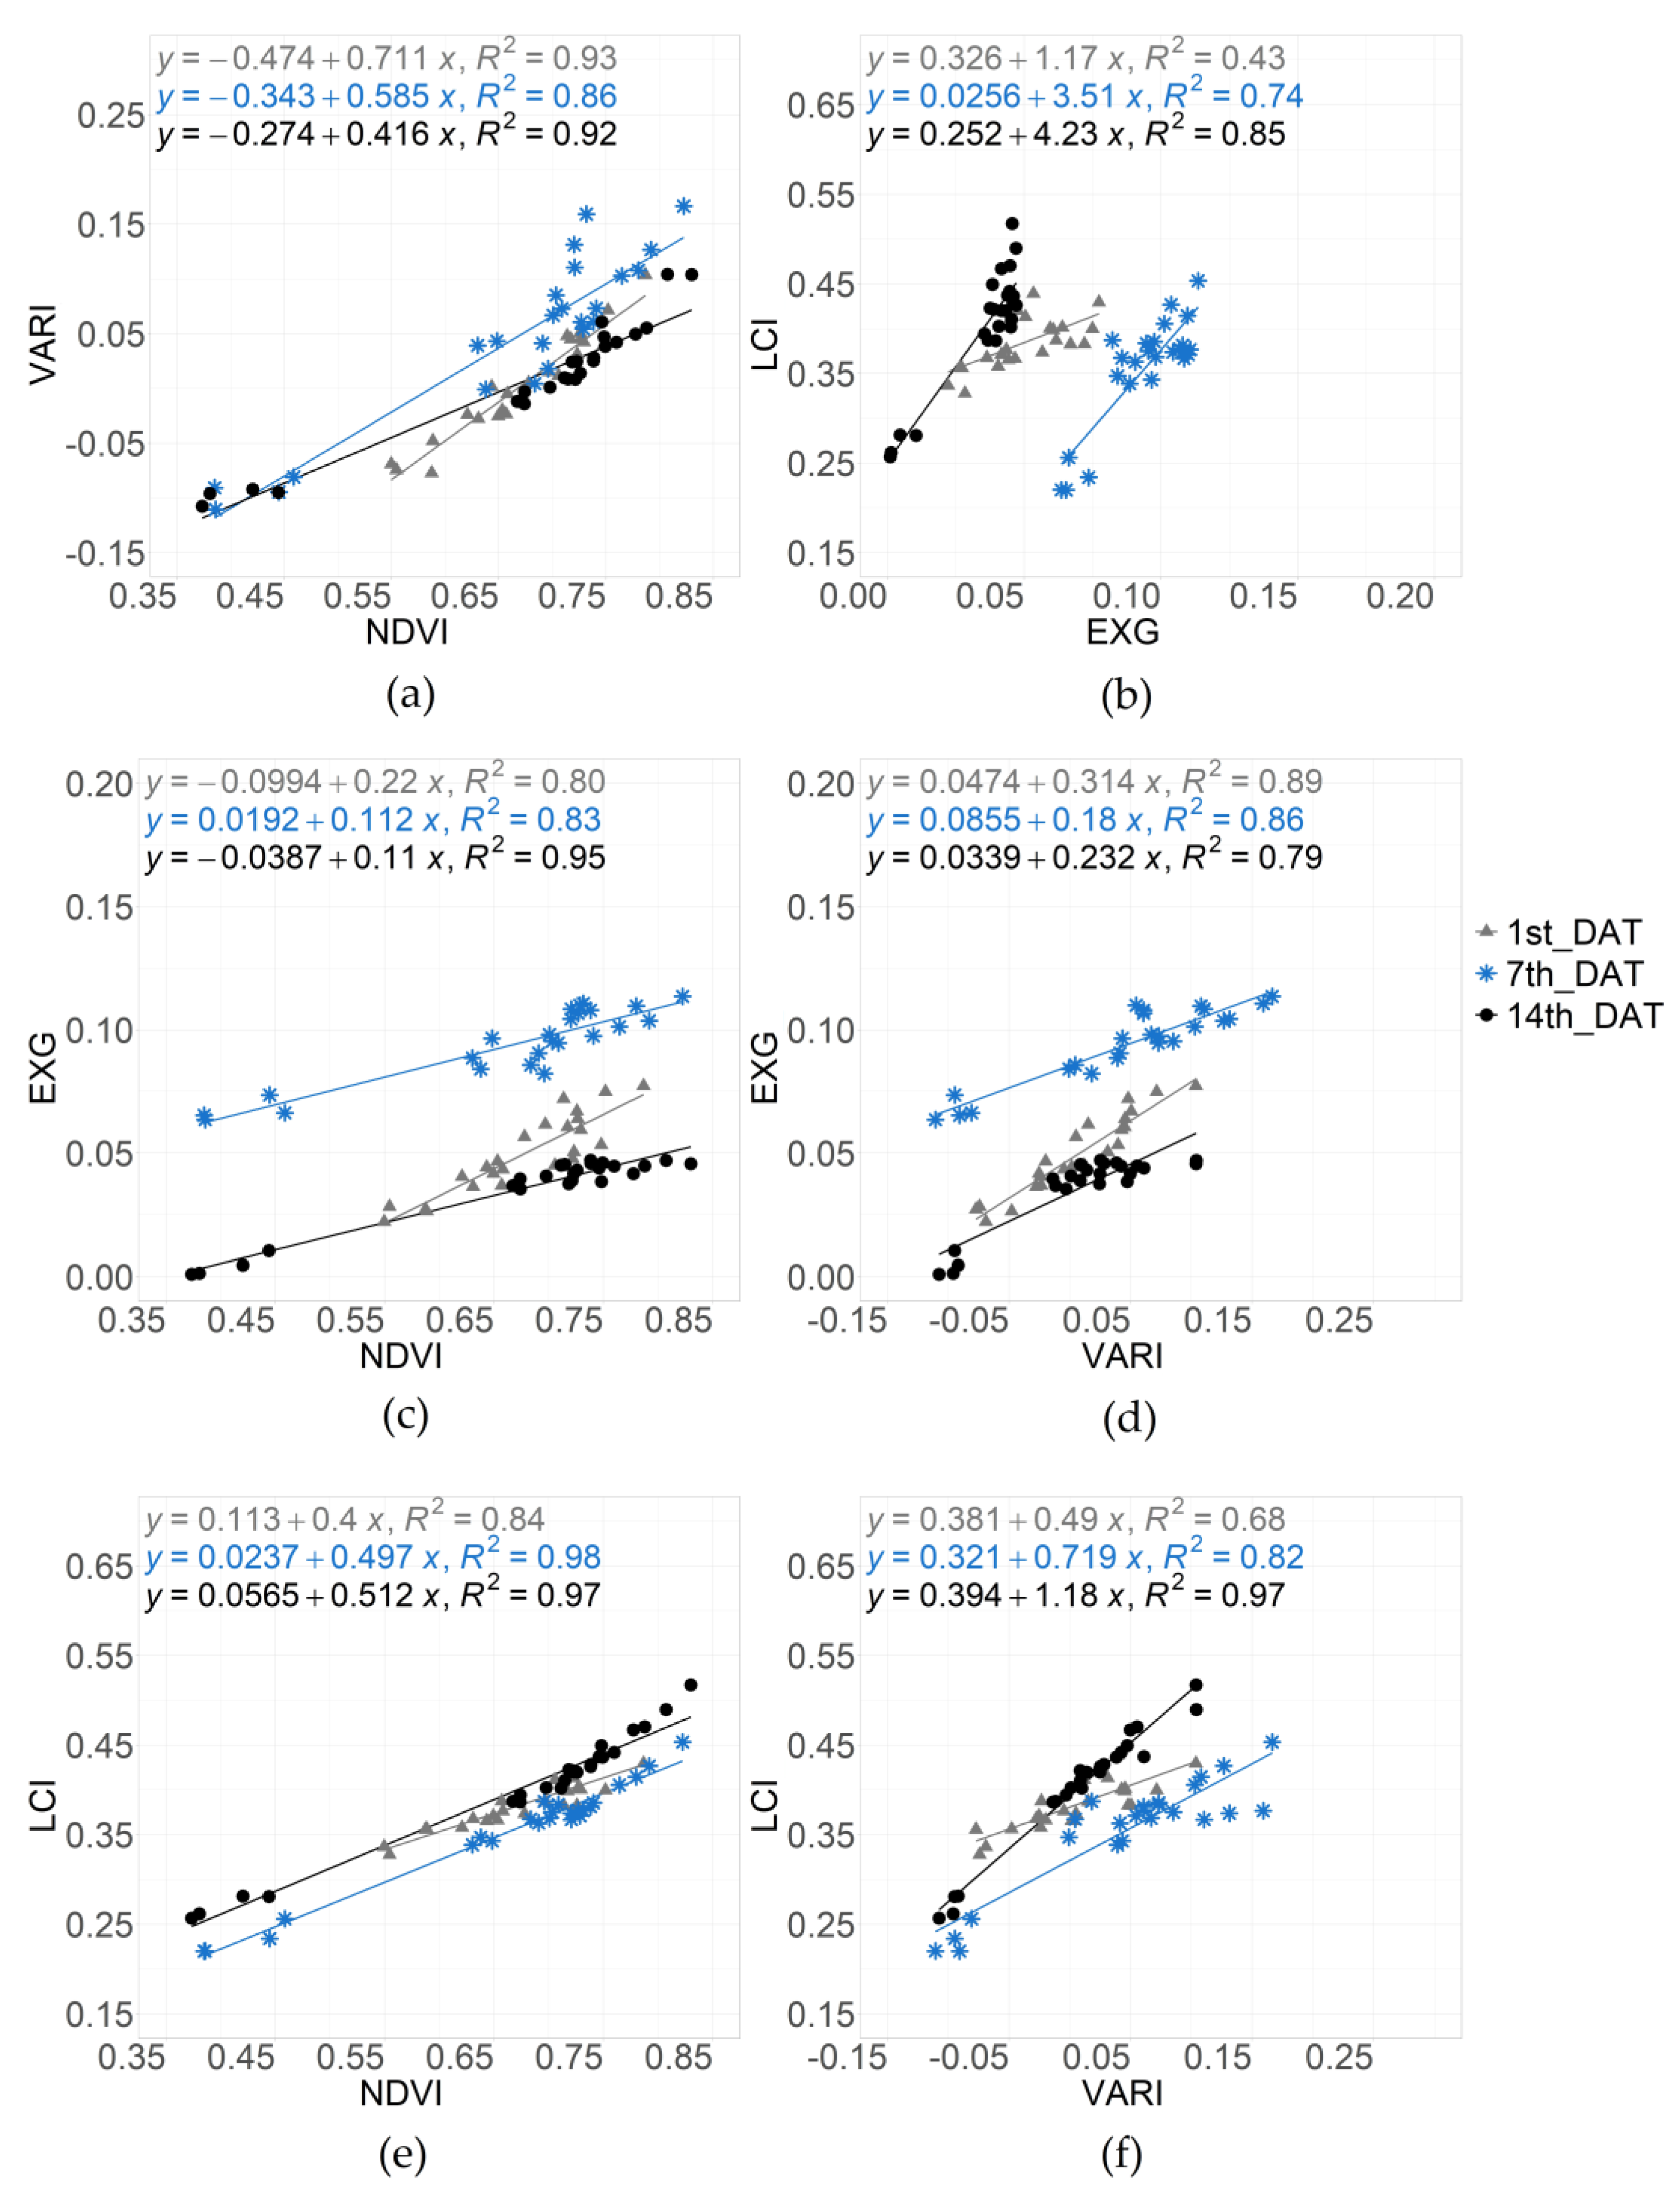
3.4. Relationships among Vegetative Indices

The results of the regression analysis showed that there were significant (p < 0.05) and strongly positive relationships among NDVI, VARI, and EXG on almost all assessment days in both years (Figure 10 and Figure 11). In 2019, the correlation between NDVI and VARI was higher than that between NDVI and EXG (Figure 10a,c). LCI displayed a strong correlation with NDVI on all DATs in 2019 (Figure 10e). Its relationship with VARI was not as strong as that with NDVI. At 1st and 7th_DAT, LCI exhibited a low correlation, which improved at 14th_DAT and reached its highest level (R2 = 0.65) at 21st_DAT (Figure 10d).
In 2021, the results of the regression analysis showed that LCI had a significant positive relationship (p < 0.05) with NDVI on all assessment days (Figure 11e). The relationship was similar between LCI and VARI (Figure 11f). The relationship between EXG and LCI was significantly positive, but R2 for 1st_DAT was 0.43 (Figure 11b). In general, LCI displayed a higher correlation with NDVI and VARI than with EXG.

4. Discussion

The aim of this study was to test the effectiveness of pelargonic acid as a desiccation tool on the cover crop in comparison with other treatments. The results indicated that pelargonic acid was reasonably effective at controlling cover crop growth within a week of application. In both experimental years, PA (16 L/ha) and PA_2T (double application of 8 L/ha) showed their highest herbicidal effect, up to 7th_DAT. PA vitality loss decreased over time, while PA_2T continued to exhibit an almost constant effect for longer because of the second application one week later. Weber et al. (2014) report that repeated application of pelargonic acid could result in a high level of herbicidal control [44]. Due to the previously mentioned fact that glyphosate-based products will be severely restricted and likely banned in Europe in the near future [15], this study compared PA as a bio-based alternative with glyphosate (GLY). In contrast to PA, both in visual observations and using the drone-based approach (VIs), the herbicidal effect of GLY was not visible in the first few days of application because GLY absorption by the plant and subsequent translocation inside the plant take some days to exhibit significant effects, which is dependent on the type of plant (annual, perennial, developmental stage) and environmental factors [45,46,47]. This means that PA, as a non-selective contact herbicide, could potentially be a short-term but rapid destruction alternative to glyphosate, especially in volatile weather conditions or when there are work bottlenecks (lack of labour and/or machinery).
The results demonstrated an initial rise and subsequent fall in the efficacy of PYR and its mixture with PA_R in both assessment methods. This decrease in PYR efficacy could be explained by cover crop regrowth on 7th_DAT. However, pyraflufen efficacy has been proven to be relatively dependent on plant growth stage at the time of spraying [24,48], which might explain the lower efficacy of PYR in the present study. The results obtained from the PYR+PA_R treatment in this experiment also demonstrated that mixing pyraflufen with other post-emergence herbicides increases herbicidal efficacy [24]. However, the efficacy enhancement caused by mixing pyraflufen with pelargonic acid was approximately 5% greater than the single PYR treatment and 17% higher than the single PA_R treatment.
Since visual assessments of herbicidal effects are subject to human error and require a lot of time and effort [25], the applicability of VIs for assessing herbicide effectiveness on cover crops was investigated. The VIs NDVI, VARI, LCI, and EXG were individually compared with the visual vitality estimation and with each other.
This research showed that EXG’s correlation with estimated vitality proved to be better than the correlation of other VIs with estimated vitality. The reason for this is that EXG reacts more to leaf discoloration [49], i.e., plant vitality [28]. Yun et al. (2016) reported that EXG values derived from UAV low-flight-altitude RGB images for experimental plots without herbicide application were higher than those with herbicide application [49]. Their study proves that EXG values can be used to ascertain the impact of herbicide use on plant growth [49]. According to Streibig et al. (2014) and Rasmussen et al. (2016), this index can be used to quantify crop injury from herbicide use [28,32]. It is an efficient VI because it can be obtained using consumer-grade cameras mounted on UAVs [32]. On the basis of research by Yang (2018), EXG can distinguish vegetation from the surrounding environment precisely [38]. Torres-Sánchez et al. (2014) have also reported that the EXG index obtained from RGB images can be used to visualise the vegetation fraction and vegetation growth accurately [50]. At the start of the experiment in 2019, there were a large number of flowering weeds in the experimental plots. Furthermore, before application in the same year, the field received less precipitation and was exposed to higher temperatures, which may explain cover crop coverage in the experimental field being less, revealing more of the soil background after application of the herbicide treatments. These results demonstrate that the presence of flowering weeds and soil background in this study did not negatively affect the EXG index.
Other than EXG, according to Henry et al. (2004) and Lewis et al. (2014), one of the common vegetative indices for detecting injury symptoms on plants caused by herbicides is NDVI [51]. In this experiment, on 1st_DAT in 2019, the application of PA treatments showed significantly more vitality loss in the visual observation (estimated vitality) than in the NDVI index. In addition, the correlation between estimated vitality and both NDVI and VARI was low on 1st_DAT in 2019. NDVI is calculated by mathematically comparing the amount of red light (which vegetation absorbs) and reflected near-infrared light (which vegetation reflects) [52]. This index is sensitive to plant chlorophyll content; therefore, plant vitality and biomass are often detectable using this vegetative index [53]. The chlorophyll pigments in a healthy plant absorb most of the visible red light, while the cell of the plant reflects most of the near-infrared light. This means that when a plant is very photosynthetically active, less NIR will be reflected [51]. Two factors might have affected NDVI in this experiment: the presence of weeds (mostly at flowering stage) and the fact that the plants were damaged because of herbicide application. However, in some plots, the plant cells were not permanently destroyed, just damaged, which had a small effect on reflected NIR, and, therefore, NDVI did not show as much damage as the visual observation suggested. In contrast to NDVI, VARI has a low sensitivity to atmospheric effects [36], but the reason for the low correlation with estimated vitality on 1st_DAT for this index was due to the fact that a high weed population negatively impacts VARI and produces lower values [54]. VARI can also be greatly affected by the background colour and a change in leaf colour. Its value increases with the development of vegetation coverage in the background during the vegetative stages unless inflorescence appears in the field [55]. Therefore, both NDVI and VARI showed a higher correlation with estimated vitality at 7th_DAT, when weed density was reduced following herbicide applications and the cover crop started to regrow and produce a vegetative coverage. In previous studies, NDVI has been found to be more effective than VARI in evaluations of crop health in fields [26].
With regard to the leaf chlorophyll index (LCI), previous studies have shown that this index has a high correlation with plant chlorophyll content [56]. Changes in a plant’s physical and biochemical structure caused by a stress factor could influence chlorophyll as an important pigment in photosynthesis [30]; therefore, the LCI value will decrease due to the reduction in this pigment content [56]. Nonetheless, in the present study, LCI showed heterogeneity in both experimental years. This may be due to the scale at which this index was tested for its correlation with estimated vitality and other vegetative indices. The correlation between VIs and plant parameters might reflect variability on different scales, meaning that those that are strongly correlated with a plant parameter on a certain scale may exhibit a very weak correlation on another scale. In the case of LCI, when the amount of foliage in the plant canopy is low, LCI has a low correlation with a plant’s chlorophyll on a canopy scale, while it shows a high correlation with chlorophyll content on a leaf scale [33,57]. In this study, the soil was not completely covered by the cover crop in 2019 due to less precipitation and higher temperatures in the growing season and to the existence of a high weed infestation. Therefore, during the period of 1st to 14th_DAT, LCI was heavily influenced and exhibited weak correlations with estimated vitality. After cover crop regrowth, LCI showed a higher correlation with estimated vitality on 21st_DAT. Previous studies have demonstrated the negative effects of low vegetation coverage and the presence of soil background on NIR- and red-edge-based indices [34].
The relationship analysis of VIs in the current study revealed that NDVI and VARI were highly correlated on all assessment days in both years. NDVI and VARI also correlated linearly with EXG on all assessment days in both years. The high correlation between EXG and VARI indices is in line with the findings of Zhang et al. (2019) in an assessment of turf grass performance [58] and another study estimating the aboveground biomass of wheat [59].

5. Conclusions

The cover crop’s high susceptibility to the PA and PA_2T treatments in the early days after application was proven by both the visual and drone-based assessments. The results confirmed that pelargonic acid has the potential to be a more sustainable alternative to synthetic herbicides. The possible ban of glyphosate in Europe requires further research to be undertaken on bio-based herbicides. Pelargonic acid has been registered on the European market for use as a plant desiccant in potatoes and to kill suckers in perennial crops, such as hops and grapevine. However, it is currently not registered for other management purposes in arable crops. The results of this study demonstrate that pelargonic acid has considerable potential to be an additional tool in integrated crop management. Future use registrations, e.g., for cover crop desiccation or the control of monocotyl and dicotyl weeds in arable crops, would allow the use of pelargonic acid as a substitute for glyphosate. Moreover, details on its technical application (water temperature, adjuvants, and the effect of weather conditions during/after application) require further investigations to ensure its suitability for on-farm use.
With regard to the drone assessment, it was concluded that VIs obtained by drone imagery can be used to monitor the effectiveness of herbicide desiccation methods in cover crops. Furthermore, the EXG index demonstrated its ability to visualise the effect of herbicides with a high degree of accuracy on all assessment days. As an RGB-based index obtainable with customer-grade cameras, EXG presents a more cost-effective option than NIR-based indices and offers an alternative to visual observation. LCI is the most sensitive and least robust VI to bi-directional reflectance distribution function (BRDF), shade, and other irregularities, such as flowering weeds in the crop cover. However, if the vegetation cover is homogeneous, it is a very good VI for determining plant stress and changes in leaf chlorophyl.

Author Contributions

Conceptualization, E.G. and S.A.; methodology, E.G., G.G. and S.A.; validation, E.G. and S.A.; formal analysis, E.G.; investigation, E.G.; resources, G.G.; data curation, E.G. and G.G.; writing—original draft preparation, E.G.; writing—review and editing, E.G., G.G. and S.A.; visualization, E.G. and G.G.; supervision, S.A. All authors have read and agreed to the published version of the manuscript.

Funding

This research was part of the project “AC/DC-weeds—Applying and Combining Disturbance and Competition for an agro-ecological management of creeping perennial weeds” funded by ERA-Net Cofund SusCrop/EU Horizon 2020, Grant no. 771134. The German part is funded by DFG (Deutsche Forschungsgemeinschaft), GE 558/3-1.

Data Availability Statement

The data presented in this study are available upon reasonable request from the corresponding author. The data are not publicly available due to project funding policy.

Acknowledgments

We sincerely thank our colleagues in the Crop Health group at the University of Rostock for their technical assistance. We also would like to acknowledge the support of the Department of Hydrology and Applied Meteorology at the University of Rostock for providing weather data.

Conflicts of Interest

The authors declare no conflict of interest.

Appendix A

Table A1. Results of a comparison of treatments using absolute values of vegetation indices at different DATs in 2019.
VITreatmentMeanMean Rank
Before1st_DAT7th_DAT14th_DAT21st_DAT1st_DAT7th_DAT14th_DAT21st_DAT
NDVIUC0.8470.7900.7570.7760.77118a24.75a25a24.25a
PA0.8510.7210.6140.6560.7239.25a11bc11.75b13b
PA_R0.8590.7960.7460.7700.77120a24a24a24.75a
PA_2T0.8380.7270.6100.6410.7128.5a9.25bc10b11.25b
PYR0.8330.7580.6490.6760.71414a12.5bc13.75b12.75b
PYR+PA_R0.8480.7600.6490.6790.72914.5a14b14.5b13b
GLY0.8440.7790.5750.5420.47217.25a6c2.5c2.5c
VARIUC0.3840.3170.2300.2240.33219ab25.25a24.5a21.25ab
PA0.3680.116−0.0270.0140.2477.75b8.5cd11.75b16.75abc
PA_R0.4360.3040.1720.1910.32619.75a23.75a24.5a24.25a
PA_2T0.3480.129−0.0310.0010.2018.5ab6.75d9.75b12.25c
PYR0.3170.2250.0570.0500.18214ab17b14b10.25c
PYR+PA_R0.4280.1980.0310.0520.23014ab14bc14.5b14.25bc
GLY0.3420.312−0.043−0.091−0.05718.5ab6.25d2.5c2.5d
EXGUC0.3090.3250.2600.2810.27021a26.25a26a25.75a
PA030702110.1380.17602203c5.25d8.75c11.5bc
PA_R0.3150.3120.2300.2610.25319.25a22.25a22.75a23.25a
PA_2T0.3080.2410.1350.1770.2168bc4.75d9.25c8.75c
PYR0.2950.2960.2020.2190.22715.75ab17b17b15b
PYR+PA_R0.3230.2770.1740.2080.22714.25ab11.75c14.75b14.75b
GLY0.30703270.1850.134010820.25a14.25bc3d2.5d
LCIUC0.2900.2150.1950.1690.14714.75a18.25ab21ab22a
PA0.2920.2170.1920.1640.12316a17.75ab18b10bc
PA_R0.3010.2290.2040.1740.14619a22a24.75a20.75a
PA_2T0.2910.2080.1860.1600.13512.25a15.75ab15.5bc15.25ab
PYR0.2880.2060.1710.1490.13312.25a11bc8.75de13.25ab
PYR+PA_R0.2900.2110.1830.1550.14012.5a14.25ab11cd17.5ab
GLY0.2890.2140.1250.1150.08514.75a2.5c2.5e2.75c
Letters show significant differences among treatments within each day at p < 0.05 using the Kruskal–Wallis test.
Table A2. Results of a comparison of treatments using absolute values of vegetation indices at different DATs in 2021.
VITreatmentMeanMean Rank
Before1st_DAT7th_DAT14th_DAT1st_DAT7th_DAT14th_DAT
NDVIUC0.6260.7320.7690.77021.75a23.5a22a
PA0.6330.5700.6880.7152.5d10.25c12b
PA_R0.6600.7010.7630.76416ab21ab19ab
PA_2T0.6350.6400.6620.7037.25cd7.25cd10.75bc
PYR0.6310.7170.7300.73518.75ab17b15.75ab
PYR+PA_R0.6650.6820.7500.76112.75bc20ab19.5ab
GLY0.6420.7440.4190.40522.5a2.5d2.5c
VARIUC0.0560.0670.1460.05423.5a23.75a21a
PA0.059−0.0670.0610.0242.5d12.75bc14.75ab
PA_R0.0830.0140.1110.04613.75c19.75a18.5ab
PA_2T0.058−0.0250.0150.0106.5d6.5cd10.5bc
PYR0.0500.0370.1010.02518.5b18.25ab15.25ab
PYR+PA_R0.0850.0090.0920.04912.25c18ab19ab
GLY0.0700.068−0.094−0.09824.5a2.5d2.5c
EXGUC0.0710.0640.1240.04921.75b26.5a26.5a
PA0.0720.0260.0940.0412.5f10.5d11d
PA_R0.0780.0520.1100.04514.25c20.75b17.25c
PA_2T0.0720.0390.0850.0376.5e6.5e7d
PYR0.0710.0610.1080.04619.5b20.25b21.5b
PYR+PA_R0.0790.0450.1000.04310.75d14.5c15.75c
GLY0.0720.0730.0670.00426.25a2.5f2.5e
LCIUC0.3150.4020.3940.44719.25a20a20a
PA0.3180.3440.3660.4172.5c12ab13a
PA_R0.3300.3980.4030.45217ab20.25a18.5a
PA_2T0.3200.3710.3600.4139.5bc11bc12ab
PYR0.3190.3970.3760.42518.5ab15.25ab15.25a
PYR+PA_R0.3320.3930.3970.45016.5ab20.5a20.25a
GLY0.3260.3990.2330.27018.25ab2.5c2.5b
For each VI, letters show significant differences among treatments within each day at p < 0.05 using the Kruskal–Wallis test.

References

  1. Legleiter, T.; Johnson, B.; Jordan, T.; Gibson, K. Successful Cover Crop Termination with Herbicides. Purdue University, Purdue External Bulletin WS-50-W. 2012. Available online: https://www.extension.purdue.edu/extmedia/ws/ws-50-w.pdf (accessed on 7 November 2022).
  2. Ulcuango, K.; Navas, M.; Centurión, N.; Ibañez, M.Á.; Hontoria, C.; Mariscal-Sancho, I. Interaction of Inherited Microbiota from Cover Crops with Cash Crops. Agronomy 2021, 11, 2199. [Google Scholar] [CrossRef]
  3. Rosario-Lebron, A.; Leslie, A.W.; Yurchak, V.L.; Chen, G.; Hooks, C.R.R. Can Winter Cover Crop Termination Practices Impact Weed Suppression, Soil Moisture, and Yield in No-till Soybean [Glycine max (L.) Merr.]? Crop Prot. 2019, 116, 132–141. [Google Scholar] [CrossRef]
  4. Tataridas, A.; Kanatas, P.; Chatzigeorgiou, A.; Zannopoulos, S.; Travlos, I. Sustainable crop and weed management in the era of the EU Green Deal: A survival guide. Agronomy 2022, 12, 589. [Google Scholar] [CrossRef]
  5. Balkcom, K.; Schomberg, H.; Lee, R.D. Chapter 5: Cover Crop Management. In Conservation Tillage Systems in the Southeast: Production, Profitability and Stewardship; Bergtold, J., Sailus, M., Eds.; Sustainable Agriculture Research and Education (SARE): Washington, DC, USA, 2020; pp. 56–76. [Google Scholar]
  6. Pittman, K.B.; Cahoon, C.W.; Bamber, K.W.; Rector, L.S.; Flessner, M.L. Herbicide selection to terminate grass, legume, and brassica cover crop species. Weed Technol. 2020, 34, 48–54. [Google Scholar] [CrossRef]
  7. Schmitt, M.B.; Berti, M.; Samarappuli, D.; Ransom, J.K. Factors affecting the establishment and growth of cover crops inter sown into maize (Zea mays L.). Agronomy 2021, 11, 712. [Google Scholar] [CrossRef]
  8. Eash, L.; Berrada, A.F.; Russell, K.; Fonte, S.J. Cover Crop Impacts on Water Dynamics and Yields in Dryland Wheat Systems on the Colorado Plateau. Agronomy 2021, 11, 1102. [Google Scholar] [CrossRef]
  9. Kornecki, T.S.; Balkcom, K.S. Chapter 9: Planting in Cover Crop Residue. In Conservation Tillage Systems in the Southeast: Production, Profitability and Stewardship; Bergtold, J., Sailus, M., Eds.; Sustainable Agriculture Research and Education (SARE): Washington, DC, USA, 2020; pp. 119–132. [Google Scholar]
  10. Cornelius, C.D.; Bradley, K.W. Herbicide programs for the termination of various cover crop species. Weed Technol. 2017, 31, 1–9. Available online: https://www.jstor.org/stable/26567280 (accessed on 21 February 2021). [CrossRef]
  11. Palhano, M.G.; Norsworthy, J.K.; Barber, T. Evaluation of chemical termination options for cover crops. Weed Technol. 2018, 32, 227–235. [Google Scholar] [CrossRef]
  12. Whalen, D.M.; Bish, M.D.; Young, B.G.; Conley, S.P.; Reynolds, D.B.; Norsworthy, J.K.; Bradley, K.W. Herbicide programs for the termination of grass and broadleaf cover crop species. Weed Technol. 2020, 34, 1–10. [Google Scholar] [CrossRef]
  13. Van Bruggen, A.H.; He, M.M.; Shin, K.; Mai, V.; Jeong, K.C.; Finckh, M.R.; Morris, J.G., Jr. Environmental and health effects of the herbicide glyphosate. Sci. Total Environ. 2018, 616, 255–268. [Google Scholar] [CrossRef]
  14. Paganelli, A.; Gnazzo, V.; Acosta, H.; López, S.L.; Carrasco, A.E. Glyphosate-based herbicides produce teratogenic effects on vertebrates by impairing retinoic acid signaling. Chem. Res. Toxicol. 2010, 23, 1586–1595. [Google Scholar] [CrossRef] [PubMed]
  15. Antier, C.; Kudsk, P.; Reboud, X.; Ulber, L.; Baret, P.V.; Messéan, A. Glyphosate use in the European agricultural sector and a framework for its further monitoring. Sustainability 2020, 12, 5682. [Google Scholar] [CrossRef]
  16. Beckie, H.J.; Flower, K.C.; Ashworth, M.B. Farming without glyphosate? Plants 2020, 9, 96. [Google Scholar] [CrossRef] [PubMed] [Green Version]
  17. Cordeau, S.; Triolet, M.; Wayman, S.; Steinberg, C.; Guillemin, J.P. Bioherbicides: Dead in the water? A review of the existing products for integrated weed management. Crop Prot. 2016, 87, 44–49. [Google Scholar] [CrossRef]
  18. Krauss, J.; Eigenmann, M.; Keller, M. Pelargonic acid for weed control in onions: Factors affecting selectivity. In Tagungsband: 29; Deutsche Arbeitsbesprechung über Fragen der Unkrautbiologie und Bekämpfung: Braunschweig, Germany, 2020; pp. 415–419. Available online: https://www.openagrar.de/receive/openagrar_mods_00056760 (accessed on 21 February 2021).
  19. Savage, S.; Zorner, P. The use of pelargonic acid as a weed management tool. Proc. Calif. Weed Conf. 1996, 48, 46–47. [Google Scholar]
  20. Ciriminna, R.; Fidalgo, A.; Ilharco, L.M.; Pagliaro, M. Herbicides based on pelargonic acid: Herbicides of the bioeconomy. Biofuels Bioprod. Biorefin. 2019, 13, 1476–1482. [Google Scholar] [CrossRef]
  21. Travlos, I.; Rapti, E.; Gazoulis, I.; Kanatas, P.; Tataridas, A.; Kakabouki, I.; Papastylianou, P. The herbicidal potential of different pelargonic acid products and essential oils against several important weed species. Agronomy 2020, 10, 1687. [Google Scholar] [CrossRef]
  22. Hoagland, R.E. Chemical interactions with bioherbicides to improve efficacy. Weed Technol. 1996, 10, 651–674. [Google Scholar] [CrossRef]
  23. Coleman, R.; Penner, D. Organic Acid Enhancement of Pelargonic Acid. Weed Tech. 2008, 22, 38–41. Available online: http://www.jstor.org/stable/25194989 (accessed on 21 February 2021). [CrossRef]
  24. Moretti, M.L.; Watkins, S.; Hanson, B. Post Efficacy with Venue (pyraflufen) as a Tankmix Partner in Orchard Crops; University of California Weed Science: Davis, CA, USA, 2014; Available online: https://ucanr.edu/blogs/ucdweedscience/blogfiles/24940.pdf (accessed on 7 November 2022).
  25. Duddu, H.S.; Johnson, E.N.; Willenborg, C.J.; Shirtliffe, S.J. High-throughput UAV image-based method is more precise than manual rating of herbicide tolerance. Plant Phenomics 2019, 2019, 6036453. [Google Scholar] [CrossRef] [Green Version]
  26. Rodene, E.; Xu, G.; Palali Delen, S.; Zhao, X.; Smith, C.; Ge, Y.; Schnable, J.; Yang, J. A UAV-based high-throughput phenotyping approach to assess time-series nitrogen responses and identify trait-associated genetic components in maize. Plant Phenome J. 2022, 5, 20030. [Google Scholar] [CrossRef]
  27. Marino, S.; Alvino, A. Detection of spatial and temporal variability of wheat cultivars by high-resolution vegetation indices. Agronomy 2019, 9, 226. [Google Scholar] [CrossRef] [Green Version]
  28. Streibig, J.C.; Rasmussen, J.; Andújar, D.; Andreasen, C.; Berge, T.W.; Chachalis, D.; Dittmann, T.; Gerhards, R.; Giselsson, T.M.; Hamouz, P.; et al. Sensor-based assessment of herbicide effects. Weed Res. 2014, 54, 223–233. [Google Scholar] [CrossRef]
  29. Mink, R.; Linn, A.I.; Santel, H.J.; Gerhards, R. Sensor-based evaluation of maize (Zea mays) and weed response to post-emergence herbicide applications of Isoxaflutole and Cyprosulfamide applied as crop seed treatment or herbicide mixing partner. Pest Manag. Sci. 2020, 76, 1856–1865. [Google Scholar] [CrossRef] [Green Version]
  30. Meena, S.V.; Dhaka, V.S.; Sinwar, D. Exploring the Role of Vegetation Indices in Plant Diseases Identification. In Proceedings of the 2020 Sixth International Conference on Parallel, Distributed and Grid Computing (PDGC), Waknaghat, India, 3–6 November 2020; pp. 372–377. [Google Scholar] [CrossRef]
  31. Guo, Z.C.; Wang, T.; Liu, S.L.; Kang, W.P.; Chen, X.; Feng, K.; Zhang, X.Q.; Zhi, Y. Biomass and vegetation coverage survey in the Mu Us sandy land-based on unmanned aerial vehicle RGB images. Int. J. Appl. Earth Obs. Geoinf. 2021, 94, 102239. [Google Scholar] [CrossRef]
  32. Rasmussen, J.; Ntakos, G.; Nielsen, J.; Svensgaard, J.; Poulsen, R.N.; Christensen, S. Are vegetation indices derived from consumer-grade cameras mounted on UAVs sufficiently reliable for assessing experimental plots? Eur. J. Agron. 2016, 74, 75–92. [Google Scholar] [CrossRef]
  33. Xue, J.; Su, B. Significant remote sensing vegetation indices: A review of developments and applications. J. Sens. 2017, 2017, 1353691. [Google Scholar] [CrossRef] [Green Version]
  34. Thenkabail, P.S.; Smith, R.B.; De Pauw, E. Hyperspectral vegetation indices and their relationships with agricultural crop characteristics. Remote Sens. Environ. 2000, 71, 158–182. [Google Scholar] [CrossRef]
  35. Bartels, J.; Wahmhoff, W.; Heitefuss, R. So kann der Praktiker Schadschwellen feststellen. DLG-Mitteil 1983, 98, 270–274. [Google Scholar]
  36. Gitelson, A.A.; Kaufman, Y.J.; Stark, R.; Rundquist, D. Novel algorithms for remote estimation of vegetation fraction. Remote Sens. Environ. 2002, 80, 76–87. [Google Scholar] [CrossRef] [Green Version]
  37. Woebbecke, D.; Meyer, G.; VonBargen, K.; Mortensen, D. Color indices for weed identification under various soil, residue, and lighting conditions. Trans. ASAE 1995, 38, 271–281. [Google Scholar] [CrossRef]
  38. Yang, D. Gobi Vegetation Recognition Based on Low-Altitude Photogrammetry Images of UAV. IOP Conf. Ser. Earth Environ. Sci. 2018, 186, 012053. [Google Scholar] [CrossRef]
  39. Gil, H.A.P.; Pacheco, A.D.J.M. Chapter 1: RGB Spectral Indices for the Analysis of Soil Protection by Vegetation Cover against Erosive Processes. In Soil Erosion-Current Challenges and Future Perspectives in a Changing World; Vieira, A., Rodrigues, S.C., Eds.; IntechOpen: London, UK, 2020; pp. 3–14. [Google Scholar]
  40. Narmilan, A.; Gonzalez, F.; Salgadoe, A.S.A.; Kumarasiri, U.W.L.M.; Weerasinghe, H.A.S.; Kulasekara, B.R. Predicting canopy chlorophyll content in sugarcane crops using machine learning algorithms and spectral vegetation indices derived from UAV multispectral imagery. Remote Sensing 2022, 14, 1140. [Google Scholar] [CrossRef]
  41. R Core Team. R: A language and Environment for Statistical Computing; R Foundation for Statistical Computing: Vienna, Austria, 2022; Available online: https://www.R-project.org/ (accessed on 1 October 2022).
  42. Shapiro, S.S.; Wilk, M.B.; Chen, H.J. A comparative study of various tests of normality. J. Am. Stat. Associ. 1968, 63, 1343–1372. [Google Scholar] [CrossRef]
  43. de Mendiburu, F.; Yaseen, M. agricolae: Statistical Procedures for Agricultural Research. R Package Version 1.4.0. 2020. Available online: https://myaseen208.github.io/agricolae/https://cran.r-project.org/package=agricolae (accessed on 1 December 2022).
  44. Webber, C.L.; Taylor, M.J.; Shrefler, J.W. Weed control in yellow squash using sequential postdirected applications of pelargonic acid. HortTechnology 2014, 24, 25–29. [Google Scholar] [CrossRef] [Green Version]
  45. Fadin, D.A.; Tornisielo, V.L.; Barroso, A.A.M.; Ramos, S.; Dos Reis, F.C.; Monquero, P.A. Absorption and translocation of glyphosate in Spermacoce verticillata and alternative herbicide control. Weed res. 2018, 58, 389–396. [Google Scholar] [CrossRef]
  46. Satchivi, N.M.; Wax, L.M.; Stoller, E.W.; Briskin, D.P. Absorption and translocation of glyphosate isopropylamine and trimethylsulfonium salts in Abutilon theophrasti and Setaria faberi. Weed Sci. 2000, 48, 675–679. [Google Scholar] [CrossRef]
  47. Sprankle, P.; Meggitt, W.F.; Penner, D. Absorption, action, and translocation of glyphosate. Weed Sci. 1975, 23, 235–240. [Google Scholar] [CrossRef]
  48. Murata, S.; Yamashita, A.; Kimura, Y.; Motoba, K.; Mabuchi, T.; Miura, Y. Herbicidal activity and characteristics of pyraflufen-ethyl for controlling broad-leaved weeds in cereals. J. Pesticide Sci. 2002, 27, 39–46. [Google Scholar] [CrossRef] [Green Version]
  49. Yun, H.S.; Park, S.H.; Kim, H.J.; Lee, W.D.; Lee, K.D.; Hong, S.Y.; Jung, G.H. Use of unmanned aerial vehicle for multi-temporal monitoring of soybean vegetation fraction. J. Biosyst. Eng. 2016, 41, 126–137. [Google Scholar] [CrossRef] [Green Version]
  50. Torres-Sánchez, J.; Peña, J.M.; de Castro, A.I.; López-Granados, F. Multi-temporal mapping of the vegetation fraction in early-season wheat fields using images from UAV. Comput. Electron. Agric. 2014, 103, 104–113. [Google Scholar] [CrossRef]
  51. Travlos, I.; Tsekoura, A.; Antonopoulos, N.; Kanatas, P.; Gazoulis, I. Novel sensor-based method (quick test) for the in-season rapid evaluation of herbicide efficacy under real field conditions in durum wheat. Weed Sci. 2021, 69, 147–160. [Google Scholar] [CrossRef]
  52. Weier, J.; Herring, D. Measuring Vegetation (NDVI & EVI); NASA Earth Observatory: Washington, DC, USA, 2000. Available online: https://earthobservatory.nasa.gov/features/MeasuringVegetation/measuring_vegetation_2.php (accessed on 7 November 2022).
  53. Götze, C.; Jung, A.; Merbach, I.; Wennrich, R.; Gläßer, C. Spectrometric analyses in comparison to the physiological condition of heavy metal stressed floodplain vegetation in a standardised experiment. Open Geosci. 2010, 2, 132–137. [Google Scholar] [CrossRef] [Green Version]
  54. Erunova, M.G.; Pisman, T.I.; Shevyrnogov, A.P. The Technology for Detecting Weeds in Agricultural Crops Based on Vegetation Index VARI (PlanetScope). J. Sib. Fed. Univ. Eng. Technol. 2021, 14, 347–353. [Google Scholar] [CrossRef]
  55. Sakamoto, T.; Shibayama, M.; Kimura, A.; Takada, E. Assessment of digital camera-derived vegetation indices in quantitative monitoring of seasonal rice growth. ISPRS J. Photogramm. Remote Sens. 2011, 66, 872–882. [Google Scholar] [CrossRef]
  56. Datt, B.; McVicar, T.R.; Van Niel, T.G.; Jupp, D.L.; Pearlman, J.S. Preprocessing EO-1 Hyperion hyperspectral data to support the application of agricultural indexes. IEEE Trans. Geosci. Remote Sens. 2003, 41, 1246–1259. [Google Scholar] [CrossRef] [Green Version]
  57. Xiao, Y.; Zhao, W.; Zhou, D.; Gong, H. Sensitivity analysis of vegetation reflectance to biochemical and biophysical variables at leaf, canopy, and regional scales. IEEE Trans. Geosci. Remote Sens. 2013, 52, 4014–4024. [Google Scholar] [CrossRef]
  58. Zhang, J.; Virk, S.; Porter, W.; Kenworthy, K.; Sullivan, D.; Schwartz, B. Applications of unmanned aerial vehicle-based imagery in turfgrass field trials. Front. Plant Sci. 2019, 10, 279. [Google Scholar] [CrossRef] [Green Version]
  59. Lu, N.; Zhou, J.; Han, Z.; Li, D.; Cao, Q.; Yao, X.; Tian, Y.; Zhu, Y.; Cao, W.; Cheng, T. Improved estimation of aboveground biomass in wheat from RGB imagery and point cloud data acquired with a low-cost unmanned aerial vehicle system. Plant Methods 2019, 15, 17. [Google Scholar] [CrossRef] [Green Version]
Figure 3. Visually estimated crop vitality after application of herbicides on the cover crop in both years. Small letters show significant differences among treatments within each day in 2019 and capital letters show significant differences among treatments within each day in 2021 at p < 0.05 using the Kruskal–Wallis test. Error bars indicate the standard deviation for each treatment within each assessment day.
Agronomy 13 00354 g003
Figure 4. (a) Estimated crop vitality obtained by visual observation in 2019; (be): calculated VIs relative to the untreated control obtained by a drone in 2019.
Agronomy 13 00354 g004
Figure 5. (a) Estimated crop vitality obtained by visual observations in 2021; (be): calculated VIs relative to the untreated control obtained by a drone in 2021.
Agronomy 13 00354 g005
Figure 6. Changes in plant vitality due to different herbicides during the experiment in 2021, expressed by RGB.
Agronomy 13 00354 g006
Figure 7. Changes in plant vitality due to different herbicides during the experiment in 2021, expressed by NDVI.
Agronomy 13 00354 g007
Figure 8. (ad): Relationship between VIs (relative values compared with before application) and visually estimated vitality in 2019. Linear and polynomial regression analysis (p < 0.05).
Agronomy 13 00354 g008
Figure 9. (ad): Relationship between VIs (relative values compared with before application) and visually estimated vitality in 2021. Linear and polynomial regression analysis (p < 0.05).
Agronomy 13 00354 g009
Figure 10. (af): Relationship between VIs (absolute values) in 2019. Linear and polynomial regression analysis (p < 0.05).
Agronomy 13 00354 g010
Figure 11. (af): Relationship between VIs (absolute values) in 2021. Linear regression analysis (p < 0.05).
Agronomy 13 00354 g011
Table 1. Herbicide treatments used in the experiments in 2019 and 2021.
TreatmentAmount Used (L /ha)Active Ingredient Content (g/L)
UC-Untreated control
PA16 L/ha680 g/L pelargonic acid
PA_R5 L/ha680 g/L pelargonic acid
PA_2T8 L/ha 1680 g/L pelargonic acid
PYR0.8 L/ha24.2 g/L pyraflufen
PYR + PA_R0.8 L/ha PYR and 5 L/ha PA24.2 g/L pyraflufen and 680 g/L pelargonic acid
GLY3 L/ha480 /L glyphosate
1 Second application within a week of the first application.
Table 2. Sunlight and cloud conditions during the drone flights, collected by the authors.
Date20192021
Before applicationCompletely cloudyCompletely cloudy
1st_DATPartly cloudyPartly cloudy
7th _DATCompletely cloudyPartly cloudy
14th _DATCompletely cloudyPartly cloudy
21st_DATSunny-
Disclaimer/Publisher’s Note: The statements, opinions and data contained in all publications are solely those of the individual author(s) and contributor(s) and not of MDPI and/or the editor(s). MDPI and/or the editor(s) disclaim responsibility for any injury to people or property resulting from any ideas, methods, instructions or products referred to in the content.

