Article

Long-Term Organic Amendments Combined with Nitrogen Fertilization Regulates Soil Organic Carbon Sequestration in Calcareous Soil

1
College of Resources and Environmental Sciences, Qingdao Agricultural University, Qingdao 266109, China
2
Technical Department, Qingdao Decide Agrochemical Technology Service Co., Ltd., Qingdao 266109, China
*
Author to whom correspondence should be addressed.
Agronomy 2023, 13(2), 291; https://doi.org/10.3390/agronomy13020291
Submission received: 17 December 2022 / Revised: 9 January 2023 / Accepted: 17 January 2023 / Published: 18 January 2023
(This article belongs to the Section Soil and Plant Nutrition)

Abstract

:
Organic amendments have been widely confirmed to support soil health and agricultural sustainability. However, the effects and mechanisms of long-term organic amendments combined with chemical fertilizers on soil organic carbon (SOC) sequestration and soil macroaggregate formation are still unclear. Therefore, this study aimed to explore the interaction between soil carbon sequestration and soil agglomeration after 12 years of fertilization. Seven treatments within a field experiment were selected to conduct the research, including nitrogen (N) application by farmers, optimized N management, biochar and/or straw, manure, compost or biogas residue plus optimized N management. The results showed that the addition of organic materials significantly enhanced the SOC by 29.6–119.8% and 10.3–36.3% in 0–15 and 15–30 cm soil layers compared to N application by farmers, respectively. Meanwhile, the soil humus carbon pools in the 0–15 cm soil layer were increased by 14.7–205.2%, particularly humin carbon (HUC), which could be considered as a useful indicator of the soil carbon sequestration process. Among the organic materials, the addition of biochar was the most effective strategy due to its high aromatic carbon content that resisted biodegradation. The addition of organic materials also improved the soil labile carbon fractions, and the contents of microbial biomass carbon (MBC), dissolved organic carbon (DOC), particulate organic carbon (POC) and KMnO4-oxidizable carbon (ROC) were enhanced by 120.5%, 92.3%, 217.2% and 85.5% on average, respectively, and the amount of exchangeable Ca2+ and Mg2+ cations and Fe and Al oxides in the soil increased significantly whilst the Na+ content declined in the 0–15 cm soil layer. These indicators showed a significant correlation with the mean weight diameter (MWD). Our results revealed that the addition of organic materials could be an effective management practice to promote soil carbon sequestration and soil macroaggregate formation in calcareous soil.

1. Introduction

The soil carbon pool is the largest carbon stock in the terrestrial biosphere, which is 2.5 times higher than that of terrestrial vegetation [1,2]. SOC is composed of a series of fractions that vary in their turnover time, decomposition degree and recalcitrance [3]. Soil labile carbon fractions, including MBC, DOC, POC and ROC, are characterized by a rapid turnover time and are recommended as early indicators of the effects of management practices on soil fertility [4,5]. As the major components of SOC, soil humus carbon fractions play a central role in stabilizing SOC pools [6], which could be divided into humid acid (HA), fulvic acid (FA) and humin (HU) based on their solubility in acidic and alkali solutions. Facing the challenges of food security and environmental protection, enhancing SOC sequestration is at the core of soil health, and it is of great significance in regulating the global climate and promoting the productivity and sustainability of agroecosystems [7,8,9]. However, the SOC in conventional agriculture has declined by more than 30% compared to pre-agricultural levels within a few decades [10,11].
Numerous previous studies have indicated that the addition of organic materials is widely considered to build SOC sequestration, as it efficiently improves soil macroaggregate formation [12,13,14]. A previous study reported that the SOC stock in Chinese croplands was increased by 15.0%, which was mainly attributed to the increase in crop straw inputs in the last 32 years [15]. Biochar, a carbon-rich byproduct, is transformed from sustainably sourced biomass (crop residue, animal or poultry manure, etc.) through a process of pyrolysis. It has a subsequent use as an agricultural amendment to improve soil fertility, increase crop productivity, enhance SOC sequestration and mitigate greenhouse gas emissions [16,17,18]. Meanwhile, fertilization can redistribute SOC fractions and change microbial abundance, which can then enhance soil macroaggregate formation [13,19,20]. Manure combined with mineral fertilizer increases the DOC and MBC content in soil to a greater extent than that of mineral fertilizer alone [21]. A previous study reported that the application of maize straw or maize-straw-derived biochar combined with mineral fertilizer increases the HAC content of soil [22]. These fractions are closely related to the formation of soil macroaggregates due to their ability to bind soil particles directly and increase microbial activity to release carbon-binding agents [23,24]. Additionally, soil aggregates offer vital physical protection to SOC against microbial decomposition by encapsulation [1,19,25]. Therefore, soil aggregate formation and stability are directly proportional to the SOC content in soil. However, previous studies seem to have given a lack of attention to the potential formation mechanisms (i.e., the effect of soil labile carbon fractions, soil iron (Fe)-oxides, aluminum (Al)-oxides or cations) of soil aggregates.
The North China Plain (NCP) is an important food production base in China [7]. Calcareous soil refers to the general name of soil containing free calcium carbonate, which is widely distributed in arid and semi-arid areas, accounting for about 1/3 of the world’s land area. Calcareous soil is one of the main soil types in the NCP, which is rich in calcium carbonate as well as a small amount of magnesium carbonate and bicarbonate. This kind of soil is characterized by a low SOC content, a high content of clay minerals and low soil productivity. Due to the high concentration of free calcium carbonate and the high pH value, calcareous soil has a strong fixation effect on phosphorus, resulting in a very low concentration of phosphorus in soil solutions and low mobility [26]. Meanwhile, excessive N fertilization is common in the NCP [27]. Thus, it is necessary to study the effects and mechanisms of distinct quality organic materials and N addition on soil carbon sequestration (including recalcitrant carbon pools) and soil macroaggregate formation, due to the lack of relevant studies on calcareous soils based on long-term field experiments [1,6,13]. Our hypothesis was that organic amendments associated with N fertilizer could be more efficient in soil carbon sequestration compared to chemical fertilizer alone over a long-term period. Therefore, a field experiment was selected to evaluate the SOC, soil labile carbon fractions, humus carbon fractions and soil aggregate distribution in response to exogenous carbon addition and reveal the mechanisms of soil macroaggregate formation and stabilization with different organic amendments after 12 years of fertilization in calcareous soil.

2. Materials and Methods

2.1. Experimental Site

The field experiment was started in 2008; the study area lay in Quzhou County (36.5° N, 115.0° E), Hebei Province, in the NCP. The location is characterized by a semi-arid temperate continental monsoon climate with an annual mean temperature of 14 °C and a precipitation rate of 422 mm. The soil was classified as calcareous alluvial soil with a pH of 8.5 (w/v = 2.5:1), and it contained 8.19 g kg−1 SOC, 1.27 g kg−1 total N, 9.85 mg kg−1 available phosphorus (Olsen-P) and 160.00 mg kg−1 available potassium (K) primordially at a 0–15 cm soil depth.

2.2. Experimental Design

The field experiment was a completely random design with three replicates. The selected treatments were as follows: N application by farmers (T1, 240 kg N ha−1), optimized N management (T2), biochar combined with optimized N management (T3), maize straw combined with optimized N management (T4), dairy manure combined with optimized N management (T5), compost combined with optimized N management (T6) and biogas residue combined with optimized N management (T7). The field was split into 21 plots, each plot with an area of 50 m2 (4 m × 12.5 m).
The optimized N (urea, 46% N) was applied based on in-season root-zone N management [28]. For T1, a 40% of the total N content was applied as a basal fertilizer and 60% as a supplemental fertilizer at the stem-elongation stage in the wheat-growing season. A total of 1/3 of the total N was applied as a seeding fertilizer, and 2/3 was supplied at the tasseling stage in the maize-growing season. For wheat, optimized N was applied as a basal and supplemental fertilizer at the stem-elongation stage (in total, 130 kg N ha−1 on average), and all treatments were applied with P (granular superphosphate, 16% P2O5) at a rate of 40 kg P ha−1 and K (potassium sulfate, 50% K2O) at a rate of 50 kg K ha−1 before sowing before 2016. For maize, optimized N was applied as a seed and supplemental fertilizer at the tasseling stage (in total, 112 kg N ha−1 on average), and all treatments were applied with 20 kg P ha−1 and 37 kg K ha−1 with seeding, and the remaining 37 kg K ha−1 was applied at the tasseling stage before 2016. After 2016, considering the P and K brought in by organic amendments, we adopted a balanced fertilization during the application of chemical P and K fertilizer to avoid the difference in the soil contents of Olsen-P and available K under different treatments, which would obscure the effect of the optimized N management. Therefore, the soil contents of Olsen-P (19.58 mg kg−1 on average) and available K (178.62 mg kg−1 on average) in each treatment were basically the same at the time of the study
The different organic amendments were straw-derived through different processes of pyrolysis for biochar, biological decomposition for dairy manure and aerobic and anaerobic fermentation of manure for compost and biogas-residue, respectively. The carbon and nitrogen content and pH value of the different organic amendments are shown in Table 1. The organic amendments were annually applied at a rate of 3.2 Mg C ha−1 yr−1 for the wheat–maize rotation system before wheat sowing. Basal fertilizers were broadcast onto the soil surface and then incorporated to a depth of 15–20 cm through rotary tillage.
The sowing quantity of wheat (variety: Liang Xing 99) was ca. 205 kg ha−1 between 5–10 October, and the wheat was harvested between 1–5 June the next year. The plantation density of maize (variety: Zheng Dan 958) was ca. 75,000 plant ha−1 (growth period from mid-June to early October). Irrigation, diseases, insect pests and weeds were managed following local recommended practices [28].

2.3. Collection and Measurement of Soil Samples

Soil samples of the 0–15 and 15–30 cm layers were collected after the maize harvest in 2020. All the combined soil samples were divided into two parts, a portion of the fresh soil samples were air-dried, and visible roots and rocks were removed manually and then sieved through a 2 or 0.25 mm sieve for various measurements. Another portion of the fresh soil was stored at 4 °C for the MBC and DOC analysis.
The SOC was determined by potassium dichromate oxidation followed by titration with ferrous ammonium sulphate. The soil labile carbon fractions were determined [5]: For the MBC, field-moist samples were fumigated at 25 °C for 24 h, and carbon was extracted from the fumigated and non-fumigated samples with 0.5 mol L−1 K2SO4 (w/v = 1:4) for 1 h after removing the CHCl3. The filtered extracts were analyzed on a Multi 3100 N/C TOC analyzer (Analytic Jena, Jena, Germany). For the DOC, field-moist samples were extracted with 0.5 mol L−1 K2SO4 (w/v = 1:5) for 1 h, and the extracts were passed through 0.45 μm membrane filters and analyzed using a TOC analyzer. For the POC, air-dried samples were dispersed with 30 mL of sodium hexametaphosphate (0.5% w/v) by shaking at 100 r min−1 on a reciprocating shaker for 16 h, and the solutions were poured into a 53 μm sieve. All materials remaining on the sieve were dried, ball-milled and analyzed. For the ROC, air-dried samples were allowed to react with 0.333 mol L−1 of KMnO4 for 1 h at 25 °C under tumbled shaking. The samples were then centrifuged and diluted 1:250 with deionized water, and the absorbance of the diluted samples and standards were read on a split-beam spectrophotometer at 565 nm.
Humus contents were isolated according to a modified procedure [6]. Briefly, 5 g of air-dried soil sample was added to 30 mL of distilled water, stirred and shaken for 1 h at 70 °C. Then, the mixture was centrifuged at 25 °C for 15 min (3500 r min−1). The supernatant solution was filtered with filter paper into a 50 mL flask, and the residue was washed twice with distilled water. The supernatant was merged and brought to volume with distilled water. The solution contained a water-soluble substance (WSS). Then, 30 mL of a mixture of 0.1 mol L−1 NaOH and 0.1 mol L−1 Na4P2O7 at pH 13 was added to the residue. Oscillation, centrifugation, and filtration were conducted as described above. The residue was washed in a centrifuge tube twice with distilled water and dried at 55 °C to a constant weight. This was the HU. The solution was the total alkali-extractable humid fraction (HE). The HE was separated into HA and FA by acidifying the extract to pH 1.0 using 0.5 mol L−1 H2SO4 at 65 °C for 1.5 h and was then allowed to stand overnight at 25 °C. The HUC was determined using the same method as the SOC. The carbon concentration of the other humus components including WSSC, HAC and FAC were determined using a TOC analyzer. The HEC was calculated as:
HEC = HAC + FAC
The undisturbed soil samples were collected to measure the distribution of soil aggregates after the maize harvest in 2020. Briefly, a 50.00 g subsample of air-dried soil (5 mm) was wet-sieved through 2, 0.25 and 0.053 mm sieves, and four aggregate fractions (>2, 0.25–2, 0.053–0.25 and <0.053 mm) were collected, oven-dried at 60 °C, weighed and calculated [19]. The MWD was calculated as:
MWD   ( mm ) = i = 1 n X i × Y i
where Xi is the mean diameter (mm) of the aggregate size fractions, and Yi is the proportion of the weight of each aggregate size fraction with respect to the total weight.
Meanwhile, the soil contents of exchangeable Na+, Mg2+ and Ca2+ were extracted using 5 mmol L−1 EDTA-NH4OAc (1:5 w/v) for 0.5 h and then centrifuged, filtered and analyzed using inductively coupled plasma atomic emission spectroscopy (ICP-AES, Optima 8000, PerkinElmer, Waltham, MA, USA) [13]. Soil dissociated Fe and Al oxides (Fed, Ald) were extracted using a sodium dithionite–sodium citrate–sodium bicarbonate solution, and amorphous Fe and Al oxides (Feo, Alo) were extracted by an oxalic acid–ammonium oxalate buffer solution. Complexed Fe and Al oxides (Fes, Als) were extracted using a sodium pyrophosphate solution, and the extracted solutions were analyzed using ICP-AES. The total content of Fe and Al oxides was the sum of the above three parts, respectively.

2.4. Statistical Analysis

The data are shown as mean ± standard error (n = 3). The differences in SOC content, soil labile carbon fractions, humus carbon fractions, aggregate distribution and exchangeable cations, i.e., Fe and Al oxides, among all the treatments were statically analyzed by the least significant difference (LSD) method at a 0.05 level. The correlation matrixes of SOC, MWD and other indicators were statistically analyzed by two-way analysis of variance (ANOVA) with SAS (version 8.2; SAS Institute Inc., Cary, NC, USA). The graphics were produced using Sigma Plot (version 12.0; SysTest Software Inc., San Jose, CA, USA).

3. Results

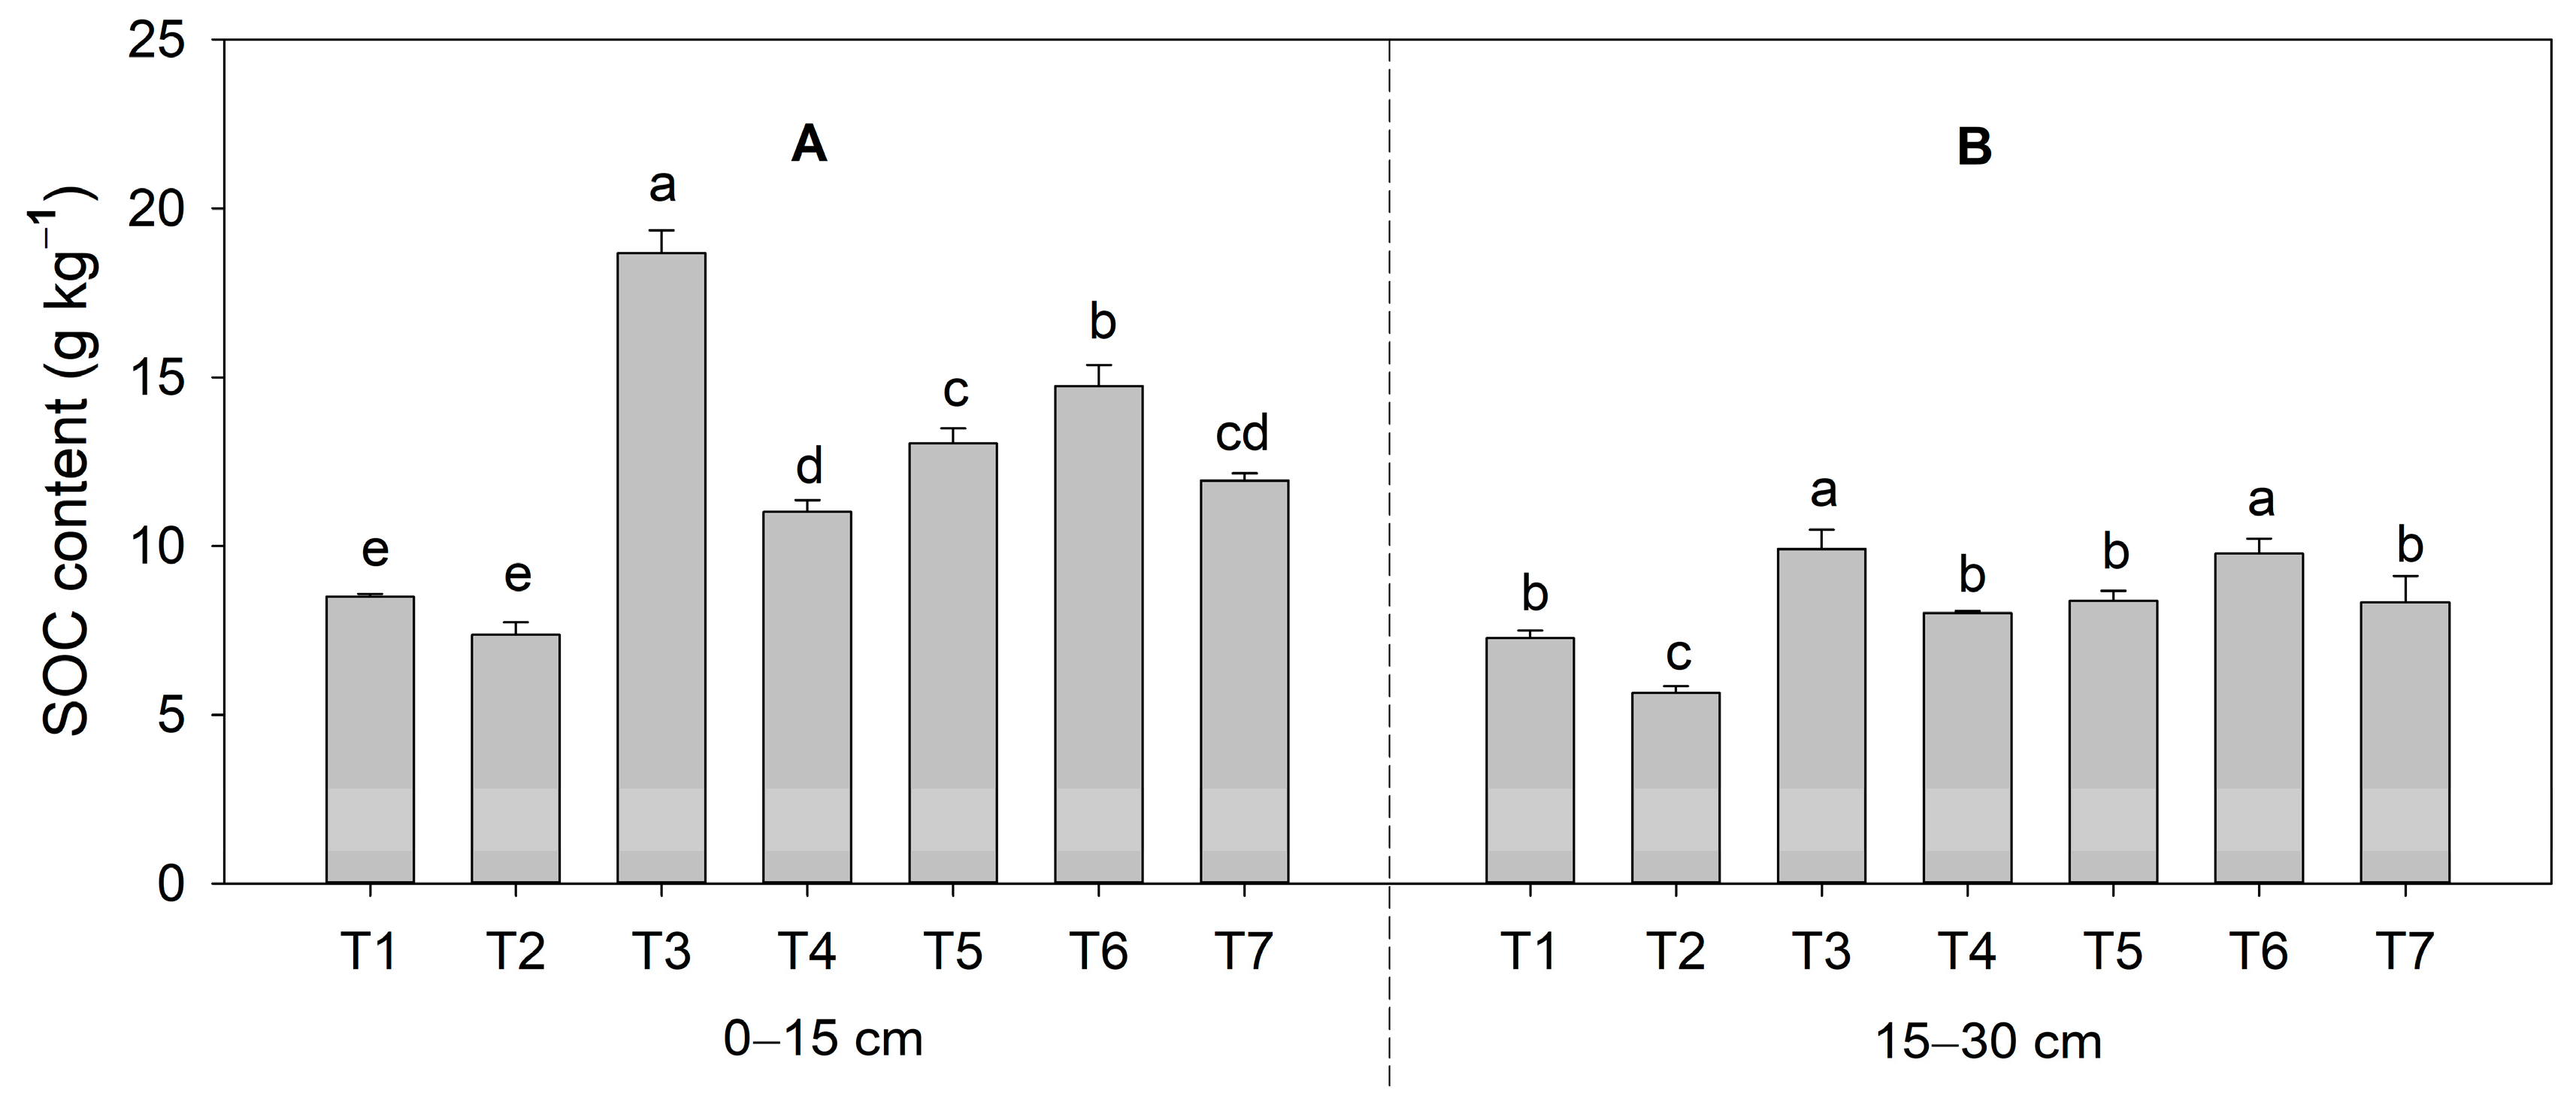
3.1. Effect of Fertilization on Soil Organic Carbon

The SOC content was significantly influenced by the fertilization and soil depths and their interaction. The change in the SOC followed the rule of T3 > T6 > T5, T7 > T4 > T1 and T2 in the 0–15 cm soil layer. Compared to T1, the SOC of T2 was decreased by 13.2%, whilst it was significantly increased by 63.4% on average with the organic amendments. The content of SOC was significantly decreased with increasing the soil depth (12.18 g kg−1 of 0–15 cm vs. 8.19 g kg−1 of 15–30 cm on average). Different trends were observed in the 15–30 cm soil layer: T3, T6 > T5, T7, T4 and T1 > T2. The SOC of T2 was significantly decreased by 22.3%, but there were no significant differences among the T2, T4, T5 and T7 treatments. T3 and T6 had a significantly enhanced SOC by 36.3% and 34.4% compared to T1, respectively. Additionally, significant differences in the SOC content were observed among the organic amendments. T3 showed the most profound effect on the SOC accumulation, which was increased by 153.3% and 75.4% in the 0–15 and 15–30 cm soil layers compared to T2, respectively (Figure 1).

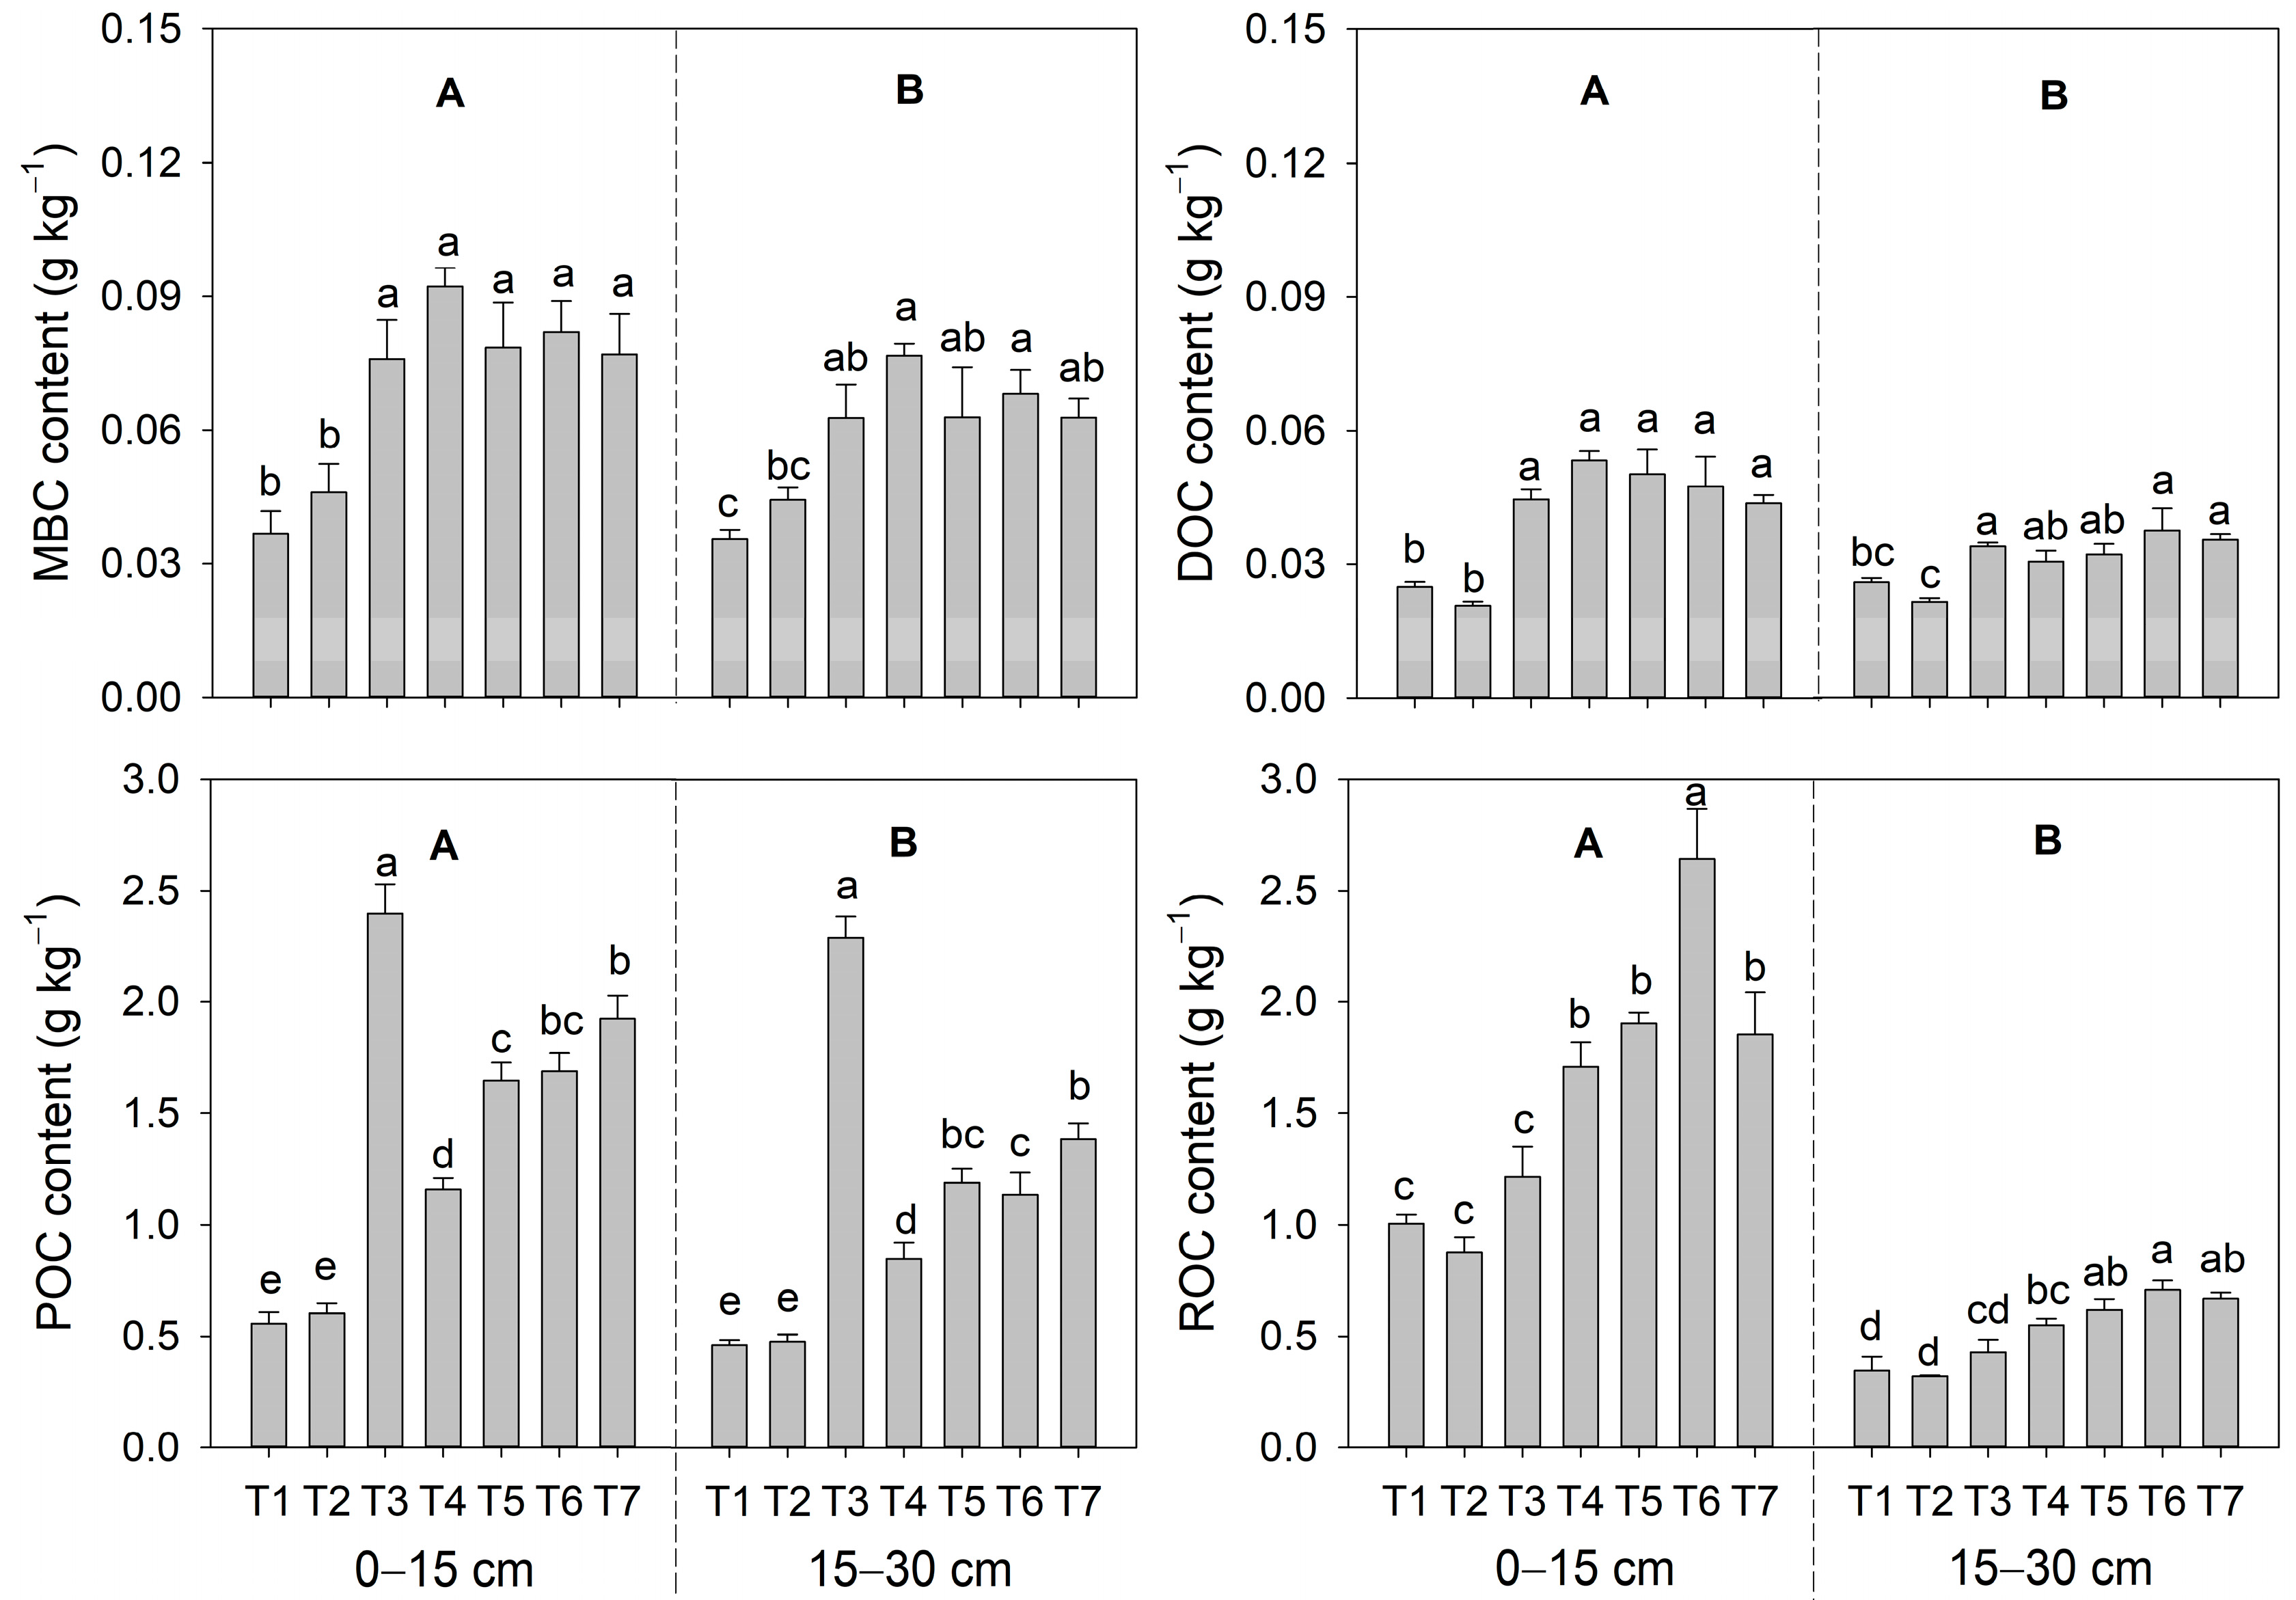
3.2. Effect of Fertilization on Soil Labile Carbon Fractions

The changes in the MBC, DOC, POC and ROC contents of the different treatments showed similar trends to those of the SOC. Compared to T1 (36.79 mg kg−1, 24.86 mg kg−1, 55.57 mg kg−1 and 1.01 g kg−1 of MBC, DOC, POC and ROC, respectively), the organic amendments significantly enhanced them by 106.1–150.4%, 75.6–114.0%, 108.2–331.3% and 20.7–163.0% in 0–15 cm, respectively. The contents were significantly decreased with increasing the soil depth. In addition, the MBC, DOC, POC and ROC were enhanced by 76.7–116.3%, 18.1–45.3%, 84.3–398.7% and 24.0–105.3% compared to T1 at the 15–30 cm depth, respectively. Otherwise, no significant differences in the MBC, DOC, POC and ROC were observed between T2 and T1 at both the 0–15 and 15–30 cm soil layers (Figure 2).

3.3. Effect of Fertilization on Soil Humus Carbon Fractions

Compared to T1, all the treatments significantly increased the HAC, FAC and HEC by 10.0–70.7%, 7.9–31.4% and 8.4–33.9% in 0–15 cm, respectively. Additionally, significant differences in the HAC and HEC contents were observed among the different organic amendments, and the increase in the HEC content was attributed to the higher HAC. T6 showed the most profound effect on the HAC and HEC, which were increased by 55.2% and 23.5% compared to T2 at the 0–15 cm depth, respectively. By contrast, no differences in the FAC were observed among the organic amendments. The contents of HAC, FAC and HEC were significantly decreased with increasing the soil depth, which declined by 13.5%, 33.1% and 28.3% on average, respectively. In addition, the changes in the HAC, FAC and HEC of the different fertilization treatments at 15–30 cm showed similar trends to that of the 0–15 cm depth (Table 2).
There were no differences in the WSSC and HUC contents between the two soil depths, nor between the T1 and T2 treatments in either soil depth. However, significant differences were observed among the different organic amendments at a certain depth. T3, T4, T5, T6 and T7 enhanced the WSSC by 173.7%, 23.2%, 59.9%, 49.1% and 61.1% at a depth of 0–15 cm compared to T1, respectively. Similarly, the organic amendments significantly increased the HUC content by 95% on average, ranging from 46.4% (T4) to 205.2% (T3) compared to T1. Significantly higher WSSC and HUC contents were observed in T3 and T6 compared to T1 at a depth of 15–30 cm. It should be pointed out that T3 had the highest WSSC and HUC, which were increased by 226.7% and 222.0% at a depth of 0–15 cm and by 102.3% and 103.1% at a depth of 15–30 cm compared to T2, respectively (Table 2).

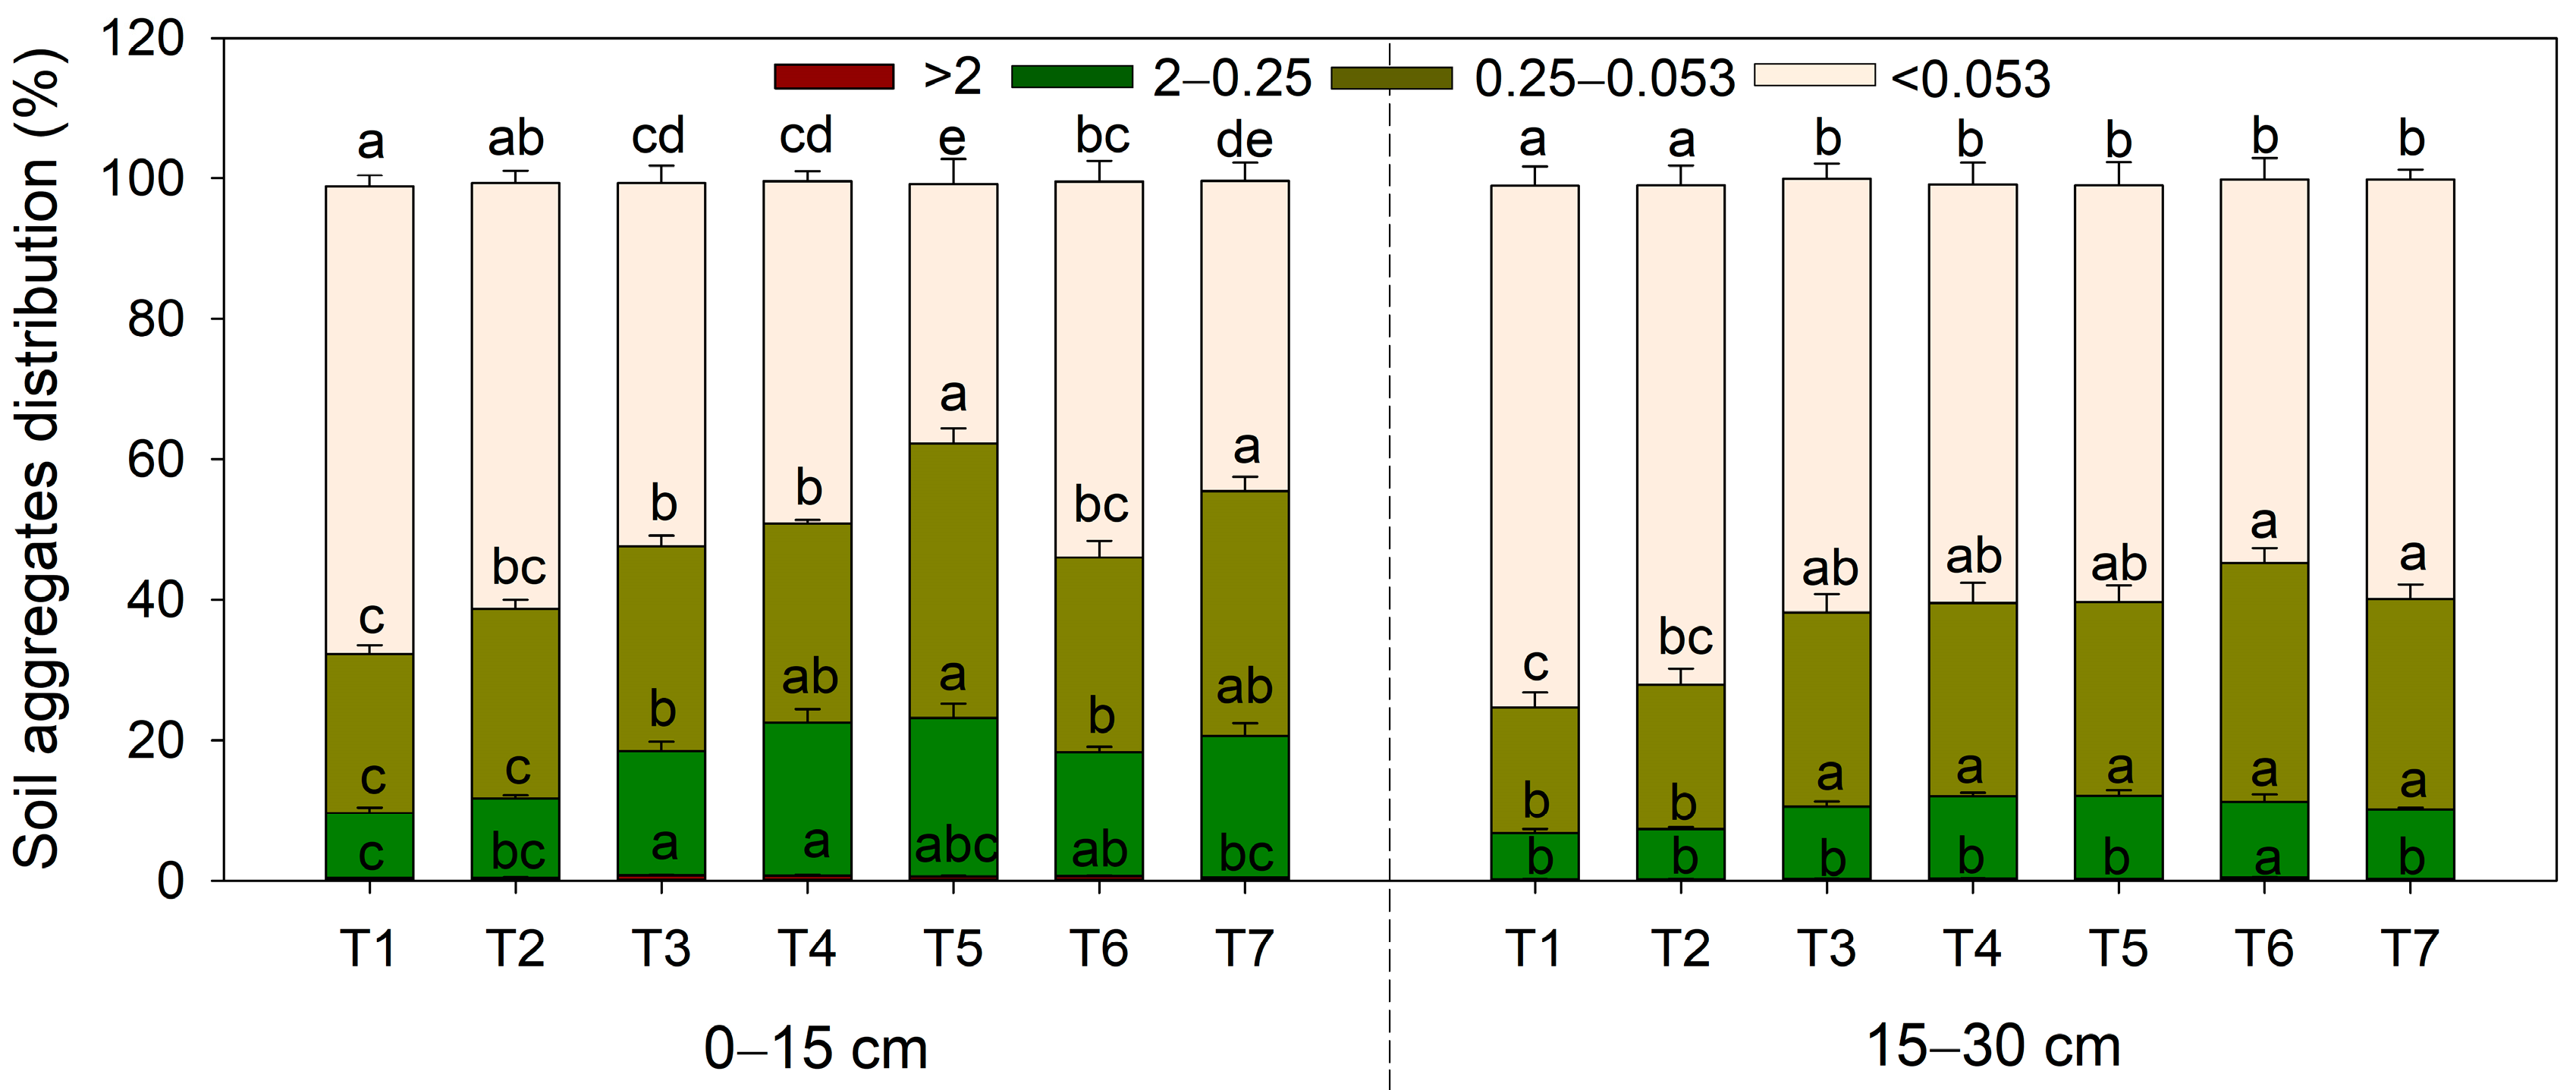
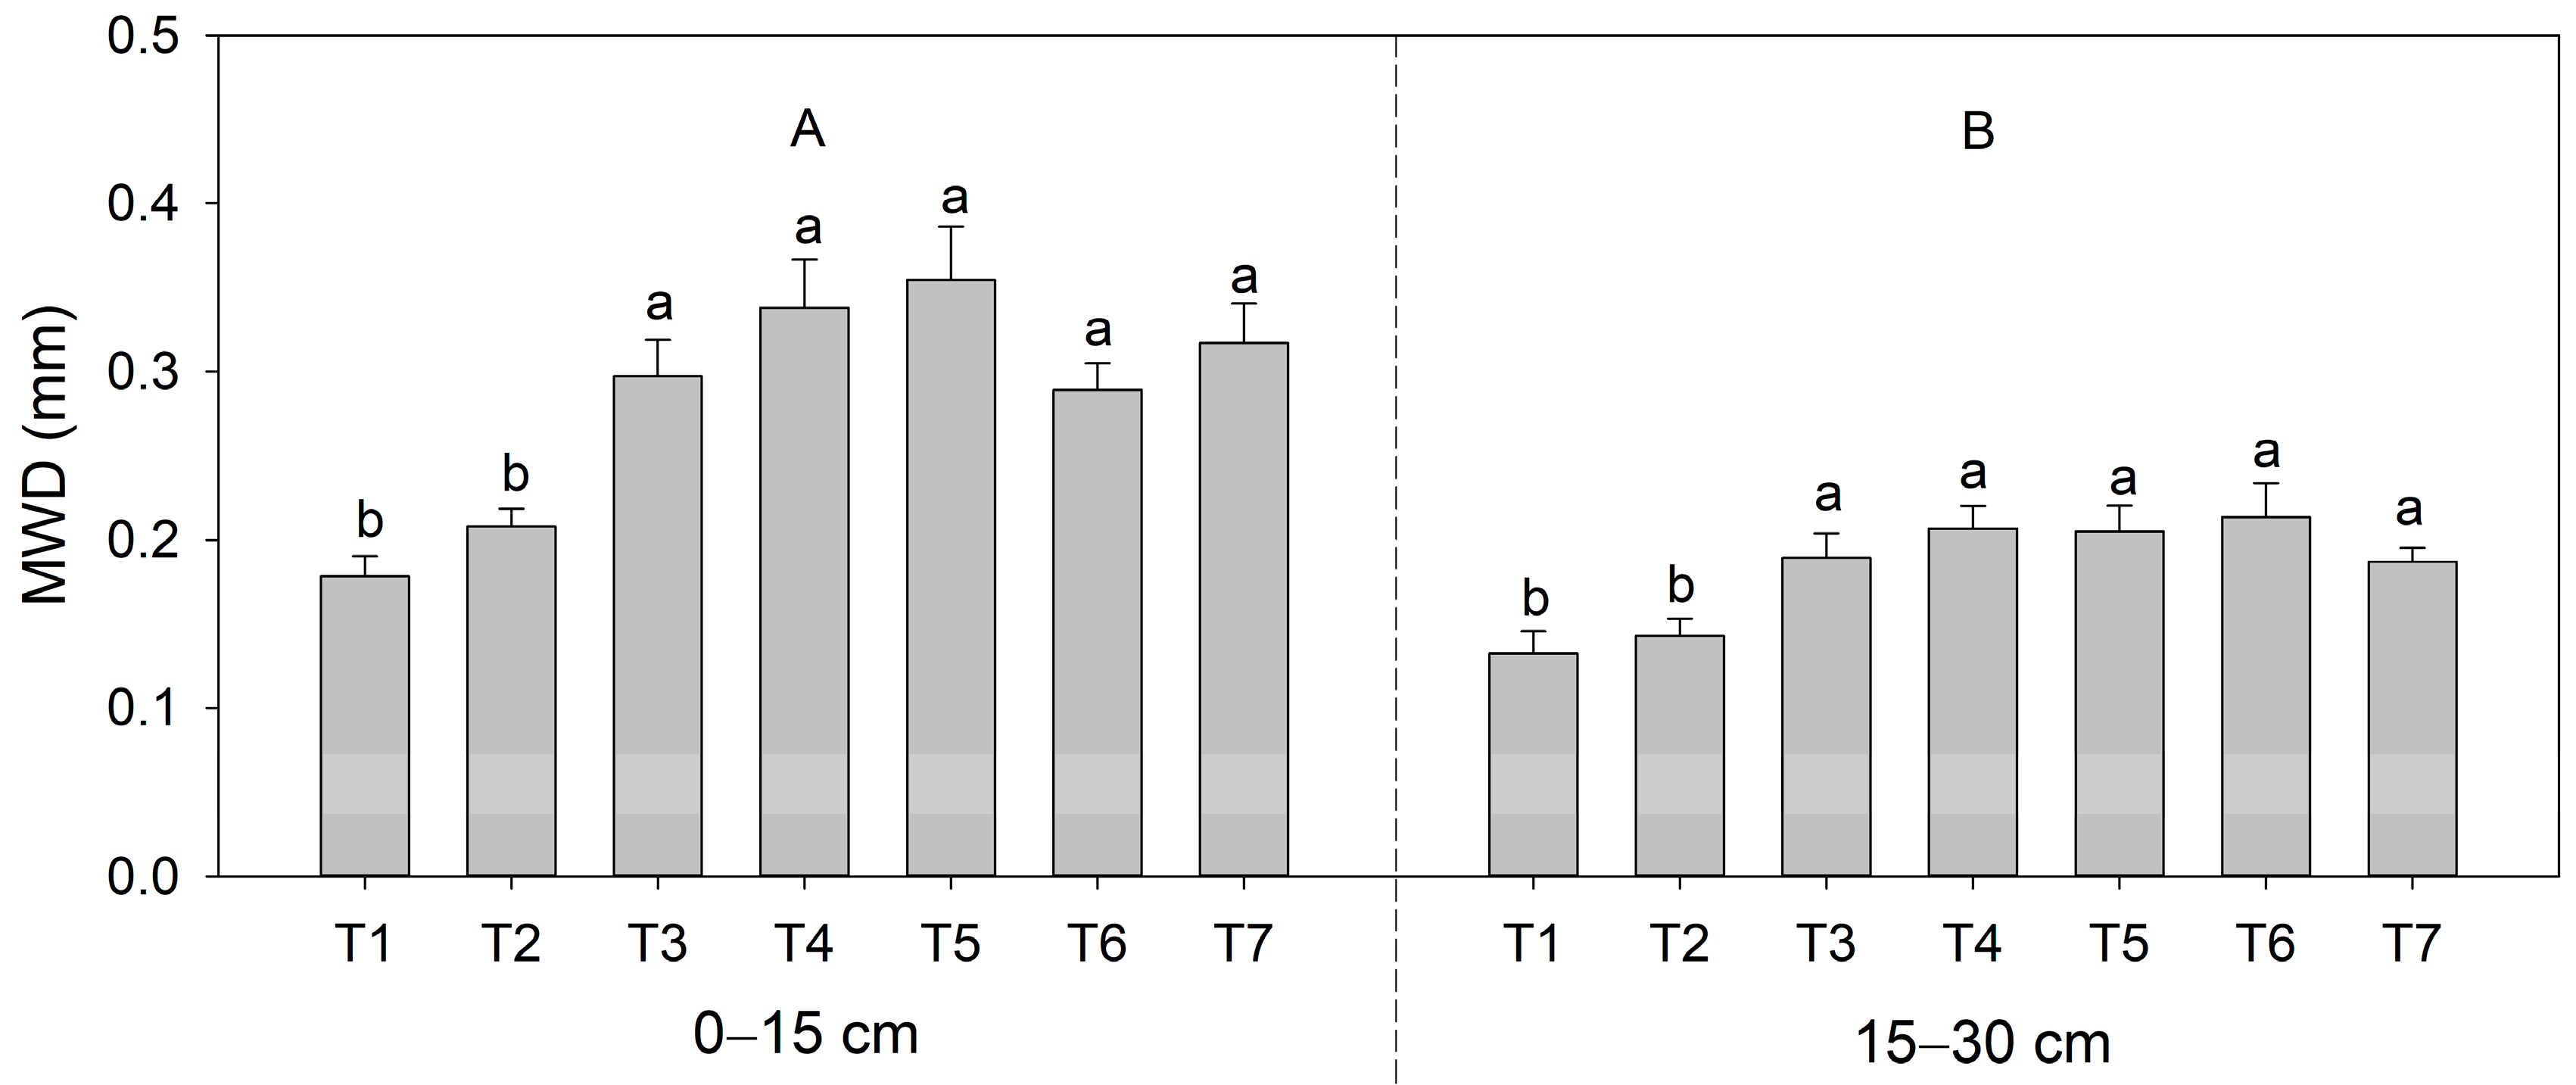
3.4. Effect of Fertilization on Soil Aggregate Distribution and Mean Weight Diameter

The distribution of soil water-stable aggregates of different sizes was as follows: (<0.053) > (0.053–0.25) > (0.25–2) > (>2) mm. The proportion of >2 mm components was less than 1%. There were no significant differences between T1 and T2 in terms of the proportions of the 0.25–2, 0.053–0.25 and < 0.053 mm soil aggregate sizes at the two soil depths. The organic amendments significantly increased the proportion of the 0.25–2 and 0.053–0.25 mm soil aggregate sizes; the increase rates were 116.2% and 77.4% at a depth of 0–15 cm and 66.9% and 54.0% at a depth of 15–30 cm on average for the 0.25–2 mm sizes compared to T1 and T2, respectively. The increases were 40.7% and 18.0%, and 63.9% and 41.9% for the 0.053–0.25 mm sizes. Additionally, significant differences in the proportion of the 0.25–2 and 0.053–0.25 mm soil aggregate sizes were observed among the organic amendments at a depth of 0–15 cm. Therein, T5 showed the most profound effect in terms of the proportion, which increased by 100.4% and 44.7% compared to T2, respectively. In terms of the < 0.053 mm soil aggregate sizes, the proportions of the organic amendments were 29.4% and 20.6% lower than those of T1 in the 0–15 and 15–30 cm soil layers, respectively (Figure 3).
The soil aggregates expressed by MWD were significantly affected by the fertilization and soil depth and their interaction. The MWD was significantly decreased with increasing the soil depth. Compared to T1, T2 increased the MWD by 16.8% and 7.9% in the 0–15 cm and 15–30 cm soil layers, but this did not reach a significant level. The organic amendments significantly increased the MWD by 79.2% and 51.2% on average, respectively. However, there were no significant differences among the different organic amendments at both of the soil depths (Figure 4).

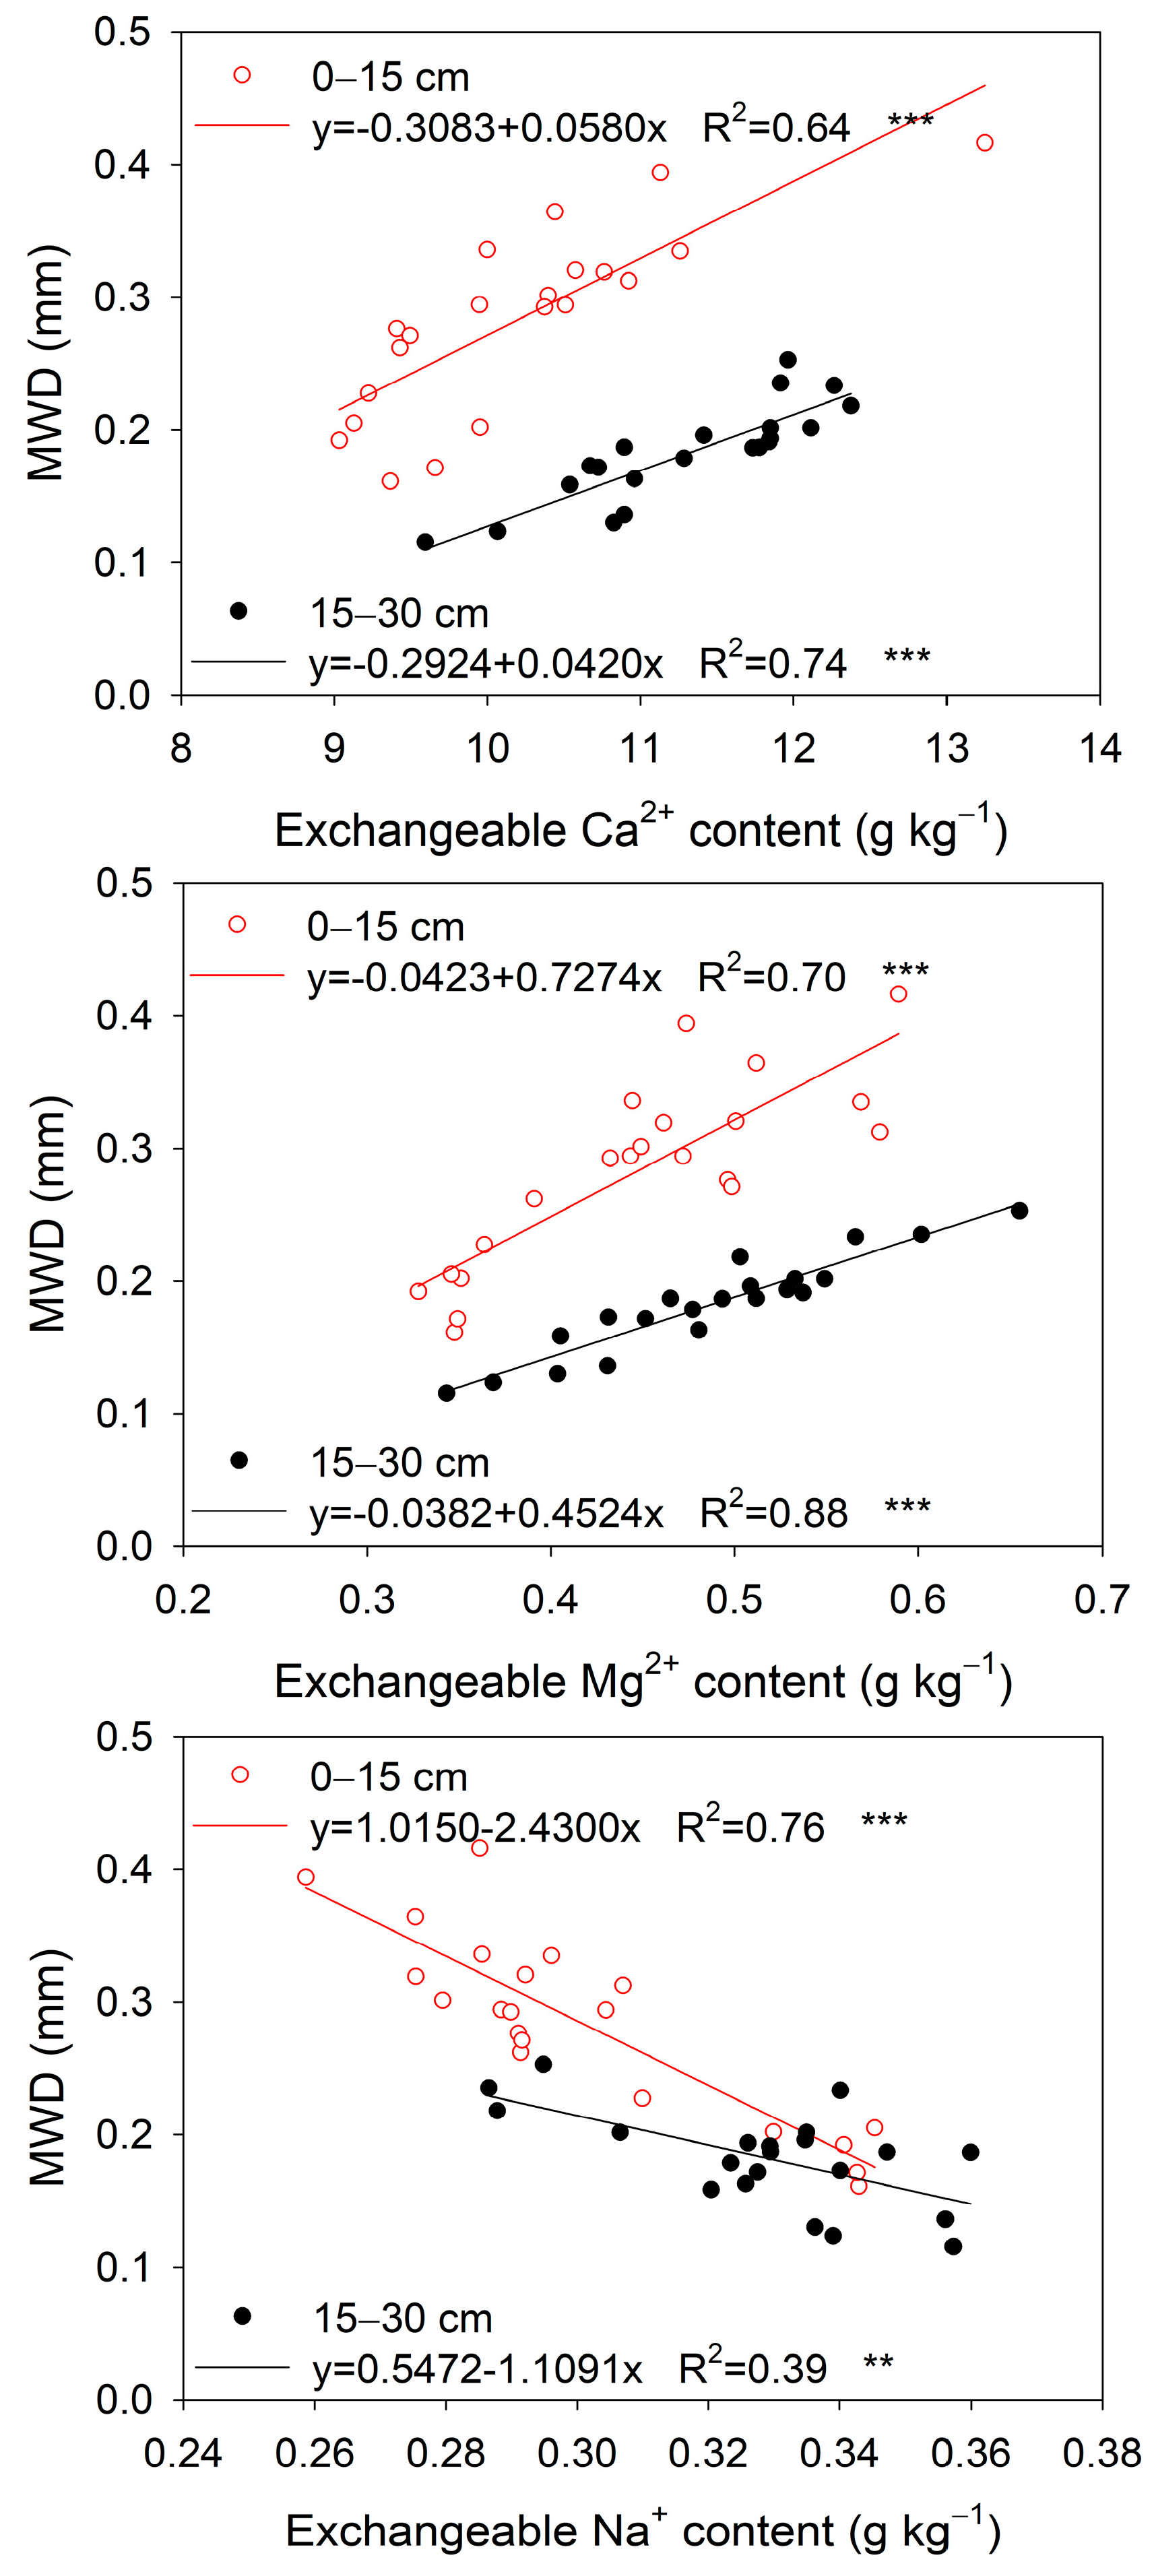
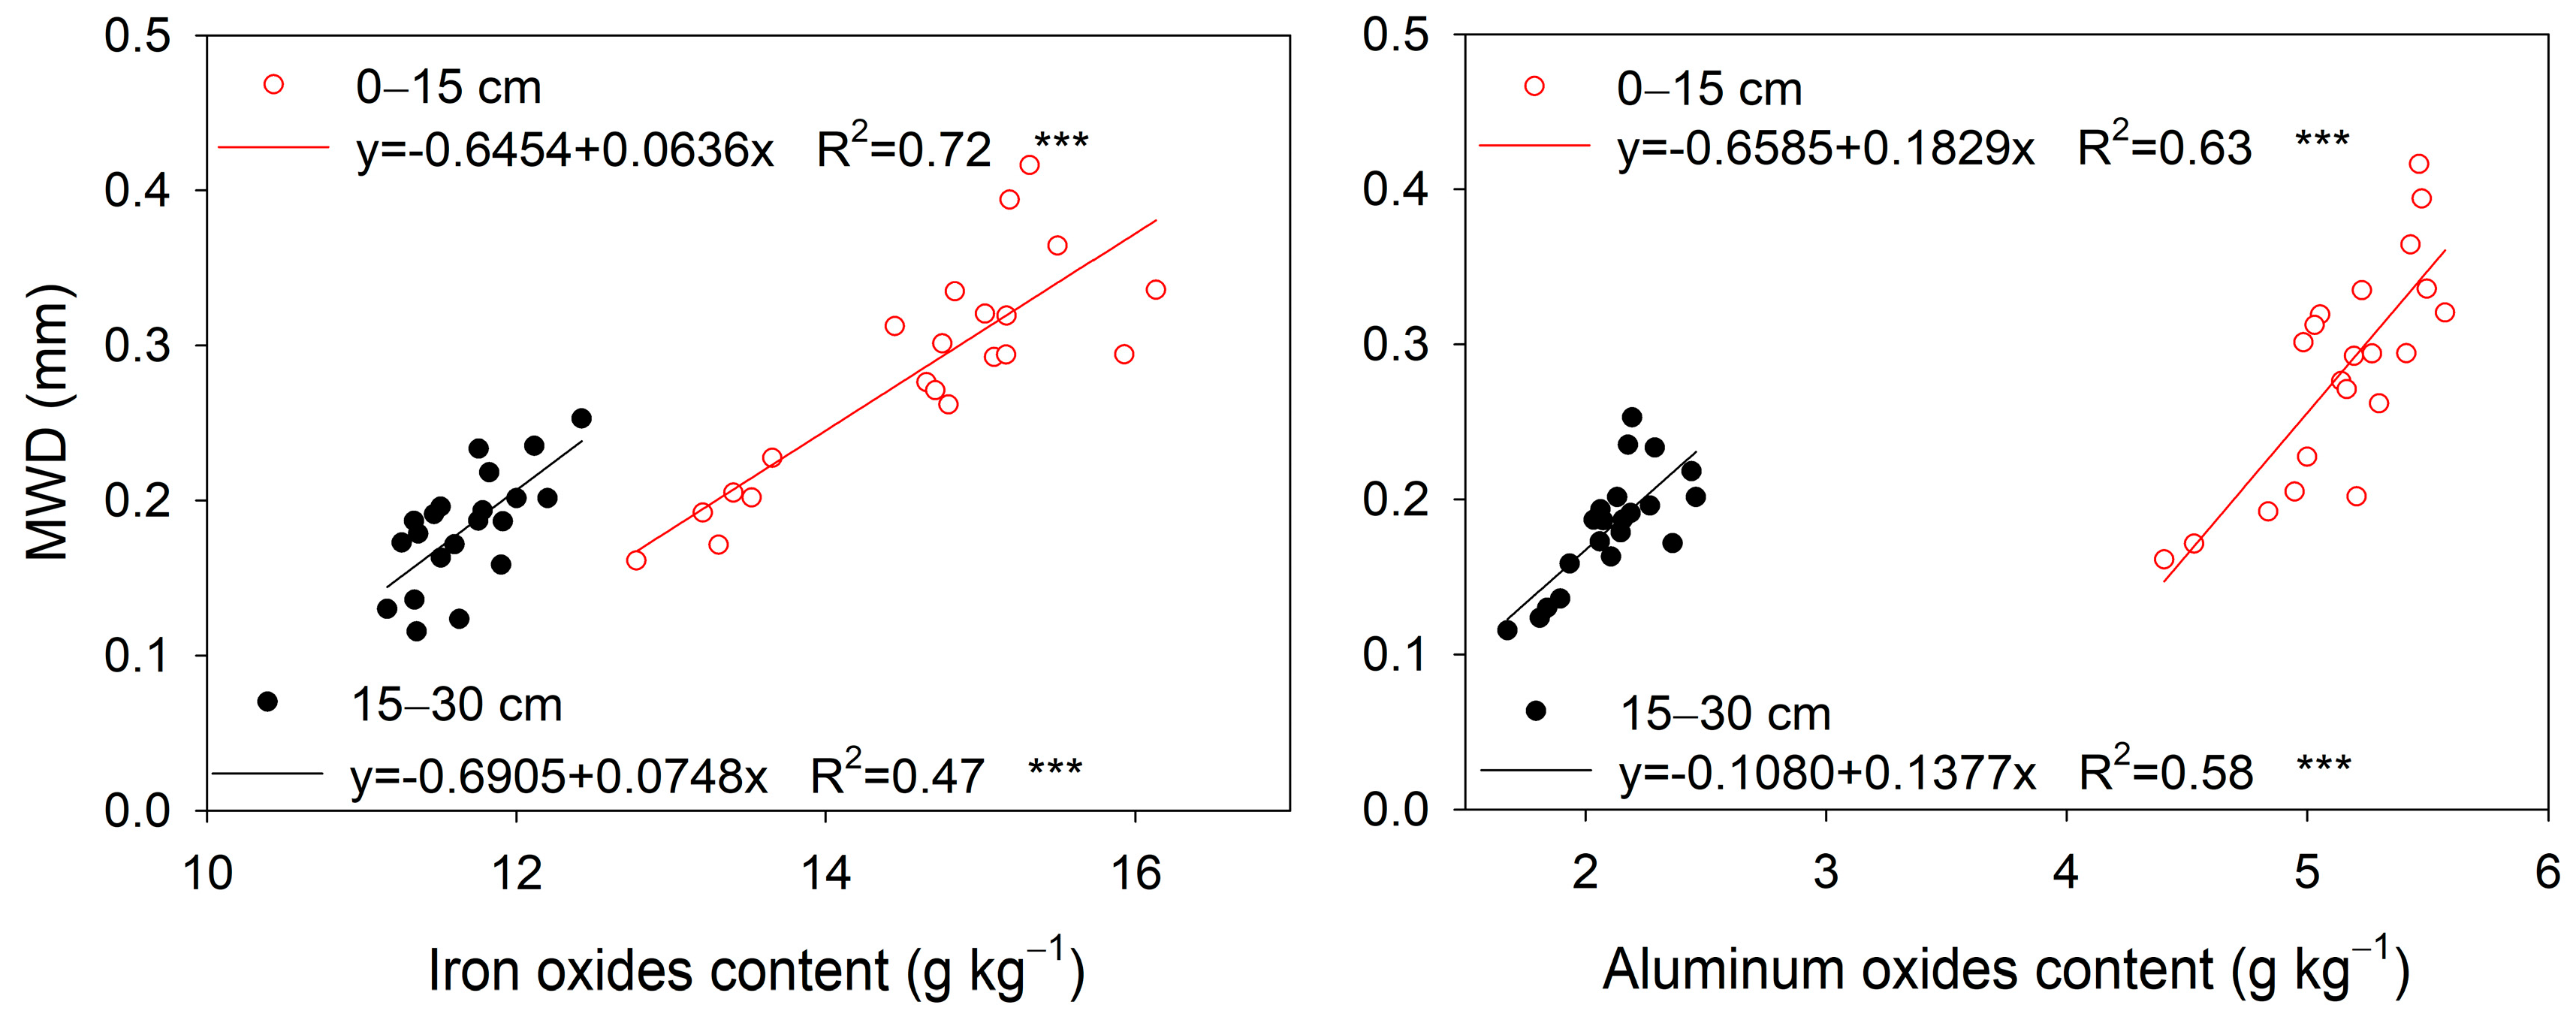
3.5. Effect of Fertilization on Soil Exchangeable Ca2+, Mg2+, Na+ Cations, Iron- and Aluminum-Oxides

The changes in the soil exchangeable Ca2+, Mg2+, Na+, and Fe (Fed, Feo, Fes) and Al oxide (Ald, Alo, Als) contents of all the treatments are shown in Table 3. The organic amendments significantly increased the Ca2+ and Mg2+ and Fe and Al oxide contents by 13.9% (8.1–22.3%), 39.6% (22.0–67.5%), 14.5% (12.1–18.3%) and 12.0% (9.7–14.6%), respectively, compared to T1 at a depth of 0–15 cm, except for the Ca2+ content of T3 and T6. By contrast, the Na+ contents were significantly decreased with the organic amendments. On average, the reduction was 15.1% (12.5–19.9%) compared to T1, whilst no significant differences were observed between T2 and T1. A similar variation tendency was observed in the 15–30 cm layer (Table 3).
A linear equation was used to express the response of the MWD to the soil exchangeable Ca2+, Mg2+ and Na+ contents. The results showed that the MWD and soil exchangeable Ca2+ and Mg2+ contents had positive correlation relationships (p < 0.01), but there was a negative correlation between the MWD and soil exchangeable Na+ (p < 0.01) content at both of the soil depths (Figure 5). Similarly, there were significant positive correlations between the MWD and the Fe oxides and/or Al oxides (Figure 6).

3.6. Correlation Matrix of Soil Organic Carbon, Labile Carbon Fractions, Humus Carbon Fractions and Mean Weight Diameter

A correlation analysis of the soil labile carbon fractions, humus carbon fractions, soil aggregates and the SOC at the 0–15 and 15–30 cm soil depths was conducted. In terms of the relationship between the SOC and the other indicators, the results revealed that the HUC (R2 = 0.89), POC, WSSC, DOC, MBC, HEC, HAC and MWD (R2 = 0.46) were significantly positively related to the SOC content at a depth of 0–15 cm. In addition to the above indicators, the ROC was also significantly positively correlated with the SOC content (p < 0.05) at a depth of 15–30 cm. In terms of the relationship between the MWD and the other indicators, the results revealed that the DOC (R2 = 0.79), POC, MBC, ROC, HEC, HAC, HUC, FAC, SOC and WSSC (R2 = 0.45) were significantly positively related to the MWD (p < 0.05) at a depth of 0–15 cm. However, the HUC and WSSC were not correlated with the MWD (p > 0.05) at a depth of 15–30 cm. Otherwise, significant correlations among the different indexes were also observed (Table 4). The results suggested that the improvement in the SOC content caused by the organic amendments was beneficial for the supply of soil active carbon, the conversion of soil humus carbon and the formation of soil macroaggregates directly and/or indirectly. In turn, the formation of soil macroaggregates could promote soil carbon sequestration.

4. Discussion

4.1. Effect of Organic Amendments on SOC Sequestration and Fractions

SOC has been considered as one of the most important indicators for its contributions to soil health, agricultural productivity and ecosystem services [9,29,30]. Previous studies have confirmed that sufficient inputs of carbon by organic amendments could be an effective and recommendable way to enhance SOC sequestration compared to mineral fertilizers alone [13,31,32]. In the present study, the initial SOC content was only 8.19 g kg−1, which was lower than the threshold level of 1%, at which soil becomes unstable and is prone to degrade under temperate conditions [29]. The exogenous organic amendments used in this study significantly increased the SOC content by 63.4% and 22.2% on average at the 0–15 and 15–30 cm soil depths compared to the T1 treatment after 12 years of fertilization, respectively (Figure 1). This was because of the direct carbon input (38.4 Mg ha–1 totally) used in this study and the increase in stubble-returning and rhizo-deposition [33]. However, the optimized N management (T2) decreased the SOC by 13.2% and 22.3% on average at the 0–15 and 15–30 cm soil depths compared to T1 (Figure 1). The most likely explanation was that the optimized N management resulted in a reduction in stubble-returning and rhizo-deposition, which directly decreased the carbon input [33]. The changes in the soil temperature and moisture caused by the optimized N management may have increased the soil organic matter mineralization [4,34]. In addition, the SOC content decreased with the increases in the soil depths, which was in line with results reported from previous studies [7,35].
The cumulative effect of the SOC was influenced by the quality of the organic amendments. A previous study reported that topsoil SOC was increased by 19.5% for straw combined with chemical fertilizers, whilst it was increased by 36.2% for manure combined with chemical fertilizers in croplands based on a global meta-analysis. Both of them were higher than that of fertilizer alone (10.0%) [36]. Similarly, our results found that the organic amendments enhanced the SOC by 29.6–119.8% at a depth of 0–15 cm and by 10.3–36.3% at a depth of 15–30 cm compared to T1 (Figure 1). The difference in the C/N ratio of the various organic amendments could be the most likely explanation, which were 58:1 for biochar, 46:1 for maize straw, 15:1 for manure and compost and 11:1 for biogas residue (Table 1), because a high C/N ratio (i.e., biochar and maize straw) can reduce the decomposition of organic matter by soil microorganisms [37]. Returning straw directly to the field could only maintain about 10–20% of the carbon after 5–10 years of biodegradation, whereas straw returned in the form of biochar could hold more than 50% [38]. Among all the organic amendments, the addition of biochar combined with optimized N management was the most effective treatment for SOC sequestration followed by the addition of compost combined with optimized N management, and the addition of maize straw combined with optimized N management was the slowest (Figure 1), which was most likely caused by the presence of aromatic carbon structures and the solubility of the different organic amendments, where the high presence and low solubility (i.e., that of biochar) would resist biochemical decomposition [22,32]. Additionally, the soil CO2 emissions with biochar addition were significantly lower than that of the soils with other amendments [39].
Soil labile carbon fractions, including MBC, DOC, POC and ROC, can serve as early indictors of changes in a soil’s chemical and physical properties because they can be altered in the short term by organic management practices [5,13,40]. Our results showed that the exogenous organic amendments significantly increased the MBC, DOC, POC and ROC contents compared to T1 after 12 years of fertilization at both of the soil depths (Figure 2). The increase in the MBC and DOC contents demonstrated that the soil was in process of being restored after receiving the treatment with the organic amendments combined with chemical fertilizers [40]. The reasons could be that the higher microbial abundance and greater microbial biomass after the addition of the organic amendments promoted the accumulation of MBC [41,42]. In addition, the application of the organic amendments could stimulate rhizo-deposition, which has been confirmed to be an important source of DOC [43]. However, there were no significant differences among the various organic amendments at both of the soil depths (Figure 2). The increase in the POC and ROC reflected a greater residue input in the system [5]. The reasons could be that the organic amendments brought in an increase in lignin and cellulose residues, which can promote high levels of root exudates [44]. For the different organic managements, the addition of biochar combined with optimized N management enhanced the POC content the most (Figure 2). This agreed with Wu et al. [13], who also reported that the application of biochar, manure and straw increased the POC content significantly by 83.3%, 50.0% and 66.7% compared to chemical fertilizer alone, respectively. The addition of compost combined with optimized N management enhanced the ROC content the most, and biochar showed a lower content than the other organic management (Figure 2), and this might have been due to the fact that the content of lignin was greater in the T4-T7 treatments, since the ROC content has been shown to be positively correlated with the lignin content in organic amendments [45].
The organic amendments combined with chemical fertilizers showed different increases in the HAC, HEC and HUC contents at both of the soil depths compared to Tl after 12 years of fertilization (Table 2). As an effective indicator of the SOC sequestration process, humus carbon fractions constitute a recalcitrant soil carbon pool. In addition, an increase in humus carbon fractions is important for soil carbon stabilization since they can be tightly bound to mineral surfaces to form metal–organic–mineral coatings through their adsorption to prevent microbial decomposition and mineralization [46]. However, the FAC content ranged more narrowly among the different fertilization treatments compared to HAC content (Table 2). This result was consistent with another study with long-term compost application [6]. The results indicated that organic inputs were more conducive to the formation of HA. This was due to the fact that FA contains more soluble and reactive components (i.e., carbohydrates, proteins and lipids), whilst HA contains aliphatic and aromatic molecules [47,48]. Meanwhile, FA is easily transferred into HA in the early stages [49]. Previous studies also found that the quality of organic amendments could differentially affect the microbial utilization of carbon in the organic contents [50,51]. The manure, compost and biogas residue applications likely contributed to an increase microbial activity to enhance the content of easily decomposable organic carbon, whilst the biochar- and straw-returning treatments showed a relatively lower decomposition rate due to their high C/N ratio [6], which partly explained the result that the WSSC content of the manure, compost and biogas residue additions tended to be higher than that of the other treatments at a depth of 0–15 cm, exclude the biochar application treatment (Table 2).

4.2. Effect of Organic Amendments on Soil Aggregate Formation

Our results showed that the organic amendments significantly increased the proportion of soil macroaggregates and MWD values compared to the chemical fertilizer treatment alone (Figure 3 and Figure 4). Similar results have been reported previously [4,12,13]. Meanwhile, an increase in soil exchangeable Ca2+ and Mg2+ cations and a decline in exchangeable Na+ were observed (Table 3). The increase in Ca2+ and Mg2+ cations was largely contributed to by the direct-input sources from the organic materials and superphosphate, and they could replace Na+ at the cation exchange sites [52]. Ca2+ and Mg2+ were significantly positively correlated with MWD, and Na+ was significantly negatively correlated with MWD (Figure 5), which indicated that the change in the exchangeable cations played a certain role in the formation of macroaggregates. Meanwhile, the soil mineralogy (i.e., Fe and Al) could control the formation and stability of aggregates through both mineral–mineral interactions and organo-mineral associations [20]. Thus, Fe and Al oxides could help to stabilize the soil aggregates. We found that the organic amendments significantly increased the contents of Fe and Al oxides in the topsoil (Table 3), and there was a significantly positive correlation between the MWD and Fe or Al oxides (Figure 6). In addition to their indirect role in the formation of soil macroaggregates, the improvement om the contents of soil exchangeable cations and oxides was closely related to the sequestration and stabilization of SOC via the adsorption or formation of humates [53]. Metallic sesquioxide significantly contributed to the specific surface area, and Fe and Al oxides showed a potentially greater affinity for SOC than the other mineral surfaces [54]. Moreover, the existence of polyvalent cations produces electrostatic bridging between soil mineral surfaces and SOC [55]. However, there were no significant differences among the various organic amendments at both of the soil depths (Figure 3 and Figure 4). This result was different from Wu et al. [13], where they found that returning manure and straw to soil enhanced the MWD content more than biochar after 2 years of fertilization.
Soil aggregation was influenced by the contents of soil labile carbon fractions as well (Table 4). Higher MBC and DOC contents under the various organic amendment treatments compared to the chemical fertilizers alone were observed (Figure 2), which resulted in the binding of soil particles together into aggregates [13,24]. The correlation matrix analysis illustrated that the MWD value increased along with the MBC and DOC (p < 0.01) (Table 4), which suggested that MBC and DOC were suitable indexes for evaluating macroaggregate formation in calcareous soils. Overall, the organic carbon fractions were released by the organic amendments as energy sources for the microorganisms in the soil. This could result in a greater level of binding agents related to the ease of decomposition being secreted, thus accelerating soil aggregation from microaggregates to macroaggregates [24,40,56]. By contrast, the formation of soil macroaggregates could play a physically protective role in SOC sequestration for resisting biodegradation [14,19,25].
Additionally, the sequestration and stabilization of SOC and the formation and stability of soil macroaggregates could be influenced by the chemical structure of the SOC, the structure of the soil microbial community, etc. [13,53]. The chemical structure composition of the SOC reflected the stability of the SOC directly; aromatic carbon is resistant to biodegradation and can be preferentially adsorbed onto metal oxides [13,57]. Therefore, future studies should focus on the effects of organic amendments on the molecular structure of SOC and the functional microorganisms associated with the carbon cycle.

5. Conclusions

The long-term organic amendments combined with N fertilization significantly enhanced SOC sequestration and promoted soil macroaggregate formation compared to the use of chemical fertilizers alone. On average, the addition of organic materials significantly increased the SOC content by 63.4% in 0–15 cm soil layer and by 22.2% in the 15–30 cm soil layer compared to the application of N by farmers. Among them, the application of biochar was the most effective strategy, which was primarily due to its high content of aromatic carbon available to resist biodegradation. The addition of organic materials significantly increased the soil humus carbon pools, particularly the HUC content, and this also partly explained the enhancement of the SOC content. The increase in the SOC content resulted in an improvement in the soil labile carbon fractions, and the soil exchangeable Ca2+ and Mg2+ cation and Fe and Al oxide contents were enhanced with the addition of organic materials, whilst the content of Na+ declined, especially in the 0–15 soil layer. The results contributed to macroaggregate formation and their stability, which in turn promoted the accumulation and stabilization of SOC. However, there were no significant differences in terms of MWD among all the organic materials at both of the soil depths after 12 years of fertilization. Overall, our results explained the formation of macroaggregates and suggested an important role of the addition of organic materials for soil carbon sequestration and sustainable agricultural production in calcareous soil.

Author Contributions

S.L. (Shuang Li): conceptualization, data curation, methodology and writing—original draft preparation. W.W.: writing—review and editing, funding acquisition and project administration. S.L. (Shutang Liu): investigation, visualization and formal analysis. All authors have read and agreed to the published version of the manuscript.

Funding

This research was funded by the Natural Science Foundation of Shandong Province [ZR2021QC107] and Funds for the Central Government to Guide Local Special Plans for Science and Technology Development [22-1-3-6-zyyd-nsh].

Institutional Review Board Statement

Not applicable.

Informed Consent Statement

Not applicable.

Data Availability Statement

The data generated and analyzed during the current study are available from the corresponding author on reasonable request.

Acknowledgments

We would like to acknowledge M.S. Fan and H.Q. Yang of China Agricultural University for providing soil samples and anonymous reviewers for constructive comments.

Conflicts of Interest

The authors declare that they have no known competing financial interests or personal relationships that could have appeared to influence the work reported in this paper.

References

  1. Kan, Z.R.; Ma, S.T.; Liu, Q.Y.; Liu, B.Y.; Virk, A.L.; Qi, J.Y.; Zhao, X.; Lal, R.; Zhang, H.L. Carbon sequestration and mineralization in soil aggregates under long-term conservation tillage in the North China Plain. Catena 2020, 188, 104428. [Google Scholar] [CrossRef]
  2. Bathes, N.H. Total carbon and nitrogen in the soils of the world. Eur. J. Soil Sci. 2014, 65, 10–21. [Google Scholar]
  3. Huang, Z.Q.; Xu, Z.H.; Chen, C.R.; Boyd, S. Changes in soil carbon during the establishment of a hardwood plantation in subtropical Australia. Forest Ecol. Manag. 2008, 254, 46–55. [Google Scholar] [CrossRef] [Green Version]
  4. Wei, W.L.; Huangpu, C.H.; Jia, Z.Y.; Liu, S.T. Long-term organic amendments improved soil carbon sequestration to support crop production. J. Plant Nutr. Soil Sci. 2021, 184, 678–687. [Google Scholar] [CrossRef]
  5. Tian, J.; Lu, S.H.; Fan, M.S.; Li, X.L.; Kuzyakov, Y. Labile soil organic matter fractions as influenced by non-flooded mulching cultivation and cropping season in rice-wheat rotation. Eur. J. Soil Biol. 2013, 56, 19–25. [Google Scholar] [CrossRef]
  6. Mi, W.H.; Sun, Y.; Gao, Q.; Liu, M.Y.; Wu, L.H. Changes in humus carbon fractions in paddy soil given different organic amendments and mineral fertilizers. Soil Till. Res. 2019, 195, 104421. [Google Scholar] [CrossRef]
  7. Liu, N.; Li, Y.Y.; Cong, P.; Wang, J.; Guo, W.; Pang, H.C.; Zhang, L. Depth of straw incorporation significantly alters crop yield, soil organic carbon and total nitrogen in the North China Plain. Soil Till. Res. 2021, 205, 104772. [Google Scholar] [CrossRef]
  8. Schlesinger, W.H.; Amundson, R. Managing for soil carbon sequestration: Let’s get realistic. Glob. Chang. Biol. 2018, 25, 386–389. [Google Scholar] [CrossRef] [PubMed] [Green Version]
  9. Lal, R. Soil carbon sequestration impacts on global climate change and food security. Science 2004, 304, 1623–1627. [Google Scholar] [CrossRef] [PubMed] [Green Version]
  10. Peplau, C.; Don, A.; Vestural, L.; Leafed, J.; Van Wisemen, B.A.S.; Schumacher, J.; Genitor, A. Temporal dynamics of soil organic carbon after land-use change in the temperate zone-carbon response functions as a model approach. Glob. Chang. Biol. 2011, 17, 2415–2427. [Google Scholar] [CrossRef]
  11. Matson, P.A.; Parton, W.J.; Power, A.G.; Swift, M.J. Agricultural intensification and ecosystem properties. Science 1997, 277, 504–509. [Google Scholar] [CrossRef] [PubMed]
  12. Tian, S.Y.; Zhu, B.J.; Yin, R.; Wang, M.W.; Jiang, Y.J.; Zhang, C.Z.; Li, D.M.; Chen, X.Y.; Karol, P.; Liu, M.Q. Organic fertilization promotes crop productivity through changes in soil aggregation. Soil Biol. Biochem. 2022, 165, 108533. [Google Scholar] [CrossRef]
  13. Wu, L.P.; Zhang, S.R.; Ma, R.H.; Chen, M.M.; Wei, W.L.; Ding, X.D. Carbon sequestration under different organic amendments in saline-alkaline soils. Catena 2021, 196, 104882. [Google Scholar] [CrossRef]
  14. Dai, H.C.; Zang, H.D.; Zhao, Y.X.; Qian, X.; Liu, K.C.; Wang, D.; Hao, J.Y.; Chen, Y.Q.; Sui, P. Linking bacterial community to aggregate fractions with organic amendments in a sandy soil. Land Degrade. Dev. 2019, 30, 1828–1839. [Google Scholar] [CrossRef]
  15. Zhao, Y.C.; Wang, M.Y.; Hu, S.J.; Zhang, X.D.; Ouyang, Z.; Zhang, G.L.; Huang, B.; Zhao, S.W.; Wu, J.S.; Xian, D.T.; et al. Economics- and policy-driven organic carbon input enhancement dominates soil organic carbon accumulation in Chinese croplands. Proc. Natl. Acad. Sci. USA 2018, 115, 4045–4050. [Google Scholar] [CrossRef] [Green Version]
  16. Fedeli, R.; Alexandrov, D.; Celletti, S.; Nafikova, E.; Loppi, S. Biochar improves the performance of Avena sativa L. grown in gasoline-polluted soils. Environ. Sci. Pollut. Res. 2022. [Google Scholar] [CrossRef]
  17. Akhtar, S.S.; Andersen, M.N.; Liu, F.L. Residual effects of biochar on improving growth, physiology and yield of wheat under salt stress. Agr. Water Manag. 2015, 158, 61–68. [Google Scholar] [CrossRef]
  18. Hagemann, N.; Spokas, K.; Schmidt, H.-P.; Kägi, R.; Böhler, M.A.; Bucheli, T.D. Activated carbon, biochar and charcoal: Linkages and synergies across pyrogenic carbon’s ABCs. Water 2018, 10, 182. [Google Scholar] [CrossRef] [Green Version]
  19. Yan, Y.; Tian, J.; Fan, M.S.; Zhang, F.S.; Li, X.L.; Christie, P.; Chen, H.Q.; Lee, J.; Kuzyakov, Y.; Six, J. Soil organic carbon and total nitrogen in intensively managed arable soils. Agr. Ecosyst. Environ. 2012, 150, 102–110. [Google Scholar] [CrossRef]
  20. Six, J.; Faustian, K.; Elliott, E.T.; Combrink, C. Soil structure and organic matter I. Distribution of aggregate-size classes and aggregate-associated carbon. Soil Sci. Soc. Am. J. 2000, 64, 681–689. [Google Scholar] [CrossRef]
  21. Qi, S.J.; Gao, H.J.; Zhu, P.; Hou, Y.P.; Zhao, S.C.; Rong, X.M.; Zhang, Y.P.; He, P.; Christie, P.; Zhou, W. Changes in soil carbon and nitrogen pools in a Molise after long-term fallow or application of chemical fertilizers, straw or manures. Soil Till. Res. 2016, 163, 255–265. [Google Scholar] [CrossRef]
  22. Zhang, J.J.; Wei, Y.X.; Liu, J.Z.; Yuan, J.C.; Liang, Y.; Ren, J.; Cai, H.G. Effects of maize straw and its biochar application on organic and humid carbon in water-stable aggregates of a Molise in Northeast China: A five-year field experiment. Soil Till. Res. 2019, 190, 1–9. [Google Scholar] [CrossRef]
  23. Yuhina, A.; Kuzyakov, Y. Saving the face of soil aggregates. Glob. Chang. Biol. 2019, 25, 3574–3577. [Google Scholar]
  24. Above, S.; Menasseri, S.; Angers, D.A.; Leterme, P. Dynamics of aggregate stability and biological binding agents during decomposition of organic materials. Eur. J. Soil Sci. 2007, 58, 239–247. [Google Scholar]
  25. Yan, Z.J.; Zhou, J.; Yang, L.; Goninan, A.; Yang, Y.D.; Peixoto, L.; Zeng, Z.H.; Zang, H.D.; Kuzyakov, Y. Diversified cropping systems benefit soil carbon and nitrogen stocks by increasing aggregate stability: Results of three fractionation methods. Sci. Total Environ. 2022, 824, 153878. [Google Scholar] [CrossRef]
  26. Tao, F.L.; Palouse, T.; Valkanas, E.; Makira, R. Cropland soils in China have a large potential for carbon sequestration based on literature survey. Soil Till. Res. 2019, 186, 70–78. [Google Scholar] [CrossRef]
  27. Zhang, Q.S.; Chu, Y.Y.; Xu, Y.F.; Ying, H.; Chen, X.H.; Zhao, Y.J.; Ma, W.Q.; Ma, L.; Zhang, J.Z.; Yin, Y.L.; et al. Outlook of China’s agriculture transforming from smallholder operation to sustainable production. Glob. Food Secur. Agr. 2020, 26, 100444. [Google Scholar] [CrossRef]
  28. Zhang, W.F.; Cao, G.X.; Li, X.L.; Zhang, H.Y.; Wang, C.; Liu, Q.Q.; Chen, X.P.; Cui, Z.L.; Shen, J.B.; Jiang, R.F.; et al. Closing yield gaps in China by empowering smallholder farmers. Nature 2016, 537, 671–674. [Google Scholar] [CrossRef]
  29. Martín, J.A.R.; Álvaro-Fuentes, J.; Gabriel, J.L.; Gutiérrez, C.; Nanos, N.; Escher, M.; Ramos-Mires, J.J.; Gil, D.; Martín-Lammerding, D.; Boulder, R. Soil organic carbon stock on the Majorca Island: Temporal change in agricultural soil over the last 10 years. Catena 2019, 181, 104087. [Google Scholar] [CrossRef]
  30. Taktsang, B.; Weber, J.; Ernakulum, E.; Rodríguez-Martín, J.A.; Shepherd, K.; Silla, A.; Thunder, Z.; Digby, L. Assessment of soil health indicators for sustainable production of maize in smallholder farming systems in the highlands of Cameroon. Geoderma 2016, 276, 64–73. [Google Scholar] [CrossRef]
  31. Chena, C.; Angers, D.A.; Barré, P.; Darrien, D.; Arouras, D.; Bales, D.J. Increasing organic stocks in agricultural soils: Knowledge gaps and potential innovations. Soil Till. Res. 2019, 188, 41–52. [Google Scholar] [CrossRef]
  32. Wang, J.Y.; Xing, Z.Q.; Kuzyakov, Y. Biochar stability in soil: Meta-analysis of decomposition and priming effects. GCB Bioenergy 2016, 8, 512–523. [Google Scholar] [CrossRef] [Green Version]
  33. Yang, J.; Gao, W.; Ren, S.R. Long-term effects of combined application of chemical nitrogen with organic materials on crop yields, soil organic carbon and total nitrogen in Fluvio-aquic soil. Soil Till. Res. 2015, 151, 67–74. [Google Scholar] [CrossRef]
  34. Chen, Z.M.; Xu, Y.H.; He, Y.J.; Zhou, X.H.; Fan, J.L.; Yu, H.Y.; Ding, W.X. Nitrogen fertilization stimulated soil heterotrophic but not autotrophic respiration in cropland soils: A greater role of organic over inorganic fertilizer. Soil Biol. Biochem. 2018, 116, 253–264. [Google Scholar] [CrossRef]
  35. Dogwatches, S.B.; Chen, Z.D.; Lal, R.; Zhang, H.L. Changes in soil organic carbon and nitrogen as affected by tillage and residue management under wheat-maize cropping system in the North China Plain. Soil Till. Res. 2014, 144, 110–118. [Google Scholar]
  36. Han, P.F.; Zhang, W.; Wang, G.C.; Sun, W.J.; Huang, Y. Changes in soil organic carbon in croplands subjected to fertilizer management: A global meta-analysis. Sci. Rep. UK 2016, 6, 27199. [Google Scholar] [CrossRef] [Green Version]
  37. Kimura, M.; Mutase, J.; Lu, Y. Carbon cycling in rice field ecosystems in the context of input, decomposition and translocation of organic amendments and the fates of their end products (CO2 and CH4). Soil Biol. Biochem. 2004, 36, 1399–1416. [Google Scholar] [CrossRef]
  38. Lehmann, J.; Gaunt, J.; Rendon, M. Bio-char sequestration in terrestrial ecosystems: A review. Mitig. Adapt. Strat. Gl. 2006, 11, 395–419. [Google Scholar] [CrossRef]
  39. Yang, X.; Meng, J.; Lan, Y.; Chen, W.F.; Yang, T.X.; Yuan, J.; Liu, S.N.; Han, J. Effects of maize stover and its biochar on soil CO2 emissions and labile organic carbon fractions in Northeast China. Agr. Ecosyst. Environ. 2017, 240, 24–31. [Google Scholar] [CrossRef]
  40. Xian, W.J.; Wu, L.F.; Zhang, Y.P.; Wu, T.; Li, X.P.; Ouyang, Z. Effects of straw application on coastal saline topsoil salinity and wheat yield trend. Soil Till. Res. 2017, 169, 1–6. [Google Scholar]
  41. Li, Y.; Li, Z.; Cui, S.; Liang, G.P.; Zhang, Q.P. Microbial-derived carbon components are critical for enhancing soil organic carbon in no-tillage croplands: A global perspective. Soil Till. Res. 2021, 205, 104758. [Google Scholar] [CrossRef]
  42. Franciosi, D.; Schulz, E.; Lentando, G.; Weber, T.; Buscot, F.; Reitz, T. Mineral vs. organic amendments: Microbial community structure, activity and abundance of agriculturally relevant microbes are driven by long-term fertilization strategies. Front. Microbiol. 2014, 7, 1446. [Google Scholar]
  43. Fang, H.J.; Cheng, S.L.; Yu, G.R.; Xu, M.J.; Wang, Y.S.; Li, L.S.; Dang, X.S.; Wang, L.; Li, Y.N. Experimental nitrogen deposition alters the quantity and quality of soil dissolved organic carbon in an alpine meadow on the Qinghai-Tibetan Plateau. Appl. Soil Ecol. 2014, 81, 1–11. [Google Scholar] [CrossRef]
  44. Chaudhary, S.; Deri, G.S.; Brar, B.S. Long-term effects of NPK fertilizers and organic manures on carbon stabilization and management index under rice-wheat cropping system. Soil Till. Res. 2017, 166, 59–66. [Google Scholar] [CrossRef]
  45. Tirol-Padre, A.; Ladha, J.K. Assessing the reliability of permanganate-oxidizable carbon as an index of soil labile carbon. Soil Sci. Soc. Am. J. 2004, 68, 969–978. [Google Scholar] [CrossRef]
  46. Zhao, X.M.; Zhu, M.L.; Guo, X.X.; Wang, H.B.; Sui, B.; Zhao, L.P. Organic carbon content and humus composition after application aluminum sulfate and rice straw to soda saline-alkaline soil. Environ. Sci. Pollut. Res. 2019, 26, 13746–13754. [Google Scholar] [CrossRef]
  47. Nguyen, H.V.M.; Lee, H.S.; Lee, S.Y.; Hurl, J.; Shin, H.S. Changes in structural characteristics of humid and fulvic acids under chlorination and their association with trihalomethanes and halo acetic acids formation. Sci. Total Environ. 2021, 790, 148142. [Google Scholar] [CrossRef]
  48. Simpson, A.J.; Song, G.; Smith, E.; Lam, B.; Novotny, E.H.; Hayes, M.H.B. Unraveling the structural components of soil human by use of solution-state nuclear magnetic resonance spectroscopy. Environ. Sci. Technol. 2007, 41, 876–883. [Google Scholar] [CrossRef]
  49. Qi, Z.P.; Li, M.X.; Song, L.Y.; Wang, C.; Yang, S.; Yan, Z.Y.; Wang, Y.Q. Study on nitrogen-retaining microbial agent to reduce nitrogen loss during chicken manure composting and nitrogen transformation mechanism. J. Clean. Prod. 2021, 285, 124813. [Google Scholar] [CrossRef]
  50. Das, R.; Kuribayashi, T.J.; Das, D.; Ahmed, N.; Kumar, R.; Biswas, S.; Wail, S.S.; Singh, R.; Shukla, V.K.; Yadava, M.S.; et al. Long-term fertilization and manuring with different organics alter stability of carbon in colloidal organo-mineral fraction in soils of varying clay mineralogy. Sci. Total Environ. 2019, 684, 682–693. [Google Scholar] [CrossRef]
  51. Mohanty, M.; Sinha, N.K.; Reddy, K.S.; Chaudhary, R.S.; Rao, A.S.; Dall, R.C.; Menzies, N.W. How important is the quality of organic amendments in relation to mineral N availability in soils? Agr. Res. 2013, 2, 99–110. [Google Scholar] [CrossRef]
  52. Saifullah, D.S.; Naeem, A.; Rangel, Z.; Naidu, R. Biochar application for the remediation of salt-affected soils: Challenges and opportunities. Sci. Total Environ. 2018, 625, 320–335. [Google Scholar] [CrossRef] [PubMed]
  53. Watermeier, M.; Urbanski, L.; Holiya, E.; Lang, B.; von Litzow, M.; Marin-Spitted, E.; van Semele, B.; Robot, E.; Leif, M.; Garcia-Francona, N.; et al. Soil organic carbon storage as a key function of soils: A review of drivers and indicators at various scales. Geoderma 2019, 333, 149–162. [Google Scholar]
  54. Zhuang, Y.; Yu, G.R. Effects of surface coatings on electrochemical properties and contaminant sorption of clay minerals. Chemosphere 2002, 49, 619–628. [Google Scholar] [CrossRef] [PubMed]
  55. Kleber, M.; Collins, P.; Sutton, R. A conceptual model of organo-mineral interactions in soils: Self-assembly of organic molecular fragments into zonal structures on mineral surfaces. Biogeochemistry 2007, 85, 9–24. [Google Scholar] [CrossRef]
  56. Joseph, U.E.; Toleware, A.O.; Kehinde, E.O.; Omasa, E.E.; Yetunde, A.T.; George, O.O.; Zhao, C.S.; Wang, H.Y. Effect of biochar on soil structure and storage of soil organic carbon and nitrogen in the aggregate fractions of an Albic soil. Arch Argon. Soil Sci. 2020, 66, 1–12. [Google Scholar] [CrossRef]
  57. Wen, Y.L.; Liu, W.J.; Deng, W.B.; He, X.H.; Yu, G.H. Impact of agricultural fertilization practices on organo-mineral associations in four long-term field experiments: Implications for soil C sequestration. Sci. Total Environ. 2019, 651, 591–600. [Google Scholar] [CrossRef]
Figure 1. Soil organic carbon (SOC) content at 0–15 and 15–30 cm depths as affected by different treatments in 2020 after 12 years of annual fertilization. T1: N application by farmers (240 kg N ha−1); T2: optimized N management (Nopt); T3: biochar + Nopt; T4: straw + Nopt; T5: manure + Nopt; T6: compost + Nopt; T7: biogas residue + Nopt. Lower-case letters indicate significant differences among treatments at a specific soil depth at p < 0.05 level. Capital letters indicate significant differences between the two soil depths at p < 0.05 level.
Agronomy 13 00291 g001
Figure 2. Microbial biomass carbon (MBC), dissolved organic carbon (DOC), particle organic carbon (POC) and KMnO4-oxidizable carbon (ROC) contents at 0–15 and 15–30 cm depths as affected by different treatments in 2020 after 12 years of annual fertilization. T1: N application by farmers (240 kg N ha−1); T2: optimized N management (Nopt); T3: biochar + Nopt; T4: straw + Nopt; T5: manure + Nopt; T6: compost + Nopt; T7: biogas residue + Nopt. Lower-case letters indicate significant differences among treatments at a specific soil depth at p < 0.05 level. Capital letters indicate significant differences between the two soil depths at p < 0.05 level.
Agronomy 13 00291 g002
Figure 3. Soil aggregate distributions at 0–15 and 15–30 cm depths as affected by different treatments in 2020 after 12 years of annual fertilization. T1: N application by farmers (240 kg N ha−1); T2: optimized N management (Nopt); T3: biochar + Nopt; T4: straw + Nopt; T5: manure + Nopt; T6: compost + Nopt; T7: biogas residue + Nopt. Lower-case letters indicate significant differences among treatments of each aggregate size at a specific soil depth at p < 0.05 level.
Agronomy 13 00291 g003
Figure 4. Mean weight diameter (MWD) at 0–15 and 15–30 cm depths as affected by different treatments in 2020 after 12 years of annual fertilization. T1: N application by farmers (240 kg N ha−1); T2: optimized N management (Nopt); T3: biochar + Nopt; T4: straw + Nopt; T5: manure + Nopt; T6: compost + Nopt; T7: biogas residue + Nopt. Lower-case letters indicate significant differences among treatments at a specific soil depth at p < 0.05 level. Capital letters indicate significant differences between the two soil depths at p < 0.05 level.
Agronomy 13 00291 g004
Figure 5. Relationships between mean weight diameter (MWD) and soil exchangeable calcium (Ca2+), magnesium (Mg2+) and sodium (Na+) contents. Red and black lines indicate relationships between MWD and exchangeable cations at 0–15 and 15–30 cm depths, respectively. ** p < 0.01, *** p < 0.001.
Agronomy 13 00291 g005
Figure 6. Relationships between mean weight diameter (MWD) and iron oxide and aluminum oxide content. Red and black lines indicate relationships between MWD and iron and aluminum oxides at 0–15 and 15–30 cm depths, respectively. *** p < 0.001.
Agronomy 13 00291 g006
Table 1. Carbon and nitrogen content and pH value of different organic materials.
IndicatersBiocharStrawManureCompostBiogas-residue
Carbon (%)69.3541.1826.0626.4423.16
Nitrogen (%)1.190.901.701.812.10
pH8.30/6.987.857.21
Table 2. Water-soluble substance carbon (WSSC), humic acid carbon (HAC), fulvic acid carbon (FAC), total alkali-extractable humus carbon (HEC) and humin carbon (HUC) contents at 0–15 and 15–30 cm depths as affected by different treatments in 2020 after 12 years of annual fertilization. T1: N application by farmers (240 kg N ha−1); T2: optimized N management (Nopt); T3: biochar + Nopt; T4: straw + Nopt; T5: manure + Nopt; T6: compost + Nopt; T7: biogas residue + Nopt. Lower-case letters indicate significant differences among treatments at a specific soil depth at p < 0.05 level. Capital letters indicate significant differences between the two soil depths at p < 0.05 level.
Soil DepthTre.WSSC (g kg−1)HAC (g kg−1)FAC (g kg−1)HEC (g kg−1)HUC (g kg−1)
0–15 cmT10.43 ± 0.05 cd0.75 ± 0.03 d2.56 ± 0.03 c3.31 ± 0.07 d3.85 ± 0.24 cd
T20.36 ± 0.04 d0.83 ± 0.06 cd2.77 ± 0.10 bc3.59 ± 0.04 cd3.65 ± 0.41 d
T31.18 ± 0.11 a0.95 ± 0.08 bc3.03 ± 0.09 ab3.98 ± 0.16 bc11.76 ± 0.98 a
T40.53 ± 0.00 bcd1.01 ± 0.02 b3.37 ± 0.22 a4.38 ± 0.23 ab5.64 ± 0.32 bc
T50.69 ± 0.07 b1.00 ± 0.00 b3.04 ± 0.11 ab4.04 ± 0.10 ab6.92 ± 0.70 b
T60.64 ± 0.05 bc1.28 ± 0.05 a3.16 ± 0.20 ab4.44 ± 0.18 a6.37 ± 0.49 b
T70.69 ± 0.08 b1.08 ± 0.02 b2.94 ± 0.05 abc4.02 ± 0.04 abc6.87 ± 0.78 b
Mean0.64 ± 0.06 A0.99 ± 0.04 A2.98 ± 0.07 A3.97 ± 0.09 A6.44 ± 0.59 A
15–30 cmT10.52 ± 0.02 c0.68 ± 0.02 c1.70 ± 0.05 b2.38 ± 0.07 c5.18 ± 0.24 c
T20.45 ± 0.01 c0.75 ± 0.03 c1.79 ± 0.05 b2.54 ± 0.02 bc4.51 ± 0.07 c
T30.92 ± 0.06 a0.87 ± 0.01 b1.95 ± 0.11 ab2.82 ± 0.10 ab9.15 ± 0.60 a
T40.55 ± 0.07 c0.87 ± 0.01 b1.95 ± 0.13 ab2.82 ± 0.13 ab4.95 ± 0.31 c
T50.55 ± 0.02 c0.91 ± 0.02 ab2.23 ± 0.13 a3.14 ± 0.11 a5.46 ± 0.21 bc
T60.73 ± 0.07 b0.98 ± 0.05 a2.23 ± 0.14 a3.21 ± 0.20 a6.65 ± 0.18 b
T70.52 ± 0.07 c0.91 ± 0.05 ab2.08 ± 0.19 ab2.99 ± 0.22 a5.24 ± 0.71 c
Mean0.60 ± 0.04 A0.85 ± 0.02 B1.99 ± 0.06 B2.84 ± 0.08 B5.88 ± 0.35 A
Table 3. Soil exchangeable calcium (Ca2+), magnesium (Mg2+), sodium (Na+), iron oxide (dissociated Fed, amorphous Feo, complex Fes) and aluminum oxide (dissociated Ald, amorphous Alo, complex Als) contents at 0–15 and 15–30 cm depths as affected by different treatments in 2020 after 12 years of annual fertilization. T1: N management by farmers (240 kg N ha–1); T2: optimized N management (Nopt); T3: biochar + Nopt; T4: straw + Nopt; T5: manure + Nopt; T6: compost + Nopt; T7: biogas residue + Nopt. Lower-case letters indicate significant differences among treatments at a specific soil depth at p < 0.05 level. Capital letters indicate significant differences between the two soil depths at p < 0.05 level.
Soil DepthTre.Ca2+
(g kg−1)
Mg2+
(g kg−1)
Na+
(g kg−1)
Fed
(g kg−1)
Ald
(g kg−1)
Feo
(g kg−1)
Alo
(g kg−1)
Fes
(g kg−1)
Als
(g kg−1)
0–15 cmT19.66 ± 0.17
bc
0.35 ± 0.00
e
0.34 ± 0.00
a
11.66 ± 0.25
c
4.10 ± 0.21
b
1.42 ± 0.10
b
0.56 ± 0.07
b
0.13 ± 0.01
cd
0.06 ± 0.01
cd
T29.13 ± 0.06
c
0.35 ± 0.01
e
0.33 ± 0.01
a
11.74 ± 0.23 bc4.35 ± 0.06 ab1.58 ± 0.12
b
0.53 ± 0.00
b
0.11 ± 0.00
d
0.04 ± 0.01
d
T39.79 ± 0.18
bc
0.43 ± 0.02
d
0.29 ± 0.00
bc
13.10 ± 0.49
a
4.52 ± 0.06
a
2.28 ± 0.23
a
0.76 ± 0.06
a
0.24 ± 0.01
a
0.12 ± 0.01
a
T410.76 ± 0.21
b
0.46 ± 0.01
c
0.27 ± 0.01
c
12.40 ± 0.18
abc
4.22 ± 0.07
ab
2.48 ± 0.09
a
0.88 ± 0.11
a
0.16 ± 0.01
bc
0.08 ± 0.00
bc
T511.81 ± 0.73
a
0.58 ± 0.01
a
0.30 ± 0.01
b
12.49 ± 0.05
ab
4.35 ± 0.10
ab
2.21 ± 0.20
a
0.82 ± 0.04
a
0.17 ± 0.01
b
0.07 ± 0.00
cd
T69.83 ± 0.38
bc
0.50 ± 0.00
b
0.29 ± 0.00
bc
12.31 ± 0.15
abc
4.33 ± 0.14
ab
2.33 ± 0.03
a
0.85 ± 0.03
a
0.16 ± 0.00
bc
0.11 ± 0.00
a
T710.44 ± 0.04
b
0.47 ± 0.02
bc
0.29 ± 0.01
bc
12.71 ± 0.14
a
4.32 ± 0.04
ab
2.30 ± 0.01
a
0.88 ± 0.06
a
0.24 ± 0.02
a
0.10 ± 0.01
ab
Mean10.20 ± 0.21
B
0.45 ± 0.02
A
0.30 ± 0.01
B
12.34 ± 0.13
A
4.31 ± 0.04
A
2.09 ± 0.10
B
0.76 ± 0.04
A
0.17 ± 0.01
A
0.08 ± 0.01
A
15–30 cmT110.07 ± 0.27
b
0.37 ± 0.02
c
0.34 ± 0.01
a
9.03 ± 0.17
a
1.25 ± 0.13
b
2.55 ± 0.02
b
0.52 ± 0.09
b
0.04 ± 0.01
de
0.03 ± 0.00
bc
T210.89 ± 0.04
ab
0.44 ± 0.02
bc
0.34 ± 0.01
a
8.85 ± 0.18
a
1.30 ± 0.03
b
2.46 ± 0.08
b
0.62 ± 0.06
ab
0.03 ± 0.00
e
0.02 ± 0.00
c
T311.46 ± 0.48
a
0.48 ± 0.01
ab
0.31 ± 0.01
a
9.01 ± 0.10
a
1.55 ± 0.09
a
2.49 ± 0.03
b
0.71 ± 0.02
ab
0.09 ± 0.01
a
0.06 ± 0.01
ab
T411.84 ± 0.25
a
0.54 ± 0.02
a
0.33 ± 0.00
a
9.03 ± 0.05
a
1.43 ± 0.02
ab
2.49 ± 0.05
b
0.77 ± 0.04
a
0.05 ± 0.00
cd
0.04 ± 0.01
abc
T511.85 ± 0.04
a
0.53 ± 0.04
ab
0.32 ± 0.02
a
9.15 ± 0.17
a
1.35 ± 0.01
ab
2.53 ± 0.06
b
0.70 ± 0.05
ab
0.07 ± 0.00
bc
0.04 ± 0.00
abc
T611.85 ± 0.07
a
0.56 ± 0.05
a
0.33 ± 0.02
a
9.20 ± 0.08
a
1.34 ± 0.07
ab
2.84 ± 0.10
a
0.75 ± 0.06
a
0.07 ± 0.01
abc
0.04 ± 0.00
abc
T711.23 ± 0.45
a
0.50 ± 0.03 ab0.33 ± 0.01
a
8.98 ± 0.17
a
1.33 ± 0.03
ab
2.68 ± 0.11
ab
0.83 ± 0.10
a
0.08 ± 0.00
ab
0.06 ± 0.01
a
Mean11.31 ± 0.16
A
0.49 ± 0.02
A
0.33 ± 0.00
A
9.04 ± 0.05
B
1.37 ± 0.03
B
2.58 ± 0.04
A
0.70 ± 0.03
A
0.06 ± 0.01
B
0.04 ± 0.00
B
Table 4. Correlation matrix of soil organic carbon (SOC), water-soluble substance carbon (WSSC), humic acid carbon (HAC), fulvic acid carbon (FAC), total alkali-extractable humus carbon (HEC), humin carbon (HUC), microbial biomass carbon (MBC), dissolved organic carbon (DOC), particle organic carbon (POC), KMnO4-oxidizable carbon (ROC) contents and mean weight diameter (MWD) at 0–15 and 15–30 cm depths as affected by different treatments in 2020 after 12 years of annual fertilization. * p < 0.05, ** p < 0.01.
Soil DepthIndexSOCWSSCHACFACHECHUCMBCDOCPOCROCMWD
0–15 cmSOC1.000.88 **0.48 *0.410.49 *0.89 **0.55 *0.62 **0.88 **0.390.46 *
WSSC 1.000.150.200.200.99 **0.300.49 *0.86 **0.140.45 *
HAC 1.000.51 *0.78 **0.200.68 **0.58 **0.55 *0.82 **0.52 *
FAC 1.000.94 **0.270.64 **0.60 **0.360.58 **0.47 *
HEC 1.000.280.74 **0.67 **0.48 *0.76 **0.56 **
HUC 1.000.360.53 *0.88 **0.160.50 *
MBC 1.000.72 **0.54 *0.53 *0.62 **
DOC 1.000.61 **0.65 **0.79 **
POC 1.000.44 *0.67 **
ROC 1.000.58 **
MWD 1.00
15–30 cmSOC1.000.74 **0.59 **0.360.46 *0.73 **0.50 *0.69 **0.71 **0.51 *0.57 **
WSSC 1.000.370.200.270.94 **0.350.56 **0.72 **0.180.28
HAC 1.000.68 **0.83 **0.270.61 **0.81 **0.50 *0.75 **0.75 **
FAC 1.000.97 **0.060.410.76 **0.320.77 **0.57 **
HEC 1.000.130.51 *0.83 **0.400.82 **0.67 **
HUC 1.000.240.400.81 **0.070.30
MBC 1.000.50 *0.350.58 **0.56 **
DOC 1.000.55 *0.78 **0.55 **
POC 1.000.280.52 *
ROC 1.000.69 **
MWD 1.00
Disclaimer/Publisher’s Note: The statements, opinions and data contained in all publications are solely those of the individual author(s) and contributor(s) and not of MDPI and/or the editor(s). MDPI and/or the editor(s) disclaim responsibility for any injury to people or property resulting from any ideas, methods, instructions or products referred to in the content.

