Article

Analysis of Genetic Diversity, Population Structure and Association Mapping for Late Blight Resistance in Potato (Solanum tuberosum L.) Accessions Using SSR Markers

1
ICAR—Central Potato Research Institute, Shimla 171001, India
2
ICAR—Central Potato Research Institute, Modipuram 250110, India
*
Author to whom correspondence should be addressed.
Agronomy 2023, 13(2), 294; https://doi.org/10.3390/agronomy13020294
Submission received: 10 November 2022 / Revised: 7 December 2022 / Accepted: 22 December 2022 / Published: 18 January 2023
(This article belongs to the Special Issue Application of Molecular Marker Technology in Crop Breeding)

Abstract

:
The allelic variations in a diversity panel of 353 potato accessions, including 256 accessions belonging to Solanum tuberosum sub spp. tuberosum, 49 accessions belonging to Solanum tuberosum sub spp. andigena, and 48 Indian potato varieties were analysed using 25 simple sequence repeat (SSR) markers. The SSR allelic profiles revealed high levels of polymorphism and distinctness among the accessions studied. A total of 343 alleles of 25 SSR markers were observed in the diversity panel of 353 highly diverse tetraploid potato accessions. The number of alleles produced per SSR varied from 8 for the marker STM1053 to 25 for the marker STIKA. The polymorphic information content (PIC) ranged from 0.66 (STG0010) to 0.93 (STM1106) with an average of 0.82. The cluster analysis using the SSR allelic profiles of 353 accessions divided the population into five major groups. The association mapping for late blight resistance identified six markers with the general linear model (GLM), and out of these six markers significance of three markers was reconfirmed with the mixed linear model (MLM). The findings of this study suggest that SSRs are the appropriate markers for evaluating genetic diversity and population structure within different potato germplasm collections. A significant diversity across the tetraploid potato accessions was observed. Moreover, the markers identified in this study could be useful in marker-assisted selection (MAS) breeding in potato for late blight resistance (LBR).

1. Introduction

Potato (Solanum tuberosum L.) is the third most important crop in terms of human consumption. Being the world’s most consumed non-grain food crop, it plays a key role in the battle against global food scarcity and hidden hunger [1]. However, due to climate change and population blasts, further increase in potato production has become challenging [2]. The potato belongs to the genus Solanum, which comprises a number of important species. Most of the cultivated potato varieties are autotetraploid; however, the ploidy level varies from diploid to hexaploidy in wild potato species [3]. Despite the availability of highly diverse potato germplasms, most of the cultivated potato varieties have a narrow genetic basis. This might be due to the repeated breeding performed for decades for better agronomic traits [4]. The diverse potato gene pool can be utilized to incorporate various desirable traits into cultivated potato varieties.
Late blight caused by P. infestans is the most devastating potato disease. The crop loss and the cost of chemicals used to control late blight were anticipated more than EUR 9 billion annually [5,6]. In the 18th and 19th centuries, around 1 million people died due to the great Irish famine caused by the late blight of potato [7]. However, over time several late-blight-resistant genes were identified in the potato germplasm, and some were introduced from other Solanum species. These include Rpi, R1, R2, and R3 genes from S. demissum, Rpi-blb2 from S. bulbocastanum, and many more [6]. The diverse potato germplasm must have some late-blight-resistant genes, which can be identified through association mapping or genome-wide association mapping (GWAS). Alvarez et al. [8] identified two new genes for LBR in potato. Recently, Wang et al. [9] found 14 candidate genes for LBR in a population of 284 potato cultivars. The candidate genes may help to develop late-blight-resistant potato cultivars.
To fulfil the increasing global potato demand, there is an urgent need for better potato varieties to satisfy potato growers, consumers, and the industry. Earlier potato varieties were differentiated on the basis of morphological and physiological parameters, such as plant architecture, tuber shape, skin colour, flesh colour, eye depth, and resistance to various biotic and abiotic stresses [10]. However, these traits are influenced by the environment, which may lead to inefficient selection [11]. Further, conventional methods used to classify the different cultivars were subjective, laborious, and required highly skilled persons. Variety identification is a crucial and essential part of breeding programs, germplasm management, seed certification, new cultivar registration, intellectual property rights, and trademarks. Therefore, it is important to create a quick and accurate approach to evaluate the genetic diversity of potato varieties.
The assessment of genetic variations in crop plants is a major aspect of plant breeding and crop improvement programs. The importance of molecular markers in plant breeding is highly known. These were used extensively in almost all the major crops for improving different traits, such as crop yield, quality, and biotic and abiotic stress tolerance. The molecular markers based on simple sequence repeats (SSRs) are co-dominant, highly polymorphic, and well conserved across the related plant species. The SSR markers are considered suitable for studying genetic diversity because they follow the Mendelian inheritance. In potato, SSR-marker-based DNA fingerprinting is extensively used to distinguish two potato cultivars at the genetic level [12,13]. These have the potential to identify a high level of variation and their results are highly reproducible. Previous studies also suggest that SSRs provide high resolution for genetic diversity studies and drop the number of markers required to differentiate two potato clones [12,14,15,16]. Nowadays, a potato genetic identification (PGI) kit is also available, which contains 24 highly polymorphic SSR markers [17,18]. The SSR markers from this kit and from some other studies were extensively used to study the genetic diversity in different potato populations [15,16,19,20,21,22]. The aim of the present study was to evaluate the allelic variations in a highly diverse potato germplasm consisting of 353 potato accessions by 25 SSR markers to study the molecular diversity and to generate an SSR allelic dataset for potato breeding. Markers for LBR were also identified through GLM and MLM.

2. Materials and Methods

2.1. Plant Material

A diversity panel of 353 tetraploid potato accessions originating from different countries was used in this study. All the accessions used in this study are maintained at the National Active Germplasm Site (NAGS) for potato, Central Potato Research Institute (ICAR-CPRI), Shimla, India. Detailed information about the potato accessions used in this study has been provided in the Supplementary Table S1.

2.2. Evaluation of Resistance to Late Blight

These accessions were grown in the experimental fields of CPRI, Regional Station (CPRI-RS), Kufri, India. The accessions were raised in an augmented randomized complete block design (ARCBD) under non-nutrient limiting and uniform agronomic conditions. Kufri Jyoti was used as a susceptible control, while Kufri Girdhari was used as a resistant control. During the crop season, the temperature ranged from 11.77 to 26.53 °C and humidity from 43.48 to 91.97% (Figure 1). The weather conditions were recorded by the meteorological department ICAR-CPRI, Shimla. The late blight infection by Phytophthora infestans was natural. The disease progression was observed three times, that is, after the first appearance of disease symptoms in susceptible control, followed by two more consecutive readings after 10 days of interval using the percentage of direct visual estimation (PDVE) [23]. The area under the disease progress curve (AUDPC) was measured from the PDVE values [24].

2.3. Genomic DNA Extraction

The fresh disease-free leaves from each accession were collected and immediately dipped in liquid nitrogen and were stored at −80 °C for DNA isolation. DNA was isolated from the plant leaves using the DNeasy® Plant Mini Kit (Qiagen, Hilden, Germany) according to the instruction manual. The quality and quantity of isolated DNA were determined by agarose gel electrophoresis and spectrophotometer (NanoDrop, Thermo Scientific, Waltham, MA, USA), respectively. All the DNA samples were diluted to 50 ng/µL concentration using nuclease-free water prior to SSR fingerprinting.

2.4. SSR Fingerprinting

In this study, 25 SSR markers previously identified as being highly polymorphic in potato were used for the polymerase chain reaction (PCR) amplification (Table 1). The PCR reactions were performed in 12 µL volumes with DNA (100 ng) using 1× AmpliTaq Gold 360 master mix (Applied Biosystems, Foster City, CA, USA) and 0.5 µM of each primer (forward and reverse). The amplification cycles were performed on a Veriti 96-well Fast Thermal cycler (Applied Biosystems, Foster City, CA, USA) as follows: one cycle at 94 °C for 5 min followed by 35 cycles at 94 °C for 45 s, annealing at 51–60 °C for 45 s, 72 °C for 1 min, and final extension at 72 °C for 8 min.

2.5. Data Analysis

The amplified SSR fragments were analysed with a 500 bp GeneScan 500 ROX standard on 3500 Genetic Analyzer (Applied Biosystems, Foster City, California, United States) using Gene Mapper® v4.1. The peak sizes were recorded and a binary data (0/1) matrix of 353 accessions was formed using 25 SSR markers based on the presence and absence of alleles. The number of alleles and the polymorphic information content (PIC) was calculated using the formula PIC = 1 Σ (P2i), where Pi is the frequency of the ith allele of a marker detected in accessions [25]. The same data matrix was used to calculate a ‘dissimilarity index’ using the Dice coefficient [26]. Factorial analysis was performed using this dissimilarity index and a genetic-diversity-based dendrogram was formed using the Neighbor Joining (NJ) method in Darwin 6.0.21. The population genetic structure was studied using Structure 2.3.4, a Bayesian-method-based interactive software [27]. To determine the number of subpopulations, the hypothetical number of subpopulations (K = 1 to 10) was run at three independent replicates at Burn-in period lengths of 10,000 and 100,000 Markov Chain Monte Carlo (MCMC). The ideal value of ΔK for this study was calculated using Evanno’s method in Structure Harvester [28,29].

2.6. Association Mapping

The mean area under the disease progress curve (AUDPC) for late blight resistance (LBR) of the whole diversity panel (353 accessions) was calculated according to [30] to perform the SSR-based association mapping. The association between the phenotypic and markers was analysed using general linear model (GLM, Q) and mixed linear model (MLM, Q + K) by using the software TASSEL 5.2.83. In MLM, the association between genotypic and phenotypic data was investigated with Q-matrix from the structure analysis as a fixed covariate and kinship (K) as a random effect. The markers with a p-value < 0.01 were considered to be significantly associated with LBR in potato.

3. Results

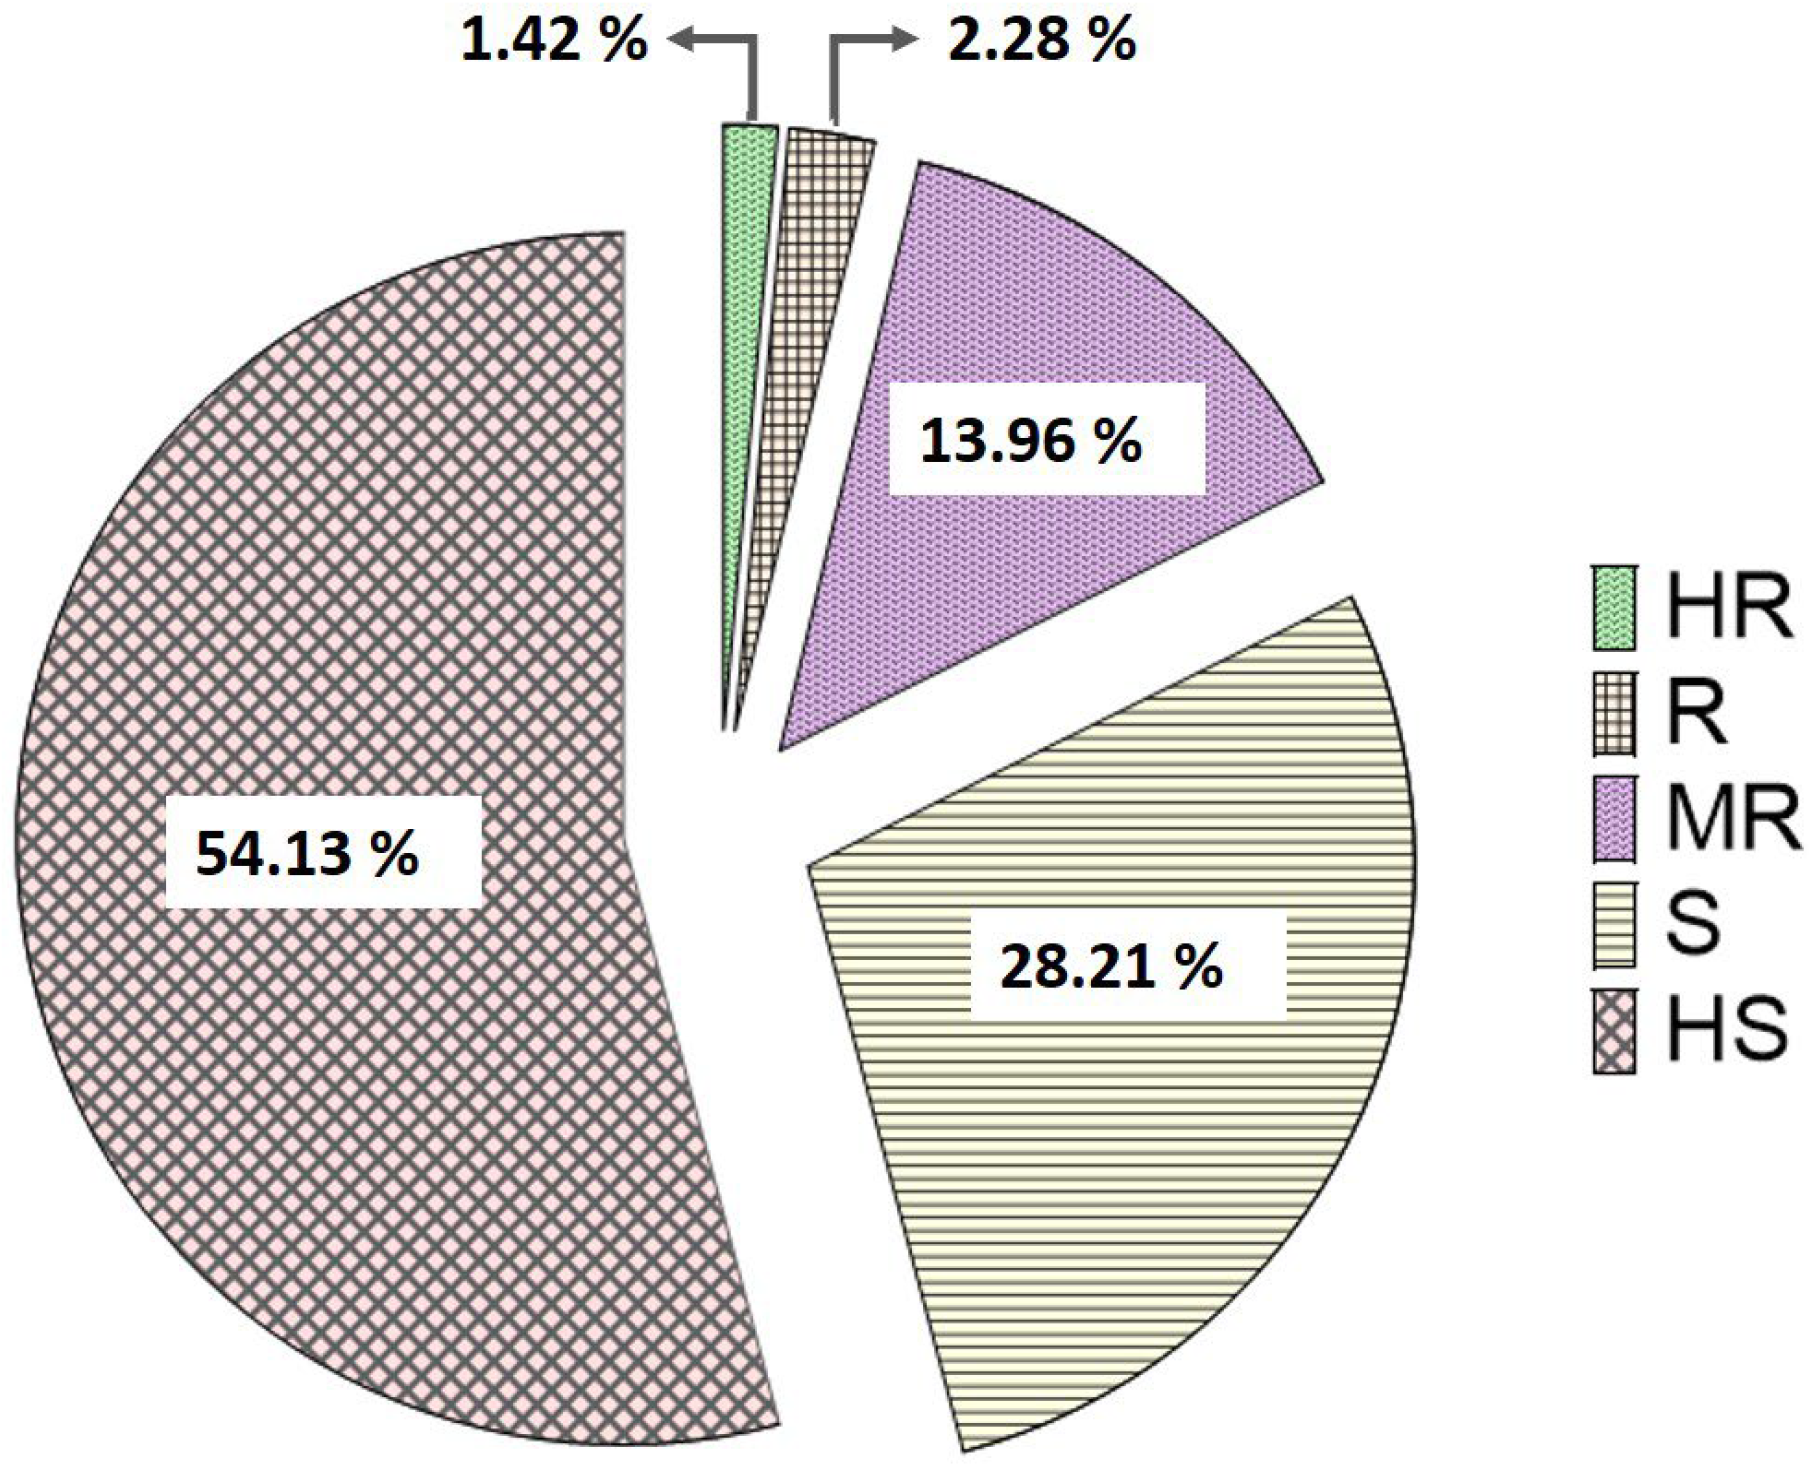
3.1. Assessment of Potato Late Blight

A diversity panel of 353 tetraploid potato accessions comprising 256 from the germplasm Solanum tuberosum ssp. tuberosum, 49 from the germplasm Solanum tuberosum ssp. Tuberosum, and 48 cultivated Indian potato varieties were screened against P. infestans. A wide range of variations were observed for late blight resistance. No disease symptoms were recorded during the 1st observation, whereas clear disease symptoms were recorded during the 2nd and 3rd observation (Figure 2).
The resistance against late blight was broadly grouped into five categories: (1) highly resistant (AUDPC, 0–50), (2) resistant (AUDPC, 51–200), (3) moderately resistant (AUDPC, 201–400), (4) susceptible (AUDPC. 401–600), and (5) highly susceptible (AUDPC, >600). LBR readings of two accessions (CP 2314 and CP 3207) were not included in this study because of their stunted growth. More than 50% of the accessions were found to be highly susceptible and 28% accessions were susceptible to late blight. Five accessions were highly resistant, eight were resistant, and forty-nine accessions showed moderate resistance to late blight (Figure 3).

3.2. SSR Fingerprinting/Allelic Diversity

The SSR Profiling of 353 highly diverse potato accessions exhibited polymorphism using 25 SSR markers. The allele size varied from 66 bp in STM0037 to 300 bp in STM5114. The number of alleles per marker varied from 8 (STM1053) to 25 (STIKA). The polymorphic information content (PIC) of 25 markers ranged from 0.67 (STG0010) to 0.93 (STM1106) with an average of 0.82 per SSR marker. The detailed information on SSR polymorphism observed in this study is presented in Table 2. In total, 343 SSR alleles were amplified 42,817 times in 353 tetraploid potato accessions using 25 SSR markers. The SSR allele of 168 bp of marker STM1104 was amplified in 330 accessions, while an allele of 205 bp of marker STG0025 was amplified only in 7 accessions.

3.3. Population Structure

Structure analysis was executed to examine the amount and distribution of genetic variations in a diversity panel of 353 tetraploid potato accessions. The structure is a powerful program for analysing the genetic makeup of diverse populations and determining the origins of individuals in mixed populations. The structure analysis estimated that the ideal number of subpopulations that best explained the structure of this diversity panel were four using Evanno’s method. This is indicated by a peak at ΔK = 4 (Figure 4).
Subpopulation 1 (pop-1, red) and subpopulation 4 (pop-4, yellow) comprise all the potato accessions from the germplasm Solanum tuberosum ssp. tuberosum. These two subpopulations revealed the presence of significant admixture in them. Subpopulation 2 (pop-2, green) represents 48 cultivated Indian potato varieties with a little admixture. Subpopulation 3 (pop-3, blue) comprises 48 accessions from the germplasm Solanum tuberosum ssp. andigena (Figure 5).
The mean fixation index (Fst) values for pop-1, pop-2, pop-3, and pop-4 were 0.142, 0.232, 0.282, 0.142, respectively with a mean alpha value of 0.047. A higher fixation index means the presence of high genetic diversity. The allele frequency divergence among the subpopulations is provided in Table 3. The average distances (expected heterozygosity) between the individuals of the same subpopulation ranged from 0.295 in pop-2 to 0.323 in pop-1. Variability for LBR within different populations is presented in Figure 6.

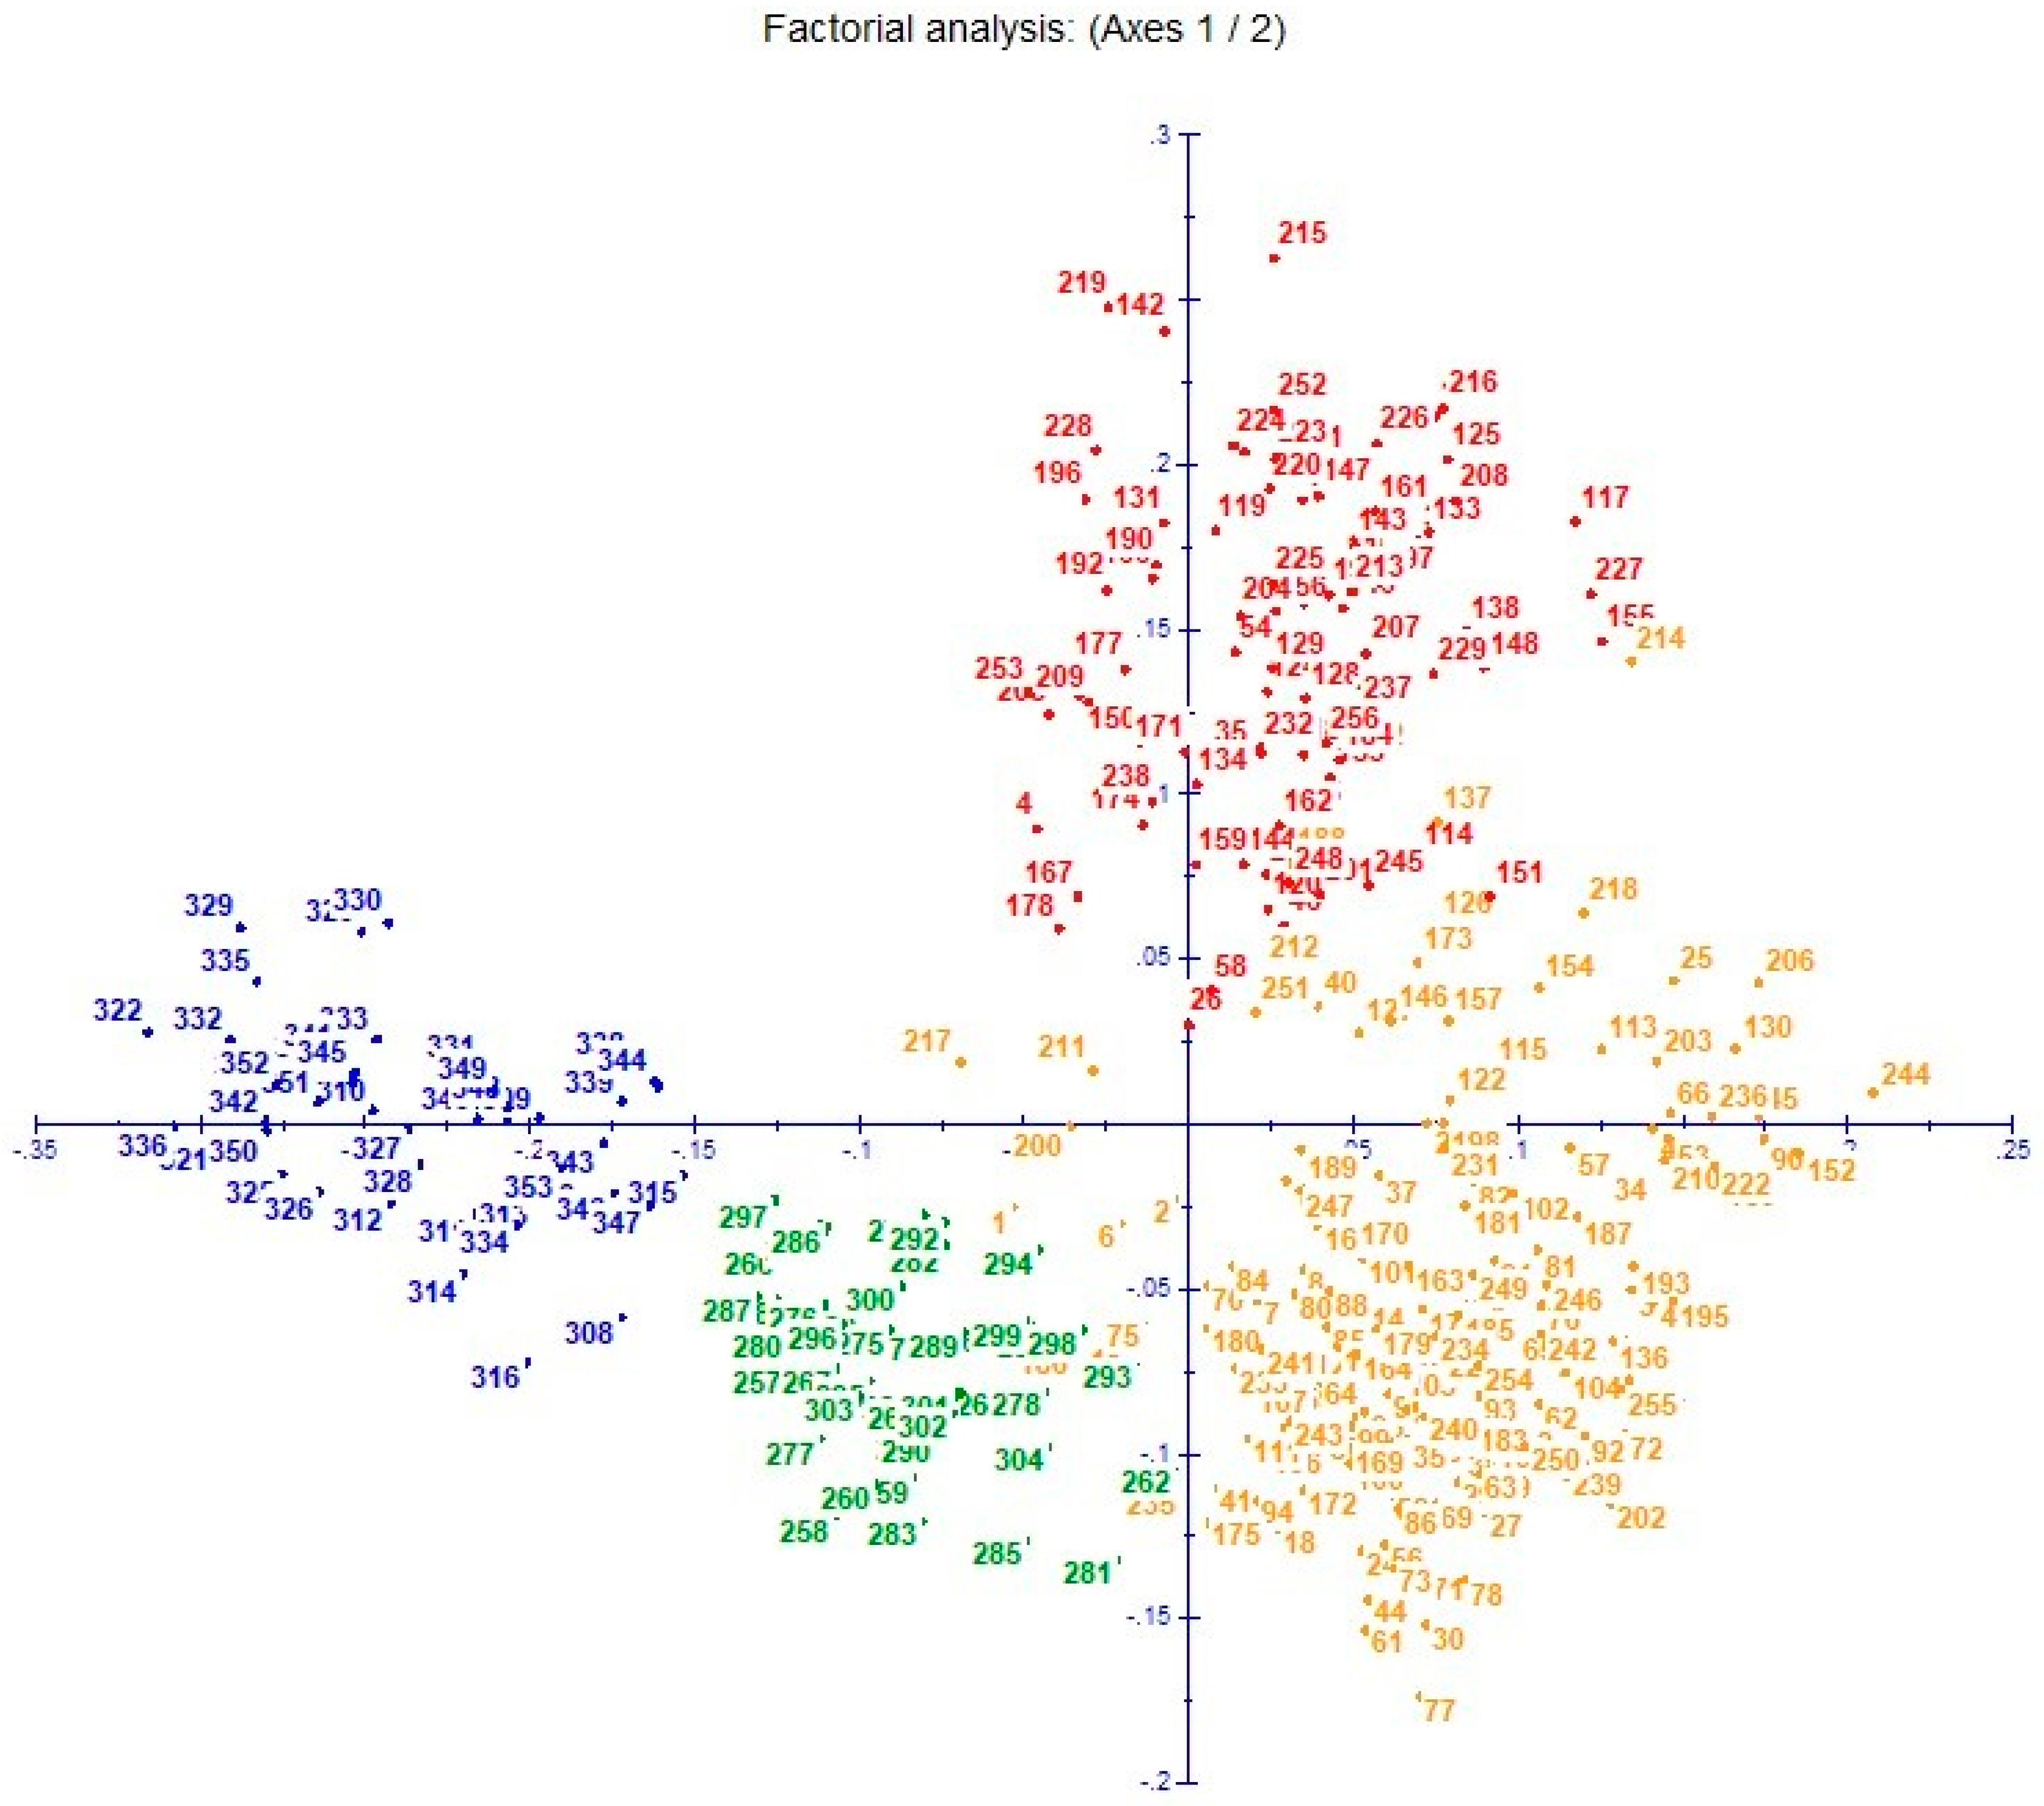
3.4. Cluster Analysis

Cluster analysis based on the Dice coefficient using the weighted neighbour-joining method revealed five distinct clusters based on the allelic profiles (Figure 7).
The majority of accessions were grouped into the respected populations. All the cultivated potato species were grouped in cluster IV and all potato accessions belonging to Solanum tuberosum ssp. Andigena were grouped in cluster V. According to the population structure, 256 potato accessions belonging to Solanum tuberosum ssp. tuberosum can be divided into two subpopulations. In the cluster analysis, pop-4 can be grouped into two different clusters (I & II), while pop-2 is represented by a separate cluster IV. The admixture of pop-3 and pop-4 lies in cluster I, whereas the admixture of pop-4 and pop-2 lies in cluster II. The potato accessions CP 2011, CP 3207, and CP 3334 showed an admixture of pop-1 and pop-4. These three accessions formed a sub-cluster in cluster II. The principal coordinate analysis (PCoA) also showed that cultivated potato varieties and potato accessions belonging to Solanum tuberosum ssp. andigena were grouped in two different clusters. The 256 potato accessions belonging to Solanum tuberosum ssp. tuberosum can be divided into two different clusters (Figure 8).

3.5. Association Analysis

Association mapping was performed to find the SSR alleles significantly linked to LBR. In total, six marker alleles were found to be associated using GLM model and three by using the MLM with p-value < 0.01 (Table 4). The markers STM5127_254, STM0019a,b_103, and STM5121_278 were significantly linked to LBR with both the models. The cumulative percentage of total phenotypic variance explained by six and three markers identified through GLM and MLM were 16.55% and 8.56%, respectively. These markers were found on chromosomes 1, 5, 6, 7, and 12.

4. Discussion

To generate an SSR dataset and examine the allelic differences in a diversity panel of 353 tetraploid potato accessions, 25 previously known SSR markers were used. In total, 343 SSR alleles of 25 SSR markers with 42,817 absolute allele frequencies were recorded in this study. The PIC is considered a critical parameter to assess the fitness of SSR makers, indicating the extent of polymorphism that a marker can produce. Similar to the previous studies, high PIC ranging from 0.67 to 0.93 was observed with an overall average of 0.82 per marker (Table 1). Out of 25 SSRs, 11 showed high polymorphism (PIC > 0.85). The maximum number of alleles in this panel were observed for STIKA (25), followed by STI003 (20), STM0019a,b (17), STI004 (16), STU6SNRN (15), and so on. Both the allele number and PIC showed the presence of high genetic diversity within the panel studied. The higher genetic diversity in the diversity panel suggests larger gene content. Previous studies conducted to evaluate genetic diversity in the potato germplasm using SSR markers also showed the existence of high allelic diversity.
The allelic variations detected in terms of number, size, and absolute frequencies might differ slightly from earlier studies. This may be due to the different instruments, software, and genotypes used for SSR analysis. We used 3500 Genetic Analyzer, ABI in this study, which is considered highly accurate for SSR analysis in potato [14]. Song et al. [20] used 55 SSR markers on 39 diploid potato genotypes to study the genetic diversity and reported PIC values ranging from 0.39 to 0.84 with a mean of 0.75. Tillault and Yevtushenko [16] analysed the genetic diversity of 20 newly released Canadian potato varieties using 10 SSR markers. They reported a lower PIC value compared to the current findings. A similar range of PIC values (0.66 to 0.91) has been reported by Tiwari et al. [22] in the wild potato species with 14 SSRs in a population of 82 potato accessions. The SSRs are useful to differentiate the closely related taxa of potato [31]. Tiwari et al. [14] reported STIKA and STU6SNRN as the most potential SSRs for varietal identification in potato. We also observed high number of alleles for both STIKA and STU6SNRN. SSR markers have proved their ability to discriminate closely related potato genotypes due to the high degree of polymorphism and heterozygosity [32,33]. SSRs also allow the labelling and management of diverse potato accessions in germplasm banks based on genetic variations [16,33].
The findings of this study suggest that SSR markers are efficient to examine the genetic diversity in the potato diversity panel. These findings are in agreement with the results of previous studies conducted to evaluate the genetic diversity in different potato germplasms [15,16,19,20,21,22]. The SSR markers, due to their desirable characteristics, such as their simplicity, abundance, codominant nature, extensive coverage on the genome, high reproducibility, and polymorphism, are considered as ideal molecular markers for diversity analysis, varietal identification, phylogenetic studies, and germplasm characterization and conservation [14,34,35]. Due to the presence of high morphological and geological diversity in the panel used, the genotypic data generated in this study could be useful to study the other economically important traits.
Moreover, late blight of potato is the most destructive disease which can be efficiently controlled by opting for late-blight-resistant varieties. LBR is a quantitative trait, which is controlled by multiple genes. The identification and introgression of late-blight-resistant genes from the vast potato germplasm is a promising approach to developing resistant cultivars [6]. Over the years, various R genes originating from wild Solanum species have been identified in potato germplasm. For example, the Rpi-blb1 (RB)a gene was identified from S. bulbocastanum, Rpi-chc1 from S. chacoense, R1, R2, R3 from S. demissum, and Rpi-avl1 from S. avilesii [6]. Over time, MAS breeding has gained breeders’ interest over conventional breeding, as it is comparatively more effective and reduces the breeding cycles. However, as the number of genes/markers/QTLs responsible for LBR are limited, this hampers the progress through MAS breeding in potato. To meet the increasing demand for potatoes, the generation of new late-blight-resistant varieties is one of the major goals of potato breeders. The discovery of new resistance genes/markers/QTLs can catalyse MAS breeding programs. Recently, several new putative candidate genes responsible for LBR have been identified [9,36]. In the present study, six MTAs associated with LBR have been identified with a large cumulative phenotypic variance (16.55%). The transfer of all these MTAs along with previously known R genes into a single potato cultivar can enhance the late blight resistance significantly. However, the effect of these genes/markers on LBR may vary in the diverse potato germplasm collections, depending upon the presence of susceptibility genes, other resistant genes, and genotype x environment interactions.

5. Conclusions

There are many potato clones which cannot be differentiated on the basis of geography, morphology, and ploidy [18,37]. These can be differentiated using SSR markers. This study also confirmed that SSRs are easy to use, highly polymorphic, and highly reproducible. The SSR markers have high utility in variety identification, testing of true-to-type genotypes and diversity analysis. The highest number of alleles were observed for STIKA, which indicates it as the most effective marker for varietal testing. However, it is recommended to run other SSRs along with it for the same reason. Further, these are important for registering a clone as a new variety. The potato diversity panel used in the study has considerable genetic variations for LBR. The SSR dataset generated in this study enables the effective management of the potato germplasm and sections of genotypes with distinct genetic makeup for diversifying potato breeding programs. Six markers were found to be associated with LBR. Further, the markers associated with LBR with high phenotypic variation found in this study will be useful for MAS breeding in potato.

Supplementary Materials

The following supporting information can be downloaded at: https://www.mdpi.com/article/10.3390/agronomy13020294/s1, Supplementary material is provided in the form of Table S1; Details of the tetraploid potato accessions used in this study.

Author Contributions

Conceptualisation, V.B. and S.S. (Sanjeev Sharma); data curation, V.B. and B.S.; formal analysis, V.B. and B.S.; investigation, A.K., B.S. and P.; methodology, S.S. (Sanjeev Sharma) and D.D.; resources, V.B., V.K. and D.K.; supervision, V.B., S.S. (Salej Sood) and V.K.; visualisation, S.S. (Salej Sood); writing—original draft, B.S.; writing—review and editing, V.B., S.S. (Salej Sood), B.D., R.S., S.S. (Sundaresha Siddappa), A.K.T., A.K.S. and M.L. All authors have read and agreed to the published version of the manuscript.

Funding

This research received no external funding.

Data Availability Statement

Not applicable.

Conflicts of Interest

The authors declare no conflict of interest.

References

  1. Singh, B.; Goutam, U.; Kukreja, S.; Sharma, J.; Sood, S.; Bhardwaj, V. Potato biofortification: An effective way to fight global hidden hunger. Physiol. Mol. Biol. Plants 2021, 27, 2297–2313. [Google Scholar] [CrossRef] [PubMed]
  2. Singh, B.; Kukreja, S.; Goutam, U. Impact of heat stress on potato (Solanum tuberosum L.): Present scenario and future opportunities. J. Hortic. Sci. Biotechnol. 2020, 95, 407–424. [Google Scholar] [CrossRef]
  3. Bradshaw, J.E. A brief history of the impact of potato genetics on the breeding of tetraploid potato cultivars for tuber propagation. Potato Res. 2022, 65, 461–501. [Google Scholar] [CrossRef]
  4. Ruiz de Arcaute, R.; Carrasco, A.; Ortega, F.; Rodriguez-Quijano, M.; Carrillo, J.M. Evaluation of genetic resources in a potato breeding program for chip quality. Agronomy 2022, 12, 1142. [Google Scholar] [CrossRef]
  5. Haverkort, A.J.; Boonekamp, P.M.; Hutten, R.; Jacobsen, E.; Lotz, L.A.P.; Kessel, G.J.T.; Vossen, J.H.; Visser, R.G.F. Durable late blight resistance in potato through dynamic varieties obtained by cisgenesis: Scientific and societal advances in the DuRPh Project. Potato Res. 2016, 59, 35–66. [Google Scholar] [CrossRef] [Green Version]
  6. Paluchowska, P.; Sliwka, J.; Yin, Z. Late blight resistance genes in potato breeding. Planta 2022, 255, 127. [Google Scholar] [CrossRef]
  7. Curran, D.; Froling, M. Large-scale mortality shocks and the Great Irish Famine 1845–1852. Econ. Model. 2010, 27, 1302–1314. [Google Scholar] [CrossRef]
  8. Álvarez, M.F.; Angarita, M.; Delgado, M.C.; García, C.; Jiménez-Gomez, J.; Gebhardt, C.; Mosquera, T. Identification of novel associations of candidate genes with resistance to late blight in Solanum tuberosum group Phureja. Front. Plant Sci. 2017, 8, 1040. [Google Scholar] [CrossRef] [Green Version]
  9. Wang, F.; Zou, M.; Zhao, L.; Xia, Z.; Wang, J. Genome-Wide association mapping of late blight tolerance trait in potato (Solanum tuberosum L.). Front. Genet. 2021, 12, 1720. [Google Scholar] [CrossRef]
  10. van Eck, H.J. Genetics of morphological and tuber traits. In Potato Biology and Biotechnology; Elsevier Science BV: Amsterdam, The Netherlands, 2007; pp. 91–115. [Google Scholar] [CrossRef]
  11. Govindaraj, M.; Vetriventhan, M.; Srinivasan, M. Importance of genetic diversity assessment in crop plants and its recent advances: An overview of its analytical perspectives. Genet. Res. Int. 2015, 2015, 431487. [Google Scholar] [CrossRef] [Green Version]
  12. Moisan-Thiery, M.; Marhadour, S.; Kerlan, M.C.; Dessenne, N.; Perramant, M.; Gokelaere, T.; Le Hingrat, Y. Potato cultivar identification using simple sequence repeats markers (SSR). Potato Res. 2005, 48, 191–200. [Google Scholar] [CrossRef]
  13. Duan, S.; Liu, B.; Zhang, Y.; Li, G.; Guo, X. Genome-wide identification and abiotic stress-responsive pattern of heat shock transcription factor family in Triticum aestivum L. BMC Genom. 2019, 20, 257. [Google Scholar] [CrossRef] [Green Version]
  14. Tiwari, J.K.; Ali, N.; Devi, S.; Kumar, V.; Zinta, R.; Chakrabarti, S.K. Development of microsatellite markers set for identification of indian potato varieties. Sci. Hortic. 2018, 231, 22–30. [Google Scholar] [CrossRef]
  15. Salimi, H.; Bahar, M.; Mirloh, A.; Talebi, M. Assessment of the genetic diversity among potato cultivars from different geographical areas using the genomic and EST microsatellites. Iran. J. Biotechnol. 2016, 14, 270. [Google Scholar] [CrossRef] [Green Version]
  16. Tillault, A.S.; Yevtushenko, D.P. Simple sequence repeat analysis of new potato varieties developed in Alberta, Canada. Plant Direct 2019, 3, e00140. [Google Scholar] [CrossRef] [Green Version]
  17. Ghislain, M.; Spooner, D.M.; Rodríguez, F.; Villamón, F.; Núñez, J.; Vásquez, C.; Waugh, R.; Bonierbale, M. Selection of highly informative and user-friendly microsatellites (SSRs) for genotyping of cultivated potato. Theor. Appl. Genet. 2004, 108, 881–890. [Google Scholar] [CrossRef]
  18. Ghislain, M.; Núñez, J.; Del Rosario Herrera, M.; Pignataro, J.; Guzman, F.; Bonierbale, M.; Spooner, D.M. Robust and highly informative microsatellite-based genetic identity kit for potato. Mol. Breed. 2009, 23, 377–388. [Google Scholar] [CrossRef] [Green Version]
  19. Liao, H.; Guo, H. Using SSR to evaluate the genetic diversity of potato cultivars from Yunnan province (SW China). Acta Biol. Crac. Ser. Bot. 2014, 56, 16–27. [Google Scholar] [CrossRef]
  20. Song, X.; Zhang, C.; Li, Y.; Feng, S.; Yang, Q.; Huang, S. SSR analysis of genetic diversity among 192 diploid potato cultivars. Hortic. Plant J. 2016, 2, 163–171. [Google Scholar] [CrossRef]
  21. Bali, S.; Patel, G.; Novy, R.; Vining, K.; Brown, C.; Holm, D.; Porter, G.; Endelman, J.; Thompson, A.; Sathuvalli, V. Evaluation of genetic diversity among russet potato clones and varieties from breeding programs across the United States. PLoS ONE 2018, 13, e0201415. [Google Scholar] [CrossRef]
  22. Tiwari, J.K.; Ali, N.; Devi, S.; Zinta, R.; Kumar, V.; Chakrabarti, S.K. Analysis of allelic variation in wild potato (Solanum) species by simple sequence repeat (SSR) markers. 3 Biotech 2019, 9, 262. [Google Scholar] [CrossRef] [PubMed]
  23. Yuen, J.E.; Forbes, G.A. Estimating the level of susceptibility to Phytophthora infestans in potato genotypes. Phytopathology 2009, 99, 782–786. [Google Scholar] [CrossRef] [PubMed] [Green Version]
  24. Campbell, C.L.; Madden, L.V. Introduction to Plant Disease Epidemiology; John Wiley & Sons: New York, NY, USA, 1990. [Google Scholar]
  25. Nei, M. Analysis of gene diversity in subdivided populations. Proc. Natl. Acad. Sci. USA 1973, 70, 3321–3323. [Google Scholar] [CrossRef] [PubMed] [Green Version]
  26. Dice, L.D. Measures of the amount of ecologic association between species. Ecology 1945, 26, 297–302. [Google Scholar] [CrossRef]
  27. Pritchard, J.K.; Stephens, M.; Donnelly, P. Inference of population structure using multilocus genotype data. Genetics 2000, 155, 945–959. [Google Scholar] [CrossRef]
  28. Evanno, G.; Regnaut, S.; Goudet, J. Detecting the number of clusters of individuals using the software STRUCTURE: A simulation study. Mol. Ecol. 2005, 14, 2611–2620. [Google Scholar] [CrossRef] [Green Version]
  29. Earl, D.A.; vonHoldt, B.M. STRUCTURE HARVESTER: A website and program for visualizing STRUCTURE output and implementing the evanno method. Conserv. Genet. Resour. 2011, 4, 359–361. [Google Scholar] [CrossRef]
  30. Forbes, G.; Pérez, W.; Piedra, J.A. Field Assessment of Resistance in Potato to Phytophthora Infestans: International Cooperators Guide; International Potato Center: Lima, Peru, 2014. [Google Scholar]
  31. Raker, C.M.; Spooner, D.M. Chilean tetraploid cultivated potato, Solanum tuberosum, is distinct from the Andean populations. Crop Sci. 2002, 42, 1451–1458. [Google Scholar] [CrossRef] [Green Version]
  32. Powell, W.; Morgante, M.; Andre, C.; Hanafey, M.; Vogel, J.; Tingey, S.; Rafalski, A. The comparison of RFLP, RAPD, AFLP and SSR (Microsatellite) markers for germplasm analysis. Mol. Breed. 1996, 2, 225–238. [Google Scholar] [CrossRef]
  33. Gavrilenko, T.; Antonova, O.; Ovchinnikova, A.; Novikova, L.; Krylova, E.; Mironenko, N.; Pendinen, G.; Islamshina, A.; Shvachko, N.; Kiru, S.; et al. A microsatellite and morphological assessment of the russian national cultivated potato collection. Genet. Resour. Crop Evol. 2010, 57, 1151–1164. [Google Scholar] [CrossRef]
  34. Schönhals, E.M.; Ortega, F.; Barandalla, L.; Aragones, A.; Ruiz de Galarreta, J.I.; Liao, J.C.; Sanetomo, R.; Walkemeier, B.; Tacke, E.; Ritter, E.; et al. Identification and reproducibility of diagnostic dna markers for tuber starch and yield optimization in a novel association mapping population of potato (Solanum tuberosum L.). Theor. Appl. Genet. 2016, 129, 767–785. [Google Scholar] [CrossRef] [Green Version]
  35. Tiwari, J.; Singh, B.; Gopal, J.; Poonam, P.; Patil, V.U. Molecular characterization of the Indian Andigena Potato core collection using microsatellite markers. Afr. J. Biotechnol. 2013, 12, 1025–1033. [Google Scholar]
  36. Deperi, S.I.; Tagliotti, M.E.; Bedogni, M.C.; Huarte, M.A. Association mapping to detect phytophthora infestans resistance in tetraploid potato. Crop Sci. 2022, 62, 216–234. [Google Scholar] [CrossRef]
  37. Spooner, D.M.; Núñez, J.; Trujillo, G.; Herrera, M.D.R.; Guzmán, F.; Ghislain, M. Extensive simple sequence repeat genotyping of potato landraces supports a major reevaluation of their gene pool structure and classification. Proc. Natl. Acad. Sci. USA 2007, 104, 19398–19403. [Google Scholar] [CrossRef]
Figure 1. Graphs showing the weather conditions during the crop season: (a) minimum and maximum average monthly temperature (°C); (b) minimum and maximum average monthly relative humidity (%).
Agronomy 13 00294 g001
Figure 2. Leaves of different potato accessions showing the visual symptoms of Phytophthora infestans under natural conditions: (af) showing degree of infection in increasing order from healthy to highly infected leaf.
Agronomy 13 00294 g002
Figure 3. Pie chart showing the distribution of diverse potato accessions in five different groups in relation to late blight resistance: HR, highly resistant; R, resistant; MR, moderately resistant; S, susceptible; HS, highly susceptible.
Agronomy 13 00294 g003
Figure 4. Plot of Delta K vs. K from Structure Harvester analysis of 353 potato accessions showing that the most likely number of clusters is 4 (K = 4).
Agronomy 13 00294 g004
Figure 5. Structure analysis showing four distinct subpopulations in a diversity panel of 353 potato accessions. The numbers below the bars (1–353) are same as the serial numbers provided to different accessions in the Supplementary File.
Agronomy 13 00294 g005
Figure 6. Boxplots representing variations for late blight resistance in four subpopulations generated from the diversity panel of 353 potato accessions through structure software based on the 25 SSR markers: (a) Pop-1; (b) Pop-2; (c) Pop-3; (d) Pop-4.
Agronomy 13 00294 g006
Figure 7. Diversity analysis of 353 tetraploid potato accessions using 25 SSR markers based on the Dice coefficient using the weighted neighbour-joining tree construction method. Different colours represent different subpopulations in the diversity panel.
Agronomy 13 00294 g007
Figure 8. Principal coordinate analysis showing the distribution of 353 potato accessions used in this study. Different colours represent different subpopulations within the diversity panel.
Agronomy 13 00294 g008
Table 1. Molecular profiling of 353 highly diverse potato accessions by 25 SSR markers.
Sr. NoPrimerRepeat MotifTa (°C)New AllelesRangePIC
1.STG0001(CT)n5815119–1570.826
2.STG0010(TG)n5814151–1690.675
3.STG0016(AGA)n5515118–1980.877
4.STG0025(AAAC)n5615187–2050.899
5.STI001(AAT)n6011170–1980.739
6.STI003(ACC)n6020125–2220.881
7.STI004(AAG)n601670–1020.852
8.STI0012(ATT)n5612162–1890.801
9.STI0030(ATT)n581583–1310.907
10.STI0032(GGA)n6110108–1590.716
11.STI0033(AGG)n6112105–1390.829
12.STM0019a,b(AT)n (GT)n (AT)n (GT)n (GC)n (GT)n551789–2070.874
13.STM0031(AC)n…(AC)n GCAC (AC)n (GCAC)n5313162–1920.856
14.STM0037(TC)n (AC)n AA (AC)n (AT)n521466–1780.724
15.STM1052(AT)n GT (AT)n (GT)n5515207–2640.879
16.STM1053(TA)n (ATC)n538162–1900.786
17.STM1064(TA)n (TG)n GT (TG)n5212163–2100.838
18.STM1104(TCT)n5312160–1820.759
19.STM1106(ATT)n5114152–1920.932
20.STM5114(ACC)n6010280–3000.694
21.STM5121(TGT)n5010278–2910.804
22.STM5127(TCT)n5511238–2720.855
23.STPoAc58(TA)n5712226–2500.861
24.STU6SNRN(TGG)55515129–2040.763
25.STIKA(T)12(A)9ATTCTTGTT(TA)2CA(TA)75525175–2470.816
SSR markers source: Ghislain et al. [18].
Table 2. Details of SSR alleles detected in 353 potato accessions in bp with their absolute frequencies (in brackets).
MarkerAllele Size (bp) with Their Absolute Frequencies (In Brackets)
STG0001119 (149)122 (134)125 (194)126 (237)129 (122)131 (170)132 (154)134 (73)135 (132)137 (106)138 (108)139 (28)140 (136)142 (157)157 (190)
STG0010151 (57)153 (114)154 (240)156 (180)158 (149)159 (185)162 (254)163 (280)164 (313)165 (242)166 (259)167 (194)168 (51)169 (25)
STG0016118 (210)122 (142)126 (52)128 (154)131 (192)135 (226)138 (20)140 (28)148 (84)154 (182)156 (39)168 (26)180 (22)188 (26)198 (92)
STG0025 187 (36)189 (97)190 (154)193 (82)194 (84)196 (66)197 (230)198 (204)199 (31)200 (56)201 (137)202 (136)203 (16)204 (22)205 (7)
STI001170 (160)173 (103)176 (133)177 (159)180 (309)183 (155)185 (286)188 (159)191 (221)194 (72)198 (22)
STI003125 (28)130 (146)135 (45)140 (225)147 (22)150 (213)155 (137)158 (59)162 (214)165 (62)171 (229)175 (52)180 (148)183 (66)192 (96)201 (105)205 (26)207 (25)215 (40)222 (32)
STI00470 (121)72 (178)74 (216)75 (252)78 (133)80 (57)83 (27)85 (153)87 (148)89 (55)91 (42)93 (165)96 (73)98 (134)99 (133)102 (31)
STI0012162 (121)165 (238)167 (221)170 (263)173 (92)176 (18)178 (53)180 (114)183 (251)185 (42)186 (110)189 (90)
STI003083 (203)85 (128)87 (106)89 (124)91 (37)96 (244)98 (53)102 (48)104 (82)105 (106)109 (8)110 (76)113 (12)128 (32)131 (21)
STI0032108 (190)111 (116)114 (115)116 (206)117 (107)119 (224)122 (173)123 (217)126 (70)159 (328)
STI0033105 (159)108 (95)110 (302)113 (73)116 (118)119 (43)122 (126)125 (149)128 (227)131 (142)135 (23)139 (19)
STM0019a,b89 (156)91 (242)98 (92)100 (102)103 (16)110 (138)112 (153)119 (20)153 (20)163 (44)165 (19)171 (17)180 (15)190 (155)197 (100)204 (201)207 (214)
STM0031162 (159)165 (90)167 (168)168 (155)170 (22)172 (28)177 (63)179 (73)183 (126)185 (207)186 (219)187 (178)192 (28)
STM003766 (203)68 (303)70 (214)72 (110)74 (232)76 (246)79 (44)81 (97)84 (139)86 (30)90 (282)110 (180)156 (65)178 (174)
STM1052207 (171)208 (253)210 (81)217 (108)221 (26)224 (164)226 (188)227 (81)242 (9)249 (106)251 (159)253 (85)255 (26)258 (30)262 (28)
STM1053162 (64)166 (82)168 (280)169 (59)171 (309)172 (135)175 (37)190 (81)
STM1064163 (80)178 (28)180 (119)183 (32)187 (322)189 (264)191 (154)193 (107)195 (89)197 (28)201 (27)210 (50)
STM1104160 (119)164 (148)165 (257)168 (330)169 (227)171 (63)172 (178)173 (109)175 (205)177 (90)178 (36)182 (14)
STM1106152 (171)157 (166)160 (188)164 (68)165 (49)168 (87)169 (64)171 (24)173 (51)175 (36)178 (20)184 (12)189 (30)192 (51)
STM5114280 (145)283 (178)285 (274)288 (322)290 (172)291 (71)294 (196)296 (269)297 (59)300 (43)
STM5121278 (62)282 (218)283 (144)284 (60)285 (289)286 (148)287 (88)288 (216)289 (70)291 (74)
STM5127238 (255)239 (93)241 (163)242 (173)247 (92)249 (71)251 (121)254 (37)268 (114)270 (121)272 (108)
STPoAc58226 (134)230 (201)231 (185)232 (212)233 (183)235 (109)238 (39)241 (52)243 (26)245 (75)248 (111)250 (59)
STU6SNRN129 (25)134 (19)138 (18)145 (188)179 (249)181 (237)182 (145)189 (207)190 (171)197 (234)198 (217)199 (155)200 (202)201 (172)204 (13)
STIKA175 (217)184 (40)186 (77)189 (133)190 (144)192 (103)193 (176)194 (273)195 (201)196 (99)198 (145)199 (156)203 (33)211 (14)214 (248)219 (181) 222 (282)223 (94)225 (131)230 (182)
234 (39)235 (52)242 (152)245 (84)247 (25)
Table 3. Allele frequency divergence among subpopulations computed using estimates of P.
Pop-1Pop-2Pop-3Pop-4
Pop-1-0.07140.09780.0355
Pop-20.0714-0.09940.0634
Pop-30.09780.0994-0.0980
Pop-40.03550.06340.0980-
Table 4. SSR loci significantly associated with late blight resistance (LBR) identified through the general linear model (GLM) and mixed linear model (MLM).
ModelMarkerChromosome NumberMarker F-ValueMarker p-ValueMarker R2
GLMSTM5127_25417.90580.00530.0254
GLMSTG0016_18817.04070.00840.0227
GLMSTI0032_11157.18910.00770.0232
GLMSTM0019a,b_10369.63000.00210.0308
GLMSTM0031_19279.26560.00250.0297
GLMSTM5121_2781210.57430.00130.0337
MLMSTM5127_25417.86690.00540.0259
MLMSTM0019a,b_10369.48610.00230.0312
MLMSTM5121_278128.64410.00350.0285
Disclaimer/Publisher’s Note: The statements, opinions and data contained in all publications are solely those of the individual author(s) and contributor(s) and not of MDPI and/or the editor(s). MDPI and/or the editor(s) disclaim responsibility for any injury to people or property resulting from any ideas, methods, instructions or products referred to in the content.

