Article

Effects of Long-Term Exclosure on Main Plant Functional Groups and Their Biochemical Properties in a Patchily Degraded Alpine Meadow in the Source Zone of the Yellow River, West China

1
College of Agriculture and Animal Husbandry, Qinghai University, Xining 810016, China
2
State Key Laboratory of Plateau Ecology and Agriculture, Qinghai University, Xining 810016, China
*
Author to whom correspondence should be addressed.
Agronomy 2023, 13(11), 2781; https://doi.org/10.3390/agronomy13112781
Submission received: 19 September 2023 / Revised: 12 October 2023 / Accepted: 6 November 2023 / Published: 9 November 2023
(This article belongs to the Special Issue Grassland and Pasture Ecological Management and Utilization)

Abstract

:
This study aimed to understand the response of vegetation community characteristics in the degraded alpine meadow of the Source Zone of the Yellow River to exclosure of various lengths. Artificial fences were erected to prevent livestock grazing and let the degraded meadow recover naturally as a means of restoration. The research focused on a typical degraded alpine meadow in which four plots were fenced off for three periods of 1 year (E1), 4 years (E4), and 10 years (E10), plus a freely grazed plot as the control. The study compared and analyzed the differences in plant community characteristics, carbon (C), nitrogen (N), and phosphorus (P) reserves, as well as the stoichiometric characteristics of main functional groups in the alpine meadow over different exclosure durations. The results indicated that E10 long-term exclosure significantly increased the aboveground biomass of gramineous plants but reduced the aboveground biomass of miscellaneous grasses. However, when compared to E4 short-term exclosure, E10 resulted in a reduction in the aboveground biomass of Cyperaceae plants. On the other hand, E4 medium-term exclosure significantly increased the aboveground biomass of Gramineae and Cyperaceae. Exclosure significantly increased the nitrogen (N) and phosphorus (P) reserves of the aboveground plant communities. Among these communities, the plant communities in the E10 long-term exclosure had the highest N and P reserves. However, this exclosure length also led to a significant reduction in plant diversity. Furthermore, except for Cyperaceae, all functional groups were observed in E10 and E4 plots. The carbon–nitrogen ratio and carbon–phosphorus ratio of these groups were significantly lower than those of groups G and E1. Medium-term exclosure (E4) has a positive impact on the aboveground biomass as well as plants’ nitrogen and phosphorus reserves. However, long-term exclosure (E10) has been observed to decrease species diversity and nutrient utilization efficiency of alpine meadow vegetation, which can be detrimental to the sustainable development of the alpine meadow ecosystem. Therefore, it is not recommended to implement long-term exclosure. Instead, a moderate level of grazing should be adopted after 4 years of exclosure.

1. Introduction

Grassland is a predominant terrestrial ecosystem covering approximately 40% of the world’s land area [1]. It serves as a crucial resource for animal husbandry and plays a vital role in biodiversity conservation, windbreak and sand fixation, and water conservation [2]. China boasts abundant grassland resources in a vast area of 3.92 × 10⁸ ha. Notably, the grassland area in the Source Zone of the Yellow River amounts to 1.04 × 10⁷ ha, serving as a significant carbon sink and water conservation region [3]. Situated in the ecologically sensitive Qinghai–Tibet Plateau, the Source Region of the Yellow River acts as a crucial nature reserve in China [4]. It also serves as the core area for the ecological functioning and water conservation of alpine meadows in the Qinghai–Tibet Plateau, possessing substantial ecological and economic values. Furthermore, this region is globally recognized as one of the high-altitude areas with rich biodiversity, characterized by a cold climate and fragile ecology [5]. The grassland ecosystem in the Source Region of the Yellow River has been significantly disturbed by human activities. The grassland in this area has been exploited beyond its sustainable carrying capacity, leading to serious overgrazing. Consequently, serious ecological problems such as grassland degradation, wetland shrinkage, and soil erosion have emerged frequently in recent decades [6]. Large-scale degradation of grassland has resulted in frequent ecological disasters, which not only hampers the sustainable development of grassland animal husbandry but also greatly impacts the ecological security and social stability of the local area, as well as the surrounding countries or regions. Therefore, how to curb grassland degradation and effectively restore the degraded grassland, and strengthen the management and restoration of the degraded grassland, has become an urgent and challenging issue worldwide.
Ecological restoration is the process of returning degraded grassland ecosystems to a healthy and stable state [7]. It can be achieved either naturally or via human intervention. The natural restoration cycle of degraded grassland ecosystems is lengthy, often taking decades or even centuries. To expedite the restoration process, artificial measures are necessary. China, on the other hand, began its efforts to restore and explore degraded grassland relatively late [8]. Currently, the main restoration measures employed in China include fenced exclosure, no-tillage reseeding, and fertilization, all of which have significantly improved the health of degraded grassland [9]. Fenced exclosure is a method of dividing grassland into smaller areas via wire fences to prevent them from being grazed by livestock and disturbed by other animals. Exclosure ensures that the grassland inside the fenced area is free from livestock grazing, trampling, and excretion, allowing it to undergo natural succession and natural recovery [10]. Compared with other manual recovery methods, the advantages of fenced exclosure include its low cost, wide applicability, and ease of implementation [11]. Extensive research has been conducted worldwide on various effects of fenced exclosure, such as plant community diversity; aboveground and underground biomass; community structure; plant carbon, nitrogen, phosphorus, and stoichiometric characteristics; soil seed bank; soil physical and chemical properties; as well as microbial community structure and diversity [12,13,14,15,16,17,18]. The findings indicated that fencing has the potential to enhance grassland biomass, improve soil structure, and increase water use efficiency [19]. Moreover, fencing proves beneficial for the restoration of degraded grassland and supports secondary succession, leading to the gradual recovery to healthy grassland [20]. Nevertheless, it is important to note that the impact of exclosure varies across different types of grasslands due to variations in climate conditions and the duration of exclosure.
Wu et al. [21] discovered that fencing has a significant positive impact on aboveground biomass in the northwest of the Qinghai–Tibet Plateau. This improvement benefits forage functional groups and restricts the growth of harmful weed functional groups. However, it does lead to a decrease in plant density and species diversity. Similarly, Xu et al. [22] found that fencing greatly enhances the coverage, height, and aboveground and underground biomass of plant communities in degraded temperate meadow steppe in the Hulunbeier steppe of North China. Furthermore, Asteken et al. [23] observed that 10 years of exclosure positively influenced the community diversity of temperate grassland and mountain meadow vegetation. It is worth noting that previous studies have focused primarily on the positive effects of fence exclosure on grassland ecosystems, neglecting its potential negative impacts on wildlife. After analyzing 208 literature sources worldwide on fencing, Smith et al. [24] discovered that only 7% of them examined both positive and negative effects of fencing. In a separate study, Boone et al. [25] found that fencing can impede the migration routes of herbivores, diminish the diversity of forage grass, and ultimately reduce the carrying capacity of grasslands. This indicates that long-term exclosure and grazing prohibition represent an extreme grassland management approach that has both protective and negative effects on the grassland ecosystem. In spite of the large number of studies on fencing, several knowledge gaps still remain. First, it remains unknown how the biomass of plant functional groups responds to exclosure duration. Additionally, different plant functional groups respond differently to exclosure in patchily degraded grassland. So far, there is a lack of research on how exclosure length can effectively balance forage productivity and plant diversity in the restorative process of patchily degraded alpine meadows, while minimizing the negative impact of exclosure.
This study focuses on the patchily degraded alpine meadow in the Source Zone of the Yellow River in the Qinghai–Tibet Plateau. This research explores how plant biophysical properties respond to different durations of exclosure in comparison with the control. The aim of this study is to investigate the long-term effects of exclosure on the patchily degraded alpine meadow and offer insights for the long-term restoration of alpine meadow ecosystems.

2. Materials and Methods

2.1. Overview of the Study Area

The study area is located in Henan Mongolian Autonomous County, Huangnan Prefecture, Qinghai Province. It is situated on the northeastern margin of the Qingnan Plateau at an average altitude of 3600–3800 m. The region experiences a typical plateau continental climate, characterized by short springs and autumns, indistinct seasons (the four seasons are not clear), and no absolute frost-free period. From May to October each year, the weather is warm and rainy, while from November to April of the following year, it becomes cold, dry, and windy. The average annual temperature ranges from 9.2 to 14.6 °C, and the annual precipitation ranges between 597.1 and 615.5 mm. The predominant soil type in the area is subalpine meadow soil.
The grassland area in Henan County is 661,500 ha, with 645,000 ha suitable for grazing. By 2021, the county had successfully and comprehensively restored the most severely degraded (e.g., denudated) alpine meadow known as “heitutan” and implemented measures to control grassland pests such as plateau pika. The restored areas included 30,600 ha of “heitutan”, 20,000 ha sloped black soil, while 95,700 ha of grassland was treated with pest prevention and control measures, 81,300 ha fenced for long-term grazing exclosure, 46,700 ha for rotational grazing exclosure, 226,700 ha for short-term exclosure, and 27,300 ha of degraded grassland had partially recovered. Additionally, the county has established a grazing prohibited area of 435,600 ha and set 154,300 ha of grassland for balanced grazing (e.g., stocking rate does not exceed the grassland carrying capacity). However, there are still several challenges facing the subsequent utilization of the once enclosed grassland.

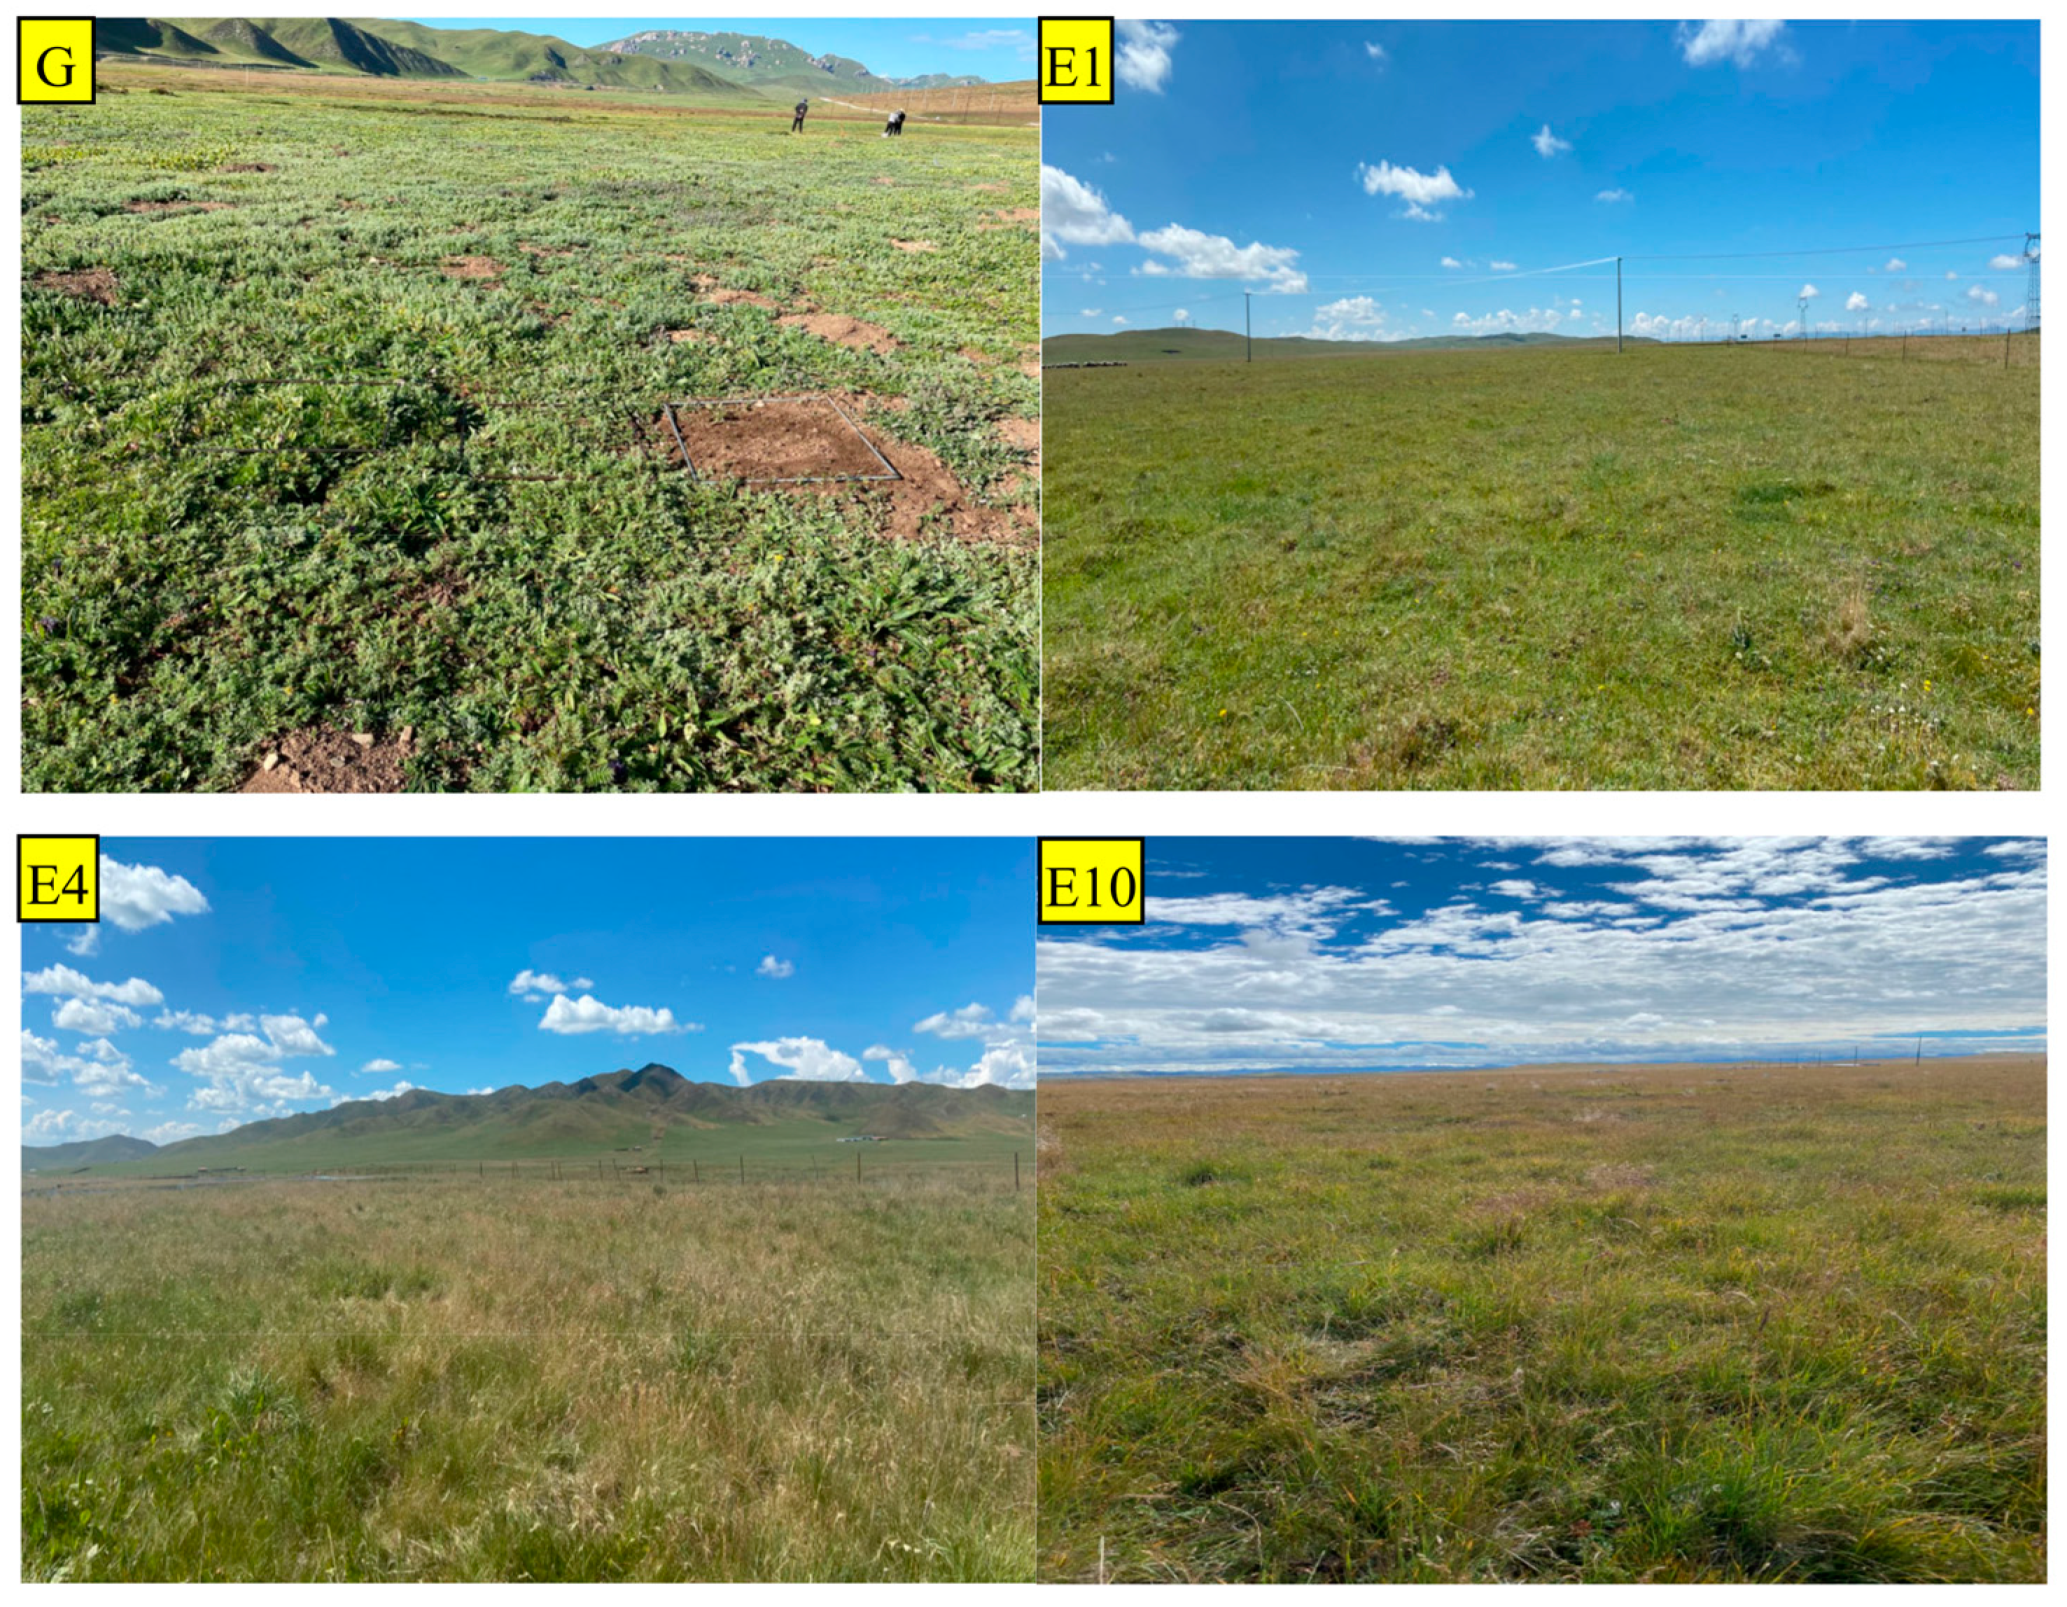
2.2. Experimental Design

In order to explore the mechanism of plant community construction in the alpine meadow under different exclosure years, and the influence of exclosure years on plant community diversity and productivity, this study adopts the philosophy of “using space as a proxy of time”. In this study, 4 experimental plots with similar topography, vegetation composition, community characteristics, and degradation degree were selected in the enclosed alpine meadow in Henan County. The plots had an area of 300 m × 250 m, totaling 7.50 ha. They were fenced off in July 2011, 2017, and 2020, respectively. By August 2021, the experimental plots had been fenced for four durations: 10 years of long-term exclosure (E10), 4 years of medium-term exclosure (E4), 1 year of short-term exclosure (E1), and free grazing (G) without fencing. The location, altitude, and main composition of plant communities in the selected plots are presented in Table 1. It should be noted that the exclosure plot in this study refers to the continuous exclosure plot that has not involved grazing since the establishment of the fence.
The table above shows the status of the plot at the time of sampling in 2021, i.e., the recovery status of the plot at the end of the experiment. Patches refer to a state in which the meadow is fragmented due to degradation. G represents free grazing (control), E1 represents exclosure for 1a, E4 represents exclosure for 4a, and E10 represents exclosure for 10a (Figure 1) (the same below).

2.3. Sample Collection and Analysis

2.3.1. Determination of Plant Community Dynamics, Population Characteristics, and Aboveground and Belowground Biomass

During the vigorous growth period of plants in August 2021, we investigated the characteristics of plant communities in the field. Six quadrants of 50 cm × 50 cm were randomly located in the plots of varying exclosure years. Within these quadrants, we surveyed plant species and total coverage, and measured height and density of various plants by functional groups. Additionally, we also sampled biomass for four types of plants (grasses, sedges, legumes, and forbs) by cutting them off the ground, and carefully packing them in plastic bags. Each bag was marked with the respective plant’s name and transported to the laboratory. In the lab, the freshly collected plants were weighted and then placed in an oven at 90 °C for 30 min to kill them. Subsequently, we dried the plants in an oven at 65 °C until a constant weight. This dry weight represented the aboveground biomass of the plants during the peak month of the growing season. Additionally, we collected cylindrical soil samples with a height of 20 cm and a diameter of 8 cm from the middle of each sampling quadrant via root drilling. These soil samples were filtered using a 2 mm sieve in the lab to find plant roots, either alive or dead. The collected roots were then dried in an oven at 65 °C until a constant weight to measure the belowground biomass [26].

2.3.2. Plant Community Structure Indices

In the field, the plant properties within the selected quadrants were surveyed at the community level and expressed in three indices: the Shannon–Wiener index, H; Simpson index (D); and Pielous index (E). They are calculated as
Shannon Wiener   diversity   index :   H = i = 1 S P i lnP i ;
Simpson   diversity   index :   D = 1 i = 1 S P i 2 ;
Pielous   evenness   index :   E = H / ln S ;
where Pi represents the ratio of the number of individuals of the i-th species to the total number of individuals in the community. It can be calculated as Pi = Ni/N, where Ni is the number of individuals of the i-th species and N is the total number of individuals of all species. S denotes the total number of species in the community. The species diversity index, H, is calculated using the Shannon–Wiener index. The maximum species diversity index, Hmax, is calculated as the natural logarithm of S, where S represents the total number of individuals of all species in the community [27].

2.3.3. Determination of Plant Carbon, Nitrogen, and Phosphorus

We determined the element content of the functional group of vegetation by separating all the aboveground parts of plants by functional group, crushing, and mixing them all with six replicates. Each composite sample represents the overall level of carbon, nitrogen, and phosphorus contents of the functional group of plants under study. Plant total carbon was determined using the potassium dichromate-H2SO4 oxidation external heating method. Total nitrogen and total phosphorus were determined using the AA3 continuous flow analyzer (Auto Analyzer 3-HR). The specific procedure was as follows: 0.2 g of plant samples were weighed and placed in a digester tube, to which 3.3 g of a catalyst (K2SO4:CuSO4 = 10:1) and 10 mL of concentrated sulfuric acid were added. The mixture was placed in a 420 °C digester for 180 min. Afterwards, the resultant solution was transferred to a 100 mL flask and the volume was adjusted to the required level. Finally, the sample determination was carried out using the continuous flow analyzer.

2.4. Data Analysis and Representation

All the obtained original data were pre-processed using Microsoft Excel 2010 (Microsoft, Washington, DC, USA), and statistically analyzed using SPSS 19.0 (IBM, New York, NY, USA). A one-way analysis of variance (p < 0.05) was used to examine the differences in plant biomass, diversity, and carbon, nitrogen, and phosphorus contents among different functional groups over different exclosure years. Histograms of plant carbon, nitrogen, and phosphorus content, and the stoichiometric ratio, were generated using Origin 2022. The correlation between plant carbon, nitrogen, and phosphorus contents and biomass was calculated and visualized using the R 4.0 (LUCENT, Murray Hill, NJ, USA). Canoco 5.0 (Microcomputer Power, Washington, DC, USA) was utilized for a redundancy analysis (RDA) and for plotting vegetation and soil characteristics.

3. Results

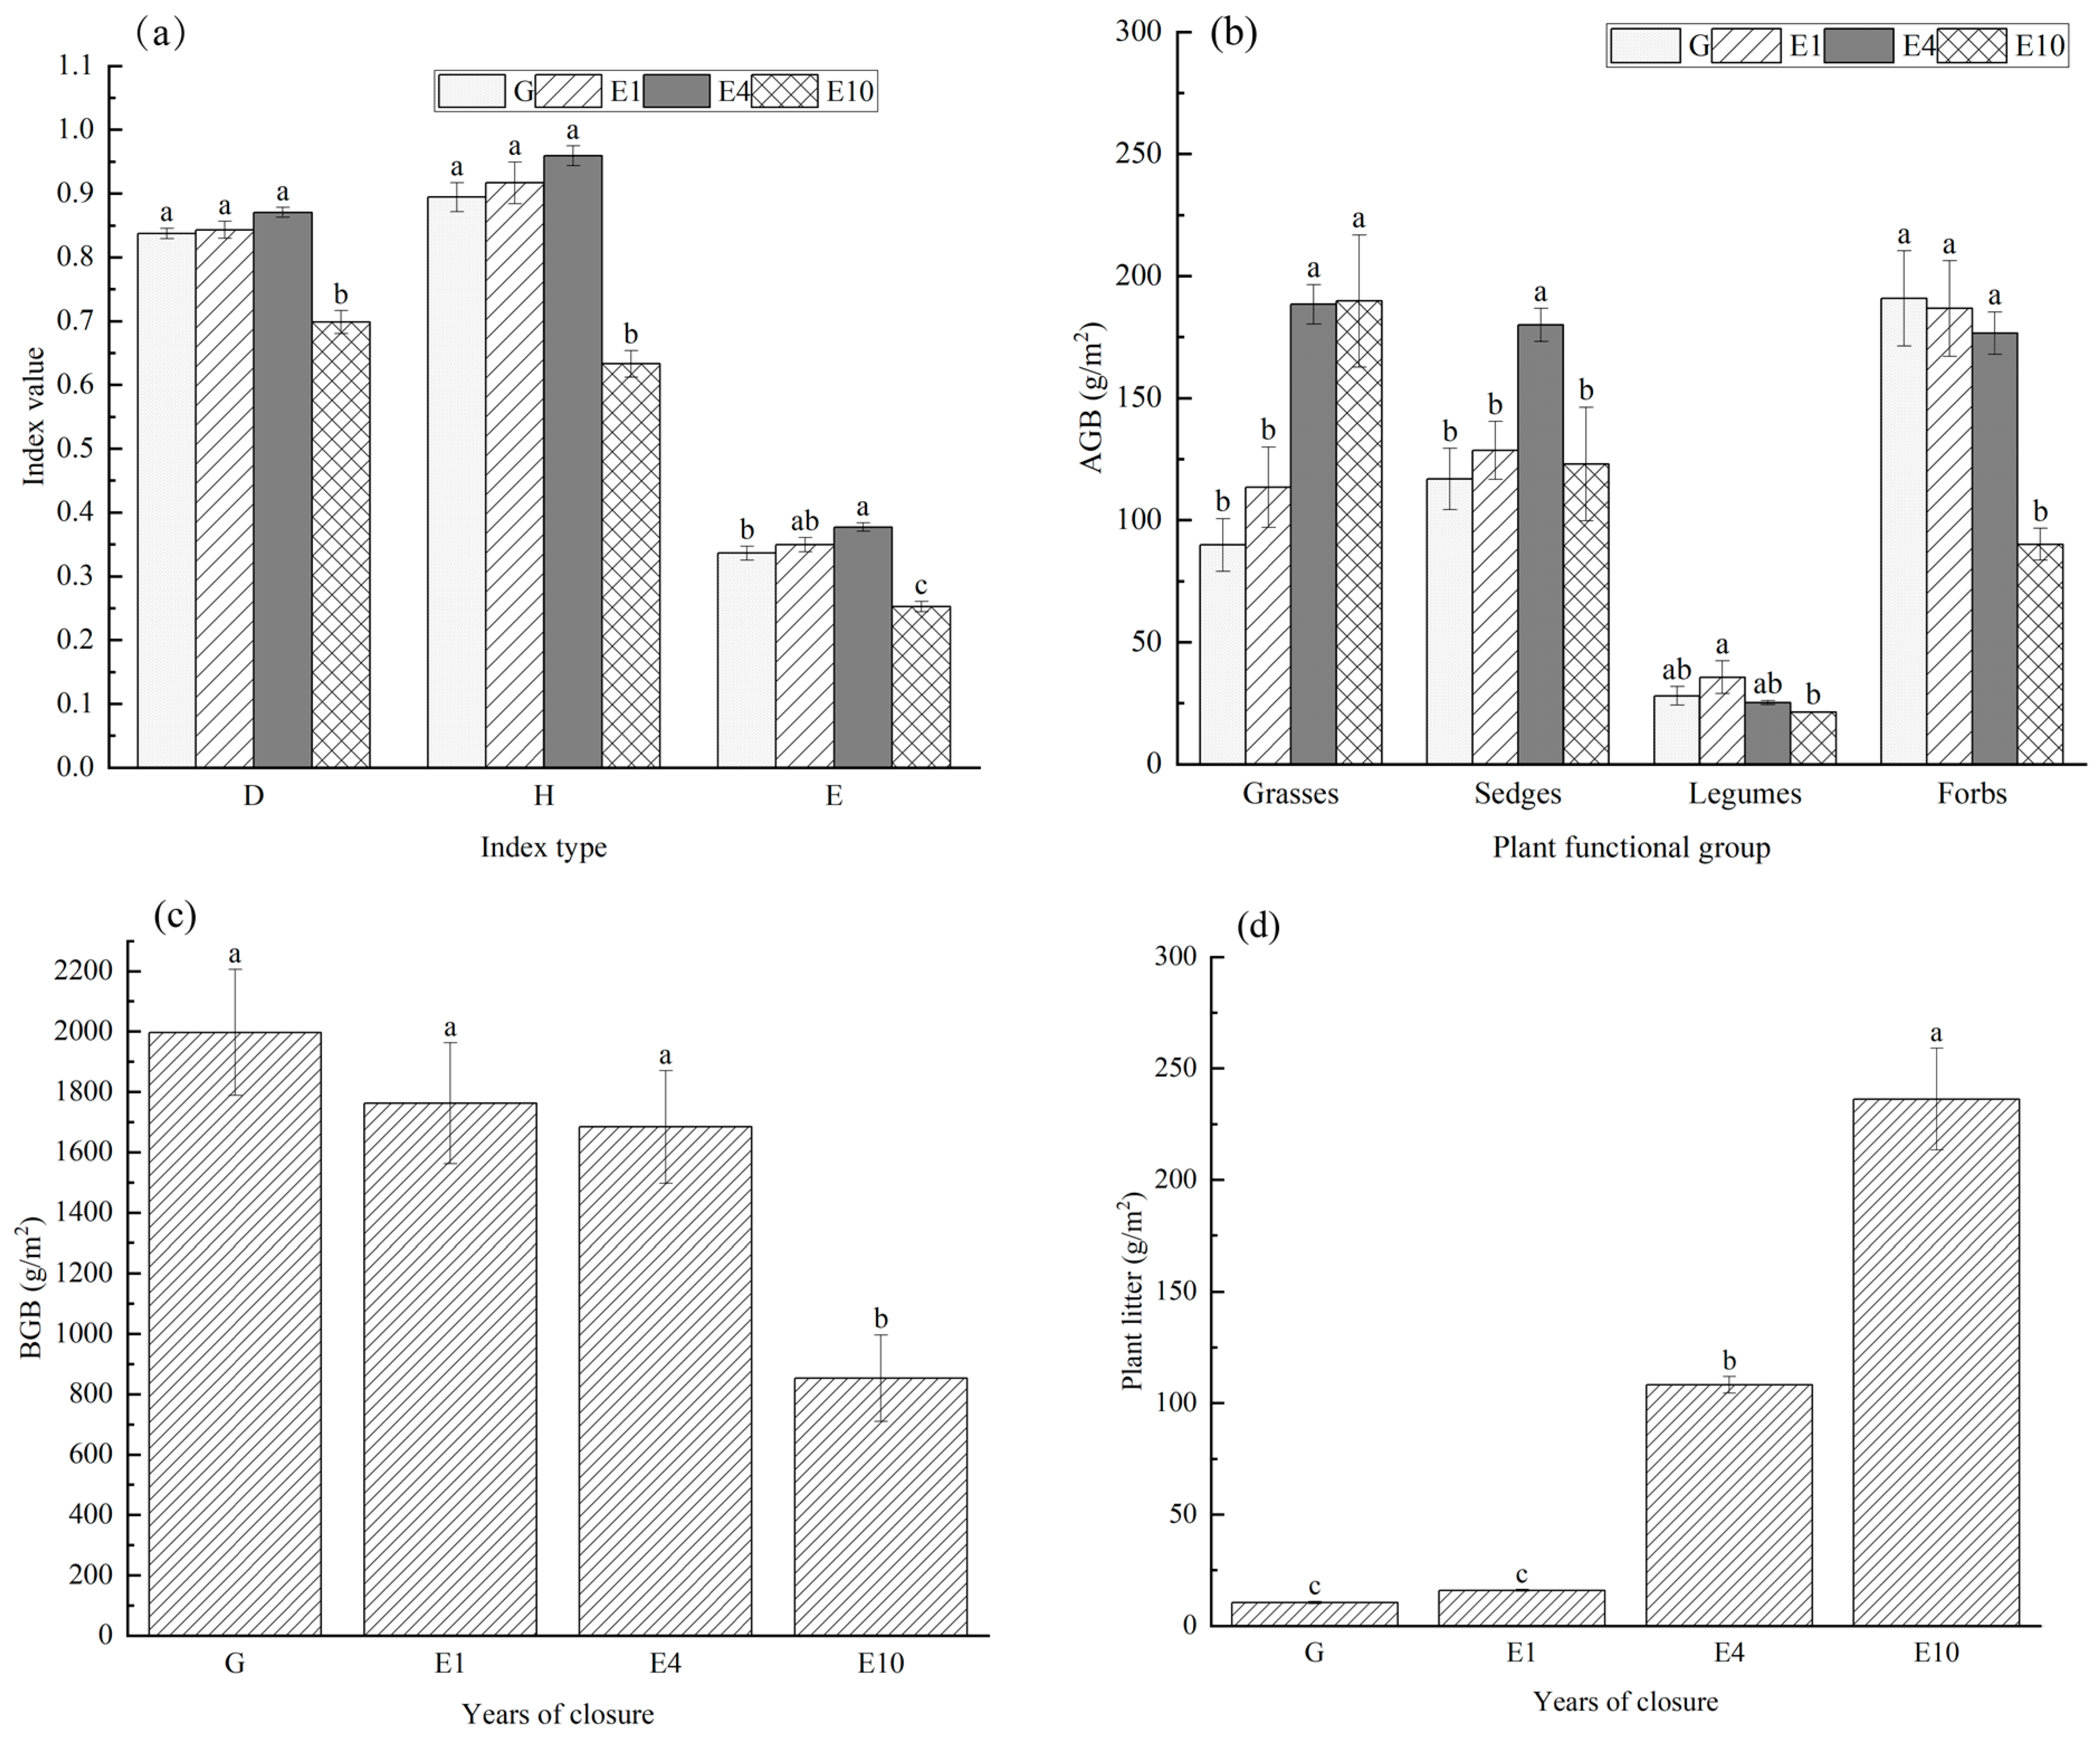
3.1. Plant Characteristics by Functional Group

Table 2 indicates significant or extremely significant differences in various indicators, with the exception of the total carbon content of plant roots, the nitrogen and phosphorus contents of sedge plants, and the aboveground biomass of leguminous plants. Notably, the carbon–nitrogen ratio and carbon–phosphorus ratio of gramineous plants, the nitrogen–phosphorus ratio of sedge plants, and the carbon–nitrogen ratio, carbon–phosphorus ratio, and nitrogen–phosphorus ratio of leguminous plants all exhibited significant or extremely significant differences. Similarly, the carbon–nitrogen ratio and carbon–phosphorus ratio of forbs also showed significant differences (Table 3).

3.2. Main Plant Characteristics by Functional Group

Significant differences were observed in the total carbon content of gramineous plants in different exclosure durations. The total carbon content of long-term exclosure (E10) and medium-term exclosure (E4) was significantly lower than that of the control (G) and 1-year exclosure (E1) plots. Similarly, the total carbon content of Cyperaceae plants showed significant variations, with E4 and E10 being significantly lower than G. Furthermore, the total carbon content of Leguminosae plants also exhibited significant differences, with E10 being significantly lower than G, E1, and E4. For forb plants, E4 showed a significant decrease in the total carbon content compared to G, E1, and E10 (Figure 2a). Additionally, significant differences were observed in the total carbon content of plant litter, with E4 and E10 showing significantly lower values than E1 and G. However, no significant difference was found in the total carbon content of the belowground parts of the plant community among different exclosure durations (Figure 2b).
Significant differences existed in the total nitrogen content of different plant groups over different exclosure years. E10 had a significantly higher nitrogen content in gramineous plants than E4, E1, and G. Similarly, E4 had a significantly higher nitrogen content than E1 and G. Among Cyperaceae plants, E10 had the highest nitrogen content that was significantly higher than E4. In the case of legumes, E10 had a significantly lower nitrogen content than E4, E1, and G. For forbs, E10 had a significantly higher nitrogen content than E4, E1, and G (Figure 3a). Significant differences were also observed in the total nitrogen content of plant litter, with E4 having a significantly lower nitrogen content than E1 and G. Furthermore, the roots of the plant community were significantly different in their nitrogen content, with E10 being significantly higher than E4, E1, and G (Figure 3b).
At different exclosure lengths, the total phosphorus content of gramineous plants showed significant variations. Both E10 and E4 had a significantly higher phosphorus content than E1 and G. Similarly, the total phosphorus content of Cyperaceae plants also showed significant differences between different exclosure lengths, with E4 having the highest content, significantly higher than E1. The total phosphorus content of leguminous plants also exhibited significant differences. E10 had a significantly higher phosphorus content than all three other durations, while E4 was significantly higher than E1 and G. For forbs, their total phosphorus content showed significant differences, with E10 being significantly higher than E1 and G, and E4 being significantly higher than E1 (Figure 4a). Furthermore, the total phosphorus content of plant litter also exhibited significant differences, with G being significantly higher than E1, E4, and E10. The roots of the plant community also had significant differences in their total phosphorus content, with E10 being significantly higher than E4, E1, and G (Figure 4b).
The community diversity indices (Shannon–Wiener index, H; Simpson index, D; and Pielous index, E) in E10 were notably lower than those of E4, E1, and G (Figure 5a). The aboveground biomass of gramineous plants exhibited significant variations among different exclosure years, with E10 and E4 showing significantly higher values than E1 and G. Similarly, the aboveground biomass of Cyperaceae plants also displayed significant differences, with E4 having the highest value, significantly surpassing E10, E1, and G. For leguminous plants, E10 had the lowest aboveground biomass, which was significantly lower than E1. The aboveground biomass of forbs also exhibited significant differences, with E10 being significantly lower than E4, E1, and G (Figure 5b). The biomass of plant litter showed significant differences among the treatments. E10 had the highest biomass, which was significantly higher than E4, E1, and G. Additionally, E4 had a significantly higher biomass than E1 and G (Figure 5c). The belowground biomass of the plants also exhibited significant differences among the treatments. E10 had the lowest biomass, which was significantly lower than E4, E1, and G. Furthermore, the three indexes of the E10 treatment were significantly lower than those of the other treatments (Figure 5d).
There was a significant difference in the carbon–nitrogen ratio among gramineous plants of different exclosure durations (p < 0.05). The carbon–nitrogen ratio of long-term exclosure (E10) and medium-term exclosure (E4) was significantly lower than that of the control (G) and 1-year exclosure (E1). However, there was no significant difference in the carbon–nitrogen ratio of Cyperaceae plants. On the other hand, the C/N ratio of leguminous plants showed significant differences. E10 had a significantly higher ratio than G, E1, and E4, while E4 had a significantly lower ratio than G. The C/N ratio of forbs also exhibited significant differences, with E10 and E4 having a significantly lower ratio than G and E1. Interestingly, there was no significant difference in the carbon–nitrogen ratio between plant litter and the belowground parts of the plant community among different exclosure years (Table 4).
There was a significant difference in the carbon–phosphorus ratio of gramineous plants among different exclosure years (p < 0.05). Both long-term exclosure (E10) and medium-term exclosure (E4) had a significantly lower carbon–phosphorus ratio than the control group (G) and 1-year exclosure (E1). No significant difference was found in the carbon–phosphorus ratio of Cyperaceae plants. Significant differences were observed in the C/P ratio of legumes. E10 and E4 had significantly lower ratios than E1 and G, and E10 had a significantly lower ratio than E4. The C/P ratio of forbs also showed significant differences, with E10 and E4 having significantly lower ratios than E1 and G. However, no significant difference existed in the carbon–phosphorus ratio between plant litter and the roots of the plant community (Table 5).
The nitrogen and phosphorus ratio of gramineous plants did not show significant differences among different exclosure years (p > 0.05). However, there was a significant difference in the ratio of nitrogen to phosphorus in Cyperaceae plants (p < 0.05). Among the treatments, E4 had the lowest ratio that was significantly lower than the other treatments. In the case of legumes, both E10 and E4 had significantly lower ratios than E1 and G. Additionally, E10 had a significantly lower ratio than E4, while E1 had a significantly higher ratio than G. On the other hand, there was no significant difference in the nitrogen to phosphorus ratio among the belowground parts of forbs, plant litters, and plant communities (Table 6).

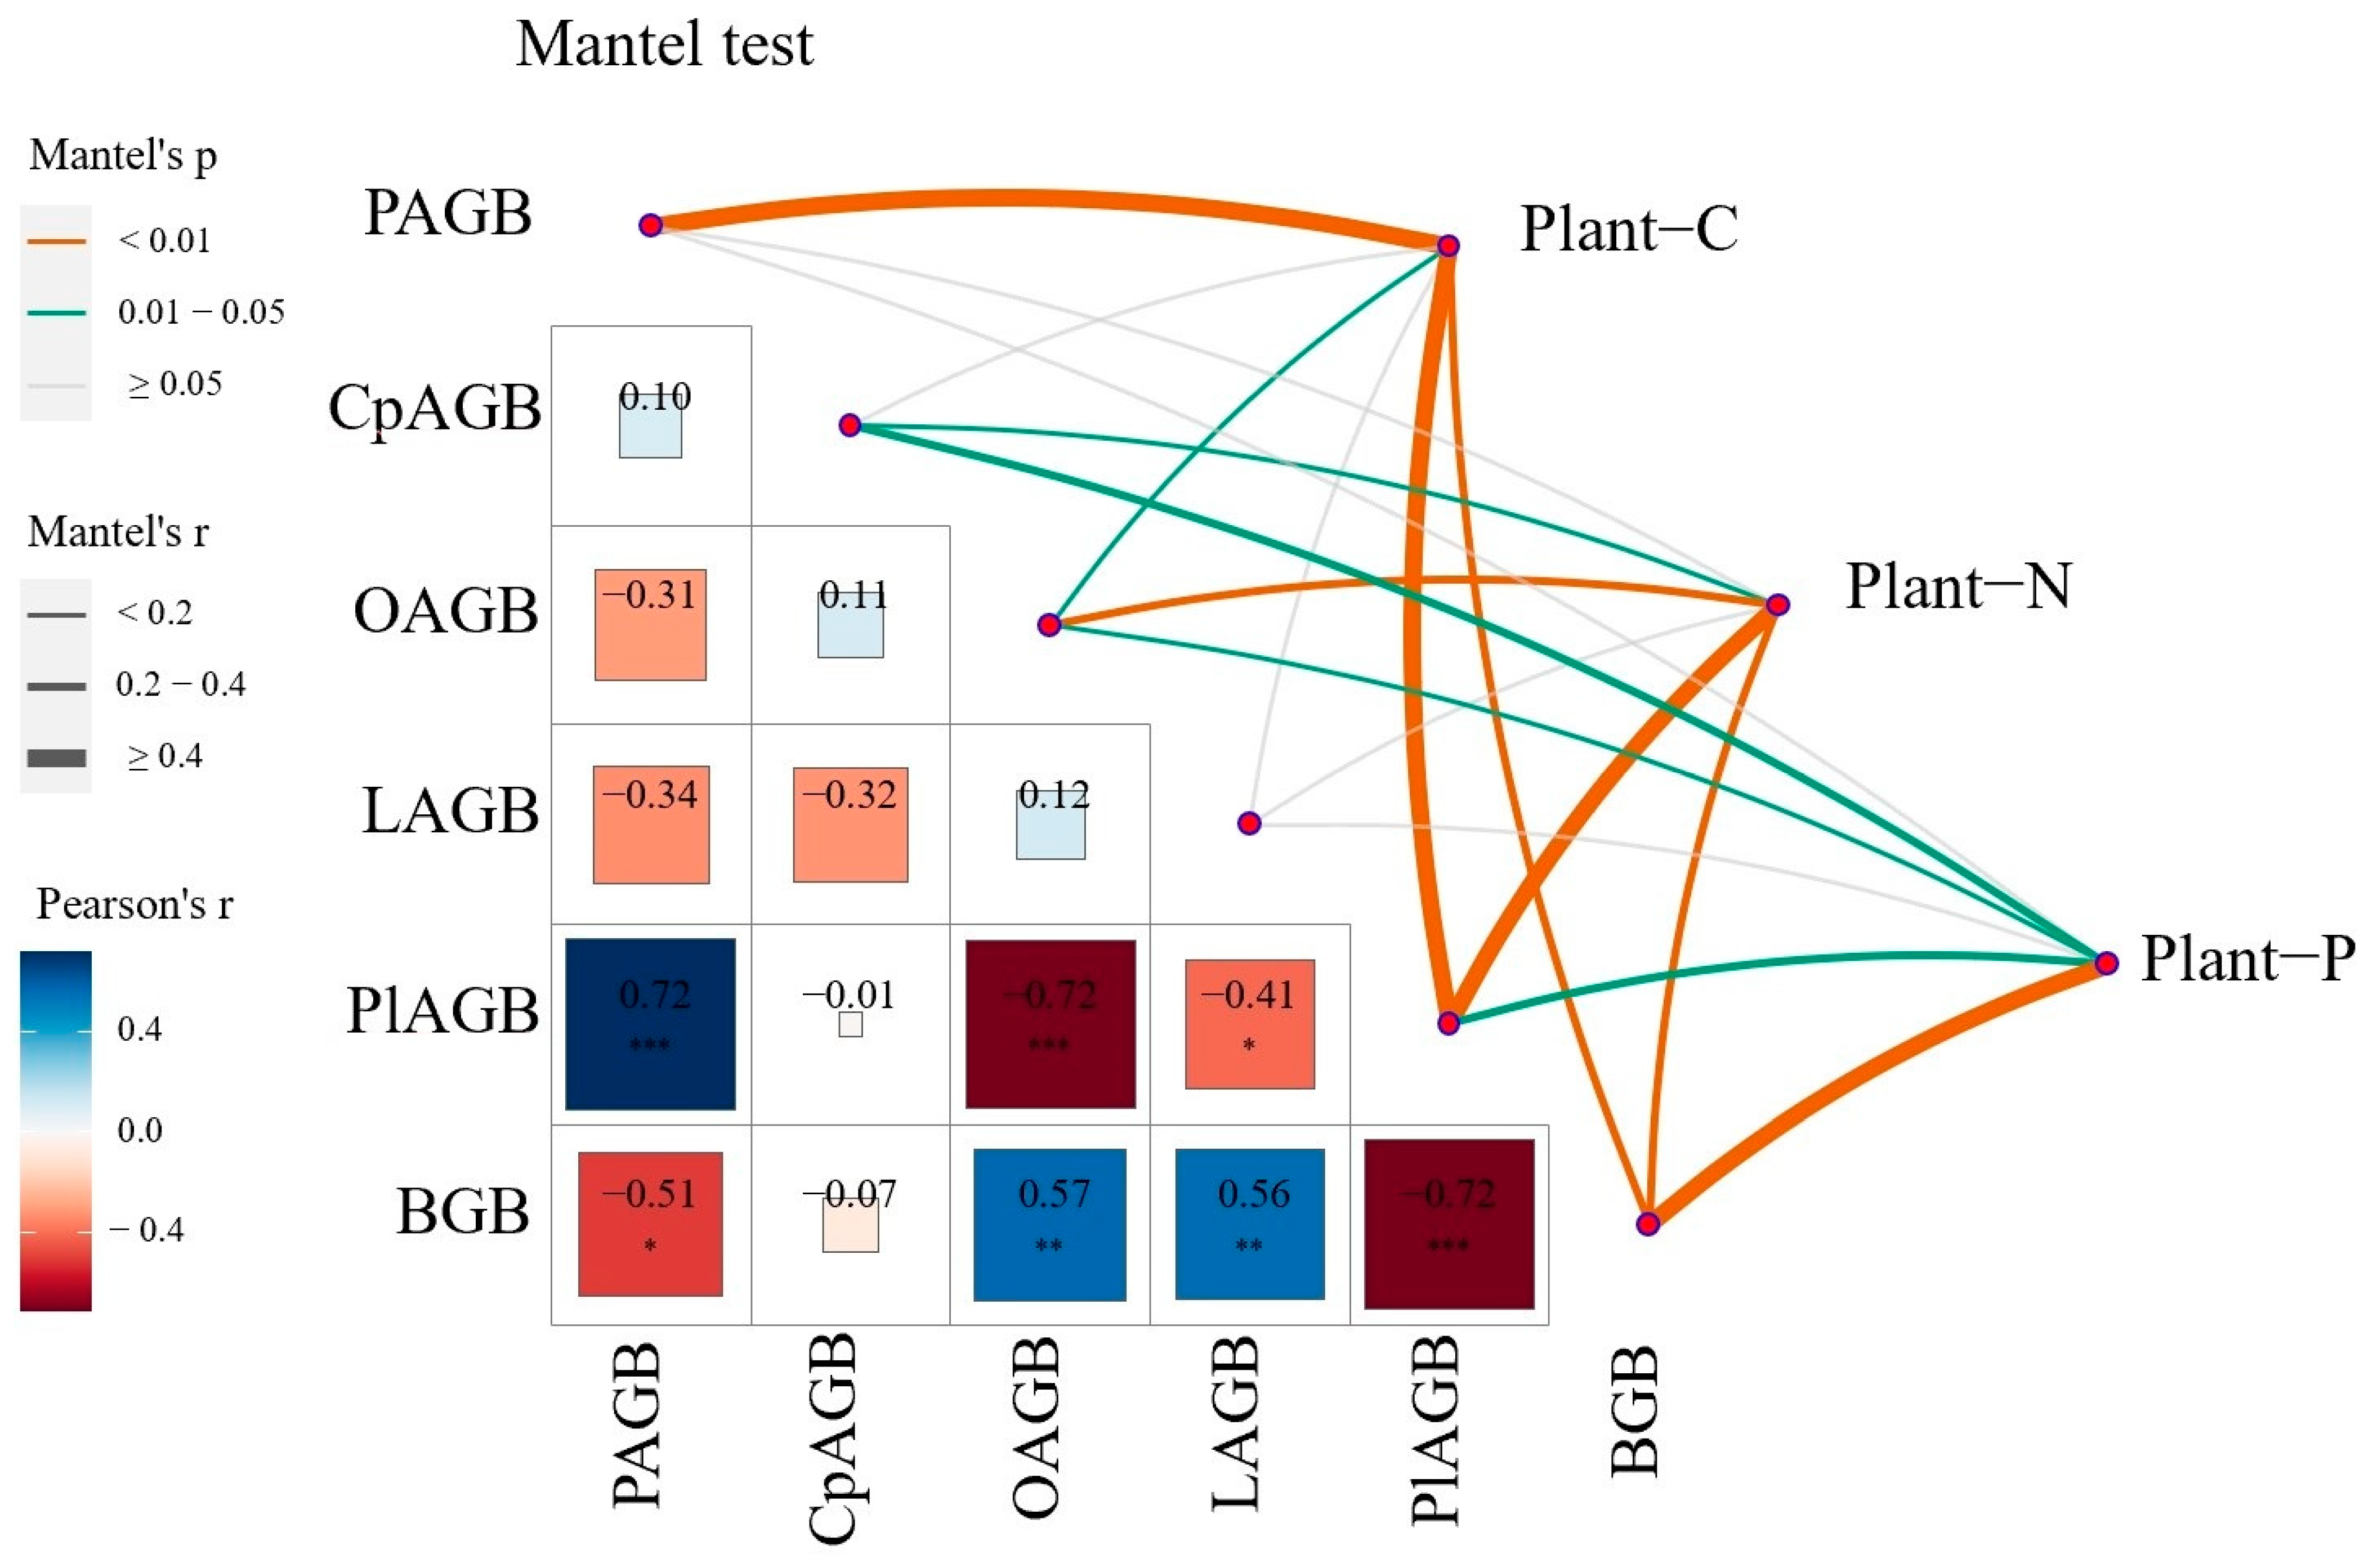
3.3. Correlation between Plant Carbon, Nitrogen, and Phosphorus Content and Biomass

The correlation analysis of the carbon, nitrogen, and phosphorus contents and aboveground and belowground biomass of plants across different exclosure years revealed significant correlations between the carbon content of the plant community and the aboveground biomass of gramineous plants, aboveground biomass of miscellaneous plants, plant litter, and underground biomass of the plant community. The nitrogen content of the plant community is significantly related to the aboveground biomass of Cyperaceae, aboveground biomass of miscellaneous plants, plant litter, and underground biomass of the plant community. The phosphorus content of the plant community is significantly related to the aboveground biomass of Cyperaceae plants, aboveground biomass of miscellaneous plants, plant litter, and underground biomass of the plant community (Figure 6).

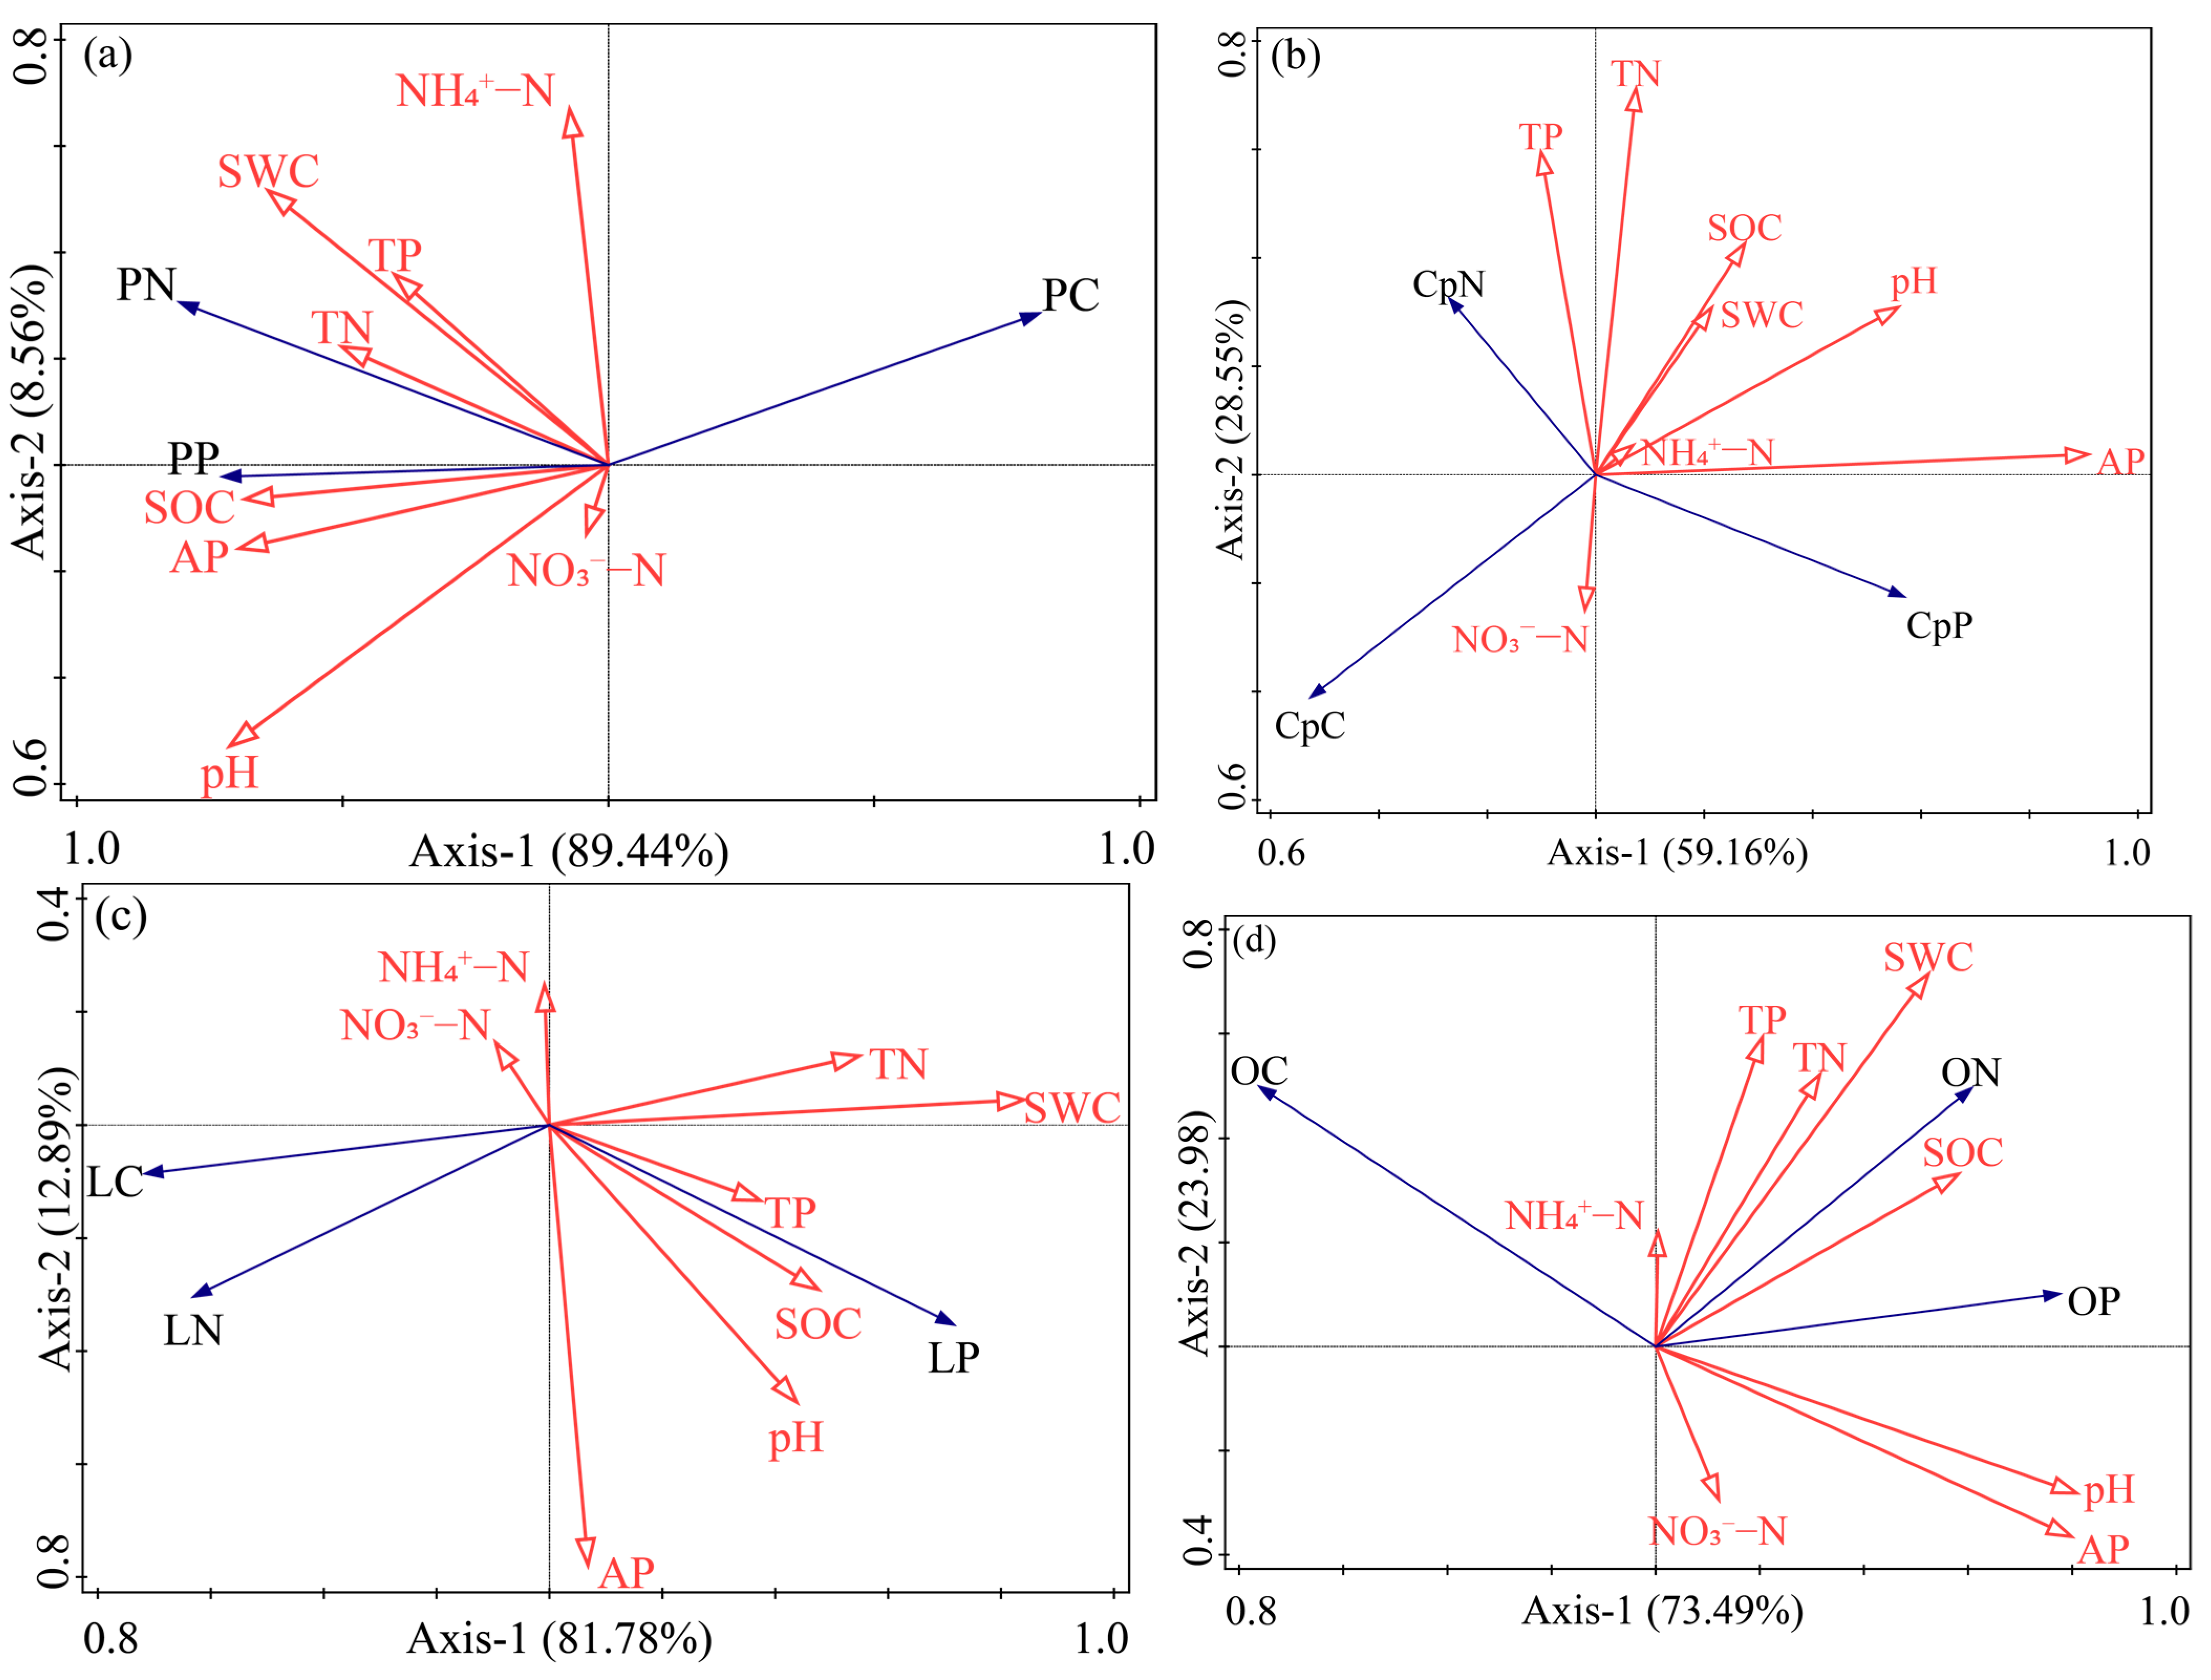
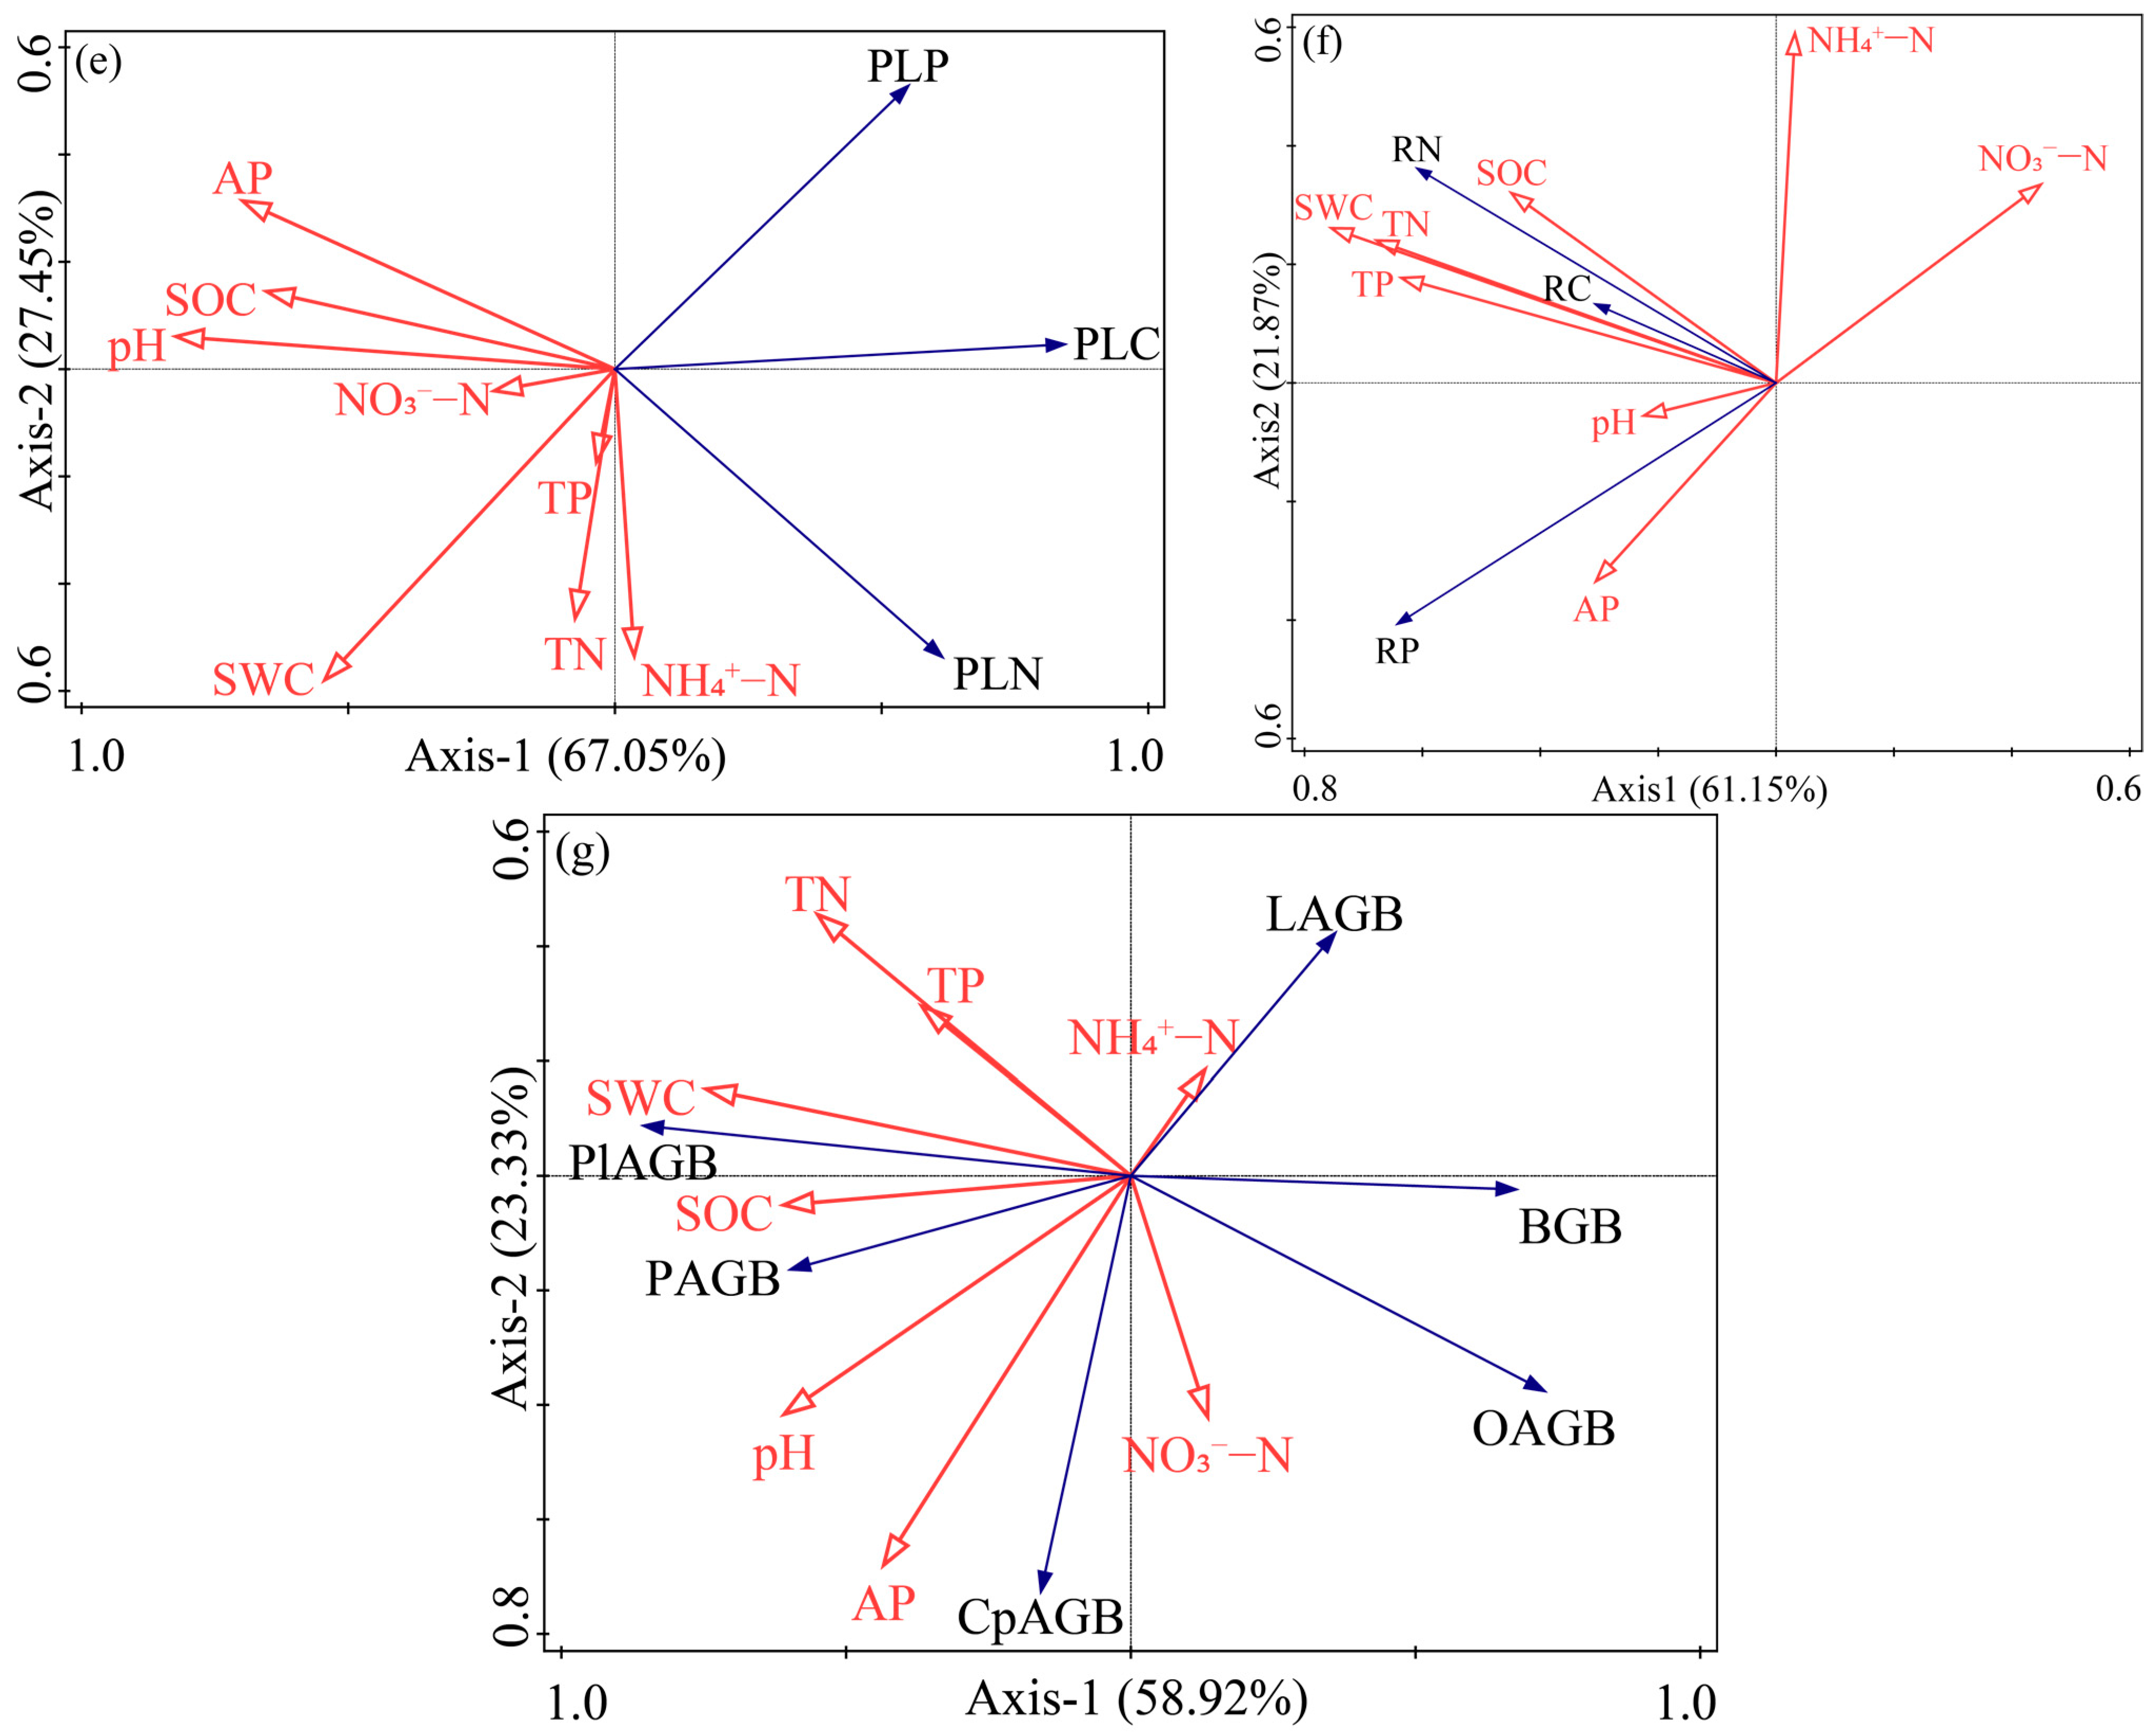
3.4. Relationship between Plant Carbon, Nitrogen, Phosphorus Content and the Environment

The RDA analysis of soil physical and chemical properties (the data for soil physical and chemical properties can be found in Appendix A) revealed significant positive correlations between the total nitrogen and total phosphorus contents of gramineous plants and soil pH, available phosphorus (AP), organic carbon (SOC), water content (SWC), and total nitrogen (TN). On the other hand, the total carbon content showed a significant negative correlation with soil pH, AP, SOC, SWC, and TN. Additionally, the total phosphorus content of sedge plants exhibited a significant positive correlation with soil AP, while the total carbon and total nitrogen contents bore a significant negative correlation with soil AP. Moreover, the total carbon and total nitrogen contents of legumes were significantly and positively correlated with SWC and TN, whereas the total phosphorus content showed a significant negative correlation with SWC and TN. Significant correlations also existed between the total nitrogen and total phosphorus contents of forbs and soil AP, pH, SWC, and SOC. However, the total carbon content showed a significant negative correlation with soil AP, pH, SWC, and SOC. Additionally, significant negative correlations were observed between the contents of total carbon, total nitrogen, and total phosphorus in plant litter and soil pH, AP, SOC, and SWC. On the other hand, the contents of total carbon, total nitrogen, and total phosphorus in plant roots showed a significant positive correlation with soil SWC, TN, and TP. The biomass of gramineae, Cyperaceae, and plant litter was significantly and positively correlated with soil SWC, pH, TN, SOC, and AP. Conversely, the biomass of leguminosae, forbs, and plant roots showed a significant negative correlation with soil SWC, pH, TN, SOC, and AP. Overall, the response of carbon, nitrogen, and phosphorus in each functional group of plants to soil physical and chemical properties varied with the exclosure duration. However, there was a significant correlation with soil pH, organic carbon content, water content, total nitrogen content, and available phosphorus content (Figure 7).

4. Discussion

4.1. Effects of Long-Term Exclosure on the Diversity and Biomass of Main Plant Functional Groups

The restoration effect of fencing exclosure on the degraded alpine meadow primarily manifests in an increase in aboveground biomass, indicating cumulative productivity. However, the impact of long-term exclosure on plant diversity is not significant. Zhu et al. [28] conducted a study in the Three Parallel Rivers region of Tibet, and revealed that a 2-year short-term exclosure led to an increase in both aboveground and belowground biomass, but resulted in a reduced plant diversity. Similarly, Fenetahun et al. [29] found that exclosure in southern Ethiopia significantly increased aboveground vegetation biomass, but led to a decrease in plant diversity as the exclosure time extended. In our study, the plant diversity of E10 was significantly lower than that of E4, E1, and G. This can be attributed to the disturbance caused by livestock grazing in the grazed grassland of G, which weakens the competitiveness of dominant species from the Gramineae and Cyperaceae families, known for their favorable palatability in the alpine meadow plant community. This disturbance also promotes forbs and interferes with the formation of various habitat patches, resulting in the coexistence of populations at different succession stages. Long-term exclosure of grassland eliminates livestock interference, promotes rapid growth of palatable grasses and sedge plants, and creates a competitive advantage. However, this also leads to a decrease in biodiversity and a tendency towards uniformity in the habitat. Numerous studies have substantiated these findings. For instance, in a series of exclosure experiments conducted over 6, 11, and 12 years on the alpine grassland of the Qinghai–Tibet Plateau, Li et al. [30] observed that exclosure significantly reduced the Shannon–Wiener diversity index and Margalef richness index of vegetation. Similarly, research conducted in Arizona, southwestern United States, demonstrated that grazing exclusion resulted in a decrease in native species and reduced the overall species richness compared to moderate grazing [31]. Ebrahimi et al. [32] found that after 2, 4, and 6 years of fencing on dry pastures in southeastern Iran, the plant species richness was the highest after 6 years, due possibly to increased interspecific competition for resources such as light and/or nutrients. In this study, the richness index and diversity index of degraded alpine meadow plants after 4 years of exclosure were found to be the highest and significantly higher than those of E10. This can be attributed to the significant enhancement of Gramineae, a dominant species, in the fenced plots. As a result, the proportion of Gramineae biomass increased significantly with prolonged exclosure. The alpine meadow grasses, such as Elymus dahuricus and Poa pratensis, not only exhibit a strong tillering ability but also occupy the upper canopy, inhibiting the growth of sedges, legumes, and forbs. This finding is consistent with the significant decrease in the biomass of sedges observed in E10 in this study. Consequently, the lack of light and nutrients leads to a decrease in or even disappearance of some dwarf plants with weak competitiveness in the lower layer of the plant community. This ultimately results in a decrease in plant community diversity in alpine meadows [33].
Mechanistically, exclosure has both promoting and inhibiting effects on grassland productivity [34]. In this study, the aboveground biomass of gramineous plants increased with the increase in exclosure years, while the aboveground biomass of forbs decreased. Significant differences were observed between E10 and E4, as well as between E1 and G. These differences can be attributed to the low forage productivity of the degraded grassland induced by overgrazing prior to fencing. Exclosure of the degraded grassland allows the recovery of the original palatable grass and sedge grass communities, leading to short-term compensatory growth, seed germination, seedling recruitment, and bud tillering, ultimately improving grassland productivity [35]. E10 of sedge plants is lower than E4 due to the super compensatory growth mechanism of forage grass in the absence of interference from livestock. This is because a large amount of litter is decomposed at a slower rate than the turnover rate of plant production, which affects the efficiency of resource utilization [36]. This finding aligns with the observation that the biomass of plant litter of E10 is the highest, significantly surpassing E4, E1, and G in this study. Furthermore, E4 is significantly higher than E1 and G. The productivity of a community can also be influenced by changes in plant functional groups during the succession of enclosed communities. Generally, the climax community of restoration succession is more productive than the degraded community [37]. Therefore, the response of plants to exclosure is determined with the net effect of promotion and inhibition, which is closely tied to environmental conditions and grassland management strategies.

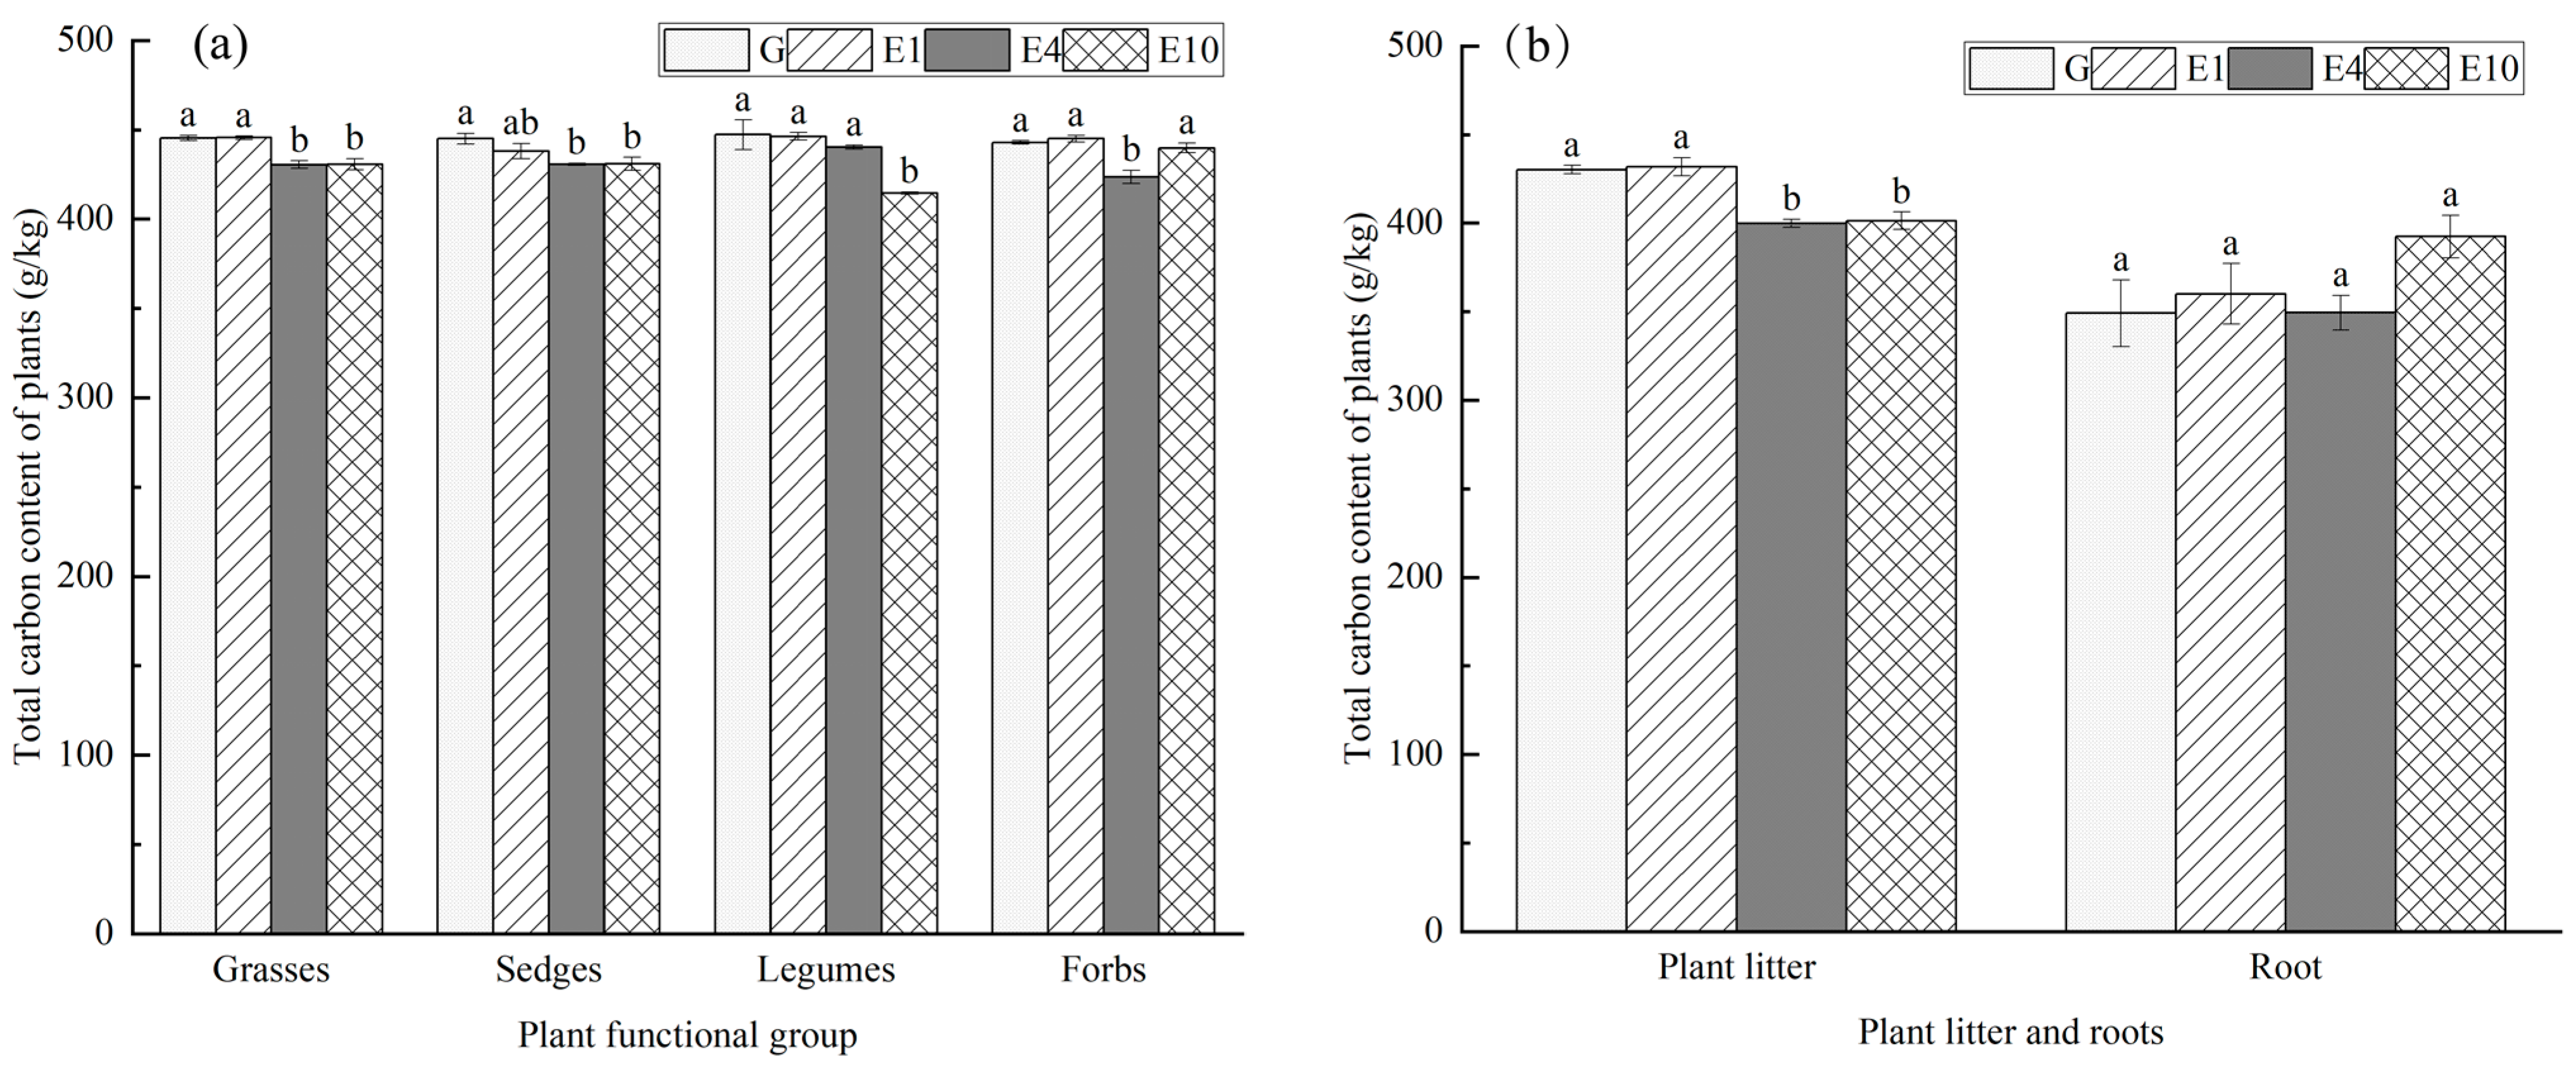
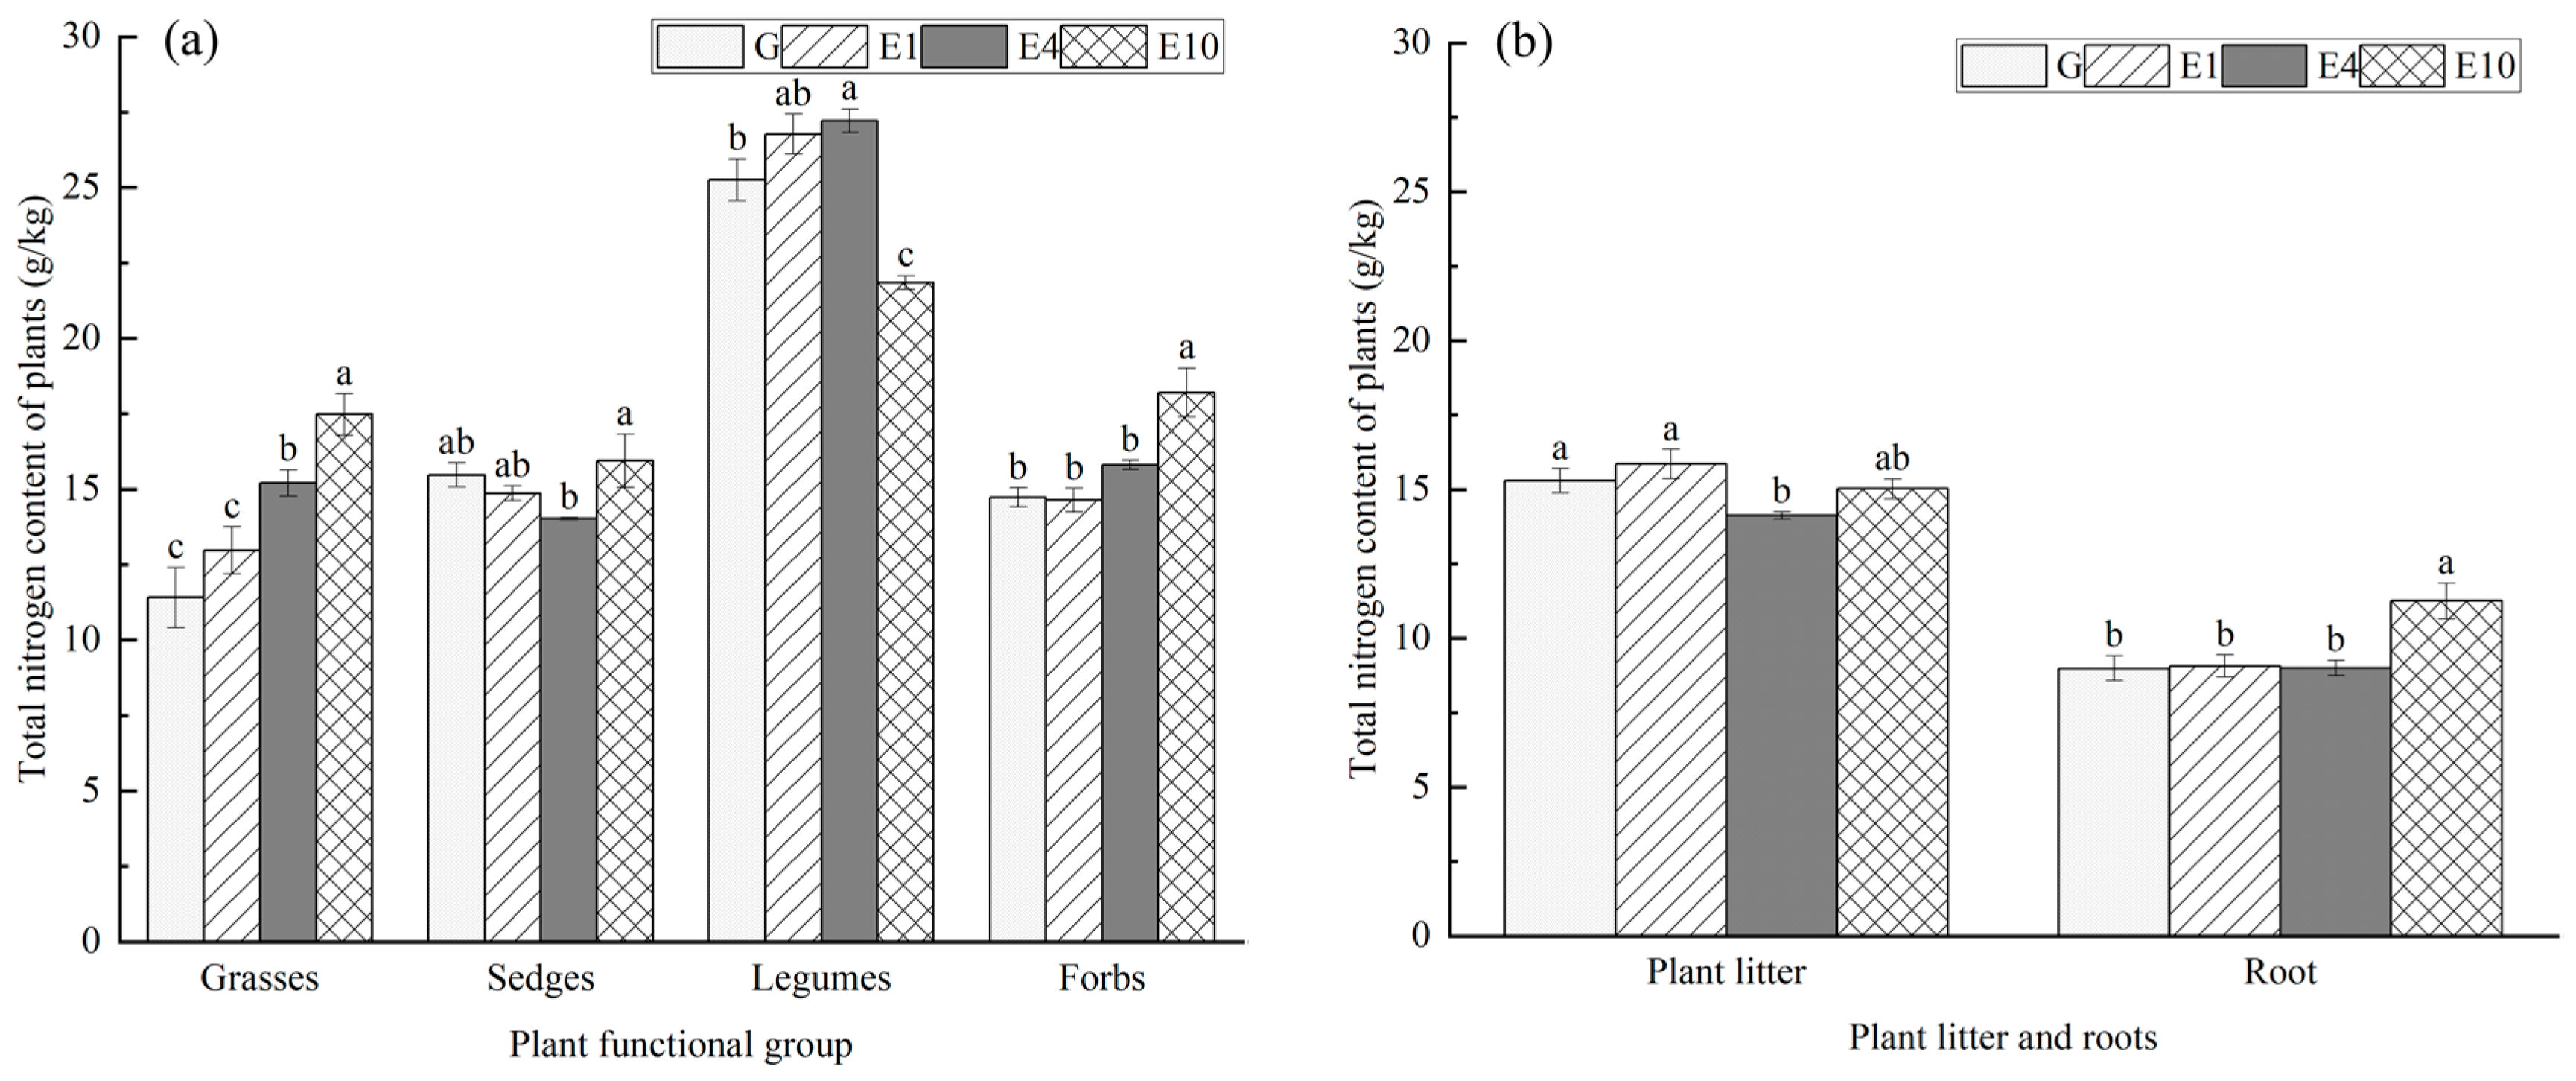
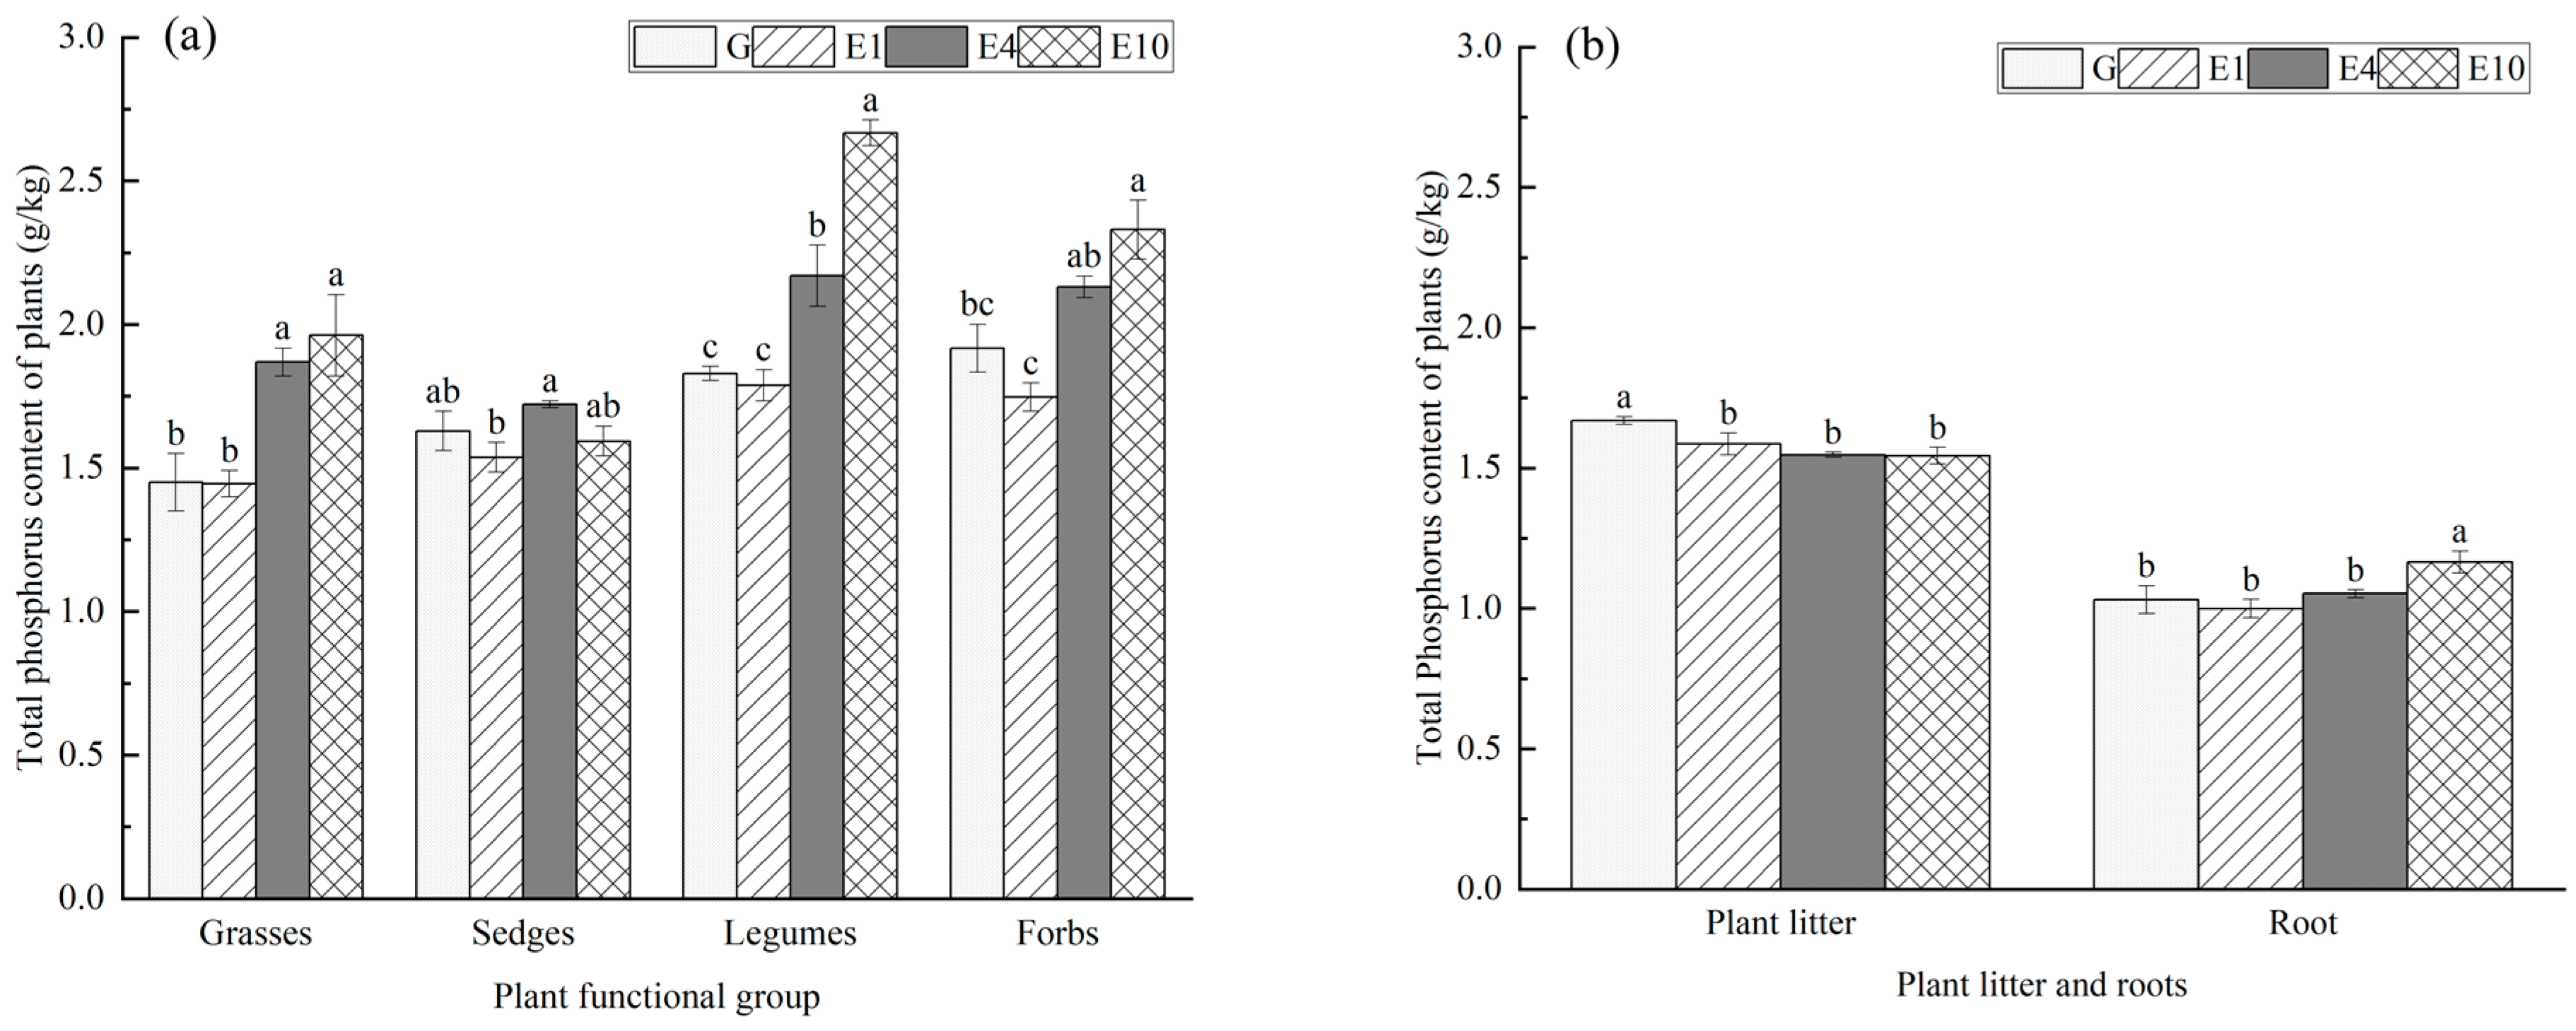
4.2. Effects of Long-Term Exclosure on Carbon, Nitrogen, and Phosphorus Contents of Plants

Carbon (C), nitrogen (N), and phosphorus (P) are fundamental elements that make up plants and influence their growth and development [38]. Carbon serves as the structural element of plants, forming the basis of all organic macromolecules. Nitrogen is the primary component of biological macromolecules such as proteins, while phosphorus is essential for the formation of genetic materials such as nucleic acids [39]. The ecological stoichiometric ratios of C, N, and P vary with the growing environment. In this study, except for forbs, the total carbon content of all functional groups was significantly lower in 10-year long-term and 4-year medium-term exclosures than 1-year exclosure and free grazing. This difference may be attributed to the compensatory growth of plants with high palatability that exhibit a strong carbon assimilation ability under the influence of livestock grazing and trampling. Consequently, the carbon content of grasses, sedges, and leguminous plants in the grazed grasslands is higher than in the long-term enclosed grassland. There were significant variations in the total nitrogen content among different plant families, namely Gramineae, Cyperaceae, and forbs. Specifically, the total nitrogen content of E10 was significantly higher than that of E4, E1, and G. Conversely, the total nitrogen content of legumes showed an opposite trend. On the one hand, the total nitrogen content of perennial legumes in long-term exclosure was lower than that in 1-year exclosure and free grazing treatments due to the decreased nitrogen availability. On the other hand, long-term enclosed perennial grasses and sedges were the dominant species in the secondary succession of alpine meadow vegetation communities. These species were at their peak growth stage, with young leaves comprising a relatively high proportion of the aboveground biomass, resulting in a high total nitrogen content. The total phosphorus content of each plant functional group was significantly higher in the 10-year long-term exclosure and 4-year medium-term exclosure than the 1-year exclosure and free grazing treatment. The exclusion of livestock in the alpine meadow vegetation community owing to long-term exclosure resulted in the formation of more seeds or reproductive branches. Additionally, the reproductive organs of the plants exhibit a higher phosphorus content.

4.3. Effects of Long-Term Exclosure on Plant Stoichiometric Characteristics

The ecological stoichiometric characteristics of carbon, nitrogen, and phosphorus vary among different plant communities in various grassland management schemes [40]. The carbon–nitrogen ratio and carbon–phosphorus ratio of Gramineae and Cyperaceae in alpine meadow communities indicate the carbon assimilation capacity of plants, which largely reflects their nutrient utilization efficiency [41]. In this study, except for Cyperaceae plants, the C/N ratio was significantly lower in long-term exclosure (E10) and medium-term exclosure (E4) than the control (G) and 1-year exclosure (E1). This can be attributed to the slow growth and low nutrient utilization efficiency of the plant community in long-term exclosure, while the vegetation community in free grazing and short-term exclosure exhibits opposite characteristics. The carbon–phosphorus ratio and carbon–nitrogen ratio were similar, indicating that free grazing and short-term exclosure have a strong vegetation carbon assimilation ability and a higher nutrient utilization efficiency than long-term exclosure. The content of the N/P ratio in plants remained relatively stable, except for Cyperaceae plants in E4 plots and Leguminosae plants in E10 and E4 treatments. In these cases, the N/P ratio was significantly lower than the G and E1 treatments. However, there were no significant differences in the N/P ratio among the other treatments, which aligns with the findings of Yu et al. [42].

4.4. Relationship between Enclosed Grassland and Environmental Factors

Exclosure has been found to have a significant rehabilitative effect on degraded grassland soil, with plant recovery following soil recovery [43]. Alpine meadow vegetation communities have the ability to influence soil hydrological processes and surface soil temperature through the input of light compounds and organic matter. Additionally, they can impact soil properties by providing habitats and resources for microscopic and macroscopic organisms [40,41,42,43,44,45]. However, changes in biotic and abiotic soil properties caused by vegetation may have counterproductive effects on aboveground vegetation biomass, which relies on soil to grow and develop [46]. Plant carbon (C), nitrogen (N), and phosphorus (P) content, as well as their stoichiometric ratios, vary with the type and content of N and P in the soil under different soil nutrient conditions [47]. In this study, the physical and chemical properties of enclosed soil such as total carbon, total nitrogen, and total phosphorus contents of Gramineous plants, sedge plants, Leguminous plants, forbs, plant litter, and plant roots did not respond to exclosure duration in a completely consistent manner. However, their responses were significantly correlated with soil pH, organic carbon content, water content, total nitrogen content, and available phosphorus content. The relationship between soil pH and nitrogen and phosphorus contents in Gramineous plants, forbs, and plant litter is significantly positive. A moderate increase in soil pH can enhance soil microbial activity, promote the decomposition of active organic substances in soil, and provide more nutrients such as nitrogen and phosphorus for plant growth. Additionally, maintaining a suitably acidic environment supports soil parent material development, improves soil fertility, and facilitates nutrient absorption by plants [48]. The nitrogen and phosphorus contents of Gramineous plants, forbs, and plant litters show a significant positive correlation with soil organic carbon content. This could be attributed to the impact of grazing and exclosure measures on Gramineous plants and forbs, as their roots respond to changes in the growing environment. Rapidly adapted growth strategies contribute to a substantial increase in organic carbon in the rhizosphere soil [49]. Previous studies have shown that soil water content plays a significant role in determining the nitrogen and phosphorus contents of various plant species. This finding is consistent with other findings obtained in ecologically fragile areas such as the Qinghai–Tibet Plateau, where soil water content is considered a key factor influencing plant nutrient levels [50]. Additionally, a strong correlation exists between the soil total nitrogen content and the total carbon, nitrogen, and phosphorus contents of the aboveground part. This correlation can be attributed to the direct influence of soil total nitrogen content on nutrient availability, soil and water conservation, aboveground and belowground biomass of vegetation, as well as the carbon, nitrogen, and phosphorus contents [51].

5. Conclusions

Short-term exclosure for a period up to 4 years has been found to have a significant positive impact on the biomass and diversity of the vegetation community in the patchily degraded alpine meadows in the study area. The 10-year long-term exclosure significantly reduces the species diversity of alpine meadows, which will lead to intensified interspecific competition, reduced ecological niche complementarity, and reduced resource use efficiency by species. From the perspective of functional groups, the biomass of grasses gradually increased, the aboveground biomass of sedge and legumes showed a trend of first increasing and then decreasing, and the biomass of forbs gradually decreased. Exclosure regulates the net primary productivity of a community by changing the proportion of different functional groups of plants in the community. On the other hand, long-term exclosure has been observed to enhance the storage of nitrogen and phosphorus and improve the nutrient utilization efficiency of gramineous and sedge plants. However, it also leads to a reduction in plant diversity within the alpine meadow vegetation community, ultimately compromising its stability and hindering the sustainable development of the degraded alpine meadow. To ensure the sustainability of such restored meadows, it is recommended to implement moderate grazing or mowing after a period of 4-year exclosure. More research is needed to assess whether this period can be further extended by a few more years.

Author Contributions

Conceptualization, P.Y.; Methodology, P.Y.; Software, P.Y.; Validation, X.L. and C.L.; Formal analysis, P.Y., C.L. and J.Z.; Resources, C.L.; Data curation, P.Y.; Writing—original draft, P.Y.; Writing—review & editing, P.Y., X.L. and J.Z.; Project administration, X.L.; Funding acquisition, X.L. All authors have read and agreed to the published version of the manuscript.

Funding

This study was financially supported by the Qinghai Science and Technology Department (Grant No. 2023-QY-210), the National Natural Science Foundation of China (U21A20191), the 111 Project of China (D18013), and Qinghai Science and Technology Innovation and Entrepreneurship Team Project titled ‘Sanjiangyuan Ecological Evolution and Management Innovation Team’ and the project of ecosystem succession and management direction in the world-class discipline of ecology at Qinghai University.

Data Availability Statement

The data presented in this study are available on request from the corresponding author. The data are not publicly available due to privacy.

Conflicts of Interest

The authors declare no conflict of interest.

Appendix A

Table A1. Differences in soil physical and chemical properties with different exclosure years [52].
Exclosure DurationpHSWC/%ω
(SOC)/g·kg−1
ω
(TN)/g·kg−1
ω
(TP)/g·kg−1
ω (NH4+−N)/
mg·kg−1
ω (NO3−N)/
mg·kg−1
ω
(AP)/mg·kg−1
G6.46 ± 0.06 c18.91 ± 0.01 b93.38 ± 8.63 ab3.85 ± 0.07 c0.67 ± 0.01 b9.00 ± 0.79 a17.14 ± 1.14 ab7.12 ± 0.38 b
E16.30 ± 0.06 d21.65 ± 0.02 b83.56 ± 9.52 b4.37 ± 0.10 ab0.75 ± 0.03 a9.65 ± 0.93 a14.78 ± 0.76 b7.05 ± 0.18 b
E46.91 ± 0.06 a21.88 ± 0.01 b115.01 ± 0.60 a4.00 ± 0.24 bc0.72 ± 0.01 ab9.17 ± 0.49 a18.65 ± 0.05 a9.51 ± 0.47 a
E106.68 ± 0.03 b26.15 ± 0.01 a116.75 ± 10.09 a4.66 ± 0.15 a0.78 ± 0.03 a8.86 ± 0.26 a14.95 ± 0.90 b7.84 ± 0.43 b
Different lowercase letters in the same column show significant differences (p < 0.05).

References

  1. Fu, B.; Li, S.; Yu, X.; Yang, P.; Yu, G.; Feng, R.; Zhuang, X. Chinese ecosystem research network: Progress and perspectives. Ecol. Complex. 2010, 7, 225–233. [Google Scholar] [CrossRef]
  2. Bardgett, R.D.; Bullock, J.M.; Lavorel, S.; Manning, P.; Schaffner, U.; Ostle, N.; Chomel, M.; Durigan, G.; Fry, E.L.; Johnson, D.; et al. Combatting global grassland degradation. Nat. Rev. Earth Environ. 2021, 2, 720–735. [Google Scholar] [CrossRef]
  3. Shao, Q.; Cao, W.; Fan, J.; Huang, L.; Xu, X. Effects of an ecological conservation and restoration project in the Three-River Source Region, China. J. Geogr. 2017, 27, 183–204. [Google Scholar] [CrossRef]
  4. Zhang, L.; Xiao, P.; Yu, H.; Zhao, T.; Liu, S.; Yang, L.; He, Y.; Luo, Y.L.; Wang, X.; Dong, W.; et al. Effects of Climate Changes on the Pasture Productivity From 1961 to 2016 in Sichuan Yellow River Source, Qinghai-Tibet Plateau, China. Front. Ecol. Evol. 2022, 10, 908924. [Google Scholar] [CrossRef]
  5. Liu, L.; Zhang, Y.; Bai, W.; Yan, J.; Ding, M.; Shen, Z.; Li, S.; Zheng, D. Characteristics of grassland degradation and driving forces in the source region of the Yellow River from 1985 to 2000. J. Geogr. 2006, 16, 131–142. [Google Scholar] [CrossRef]
  6. Dong, S.C.; Zhou, C.J.; Wang, H.Y. Ecological crisis and countermeasures of the Three Rivers’ Headstream Regions. J. Nat. Resour. 2002, 17, 713–720. [Google Scholar]
  7. Martin, D.M. Ecological restoration should be redefined for the twenty-first century. Restor. Ecol. 2017, 25, 668–673. [Google Scholar] [CrossRef]
  8. Ren, Y.; Lü, Y.; Fu, B. Quantifying the impacts of grassland restoration on biodiversity and ecosystem services in China: A meta-analysis. Ecol. Eng. 2016, 95, 542–550. [Google Scholar] [CrossRef]
  9. Zhang, Z.H.; Zhou, H.K.; Zhao, X.Q.; Yao, B.Q.; Ma, Z.; Dong, Q.M.; Dong, Q.; Zhang, Z.H.; Wang, W.Y.; Yang, Y.W. Relationship between biodiversity and ecosystem functioning in alpine meadows of the Qinghai-Tibet Plateau. Biodivers. Sci. 2018, 26, 111. [Google Scholar] [CrossRef]
  10. Xue, Y.F.; Zong, N.; He, N.P.; Tian, J.; Zhang, Y.Q. Influence of long-term enclosure and free grazing on soil microbial community structure and carbon metabolic diversity of alpine meadow. J. Appl. Ecol. 2018, 29, 2705–2712. [Google Scholar]
  11. Jachowski, D.S.; Slotow, R.; Millspaugh, J.J. Good virtual fences make good neighbors: Opportunities for conservation. Anim. Conserv. 2014, 17, 187–196. [Google Scholar] [CrossRef]
  12. Chen, Q.; Shang, Y.T.; Zhu, R.; Bao, Q.L.; Lin, S. Long-term enclosure at heavy grazing grassland affects soil nitrification via ammonia-oxidizing bacteria in Inner Mongolia. Sci. Rep. 2022, 12, 21464. [Google Scholar] [CrossRef]
  13. Zhang, Z.W.; Han, J.H.; Yin, H.Y.; Xue, J.; Jia, L.Z.; Zhen, X.; Chang, J.J.; Wang, S.K.; Yu, B. Assessing the effects of different long-term ecological engineering enclosures on soil quality in an alpine desert grassland area. Ecol. Indic. 2022, 143, 109426. [Google Scholar] [CrossRef]
  14. Shang, Z.H.; Cao, J.J.; Guo, R.Y.; Henkin, Z.; Ding, L.M.; Long, R.J.; Deng, B. Effect of enclosure on soil carbon, nitrogen and phosphorus of alpine desert rangeland. Land Degrad. Dev. 2017, 28, 1166–1177. [Google Scholar] [CrossRef]
  15. Asadian, G.; Javadi, S.A.; Jafary, M.; Arzani, H.; Akbarzade, M. Relationships between environmental factors and plant communities in enclosure rangelands (case study: Gonbad, Hamadan). J. Rangel. Sci. 2016, 7, 20–34. [Google Scholar]
  16. Bode, M.; Wintle, B. How to build an efficient conservation fence. Conserv. Biol. 2010, 24, 182–188. [Google Scholar] [CrossRef]
  17. Zuo, W.Q.; Wang, Y.H.; Wang, F.Y.; Shi, G.X. Effects of enclosure on the community characteristics of Leymus chinensis in degenerated steppe. Acta Prataculturae Sin. 2009, 18, 12. [Google Scholar]
  18. Yao, X.; Wu, J.; Gong, X.; Lang, X.; Wang, C.; Song, S.; Ahmad, A.A. Effects of long term fencing on biomass, coverage, density, biodiversity and nutritional values of vegetation community in an alpine meadow of the Qinghai-Tibet Plateau. Ecol. Eng. 2019, 130, 80–93. [Google Scholar] [CrossRef]
  19. Babur, E.; Kara, O.; Fathi, R.A.; Susam, Y.E.; Riaz, M.; Arif, M.; Akhtar, K. Wattle fencing improved soil aggregate stability, organic carbon stocks and biochemical quality by restoring highly eroded mountain region soil. J. Environ. Manag. 2021, 288, 112489. [Google Scholar] [CrossRef]
  20. Zhang, C.; Yan, R.R.; Liang, Q.W.; Na, R.S.; Li, T.; Yang, X.F.; Bao, Y.H.; Xin, X.P. Study on soil physical and chemical properties and carbon and nitrogen sequestration of grassland under different utilization modes. Acta Prataculturae Sin. 2021, 30, 90–98. [Google Scholar]
  21. Wu, G.L.; Du, G.Z.; Liu, Z.H.; Thirgood, S. Effect of fencing and grazing on a Kobresia-dominated meadow in the Qinghai-Tibetan Plateau. Plant Soil 2009, 319, 115–126. [Google Scholar] [CrossRef]
  22. Xu, L.; Nie, Y.; Chen, B.; Xin, X.; Yang, G.; Xu, D.; Ye, L. Effects of fence enclosure on vegetation community characteristics and productivity of a degraded temperate meadow steppe in northern China. Appl. Sci. 2020, 10, 2952. [Google Scholar] [CrossRef]
  23. Astaiken, G.; Dong, Y.Q.; Zhou, S.J.; Nie, T.T.; Jiang, A.J.; An, S.Z. Effects of enclosure on plant community diversity and niche characteristics of different grassland types-Taking different types of grassland in Xinjiang as an example. Pratacultural Sci. 2023, 40, 1168–1185. [Google Scholar]
  24. Smith, D.; King, R.; Allen, B.L. Impacts of exclusion fencing on target and non-target fauna: A global review. Biol. Rev. 2020, 95, 1590–1606. [Google Scholar] [CrossRef] [PubMed]
  25. Boone, R.B.; Hobbs, N.T. Lines around fragments: Effects of fencing on large herbivores. Afr. J. Range Forage Sci. 2004, 21, 147–158. [Google Scholar] [CrossRef]
  26. Lu, R.K. Soil Agrochemical Analysis Method; China Agricultural Science and Technology Press: Beijing, China, 2000; pp. 266–292. [Google Scholar]
  27. Nie, Y.Y.; Xu, L.J.; Xin, X.P.; Chen, B.R.; Zhang, B.H. Effects of fence enclosure on the plant community composition and niche characteristics in a temperate meadow steppe. Acta Prataculturae Sin. 2020, 29, 11–22. [Google Scholar]
  28. Zhu, N.; Sun, J.; Shi, N.; Wang, J.N.; Zhang, L.; Luo, D.L.; Shen, C.; Gai, A.H. Effects of Short-term Fence Enclosing on Plant Community and the Physical and Chemica Properties of Alpine Meadow Soils. Acta Agrestia Sin. 2023, 31, 834–843. [Google Scholar]
  29. Fenetahun, Y.; Yuan, Y.; Xinwen, X.; Yongdong, W. Effects of grazing enclosures on species diversity, phenology, biomass, and carrying capacity in Borana Rangeland, Southern Ethiopia. Front. Ecol. Evol. 2021, 8, 623627. [Google Scholar] [CrossRef]
  30. Li, R.F.; Niu, H.S.; Kong, Q.; Liu, Q. Effects of exclosure on plant and soil nutrients in an alpine grassland. Pratacultural Sci. 2021, 38, 399–409. [Google Scholar]
  31. Loeser, M.R.R.; Sisk, T.D.; Crews, T.E. Impact of grazing intensity during drought in an Arizona grassland. Conserv. Biol. 2007, 21, 87–97. [Google Scholar] [CrossRef]
  32. Ebrahimi, M.; Khosravi, H.; Rigi, M. Short-term grazing exclusion from heavy livestock rangelands affects vegetation cover and soil properties in natural ecosystems of southeastern Iran. Ecol. Eng. 2016, 95, 10–18. [Google Scholar] [CrossRef]
  33. Inderjit. Plant invasions: Habitat invasibility and dominance of invasive plant species. Plant Soil 2005, 277, 1–5. [Google Scholar] [CrossRef]
  34. Liu, M.; Liu, G.; Wu, X.; Wang, H.; Chen, L. Vegetation traits and soil properties in response to utilization patterns of grassland in Hulun Buir City, Inner Mongolia, China. Chin. Geogr. Sci. 2014, 24, 471–478. [Google Scholar] [CrossRef]
  35. Yuan, J.; Li, H.; Yang, Y. The compensatory tillering in the forage grass Hordeum brevisubulatum after simulated grazing of different severity. Front. Plant Sci. 2020, 11, 792. [Google Scholar] [CrossRef] [PubMed]
  36. Qin, R.; Wang, X. Effects of crown height on the compensatory growth of Italian ryegrass based on combined effects of stored organic matter and cytokinin. Grassl. Sci. 2020, 66, 29–39. [Google Scholar] [CrossRef]
  37. Wang, C.T.; Long, R.J.; Wang, Q.L.; Jing, Z.C.; Shi, J.J. Changes in plant diversity, biomass and soil C, in alpine meadows at different degradation stages in the headwater region of three rivers, China. Land Degrad. Dev. 2009, 20, 187–198. [Google Scholar] [CrossRef]
  38. Zechmeister-Boltenstern, S.; Keiblinger, K.M.; Mooshammer, M.; Peñuelas, J.; Richter, A.; Sardans, J.; Wanek, W. The application of ecological stoichiometry to plant–microbial–soil organic matter transformations. Ecol. Monogr. 2015, 85, 133–155. [Google Scholar] [CrossRef]
  39. Malhotra, H.; Vandana; Sharma, S.; Pandey, R. Phosphorus nutrition: Plant growth in response to deficiency and excess. In Plant Nutrients and Abiotic Stress Tolerance; Hasanuzzaman, M., Fujita, M., Oku, H., Nahar, K., Hawrylak-Nowak, B., Eds.; Springer: Singapore, 2018; pp. 171–190. [Google Scholar]
  40. Elser, J.J.; Fagan, W.F.; Kerkhoff, A.J.; Swenson, N.G.; Enquist, B.J. Biological stoichiometry of plant production: Metabolism, scaling and ecological response to global change. New Phytol. 2010, 186, 593–608. [Google Scholar] [CrossRef]
  41. Song, S.; Wang, X.; He, C.; Chi, Y. Effects of Utilization Methods on C, N, P Rate and Enzyme Activity of Artificial Grassland in Karst Desertification Area. Agronomy 2023, 13, 1368. [Google Scholar] [CrossRef]
  42. Yu, Q.; Chen, Q.S.; Elser, J.J.; He, N.P.; Wu, H.H.; Zhang, G.M.; Wu, J.G.; Bai, Y.F.; Han, X.G. Linking stoichiometric homoeostasis with ecosystem structure, functioning and stability. Ecol. Lett. 2010, 13, 1390–1399. [Google Scholar] [CrossRef]
  43. Cheng, J.; Jing, G.; Wei, L.; Jing, Z. Long-term grazing exclusion effects on vegetation characteristics, soil properties and bacterial communities in the semi-arid grasslands of China. Ecol. Eng. 2016, 97, 170–178. [Google Scholar] [CrossRef]
  44. Ayres, E.; Steltzer, H.; Simmons, B.L.; Simpson, R.T.; Steinweg, J.M.; Wallenstein, M.D.; Mellor, N.; Parton, W.J.; Moor, J.C.; Wall, D.H. Home-field advantage accelerates leaf litter decomposition in forests. Soil Biol. Biochem. 2009, 41, 606–610. [Google Scholar] [CrossRef]
  45. Wardle, D.A.; Bardgett, R.D.; Klironomos, J.N.; Setala, H.; Van Der Putten, W.H.; Wall, D.H. Ecological linkages between aboveground and belowground biota. Science 2004, 304, 1629–1633. [Google Scholar] [CrossRef] [PubMed]
  46. Van der Putten, W.H.; Bardgett, R.D.; Bever, J.D.; Bezemer, T.M.; Casper, B.B.; Fukami, T.; Wardle, D.A. Plant–soil feedbacks: The past, the present and future challenges. J. Ecol. 2013, 101, 265–276. [Google Scholar] [CrossRef]
  47. McGroddy, M.E.; Daufresne, T.; Hedin, L.O. Scaling of C:N:P stoichiometry in forests worldwide: Implications of terrestrial redfield-type ratios. Ecology 2004, 85, 2390–2401. [Google Scholar] [CrossRef]
  48. Yu, Y.C.; Yang, J.Y.; Zeng, S.C.; Wu, D.M.; Jacobs, D.F.; Sloan, J.L. Soil pH, organic matter, and nutrient content change with the continuous cropping of Cunninghamia lanceolata plantations in South China. J. Soils Sediments 2017, 17, 2230–2238. [Google Scholar] [CrossRef]
  49. Filser, J.; Faber, J.H.; Tiunov, A.V.; Brussaard, L.; Frouz, J.; De Deyn, G.; Uvarov, A.V.; Berg, M.P.; Lavelle, P.; Loreau, M.; et al. Soil fauna: Key to new carbon models. Soil 2016, 2, 565–582. [Google Scholar] [CrossRef]
  50. Liu, T.Y.; Zhou, T.C.; Sun, J.; Wang, Y.; Ye, C.C. Distribution and coupling characteristics of plant nitrogen and phosphorus along desertification gradients in alpine meadows, eastern Tibet Plateau. Pratacultural. Sci. 2021, 38, 209–220. [Google Scholar]
  51. Hati, K.M.; Swarup, A.; Mishra, B.; Manna, M.C.; Wanjari, R.H.; Mandal, K.G.; Misra, A.K. Impact of long-term application of fertilizer, manure and lime under intensive cropping on physical properties and organic carbon content of an Alfisol. Geoderma 2008, 148, 173–179. [Google Scholar] [CrossRef]
  52. Yang, P.N.; Li, X.L.; Li, C.Y.; Duan, C.W. Response of Soil Microbial Diversity to Long-term Enclosure in Degraded Patches of Alpine Meadow in the Source Zone of the Yellow River. Huan Jing Ke Xue = Huanjing Kexue 2023, 44, 2293–2303. [Google Scholar]
Figure 1. Sample landscape display.
Agronomy 13 02781 g001
Figure 2. Total carbon content of different functional groups in plants. (a) Total carbon content of grasses, sedges, legumes, and forbs. (b) Total carbon content of plant litter and plant roots. Different lowercase letters in the same column show significant differences (p < 0.05).
Agronomy 13 02781 g002
Figure 3. Total nitrogen content of different functional groups in plants. (a) Total nitrogen contents of grasses, sedges, legumes, and forbs. (b) Total nitrogen contents of plant litter and plant roots. Different lowercase letters in the same column show significant differences (p < 0.05).
Agronomy 13 02781 g003
Figure 4. Total phosphorus content of different functional groups in plants. (a) Total phosphorus content of grasses, sedges, legumes, and forbs. (b) Total phosphorus contents of plant litter and plant roots. Different lowercase letters in the same column show significant differences (p < 0.05).
Agronomy 13 02781 g004
Figure 5. Plant community diversity index and biomass of different functional groups. (a) Plant community diversity index, (b) Aboveground biomass of grasses, sedges, legumes, and forbs, (c) Belowground biomass of plant communities, and (d) Plant litter content (AGB = aboveground biomass, and BGB = belowground biomass). Different lowercase letters in the same column show significant differences (p < 0.05).
Agronomy 13 02781 g005
Figure 6. Correlation between plant carbon, nitrogen, and phosphorus contents and aboveground and belowground biomass with different exclosure years. PAGB, CpAGB, LAGB, OAGB, and PlAGB represent the aboveground biomass of grasses, sedges, legumes, forbs, and plant litters, respectively. BGB represents belowground biomass. * indicates p < 0.05, ** indicates p < 0.01, *** indicates p < 0.001.
Agronomy 13 02781 g006
Figure 7. RDA analysis of soil physical and chemical properties and vegetation characteristics at different exclosure durations. Figure (af) represent the RDA analysis of carbon, nitrogen and phosphorus content and soil physicochemical properties of grasses, sedges, legumes, forbs, plant litter and root, respectively, and (g) represents the RDA analysis of soil physicochemical properties of plant biomass. The carbon, nitrogen, and phosphorus contents of gramineous plants are represented by PC, PN, and PP, respectively. Similarly, the carbon, nitrogen, and phosphorus contents of Cyperaceae plants are represented by CpC, CpN, and CpP, respectively. The carbon, nitrogen, and phosphorus contents of legumes are represented by LC, LN, and LP, respectively. The contents of carbon, nitrogen, and phosphorus in miscellaneous plants are represented by OC, ON, and OP, respectively. PAGB, CpAGB, LAGB, OAGB, and PlAGB represent the aboveground biomass of grasses, sedges, legumes, forbs, and plant litters, respectively. BGB represents belowground biomass. The contents of carbon, nitrogen, and phosphorus in plant litter are represented by plC, PlN, and PlP, respectively. RC, RN, and RP represent the content of carbon, nitrogen, and phosphorus in plant roots, respectively. NH4+−N represents ammonium nitrogen content, and NO3−N represents nitrate nitrogen content.
Agronomy 13 02781 g007aAgronomy 13 02781 g007b
Table 1. Location, elevation, and main composition of plant community of each plot.
Exclosure DurationPlot LocationElevation/mPatch NumbersPatch Density (Area Ratio)/%The Main Composition of Plant Community
GE 101°46′06″,
N 34°41′02″
36101086.4541.64Elymus nutans Griseb., Koeleria cristata L., Kobresia pygmaea Willd., Ligularia virgaurea, Gentiana scabra Bunge, Pedicularis spicata, Oxytropis ochrocephala, Carun buriaticum, Gentiana macrophylla Pall., and Taraxacum officinalis
E1E 101°46′08″,
N 34°41′04″
3610989.5236.41Poa annua L., Elymus nutans Griseb., Kobresia pygmaea Willd., Koeleria cristata L., Potentilla anserina, Pedicularis spicata, Saussurea pulchra, Gentiana scabra Bunge, and Ligularia virgaurea
E4E 101°46′10″,
N 34°41′06″
3610536.7118.63Elymus nutans Griseb., Poa annua L., Koeleria cristata L., Potentilla anserina, Ajania tenuifolia, Astragalus sp., and Gentiana scabra Bunge
E10E 101°26′34″,
N 34°18′36″
3720331.816.67Elymus nutans Griseb., Poa annua L., Koeleria cristata L., Carex L., Potentilla anserina, and Gentiana scabra Bunge
Table 2. Results of ANOVA on the characteristics of main functional groups of plants.
Group/TypedfF (C)F (N)F (P)F (AGB)F (Index)
Grasses317.52 **12.45 **8.64 **8.92 **
Sedges34.60 *2.75 ns2.34 ns3.80 *
Legumes312.64 **21.26 **39.20 **2.47 ns
Forbs314.50 **11.92 **12.15 **10.3 **
Plant litter320.01 **3.95 *5.11 **82.94 **
Root31.87 ns6.79 **3.96 *7.16 **
D3 37.63 **
H332.70 **
E338.80 **
** Extremely significant difference (p < 0.01), * significant difference (p < 0.05), ns means no significant difference. In the table, grasses mean Poaceae family, sedges mean Cyperaceae family, legumes mean Fabaceae family, and forbs mean herbaceous plants from different families.
Table 3. Results of analysis of variance of carbon, nitrogen, and phosphorus stoichiometry of main functional groups of plants.
Group/TypedfF (C/N)F (C/P)F (N/P)
Grasses39.61 **11.05 **1.61 ns
Sedges32.69 ns2.96 ns3.85 *
Legumes310.32 **43.60 **65.73 **
Forbs314.07 **13.57 **1.24 ns
Plant litter31.64 ns1.65 ns1.80 ns
Root30.56 ns0.40 ns1.06 ns
** Extremely significant difference (p < 0.01), * significant difference (p < 0.05), ns means no significant difference. In the table, grasses mean Poaceae family, sedges mean Cyperaceae family, legumes mean Fabaceae family, and forbs mean herbaceous plants from different families.
Table 4. Carbon–nitrogen ratio of plants in different functional groups.
Exclosure DurationGrassesSedgesLegumesForbsPlant LitterRoot
G40.50 ± 3.43 a28.85 ± 0.77 a17.78 ± 0.59 b30.14 ± 0.64 a28.21 ± 0.79 a39.22 ± 2.88 a
E135.11 ± 2.59 a29.50 ± 0.40 a16.72 ± 0.40 bc30.52 ± 0.83 a27.32 ± 0.66 a40.24 ± 3.19 a
E428.41 ± 0.79 b30.71 ± 0.10 a16.19 ± 0.20 c26.80 ± 0.16 b28.30 ± 0.42 a38.96 ± 1.59 a
E1024.84 ± 1.07 b27.42 ± 1.43 a18.98 ± 0.21 a24.40 ± 1.13 c26.74 ± 0.35 a35.61 ± 2.85 a
Different lowercase letters in the same column show significant differences (p < 0.05).
Table 5. Carbon–phosphorus ratio of different functional groups of plants.
Exclosure DurationGrassesSedgesLegumesForbsPlant LitterRoot
G313.89 ± 19.97 a275.68 ± 12.33 a244.64 ± 5.12 a233.21 ± 10.25 a257.71 ± 2.53 a344.54 ± 30.73 a
E1309.91 ± 9.49 a286.21 ± 7.78 a250.81 ± 7.72 a255.60 ± 6.68 a272.99 ± 6.95 a363.32 ± 24.97 a
E4231.19 ± 6.17 b250.16 ± 2.01 a205.20 ± 9.16 b199.17 ± 4.90 b258.39 ± 0.42 a331.79 ± 8.11 a
E10225.76 ± 17.76 b271.89 ± 9.65 a155.60 ± 2.69 c190.83 ± 9.70 b260.59 ± 8.33 a338.33 ± 14.65 a
Different lowercase letters in the same column show significant differences (p < 0.05).
Table 6. Ratios of nitrogen to phosphorus in different functional groups of plants.
Exclosure DurationGrassesSedgesLegumesForbsGrassesRoot
G7.87 ± 0.46 a9.62 ± 0.59 a13.80 ± 0.25 b7.74 ± 0.32 a9.17 ± 0.30 a8.82 ± 0.63 a
E19.00 ± 0.52 a9.71 ± 0.30 a15.02 ± 0.48 a8.39 ± 0.22 a10.04 ± 0.43 a9.09 ± 0.33 a
E48.15 ± 0.16 a8.14 ± 0.05 b12.66 ± 0.48 c7.43 ± 0.18 a9.14 ± 0.13 a8.55 ± 0.21 a
E109.12 ± 0.66 a10.02 ± 0.54 a8.20 ± 0.13 d7.91 ± 0.58 a9.76 ± 0.39 a9.72 ± 0.63 a
Different lowercase letters in the same column show significant differences (p < 0.05).
Disclaimer/Publisher’s Note: The statements, opinions and data contained in all publications are solely those of the individual author(s) and contributor(s) and not of MDPI and/or the editor(s). MDPI and/or the editor(s) disclaim responsibility for any injury to people or property resulting from any ideas, methods, instructions or products referred to in the content.

