Article

Responses of Soil Bacterial Communities and Chemical Properties to Grazing Regulation in Desert Steppe

1
Yinshanbeilu Grassland Eco-Hydrology National Observation and Research Station, China Institute of Water Resources and Hydropower Research, Beijing 100038, China
2
College of Resources and Environmental Economics, Inner Mongolia University of Finance and Economics, Hohhot 010070, China
3
Department of Sediment Research, China Institute of Water Resources and Hydropower Research, Beijing 100048, China
4
Institute of Water Resources for Pastoral Area, Ministry of Water Resources, Hohhot 010020, China
*
Author to whom correspondence should be addressed.
Agronomy 2023, 13(11), 2817; https://doi.org/10.3390/agronomy13112817
Submission received: 17 October 2023 / Revised: 6 November 2023 / Accepted: 13 November 2023 / Published: 15 November 2023
(This article belongs to the Special Issue Grassland and Pasture Ecological Management and Utilization)

Abstract

:
Due to the region’s social economy and historical culture, rough grazing has led to unresolved grassland-based ecological problems in Northern China. Soil microorganisms are essential structural and functional components of underground ecosystems, and the effects of various grazing intensities on the physicochemical properties and bacterial communities of soil are unclear. A stocking density regulation experiment was carried out in the desert steppe of the Inner Mongolia Autonomous Region. In the study area, four grazing intensities were set, namely, the enclosure control group (CK), light grazing, moderate grazing, and heavy grazing. Field investigations and 16S rRNA sequencing were used to compare and analyze the characteristics of soil bacterial community structures and their correlations with soil nutrient factors under different grazing intensities. The experiment showed the following results: (1) The Shannon, Simpson, and Pielou indices of the light grazing group were significantly higher than those of the CK (p < 0.05), and the indices of the moderate and heavy grazing groups were lower than those of the CK, but the difference was not significant, and there were no significant differences in the Chao1 index between each group. (2) Acidobacteria, Actinobacteria, Proteobacteria, and Chloroflexi were the main bacterial phyla. (3) With the exception of soil organic matter and available potassium, which had significant negative correlations with the Shannon index (p < 0.05), other soil factors had no significant correlation with the soil bacterial diversity. (4) The contents of soil organic matter, total phosphorus, alkali-hydrolyzed nitrogen, available phosphorus, and available potassium influenced the differences between soil bacterial communities under different grazing intensities.

1. Introduction

Soil microorganisms commonly participate in natural energy flows and material cycles, while their microbial diversity boosts the versatility of terrestrial ecosystems because of these microorganisms’ large populations and wide distributions [1]. Soil microbes have wide-ranging distributions and functions, meaning that their diversity maintenance mechanisms and responses to environmental changes have been widely studied in the field of ecological restoration [2,3]. Soil microbes are sensitive to both natural climate change and anthropogenic land use change, with both processes having a great impact on their community structure and diversity [4].
Grasslands play an irreplaceable ecological role in soil conservation, climate regulation, and biodiversity maintenance in the construction and protection of ecological environments [5,6], and grassland environments account for more than 40% of the land area of China [7]. Desert steppe, as one of the most important land types in Northwestern China, also supports local animal husbandry practices. However, due to the long-term high intensity grazing and human exploitation of this environment, many of the desert steppes have been significantly degraded [8]. The main manifestations of degradation are desertification, soil fertility reduction, a decrease in biodiversity and a decline in soil health [9]. The safety of the ecological environment and the sustainability of livestock husbandry are seriously threatened in China. In order to reverse these trends, measures for ecologically managing grassland, such as enclosure and the prohibition of grazing, thus returning farmland to grassland, and transplanting and replanting trees, have been employed, and these measures have achieved obvious improvements in the health of ecosystems [10]. However, most of these measures require years to deliver positive results, and the process of natural recovery is relatively slow, which somewhat limits the productive capacity of grasslands. Therefore, on the premise of achieving ecological governance objectives, many scholars have considered how to sustainably develop animal husbandry and create scientific grazing methods that maximize productive potential while ensuring ecological security.
The study of the influence of grazing on grassland ecosystems has mostly focused on the physical and chemical properties of soil, and there are many indices of these properties which can reflect soil conditions. Soil microorganisms are an important group to study as they are highly sensitive to environmental changes. They can be used as characteristic factors to evaluate and regulate the health of soil ecosystems [11]. It is generally believed that grazing reduces the biomass and diversity of plants and has a negative impact on the microbial community, but the input of manure can also introduce and stimulate some microbial populations. Therefore, we hypothesized that (1) grazing reduced soil microbial diversity compared to the level of diversity present in enclosed grassland, (2) the stocking density had a significant effect on the soil microbial community, and (3) changes in the soil microbial community were closely related to changes in the physical and chemical properties of soil caused by grazing. In addition, the study of the multi-layer correlation between the microbial community, the physical and chemical properties of soil, and the stocking density can help researchers to understand the effects of grazing on soil ecosystems with regard to material transfer, which could provide a scientific basis for guiding the regulation of grazing and support research into the microbial measures of ecological restoration and protection of grassland environments.

2. Material and Methods

2.1. Study Site

The study site was located in Siziwang County (41°46′43″ N, 111°54′52″ E) in Ulanqab, Inner Mongolia Autonomous Region. The area is characterized by a mid-temperate continental climate, the site’s altitude is 1459 m, the average annual temperature is 3–4 °C, the average annual rainfall is 240–320 mm, and the average annual evaporation rate is 2900–3000 mm. The frost-free period lasts for about 108 days. The study area was located in a desert steppe environment, where Stipa breviflora Griseb. was a group species and Artemisia frigida Willd. and Cleistogenes songorica Roshev. were dominant species, and the main soil type was sandy chestnut soil.

2.2. Sampling

Based on the grazing control experimental plots set up in 2002, the sampling areas for each group were established, having stocking densities of 0, 0.80, 1.92, and 2.71 [sheep/(hm2·a)], respectively. These groups were referred to as the fencing-in group (CK), light grazing group (LG), medium grazing group (MG), and heavy grazing group (HG), respectively. The grazing period took place from June to December per year. There were three repeated plots of 4.40 hm2 for each treatment group, resulting in a total of 12 plots.
Sample collections were conducted in December 2022, which represented the end of the grazing period. The soil samples were collected in 0–10 cm soil layers from each plot following the removal of loose litter, herbs, and a humus layer. A random sampling method was adopted to collect soil samples in each plot. Every three soil samples were mixed into one composite sample, and for each plot, three repeated composite samples were tested. These samples were put into sealed bags and numbered. The 36 soil samples were kept in a portable incubator at 4 °C for less than 8 h, before being stored at −80 °C. Each sample was divided into two parts to allow us to analyze the soil’s chemical properties and bacterial community structure.

2.3. Soil Chemical Properties Analysis

Roots and stone debris were removed from the air-dried soil samples. The presence of soil organic matter (SOM) was determined via potassium dichromate oxidation [12]; the contents of total nitrogen (TN) and alkali-hydrolyzed nitrogen (AN) were determined via the Kjeldahl nitrogen determination and alkali-hydrolytic diffusion methods, respectively [13]; and the contents of soil total phosphorus (TP) and available phosphorus (AP) were determined via molybdenum-antimony and scandium colorimetry, respectively [14]. The contents of oil total potassium (TK) and available potassium (AK) were determined via the alkaline melting and ammonium acetate extraction methods [15], respectively.

2.4. Molecular Characterization of the Soil Bacteria

The composite soil samples were thoroughly mixed before DNA extraction took place. Next, 2 g soil was used to extract DNA via a Powersoil DNA Isolation Kit (MoBio, Carlsbad, CA, USA) [16]. The V3–V4 regions of the 16S rRNA gene were amplified using the primers 338F: ACTCCTACGGGAGGCAGCAG and 806R: GGACTACHVGGGTWTCTAAT. The PCR products were mixed and tested via 2% agarose gel electrophoresis. The PCR products were gelled and recovered using an AxyPrep DNA Gel Extraction Kit (AXYGEN, Corning, NY, USA). The qualified PCR products were used to construct and sequence the Illumina Miseq library, with this step being carried out by Allwegene Technology Inc., Beijing, China.
The original sequences were double-ended sequence data. We filtered the sequences with read tail mass values of less than 20. We set a window of 50 bp: if the average mass value in the window was lower than 20, the back-end bases were cut off from the window, and the reads below 50 bp were filtered following a quality control procedure. Then, we used the overlap of PE sequencing to merge pairs of sequences into a single sequence. After this step, the raw tag data were obtained upon removing the barcode and primer and performing splicing, and the high-quality sequence clean tags were obtained after further removing the chimeric and short sequences. To minimize the sample variation-related error and maximize sample coverage, the data sizes of all samples were homogenized to 16,104 sequences. The remaining sequences were classified as an operational classification unit (OTU) using Uclust (Version 1.2.22, http://www.drive5.com/uclust/downloads1_2_22q.html, accessed on 15th December 2022), with all sequences having more than 97% similarity [17].

2.5. Bioinformation Analysis and Statistical Analysis

The Chao1, Simpson, Shannon, and Pielou indices were used to characterize the diversity and evenness of the soil bacterial community, and they were computed using the vegan package in R (version 3.4.3) [18,19,20,21]. We used the nonparametric Kruskal–Wallis test to test three or more sets of data, with differential OTUs (p < 0.05), that originated from multiple larger sets of data generated in multiple biological replicates. The similarities and differences between bacterial communities were obtained via nonmetric multidimensional scaling analysis (NMDS) and analysis of similarities (ANOSIMs). The correlation between soil bacterial community and soil chemical properties was expressed on the NMDS map via envfit. The Mantel test was calculated using the Euclidian distances between the soil bacterial communities and the Bayesian distances between the soil properties of different stocking density groups. Redundancy analysis (RDA) of the correlation between soil bacteria and soil properties was performed using Canoco 5.0 for Windows. The diversity indices, the Kruskal–Wallis test and the above similarity and heterogeneity test were performed and the OTU clustering heatmap was generated via R. Other histograms were created via Origin 2022 (OriginLab Corporation, Northampton, MA, USA).
Differences in the soil properties (SOM, TN, AN, TP, AP, TK, AK) and bacterial diversity indices of the various stocking density groups were compared by performing one-way ANOVAs and post hoc Tukey tests (p < 0.05). The correlation between the soil bacterial diversity and the soil properties was tested via Pearson’s correlation coefficient. All the above-mentioned mathematical statistical analyses were conducted via SPSS 26.0 (IBM, Chicago, IL, USA).

3. Results

3.1. Soil Properties under Different Stocking Density Groups

Soil properties were affected by stocking density, but there was no significant difference between these effects (Table 1). The TN, TP, and AP contents of the grazing groups were lower than those of the fencing-in group. The contents of other soil properties were highest in the heavy grazing group and lowest in the medium grazing group.

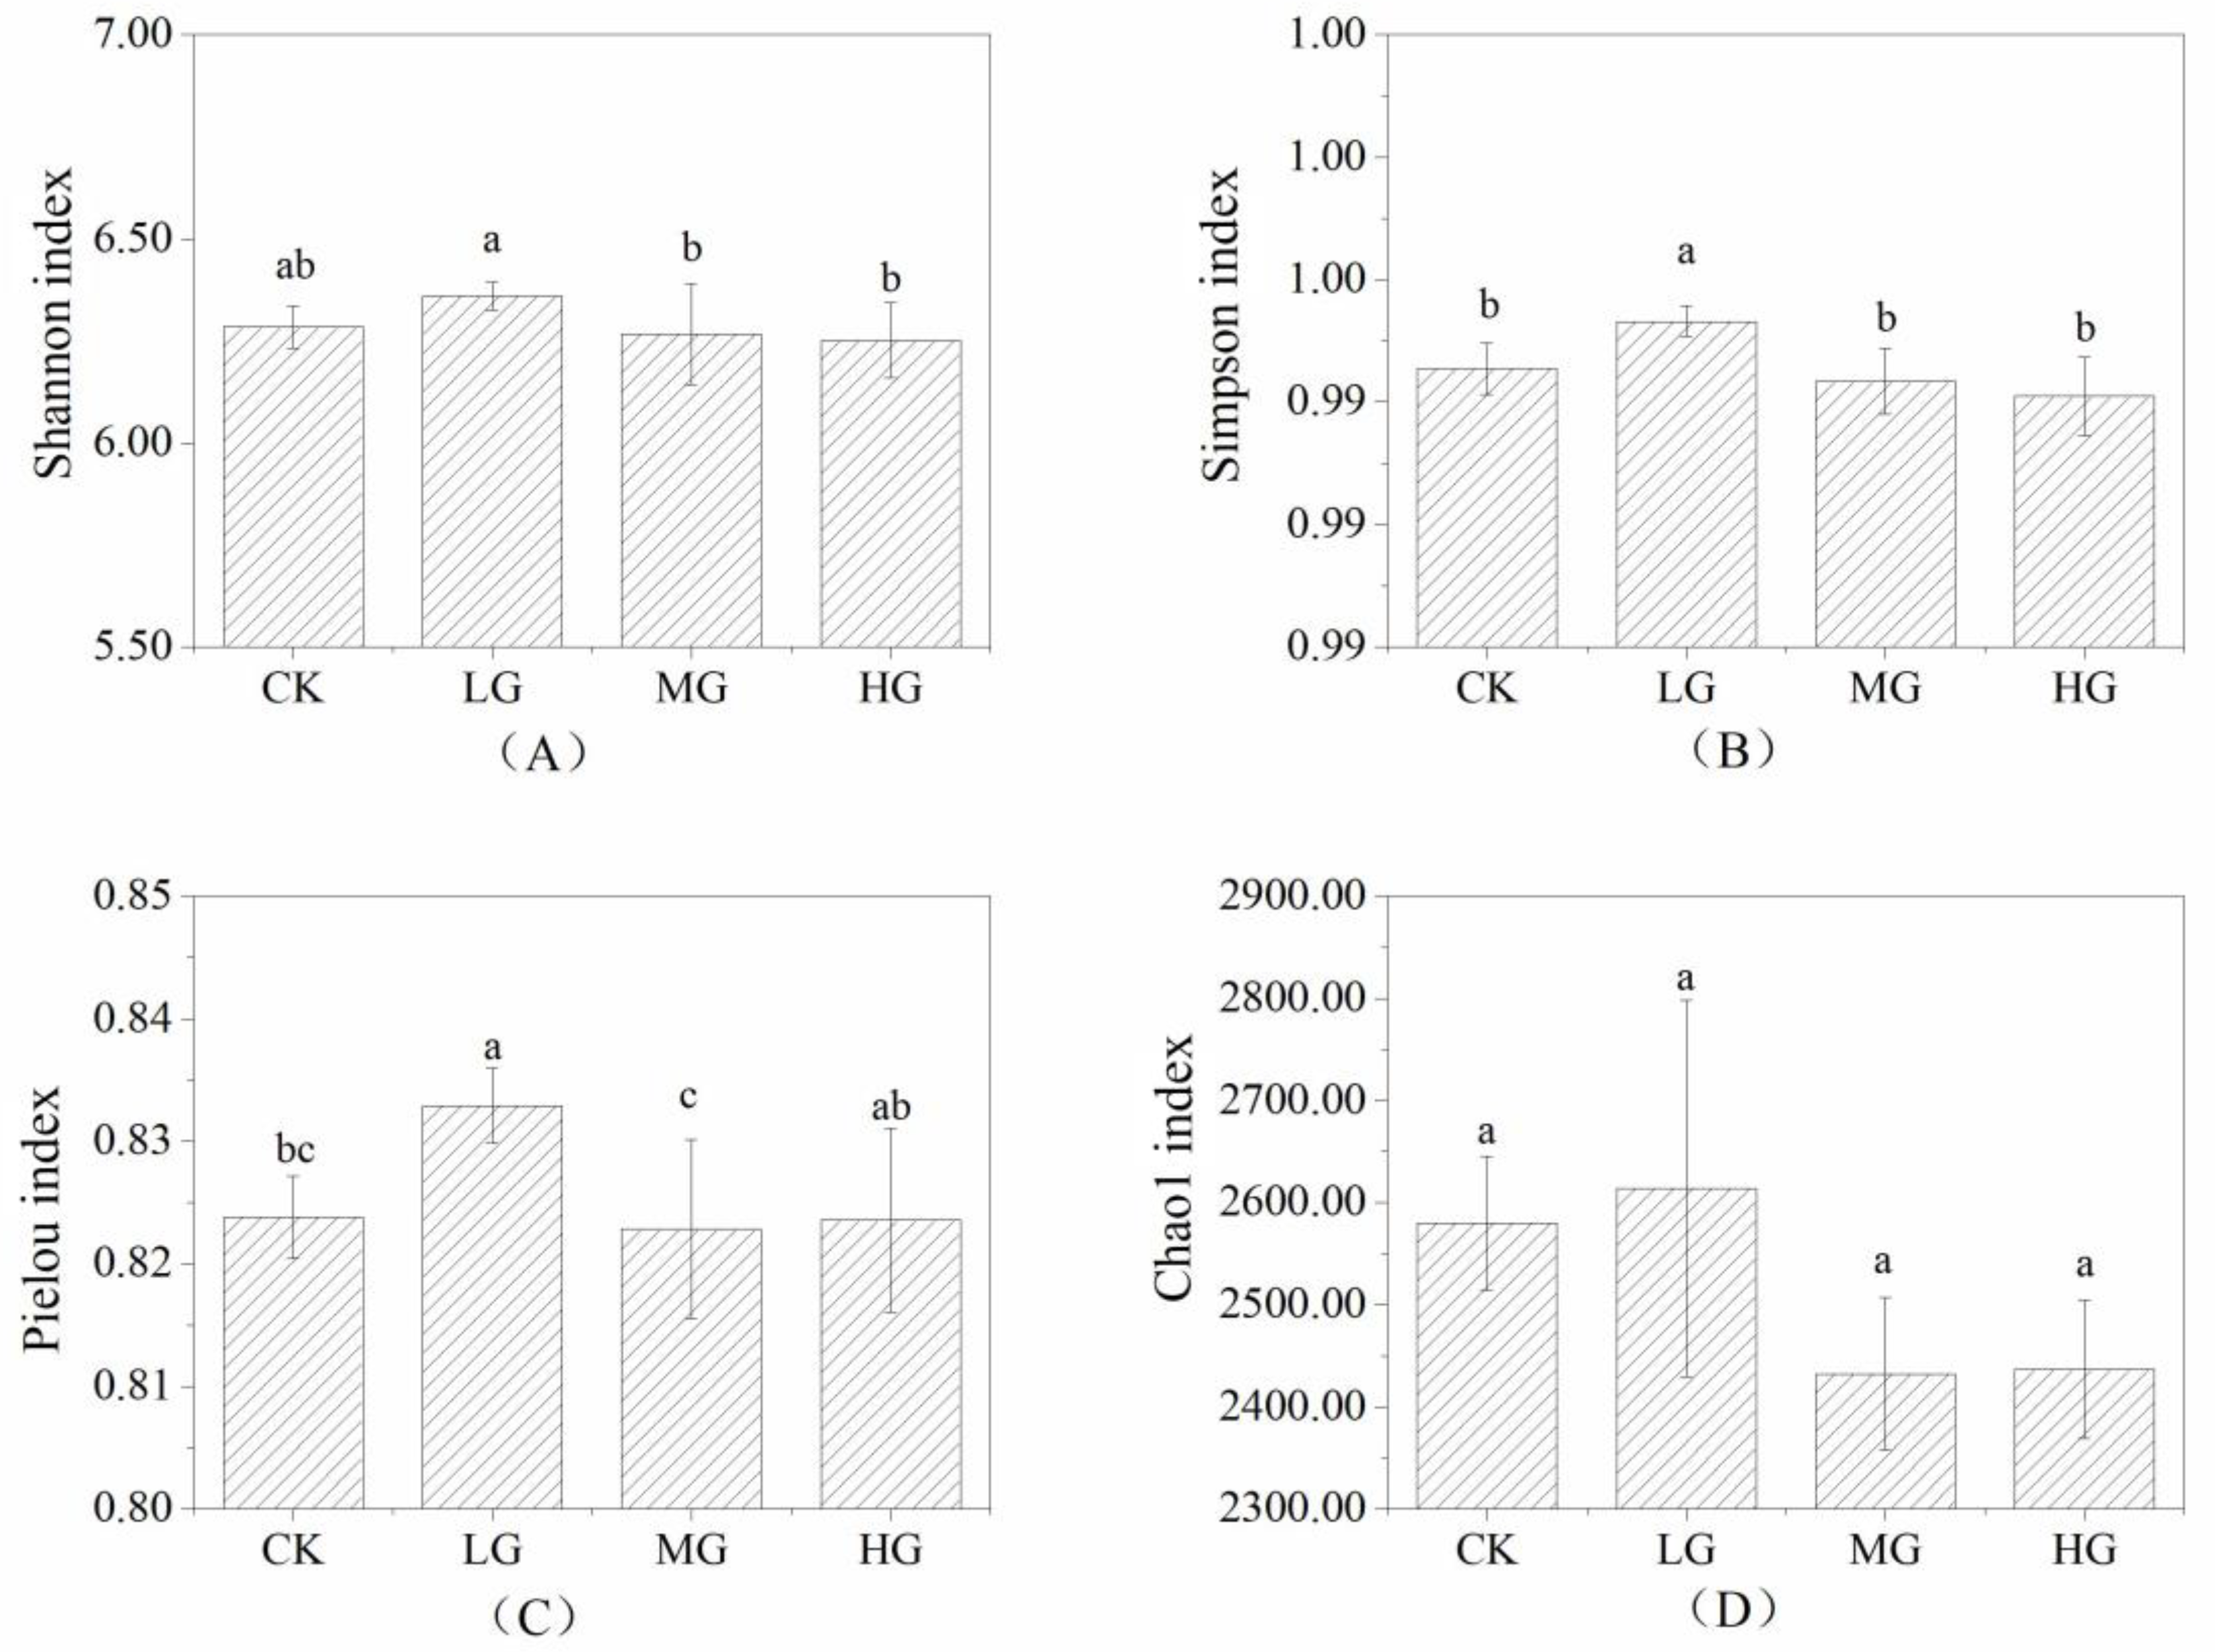
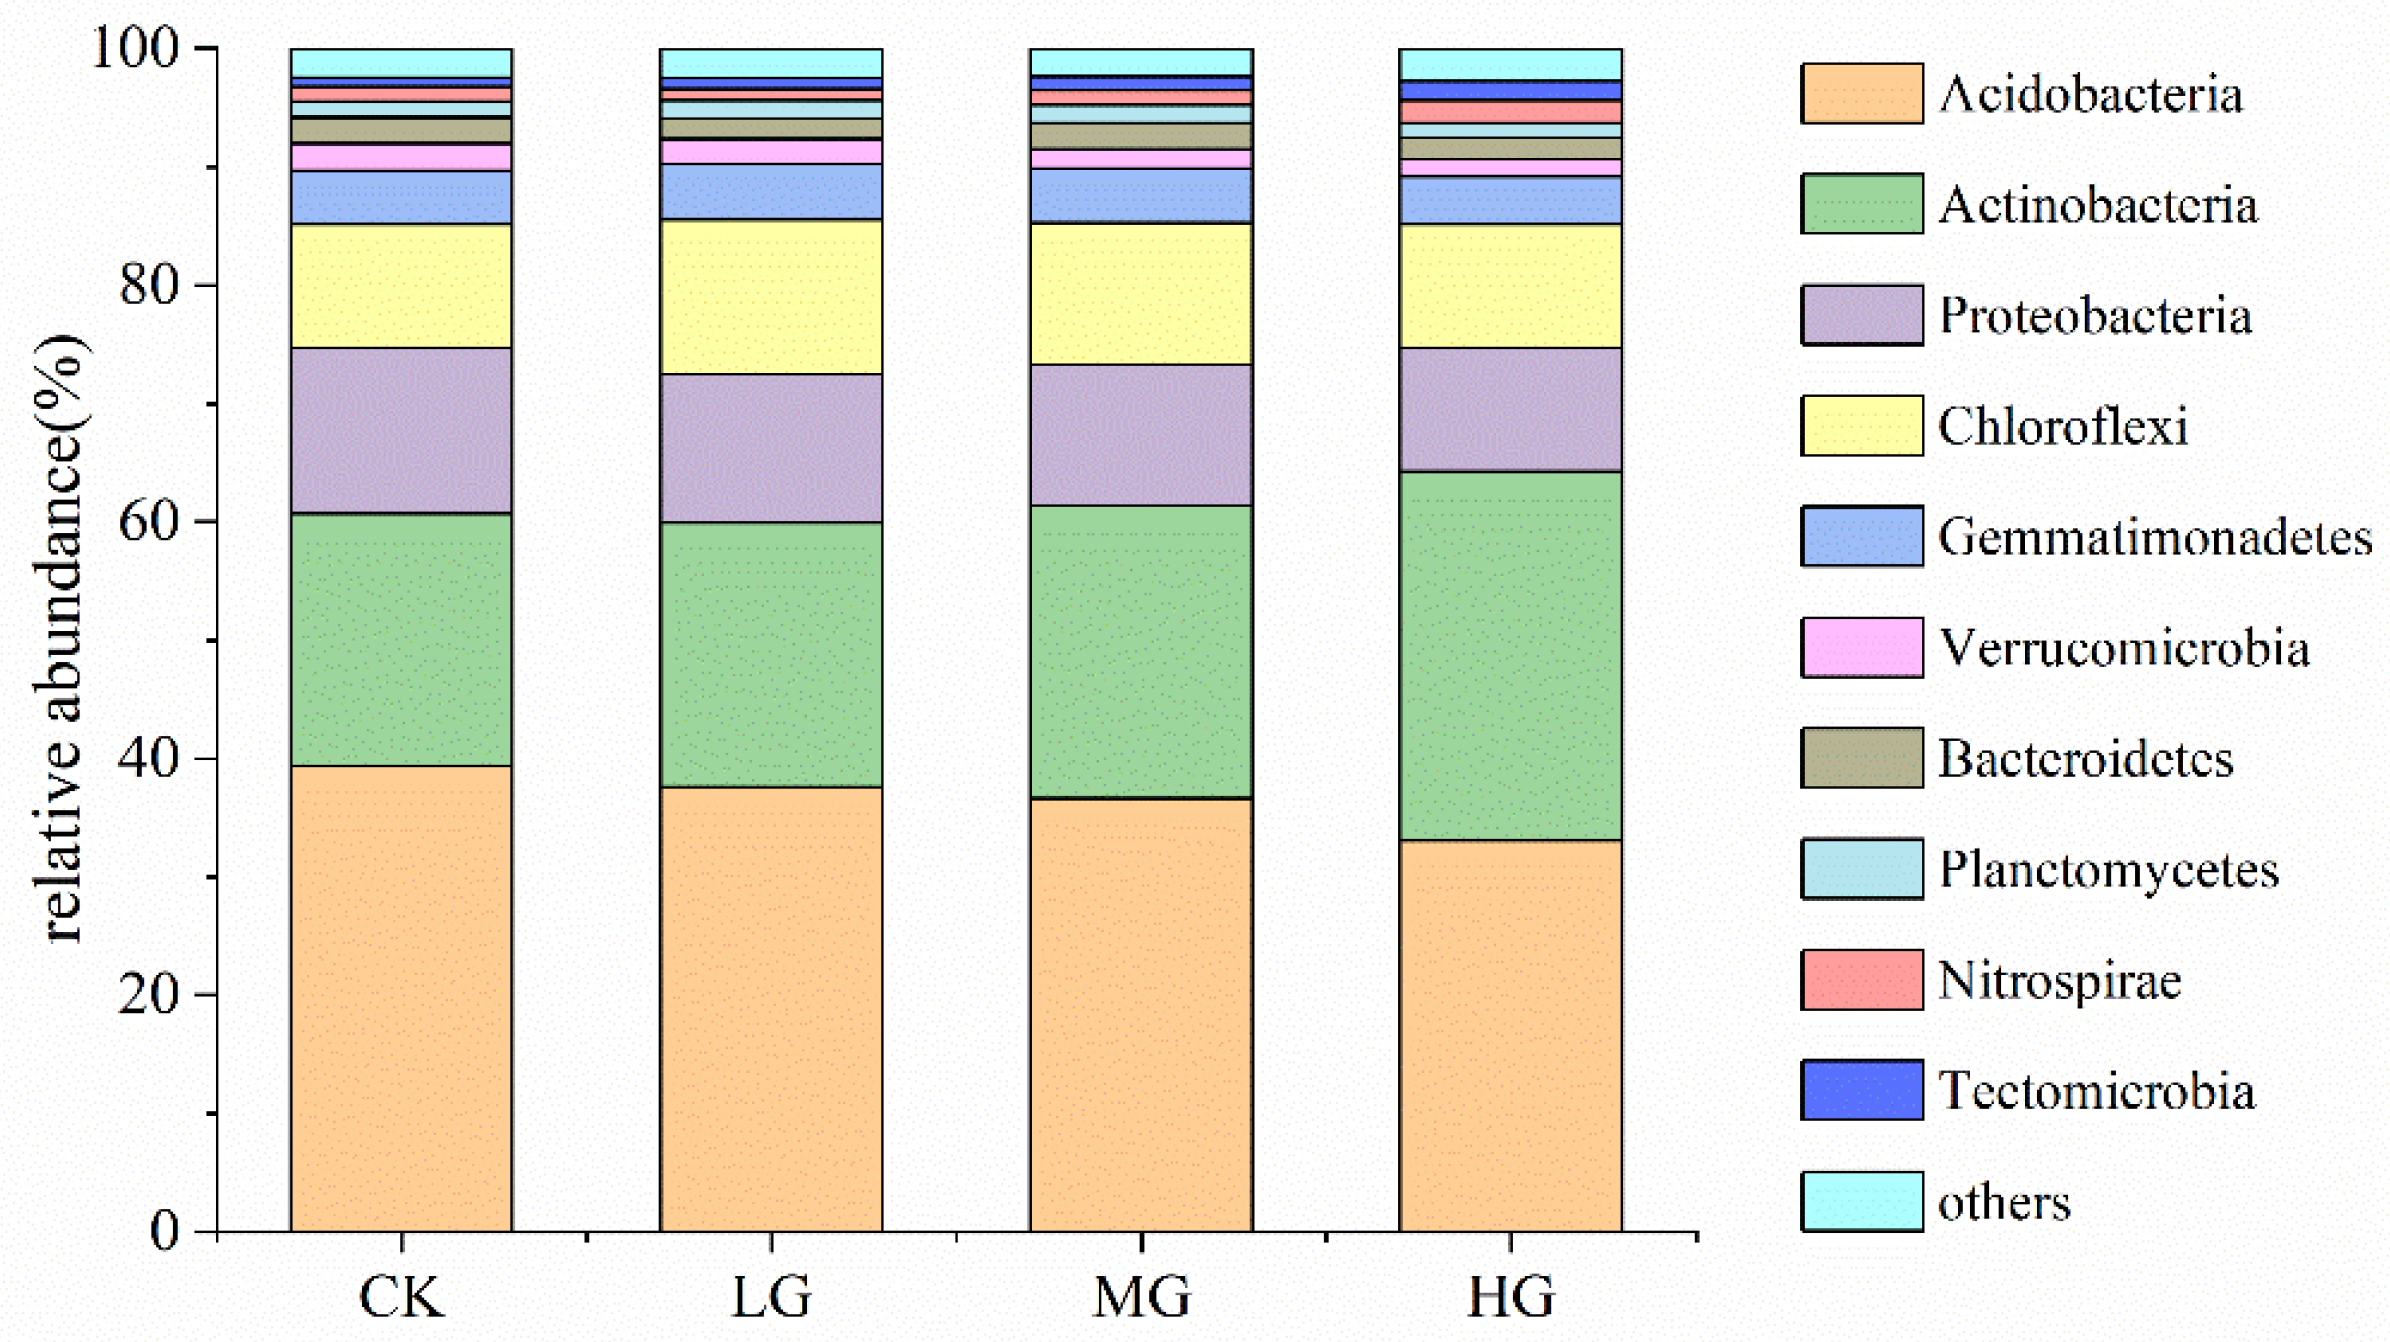
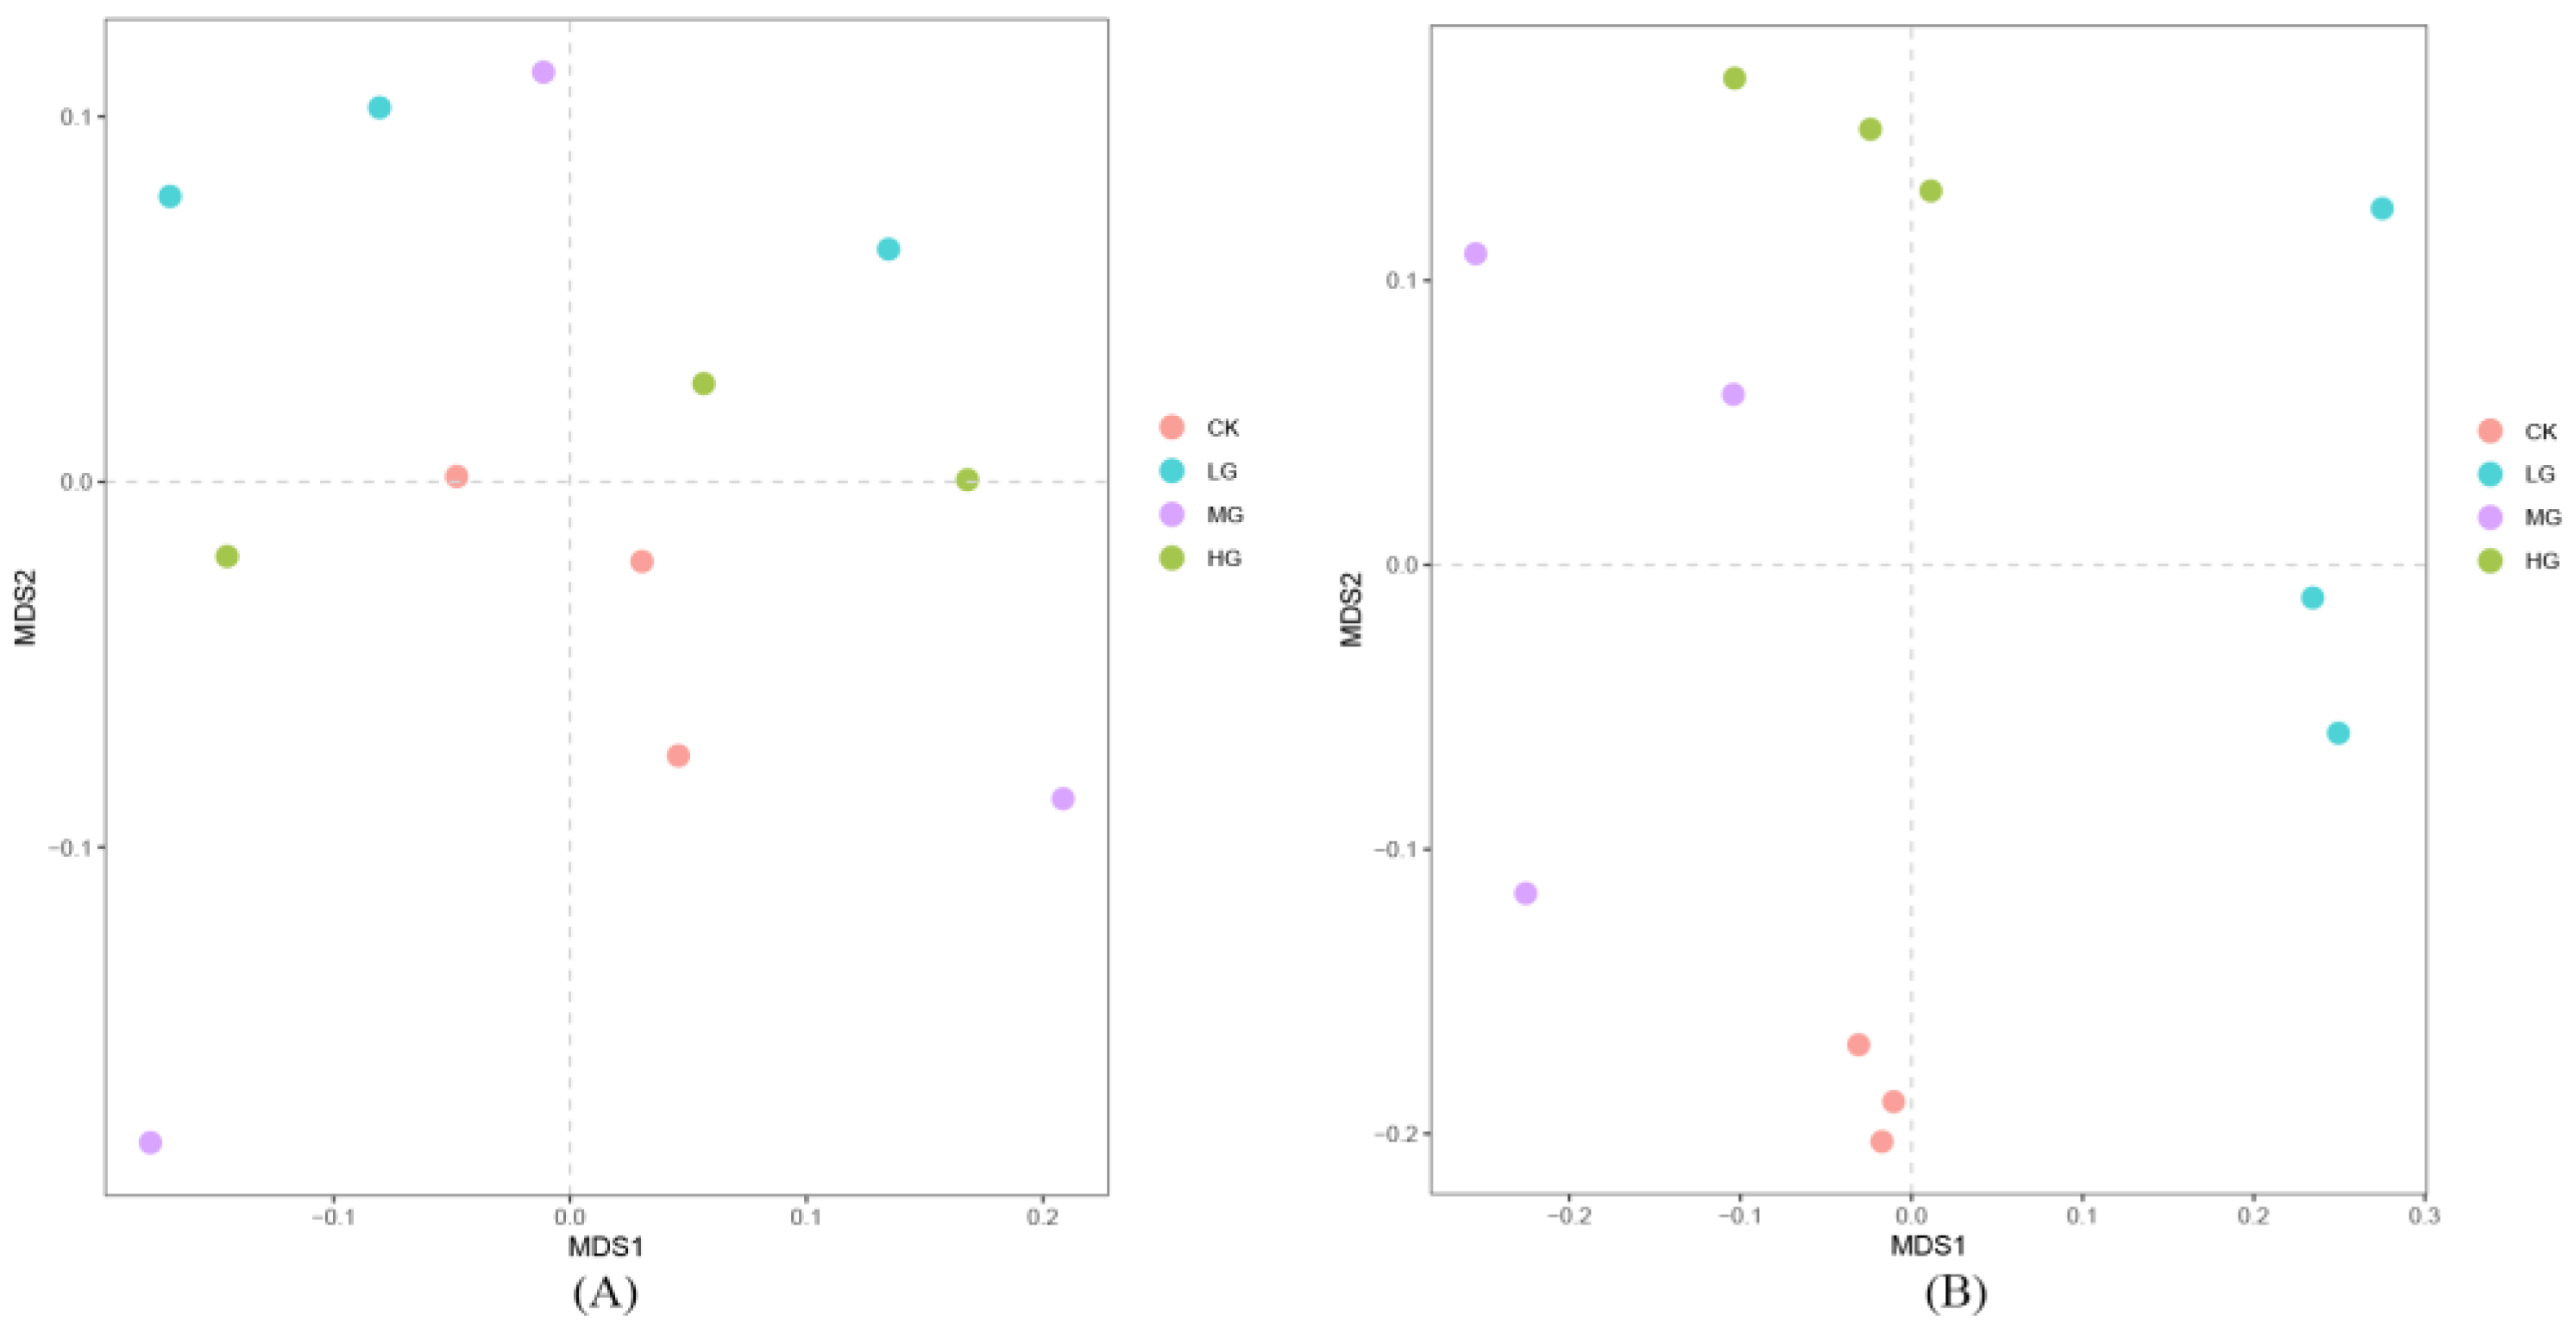
3.2. The Composition and Structure of the Soil Bacterial Community under Different Grazing Intensities

The soil bacterial diversity indices determined under different grazing intensities in the desert steppe environment are shown in Figure 1. The Shannon and Simpson indices of the light grazing group were significantly higher than those of the medium and heavy grazing groups (p < 0.05). The Pielou index of the fencing-in group was significantly lower than that of the light grazing group (p < 0.05), but there was no significant difference between the first group and the other two groups (p > 0.05). The Pielou index of the medium grazing group was significantly lower than those of the light and heavy grazing groups (p < 0.05). The values of the Chao1 index differed between the four groups, albeit not to a significant extent (p > 0.05).
A total of 4746 OTUs were collected, and they were further identified as 36 phyla, 95 classes, 116 orders, 206 families, and 277 genera. The main bacterial groups (relative abundance ≥ 1%) are shown in Figure 2. Chloroflexi, Acidobacteria, Proteobacteria, and Chloroflexi were the dominant groups. These groups had average relative abundances of 36.64% ± 2.65%, 24.89% ± 4.44%, 12.25% ± 1.48%, and 11.46% ± 1.30%, respectively. The relative abundance of Acidobacteria and Proteobacteria decreased in correlation with the increase in the stocking density, while Actinobacteria showed the opposite pattern; the relative abundance of Chloromycetes initially increased, before decreasing in correlation with the stocking density. Moreover, at the class level, the populations with the three greatest relative abundances were Blastocatellia, Subgroup_6 (belongs to Acidobacteria) and Alphaproteobacteria, while at the order level, they were Blastocatellales, Rubrobacterales, and Rhizobiales. At the family level, the populations with the three greatest relative abundances were Blastocatellaceae-Subgroup-4, Rubrobacteriaceae, and Gemmatimonadaceae, while at the genus level, they were RB41, Rubrobacter, and Krasilnikovia.
The NMDS analyses of soil bacterial communities under different grazing intensities are shown in Figure 3. As shown in Figure 3A, all the sample plots with the same color showed a state of aggregation except for the medium grazing group, although there was no obvious boundary between them. The dispersion of the medium grazing group indicated that the soil bacterial communities in this group greatly varied. The close distance between the heavy grazing group and the fencing-in group indicated that their soil bacterial compositions were more similar to one another than to those of other groups.
We used the Kruskal–Wallis test to obtain the differences in OTU levels between multiple sets of data with several biological replicates: Figure 3B shows the results of the NMDS analyses of the differential OTUs in each group determined via the Kruskal–Wallis test. Each group was separated from the others, indicating that their differential OTUs had great heterogeneity. The distance between the plots in the medium grazing group was still large, indicating that the variation in the OTUs between the plots in the same group was great; this result was consistent with the rule outlined in Figure 3A, given the overall situation. In the fencing-in group, the plots had stronger cohesion, indicating that the differential OTUs in this group did not undergo significant change.

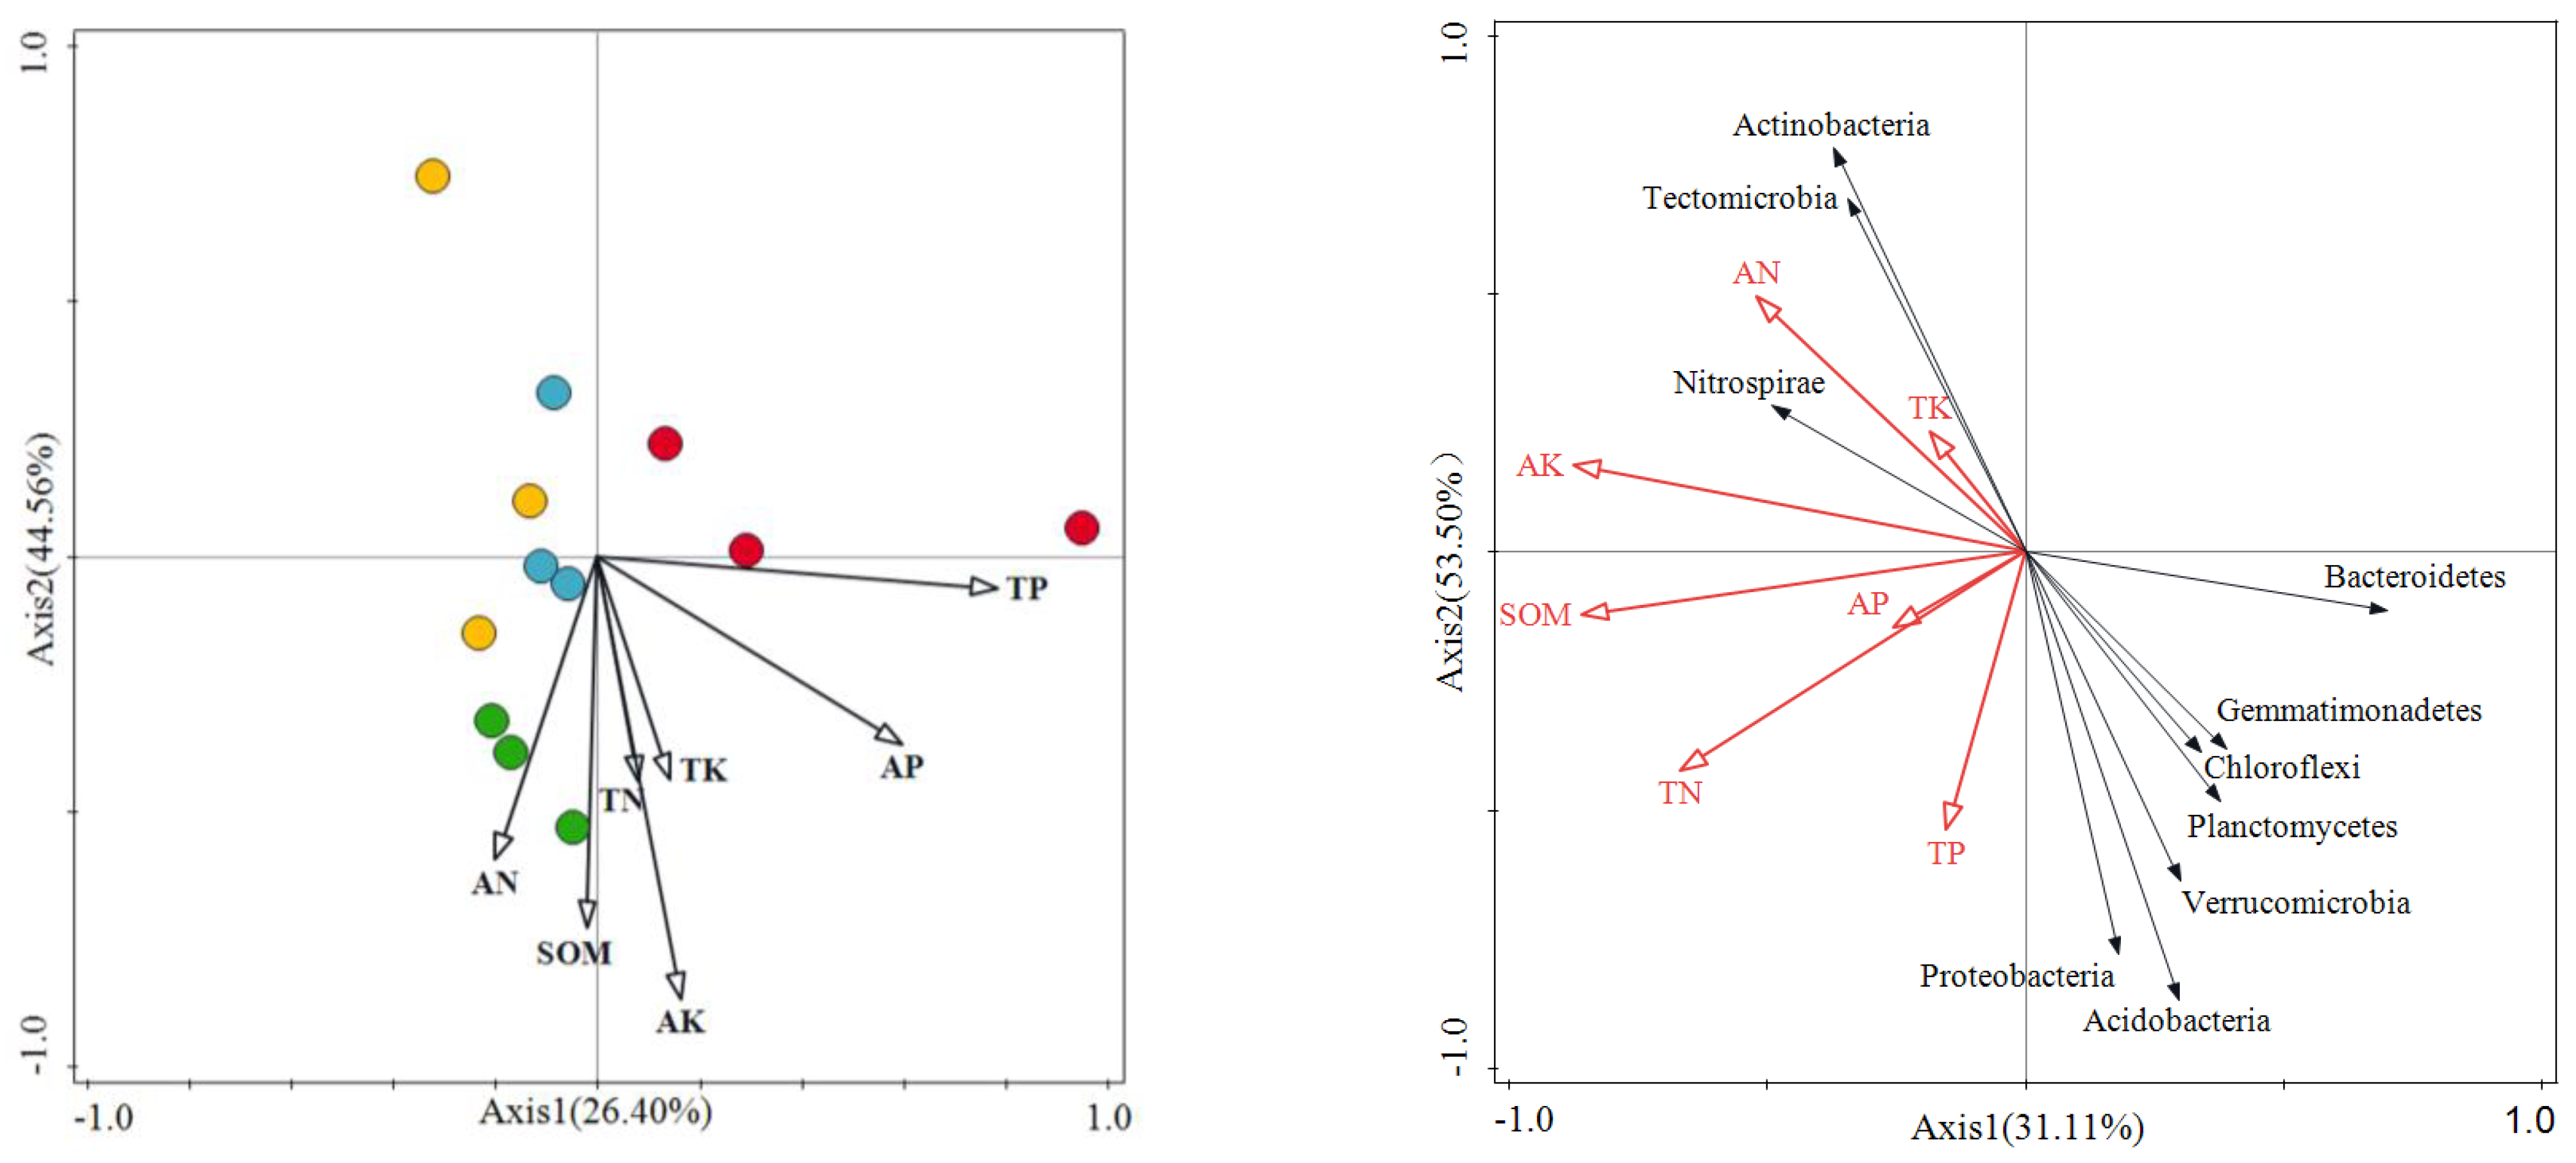
3.3. Correlations between Soil Bacteria and Soil Properties under Different Grazing Intensities

In Table 2, the Shannon index has the strongest and most significant negative correlation with soil organic matter and available potassium content (p < 0.05). The Simpson, Pielou, and Chao1 indices were not correlated with the soil properties.
Among soil properties, only the soil organic matter content was significantly correlated with the soil bacterial community composition (r = 0.4353, p < 0.05), as determined via the Mantel test (Table 3). The other correlations were relatively weak and insignificant.
At the OTU level, the soil properties could explain 70.96% of the rate of variation in the soil bacterial community determined via the redundancy analysis (Figure 4). The total contents of phosphorus, available phosphorus, available potassium, and soil organic matter had greater effects on the soil bacterial community structure. The fencing-in group and the grazing groups were horizontally distributed on both sides of the axis, showing the differences in soil bacterial community structure caused by grazing. The fencing-in group was strong correlated with the contents of total phosphorus and available phosphorus. The heavy grazing group was strongly correlated with the contents of soil organic matter and alkali-hydrolyzed nitrogen. At the bacterial phyla level, the contents of soil organic matter, total nitrogen, available potassium, alkali-hydrolyzed nitrogen, and total phosphorus had strong plasticizing effects on the distribution of the soil bacterial phyla. The contents of soil total phosphorus and nitrogen showed a strong positive correlation with most bacteria, such as Proteobacteria and Acidobacteria. In contrast, the contents of soil total potassium, alkali-hydrolyzable nitrogen, and available phosphorus showed strong positive correlations with Nitrospirae, Tectomicrobia, and Actinobacteria.

4. Discussion

4.1. Effects of Stocking Density on Soil Nutrient Content

Although the contents of total and available nutrients were affected by the change in the stocking density, there was no significant difference. There is no uniform rule in the research into the effects of stocking density on soil nutrient content. According to a four-year grazing regulation experiment conducted in the farming–grazing transitional zone of Shanxi Province, there was no significant difference in the contents of soil organic carbon and nitrogen between different grazing intensities in a single month [22]. The influence of grazing on grassland soil nutrients was generally considered to be caused by animals’ nibbling on above-ground plants and litter, as well as the change in the physical properties of soil, such as porosity reduction or the mechanical destruction of the soil’s structure caused by trampling by animals, and the addition of animal excrement; all these factors impacted soil nutrient storage and cycling [23,24]. The contents of organic matter, total potassium, and alkali-hydrolyzed nitrogen in the light grazing group were increased compared to the fencing-in group. Many previous studies have verified this observation, and moderate trampling disturbance could improve grassland productivity and carbon sequestration [25]. In our study, almost all soil properties had the lowest results in the medium grazing groups. The overcompensated growth of plants in the medium grazing group may be the reason for the decrease in the soil organic matter and nutrients [26]. However, the increase in nutrients in the heavy grazing group may be due to a large cumulative amount of animal excreta, as the nutrient elements in excreta exceeded the dynamic balance of the nutrient cycle in the ecosystem but were not transported outwards, meaning that they were stored in the surface soil. It is also believed that the comprehensive influence of animals in the heavy grazing group would lead to an increase in the plant root–shoot ratio, which stimulated the accumulation of root biomass and, thus, increased the nutrient elements released by root litter into the soil [27].

4.2. Responses of Soil Bacterial Diversity and Community Structure to Stocking Density

The α-diversity indices of the light grazing group were higher than those of the fencing-in group, but the difference between them was not significant. Compared to the fencing-in group, the excrement produced via moderate grazing and plant residue, as well as litters chewed and trampled by animals, were more easily decomposed, providing rich carbon sources for the growth of soil bacteria, thus improving the bacterial diversity [28]. The Shannon and Simpson indices of the medium and heavy grazing groups were significantly lower than those of the light grazing group. Intensive grazing would lead to the degradation of above-ground vegetation and a reduction in soil fertility, thus inhibiting the growth of some bacteria. A significant decrease in soil bacterial diversity was found in a 64-year intensive grazing experiment [29]. In the grazing gradient (control, light, medium, heavy and overgrazing) tests in Inner Mongolia, the soil bacterial α-diversity index increased and then decreased, which was similar to the changing trend of the results of our study [30]. Scholars also found that heavy grazing and control groups had no significant effects on the α-diversity indices [31]. There were several reasons for this differentiation between results, including the differences in environmental conditions, vegetation status, grazing animals, and grazing experiment designs in different study areas [32,33].
Acidobacteria, Actinomycetes, and Proteobacteria were the most common soil bacterial phyla, and their relative abundances in soil varied depending on the climatic conditions, soil types, vegetation types, and land use patterns [34]. Previous studies showed that grazing decreased the relative abundances of dominant bacteria compared to the control group, but the difference was not significant [35]. Acidobacteria and Proteobacteria showed such changes in our study. However, this rule was not consistent, as the dominant bacteria in different grasslands showed various trends in correlation with the increase in grazing intensity [36]. In the NMDS analysis of the overall bacterial community structure, the sample sites of different groups had a certain degree of cohesion, but the boundary with other groups was not obvious, indicating that the soil bacterial community of each group had a certain degree of overlap. However, the NMDS analysis results of different OTUs indicated that the bacteria that were significantly affected by stocking density belonged to nondominant species, which accounted for a small proportion of the soil bacterial community. Blastocatellia (belongs to Acidobacteria), Thermomicrobia (belongs to Chloroflexi), and Subgroup_6 (belongs to Acidobacteria) class were the three OTUs with the largest abundances of different OTUs. The response of the bacterial community structure to grazing was affected by the species of animal and the grazing time, as well as other factors. In the grassland environment, with Leymus chinensis being the dominant species in Jilin Province, the soil bacterial community structures had significant differences, which were caused by the grazing intensity [37].

4.3. The Correlation between Stocking Density, Soil Nutrient Content, and Soil Bacteria

Influencing the soil organic carbon transfer was one of the most important ways that grazing could change the soil’s bacterial community structure [38]. This measure showed that the soil bacterial α-diversity was closely related to soil organic matter content (SOC) and soil water content under different grazing intensities [30]. In our study, the Shannon index was only negatively correlated with soil organic matter and available potassium content among the soil properties (p < 0.05). The Mantel test showed a significant positive correlation between the soil organic matter content and the bacterial community (p < 0.05). The soil bacterial community structure was significantly positively correlated with the soil contents of organic carbon and total nitrogen in alpine grassland ecosystems in northern Tibet [39]. The variations in the above results may be caused by climatic and vegetation conditions. In terms of the eutrophic hypothesis, eutrophic bacteria were positively correlated with soil organic carbon, and the accumulation of soil organic carbon reduced the relative abundance of oligotrophic bacteria [40]. In our results, there was no significant change in soil organic carbon content between the grazing groups (p > 0.05), and it varied in the following manner: HG > LG > CK > MG. However, from the analysis of the overall range of numerical change, the results related to Acidobacteria, which is one of the representatives of oligotrophic bacteria, were consistent with this viewpoint. Meanwhile, the negative correlation between Acidobacteria and soil organic carbon was also explained by some scholars based on the principle of soil carbon mineralization [41]. Proteobacteria are defined as eutrophic bacteria with a high carbon utilization rate, and the high soil contents of carbon and nitrogen are conducive to their growth [42]. However, as one of the dominant phyla in this study, Proteobacteria did not conform to this hypothesis. This may be caused by the fact that our study was not a simple soil nutrient control experiment, instead overlaying the influence of grazing factors. Some bacteria in Actinomycetes have a photosynthetic autotrophic ability to fix CO2 [43], which made their relative abundances exhibit an increasing trend, even when the grazing intensity increased and the above-ground vegetation decreased. As determined via RDA analysis, the close positive correlation between the heavy grazing group and soil organic matter may be due to the dominant position of Actinomyces.
Compared to the accumulation of soil nutrients brought about via natural restoration in the fencing-in group, the increase in soil nitrogen and phosphorus in the heavy grazing group mainly occurred due to the input of animal feces [44]. Soil bacteria participate in nitrogen fixation, nitrification, denitrification, and other processes in the ecosystem. The content of soil-available nitrogen had a significant positive correlation with Nitrospirae, while it had a negative correlation with Acidobacteria. These findings were contrary to the results of previous studies that stated that there was a significant positive correlation between Acidobacteria and nitrogen because of the significant use of ammonium nitrogen and nitrate nitrogen as nitrogen sources [45]. Soil-available phosphorus had little correlation with the various bacterial phyla. It has been shown that bacteria are far less sensitive to soil phosphorus utilization than fungi, and there is no obvious correlation between the available phosphorus and bacterial abundance [46]. The strong correlation between soil phosphorus and the soil bacterial community structure, as determined via RDA analysis, may be due to the indirect effect that phosphorus has on the above-ground plant and soil fungal community, before acting on the bacterial community [47].
The correlation between soil nutrient content and soil bacteria under the influence of grazing was complex and changeable. More experiments are needed, such as controlling fecal input and more combined regulation of the stocking density and time, to explore the correlation between these factors and provide a more effective and accurate theoretical basis for studying actual grazing activities.

5. Conclusions

The soil bacterial communities present in the desert steppe environment under different stocking densities were identified as 36 phyla, 95 classes, 116 orders, 206 families, and 277 genera. Acidobacteria, Actinobacteria, Proteobacteria, and Chloroflexi were the dominant phyla. Light grazing increased the bacterial α-diversity indices of the soil, while medium and heavy grazing decreased these indices. There were some differences in soil bacterial communities between the different grazing intensities, and the variability in the soil bacterial communities was greater in the medium grazing group. In our study, soil chemical properties did not significantly change in response to the stocking density. Only soil organic matter and available potassium had significant negative correlations with the soil bacterial Shannon index, while the contents of soil organic matter, total phosphorus, alkali-hydrolyzed nitrogen, available phosphorus, and available potassium played strong roles in shaping the bacterial community differences and taxa composition. It would be unwise for governments to pursue desert steppe land restoration by completely banning grazing for a long time, given its complex relationship with soil microbial characterization. Nonetheless, we will continue to conduct multi-year observations and analyses to further study the relationship between soil microbes and grazing.

Author Contributions

Y.W.: Conceptualization, software, formal analysis, investigation, resources, data curation, writing—original draft preparation, project administration, project administration M.G.: Conceptualization, methodology, validation, writing—original draft preparation, writing—review and editing Y.L.: software, visualization X.Y.: validation, supervision J.G.: methodology, resources, supervision J.W.: formal analysis, investigation, visualization. All authors have read and agreed to the published version of the manuscript.

Funding

This study was supported by Yinshanbeilu Grassland Eco-hydrology National Observation and Research Station, China Institute of Water Resources and Hydropower Research (Grant NO. YSS202117); National Natural Science Foundation of China (32260279); and the Natural Science Foundation of Inner Mongolia (2020BS04007, 2020BS03001).

Institutional Review Board Statement

Not applicable.

Informed Consent Statement

Not applicable.

Data Availability Statement

The original contributions presented in the study are included in the article; further inquiries can be directed to the corresponding author.

Conflicts of Interest

The authors declare that they have no conflict of interest to report regarding the present study.

References

  1. Delgado-Baquerizo, M.; Maestre, F.T.; Reich, P.B.; Jeffries, T.C.; Gaitan, J.J.; Encinar, D.; Berdugo, M.; Campbell, C.D.; Singh, B.K. Microbial diversity drives multifunctionality in terrestrial ecosystems. Nat. Commun. 2016, 7, 10541. [Google Scholar] [CrossRef]
  2. Geisen, S.; Wall, D.H.; van der Putten, W.H. Challenges and opportunities for soil biodiversity in the anthropocene. Curr. Biol. 2019, 29, 1036–1044. [Google Scholar] [CrossRef] [PubMed]
  3. Zhang, G.; Zhao, Z.; Yin, X.; Zhu, Y. Impacts of biochars on bacterial community shifts and biodegradation of antibiotics in an agricultural soil during short-term incubation. Sci. Total Environ. 2021, 771, 144751. [Google Scholar] [CrossRef] [PubMed]
  4. Zhang, Z.C.; Shi, Z.Q.; Yang, J.Y.; Hao, B.H.; Hao, L.J.; Diao, F.W.; Wang, L.X.; Bao, Z.H.; Guo, W. A new strategy for evaluating the improvement effectiveness of degraded soil based on the synergy and diversity of microbial ecological function. Ecol. Indic. 2021, 120, 106917. [Google Scholar] [CrossRef]
  5. Xue, Y.; Bai, X.; Zhao, C.; Tan, Q.; Li, Y.; Luo, G.; Long, M. Spring photosynthetic phenology of Chinese vegetation in response to climate change and its impact on net primary productivity. Agric. For. Meteorol. 2023, 342, 109734. [Google Scholar] [CrossRef]
  6. Qiu, D.; Zhu, G.; Lin, X.; Jiao, Y.; Lu, S.; Liu, J.; Chen, L. Dissipation and movement of soil water in artificial forest in arid oasis areas: Cognition based on stable isotopes. CATENA 2023, 228, 107178. [Google Scholar] [CrossRef]
  7. Pan, D.R.; Yan, H.W.; Li, Q.; Liu, D.Y.; Liu, X.N.; Zhang, D.G.; Han, T.H.; Sun, B.; Jiang, J.C. Loss of grassland ecosystem service values based on potential vegetation in China. Rangel. J. 2022, 43, 363–375. [Google Scholar] [CrossRef]
  8. Li, M.Y.; Li, X.B.; Liu, S.Y.; Li, X.; Lyu, X.; Dang, D.L.; Dou, H. Ecosystem services under different grazing intensities in typical grasslands in Inner Mongolia and their relationships. Glob. Ecol. Conserv. 2021, 26, e01526. [Google Scholar] [CrossRef]
  9. Akiyama, T.; Kawamura, K. Grassland degradation in China: Methods of monitoring, management and restoration. Grassl. Sci. 2007, 53, 1–17. [Google Scholar] [CrossRef]
  10. Zhang, H.Y.; Fan, J.W.; Shao, Q.Q.; Zhang, Y.X. Ecosystem dynamics in the ‘Returning Rangeland to Grassland’ programs, China. Acta Prataculturae Sin. 2016, 25, 1–15. [Google Scholar]
  11. Coban, O.; Deyn, G.B.; van der Ploeg, M. Soil microbiota as game-changers in restoration of degraded lands. Science 2022, 375, abe0725. [Google Scholar] [CrossRef] [PubMed]
  12. Walkley, A.; Black, I.A. An examination of the degtjareff method for determining soil organic matter, and a proposed modification of the chromic acid Titration method. Soil Sci. 1934, 37, 29–38. [Google Scholar] [CrossRef]
  13. Mason, C.J.; Edwards, M.; Riby, P.G.; Coe, G. The use of microwaves in the acceleration of digestion and colour development in the determination of total Kjeldahl nitrogen in soil. Analyst 1999, 124, 1719–1726. [Google Scholar] [CrossRef]
  14. Bao, S. Soil and Agricultural Chemistry Analysis, 3rd ed.; Agriculture Press of China: Beijing, China, 2000; p. 11. [Google Scholar]
  15. Liu, J.S.; Ma, Q.; Hui, X.L.; Ran, J.Y.; Ma, Q.X.; Wang, X.; Wang, Z.H. Long-term high-P fertilizer input decreased the total bacterial diversity but not phoD-harboring bacteria in wheat rhizosphere soil with available-P deficiency. Soil Biol. Biochem. 2020, 149, 107918. [Google Scholar] [CrossRef]
  16. Edgar, R. Search and Clustering Orders of Magnitude Faster than BLAST. Bioinformatics 2010, 26, 2460–2461. [Google Scholar] [CrossRef]
  17. Caporaso, J.G.; Lauber, C.L.; Walters, W.A.; Berg-Lyons, D.; Huntley, J.; Fierer, N.; Gormley, J.A.; Smith, G.; Knight, R. Ultra-high-throughput microbial community analysis on the Illumina HiSeq and MiSeq platforms. ISME J. 2012, 6, 1621–1624. [Google Scholar] [CrossRef]
  18. Shanon, C.E. A mathematical theory of communications. Bell Syst. Tech. J. 1948, 27, 379–423. [Google Scholar] [CrossRef]
  19. Simpson, E.H. Measurement of diversity. Nature 1949, 168, 668. [Google Scholar] [CrossRef]
  20. Chao, A. Non-parametric estimation of the number of classes in a population. Scand. J. Stat. 1984, 11, 265–270. [Google Scholar]
  21. Pielou, E.C. Species-diversity and pattern-diversity in the study of ecological succession. J. Theor. Biol. 1966, 10, 370–383. [Google Scholar] [CrossRef]
  22. Haynes, R.; Williams, P.H. Nutrient Cycling and Soil Fertility in the Grazed Pasture Ecosystem. Adv. Agron. 1993, 49, 119–199. [Google Scholar]
  23. Ma, W.M.; Ding, K.Y.; Zhong, W.L. Comparison of soil carbon and nitrogen stocks at grazing-excluded and yak grazed alpine meadow sites in Qinghai-Tibetan Plateau, China. Ecol. Eng. 2016, 87, 203–211. [Google Scholar] [CrossRef]
  24. Rakkar, M.K.; Blanco-Canqui, H. Grazing of crop residues: Impacts on soils and crop production. Agric. Ecosyst. Environ. 2018, 258, 71–90. [Google Scholar] [CrossRef]
  25. Zhu, G.Y.; Deng, L.; Zhang, X.B.; Shangguan, Z.P. Effects of grazing exclusion on plant community and soil physicochemical properties in a desert steppe on the Loess Plateau, China. Ecol. Eng. 2016, 90, 372–381. [Google Scholar] [CrossRef]
  26. Stewart Ibarra, A.; Frank, D. Short sampling intervals reveal very rapid root turnover in temperate grassland. Oecologia 2008, 157, 453–458. [Google Scholar] [CrossRef]
  27. Zhou, X.; Wang, J.; Hao, Y.; Wang, Y. Intermediate grazing intensities by sheep increase soil bacterial diversities in an Inner Mongolian steppe. Biol. Fert. Soils 2010, 46, 817–824. [Google Scholar] [CrossRef]
  28. Zhang, Y.T.; Gao, X.L.; Hao, X.Y.; Alexander, T.; Shi, X.J.; Jin, L.; Thomas, B.W. Heavy grazing over 64 years reduced soil bacterial diversity in the foothills of the Rocky Mountains, Canada. Appl. Soil Ecol. 2020, 147, 103361. [Google Scholar] [CrossRef]
  29. Wang, Z.; Jiang, S.Y.; Struik, P.C.; Wang, H.; Jin, K.; Wu, R.; Na, R.; Mu, H.B.; Ta, N. Plant and soil responses to grazing intensity drive changes in the soil microbiome in a desert steppe. Plant Soil 2022, 491, 219–237. [Google Scholar] [CrossRef]
  30. Li, Y.M.; Wang, S.P.; Jiang, L.L.; Zhang, L.R.; Cui, S.J.; Meng, F.D.; Wang, Q.; Li, X.; Zhou, Y. Changes of soil microbial community under different degraded gradients of alpine meadow. Agr. Ecosyst. Environ. 2016, 222, 213–222. [Google Scholar] [CrossRef]
  31. Xu, S.; Silveira, M.; Inglett, K.; Sollenberger, L.; Gerber, S. Soil microbial community responses to long-term land use intensification in subtropical grazing lands. Geoderma 2017, 293, 73–81. [Google Scholar] [CrossRef]
  32. Wang, M.M.; Wang, S.P.; Wu, L.W.; Xu, D.P.; Lin, Q.Y.; Yi, G.H.; Li, X.Z.; Zhou, J.Z.; Yang, Y.F. Evaluating the lingering effect of livestock grazing on functional potentials of microbial communities in Tibetan grassland soils. Plant Soil 2016, 407, 385–399. [Google Scholar] [CrossRef]
  33. Baker, K.L.; Langenheder, S.; Nicol, G.W.; Ricketts, D.; Killham, K.; Campbell, C.D.; Prosser, J.I. Environmental and spatial characterisation of bacterial community composition in soil to inform sampling strategies. Soil Biol. Biochem. 2009, 41, 2292–2298. [Google Scholar] [CrossRef]
  34. Yin, Y.L.; Wang, Y.Q.; Li, S.X.; Liu, Y.; Zhao, W.; Ma, Y.S.; Bao, G.S. Effects of enclosing on soil microbial community diversity and soil stoichiometric characteristics in a degraded alpine meadow. J. Appl. Ecol. 2019, 30, 127–136. [Google Scholar]
  35. Le Roux, X.; Poly, F.; Currey, P.; Commeaux, C.; Hai, B.; Nicol, G.W.; Prosser, J.I.; Schloter, M.; Attard, E.; Klumpp, K. Effects of aboveground grazing on coupling among nitrifier activity, abundance and community structure. ISME J. 2008, 2, 221–232. [Google Scholar] [CrossRef] [PubMed]
  36. Qu, T.B.; Du, W.C.; Yuan, X.; Yang, Z.M.; Liu, D.B.; Wang, D.L.; Yu, L.J. Impacts of grazing intensity and plant community composition on soil bacterial community diversity in a steppe grassland. PLoS ONE 2016, 11, e0159680. [Google Scholar] [CrossRef]
  37. Xun, W.B.; Yan, R.R.; Ren, Y.; Jin, D.Y.; Xiong, W.; Zhang, G.S.; Cui, Z.L.; Xin, X.P.; Zhang, R.F. Grazing-induced microbiome alterations drive soil organic carbon turnover and productivity in meadow steppe. Microbiome 2018, 6, 170. [Google Scholar] [CrossRef]
  38. Gao, F.; Wang, B.; Shi, Y.X.; Zhang, G.X.; Wang, J.; Si, G.C.; Han, C.H.; Yuan, Y.L.; Hu, Z. The response of alpine grasslands ecosystem in the north Tibet to short-term enclosure. Acta Ecol. Sin. 2017, 37, 4366–4374. [Google Scholar]
  39. Wang, Z.; Li, X.L.; Ji, B.M.; Struik, P.C.; Jin, K.; Tang, S.M. Coupling between the responses of plants, soil, and microorganisms following grazing exclusion in an cvergrazed grassland. Front. Plant Sci. 2021, 12, 640789. [Google Scholar] [CrossRef]
  40. Xun, W.B.; Zhao, J.; Xue, C.; Zhang, G.S.; Ran, W.; Wang, B.R.; Shen, Q.R.; Zhang, R.F. Significant alteration of soil bacterial communities and organic carbon decomposition by different long-term fertilization management conditions of extremely low-productivity arable soil in South China. Environ. Microbiol. 2016, 18, 1907–1917. [Google Scholar] [CrossRef]
  41. Thomson, B.C.; Ostle, N.; McNamara, N.; Bailey, M.J.; Whiteley, A.S.; Griffiths, R.I. Vegetation affects the relative abundances of dominant soil bacterial taxa and soil respiration rates in an upland grassland soil. Microb. Ecol. 2010, 59, 335–343. [Google Scholar] [CrossRef]
  42. He, Z.L.; Piceno, Y.; Deng, Y.; Xu, M.Y.; Lu, Z.M.; DeSantis, T.; Andersen, G.; Hobbie, S.E.; Reich, P.B.; Zhou, J.Z. The phylogenetic composition and structure of soil microbial communities shifts in response to elevated carbon dioxide. ISME J. 2011, 6, 259–272. [Google Scholar] [CrossRef] [PubMed]
  43. Liu, J.; Li, L.; Ji, L.; Li, Y.; Liu, J.; Li, F. Divergent effects of grazing versus mowing on plant nutrients in typical steppe grasslands of Inner Mongolia. J. Plant Ecol. 2022, 16, rtac032. [Google Scholar] [CrossRef]
  44. Melo, V.; Barros, L.; Silva, M.; Veloso, T.; Senwo, Z.; Matos, K.; Nunes, T.K.O. Soil bacterial diversities and response to deforestation, land use and burning in North Amazon, Brazil. Appl. Soil Ecol. 2021, 158, 103775. [Google Scholar] [CrossRef]
  45. Wang, Z.; Zhang, J.X.; Yang, X.L.; Huang, X.; Chen, S.L.; Qiao, Y.M. Characteristics of soil microbial diversity in different patches of alpine meadow. Acta Agrestia Sin. 2021, 29, 1916–1926. [Google Scholar]
  46. Adair, K.L.; Wratten, S.; Lear, G. Soil phosphorus depletion and shifts in plant communities change bacterial community structure in a long-term grassland management trial. Env. Microbiol. Rep. 2013, 5, 404–413. [Google Scholar] [CrossRef] [PubMed]
  47. John, M.K. Colorimetric determination in soil and plant material with ascorbic acid. Soil Sci. 1970, 109, 214–220. [Google Scholar] [CrossRef]
Figure 1. Soil bacterial community diversity indices under different stocking densities. Letters indicate significant differences for each parameter (p < 0.05). Diversity index includes Shannon (A), Simpson (B), Pielou (C), and Chao1 (D) indices. CK—fencing-in group; LG—light grazing group; MG—medium grazing group; HG—heavy grazing group.
Agronomy 13 02817 g001
Figure 2. Soil bacterial community composition under different stocking densities (phylum level). Note: only the bacterial phyla for which the relative abundance was greater than 1% are listed here, and those with lower values were counted as other elements. CK—fencing-in group; LG—light grazing group; MG—medium grazing group; HG—heavy grazing group.
Agronomy 13 02817 g002
Figure 3. Analysis of nonmetric multidimensional scaling in soil bacterial communities under different grazing intensities, considering the overall OTUs and differential OTUs. Note: Figure (A) was generated based on overall OTUs, while Figure (B) was generated based on differential OTUs.
Agronomy 13 02817 g003
Figure 4. Redundancy analysis (RDA) of the soil bacterial structure and the soil properties under different grazing intensities, based on the full OTUs and the phylum level. Note 1: the left figure was the result based on all OTUs, while the right figure was based on the bacterial phylum level. Note 2: in the left figure, the red points represent CK, the blue points represent LG, the yellow points represent MG, and the green points represent HG. SOM—soil organic matter; TN—soil total nitrogen; AN—soil alkali-hydrolyzed nitrogen; TP—soil total phosphorus; AP—soil-available phosphorus; TK—soil total potassium; AK—soil-available potassium.
Agronomy 13 02817 g004
Table 1. Effects of different grazing intensities on chemical properties of soil.
SOM (g/kg)TN (g/kg)TP (g/kg)TK (g/kg)AN (mg/kg)AP (mg/kg)AK (mg/kg)
CK24.62 ± 1.43a1.61 ± 0.12a0.46 ± 0.02a28.93 ± 2.11a70.98 ± 6.28a4.82 ± 0.59a169.22 ± 16.66a
LG24.70 ± 0.91a1.60 ± 0.06a0.44 ± 0.01a29.21 ± 3.86a77.31 ± 19.54a3.88 ± 0.93a157.33 ± 12.88a
MG24.49 ± 4.35a1.52 ± 0.18a0.44 ± 0.02a27.46 ± 0.76a70.84 ± 14.37a3.63 ± 0.58a151.97 ± 45.02a
HG25.70 ± 0.43a1.61 ± 0.06a0.43 ± 0.00a30.09 ± 1.04a95.42 ± 13.79a4.44 ± 1.28a196.72 ± 8.44a
Note: The same letter being present in the same column means that no significant difference was noted. CK—fencing-in group; LG—light grazing group; MG—medium grazing group; HG—heavy grazing group; SOM—soil organic matter; TN—soil total nitrogen; A—soil alkali-hydrolyzed nitrogen; TP—soil total phosphorus; AP—soil-available phosphorus; TK—soil total potassium; AK—soil-available potassium.
Table 2. Pearson’s correlation coefficients for soil bacterial diversity and soil properties under different grazing intensities.
SOMTNTPTKANAPAK
Shannon−0.652 *−0.263−0.0530.231−0.151−0.308−0.604 *
Simpson−0.433−0.0120.1170.162−0.222−0.328−0.495
Pielou−0.453−0.120−0.0310.314−0.031−0.469−0.467
Chao1−0.1410.0100.297−0.245−0.1860.454−0.068
Note: the asterisk indicates a significant difference (p < 0.05). SOM—soil organic matter; TN—soil total nitrogen; AN—soil alkali-hydrolyzed nitrogen; TP—soil total phosphorus; AP—soil-available phosphorus; TK—soil total potassium; AK—soil-available potassium.
Table 3. Correlations between the soil bacterial communities under different grazing intensities and soil properties, as determined via the Mantel test.
SOMTNTPTKANAPAK
r0.43530.2983−0.12210.2819−0.0122−0.08400.2790
p0.0190.0850.6750.0520.5140.6710.076
Note: the bold font represents the significant difference (p < 0.05). SOM—soil organic matter; TN—soil total nitrogen; AN—soil alkali-hydrolyzed nitrogen; TP—soil total phosphorus; AP—soil-available phosphorus; TK—soil total potassium; AK—soil-available potassium.
Disclaimer/Publisher’s Note: The statements, opinions and data contained in all publications are solely those of the individual author(s) and contributor(s) and not of MDPI and/or the editor(s). MDPI and/or the editor(s) disclaim responsibility for any injury to people or property resulting from any ideas, methods, instructions or products referred to in the content.

