Article

Identification of Stripe Rust and Leaf Rust on Different Wheat Varieties Based on Image Processing Technology

1
College of Plant Protection, China Agricultural University, Beijing 100193, China
2
Institute of Plant Protection, Gansu Academy of Agricultural Sciences, Lanzhou 730070, China
3
Wheat Research Institute, Gansu Academy of Agricultural Sciences, Lanzhou 730070, China
*
Author to whom correspondence should be addressed.
Agronomy 2023, 13(1), 260; https://doi.org/10.3390/agronomy13010260
Submission received: 20 December 2022 / Revised: 11 January 2023 / Accepted: 12 January 2023 / Published: 14 January 2023
(This article belongs to the Special Issue Epidemiology and Control of Fungal Diseases of Crop Plants)

Abstract

:
The timely and accurate identification of stripe rust and leaf rust is essential in effective disease control and the safe production of wheat worldwide. To investigate methods for identifying the two diseases on different wheat varieties based on image processing technology, single-leaf images of the diseases on different wheat varieties, acquired under field and laboratory environmental conditions, were processed. After image scaling, median filtering, morphological reconstruction, and lesion segmentation on the images, 140 color, texture, and shape features were extracted from the lesion images; then, feature selections were conducted using methods including ReliefF, 1R, correlation-based feature selection, and principal components analysis combined with support vector machine (SVM), back propagation neural network (BPNN), and random forest (RF), respectively. For the individual-variety disease identification SVM, BPNN, and RF models built with the optimal feature combinations, the identification accuracies of the training sets and the testing sets on the same individual varieties acquired under the same image acquisition conditions as the training sets used for modeling were 87.18–100.00%, but most of the identification accuracies of the testing sets for other individual varieties were low. For the multi-variety disease identification SVM, BPNN, and RF models built with the merged optimal feature combinations based on the multi-variety disease images acquired under field and laboratory environmental conditions, identification accuracies in the range of 82.05–100.00% were achieved on the training set, the corresponding multi-variety disease image testing set, and all the individual-variety disease image testing sets. The results indicated that the identification of images of stripe rust and leaf rust could be greatly affected by wheat varieties, but satisfactory identification performances could be achieved by building multi-variety disease identification models based on disease images from multiple varieties under different environments. This study provides an effective method for the accurate identification of stripe rust and leaf rust and could be a useful reference for the automatic identification of other plant diseases.

1. Introduction

Wheat stripe rust, caused by Puccinia striiformis f. sp. tritici (Pst), and wheat leaf rust, caused by P. triticina (Pt), are two important airborne fungal diseases with characteristics of strong epidemicity and serious destructiveness that threaten wheat production worldwide [1,2,3,4]. The causal agents of the two diseases mainly infect wheat leaves, and multiple uredinia can be produced on the infected leaves. The wheat plant symptoms caused by the two diseases are very similar; thus, it is very difficult to distinguish and identify the two diseases, especially in the wheat seedling stage [1,5,6]. Therefore, the rapid and accurate identification of wheat stripe rust and wheat leaf rust is of great significance for prediction and management of the two diseases.
Plant disease identification is a prerequisite and basis of effective disease management. At present, plant disease identification can be carried out using the artificial visual observation method [7,8,9] and methods based on molecular biology technology [10,11,12], remote sensing technology [6,12,13,14,15], image processing technology [7,8,9,14,16,17,18], near infrared spectroscopy [5], and Internet of Things technology [19,20,21]. In practice, plant disease identification mainly relies on experienced personnel to implement it using the artificial visual observation method. This method requires high levels of personnel experience and can easily lead to errors. Most importantly, experienced personnel may not be able to reach the fields with plant diseases in time to make a disease diagnosis, which can mean that the most suitable period for disease control is missed. When molecular biology technology is used to detect and identify plant diseases, professional experimental instruments and reagents are required, testing personnel need to have certain professional ability and experimental data-analysis abilities, and the disease identification method based on this technology is time-consuming and laborious [10]. Remote sensing technology is rarely used in practical disease identification applications due to the limitations of remote sensing resolution, its technical applicability, and instrument prices. Near-infrared spectroscopy instruments are generally expensive; studies on plant disease identification based on near-infrared spectroscopy technology need to be further strengthened, and the related disease identification methods are far from having practical applications. Disease identification based on Internet of Things technology requires many sensors and electronic devices, and it is difficult to deploy these devices in large-scale crop fields. For users, disease identification based on image processing technology does not require more expensive instruments and professional knowledge. Disease images can be collected by using mobile phones or cameras with photo-taking functions; then, the acquired disease images can be processed by using software or an application program, and the disease identification results can be obtained, which can save costs and improve production efficiency [22].
With the rapid development of information technology, devices with photo-taking functions have become widely used in daily life, and it is very convenient and fast to obtain plant disease images. Image-processing technology has been used in the studies on the identification of various plant diseases [7,8,9,14,16,17,18,23,24,25,26,27,28,29,30,31,32,33,34,35,36,37,38]. Plant disease identification based on traditional image-processing technology generally includes plant disease image acquisition, image preprocessing, lesion image segmentation, image feature extraction and selection, and the construction and application of disease image identification models. In recent years, deep learning methods, which are widely used, can directly extract features from plant disease images, with great advantages in disease image identification [8,28,32,34,35,36,37,38,39,40].
There have been some research reports on wheat disease image identification [41,42,43,44,45]. Li et al. [41] used the K-means clustering algorithm to segment acquired images of wheat stripe rust and wheat leaf rust and built a support vector machine (SVM) model with a radial basis function (RBF) kernel based on the 26 selected features from the 50 extracted color, shape, and texture features to carry out image-based recognition of the two diseases. The results showed that the recognition accuracies of the training set and the testing set for the built SVM model were 96.67% and 100.00%, respectively. Based on the acquired images of wheat leaves infected by three diseases (including powdery mildew, stripe rust, and leaf rust) and healthy wheat leaves, Du et al. [43] performed image-processing operations, including Gaussian filter, top hat and bottom hat transformations, green portion acquisition operations, gray-level binarization, and morphological operations. Then, they obtained segmented lesion images, subsequently extracted 10 color, shape, and texture features from the segmented lesion images, and finally built SVM classifiers with different kernel functions and feature combinations. The results showed that for the optimal SVM classifier with an RBF kernel, an overall recognition accuracy of 97.73% was achieved. Genaev et al. [45] proposed a deep learning method based on a convolutional neural network with EfficientNet architecture for image-based identification of five kinds of wheat diseases, including leaf rust, stem rust, yellow rust, powdery mildew, and Septoria; the best accuracy of 0.942 was obtained.
Plant disease identification based on image processing technology is affected by many factors, such as disease image capture conditions, complex backgrounds, and disease symptom variations [7,46]. At present, to the best of our knowledge, there are no reports on the effects that different wheat varieties have on the image identification of wheat stripe rust and wheat leaf rust. In this study, the identification of stripe rust and leaf rust on different varieties of wheat was investigated based on image processing technology. Based on the single-leaf images of stripe rust and leaf rust with different severity levels—and looking at different wheat varieties acquired under field and laboratory environmental conditions—image scaling, median filtering, and morphological processing of the images were conducted, and image segmentation was carried out using the combined method of the threshold segmentation method and K-means clustering algorithm. After color, texture, and shape features were extracted from the segmented lesion images, feature selections were performed by using a combination of the ReliefF [47], 1-rule (1R) [48], correlation-based feature selection (CFS) [49] and principal components analysis (PCA) methods, and the SVM, back propagation neural network (BPNN) and random forest (RF) modeling methods. Subsequently, the individual-variety disease identification models and the multi-variety disease identification models were built by using the SVM, BPNN, and RF modeling methods, and the identification effects of the models, built based on different training sets, were analyzed to explore the influence of wheat varieties on disease image identification. In this study, efforts were made to overcome the influence of wheat varieties on the identification of disease images and to provide an accurate and rapid method for the identification of stripe rust and leaf rust on different varieties in order to accomplish the timely, accurate, and intelligent identification of stripe rust and leaf rust on different wheat varieties in practical production. The results of this study will be helpful in the implementation of real-time and accurate integrated management strategies for the two diseases, and can also provide a valuable reference for the identification and monitoring of other plant diseases.

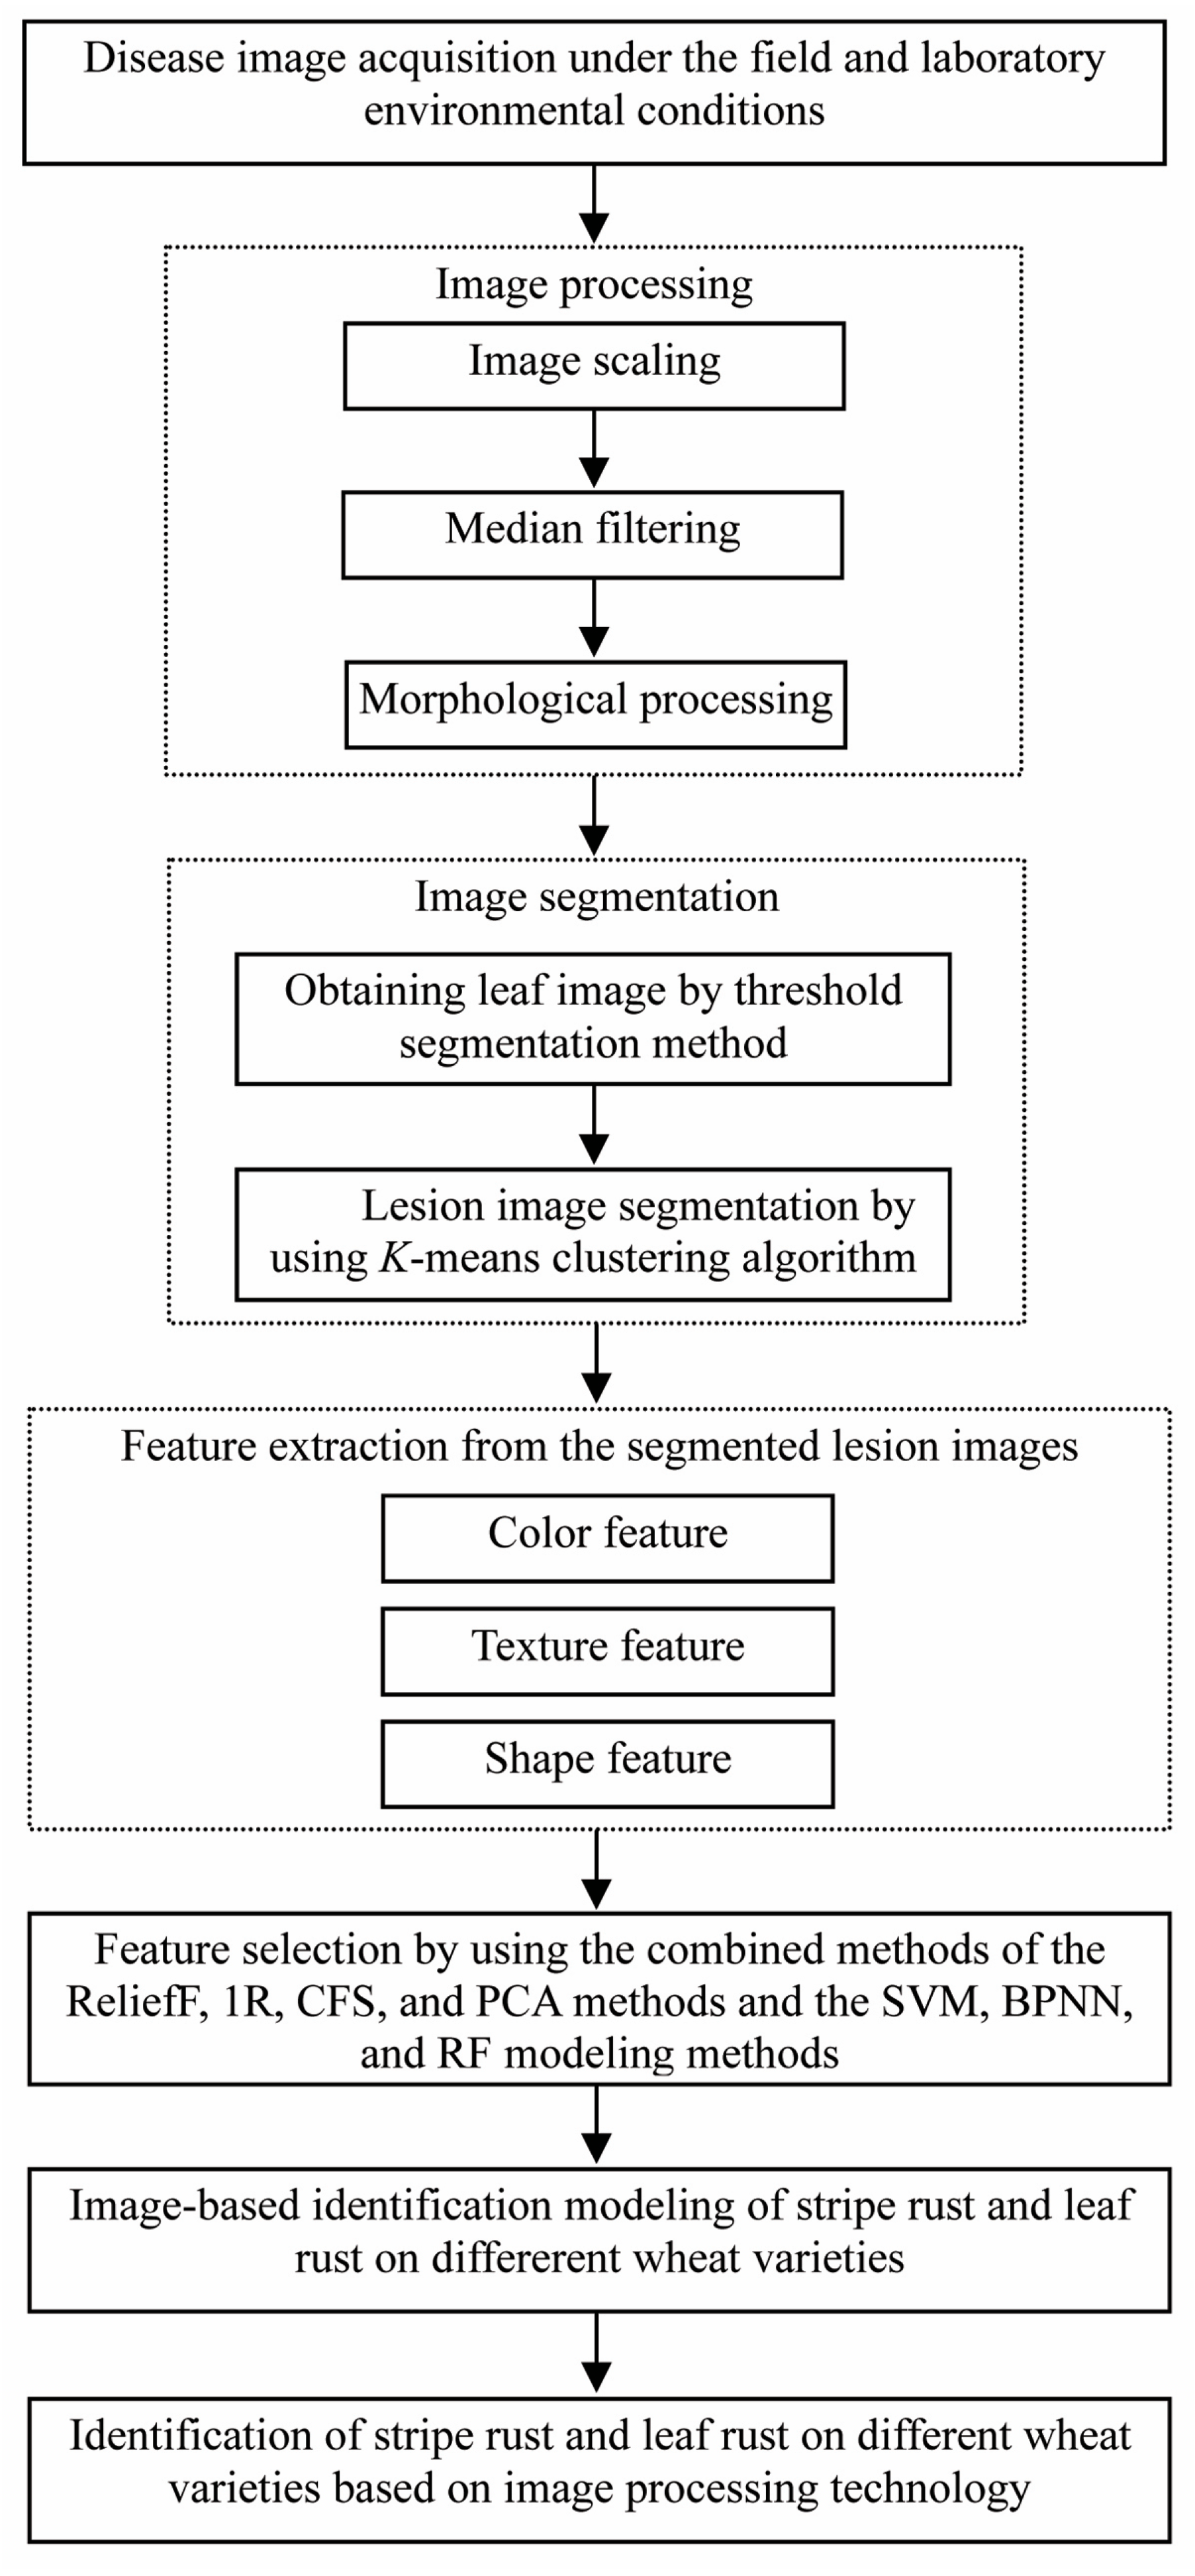
2. Materials and Methods

The image-based identification of stripe rust and leaf rust on different wheat varieties was carried out according to the main steps, as shown in Figure 1, aiming to explore the effects of wheat varieties on image-based disease identification performance.

2.1. Acquisition of Single-Leaf Images of Wheat Stripe Rust and Wheat Leaf Rust

Single diseased wheat leaves with typical symptoms of stripe rust and leaf rust, used for image acquisition in this study, were sampled from the wheat field in Shangzhuang Experimental Station of China Agricultural University, Haidian District, Beijing, China; the controlled-climate chamber in the Laboratory of Macro-Phytopathology, China Agricultural University, Beijing, China; and the wheat field in Gangu Testing Station of the Institute of Plant Protection, Gansu Academy of Agricultural Sciences, Gangu, Gansu, China.
The seeds of wheat varieties Beijing 0045 (moderately resistant to Pst and Pt), Mingxian 169 (highly susceptible to Pst and Pt), and Nongda 211 (moderately resistant to Pst and Pt) were sown in Shangzhuang Experimental Station on 6 and 7 October 2020. The experimental field was divided into the experimental zone of wheat stripe rust and the experimental zone of wheat leaf rust. Late in the afternoon of 5 April 2021, using the artificial spray inoculation method described by Wang et al. [6], the wheat seedlings in the experimental zones were inoculated with Pst and Pt, respectively. The urediospores of Pst and Pt, multiplied in the controlled-climate chamber, were used to make urediospore suspensions of 300 mg/L, 200 mg/L and 100 mg/L with 0.05% Tween 20 solution, respectively. The urediospore suspensions were evenly sprayed on the leaves of wheat seedlings, the inoculated wheat seedlings were immediately covered with plastic films sprayed with water droplets, and the plastic film edges were covered with soil to moisturize the wheat leaves. The plastic films were unveiled between 8:00 and 9:00 (Beijing time) on 6 April 2021.
In Gangu Testing Station, the seeds of wheat varieties Longjian 9822 (moderately susceptible to Pst), Longjian 9825 (highly resistant to Pst), and Tianxuan 66 (moderately resistant to Pst) were sown on 19 October 2020. A Mingxian 169 cluster was planted at the center of each plot. Late in the afternoon of 27 March 2021, the seedlings of Mingxian 169 at the center of each plot were inoculated with Pst using the artificial spray inoculation method.
In the controlled-climate chamber, wheat varieties Beijing 0045, Mingxian 169, and Nongda 211 were used. The selected plump wheat seeds were sown in pots (10 cm in diameter and 10 cm high, 15–20 seeds per pot), and the pots were incubated in the controlled-climate chamber at 12–15 °C with 50–70% relative humidity (12 h/12 h light/dark cycle). When the first leaves of the wheat seedlings fully expanded, the urediospores of Pst or Pt were collected from the diseased seedlings of Mingxian 169 used for multiplication of the corresponding causal agent, and the healthy wheat seedlings were inoculated using the artificial spray inoculation method, as described by Cheng et al. [50]. After a urediospore suspension made with 0.02% Tween 20 solution was sprayed on the leaves of wheat seedlings in the pots, the pots were immediately placed into a moist chamber under dark conditions at 12–15 °C for 24 h. Subsequently, each pot with the inoculated wheat seedlings was taken from the moist chamber and covered with a transparent and clean glass cylinder wrapped with two layers of sterile cotton gauze on the top side. All the inoculated wheat seedlings were placed into the controlled-climate chamber for incubation under the conditions described above. To acquire wheat disease images with different severity levels, different concentrations of urediospore suspensions were used. To acquire the images of diseased wheat leaves with high severity levels, the urediospore suspensions with the concentrations of 15 mg/10 mL, 12 mg/10 mL, and 9 mg/10 mL were made and used for artificial spray inoculation. The urediospore suspension concentrations of 5 mg/10 mL, 3 mg/10 mL, and 1 mg/10 mL were used to acquire the images of diseased wheat leaves with low severity levels.
The disease symptoms appeared in the fields about 15 days after inoculation, and the symptoms of wheat stripe rust and wheat leaf rust appeared on the wheat seedlings in the controlled-climate chamber about 10 days after inoculation. According to the Rules for Monitoring and Forecast of the Wheat Stripe Rust (Puccinia striiformis West.) (National Standard of the People’s Republic China, GB/T 15795–2011) and the Rules for the Investigation and Forecast of Wheat Leaf Rust (Puccinia recondita Rob. et Desm.) (Agricultural Industry Standard of the People’s Republic China, NY/T 617–2002), single leaves of stripe rust and leaf rust with different severity levels on different wheat varieties were collected from the wheat fields and the controlled-climate chamber. On each collected, diseased, single wheat leaf, there were only typical symptoms of wheat stripe rust or wheat leaf rust, without any interference from symptoms caused by other diseases and insect pests. After the disease symptoms appeared on the inoculated wheat seedlings, the single-leaf images of wheat stripe rust and wheat leaf rust were acquired many times under field conditions, and direct sunlight or insufficient light was avoided during image acquisition. The images of single wheat leaves collected from the controlled-climate chamber were acquired under laboratory environmental conditions. Each single diseased leaf was expanded to appear as flat as possible on a white background; the leaf image was taken using an iPhone 6S smartphone or a Nikon D700 digital camera (Nikon Corp., Tokyo, Japan) with the lens perpendicular to the leaf under good light conditions. The sizes of the images (jpeg format) acquired using the iPhone 6S smartphone and the Nikon D700 digital camera were 4032 × 3024 pixels and 4256 × 2832 pixels, respectively. The images of single diseased leaves infected by wheat leaf rust, collected from the controlled-climate chamber, were acquired between 1 March 2021 and 2 July 2021, and between 5 January 2022 and 20 February 2022. The images of single diseased leaves infected by wheat stripe rust, collected from the controlled-climate chamber, were acquired between 1 September 2021 and 31 December 2021. The quantities of the acquired single-leaf images of stripe rust and leaf rust in this study are shown in Table 1, and the samples of the acquired disease images are shown in Figure 2a–i and Figure 3a–f.

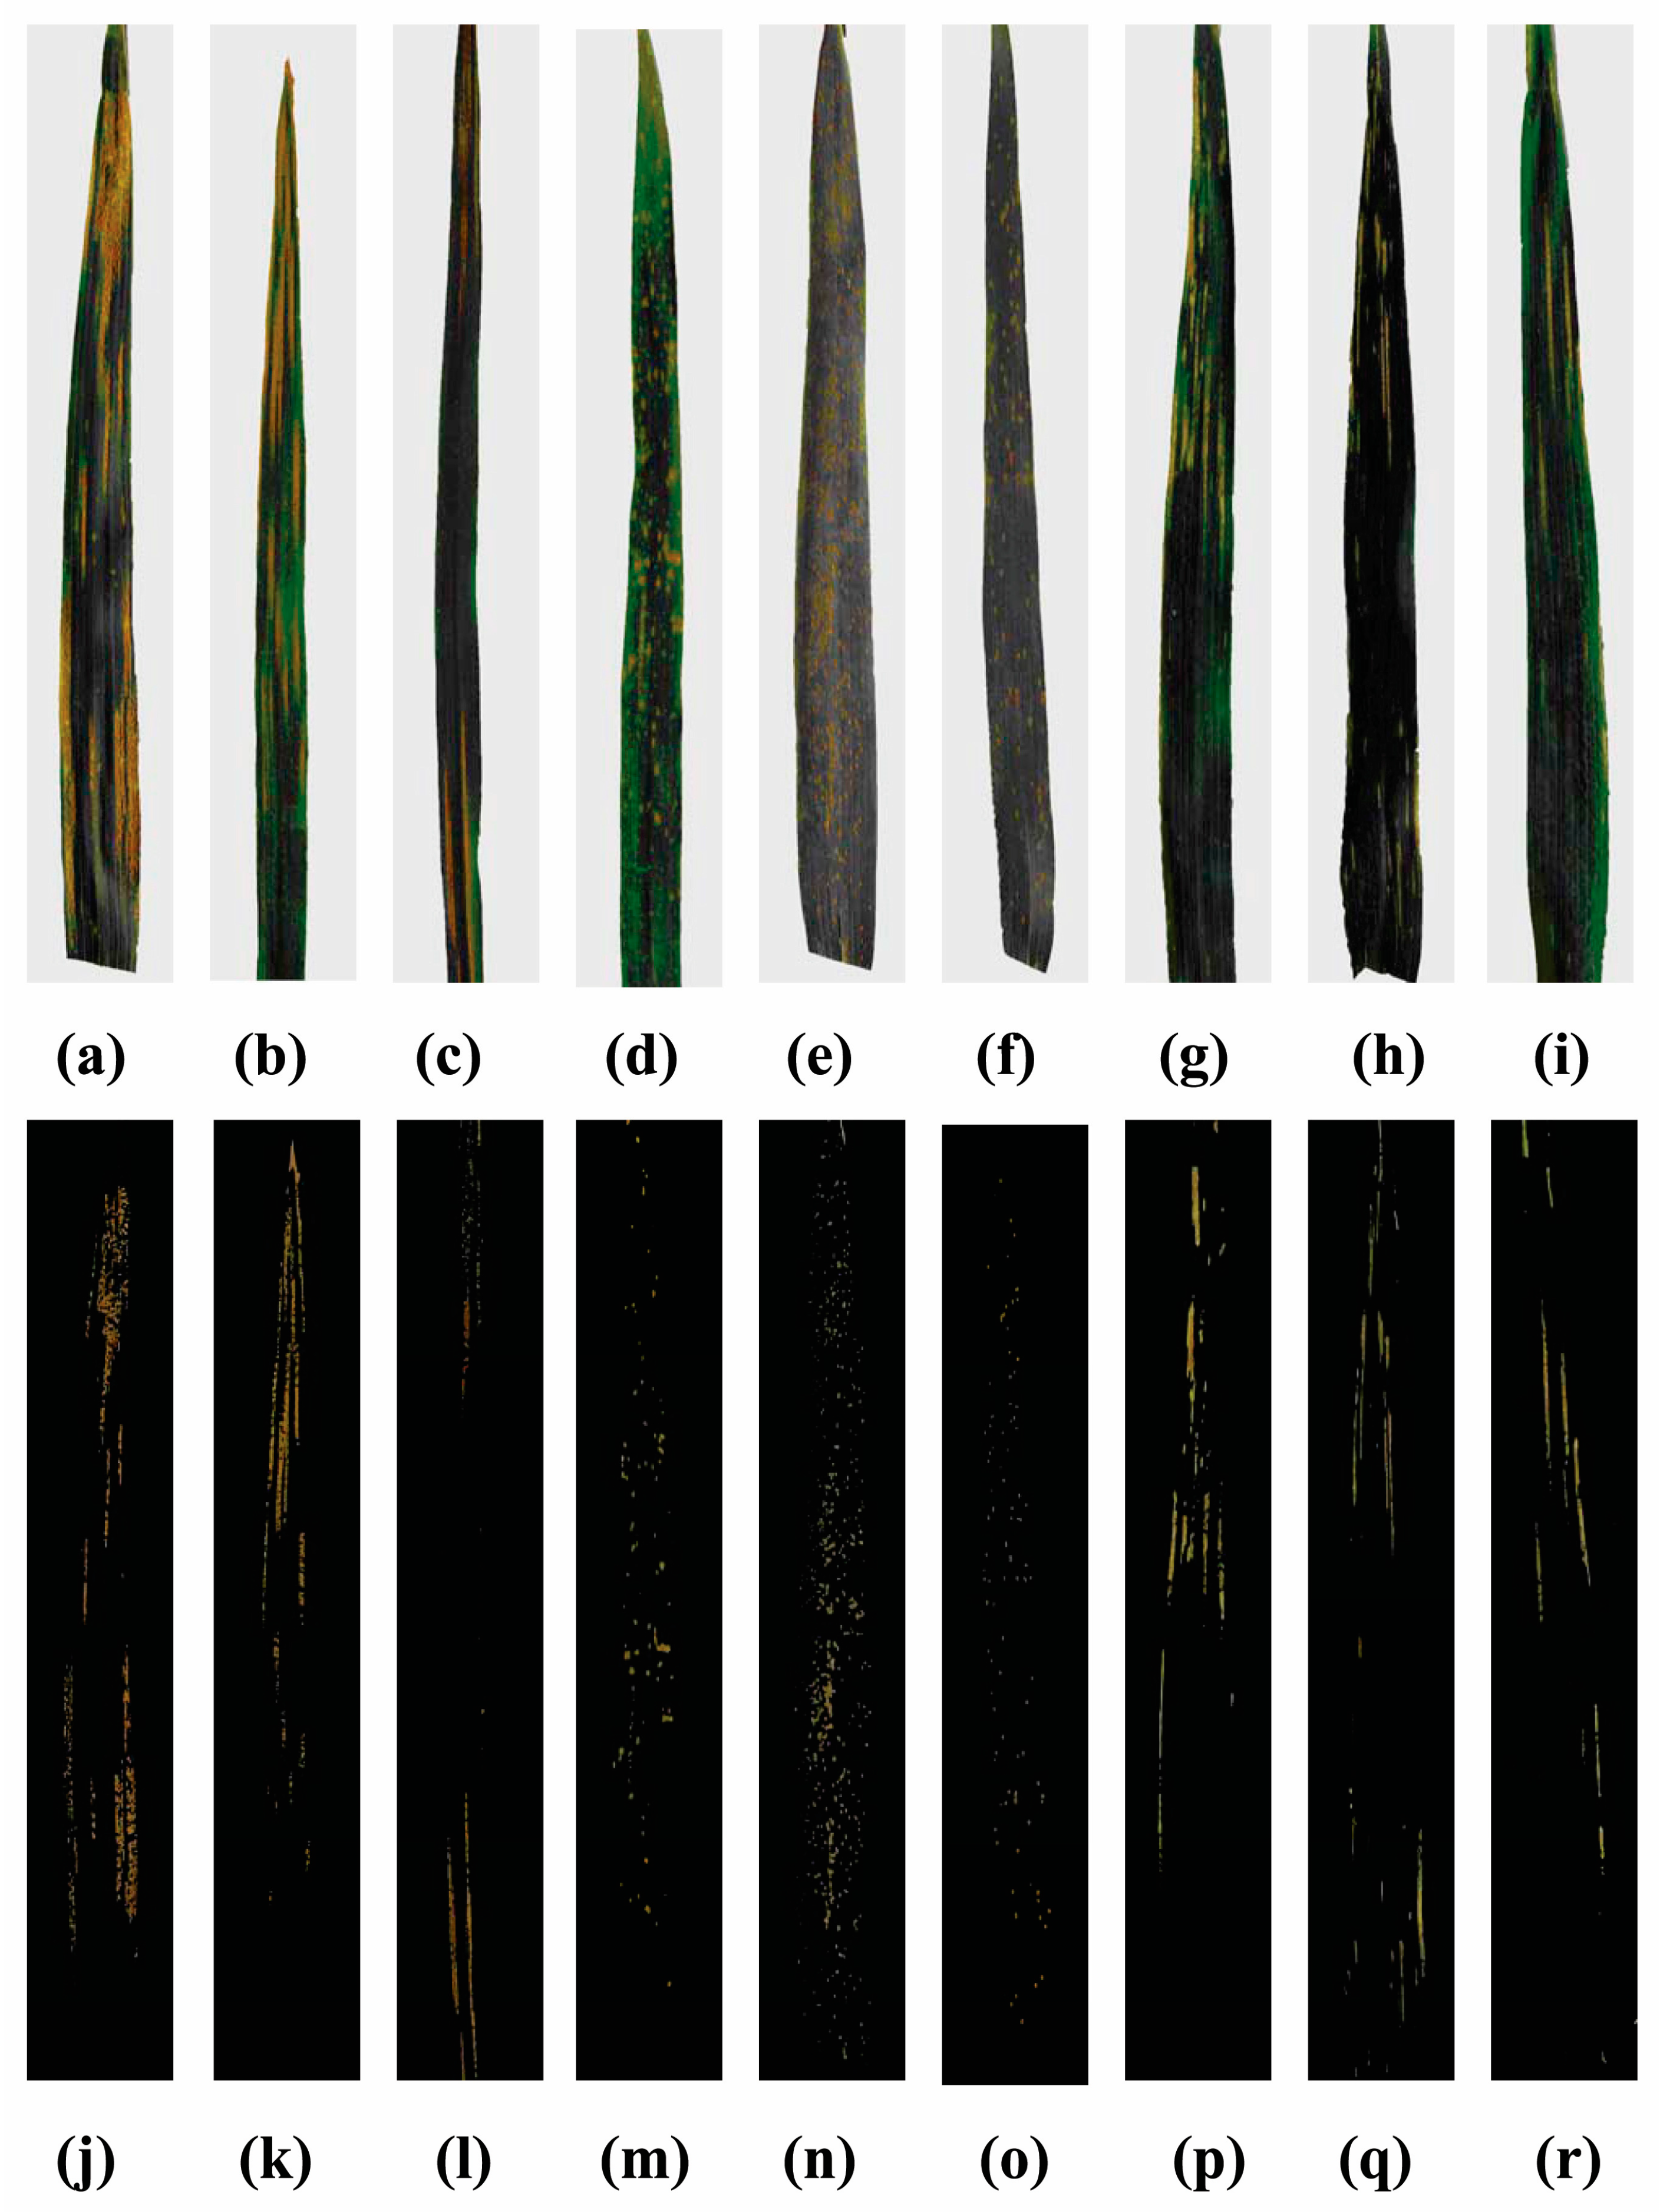
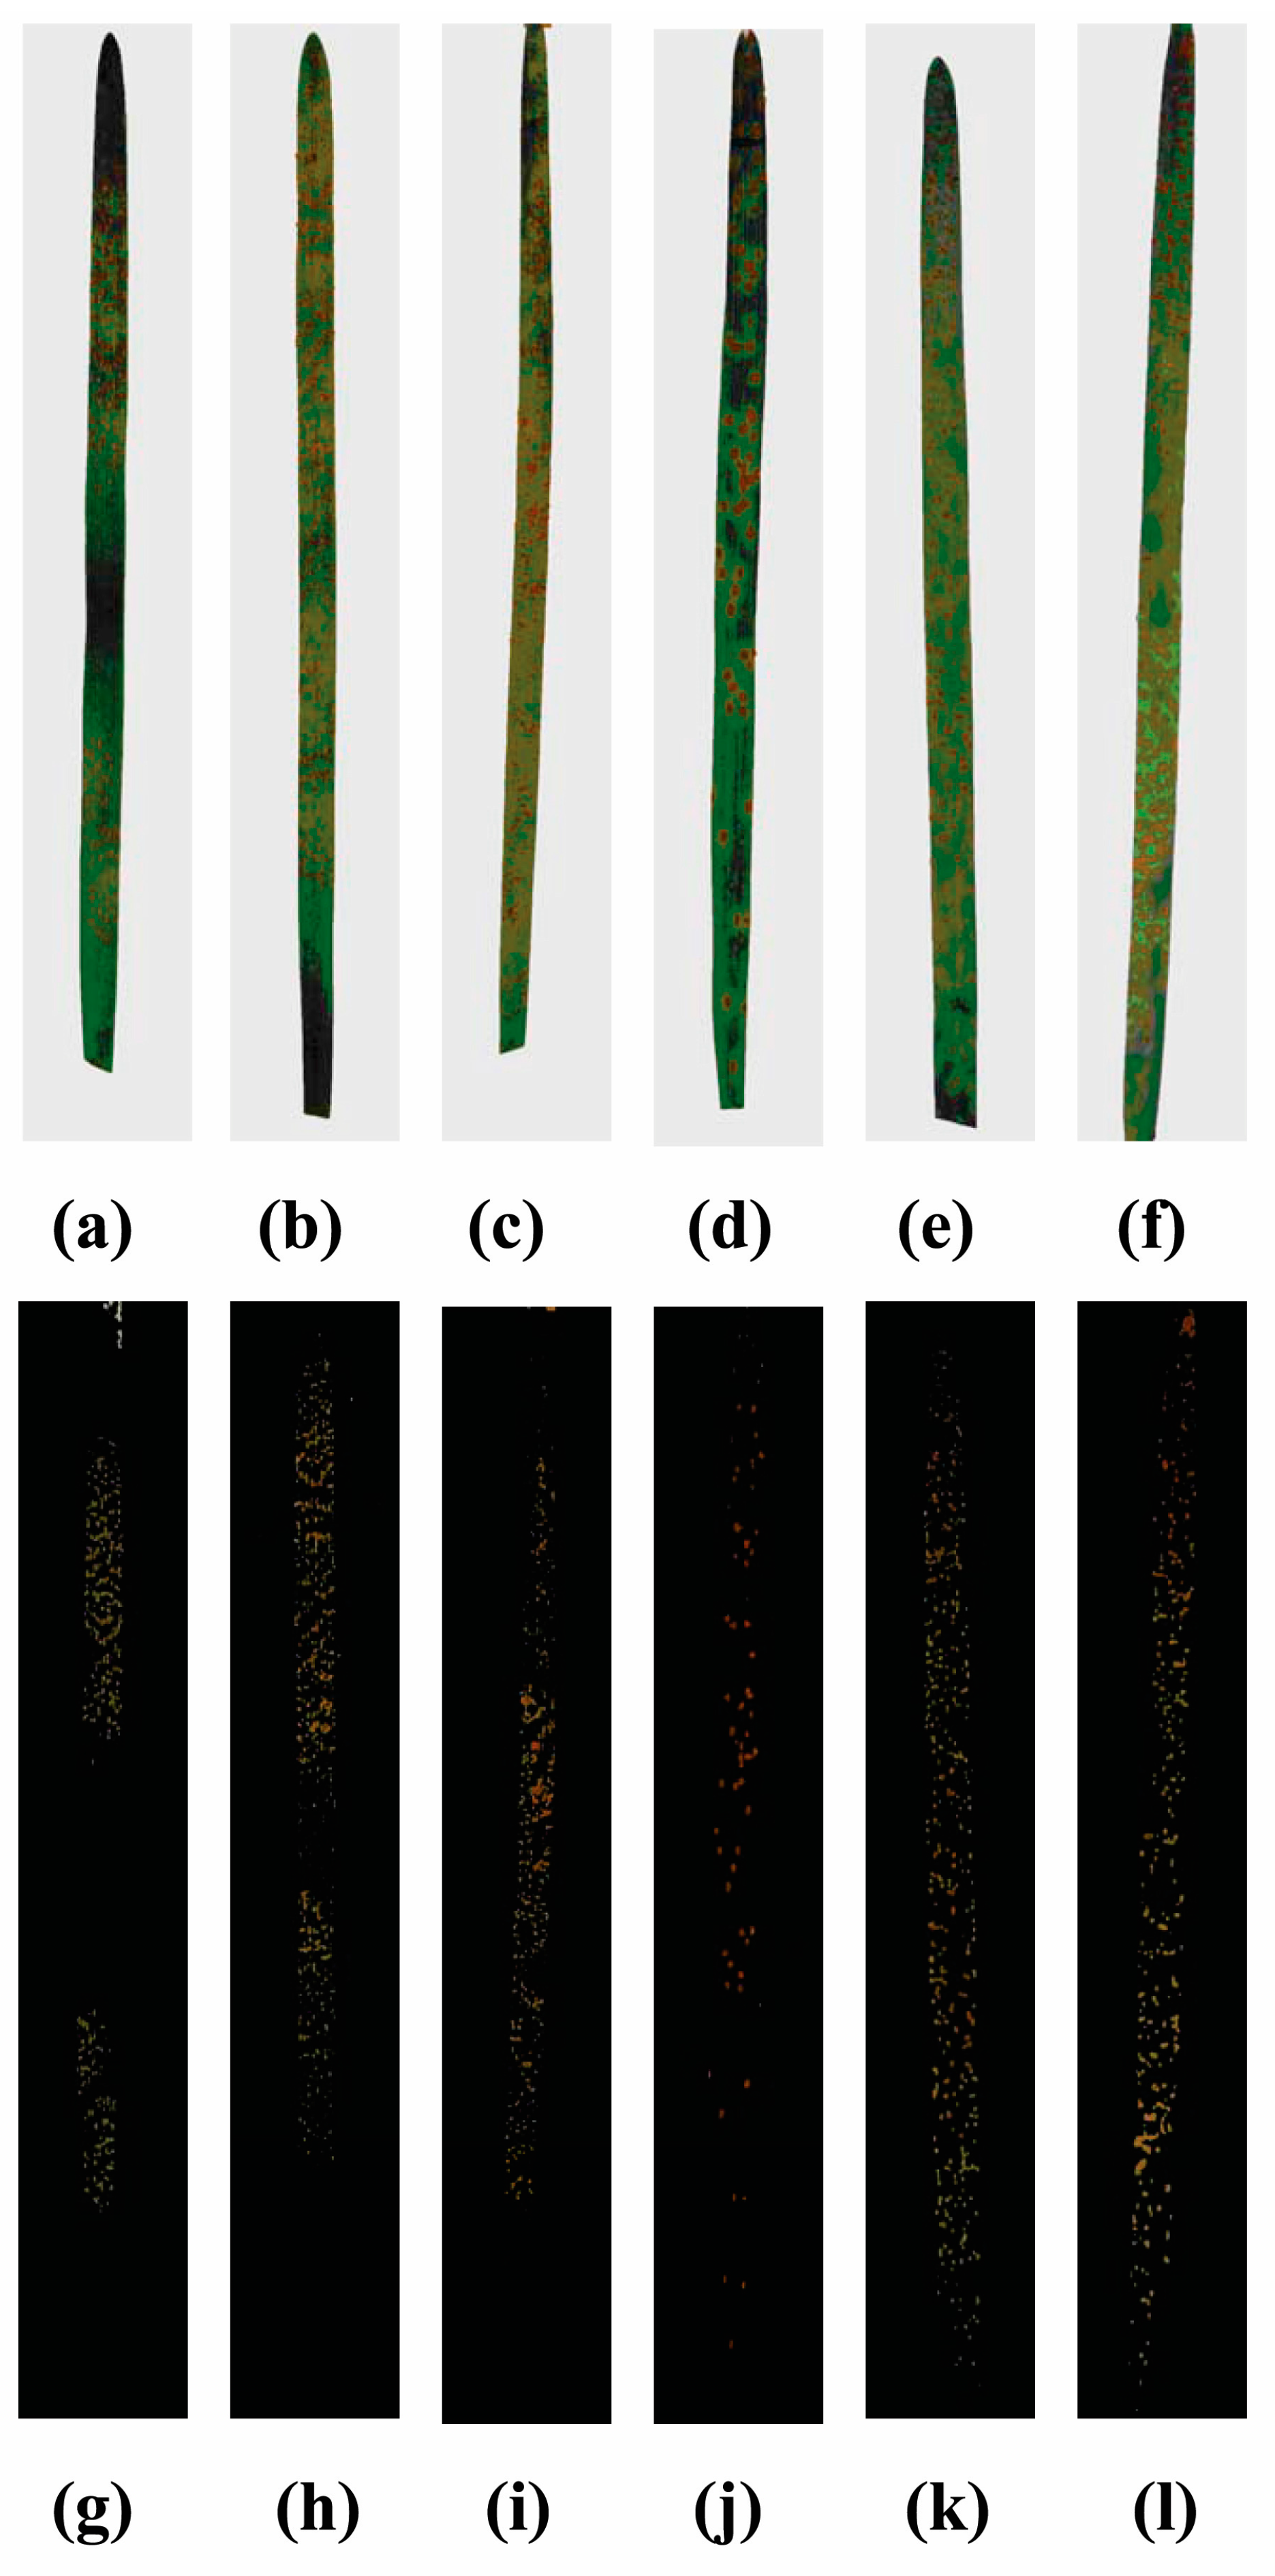
2.2. Disease Image Preprocessing and Lesion Image Segmentation

To reduce noise interference and improve image processing speed, image preprocessing operations, including image scaling, median filtering, and morphological opening and closing using reconstruction operations, were successively performed on all the acquired disease images. All the image preprocessing operations were performed in the software MATLAB 2019b (MathWorks, Natick, MA, USA). Image scaling was performed using the nearest-neighbor interpolation algorithm, and each original single-diseased-leaf image was scaled to 1703 × 1133 pixels. The median filtering algorithm based on a 3 × 3 filtering window was used to denoise each disease image. The morphological opening and closing operations of the R, G, and B color components of each disease image were performed by using the circular structure element with a radius of 3, and then reconstruction operations were carried out to obtain a new color disease image.
As the difference between the single leaf and the corresponding background in each single diseased leaf image acquired in this study was very obvious, in the software MATLAB R2019b, the Otsu threshold segmentation method (i.e., the maximization of interclass variance method) was used to segment the single diseased leaf from the background in an acquired disease image, and then the K-means clustering algorithm [41,51] was used to implement lesion image segmentation; thus, the segmented color lesion image and segmented binary lesion image were obtained. The segmented color lesion images of the images of wheat stripe rust and wheat leaf rust on different varieties acquired under field and laboratory environmental conditions are shown in Figure 2j–r and Figure 3g–l.

2.3. Feature Extraction from the Segmented Lesion Images

Color, texture, and shape features were extracted from the segmented color lesion images and the segmented binary lesion images of wheat stripe rust and wheat leaf rust. The 30 extracted color features included the first moments, the second moments, and the third moments of the gray images of the nine components in the RGB, HSV, and L*a*b* color spaces, and the three corresponding color ratios r, g, and b of the R, G, and B components. The 99 extracted texture features included the seven Hu invariant moments, gray-level co-occurrence matrix (GLCM)-based contrast, GLCM-based correlation, GLCM-based energy, and GLCM-based homogeneity of the gray images of the nine components in the RGB, HSV, and L*a*b* color spaces. The 11 extracted shape features included area, perimeter, circularity and complexity, and the seven Hu invariant moments of each segmented binary lesion image. A total of 140 features were extracted for each acquired single-diseased-leaf image.
Except the GLCM-based correlation of the gray images of the nine components in the RGB, HSV, and L*a*b* color spaces, and the shape features area and perimeter, the other 129 features extracted in this study were the same as the 129 lesion image features extracted by Qin et al. [27], and these features were calculated according to the methods described by Qin et al. [27]. Correlation is used to describe the similarity of GLCM elements in the row or column direction. Area refers to the total number of pixels in the lesion region/regions in a segmented lesion image. Perimeter is used to describe the boundary length of the lesion region/regions; that is, the total number of pixels on the edge contours of all the lesion regions in a segmented lesion image. Correlation, area, and perimeter were calculated according to Formulas (1)–(3), as described in References [41,52].
C o r r e l a t i o n = i = 0 P 1 j = 0 P 1 ( i , j ) 2 p ( i , j )
where P refers to the total number of pixels in the lesion region/regions, (i, j) denotes any coordinate in the lesion region/regions, and p(i, j) represents the color value of the point with the coordinate (i, j).
A r e a = x = 0 , y = 0 N f ( x , y )
where N refers to the lesion region/regions, and f(x, y) represents the unit coordinate of the lesion region/regions.
P e r i m e t e r = i = 1 N Δ l i
where N refers to the lesion region/regions, and ∆li represents the unit coordinate on the edge contours of all the lesion regions.
All the color, texture, and shape features were extracted by using programming with the MATLAB R2019b software. To conveniently present the extracted features, each extracted feature in this study was given a name and a number, as shown in Table 2. The features numbered 1–30 were color features, the ones numbered 31–129 were texture features, and the ones numbered 130–140 were shape features. In Table 2, the feature names r, g, and b denote the three color ratios of the R, G, and B components, respectively. The feature name μ1RGB_R denotes the first moment of the gray image of the R component in the RGB color space; the feature name Φ1RGB_R denotes the first Hu invariant moment of the gray image of the R component in the RGB color space; the feature name Contrast RGB_R denotes the contrast of the gray image of the R component in the RGB color space, the feature name Φ1shape denotes the first Hu invariant moment of a segmented binary lesion image, and the rest can be deduced by analogy.

2.4. Feature Selection of the Segmented Lesion Images

To improve the speed of data processing and the model identification, feature selections were carried out using a combination of the ReliefF, 1R, CFS, and PCA feature selection methods and the SVM, BPNN, and RF modeling methods based on the multi-variety disease image dataset consisting of 1332 images (including 1020 images of stripe rust and 312 images of leaf rust) acquired in the wheat field in Shangzhuang Experimental Station, and the multi-variety disease image dataset consisting of 7280 images (including 3732 images of stripe rust and 3548 images of leaf rust) acquired under laboratory environmental conditions, respectively. Before feature selection, the values of all features extracted from the segmented lesion images were normalized to the range of 0–1 by using the following formula: X norm i = ( X i X min i ) / ( X max i X min i ) , where X norm i was the value of the ith feature after normalization, X i was the value of the ith feature before normalization, X min i was the minimum value of the ith feature before normalization, and X max i was the maximum value of the ith feature before normalization.
Firstly, the feature selection methods ReliefF, 1R, CFS, and PCA were used to conduct the feature selections based on the multi-variety disease image dataset consisting of the images acquired in the wheat field in Shangzhuang Experimental Station, and the multi-variety disease image dataset consisting of the images acquired under laboratory environmental conditions, respectively. The ReliefF, 1R, and CFS methods were implemented with the default values for the parameters involved in the software Weka (Waikato Environment for Knowledge Analysis) 3.8.5, developed by The University of Waikato in Hamilton, New Zealand.
For the ReliefF method, the importance ranking of each extracted feature was achieved according to the correlation between the feature and the categories. For the 1R method, the importance ranking of each feature was obtained according to the classification accuracy of the 1R classifier, which was built based on the corresponding single feature. For the ReliefF and 1R methods, a feature with a higher ranking is more important for disease identification, indicating that it is more likely that better identification results will be achieved if disease-identification modeling is conducted based on this feature. For the CFS method, the best combination of features used for disease-identification modeling can be directly obtained. To obtain the best feature combination, the correlation between the combination and the categories should be as high as possible, and the correlations among the features in the combination should be as low as possible. Feature selection using the PCA method was implemented in the MATLAB R2019b software in this study. In this software, the corrcoef function was used to calculate the correlation coefficient matrix, and then the eigenvalues, contribution rate of each principal component, and cumulative contribution rates of the principal components were calculated. A cumulative contribution rate greater than 95% was treated as the criterion for selecting the number of principal components.
The multi-variety disease images acquired in the wheat field in Shangzhuang Experimental Station and the multi-variety disease images acquired under laboratory environmental conditions were randomly divided into the training sets and the corresponding testing sets in ratios (training set: testing set) equal to 2:1. The training set constructed based on images acquired in the wheat field in Shangzhuang Experimental Station consisted of 888 disease images, including 680 images of wheat stripe rust and 208 images of wheat leaf rust; the corresponding testing set consisted of 444 disease images, including 340 images of wheat stripe rust and 104 images of wheat leaf rust. The training set constructed based on images acquired under laboratory environmental conditions consisted of 4853 disease images, including 2488 images of wheat stripe rust and 2365 images of wheat leaf rust; the corresponding testing set consisted of 2427 disease images, including 1244 images of wheat stripe rust and 1183 images of wheat leaf rust. A total of 475 multi-variety disease images of wheat stripe rust, acquired in the wheat field in Gangu Testing Station, were used to construct an additional testing set. With the features selected using the ReliefF, 1R, CFS, and PCA methods, the optimal SVM, BPNN, and RF models for disease identification were built based on the multi-variety disease images acquired in the wheat field in Shangzhuang Experimental Station and the multi-variety disease images acquired under laboratory environmental conditions, respectively. The identification accuracies of the corresponding training sets, testing sets, and additional testing set were calculated. Based on the criterion of using as few features as possible, and trying to include the three kinds of color, texture, and shape features under the premise of ensuring the identification performances of the built disease identification models, the optimal feature combinations were selected through comprehensive comparisons. Based on the corresponding selected optimal feature combinations, the SVM, BPNN, and RF modeling methods were used to build different individual-variety and multi-variety disease identification models in the subsequent research.
The SVM models for disease identification were built using the C-SVM in the LIBSVM-3.23 package [53]. The RBF function was chosen as the kernel function. The grid search algorithm and the 3-fold cross-validation method were applied to search the optimal penalty parameter C (Cbest) and the optimal kernel function parameter g (gbest). When the identification accuracy reached the highest level, the values of C and g were treated as optimal parameters for SVM modeling. The optimal SVM model for disease identification was built by using Cbest, gbest, and other parameters, with the default values.
The disease identification BPNN models with three layers, including an input layer, hidden layer, and output layer, were built by using the neural network toolbox in the MATLAB software. To obtain the optimal BPNN model for disease identification, the transfer function tansig was used in both the hidden layer and the output layer; the maximum number of epochs, the learning rate, and the goal of training performance were set to 3000, 0.05, and 0.01, respectively, and the default values were used for all the other parameters.
The RF modeling method makes voting decisions by constructing multiple decision trees. In this study, to build different disease identification RF models, the number of decision trees was set to 10, 20, 30, 40, 50, 60, 70, 80, and 100, respectively, and the default values were used for the other parameters. The optimal number of decision trees was determined according to the disease identification performances of the built RF models. Finally, the optimal RF model for disease identification was built using the optimal number of decision trees and other parameters with default values.

2.5. Building of Disease Identification Models of Stripe Rust and Leaf Rust on Different Wheat Varieties

2.5.1. Image Datasets for Building Disease Identification Models

For the single-leaf images of stripe rust and leaf rust on Beijing 0045, Mingxian 169, and Nongda 211 acquired in the wheat field in Shangzhuang Experimental Station, to ensure balance in the numbers of disease images of stripe rust and leaf rust used for disease-identification modeling, the disease images of wheat stripe rust on Beijing 0045, Mingxian 169, and Nongda 211 were evenly divided into two, four, and three parts, respectively, according to severity levels. Then, the images in individual parts of different severity levels of the same wheat varieties were combined into new image sub-datasets; thus, two image sub-datasets of Beijing 0045, four image sub-datasets of Mingxian 169, and three image sub-datasets of Nongda 211 were constructed. Subsequently, the images in each image sub-dataset were combined with the leaf rust images to construct a new dataset. Finally, a total of nine new image datasets were constructed, consisting of the stripe rust and leaf rust images. For the single-leaf images of stripe rust and leaf rust on Beijing 0045, Mingxian 169, and Nongda 211 acquired under laboratory environmental conditions, the stripe rust and leaf rust images of the corresponding wheat varieties formed three new image datasets. To build the individual-variety disease identification models, each of the 12 image datasets of wheat stripe rust and wheat leaf rust was divided into training sets and testing sets with ratios equal to 2:1 according to the different severity levels of each disease, and then the disease images in the training set and the testing set for each severity level of the two diseases were recombined into new training sets and testing sets, ensuring that the training set and the corresponding testing set used to build each model contained disease images of different severity levels. For the disease images acquired in the wheat field in Shangzhuang Experimental Station, two training sets (Training Set 1 and Training Set 2) and two corresponding testing sets (Testing Set 1 and Testing Set 2) of Beijing 0045, four training sets (Training Set 1, Training Set 2, Training Set 3, and Training Set 4) and four corresponding testing sets (Testing Set 1, Testing Set 2, Testing Set 3, and Testing Set 4) of Mingxian 169, and three training sets (Training Set 1, Training Set 2, and Training Set 3) and three corresponding testing sets (Testing Set 1, Testing Set 2, and Testing Set 3) of Nongda 211 were constructed, respectively. For the disease images acquired under laboratory environmental conditions, one training set and one corresponding testing set were constructed for Beijing 0045, Mingxian 169, and Nongda 211, respectively. The training and testing sets constructed to build the disease identification models using the acquired images of stripe rust and leaf rust on different wheat varieties from the wheat field in Shangzhuang Experimental Station and under laboratory environmental conditions are shown in Table 3.
To build the multi-variety disease identification models based on the disease images of the different wheat varieties acquired in the wheat field in Shangzhuang Experimental Station and under laboratory environmental conditions, the training sets and the corresponding testing sets constructed using images of stripe rust and leaf rust acquired in the wheat field in Shangzhuang Experimental Station and under laboratory environmental conditions were combined into a new training set and testing set, respectively. The new training set was composed of 5741 disease images, including 3168 images of stripe rust and 2573 images of leaf rust, and the new testing set was composed of 2871 disease images, including 1584 images of stripe rust and 1287 images of leaf rust. The disease identification models built based on the new training set were used to identify the images in the corresponding new testing set and the testing sets consisting of the individual variety disease images of the different wheat varieties acquired in the wheat field in Shangzhuang Experimental Station and under laboratory environmental conditions, with the aim of comparing the models’ identification performances.
When building the individual-variety disease identification models and multi-variety disease identification models, a total of 475 multi-variety disease images of wheat stripe rust acquired in the wheat field in Gangu Testing Station were used to construct an additional testing set to test the identification performance of each model.

2.5.2. Building of the Individual-Variety Disease Identification Models Based on the Disease Images of the Different Wheat Varieties Acquired in the Wheat Field in Shangzhuang Experimental Station

With the optimal feature combinations selected by using the feature selection methods ReliefF, 1R, CFS, and PCA, combined with the SVM, BPNN, and RF modeling methods based on the multi-variety disease images acquired in the wheat field in Shangzhuang Experimental Station, the individual-variety disease identification models of the images of different wheat varieties acquired in the wheat field in Shangzhuang Experimental Station were built using the SVM, BPNN, and RF modeling methods, as described above. By using the individual-variety disease identification SVM, BPNN, and RF models built based on different training sets of the wheat varieties Beijing 0045, Mingxian 169, and Nongda 211 consisting of the disease images acquired in the wheat field in Shangzhuang Experimental Station, the images in the individual-variety disease image testing sets acquired in the wheat field in Shangzhuang Experimental Station and under laboratory environmental conditions and the additional testing set consisting of the multi-variety disease images acquired in the wheat field in Gangu Testing Station were identified. The identification performances of the built models for the individual-variety disease images acquired in the wheat field in Shangzhuang Experimental Station and under laboratory environmental conditions as well as the multi-variety disease images acquired in the wheat field in Gangu Testing Station were evaluated and analyzed. The identification accuracies of the individual-variety disease identification models built based on the different training sets were calculated for the corresponding training sets and the different testing sets, respectively.

2.5.3. Building of the Individual-Variety Disease Identification Models Based on the Disease Images of the Different Wheat Varieties Acquired under Laboratory Environmental Conditions

With the optimal feature combinations selected using the feature selection methods ReliefF, 1R, CFS, and PCA, combined with the SVM, BPNN, and RF modeling methods based on the multi-variety disease images acquired under laboratory environmental conditions, the individual-variety disease identification models of the images of the different wheat varieties acquired under laboratory environmental conditions were built using the SVM, BPNN, and RF modeling methods, as described above. The individual-variety disease identification SVM, BPNN, and RF models, built based on the different training sets of the wheat varieties Beijing 0045, Mingxian 169, and Nongda 211, consisting of the disease images acquired under laboratory environmental conditions, were used to identify the images in the individual-variety disease image testing sets acquired in the wheat field in Shangzhuang Experimental Station and under laboratory environmental conditions, as well as the additional testing set consisting of the multi-variety disease images acquired in the wheat field in Gangu Testing Station. The identification performances of the built models regarding the individual-variety disease images acquired in the wheat field in Shangzhuang Experimental Station and under laboratory environmental conditions, and the multi-variety disease images acquired in the wheat field in Gangu Testing Station, were investigated. By using the individual-variety disease identification models built based on the different training sets, the identification accuracies of the corresponding training sets and the different testing sets were calculated, respectively.

2.5.4. Building of the Multi-Variety Disease Identification Models Based on the Disease Images of Different Wheat Varieties Acquired in the Wheat Field in Shangzhuang Experimental Station and under Laboratory Environmental Conditions

The optimal feature combinations were selected by using the feature selection methods ReliefF, 1R, CFS, and PCA, combined with the SVM, BPNN, and RF modeling methods based on the multi-variety disease images acquired in the wheat field in Shangzhuang Experimental Station. The optimal feature combinations were selected using the feature selection methods ReliefF, 1R, CFS, and PCA, combined with the SVM, BPNN, and RF modeling methods based on the multi-variety disease images acquired under laboratory environmental conditions. These were merged into new feature combinations according to the combined feature selection methods. With the new feature combinations, the multi-variety disease identification models based on the training set, composed of multi-variety disease images acquired in the wheat field in Shangzhuang Experimental Station and under laboratory environmental conditions, were built using the corresponding modeling methods that were used for feature selection. The disease identification SVM, BPNN, and RF models were built as described above. The disease identification SVM, BPNN, and RF models were used to identify the images in the training set composed of multi-variety disease images acquired in the wheat field in Shangzhuang Experimental Station and under laboratory environmental conditions, the individual-variety disease image testing sets acquired in the wheat field in Shangzhuang Experimental Station and under laboratory environmental conditions, and the additional testing set consisting of the multi-variety disease images acquired in the wheat field in Gangu Testing Station. The identification accuracies of the training set composed of multi-variety disease images acquired in the wheat field in Shangzhuang Experimental Station and under laboratory environmental conditions, the individual-variety disease image testing sets acquired in the wheat field in Shangzhuang Experimental Station and under laboratory environmental conditions, and the additional testing set consisting of the multi-variety disease images acquired in the wheat field in Gangu Testing Station, were calculated, respectively, and the identification performances of the built models on the disease images in the corresponding testing sets were investigated.

3. Results

3.1. Feature Selection Results of the Segmented Lesion Images

Feature selection results, as shown in Table 4, were achieved using the ReliefF, 1R, and CFS methods based on the multi-variety disease image dataset consisting of images acquired in the wheat field in Shangzhuang Experimental Station, and the multi-variety disease image dataset consisting of the images acquired under laboratory environmental conditions, respectively. Looking at the same disease image dataset, there were great differences among the feature selection results obtained using different feature selection methods. Based on the different disease image datasets, the feature selection results obtained using the same feature selection method were also greatly different. The feature selection results obtained by using the PCA method, based on the multi-variety disease image dataset consisting of the images acquired in the wheat field in Shangzhuang Experimental Station, showed that the cumulative contribution rate of the first 20 principal components reached up to 95.40%. The feature selection results obtained by using the PCA method, based on the multi-variety disease image dataset consisting of the images acquired under laboratory environmental conditions, showed that the cumulative contribution rate of the first 21 principal components reached 95.28%. Based on the multi-variety disease image dataset consisting of images acquired in the wheat field in Shangzhuang Experimental Station and the multi-variety disease image dataset consisting of images acquired under laboratory environmental conditions, the best feature combinations obtained by using the CFS method consisted of five features and two features, respectively. Since the best feature combinations only consisted of a few features, the features selected by using the CFS method were not used for disease identification modeling. In this study, with feature combinations consisting of the top 13, 20, and 27 features, selected by using the ReliefF and 1R methods, the multi-variety disease identification models were built using the SVM, BPNN, and RF modeling methods based on the training sets constructed using the multi-variety disease images acquired in the wheat field in Shangzhuang Experimental Station and the multi-variety disease images acquired under laboratory environmental conditions, with ratios of 2:1, respectively. With the first 20 principal components selected by using the PCA method, the multi-variety disease identification models were built using the SVM, BPNN, and RF modeling methods based on the training set constructed using the multi-variety disease images acquired in the wheat field in Shangzhuang Experimental Station, with a ratio of 2:1. With the first 21 principal components selected using the PCA method, the multi-variety disease identification models were built by using the SVM, BPNN, and RF modeling methods, based on the training set constructed using the multi-variety disease images acquired under laboratory environmental conditions, with a ratio of 2:1. The testing sets constructed using the multi-variety disease images acquired in the wheat field in Shangzhuang Experimental Station and the multi-variety disease images acquired under laboratory environmental conditions with ratios of 2:1, and the additional testing set consisting of the multi-variety disease images acquired in the wheat field in Gangu Testing Station, were used for model verification. The optimal feature combinations were determined by comprehensive comparisons, as described above.

3.1.1. Feature Selection Results Using the Different Feature Selection Methods Combined with the SVM Modeling Method

Disease identification results of the SVM models built with the top 13, 20, and 27 features, selected based on the multi-variety disease image dataset consisting of images acquired in the wheat field in Shangzhuang Experimental Station by using ReliefF and 1R, are shown in Table 5. For the SVM models, the identification accuracies of the training set and the testing set constructed by using the multi-variety disease images acquired in the wheat field in Shangzhuang Experimental Station were 98.87–100.00%, and the identification accuracies of the testing set consisting of the multi-variety disease images acquired under laboratory environmental conditions were 56.65–69.67%. For the built SVM model (both Cbest and gbest were 1.320) with the top 13 features in the importance ranking for disease identification, selected based on the multi-variety disease image dataset consisting of images acquired in the wheat field in Shangzhuang Experimental Station by using the 1R method, the identification accuracies of the training set and testing set constructed using the multi-variety disease images acquired in the wheat field in Shangzhuang Experimental Station both reached 100.00%. For the built SVM model (both Cbest and gbest were 0.021) with the first 20 principal components selected based on the multi-variety disease image dataset consisting of images acquired in the wheat field in Shangzhuang Experimental Station using the PCA method, the identification accuracies of the training set and the testing set constructed using the multi-variety disease images acquired in the wheat field in Shangzhuang Experimental Station were 99.89% and 100.00%, respectively; the identification accuracy of the testing set consisting of the multi-variety disease images acquired under laboratory environmental conditions was only 39.31%. For the SVM models built with the features selected based on the multi-variety disease image dataset consisting of images acquired in the wheat field in Shangzhuang Experimental Station using the ReliefF, 1R, and PCA methods, the identification accuracies of the additional testing set consisting of the multi-variety disease images acquired in the wheat field in Gangu Testing Station were 99.58–100.00%. According to comprehensive comparisons of the results, the optimal feature combination, selected by using the SVM modeling method, for building individual-variety disease identification models based on disease images of different wheat varieties acquired in the wheat field in Shangzhuang Experimental Station, was composed of the 13 most important features for disease identification. These were selected based on the multi-variety disease image dataset consisting of images acquired in the wheat field in Shangzhuang Experimental Station using the 1R method.
Disease identification results of the SVM models built with the top 13, 20, and 27 features, selected based on the multi-variety disease image dataset consisting of images acquired under laboratory environmental conditions by using feature selection methods including ReliefF and 1R, are shown in Table 6. For the built SVM models, the identification accuracies of the training set and the testing set constructed using the multi-variety disease images acquired under laboratory environmental conditions were 99.67–100.00%, and the identification accuracies of the testing set consisting of the multi-variety disease images acquired in the wheat field in Shangzhuang Experimental Station were low. For the built SVM model (Cbest = 256.000 and gbest = 1.320) with the top 13 features (including color, texture, and shape features) in the importance ranking for disease identification selected based on the multi-variety disease image dataset consisting of images acquired under laboratory environmental conditions using the 1R method, the identification accuracies of the training set and the testing set constructed using multi-variety disease images acquired under laboratory environmental conditions were 99.88% and 99.67%, respectively. For the SVM model (Cbest = 0.027 and gbest = 0.036) built with the first 21 principal components selected based on the multi-variety disease image dataset consisting of images acquired under laboratory environmental conditions using the PCA method, the identification accuracies of the training set and the testing set constructed using the multi-variety disease images acquired under laboratory environmental conditions were 99.98% and 52.49%, respectively; the identification accuracy of the testing set consisting of the multi-variety disease images acquired in the wheat field in Shangzhuang Experimental Station was 23.42%, and the identification accuracy of the additional testing set consisting of the multi-variety disease images acquired in the wheat field in Gangu Testing Station was only 3.57%. According to comprehensive comparisons of the results, the optimal feature combination, selected by using the SVM modeling method for building individual-variety disease identification models based on disease images of different wheat varieties acquired under laboratory environmental conditions, was composed of the 13 most important features for disease identification. These were selected based on the multi-variety disease image dataset consisting of images acquired under laboratory environmental conditions using the 1R method.

3.1.2. Feature Selection Results Using the Different Feature Selection Methods Combined with the BPNN Modeling Method

Disease identification results of the BPNN models built with the top 13, 20, and 27 features selected based on the multi-variety disease image dataset consisting of images acquired in the wheat field in Shangzhuang Experimental Station using the ReliefF and 1R methods, respectively, are shown in Table 7. For the built optimal BPNN models, the identification accuracies of the training set and the testing set constructed using the multi-variety disease images acquired in the wheat field in Shangzhuang Experimental Station were 97.52–99.66%, and the identification accuracies of the testing set consisting of the multi-variety disease images acquired under laboratory environmental conditions were 3.96–52.37%. For the optimal BPNN model, built with the top 13 features in the importance ranking for disease identification selected based on the multi-variety disease image dataset consisting of images acquired in the wheat field in Shangzhuang Experimental Station using the 1R method, the identification accuracies of the training set and the testing set constructed using the multi-variety disease images acquired in the wheat field in Shangzhuang Experimental Station were 99.44% and 98.42%, respectively. The identification accuracy of the additional testing set consisting of the multi-variety disease images acquired in the wheat field in Gangu Testing Station was 96.21%. For the optimal BPNN model, built with the first 20 principal components selected based on the multi-variety disease image dataset consisting of images acquired in the wheat field in Shangzhuang Experimental Station using the PCA method, the identification accuracies of the training set and the testing set constructed using the multi-variety disease images acquired in the wheat field in Shangzhuang Experimental Station were 99.89% and 95.50%, respectively; the identification accuracy of the additional testing set consisting of the multi-variety disease images acquired in the wheat field in Gangu Testing Station was 98.95%, and the identification accuracy of the testing set consisting of the multi-variety disease images acquired under laboratory environmental conditions was only 20.11%. According to comprehensive comparisons of the results, the optimal feature combination, selected using the BPNN modeling method for building individual-variety disease identification models based on disease images of different wheat varieties acquired in the wheat field in Shangzhuang Experimental Station, comprised the 13 most important features for disease identification, selected based on the multi-variety disease image dataset consisting of images acquired in the wheat field in Shangzhuang Experimental Station using the 1R method.
The disease identification results of the BPNN models built with the top 13, 20, and 27 features, selected based on the multi-variety disease image dataset consisting of images acquired under laboratory environmental conditions using the ReliefF and 1R methods, respectively, are shown in Table 8. For the optimal BPNN models, the identification accuracies of the training set and the testing set constructed using the multi-variety disease images acquired under laboratory environmental conditions were 98.64–99.92%, and the identification accuracies of the testing set consisting of multi-variety disease images acquired in the wheat field in Shangzhuang Experimental Station were low. For the optimal BPNN model built with the top 27 features (including color, texture, and shape features) in the importance ranking for disease identification selected based on the multi-variety disease image dataset consisting of the images acquired under laboratory environmental conditions using the 1R method, the identification accuracies of the training set and the testing set constructed using multi-variety disease images acquired under laboratory environmental conditions were 99.92% and 99.84%, respectively, and the identification accuracy of the additional testing set consisting of multi-variety disease images acquired in the wheat field in Gangu Testing Station was 99.37%. For the optimal BPNN model built with the first 21 principal components selected based on the multi-variety disease image dataset consisting of images acquired under laboratory environmental conditions using the PCA method, the identification accuracies of the training set and the testing set constructed using the multi-variety disease images acquired under laboratory environmental conditions were 99.59% and 48.74%, respectively; the identification accuracies of the testing set consisting of multi-variety disease images acquired in the wheat field in Shangzhuang Experimental Station and the additional testing set consisting of multi-variety disease images acquired in the wheat field in Gangu Testing Station were 11.04% and 16.21%, respectively. According to comprehensive comparisons of the results, the optimal feature combination, selected by using the BPNN modeling method for building individual-variety disease identification models based on disease images of different wheat varieties acquired under laboratory environmental conditions, was composed of the 27 most important features for disease identification selected based on the multi-variety disease image dataset consisting of images acquired under laboratory environmental conditions using the 1R method.

3.1.3. Feature Selection Results Using the Different Feature Selection Methods Combined with the RF Modeling Method

Disease identification results of the RF models built with the top 13, 20, and 27 features, selected based on the multi-variety disease image dataset consisting of images acquired in the wheat field in Shangzhuang Experimental Station using the ReliefF and 1R methods, respectively, are shown in Table 9. For the optimal RF models, the identification accuracies of the training set and the testing set constructed using multi-variety disease images acquired in the wheat field in Shangzhuang Experimental Station were 97.07–100.00%, and the identification accuracies of the testing set consisting of multi-variety disease images acquired under laboratory environmental conditions were 43.02–51.92%. For the optimal RF model built with the top 13 features in the importance ranking for disease identification selected based on the multi-variety disease image dataset consisting of images acquired in the wheat field in Shangzhuang Experimental Station using the 1R method, the identification accuracies of the training set and the testing set constructed using multi-variety disease images acquired in the wheat field in Shangzhuang Experimental Station were 100.00% and 99.10%, respectively, and the identification accuracy of the additional testing set consisting of multi-variety disease images acquired in the wheat field in Gangu Testing Station was 93.47%. For the optimal RF model built with the first 20 principal components selected based on the multi-variety disease image dataset consisting of images acquired in the wheat field in Shangzhuang Experimental Station using the PCA method, the identification accuracies of the training set and the testing set constructed using multi-variety disease images acquired in the wheat field in Shangzhuang Experimental Station were 100.00% and 99.77%, respectively; the identification accuracy of the additional testing set consisting of multi-variety disease images acquired in the wheat field in Gangu Testing Station was 97.05%, and the identification accuracy of the testing set consisting of multi-variety disease images acquired under laboratory environmental conditions was only 25.05%. According to comprehensive comparisons of the results, the optimal feature combination, selected by using the RF modeling method for building individual-variety disease identification models based on disease images of different wheat varieties acquired in the wheat field in Shangzhuang Experimental Station, comprised the 13 most important features for disease identification selected based on the multi-variety disease image dataset consisting of images acquired in the wheat field in Shangzhuang Experimental Station using the 1R method.
The disease identification results of the RF models built with the top 13, 20, and 27 features, selected based on the multi-variety disease image dataset consisting of images acquired under laboratory environmental conditions using the ReliefF and 1R methods, respectively, are shown in Table 10. For the built optimal RF models, the identification accuracies of the training set and the testing set constructed using the multi-variety disease images acquired under laboratory environmental conditions were 97.32–100.00%, and the identification accuracies of the testing set consisting of the multi-variety disease images acquired in the wheat field in Shangzhuang Experimental Station were 27.03–99.10%. For the optimal RF model, built with the top 27 features (including color, texture, and shape features) in the importance ranking for disease identification selected based on the multi-variety disease image dataset consisting of images acquired under laboratory environmental conditions using the 1R method, the identification accuracies of the training set and the testing set constructed using the multi-variety disease images acquired under laboratory environmental conditions were 100.00% and 99.37%, respectively; the identification accuracy of the testing set consisting of the multi-variety disease images acquired in the wheat field in Shangzhuang Experimental Station was 99.10%, and the identification accuracy of the additional testing set consisting of the multi-variety disease images acquired in the wheat field in Gangu Testing Station was 94.95%. For the optimal RF model built with the first 21 principal components, selected based on the multi-variety disease image dataset consisting of images acquired under laboratory environmental conditions using the PCA method, the identification accuracies of the training set and the testing set constructed using the multi-variety disease images acquired under laboratory environmental conditions were 100.00% and 87.68%, respectively, and the identification accuracies of the testing set consisting of the multi-variety disease images acquired in the wheat field in Shangzhuang Experimental Station and the additional testing set consisting of the multi-variety disease images acquired in the wheat field in Gangu Testing Station were 20.50% and 16.63%, respectively. According to comprehensive comparisons of the results, the optimal feature combination, selected using the RF modeling method for building individual-variety disease identification models based on disease images of different wheat varieties acquired under laboratory environmental conditions, comprised the 27 most important features for disease identification, selected based on the multi-variety disease image dataset consisting of images acquired under laboratory environmental conditions using the 1R method.

3.2. Identification Results of the Disease Identification Models of Stripe Rust and Leaf Rust Built Based on Disease Images of the Different Wheat Varieties

3.2.1. Identification Results of the Individual-Variety Disease Identification Models Built Based on Disease Images of the Different Wheat Varieties Acquired in the Field in Shangzhuang Experimental Station

With the 13 most important features for disease identification selected based on the multi-variety disease images acquired in the wheat field in Shangzhuang Experimental Station using the 1R method combined with the SVM, BPNN, and RF modeling methods, the individual-variety disease identification models were built using the SVM, BPNN, and RF modeling methods based on the two training sets (Training Set 1 and Training Set 2) of Beijing 0045, consisting of disease images acquired in the wheat field in Shangzhuang Experimental Station. The images in the corresponding two testing sets of Beijing 0045, the four testing sets of Mingxian 169, and the three testing sets of Nongda 211 acquired in the wheat field in Shangzhuang Experimental Station, the testing sets of Beijing 0045, Mingxian 169, and Nongda 211 acquired under laboratory environmental conditions, and the additional testing set consisting of the multi-variety disease images acquired in the wheat field in Gangu Testing Station were identified using the built models; the identification results are shown in Table 11. Based on Training Set 1 of Beijing 0045, acquired in the wheat field in Shangzhuang Experimental Station, the optimal SVM model was built with a Cbest value of 48.503 and gbest of 0.190. Based on Training Set 2 of Beijing 0045, acquired in the wheat field in Shangzhuang Experimental Station, the optimal SVM model was built with the Cbest value of 48.503 and gbest of 0.250. Based on Training Set 1 and Training Set 2 of Beijing 0045, acquired in the wheat field in Shangzhuang Experimental Station, the optimal RF models were built with decision tree numbers equal to 30 and 40, respectively. The identification accuracies of the testing sets of Beijing 0045 and Mingxian 169 acquired in the wheat field in Shangzhuang Experimental Station using the SVM, BPNN, and RF models were 87.32–99.13%. In particular, the identification accuracies of the testing sets of Beijing 0045 and Mingxian 169 acquired in the wheat field in Shangzhuang Experimental Station using the SVM models were 98.59–99.13%. The identification accuracies of the three testing sets of Nongda 211 acquired in the wheat field in Shangzhuang Experimental Station using the SVM and RF models were 60.00–77.50%. For the individual-variety disease image testing sets of the three wheat varieties acquired under laboratory environmental conditions, the identification accuracies achieved using the SVM models were 66.75–69.24%, those achieved using the BPNN models were 37.58–54.32%, and those achieved using the RF models were 53.01–63.08%. For the SVM models based on Training Set 1 and Training Set 2 of Beijing 0045, acquired in the wheat field in Shangzhuang Experimental Station, the identification accuracies of the additional testing set acquired in Gangu Testing Station were 99.79% and 99.16%, respectively. The results showed that when the SVM, BPNN, and RF models built based on the different training sets of Beijing 0045, acquired in the wheat field in Shangzhuang Experimental Station, were used to identify the individual-variety disease images acquired in the wheat field in Shangzhuang Experimental Station and under laboratory environmental conditions, there were great differences among the identification accuracies of the corresponding testing sets. The results indicated that the identification performances of the SVM models were optimal, and that image identification of wheat stripe rust and wheat leaf rust on Beijing 0045 and Mingxian 169 in Shangzhuang Experimental Station could be accomplished using the SVM models.
With the 13 most important features for disease identification, selected based on the multi-variety disease images acquired in the wheat field in Shangzhuang Experimental Station using the 1R method combined with the SVM, BPNN, and RF modeling methods, the individual-variety disease identification models were built using the SVM, BPNN, and RF modeling methods based on the four training sets (Training Set 1, Training Set 2, Training Set 3, and Training Set 4) of Mingxian 169 consisting of the disease images acquired in the wheat field in Shangzhuang Experimental Station. The built models were used to conduct image identification for the corresponding four testing sets of Mingxian 169, the two testing sets of Beijing 0045, and the three testing sets of Nongda 211 acquired in the wheat field in Shangzhuang Experimental Station, the testing sets of Beijing 0045, Mingxian 169, and Nongda 211 acquired under laboratory environmental conditions, and the additional testing set consisting of the multi-variety disease images acquired in the wheat field in Gangu Testing Station, respectively; the identification results are shown in Table 12. Based on Training Set 1 of Mingxian 169, acquired in the wheat field in Shangzhuang Experimental Station, the optimal SVM model was built with a Cbest value of 1.000 and a gbest of 5.278. Based on Training Set 2 of Mingxian 169 acquired in the wheat field in Shangzhuang Experimental Station, the optimal SVM model was built with a Cbest of 1.741 and a gbest of 0.435. Based on Training Set 3 of Mingxian 169 acquired in the wheat field in Shangzhuang Experimental Station, the optimal SVM model was built with a Cbest of 0.574 and a gbest of 4.000. Based on Training Set 4 of Mingxian 169 acquired in the wheat field in Shangzhuang Experimental Station, the optimal SVM model was built with a Cbest of 1.320 and a gbest of 1.000. For the four built SVM models, the identification accuracies of the corresponding training sets of Mingxian 169 which were used for modeling were all 100.00%; the identification accuracies of the corresponding testing sets of Mingxian 169 acquired in the wheat field in Shangzhuang Experimental Station were 97.18–100.00%; the identification accuracies of the two testing sets of Beijing 0045 acquired in the wheat field in Shangzhuang Experimental Station were 90.35–94.78%, and the identification accuracies of the three testing sets of Nongda 211 acquired in the wheat field in Shangzhuang Experimental Station were 45.00–75.00%. For the BPNN models, the identification accuracies of the training and testing sets of Mingxian 169 acquired in the wheat field in Shangzhuang Experimental Station were 94.37–100.00%. For the BPNN model built based on Training Set 2 of Mingxian 169 acquired in the wheat field in Shangzhuang Experimental Station, the identification accuracies of Testing Set 1, Testing Set 2, and Testing Set 3 of Nongda 211, acquired in the wheat field in Shangzhuang Experimental Station were 71.79%, 80.00%, and 85.00%, respectively. Using the BPNN models built based on Training Set 1, Training Set 3, and Training Set 4 of Mingxian 169, acquired in the wheat field in Shangzhuang Experimental Station, poor identification performances were obtained for the images of Nongda 211 acquired in the wheat field in Shangzhuang Experimental Station. Based on Training Set 1, Training Set 2, Training Set 3, and Training Set 4 of Mingxian 169 acquired in the wheat field in Shangzhuang Experimental Station, the optimal RF models were built with the decision tree numbers 30, 10, 40, and 30, respectively. For these RF models, the identification accuracies of the training and testing sets of Mingxian 169 acquired in the wheat field in Shangzhuang Experimental Station were 92.96–100.00%; the identification accuracies of the testing sets of Beijing 0045 and Nongda 211 acquired in the wheat field in Shangzhuang Experimental Station were 70.00–92.50%. For the SVM, BPNN, and RF models, built based on the different training sets of Mingxian 169 acquired in the wheat field in Shangzhuang Experimental Station, the identification accuracies of the individual-variety disease image testing sets of the three wheat varieties Beijing 0045, Mingxian 169, and Nongda 211, acquired under laboratory environmental conditions, were low. For the individual-variety disease image testing sets of the three wheat varieties acquired under laboratory environmental conditions, the identification accuracies obtained using the SVM models were 52.46–74.04%; those obtained using the BPNN models were 43.43–59.85%, and those obtained using the RF models were 52.09–72.39%. Among the SVM, BPNN, and RF models built based on the different training sets of Mingxian 169 acquired in the wheat field in Shangzhuang Experimental Station, the identification accuracies of the additional testing set acquired in Gangu Testing Station were 80.84–93.26%, with the exception of the BPNN models built based on Training Set 1 and Training Set 3, which had identification accuracies less than 80%. The results demonstrated that the identification performances of the SVM models were optimal among the models built based on the four Mingxian 169 training sets acquired in the wheat field in Shangzhuang Experimental Station, and that wheat stripe rust and wheat leaf rust on Mingxian 169 and Beijing 0045 in Shangzhuang Experimental Station could be identified by using the SVM models.
With the 13 most important features for disease identification, selected based on the multi-variety disease images acquired in the wheat field in Shangzhuang Experimental Station using the 1R method combined with the SVM, BPNN, and RF modeling methods, the individual-variety disease identification models were built using the SVM, BPNN, and RF modeling methods based on the three training sets (Training Set 1, Training Set 2, and Training Set 3) of Nongda 211, consisting of the disease images acquired in the wheat field in Shangzhuang Experimental Station. The built models were used to conduct image identification for the corresponding three testing sets of Nongda 211, the two testing sets of Beijing 0045, and the four testing sets of Mingxian 169 acquired in the wheat field in Shangzhuang Experimental Station, the testing sets of Beijing 0045, Mingxian 169, and Nongda 211 acquired under laboratory environmental conditions, and the additional testing set consisting of multi-variety disease images acquired in the wheat field in Gangu Testing Station, respectively; the identification results are shown in Table 13. Based on Training Set 1 of Nongda 211 acquired in the wheat field in Shangzhuang Experimental Station, the optimal SVM model was built with a Cbest equal to 5.278 and a gbest equal to 0.435. Based on Training Set 2 of Nongda 211 acquired in the wheat field in Shangzhuang Experimental Station, the optimal SVM model was built with a Cbest equal to 12.126 and a gbest equal to 0.0825. Based on Training Set 3 of Nongda 211 acquired in the wheat field in Shangzhuang Experimental Station, the optimal SVM model was built with a Cbest equal to 1.000 and a gbest equal to 0.758. For the four built SVM models, the identification accuracies of the three testing sets of Nongda 211 acquired in the wheat field in Shangzhuang Experimental Station were 89.74–97.50%; those of the two testing sets of Beijing 0045 acquired in the wheat field in Shangzhuang Experimental Station were 55.26–60.87%, and those of the four testing sets of Mingxian 169 acquired in the wheat field in Shangzhuang Experimental Station were 76.06–83.10%. For the built BPNN models, the identification accuracies of the corresponding three testing sets of Nongda 211 acquired in the wheat field in Shangzhuang Experimental Station were 87.18–97.50%, and those of the two testing sets of Beijing 0045 acquired in the wheat field in Shangzhuang Experimental Station were 50.43–55.65%; there were great differences among the identification accuracies (53.52–71.83%) of the four testing sets of Mingxian 169 acquired in the wheat field in Shangzhuang Experimental Station. Based on Training Set 1, Training Set 2, and Training Set 3 of Nongda 211, acquired in the wheat field in Shangzhuang Experimental Station, the optimal RF models were built with decision tree numbers equal to 30, 40, and 40, respectively. For these RF models, the identification accuracies of the three testing sets of Nongda 211 acquired in the wheat field in Shangzhuang Experimental Station were 92.50–100.00%; those of the two testing sets of Beijing 0045 acquired in the wheat field in Shangzhuang Experimental Station were 55.26–63.48%, and those of the four testing sets of Mingxian 169 acquired in the wheat field in Shangzhuang Experimental Station were 84.51–90.14%. By using the SVM, BPNN, and RF models, built based on the different training sets of Nongda 211 acquired in the wheat field in Shangzhuang Experimental Station, low identification accuracies were obtained for all the individual-variety disease image testing sets of the three wheat varieties Beijing 0045, Mingxian 169, and Nongda 211 acquired under laboratory environmental conditions. For the individual-variety disease image testing sets of the three wheat varieties acquired under laboratory environmental conditions, the identification accuracies obtained using the SVM models were 45.29–58.64%; those obtained using the BPNN models were 43.98–58.20%, and those achieved using the RF models were 43.19–55.67%. For the SVM, BPNN, and RF models, built based on the different training sets of Nongda 211 acquired in the wheat field in Shangzhuang Experimental Station, the identification accuracies of the additional testing set acquired in Gangu Testing Station were 95.37–99.58%. Taken overall, among the models built based on the different training sets of Nongda 211 acquired in the wheat field in Shangzhuang Experimental Station, the optimal identification performances were achieved by using the RF models. The results demonstrated that wheat stripe rust and wheat leaf rust on Nongda 211 and Mingxian 169 in Shangzhuang Experimental Station could be identified by using the RF modeling method.

3.2.2. Identification Results of Individual-Variety Disease Identification Models Built Based on Disease Images of the Different Wheat Varieties Acquired under Laboratory Environmental Conditions

With the 13 most important features for disease identification, selected based on the multi-variety disease images acquired under laboratory environmental conditions using the 1R method combined with the SVM modeling method, the individual-variety disease identification model was built using the SVM modeling method, based on the training set of Beijing 0045 consisting of disease images acquired under laboratory environmental conditions. With the 27 most important features for disease identification, selected based on the multi-variety disease images acquired under laboratory environmental conditions using the 1R method combined with the BPNN and RF modeling methods, the individual-variety disease identification models were built using the BPNN and RF modeling methods, based on the training set of Beijing 0045 consisting of disease images acquired under laboratory environmental conditions. Using the built SVM, BPNN, and RF models, the images in the corresponding testing sets of Beijing 0045, Mingxian 169, and Nongda 211 acquired under laboratory environmental conditions, the two testing sets of Beijing 0045, the four testing sets of Mingxian 169, and the three testing sets of Nongda 211 acquired in the wheat field in Shangzhuang Experimental Station and the additional testing set consisting of multi-variety disease images acquired in the wheat field in Gangu Testing Station were identified, respectively; the identification results are shown in Table 14. Based on the training set of Beijing 0045 consisting of the disease images acquired under the laboratory environmental condition, the optimal SVM model was built with a Cbest equal to 1024.000 and a gbest equal to 0.435. Using this SVM model, the identification accuracies of the training set and the corresponding testing set of Beijing 0045 acquired under laboratory environmental conditions were 94.05% and 89.53%, respectively. For the built BPNN model, the identification accuracies of the training set and the corresponding testing set of Beijing 0045 acquired under laboratory environmental conditions were 96.99% and 92.80%, respectively. Based on the training set of Beijing 0045 consisting of disease images acquired under laboratory environmental conditions, the optimal RF model was built with 50 decision trees. Using this built RF model, the identification accuracies of the training set and the corresponding testing set of Beijing 0045 acquired under laboratory environmental conditions were 100.00% and 92.28%, respectively. For the testing sets of Mingxian 169 and Nongda 211 acquired under laboratory environmental conditions, the identification accuracies obtained using the built SVM model were 74.59% and 75.96%, respectively; those obtained using the built BPNN model were 55.45% and 58.70%, respectively, and those obtained using the built RF model were 84.27% and 82.07%, respectively. The identification accuracies of Training Set 1 and Training Set 2 of Beijing 0045 acquired in the wheat field in Shangzhuang Experimental Station using the built BPNN model were 77.19% and 78.95%, respectively. Low identification accuracies (46.48–70.00%) were obtained for the other individual-variety disease image testing sets acquired in the wheat field in Shangzhuang Experimental Station using the built SVM, BPNN, and RF models. The identification accuracies of the additional testing set consisting of the multi-variety disease images acquired in Gangu Testing Station, obtained using the SVM, BPNN, and RF models built based on the training set of Beijing 0045 consisting of the disease images acquired under laboratory environmental conditions, were 85.26%, 95.58%, and 84.63%, respectively. The results showed that, based on the training set of Beijing 0045 consisting of the disease images acquired under the laboratory environmental condition, using the SVM, BPNN, and RF modeling methods, satisfactory identification performances of the disease images of Beijing 0045 acquired under laboratory environmental conditions were achieved. In addition, there were great differences among the identification accuracies of the testing sets of the other two varieties acquired under laboratory environmental conditions and the testing sets of the three wheat varieties acquired in the wheat field in Shangzhuang Experimental Station.
With the 13 most important features for disease identification, selected based on the multi-variety disease images acquired under laboratory environmental conditions using the 1R method combined with the SVM modeling method, the individual-variety disease identification model was built using the SVM modeling method based on the training set of Mingxian 169 consisting of disease images acquired under laboratory environmental conditions. With the 27 most important features for disease identification, selected based on the multi-variety disease images acquired under laboratory environmental conditions using the 1R method combined with the BPNN and RF modeling methods, the individual-variety disease identification models were built using the BPNN and RF modeling methods based on the training set of Mingxian 169 consisting of disease images acquired under laboratory environmental conditions. Using the built SVM, BPNN, and RF models, the images in the corresponding testing sets of Mingxian 169, Beijing 0045, and Nongda 211 acquired under laboratory environmental conditions, the two testing sets of Beijing 0045, the four testing sets of Mingxian 169, and the three testing sets of Nongda 211 acquired in the wheat field in Shangzhuang Experimental Station, and the additional testing set consisting of multi-variety disease images acquired in the wheat field in Gangu Testing Station were identified, respectively; the obtained identification results are shown in Table 15. Based on the training set of Mingxian 169 consisting of disease images acquired under laboratory environmental conditions, the optimal SVM model was built with a Cbest of 1024.000 and a gbest of 1.741. Using this built SVM model, the identification accuracies of the training set used for modeling and the corresponding Mingxian 169 testing set acquired under laboratory environmental conditions were 97.96% and 92.52%, respectively. For the built BPNN model, the identification accuracies of the training set used for modeling and the corresponding Mingxian 169 testing set acquired under laboratory environmental conditions were 97.08% and 94.39%, respectively. Based on the training set of Mingxian 169 consisting of disease images acquired under laboratory environmental conditions, the optimal RF model was built with 60 decision trees. Using this built RF model, the identification accuracies of the training set used for modeling and the corresponding Mingxian 169 testing set acquired under laboratory environmental conditions were 100.00% and 95.82%, respectively. For the testing sets of Beijing 0045 and Nongda 211 acquired under the laboratory environmental condition, the identification accuracies obtained using the built SVM model were 72.25% and 76.89%, respectively; those obtained using the built BPNN model were 65.84% and 66.93%, respectively, and those obtained using the RF model were 83.64% and 84.06%, respectively. The results indicated that the images of stripe rust and leaf rust on the different individual varieties acquired under laboratory environmental conditions could be identified using the built RF model. Using the built SVM, BPNN, and RF models, the identification accuracies of the individual-variety disease image testing sets acquired in the wheat field in Shangzhuang Experimental Station were 46.48–74.56%, and the identification accuracies of the additional testing set consisting of multi-variety disease images acquired in Gangu Testing Station were 93.26%, 94.95% and 81.26%, respectively. The results showed that, based on the training set of Mingxian 169 consisting of disease images acquired under laboratory environmental conditions and using the built SVM, BPNN, and RF models, the images of wheat stripe rust and wheat leaf rust on Mingxian 169 acquired under laboratory environmental conditions could be identified. In addition, the results demonstrated that the built SVM and RF models achieved better identification performances on disease images of the different individual wheat varieties acquired under laboratory environmental conditions than those obtained on disease images of the different individual wheat varieties acquired in the wheat field in Shangzhuang Experimental Station.
With the 13 most important features for disease identification selected based on the multi-variety disease images acquired under laboratory environmental conditions using the 1R method combined with the SVM modeling method, the individual-variety disease identification model was built using the SVM modeling method based on the training set of Nongda 211 consisting of disease images acquired under laboratory environmental conditions. With the 27 most important features for disease identification selected based on the multi-variety disease images acquired under laboratory environmental conditions using the 1R method combined with the BPNN and RF modeling methods, the individual-variety disease identification models were built using the BPNN and RF modeling methods based on the training set of Nongda 211 consisting of disease images acquired under laboratory environmental conditions. By using the built SVM, BPNN, and RF models, the images in the corresponding testing sets of Nongda 211, Mingxian 169, and Beijing 0045 acquired under laboratory environmental conditions, the two testing sets of Beijing 0045, the four testing sets of Mingxian 169, and the three testing sets of Nongda 211 acquired in the wheat field in Shangzhuang Experimental Station, and the additional testing set consisting of multi-variety disease images acquired in the wheat field in Gangu Testing Station were identified, respectively; the obtained identification results are shown in Table 16. Based on the training set of Nongda 211 consisting of disease images acquired under laboratory environmental conditions, the optimal SVM model was built with a Cbest of 1024.000 and a gbest of 0.574. Using this built SVM model, the identification accuracies of the training set used for modeling and the corresponding testing set of Nongda 211 acquired under laboratory environmental conditions were 94.69% and 93.49%, respectively. For the built BPNN model, the identification accuracies of the training set used for modeling and the corresponding testing set of Nongda 211 acquired under laboratory environmental conditions were 93.17% and 92.30%, respectively. Based on the training set of Nongda 211 consisting of disease images acquired under laboratory environmental conditions, the optimal RF model was built with 40 decision trees. Using this built RF model, the identification accuracies of the training set used for modeling and the corresponding testing set of Nongda 211 acquired under laboratory environmental conditions were 100.00% and 92.03%, respectively. For the testing sets of Beijing 0045 and Mingxian 169 acquired under laboratory environmental conditions, the identification accuracies obtained using the built SVM model were 75.13% and 77.23%, respectively; those obtained using the built BPNN model were 59.42% and 67.77%, respectively, and those obtained using the RF model were 86.39% and 83.28%, respectively. For the built SVM model based on the Nongda 211 training set consisting of disease images acquired under laboratory environmental conditions, the identification accuracies of the Nongda 211 testing sets acquired in the wheat field in Shangzhuang Experimental Station were 70.00–74.36%, and low identification accuracies were obtained for the testing sets of Beijing 0045 and Mingxian 169 acquired in the wheat field in Shangzhuang Experimental Station. For the built BPNN model based on the Nongda 211 training set consisting of disease images acquired under laboratory environmental conditions, the identification accuracies of the Mingxian 169 testing sets acquired in the wheat field in Shangzhuang Experimental Station were 78.87–81.69%, and low identification accuracies were obtained for the testing sets of Beijing 0045 and Nongda 211 acquired in the wheat field in Shangzhuang Experimental Station. For the built RF model based on the Nongda 211 training set consisting of disease images acquired under laboratory environmental conditions, the identification accuracies of the different individual-variety disease image testing sets acquired in the wheat field in Shangzhuang Experimental Station were 47.50–64.79%. Using the built SVM, BPNN, and RF models based on the Nongda 211 training set consisting of disease images acquired under laboratory environmental conditions, the identification accuracies of the additional testing set consisting of multi-variety disease images acquired in Gangu Testing Station, were 91.37% and 89.89% and 83.58%, respectively. The results showed that, based on the Nongda 211 training set consisting of disease images acquired under laboratory environmental conditions, the images of wheat stripe rust and wheat leaf rust on Mingxian 169 acquired under laboratory environmental conditions could be identified using the built SVM, BPNN, and RF models. Furthermore, the results demonstrated that when using the built SVM, BPNN, and RF models, there were great differences between the obtained identification performances for the disease images of the other two individual wheat varieties acquired under laboratory environmental conditions and those obtained for the disease images of the different individual wheat varieties acquired in the wheat field in Shangzhuang Experimental Station.

3.2.3. Identification Results of the Multi-Variety Disease Identification Models Built Based on Disease Images of the Different Wheat Varieties Acquired in the Wheat Field in Shangzhuang Experimental Station and under Laboratory Environmental Conditions

The 13 most important features for disease identification selected based on the multi-variety disease images acquired in the wheat field in Shangzhuang Experimental Station using the 1R method combined with the SVM modeling method, and the 13 most important features for disease identification selected based on the multi-variety disease images acquired under laboratory environmental conditions using the 1R method combined with the SVM modeling method, were merged together. With these 26 merged features, the multi-variety disease identification model based on the training set composed of multi-variety disease images acquired in the wheat field in Shangzhuang Experimental Station and under laboratory environmental conditions was built using the SVM modeling method. The 13 most important features for disease identification selected based on the multi-variety disease images acquired in the wheat field in Shangzhuang Experimental Station using the 1R method combined with the BPNN and RF modeling methods, and the 27 most important features for disease identification selected based on the multi-variety disease images acquired under laboratory environmental conditions using the 1R method combined with the BPNN and RF modeling methods were merged together. As there was an overlapping feature between the 13 most important features and the 27 most important features, the 39 merged features were utilized to build multi-variety disease identification models based on the training set composed of multi-variety disease images acquired in the wheat field in Shangzhuang Experimental Station and under laboratory environmental conditions using the BPNN and RF modeling methods, respectively. Using the built SVM, BPNN, and RF models, the images in the corresponding multi-variety image testing set consisting of disease images acquired in the wheat field in Shangzhuang Experimental Station and under laboratory environmental conditions, the two testing sets of Beijing 0045, the four testing sets of Mingxian 169, and the three testing sets of Nongda 211 acquired in the wheat field in Shangzhuang Experimental Station, the individual-variety disease image testing sets of Beijing 0045, Mingxian 169, and Nongda 211 acquired under laboratory environmental conditions, and the additional testing set consisting of the multi-variety disease images acquired in the wheat field in Gangu Testing Station were identified, respectively. The corresponding identification results are shown in Table 17. When the values of Cbest and gbest were 588.133 and 0.330, respectively, the optimal SVM model was achieved. Using this built SVM model, the identification accuracies of the training set used for modeling and the corresponding testing set consisting of disease images acquired in the wheat field in Shangzhuang Experimental Station and under laboratory environmental conditions were 99.93% and 98.40%, respectively. For the built BPNN model, the identification accuracies of the training set used for modeling and the corresponding testing set consisting of disease images acquired in the wheat field in Shangzhuang Experimental Station and under laboratory environmental conditions were 98.38% and 96.45%, respectively. Based on the training set composed of multi-variety disease images acquired in the wheat field in Shangzhuang Experimental Station and under laboratory environmental conditions, the optimal RF model was built with 40 decision trees. Using this built RF model, the identification accuracies of the training set used for modeling and the corresponding testing set consisting of disease images acquired in the wheat field in Shangzhuang Experimental Station and under laboratory environmental conditions were 100.00% and 95.82%, respectively. For the built SVM model, the identification accuracies of the different individual-variety disease image testing sets of Beijing 0045, Mingxian 169, and Nongda 211 acquired in the wheat field in Shangzhuang Experimental Station were 92.50–97.44%; those of the individual-variety disease image testing sets of Beijing 0045, Mingxian 169, and Nongda 211 acquired under laboratory environmental conditions, were 98.04%, 99.01%, and 98.94%, respectively, and the identification accuracy of the additional testing set consisting of the multi-variety disease images acquired in the wheat field in Gangu Testing Station was 99.79%. The identification accuracies of Testing Set 1 and Testing Set 2 of Nongda 211 acquired in the wheat field in Shangzhuang Experimental Station using the built BPNN model were 82.05% and 85.00%, respectively. The identification accuracies of the other individual-variety disease image testing sets of Beijing 0045, Mingxian 169, and Nongda 211 acquired in the wheat field in Shangzhuang Experimental Station were 90.00–98.59%, when using the built BPNN and RF models. For the built BPNN and RF models, the identification accuracies of the individual-variety disease image testing sets of Beijing 0045, Mingxian 169, and Nongda 211 acquired under laboratory environmental conditions were 93.49–97.34%, and the identification accuracies of the additional testing set consisting of multi-variety disease images acquired in the wheat field in Gangu Testing Station were 98.74% and 99.79%, respectively. The results indicated that, using the multi-variety disease identification models built by using the SVM, BPNN, and RF modeling methods based on disease images of the different wheat varieties acquired in the wheat field in Shangzhuang Experimental Station and under laboratory environmental conditions, the images of wheat stripe rust and wheat leaf rust on the different individual-varieties acquired in the wheat field in Shangzhuang Experimental Station and under laboratory environmental conditions could be accurately identified.
The results showed that, for the individual-variety disease identification models built based on the different individual-variety disease image training sets acquired in the wheat field in Shangzhuang Experimental Station and under laboratory environmental conditions using the SVM, BPNN, and RF modeling methods, respectively, the identification accuracies of the training sets used for modeling and the corresponding testing sets were 89.53–100.00%, and the identification accuracies of the other testing sets of the corresponding individual varieties used for modeling acquired under the same acquisition conditions were 87.18–100.00%, indicating that the identification of images of wheat stripe rust and wheat leaf rust on the same individual wheat variety could be achieved under the acquisition conditions of images used for modeling. However, when the built individual-variety disease identification models were used to conduct image identification on testing sets of the same individual wheat variety acquired under conditions different from those of the images used for modeling and the testing sets of other individual varieties acquired in the wheat field in Shangzhuang Experimental Station and under laboratory environmental conditions, most identification accuracies decreased and poor identification performances were achieved. The results demonstrated that, for the multi-variety disease identification models built by using the SVM, BPNN, and RF modeling methods based on the training set composed of multi-variety disease images acquired in the wheat field in Shangzhuang Experimental Station and under laboratory environmental conditions, the identification accuracies of the training set used for modeling and the corresponding testing set consisting of disease images acquired in the wheat field in Shangzhuang Experimental Station and under laboratory environmental conditions were 95.82–100.00%. Good identification performances were achieved on the different individual-variety disease image testing sets acquired in the wheat field in Shangzhuang Experimental Station and under laboratory environmental conditions and the additional testing set consisting of multi-variety disease images acquired in the wheat field in Gangu Testing Station. The results indicated that wheat varieties have a great influence on the image-based identification of wheat stripe rust and wheat leaf rust, and that the identification of wheat stripe rust and wheat leaf rust on different varieties acquired in the wheat field in Shangzhuang Experimental Station and under laboratory environmental conditions could be implemented using the disease identification SVM, BPNN, and RF models built based on multi-variety disease images acquired in the wheat field in Shangzhuang Experimental Station and under laboratory environmental conditions.

4. Discussion

In this study, based on image processing technology, disease identification SVM, BPNN, and RF models were built to identify images of stripe rust and leaf rust on different wheat varieties acquired under field and laboratory environmental conditions. The results showed that the disease identification models built by using different disease image datasets showed great differences in the identification of the images of wheat stripe rust and wheat leaf rust on different wheat varieties and under different environmental conditions, indicating that wheat varieties influence image-based disease identification. The results demonstrated that satisfactory image-based disease identification performance can be achieved by comprehensively utilizing the disease images on different varieties acquired under different conditions for modeling. The main reason for the influence of wheat varieties on disease image identification should be that the wheat varieties affect the phenotypic characteristics of the segmented lesion images, although the lesion images are segmented from the acquired disease images in the disease image processing. In the studies on plant disease image identification, disease images on different plant varieties and under different acquisition conditions should be obtained; subsequently, based on these disease images, disease-identification modeling can be carried out using suitable modeling methods, aiming to overcome the influence of wheat varieties, improve the identification ability and identification performance of the built identification models, and expand their application range. This study provides support for the accurate image-based identification of wheat stripe rust and wheat leaf rust and provides a reference for the automatic image-based identification of other plant diseases.
In studies on the image identification of plant diseases in the field, the influence of many uncertain factors, such as weather, geographical environmental conditions, disease occurrence period, and disease severity, will lead to fewer images being acquired for model building and training, and it is difficult to ensure a balance between the various disease image categories during modeling. Thus, the generalization abilities of the built disease identification models will be affected, making it difficult for the built models to be widely used in actual production environments. Therefore, the number of disease images of multi-variety plants in different environments should be increased as much as possible to improve the application abilities of the built disease identification models in the field. Many researchers have carried out studies on plant disease image identification based on field-environment scenarios [54,55]. In most research reports, the high identification accuracies of plant disease images acquired against complex backgrounds in the field were achieved by using improved deep learning networks, such as the improved regional convolutional neural network Faster R-CNN algorithm [54], the improved EfficientNet [45], and the improved MobileNet-V2 [55]. In further studies, it is necessary to increase the number of plant disease images with more complex sources, aiming to improve the balance in disease image quantity of each kind of plant disease, and improve the generalization and practical application abilities of image-based identification models of plant diseases.
Plant disease image features are affected by various factors [7,46]. Environmental conditions during image acquisition may influence the features of plant disease images. Different stages of the plant disease process, plant growth environmental conditions, plant growing stage, plant varieties and other plant-related factors may affect the color, shape, and texture of the disease images. The results obtained in this study showed that, for the built image identification model based on disease images of an individual variety, the identification performances of the images of the other different wheat varieties decreased in most cases, indicating that the varieties can influence the identification of disease images. This may be caused by the influence of wheat varieties on the characteristics of disease images due to the different leaf characteristics of wheat varieties and their different responses to pathogen infection. Therefore, it is important to extract or select appropriate disease image features for disease image identification.
In some studies of plant disease image identification, many features were extracted from disease images. To reduce the data dimensions and improve the efficiency of the identification models, feature selection methods such as ReliefF [47], 1R [48], CFS [49], and PCA were used for feature selection; then, the selected features were used to build models for disease identification. In this study, the feature selection methods ReliefF, 1R, CFS, and PCA combined with the SVM, BPNN, and RF modeling methods were used for feature selection. In this study, the top 13, 20, and 27 features were selected using the ReliefF and 1R methods, and the principal components with a cumulative contribution rate of greater than 95% were selected using the PCA method. Then, the multi-variety disease identification models were built using the SVM, BPNN, and RF modeling methods based on multi-variety disease images acquired in the wheat field in Shangzhuang Experimental Station and multi-variety disease images acquired under laboratory environmental conditions, respectively. The optimal feature combinations were selected through comprehensive comparisons. Then, with the corresponding optimal feature combinations, using the SVM, BPNN, and RF modeling methods, the individual-variety disease identification models were built based on the individual-variety disease image training sets acquired in the wheat field in Shangzhuang Experimental Station and under laboratory environmental conditions. Subsequently, the built models were used to identify the different individual-variety disease image testing sets acquired in the wheat field in Shangzhuang Experimental Station and under laboratory environmental conditions, respectively. The results showed high identification accuracies for the testing sets on the corresponding individual varieties used for modeling when acquired under the same environmental conditions as the training sets. Most of the identification accuracies of the other individual-variety disease image testing sets decreased. For the multi-variety disease identification models, built with the merged feature combinations based on the training set composed of multi-variety disease images acquired in the wheat field in Shangzhuang Experimental Station and under laboratory environmental conditions, high identification accuracies were achieved for the different individual-variety disease image testing sets acquired in the wheat field in Shangzhuang Experimental Station and under laboratory environmental conditions, as well as the additional testing set consisting of the multi-variety disease images acquired in the wheat field in Gangu Testing Station. Therefore, during the feature selection of plant disease images, feature selection methods such as ReliefF, 1R, CFS, and PCA can be combined with modeling methods to select more suitable features for modeling and achieve a better modeling performance.
For traditional image processing technology, various parameters need to be set artificially, and each process is affected by many factors. However, the increasing development of deep learning technology can directly perform feature extraction and identification on disease images, which is more conducive to automatic disease image identification. With the development of computer technology, deep learning is increasingly used in image-based plant disease identification [8,28,32,34,35,36,37,38,39,40]. Plant disease image identification based on deep learning often requires more disease images. In further studies, more disease images of various wheat varieties under different environmental conditions can be obtained for the image identification of wheat stripe rust and wheat leaf rust based on deep learning.
The early detection of plant diseases is very important for effective plant disease management. It is necessary to strengthen studies on the image identification of plant diseases during the incubation period and the early stage of disease progress in order to provide support for the early detection, early diagnosis, early warning, and early management of plant diseases. In further studies, image processing techniques and methods for the early detection and rapid diagnosis of plant diseases should be explored and developed. More attention should be paid to the development and application of Internet of Things and artificial intelligence technology in wheat disease monitoring, as well as the development of intelligent disease-monitoring systems for wheat diseases. Efforts should be made toward the automatization, intellectualization, and digitization of disease detection and identification. This will provide strong support for the detection, identification, and accurate control of wheat and other plant diseases.

5. Conclusions

In this study, after preprocessing operations of wheat stripe rust and wheat leaf rust images on different wheat varieties acquired under field and laboratory environmental conditions, the Otsu threshold segmentation method and the K-means clustering algorithm were combined to perform image segmentation. A total of 140 color, texture, and shape features were extracted from the segmented lesion images and feature selection was performed using feature selection methods including ReliefF, 1R, CFS, and PCA combined with the SVM, BPNN, and RF modeling methods. With the optimal feature combinations, the individual-variety disease identification models were built using the SVM, BPNN, and RF modeling methods based on the different individual variety disease images acquired in the wheat field in Shangzhuang Experimental Station and under laboratory environmental conditions. The individual-variety disease identification models could accurately identify disease images on the same individual varieties acquired under the same conditions. However, the identification accuracies of most of the other different individual-variety disease image testing sets decreased. With the merged feature combinations, the multi-variety disease image identification models were built using the SVM, BPNN, and RF modeling methods based on the multi-variety disease images acquired in the wheat field in Shangzhuang Experimental Station and under laboratory environmental conditions. The multi-variety disease image identification models showed good identification performances on the training set used for modeling, the corresponding multi-variety disease image testing set, and the 12 different individual-variety disease image testing sets acquired in the wheat field in Shangzhuang Experimental Station and under laboratory environmental conditions. The results showed that the wheat varieties had a great influence on the image identification of the diseases, and that satisfactory image-based disease identification performances can be obtained by comprehensively utilizing disease images of the different varieties acquired under different conditions for modeling.

Author Contributions

Conceptualization, H.W. (Haiguang Wang); Methodology, H.W. (Hongli Wang) and H.W. (Haiguang Wang); Software, H.W. (Hongli Wang); Validation, H.W. (Hongli Wang) and H.W. (Haiguang Wang); Formal Analysis, H.W. (Hongli Wang) and H.W. (Haiguang Wang); Investigation, H.W. (Hongli Wang), Q.J., Z.S., S.C. and H.W. (Haiguang Wang); Resources, H.W. (Haiguang Wang); Data Curation, H.W. (Hongli Wang) and H.W. (Haiguang Wang); Writing—Original Draft Preparation, H.W. (Hongli Wang) and H.W. (Haiguang Wang); Writing—Review and Editing, H.W. (Hongli Wang), Q.J., Z.S., S.C. and H.W. (Haiguang Wang); Visualization, H.W. (Hongli Wang) and H.W. (Haiguang Wang); Supervision, H.W. (Haiguang Wang); Project Administration, H.W. (Haiguang Wang); Funding Acquisition, H.W. (Haiguang Wang). All authors have read and agreed to the published version of the manuscript.

Funding

This research was funded by the National Natural Science Foundation of China (Grant number 32072357) and the National Key Basic Research Program of China (Grant number 2018YFD0200402).

Institutional Review Board Statement

Not applicable.

Informed Consent Statement

Not applicable.

Data Availability Statement

The data presented in this study are available on request from the corresponding author.

Conflicts of Interest

The authors declare no conflict of interest.

References

  1. Li, Z.Q.; Zeng, S.M. Wheat Rusts in China; China Agriculture Press: Beijing, China, 2002; pp. 1–254. [Google Scholar]
  2. Singh, R.P.; Singh, P.K.; Rutkoski, J.; Hodson, D.P.; He, X.Y.; Jørgensen, L.N.; Hovmøller, M.S.; Huerta-Espino, J. Disease impact on wheat yield potential and prospects of genetic control. Annu. Rev. Phytopathol. 2016, 54, 303–322. [Google Scholar] [CrossRef] [Green Version]
  3. Figueroa, M.; Hammond-Kosack, K.E.; Solomon, P.S. A review of wheat diseases–A field perspective. Mol. Plant Pathol. 2018, 19, 1523–1536. [Google Scholar] [CrossRef]
  4. Lorrain, C.; dos Santos, K.C.; Germain, H.; Hecker, A.; Duplessis, S. Advances in understanding obligate biotrophy in rust fungi. New Phytol. 2019, 222, 1190–1206. [Google Scholar] [CrossRef] [Green Version]
  5. Li, X.L.; Ma, Z.H.; Zhao, L.L.; Li, J.H.; Wang, H.G. Early diagnosis of wheat stripe rust and wheat leaf rust using near infrared spectroscopy. Spectrosc. Spectr. Anal. 2013, 33, 2661–2665. [Google Scholar] [CrossRef]
  6. Wang, H.; Qin, F.; Ruan, L.; Wang, R.; Liu, Q.; Ma, Z.H.; Li, X.L.; Cheng, P.; Wang, H.G. Identification and severity determination of wheat stripe rust and wheat leaf rust based on hyperspectral data acquired using a black-paper-based measuring method. PLoS ONE 2016, 11, e0154648. [Google Scholar] [CrossRef] [Green Version]
  7. Barbedo, J.G.A. A review on the main challenges in automatic plant disease identification based on visible range images. Biosyst. Eng. 2016, 144, 52–60. [Google Scholar] [CrossRef]
  8. Chen, Z.Y.; Wu, R.H.; Lin, Y.Y.; Li, C.Y.; Chen, S.Y.; Yuan, Z.N.; Chen, S.W.; Zou, X.J. Plant disease recognition model based on improved YOLOv5. Agronomy 2022, 12, 365. [Google Scholar] [CrossRef]
  9. Feng, Q.; Wang, S.T.; Wang, H.; Qin, Z.L.; Wang, H.G. Circle fitting based image segmentation and multi-scale block local binary pattern based distinction of ring rot and anthracnose on apple fruits. Front. Plant Sci. 2022, 13, 884891. [Google Scholar] [CrossRef]
  10. Schaad, N.W.; Frederick, R.D. Real-time PCR and its application for rapid plant disease diagnostics. Can. J. Plant Pathol. 2002, 24, 250–258. [Google Scholar] [CrossRef]
  11. Liu, M.; McCabe, E.; Chapados, J.T.; Carey, J.; Wilson, S.K.; Tropiano, R.; Redhead, S.A.; Lévesque, C.A.; Hambleton, S. Detection and identification of selected cereal rust pathogens by TaqMan® real-time PCR. Can. J. Plant Pathol. 2015, 37, 92–105. [Google Scholar] [CrossRef]
  12. Martinelli, F.; Scalenghe, R.; Davino, S.; Panno, S.; Scuderi, G.; Ruisi, P.; Villa, P.; Stroppiana, D.; Boschetti, M.; Goulart, L.R.; et al. Advanced methods of plant disease detection. A review. Agron. Sustain. Dev. 2015, 35, 1–25. [Google Scholar] [CrossRef] [Green Version]
  13. Bravo, C.; Moshou, D.; West, J.; McCartney, A.; Ramon, H. Early disease detection in wheat fields using spectral reflectance. Biosyst. Eng. 2003, 84, 137–145. [Google Scholar] [CrossRef]
  14. Sankaran, S.; Mishra, A.; Ehsani, R.; Davis, C. A review of advanced techniques for detecting plant diseases. Comput. Electron. Agric. 2010, 72, 1–13. [Google Scholar] [CrossRef]
  15. Oerke, E.C. Remote sensing of diseases. Annu. Rev. Phytopathol. 2020, 58, 225–252. [Google Scholar] [CrossRef]
  16. Chouhan, S.S.; Singh, U.P.; Jain, S. Applications of computer vision in plant pathology: A survey. Arch. Comput. Method Eng. 2020, 27, 611–632. [Google Scholar] [CrossRef]
  17. Yang, G.F.; He, Y.; Yang, Y.; Xu, B.B. Fine-grained image classification for crop disease based on attention mechanism. Front. Plant Sci. 2020, 11, 600854. [Google Scholar] [CrossRef]
  18. Vishnoi, V.K.; Kumar, K.; Kumar, B. Plant disease detection using computational intelligence and image processing. J. Plant Dis. Prot. 2021, 128, 19–53. [Google Scholar] [CrossRef]
  19. Chouhan, S.S.; Singh, U.P.; Jain, S. Automated plant leaf disease detection and classification using fuzzy based function network. Wirel. Pers. Commun. 2021, 121, 1757–1779. [Google Scholar] [CrossRef]
  20. Zhang, J.Y.; Rao, Y.; Man, C.; Jiang, Z.H.; Li, S.W. Identification of cucumber leaf diseases using deep learning and small sample size for agricultural Internet of Things. Int. J. Distrib. Sens. Netw. 2021, 17, 15501477211007407. [Google Scholar] [CrossRef]
  21. Orchi, H.; Sadik, M.; Khaldoun, M. On using artificial intelligence and the Internet of Things for crop disease detection: A contemporary survey. Agriculture 2022, 12, 9. [Google Scholar] [CrossRef]
  22. Wang, H.G. Smart phytoprotection and suggestions for its development. J. China Agric. Univ. 2022, 27, 1–21. [Google Scholar] [CrossRef]
  23. Patil, J.K.; Kumar, R. Advances in image processing for detection of plant diseases. J. Adv. Bioinform. Appl. Res. 2011, 2, 135–141. [Google Scholar]
  24. Barbedo, J.G.A. An automatic method to detect and measure leaf disease symptoms using digital image processing. Plant Dis. 2014, 98, 1709–1716. [Google Scholar] [CrossRef] [Green Version]
  25. Oberti, R.; Marchi, M.; Tirelli, P.; Calcante, A.; Iriti, M.; Borghese, A.N. Automatic detection of powdery mildew on grapevine leaves by image analysis: Optimal view-angle range to increase the sensitivity. Comput. Electron. Agric. 2014, 104, 1–8. [Google Scholar] [CrossRef]
  26. Omrani, E.; Khoshnevisan, B.; Shamshirband, S.; Saboohi, H.; Anuar, N.B.; Nasir, M.H.N.M. Potential of radial basis function-based support vector regression for apple disease detection. Measurement 2014, 55, 512–519. [Google Scholar] [CrossRef]
  27. Qin, F.; Liu, D.X.; Sun, B.D.; Ruan, L.; Ma, Z.H.; Wang, H.G. Identification of alfalfa leaf diseases using image recognition technology. PLoS ONE 2016, 11, e0168274. [Google Scholar] [CrossRef] [Green Version]
  28. DeChant, C.; Wiesner-Hanks, T.; Chen, S.Y.; Stewart, E.L.; Yosinski, J.; Gore, M.A.; Nelson, R.J.; Lipson, H. Automated identification of northern leaf blight-infected maize plants from field imagery using deep learning. Phytopathology 2017, 107, 1426–1432. [Google Scholar] [CrossRef] [PubMed] [Green Version]
  29. Shrivastava, S.; Singh, S.K.; Hooda, D.S. Soybean plant foliar disease detection using image retrieval approaches. Multimed. Tools Appl. 2017, 76, 26647–26674. [Google Scholar] [CrossRef]
  30. Zhang, S.W.; Wu, X.W.; You, Z.H.; Zhang, L.Q. Leaf image based cucumber disease recognition using sparse representation classification. Comput. Electron. Agric. 2017, 134, 135–141. [Google Scholar] [CrossRef]
  31. Ma, J.C.; Du, K.M.; Zheng, F.X.; Zhang, L.X.; Gong, Z.H.; Sun, Z.F. A recognition method for cucumber diseases using leaf symptom images based on deep convolutional neural network. Comput. Electron. Agric. 2018, 154, 18–24. [Google Scholar] [CrossRef]
  32. Zhang, X.H.; Qiao, Y.; Meng, F.F.; Fan, C.G.; Zhang, M.M. Identification of maize leaf diseases using improved deep convolutional neural networks. IEEE Access 2018, 6, 30370–30377. [Google Scholar] [CrossRef]
  33. Abade, A.; Ferreira, P.A.; Vidal, F.D. Plant diseases recognition on images using convolutional neural networks: A systematic review. Comput. Electron. Agric. 2021, 185, 106125. [Google Scholar] [CrossRef]
  34. Afifi, A.; Alhumam, A.; Abdelwahab, A. Convolutional neural network for automatic identification of plant diseases with limited data. Plants 2021, 10, 28. [Google Scholar] [CrossRef]
  35. Caldeira, R.F.; Santiago, W.E.; Teruel, B. Identification of cotton leaf lesions using deep learning techniques. Sensors 2021, 21, 3169. [Google Scholar] [CrossRef]
  36. Narmadha, R.P.; Sengottaiyan, N.; Kavitha, R.J. Deep transfer learning based rice plant disease detection model. Intell. Autom. Soft Comput. 2022, 31, 1257–1271. [Google Scholar] [CrossRef]
  37. Pandey, A.; Jain, K. A robust deep attention dense convolutional neural network for plant leaf disease identification and classification from smart phone captured real world images. Ecol. Inform. 2022, 70, 101725. [Google Scholar] [CrossRef]
  38. Pandian, J.A.; Kumar, V.D.; Geman, O.; Hnatiuc, M.; Arif, M.; Kanchanadevi, K. Plant disease detection using deep convolutional neural network. Appl. Sci. 2022, 12, 6982. [Google Scholar] [CrossRef]
  39. Jiang, Z.C.; Dong, Z.X.; Jiang, W.P.; Yang, Y.Z. Recognition of rice leaf diseases and wheat leaf diseases based on multi-task deep transfer learning. Comput. Electron. Agric. 2021, 186, 106184. [Google Scholar] [CrossRef]
  40. Krishnamoorthy, N.; Prasad, L.V.N.; Kumar, C.S.P.; Subedi, B.; Abraha, H.B.; Sathishkumar, V.E. Rice leaf diseases prediction using deep neural networks with transfer learning. Environ. Res. 2021, 198, 111275. [Google Scholar] [CrossRef]
  41. Li, G.L.; Ma, Z.H.; Wang, H.G. Image recognition of wheat stripe rust and wheat leaf rust based on support vector machine. J. China Agric. Univ. 2012, 17, 72–79. [Google Scholar] [CrossRef]
  42. Guo, Q.; Wang, L.W.; Dong, F.M.; Nie, C.W.; Sun, S.F.; Wang, J.H. Identification of wheat stripe rust and powdery mildew using orientation coherence feature. Tran. Chin. Soc. Agric. Mach. 2015, 46, 26–34. [Google Scholar] [CrossRef]
  43. Du, K.; Sun, Z.; Li, Y.; Zheng, F.; Chu, J.; Su, Y. Diagnostic model for wheat leaf conditions using image features and a support vector machine. Trans. ASABE 2016, 59, 1041–1052. [Google Scholar] [CrossRef]
  44. Xia, Y.Q.; Li, Y.B.; Li, C. Recognition of wheat leaf diseases based on image processing technology. Bull. Sci. Tech. 2016, 32, 92–95. [Google Scholar] [CrossRef]
  45. Genaev, M.A.; Skolotneva, E.S.; Gultyaeva, E.I.; Orlova, E.A.; Bechtold, N.P.; Afonnikov, D.A. Image-based wheat fungi diseases identification by deep learning. Plants 2021, 10, 1500. [Google Scholar] [CrossRef]
  46. Lai, J.C.; Li, S.K.; Ming, B.; Wang, N.; Wang, K.R.; Xie, R.Z.; Gao, S.J. Advances in research on computer-vision diagnosis of crop diseases. Sci. Agric. Sin. 2009, 42, 1215–1221. [Google Scholar] [CrossRef]
  47. Kononenko, I. Estimating attributes: Analysis and extensions of RELIEF. Lect. Notes Comput. Sci. 1994, 784, 171–182. [Google Scholar] [CrossRef] [Green Version]
  48. Witten, I.H.; Frank, E.; Hall, M.A. Data Mining: Practical Machine Learning Tools and Techniques, 3rd ed.; China Machine Press: Beijing, China, 2014; pp. 61–64. [Google Scholar]
  49. Hall, M.A. Correlation-based Feature Selection for Machine Learning. PhD Thesis, Dept. of Computer Science, University of Waikato, Hamilton, New Zealand, 1999. [Google Scholar]
  50. Cheng, P.; Ma, Z.H.; Wang, X.J.; Wang, C.Q.; Li, Y.; Wang, S.H.; Wang, H.G. Impact of UV-B radiation on aspects of germination and epidemiological components of three major physiological races of Puccinia striiformis f. sp. tritici. Crop Prot. 2014, 65, 6–14. [Google Scholar] [CrossRef]
  51. Li, G.L.; Ma, Z.H.; Huang, C.; Chi, Y.W.; Wang, H.G. Segmentation of color images of grape diseases using K_means clustering algorithm. Trans. Chin. Soc. Agric. Eng. 2010, 26, 32–37. [Google Scholar] [CrossRef]
  52. Li, G.L.; Ma, Z.H.; Wang, H.G. Image Recognition of Grape Downy Mildew and Grape Powdery Mildew Based on Support Vector Machine. In Proceedings of the 5th International Conference on Computer and Computing Technologies in Agriculture, CCTA 2011, Beijing, China, 29–31 October 2011; Li, D., Chen, Y., Eds.; Springer: Berlin, Heidelberg, 2012; pp. 151–162. [Google Scholar] [CrossRef] [Green Version]
  53. Chang, C.C.; Lin, C.J. LIBSVM: A library for support vector machines. ACM Trans. Intell. Syst. Technol. 2011, 2, 27. [Google Scholar] [CrossRef]
  54. Fan, X.P.; Zhou, J.P.; Xu, Y. Recognition of field maize leaf diseases based on improved regional convolutional neural network. J. South China Agric. Univ. 2020, 41, 82–91. [Google Scholar] [CrossRef]
  55. Sun, J.; Zhu, W.D.; Luo, Y.Q.; Shen, J.F.; Chen, Y.D.; Zhou, X. Recognizing the diseases of crop leaves in fields using improved Mobilenet-V2. Trans. Chin. Soc. Agric. Eng. 2021, 37, 161–169. [Google Scholar] [CrossRef]
Figure 1. Workflow diagram of the main steps for image-based identification of stripe rust and leaf rust on different wheat varieties.
Agronomy 13 00260 g001
Figure 2. The original single-diseased-leaf images and the corresponding segmented color lesion images of wheat stripe rust and wheat leaf rust on different varieties, acquired in the wheat fields in Shangzhuang Experimental Station and Gangu Testing Station. To ensure a clear demonstration, all the images are shown after being uniformly cropped. (ac) are the original single-diseased-leaf images of wheat stripe rust on wheat varieties Beijing 0045, Mingxian 169, and Nongda 211, acquired in the wheat field in Shangzhuang Experimental Station, respectively; (df) are the original single-diseased-leaf images of wheat leaf rust on wheat varieties Beijing 0045, Mingxian 169, and Nongda 211, acquired in the wheat field in Shangzhuang Experimental Station, respectively; (gi) are the original single-diseased-leaf images of wheat stripe rust on wheat varieties Longjian 9822, Longjian 9825, and Tianxuan 66, acquired in the wheat field in Gangu Testing Station, respectively; (jl) are the segmented color lesion images of the single-diseased-leaf images of wheat stripe rust on wheat varieties Beijing 0045, Mingxian 169, and Nongda 211, acquired in the wheat field in Shangzhuang Experimental Station, respectively; (mo) are the segmented color lesion images of the single-diseased-leaf images of wheat leaf rust on wheat varieties Beijing 0045, Mingxian 169, and Nongda 211, acquired in the wheat field in Shangzhuang Experimental Station, respectively; and (pr) are the segmented color lesion images of the single-diseased-leaf images of wheat stripe rust on wheat varieties Longjian 9822, Longjian 9825, and Tianxuan 66, acquired in the wheat field in Gangu Testing Station, respectively.
Agronomy 13 00260 g002
Figure 3. The original single-diseased-leaf images and the corresponding segmented color lesion images of wheat stripe rust and wheat leaf rust on different varieties, acquired under laboratory environmental conditions. For a clear demonstration, all the images are shown after being uniformly cropped. (ac) are the original single-diseased-leaf images of wheat stripe rust on wheat varieties Beijing 0045, Mingxian 169, and Nongda 211, acquired under laboratory environmental conditions, respectively; (df) are the original single-diseased-leaf images of wheat leaf rust on wheat varieties Beijing 0045, Mingxian 169, and Nongda 211, acquired under laboratory environmental conditions, respectively; (gi) are the segmented color lesion images of the single-diseased-leaf images of wheat stripe rust on wheat varieties Beijing 0045, Mingxian 169, and Nongda 211, acquired under laboratory environmental conditions, respectively; and (jl) are the segmented color lesion images of the single-diseased-leaf images of wheat leaf rust on wheat varieties Beijing 0045, Mingxian 169, and Nongda 211, acquired under laboratory environmental conditions, respectively.
Agronomy 13 00260 g003
Table 1. Quantities of the acquired single-leaf images of stripe rust and leaf rust on different wheat varieties from the wheat field in Shangzhuang Experimental Station of China Agricultural University, Haidian District, Beijing, China; the controlled-climate chamber in the Laboratory of Macro-Phytopathology, China Agricultural University, Beijing, China; and the wheat field in Gangu Testing Station of the Institute of Plant Protection, Gansu Academy of Agricultural Sciences, Gangu, Gansu, China.
Diseased leaf Collection LocationWheat VarietyNumber of Acquired Images of Wheat Stripe RustNumber of Acquired Images of Wheat Leaf Rust
The wheat field in Shangzhuang Experimental StationBeijing 0045345170
Mingxian 169448101
Nongda 21122741
The controlled-climate chamberBeijing 004510351258
Mingxian 1691473 1254
Nongda 21112241036
The wheat field in Gangu Testing StationLongjian 9822198
Longjian 9825145
Tianxuan 66132
Table 2. Names and feature numbers of the color, texture, and shape features extracted in this study.
Feature NameFeature NumberFeature NameFeature NumberFeature NameFeature NumberFeature NameFeature NumberFeature NameFeature Number
r1Φ1RGB_R31Φ3HSV_S61Φ5Lab_b91Homogeneity Lab_L121
g2Φ2RGB_R32Φ4HSV_S62Φ6Lab_b92Contrast Lab_a122
b3Φ3RGB_R33Φ5HSV_S63Φ7Lab_b93Correlation Lab_a123
μ1RGB_R4Φ4RGB_R34Φ6HSV_S64Contrast RGB_R94Energy Lab_a124
μ2RGB_R5Φ5RGB_R35Φ7HSV_S65Correlation RGB_R95Homogeneity Lab_a125
μ3RGB_R6Φ6RGB_R36Φ1HSV_V66Energy RGB_R96Contrast Lab_b126
μ1RGB_G7Φ7RGB_R37Φ2HSV_V67Homogeneity RGB_R97Correlation Lab_b127
μ2RGB_G8Φ1RGB_G38Φ3HSV_V68Contrast RGB_G98Energy Lab_b128
μ3RGB_G9Φ2RGB_G39Φ4HSV_V69Correlation RGB_G99Homogeneity Lab_b129
μ1RGB_B10Φ3RGB_G40Φ5HSV_V70Energy RGB_G100Area130
μ2RGB_B11Φ4RGB_G41Φ6HSV_V71Homogeneity RGB_G101Perimeter131
μ3RGB_B12Φ5RGB_G42Φ7HSV_V72Contrast RGB_B102Circularity132
μ1HSV_H13Φ6RGB_G43Φ1Lab_L73Correlation RGB_B103Complexity133
μ2HSV_H14Φ7RGB_G44Φ2Lab_L74Energy RGB_B104Φ1shape134
μ3HSV_H15Φ1RGB_B45Φ3Lab_L75Homogeneity RGB_B105Φ2shape135
μ1HSV_S16Φ2RGB_B46Φ4Lab_L76Contrast HSV_H106Φ3shape136
μ2HSV_S17Φ3RGB_B47Φ5Lab_L77Correlation HSV_H107Φ4shape137
μ3HSV_S18Φ4RGB_B48Φ6Lab_L78Energy HSV_H108Φ5shape138
μ1HSV_V19Φ5RGB_B49Φ7Lab_L79Homogeneity HSV_H109Φ6shape139
μ2HSV_V20Φ6RGB_B50Φ1Lab_a80Contrast HSV_S110Φ7shape140
μ2HSV_V21Φ7RGB_B51Φ2Lab_a81Correlation HSV_S111
μ1Lab_L22Φ1HSV_H52Φ3Lab_a82Energy HSV_S112
μ2Lab_L23Φ2HSV_H53Φ4Lab_a83Homogeneity HSV_S113
μ3Lab_L24Φ3HSV_H54Φ5Lab_a84Contrast HSV_V114
μ1Lab_a25Φ4HSV_H55Φ6Lab_a85Correlation HSV_V115
μ2Lab_a26Φ5HSV_H56Φ7Lab_a86Energy HSV_V116
μ3Lab_a27Φ6HSV_H57Φ1Lab_b87Homogeneity HSV_V117
μ1Lab_b28Φ7HSV_H58Φ2Lab_b88Contrast Lab_L118
μ2Lab_b29Φ1HSV_S59Φ3Lab_b89Correlation Lab_L119
μ3Lab_b30Φ2HSV_S60Φ4Lab_b90Energy Lab_L120
Table 3. Training and testing sets constructed for disease-identification modeling by using the acquired images of stripe rust and leaf rust on different wheat varieties from the wheat field in Shangzhuang Experimental Station and the controlled-climate chamber.
Diseased Leaf Collection LocationWheat VarietyTraining SetTesting Set Corresponding to the Training Set
DatasetImage Quantity of Wheat Stripe RustImage Quantity of Wheat Leaf RustTotal QuantityDatasetImage Quantity of Wheat Stripe RustImage Quantity of Wheat Leaf RustTotal Quantity
The wheat field in Shangzhuang Experimental StationBeijing 0045Training Set 1115113228Testing Set 15757114
Training Set 2115113228Testing Set 25857115
Mingxian 169Training Set 17567142Testing Set 1373471
Training Set 27567142Testing Set 2373471
Training Set 37567142Testing Set 3373471
Training Set 47567142Testing Set 4373471
Nongda 211Training Set 1502777Testing Set 1251439
Training Set 2502777Testing Set 2261440
Training Set 3502777Testing Set 3261440
The controlled-climate chamberBeijing 0045Training set6908391529Testing set345419764
Mingxian 169Training set9828361818Testing set491418909
Nongda 211Training set8166911507Testing set408345753
Table 4. Feature selection results obtained by using the ReliefF, 1R, and CFS methods, based on the multi-variety disease image dataset consisting of the images acquired in the wheat field in Shangzhuang Experimental Station, and the multi-variety disease image dataset consisting of the images acquired under laboratory environmental conditions, respectively.
Disease Image DatasetFeature Selection MethodFeature Selection Results
The multi-variety disease image dataset consisting of the images acquired in the wheat field in Shangzhuang Experimental StationReliefF107, 111, 2, 110, 13, 132, 18, 106, 16, 103, 15, 95, 99, 119, 3, 17, 19, 115, 27, 1, 104, 14, 116, 127, 96, 21, 109, 100, 22, 120, 4, 29, 7, 133, 10, 87, 126, 11, 28, 25, 5, 123, 20, 8, 23, 88, 9, 24, 112, 80, 105, 108, 117, 26, 6, 113, 128, 101, 97, 121, 94, 118, 98, 114, 131, 12, 122, 129, 125, 102, 66, 30, 59, 45, 52, 31, 38, 81, 134, 124, 73, 130, 90, 53, 60, 92, 67, 32, 46, 39, 74, 89, 83, 135, 82, 48, 47, 62, 61, 136, 137, 85, 55, 54, 91, 40, 68, 33, 41, 69, 75, 34, 76, 49, 72, 138, 79, 37, 44, 56, 63, 65, 58, 35, 70, 77, 42, 140, 93, 36, 71, 57, 64, 86, 78, 43, 50, 51, 84, 139
1 R107, 21, 24, 111, 19, 9, 131, 18, 6, 13, 133, 130, 132, 95, 115, 7, 15, 119, 22, 16, 99, 4, 12, 35, 134, 127, 135, 38, 74, 56, 39, 32, 138, 73, 10, 31, 30, 66, 100, 77, 70, 28, 120, 79, 110, 41, 20, 103, 104, 67, 140, 116, 76, 42, 87, 106, 44, 137, 96, 63, 72, 34, 139, 75, 136, 78, 45, 40, 51, 46, 37, 49, 68, 48, 5, 71, 43, 50, 123, 97, 8, 69, 33, 122, 105, 36, 27, 90, 65, 26, 29, 88, 1, 47, 109, 82, 58, 101, 108, 98, 2, 52, 124, 128, 54, 55, 117, 93, 23, 53, 114, 86, 102, 121, 85, 126, 125, 84, 3, 62, 92, 118, 112, 17, 89, 64, 25, 57, 80, 94, 59, 129, 83, 61, 14, 91, 113, 11, 81, 60
CFS64, 67, 79, 86, 138
The multi-variety disease image dataset consisting of the images acquired under laboratory environmental conditionsReliefF95, 115, 119, 17, 110, 123, 15, 99, 1, 13, 107, 18, 16, 103, 2, 8, 111, 3, 127, 11, 14, 23, 10, 27, 5, 134, 20, 112, 19, 31, 66, 38, 7, 73, 21, 6, 109, 132, 106, 113, 25, 22, 108, 45, 24, 117, 121, 97, 4, 80, 30, 101, 118, 131, 114, 9, 98, 94, 59, 124, 81, 88, 26, 12, 122, 104, 100, 52, 125, 116, 96, 120, 102, 105, 126, 133, 128, 129, 29, 28, 87, 82, 130, 89, 83, 135, 32, 67, 74, 39, 90, 85, 46, 92, 60, 53, 86, 84, 136, 51, 137, 44, 91, 79, 93, 72, 33, 68, 37, 34, 62, 75, 65, 69, 61, 40, 47, 58, 48, 76, 140, 41, 55, 54, 64, 57, 63, 49, 42, 77, 35, 70, 138, 56, 50, 43, 78, 71, 36, 139
1 R45, 46, 38, 39, 134, 17, 73, 135, 74, 16, 15, 67, 31, 10, 66, 32, 52, 53, 50, 60, 59, 11, 43, 123, 78, 18, 139, 36, 102, 98, 71, 1, 89, 105, 114, 118, 104, 107, 101, 121, 90, 91, 57, 94, 27, 115, 95, 97, 47, 117, 120, 13, 100, 64, 116, 8, 48, 96, 128, 40, 2, 41, 7, 129, 119, 75, 92, 93, 126, 30, 130, 88, 137, 76, 136,28,33,99,3,12, 68, 127, 23, 140, 69, 108, 26, 87, 72, 34, 19, 65, 55, 138, 37, 44, 79, 131, 54, 61, 125, 29, 22, 122, 58, 35, 77, 62, 124, 70, 113, 42, 63, 109, 14, 25, 49, 80, 106, 84, 56, 21, 112, 111, 20, 81, 82, 4, 51, 132, 6, 110, 9, 24, 133, 85, 83, 5, 103, 86
CFS37, 41
Note: For convenience, the feature numbers were used to represent the features, and the features corresponding to the feature numbers are shown in Table 2. For the ReliefF or 1R method, the importance ranking of each extracted feature was achieved.
Table 5. Disease identification results of the SVM models built with features selected based on the multi-variety disease image dataset consisting of images acquired in the wheat field in Shangzhuang Experimental Station using feature selection methods including ReliefF and 1R, respectively.
Feature Selection MethodNumber of Selected FeaturesCbest Valuegbest ValueIdentification Accuracy of the Training Set Consisting of the Multi-Variety Disease Images Acquired in the Wheat Field in Shangzhuang Experimental Station (%)Identification Accuracy of the Testing Set Consisting of the Multi-Variety Disease Images Acquired in the Wheat Field in Shangzhuang Experimental Station (%)Identification Accuracy of the Testing Set Consisting of the Multi-Variety Disease Images Acquired under Laboratory Environmental Conditions (%)Identification Accuracy of the Additional Testing Set Consisting of the Multi-Variety Disease Images Acquired in the Wheat Field in Gangu Testing Station (%)
ReliefF1336.7580.758100.0098.8764.3199.58
205.2780.435100.00100.0063.9099.79
2712.1260.144100.00100.0069.67100.00
1R131.3201.320100.00100.0056.65100.00
201.7411.000100.0099.5559.70100.00
2764.0000.083100.0099.7762.26100.00
Table 6. Disease identification results of the SVM models built with features selected based on the multi-variety disease image dataset consisting of images acquired under laboratory environmental conditions using feature selection methods including ReliefF and 1R, respectively.
Feature Selection MethodNumber of Selected FeaturesCbest Valuegbest ValueIdentification Accuracy of the Training Set Consisting of the Multi-Variety Disease Images Acquired under Laboratory Environmental Conditions (%)Identification Accuracy of the Testing Set Consisting of the Multi-Variety Disease Images Acquired under Laboratory Environmental Conditions (%)Identification Accuracy of the Testing Set Consisting of the Multi-Variety Disease Images Acquired in the Wheat Field in Shangzhuang Experimental Station (%)Identification Accuracy of the Additional Testing Set Consisting of the Multi-variety Disease Images Acquired in the Wheat Field in Gangu Testing Station (%)
ReliefF1312.1261.00099.9299.9223.4284.63
2021.1120.190100.00100.0026.35100.00
274.0000.574100.00100.0023.8716.63
1R13256.0001.32099.8899.6743.6970.53
2048.5030.10999.9699.9676.584.00
271.3200.083100.0099.9264.6499.16
Table 7. Disease identification results of the BPNN models built with features selected based on the multi-variety disease image dataset consisting of images acquired in the wheat field in Shangzhuang Experimental Station using feature selection methods including ReliefF and 1R, respectively.
Feature Selection MethodNumber of Selected FeaturesIdentification Accuracy of the Training Set Consisting of the Multi-Variety Disease Images Acquired in the Wheat Field in Shangzhuang Experimental Station (%)Identification Accuracy of the Testing Set Consisting of the Multi-Variety Disease Images Acquired in the Wheat Field in Shangzhuang Experimental Station (%)Identification Accuracy of the Testing Set Consisting of the Multi-Variety Disease Images Acquired under Laboratory Environmental Conditions (%)Identification Accuracy of the Additional Testing Set Consisting of the Multi-Variety Disease Images Acquired in the Wheat Field in Gangu Testing Station (%)
ReliefF1397.8697.5245.2899.37
2099.6697.9713.6473.89
2799.1098.203.9670.32
1R1399.4498.4243.8896.21
2099.6699.5552.3794.32
2799.3299.1011.3777.89
Table 8. Disease identification results of the BPNN models built with features selected based on the multi-variety disease image dataset consisting of images acquired under laboratory environmental conditions using feature selection methods including ReliefF and 1R, respectively.
Feature Selection MethodNumber of Selected FeaturesIdentification Accuracy of the Training Set Consisting of the Multi-Variety Disease Images Acquired Under Laboratory Environmental Conditions (%)Identification Accuracy of the Testing Set Consisting of the Multi-Variety Disease Images Acquired Under Laboratory Environmental Conditions (%)Identification Accuracy of the Testing Set Consisting of the Multi-Variety Disease Images Acquired in the Wheat Field in Shangzhuang Experimental Station (%)Identification Accuracy of The additional Testing Set Consisting of The Multi-Variety Disease Images Acquired in the Wheat Field in Gangu Testing Station (%)
ReliefF1399.3499.1822.7564.42
2098.8998.7622.520.84
2799.4299.2622.520.42
1R1398.8398.6429.5066.95
2099.4899.3476.3517.89
2799.9299.8420.9599.37
Table 9. Disease identification results of the RF models built with features selected based on the multi-variety disease image dataset consisting of images acquired in the wheat field in Shangzhuang Experimental Station using feature selection methods including ReliefF and 1R, respectively.
Feature Selection MethodNumber of Selected FeaturesIdentification Accuracy of the Training Set Consisting of the Multi-Variety Disease Images Acquired in the Wheat Field in Shangzhuang Experimental Station (%)Identification Accuracy of the Testing Set Consisting of the Multi-Variety Disease Images Acquired in the Wheat Field in Shangzhuang Experimental Station (%)Identification Accuracy of the Testing Set Consisting of the Multi-Variety Disease Images Acquired Under Laboratory Environmental Conditions (%)Identification Accuracy of the Additional Testing Set Consisting of the Multi-Variety Disease Images Acquired in the Wheat Field in Gangu Testing Station (%)
ReliefF13100.0097.0748.9571.37
2099.8997.5251.9285.47
2799.8999.1043.1890.95
1R13100.0099.1048.2193.47
20100.0099.5545.0495.37
27100.0099.3243.0292.42
Table 10. Disease identification results of the RF models built with features selected based on the multi-variety disease image dataset consisting of images acquired under laboratory environmental conditions using feature selection methods including ReliefF and 1R, respectively.
Feature Selection MethodNumber of Selected FeaturesIdentification Accuracy of the Training Set Consisting of the Multi-Variety Disease Images Acquired Under Laboratory Environmental Conditions (%)Identification Accuracy of the Testing Set Consisting of the Multi-Variety Disease Images Acquired Under Laboratory Environmental Conditions (%)Identification Accuracy of the Testing Set Consisting of the Multi-Variety Disease Images Acquired in the Wheat Field in Shangzhuang Experimental Station (%)Identification Accuracy of the Additional Testing Set Consisting of the Multi-Variety Disease Images Acquired in the Wheat Field in Gangu Testing Station (%)
ReliefF13100.0097.3639.6467.16
2099.8897.3239.4152.00
27100.0099.0127.0359.58
1R1399.9299.0959.9188.42
20100.00100.0076.581.68
27100.0099.3799.1094.95
Table 11. Identification results for the individual-variety disease image testing sets acquired in the wheat field in Shangzhuang Experimental Station and under laboratory environmental conditions, and the additional testing set consisting of multi-variety disease images acquired in the wheat field in Gangu Testing Station using the SVM, BPNN, and RF models. These were built based on the different training sets of the variety Beijing 0045 consisting of disease images acquired in the wheat field in Shangzhuang Experimental Station.
ModelTraining Set of Beijing 0045 Acquired in Shangzhuang Experimental StationShangzhuang Experimental StationThe Controlled-Climate ChamberIdentification Accuracy of the Additional Testing Set Acquired In Gangu Testing Station (%)
Identification Accuracy of the Training Set of Beijing 0045 (%)Identification Accuracy of Testing Set 1 of Beijing 0045 (%)Identification Accuracy of Testing Set 2 of Beijing 0045 (%)Identification Accuracy of Testing Set 1 of Mingxian 169 (%)Identification Accuracy of Testing Set 2 of Mingxian 169 (%)Identification Accuracy of Testing Set 3 of Mingxian 169 (%)Identification Accuracy of Testing Set 4 of Mingxian 169 (%)Identification Accuracy of Testing Set 1 of Nongda 211 (%)Identification Accuracy of Testing Set 2 of Nongda 211 (%)Identification Accuracy of Testing Set 3 of Nongda 211 (%)Identification Accuracy of the Testing Set of Beijing 0045 (%)Identification Accuracy of the Testing Set of Mingxian 169 (%)Identification Accuracy of the Testing Set of Nongda 211 (%)
SVMTraining Set 199.5699.1299.1398.5998.5998.5998.5966.6772.5077.5066.7568.3268.3999.79
Training Set 2100.0099.1299.1398.5998.5998.5998.5974.3677.5077.5069.2468.6568.1399.16
BPNNTraining Set 196.9396.4994.7491.5591.5591.5591.5527.525.0025.0043.5951.3854.3289.47
Training Set 299.5698.2599.1394.3794.3794.3794.3133.3332.5032.5046.2043.0137.5897.26
RFTraining Set 1100.0093.8694.7890.1495.7791.5587.3266.6777.5067.5053.0158.2063.0891.37
Training Set 2100.0094.7493.9191.5592.9694.3792.9661.5467.5060.0056.2858.3161.3591.58
Note: The table shows only the results of the optimal SVM, BPNN, and RF models, the same as below.
Table 12. Identification results for the individual-variety disease image testing sets acquired in the wheat field in Shangzhuang Experimental Station and under laboratory environmental conditions, and the additional testing set consisting of multi-variety disease images acquired in the wheat field in Gangu Testing Station using the SVM, BPNN, and RF models, built based on the different training sets of the variety Mingxian 169, consisting of disease images acquired in the wheat field in Shangzhuang Experimental Station.
ModelTraining Set of Mingxian 169 Acquired in Shangzhuang Experimental StationShangzhuang Experimental StationThe Controlled-Climate ChamberIdentification Accuracy of the Additional Testing Set Acquired in Gangu Testing Station (%)
Identification Accuracy of the Training Set of Mingxian 169 (%)Identification Accuracy of Testing Set 1 of Mingxian 169 (%)Identification Accuracy of Testing Set 2 of Mingxian 169 (%)Identification Accuracy of Testing Set 3 of Mingxian 169 (%)Identification Accuracy of Testing Set 4 of Mingxian 169 (%)Identification Accuracy of Testing Set 1 of Beijing 0045 (%)Identification Accuracy of Testing Set 2 of Beijing 0045 (%)Identification Accuracy of Testing Set 1 of Nongda 211 (%)Identification Accuracy of Testing Set 2 of Nongda 211 (%)Identification Accuracy of Testing Set 3 of Nongda 211 (%)Identification Accuracy of the Testing Set of Beijing 0045 (%)Identification Accuracy of the Testing Set of Mingxian 169 (%)Identification Accuracy of the Testing Set of Nongda 211 (%)
SVMTraining Set 1100.0098.59100.0097.1898.5993.8693.0469.2365.0075.0066.2374.0465.2185.26
Training Set 2100.00100.00100.0098.5998.5990.3593.0461.5445.0052.5057.3357.3252.4684.00
Training Set 3100.00100.00100.0098.5998.5991.2392.1769.2350.0065.0064.6667.8860.9680.84
Training Set 4100.00100.00100.0098.5998.5994.7494.7869.2352.5060.0064.9269.5365.2190.53
BPNNTraining Set 199.3098.59100.0098.5998.5978.9577.3956.4145.0045.0049.4845.2143.4378.11
Training Set 295.0797.1895.7794.3798.5985.9690.4371.7980.0085.0047.1259.8556.4484.63
Training Set 397.8998.5998.5995.7797.1864.0467.8335.9035.0035.0048.8245.1043.5656.63
Training Set 498.59100.00100.0098.5998.5971.0578.2635.9035.0035.0051.4443.4545.0283.58
RFTraining Set 1100.0094.3797.1894.3794.3777.1980.0092.3187.5092.5053.6660.0758.9691.79
Training Set 2100.0097.1898.5997.1897.1881.5875.6571.7970.0070.0061.5261.3952.8682.53
Training Set 3100.0094.3795.7794.3792.9671.9373.0487.1880.0085.0052.0959.9655.7893.26
Training Set 4100.00100.00100.0098.5998.5978.9575.6584.6282.5080.0071.2072.3968.1388.00
Table 13. Identification results for the individual-variety disease image testing sets acquired in the wheat field in Shangzhuang Experimental Station and under laboratory environmental conditions, and the additional testing set consisting of multi-variety disease images acquired in the wheat field in Gangu Testing Station using the SVM, BPNN, and RF models built based on the different training sets of the variety Nongda 211 consisting of disease images acquired in the wheat field in Shangzhuang Experimental Station.
ModelTraining Set of Nongda 211 Acquired in Shangzhuang Experimental StationShangzhuang Experimental StationThe Controlled-Climate ChamberIdentification Accuracy of the Additional Testing Set Acquired in Gangu Testing Station (%)
Identification Accuracy of the Training Set of Nongda 211 (%)Identification Accuracy of Testing Set 1 of Nongda 211 (%)Identification Accuracy of Testing Set 2 of Nongda 211 (%)Identification Accuracy of Testing Set 3 of Nongda 211 (%)Identification Accuracy of Testing Set 1 of Beijing 0045 (%)Identification Accuracy of Testing Set 2 of Beijing 0045 (%)Identification Accuracy of Testing Set 1 of Mingxian 169 (%)Identification Accuracy of Testing Set 2 of Mingxian 169 (%)Identification Accuracy of Testing Set 3 of Mingxian 169 (%)Identification Accuracy of Testing Set 4 of Mingxian 169 (%)Identification Accuracy of the Testing Set of Beijing 0045 (%)Identification Accuracy of the Testing Set of Mingxian 169 (%)Identification Accuracy of the Testing Set of Nongda 211 (%)
SVMTraining Set 1100.0092.3192.5095.0057.0257.3983.1083.1083.1081.6945.2956.2252.8698.95
Training Set 294.8194.8795.0097.5055.2655.6577.4677.4677.4676.0648.4358.6454.7199.58
Training Set 396.1089.7490.0092.5060.5360.8783.1083.1083.1083.1048.5657.4352.7298.95
BPNNTraining Set 194.8189.7495.0097.5054.3955.6553.5253.5253.5253.5243.9855.5651.0098.11
Training Set 297.4092.3192.5095.0050.8850.4356.3456.3456.3456.3449.2158.2048.3498.11
Training Set 398.7087.1890.0092.5050.8853.0471.8371.8371.8371.8344.3752.1955.0197.89
RFTraining Set 1100.0094.8795.0097.5055.2656.5285.9285.9284.5184.5143.1951.3849.1495.37
Training Set 2100.0097.4497.50100.0061.4062.6188.7388.7387.3287.3245.1654.3551.3998.11
Training Set 3100.0094.8795.0092.5062.2863.4888.7390.1488.7388.7345.8155.6752.0697.89
Table 14. Identification results for the individual-variety disease image testing sets acquired under laboratory environmental conditions and in the wheat field in Shangzhuang Experimental Station and the additional testing set consisting of the multi-variety disease images acquired in the wheat field in Gangu Testing Station, using the SVM, BPNN, and RF models built based on the training set of the variety Beijing 0045, itself consisting of disease images acquired under laboratory environmental conditions.
ModelIdentification Accuracy of the Training Set of Beijing 0045 Acquired under Laboratory Environmental Conditions (%)The Controlled-Climate ChamberShangzhuang Experimental Station
Identification Accuracy of the Testing Set of Beijing 0045 (%)Identification Accuracy of the Testing Set of Mingxian 169 (%)Identification Accuracy of the Testing Set of Nongda 211 (%)Identification Accuracy of Testing Set 1 of Beijing 0045 (%)Identification Accuracy of Testing Set 2 of Beijing 0045 (%)Identification Acuracy of Testing Set 1 of Mingxian 169 (%)Identification Accuracy of Testing Set 2 of Mingxian 169 (%)Identification Accuracy of Testing Set 3 of Mingxian 169 (%)Identification Accuracy of Testing Set 4 of Mingxian 169 (%)Identification Accuracy of Testing Set 1 of Nongda 211 (%)Identification Accuracy of Testing Set 2 of Nongda 211 (%)Identification Accuracy of Testing Set 3 of Nongda 211 (%)
SVM94.0589.5374.5975.9658.7758.2660.5660.5660.5659.1566.676567.50
BPNN96.9992.8055.4558.7077.1978.9546.4850.7046.4847.8966.6747.5050.00
RF100.0092.2884.2782.0749.1251.3060.5659.1560.5660.5664.1065.0070.00
Table 15. Identification results for the individual-variety disease image testing sets acquired under laboratory environmental conditions and in the wheat field in Shangzhuang Experimental Station, and the additional testing set consisting of the multi-variety disease images acquired in the wheat field in Gangu Testing Station by using the SVM, BPNN, and RF models, built based on the training set of the variety Mingxian 169, consisting of disease images acquired under laboratory environmental conditions.
ModelIdentification Accuracy of the Training Set of Mingxian 169 Acquired under Laboratory Environmental Condition (%)The Controlled-Climate ChamberShangzhuang Experimental Station
Identification Accuracy of the Testing Set of Mingxian 169 (%)Identification Accuracy of the Testing Set of Beijing 0045 (%)Identification Accuracy of the Testing Set of Nongda 211 (%)Identification Accuracy of Testing Set 1 of Beijing 0045 (%)Identification Accuracy of Testing Set 2 of Beijing 0045 (%)Identification Accuracy of Testing Set 1 of Mingxian 169 (%)Identification Accuracy of Testing Set 2 of Mingxian 169 (%)Identification Accuracy of Testing Set 3 of Mingxian 169 (%)Identification Accuracy of Testing Set 4 of Mingxian 169 (%)Identification Accuracy of Testing Set 1 of Nongda 211 (%)Identification Accuracy of Testing Set 2 of Nongda 211 (%)Identification Accuracy of Testing Set 3 of Nongda 211 (%)
SVM97.9692.5272.2576.8960.5359.1359.1559.1559.1559.1569.2365.0070.00
BPNN97.0894.3965.8466.9374.5673.0450.7049.3052.1146.4856.4157.5062.50
RF100.0095.8283.6484.0657.8959.1363.3864.7964.7963.3866.6770.0067.50
Table 16. Identification results for the individual-variety disease image testing sets acquired under laboratory environmental conditions and in the wheat field in Shangzhuang Experimental Station, and the additional testing set consisting of multi-variety disease images acquired in the wheat field in Gangu Testing Station using the SVM, BPNN, and RF models built based on the training set of the variety Nongda 211, itself consisting of disease images acquired under laboratory environmental conditions.
ModelIdentification Accuracy of the Training Set of Nongda 211 Acquired under Laboratory Environmental Conditions (%)The controlled-Climate ChamberShangzhuang Experimental Station
Identification Accuracy of the Testing Set of Nongda 211 (%)Identification Accuracy of the Testing Set of Mingxian 169 (%)Identification Accuracy of the Testing Set of Beijing 0045 (%)Identification Accuracy of Testing Set 1 of Beijing 0045 (%)Identification Accuracy of Testing Set 2 of Beijing 0045 (%)Identification Accuracy of Testing Set 1 of Mingxian 169 (%)Identification Accuracy of Testing Set 2 of Mingxian 169 (%)Identification Accuracy of Testing Set 3 of Mingxian 169 (%)Identification Accuracy of Testing Set 4 of Mingxian 169 (%)Identification Accuracy of Testing Set 1 of Nongda 211 (%)Identification Accuracy of Testing Set 2 of Nongda 211 (%)Identification Accuracy of Testing Set 3 of Nongda 211 (%)
SVM94.6993.4975.1377.2357.8960.0059.1559.1559.1560.5674.3672.5070.00
BPNN93.1792.3059.4267.7727.1922.6181.6981.6980.2878.8761.5455.0065.00
RF100.0092.0386.3983.2861.4060.0064.7963.3863.3861.9758.9765.0047.50
Table 17. Identification results for the multi-variety disease image testing set consisting of disease images acquired in the wheat field in Shangzhuang Experimental Station and under laboratory environmental conditions, the individual-variety disease image testing sets acquired in the wheat field in Shangzhuang Experimental Station and under laboratory environmental conditions, and the additional testing set consisting of the multi-variety disease images acquired in the wheat field in Gangu Testing Station using the SVM, BPNN, and RF models built based on the multi-variety disease image training set consisting of disease images acquired in the wheat field in Shangzhuang Experimental Station and under laboratory environmental conditions.
ModelThe Multi-Variety Disease Images Acquired in Shangzhuang Experimental Station and under Laboratory Environmental ConditionsShangzhuang Experimental StationThe Controlled-Climate Chamber
Identification Accuracy of the Training Set (%)Identification Accuracy of the Testing Set (%)Identification Accuracy of Testing Set 1 of Beijing 0045 (%)Identification Accuracy of Testing Set 2 of Beijing 0045 (%)Identification Accuracy of Testing Set 1 of Mingxian 169 (%)Identification Accuracy of Testing Set 2 of Mingxian 169 (%)Identification Accuracy of Testing Set 3 of Mingxian 169 (%)Identification Accuracy of Testing Set 4 of Mingxian 169 (%)Identification Accuracy of Testing Set 1 of Nongda 211 (%)Identification Accuracy of Testing Set 2 of Nongda 211 (%)Identification Accuracy of Testing Set 3 of Nongda 211 (%)Identification Accuracy of the Testing Set of Beijing 0045 (%)Identification Accuracy of the Testing Set of Mingxian 169 (%)Identification Accuracy of the Testing Set of Nongda 211 (%)
SVM99.9398.4093.8695.6597.1897.1897.1897.1897.4492.5095.0098.0499.0198.94
BPNN98.3896.4594.7496.5298.5998.5998.5998.5982.0585.0090.0094.3796.8197.34
RF100.0095.8298.2598.2698.5998.5998.5998.5997.4497.595.0093.5996.9293.49
Disclaimer/Publisher’s Note: The statements, opinions and data contained in all publications are solely those of the individual author(s) and contributor(s) and not of MDPI and/or the editor(s). MDPI and/or the editor(s) disclaim responsibility for any injury to people or property resulting from any ideas, methods, instructions or products referred to in the content.

