Article

Effect of Soil Moisture Deficit on Aerobic Rice in Temperate Australia

Centre for Regional and Rural Futures (CeRRF), Deakin University, Griffith, NSW 2680, Australia
*
Author to whom correspondence should be addressed.
Agronomy 2023, 13(1), 168; https://doi.org/10.3390/agronomy13010168
Submission received: 21 November 2022 / Revised: 29 December 2022 / Accepted: 31 December 2022 / Published: 4 January 2023
(This article belongs to the Special Issue Water Saving in Irrigated Agriculture)

Abstract

:
Declining water availability is pressing rice growers to adopt water-saving irrigation practices such as aerobic rice to maintain profitability per megalitre (ML) of water input. Irrigators require well-defined irrigation thresholds to initiate irrigation to maximise water productivity. Such thresholds do not exist for temperate rice regions. Adopting a strategy that has been reported to succeed in non-temperate environments may fail in temperate climates, and therefore, needs investigation. This study aimed to investigate, in a temperate Australian environment, the effect of increasing soil moisture deficit during the rice vegetative period on crop physiological development, grain yield and water productivity. The study was conducted in a commercial farm using a randomised complete block design in the 2020/21 and 2021/22 growing seasons. Automated gravity surface irrigation technologies were adopted to enable high-frequency irrigation. Extending soil moisture deficit beyond 15 kPa was found to significantly delay panicle initiation by at least 13–14 days, exposing rice to cold temperatures in Year 1 during the cold-sensitive early pollen microspore period. This reduced yield by up to 55% (4.5 t/ha) compared to the 15 kPa treatment that was not impacted by cold sterility. In the absence of cold sterility, irrigated water productivity and total water productivity ranged between 1.02 and 1.61 t/ML, and 0.84 and 0.93 t/ML, respectively. The highest yields (8.1 and 7.5 t/ha) were achieved irrigating at a soil tension of 15 kPa in growing seasons 2020/21 and 2021/22. This research demonstrates that sound water productivity can be achieved with aerobic rice cultivation in temperate climates, providing cold temperatures during early pollen microspore are avoided. The quantification of the delay in crop development caused by increasing soil moisture deficit provides rice farmers greater confidence in determining the irrigation strategy and timing of pre-emergent irrigation in regions at risk of cold sterility. However, due to the high labour demand associated with aerobic rice, the adoption of aerobic rice at a commercial scale in this Australian environment is unlikely without adopting automated irrigation technology.

1. Introduction

Rice is the largest irrigated crop and accounts for 30% of the global irrigated area whilst being a staple food for over 50% of the global population [1,2]. Relative to other crops, rice is a high-water use species [2,3,4]. Global water scarcity is increasing due to increased demand from urban and industrial users, silting of reservoirs, chemical pollution, decreasing groundwater tables, salinisation, livestock production, as well as social and other environmental pressures [5]. As a consequence of reduced water availability for irrigation and increasing water costs, rice farmers must enhance water productivity to maximise rice production per unit of applied water.
Rice has traditionally been grown under continuously flooded situations in an anaerobic environment for the majority of the season (from the 3-leaf stage until physiological maturity). This practice aims to maximise yields by meeting rice crop evapotranspiration needs, reducing weed and pest pressures and providing a thermal buffer in temperate environments during the early pollen microspore period when the crop is sensitive to low temperatures [6,7,8,9]. Water-saving irrigation techniques for rice have been investigated around the world with the aim to reduce water use whilst maintaining or improving grain yields. One such strategy termed alternate wetting and drying (AWD), consists of periodic soil drying and re-flooding, generally to 2–5 cm a few days after the disappearance of ponded water [10,11]. Delayed permanent water (DPW) is a water-saving strategy in which the soil is left to dry between irrigation events in the early vegetative period and delays the onset of permanent water until just before panicle initiation [12]. Mid-season drainage and aerobic rice (understood here as periodic irrigation without maintaining a flood at any time in the growing season) are also techniques implemented to reduce water use. Decreasing the depth of flooded water (normally 5–10 cm above ground) to soil saturation or implementing AWD techniques has reduced water input by ~40% compared to continuously flooded rice in Japan, Uruguay, India and the Philippines with little or no yield loss, provided adequate weed control is achieved [13,14,15,16].
Advances in water productivity have also been achieved without any period of ponding as is the case for aerobic rice, compared to continuous flooding due to a significant reduction in water use. However, minor yield penalties often ensue with yields generally below 6 t/ha [13,17,18,19,20]. Environmental factors, cultivar selection, the extent, duration and frequency of drought stress and water table height are all factors found to influence the extent of yield reduction when rice is grown in non-ponded systems [11,13,18].
A review of global aerobic rice production by Kato et al. [19] concluded that aerobic rice production in temperate regions can produce in excess of 9 t/ha, whilst yields in tropical areas are limited to less than 8 t/ha. Whilst the review highlighted studies on rice grown under aerobic conditions that achieved yields in excess of 8 t/ha, many were from subtropical environments with associated lower vapour pressure deficit and solar radiation [21,22,23,24] with no yields > 8 t/ha from truly temperate environments outside of Japan. Comparatively, growers of flooded rice in temperate Australia achieve in excess of 10 t/ha [25,26], with the next highest yielding rice producers (Tajikistan, Egypt, Uruguay, USA and Peru (8–9 t/ha) [25]) also predominately from temperate environments. Widespread adoption of non-ponded rice is not evident in these high-yielding temperate regions which can be exposed to cold-induced sterility, heat stress and high evaporative demand [8,9]. In the absence of ponded water, under mild water stress, stomatal closure reduces evaporative cooling, thus high temperatures can severely damage rice during the reproductive period [27].
Despite substantial water savings, the yields of non-flooded/aerobic rice were generally considered unacceptable in the sprinkler and flood-irrigated experiments conducted in temperate Australia in the 1980s [28,29,30]. Yield reduction was likely a result of a large soil moisture deficit with leaf rolling, wilting and senescence reported, particularly in the once-a-week irrigation regimes [28,29] and when the sprinkler experienced issues [30]. As such, the practice was not adopted at a commercial scale. However, delaying the onset of permanent water until just before panicle initiation has successfully reduced water use by 15–23% whilst maintaining or increasing yields [12,28]. This highlights the ability of rice grown in temperate environments to withstand water stress in the vegetative stage and significantly increase water productivity. Nevertheless, the adoption of DPW does not appear to be widespread in any temperate rice regions, possibly due to agronomic and labour challenges associated with irrigation prior to the permanent flood or due to variability of irrigation regime producing inconsistent results. However, the extent of soil moisture deficit between irrigation events prior to the application of permanent water was found to vary considerably (−20 to >−120 kPa) in different temperate Australian rice fields [31].
Scheduling irrigation frequency based on number of days since the last irrigation [28,29,30] or crop evapotranspiration without definitive crop coefficients [12] may result in under- or over-irrigation due to the effects of different soil types and climatic conditions. This is evident with severe leaf rolling, scorching and stunting reported by [28,29,30] when irrigation occurred on a 7-day interval, whilst simultaneously observing water runoff under a sprinkler irrigation system [30]. As such, an absolute value irrigation threshold that is easily measured and accounts for environmental variation may provide farmers with confidence to adopt water-saving rice irrigation practices should sound water productivity be achieved. Soil-water or plant-water-based sensing would likely provide more accurate irrigation scheduling due to the influence of soil type, crop management and variable evapotranspiration with Tuong et al. [11] recommending irrigation scheduling based on soil water potential rather than the number of days for AWD rice. Soil moisture sensing has long been applied in the field and is considered easier to measure and automate than plant-based sensing with a number of commercial sensors available [32]. Cost-effective and appropriate sensing with definitive thresholds to schedule irrigation in water-saving rice lends itself to incorporation into automated gravity surface irrigation which is an emerging technology used to overcome the increased labour issues associated with high frequency irrigation experienced with aerobic rice production [33].
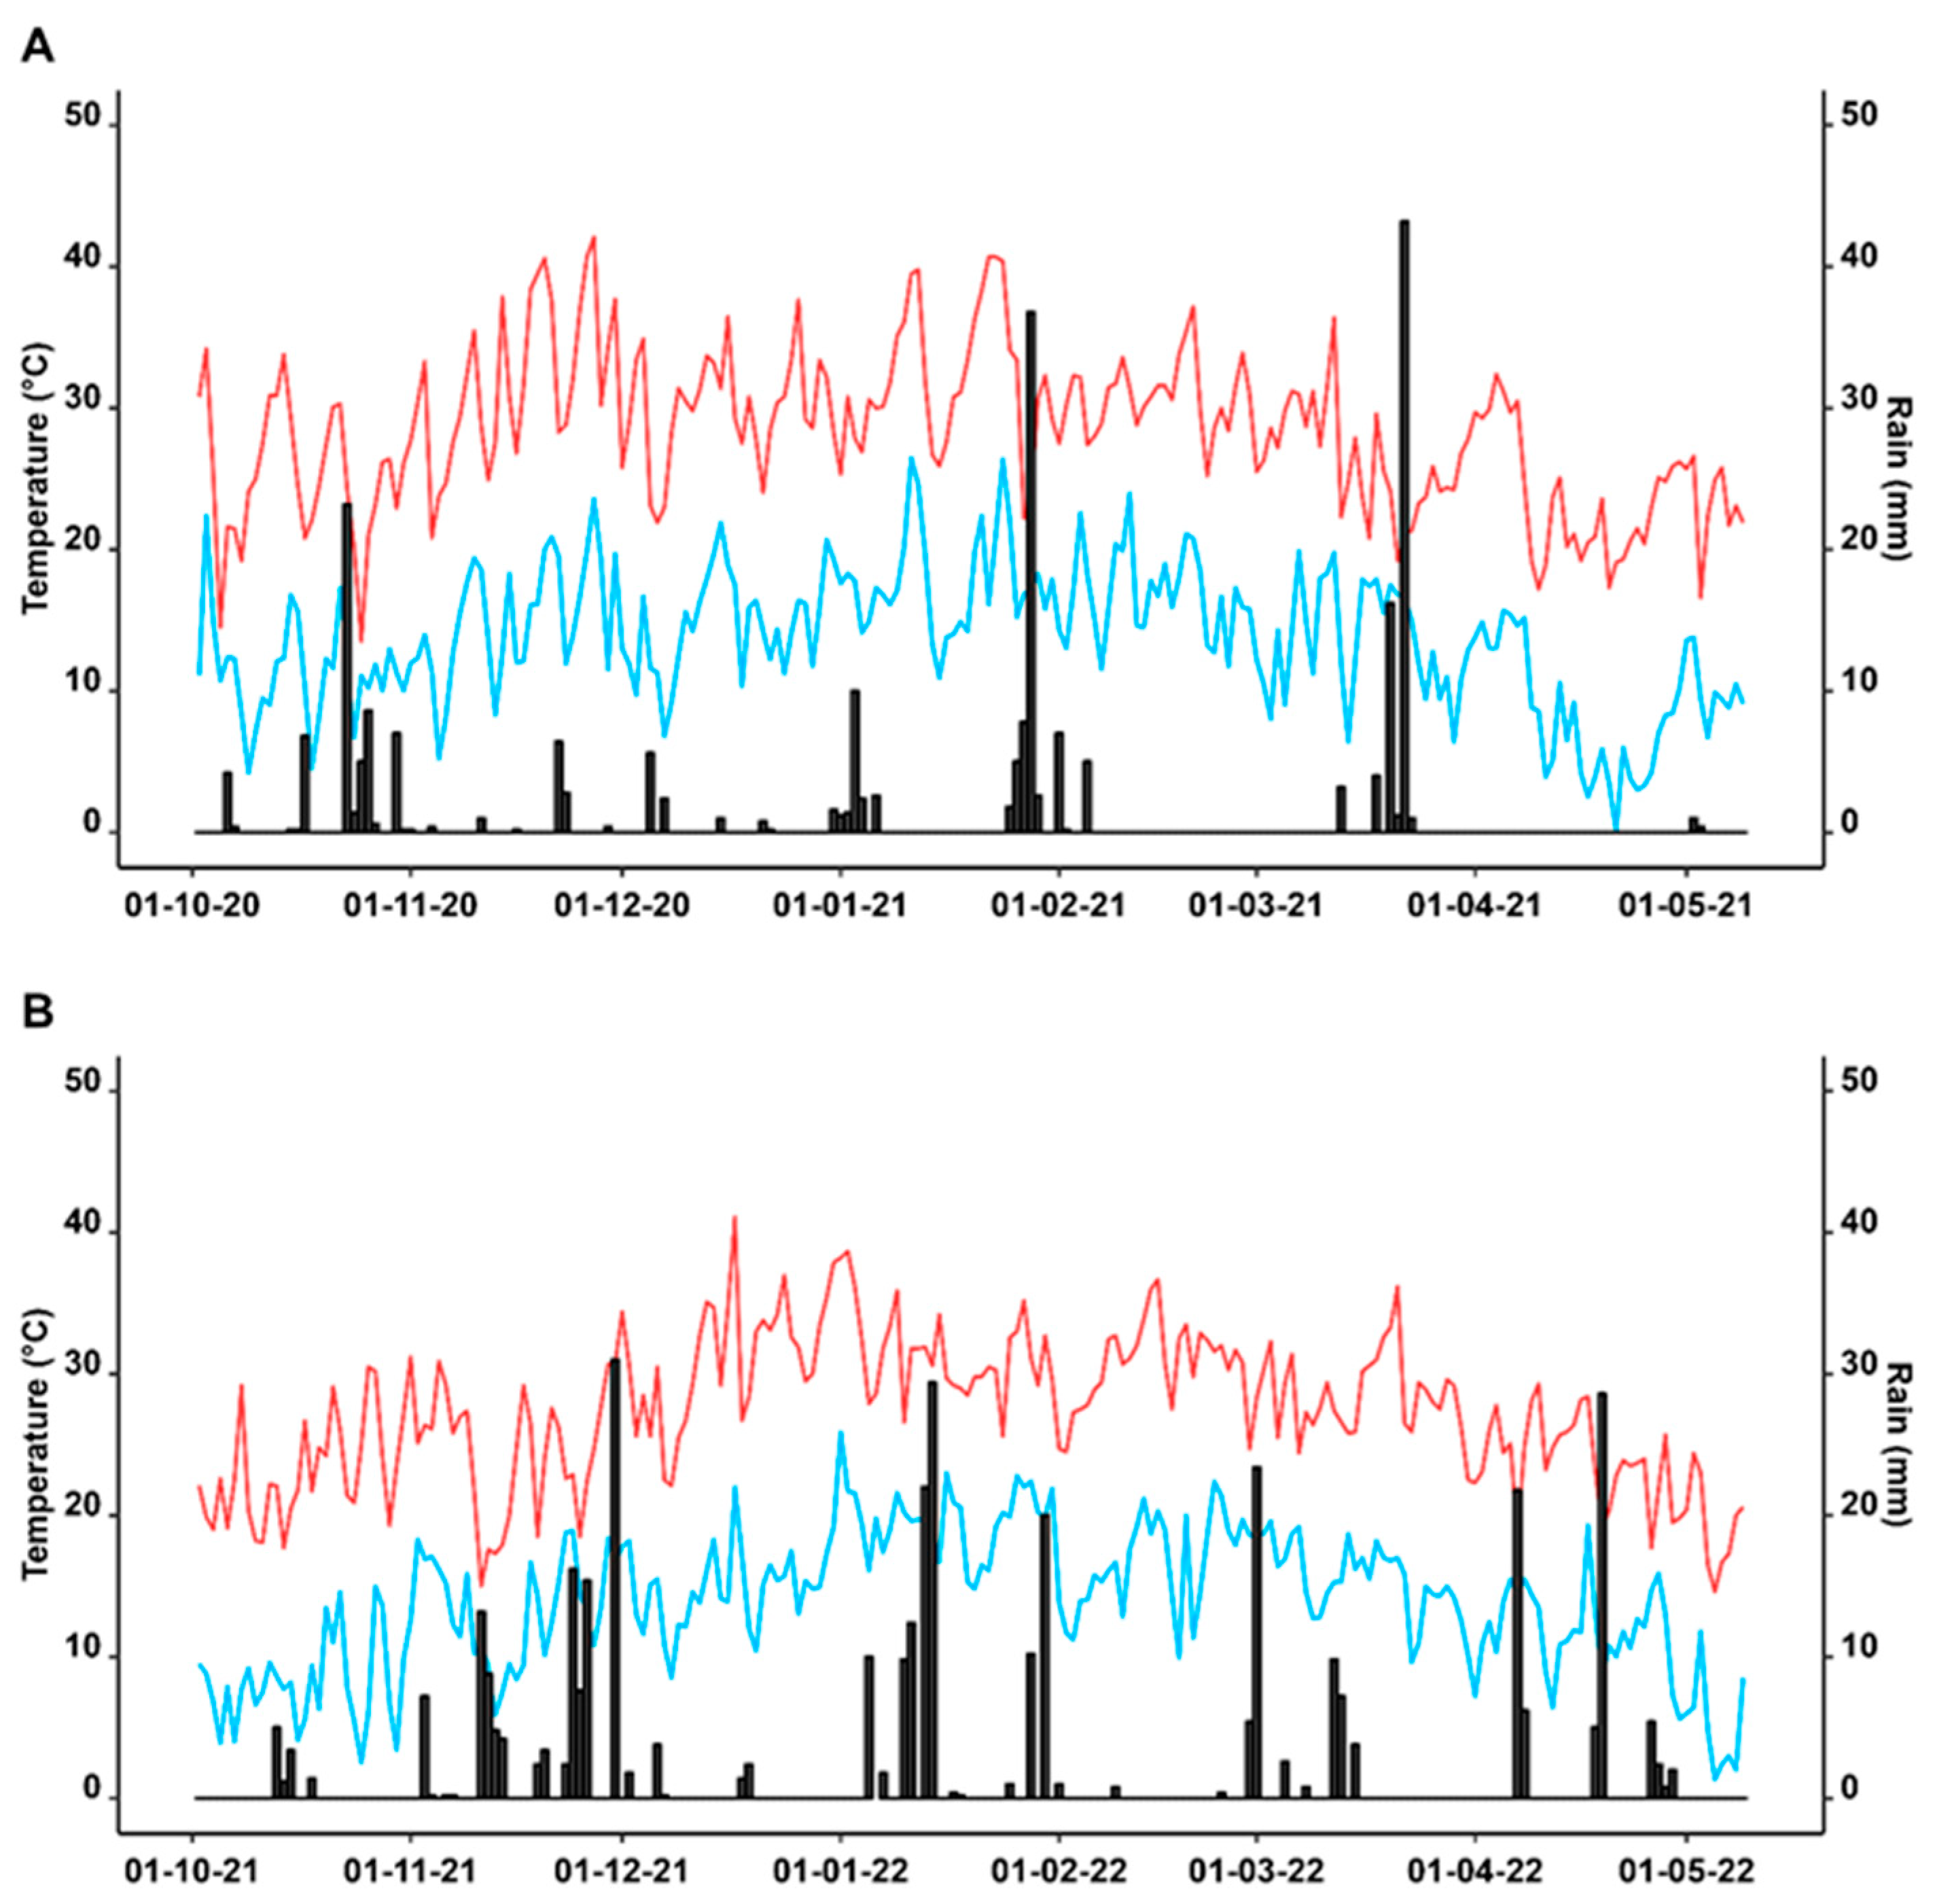
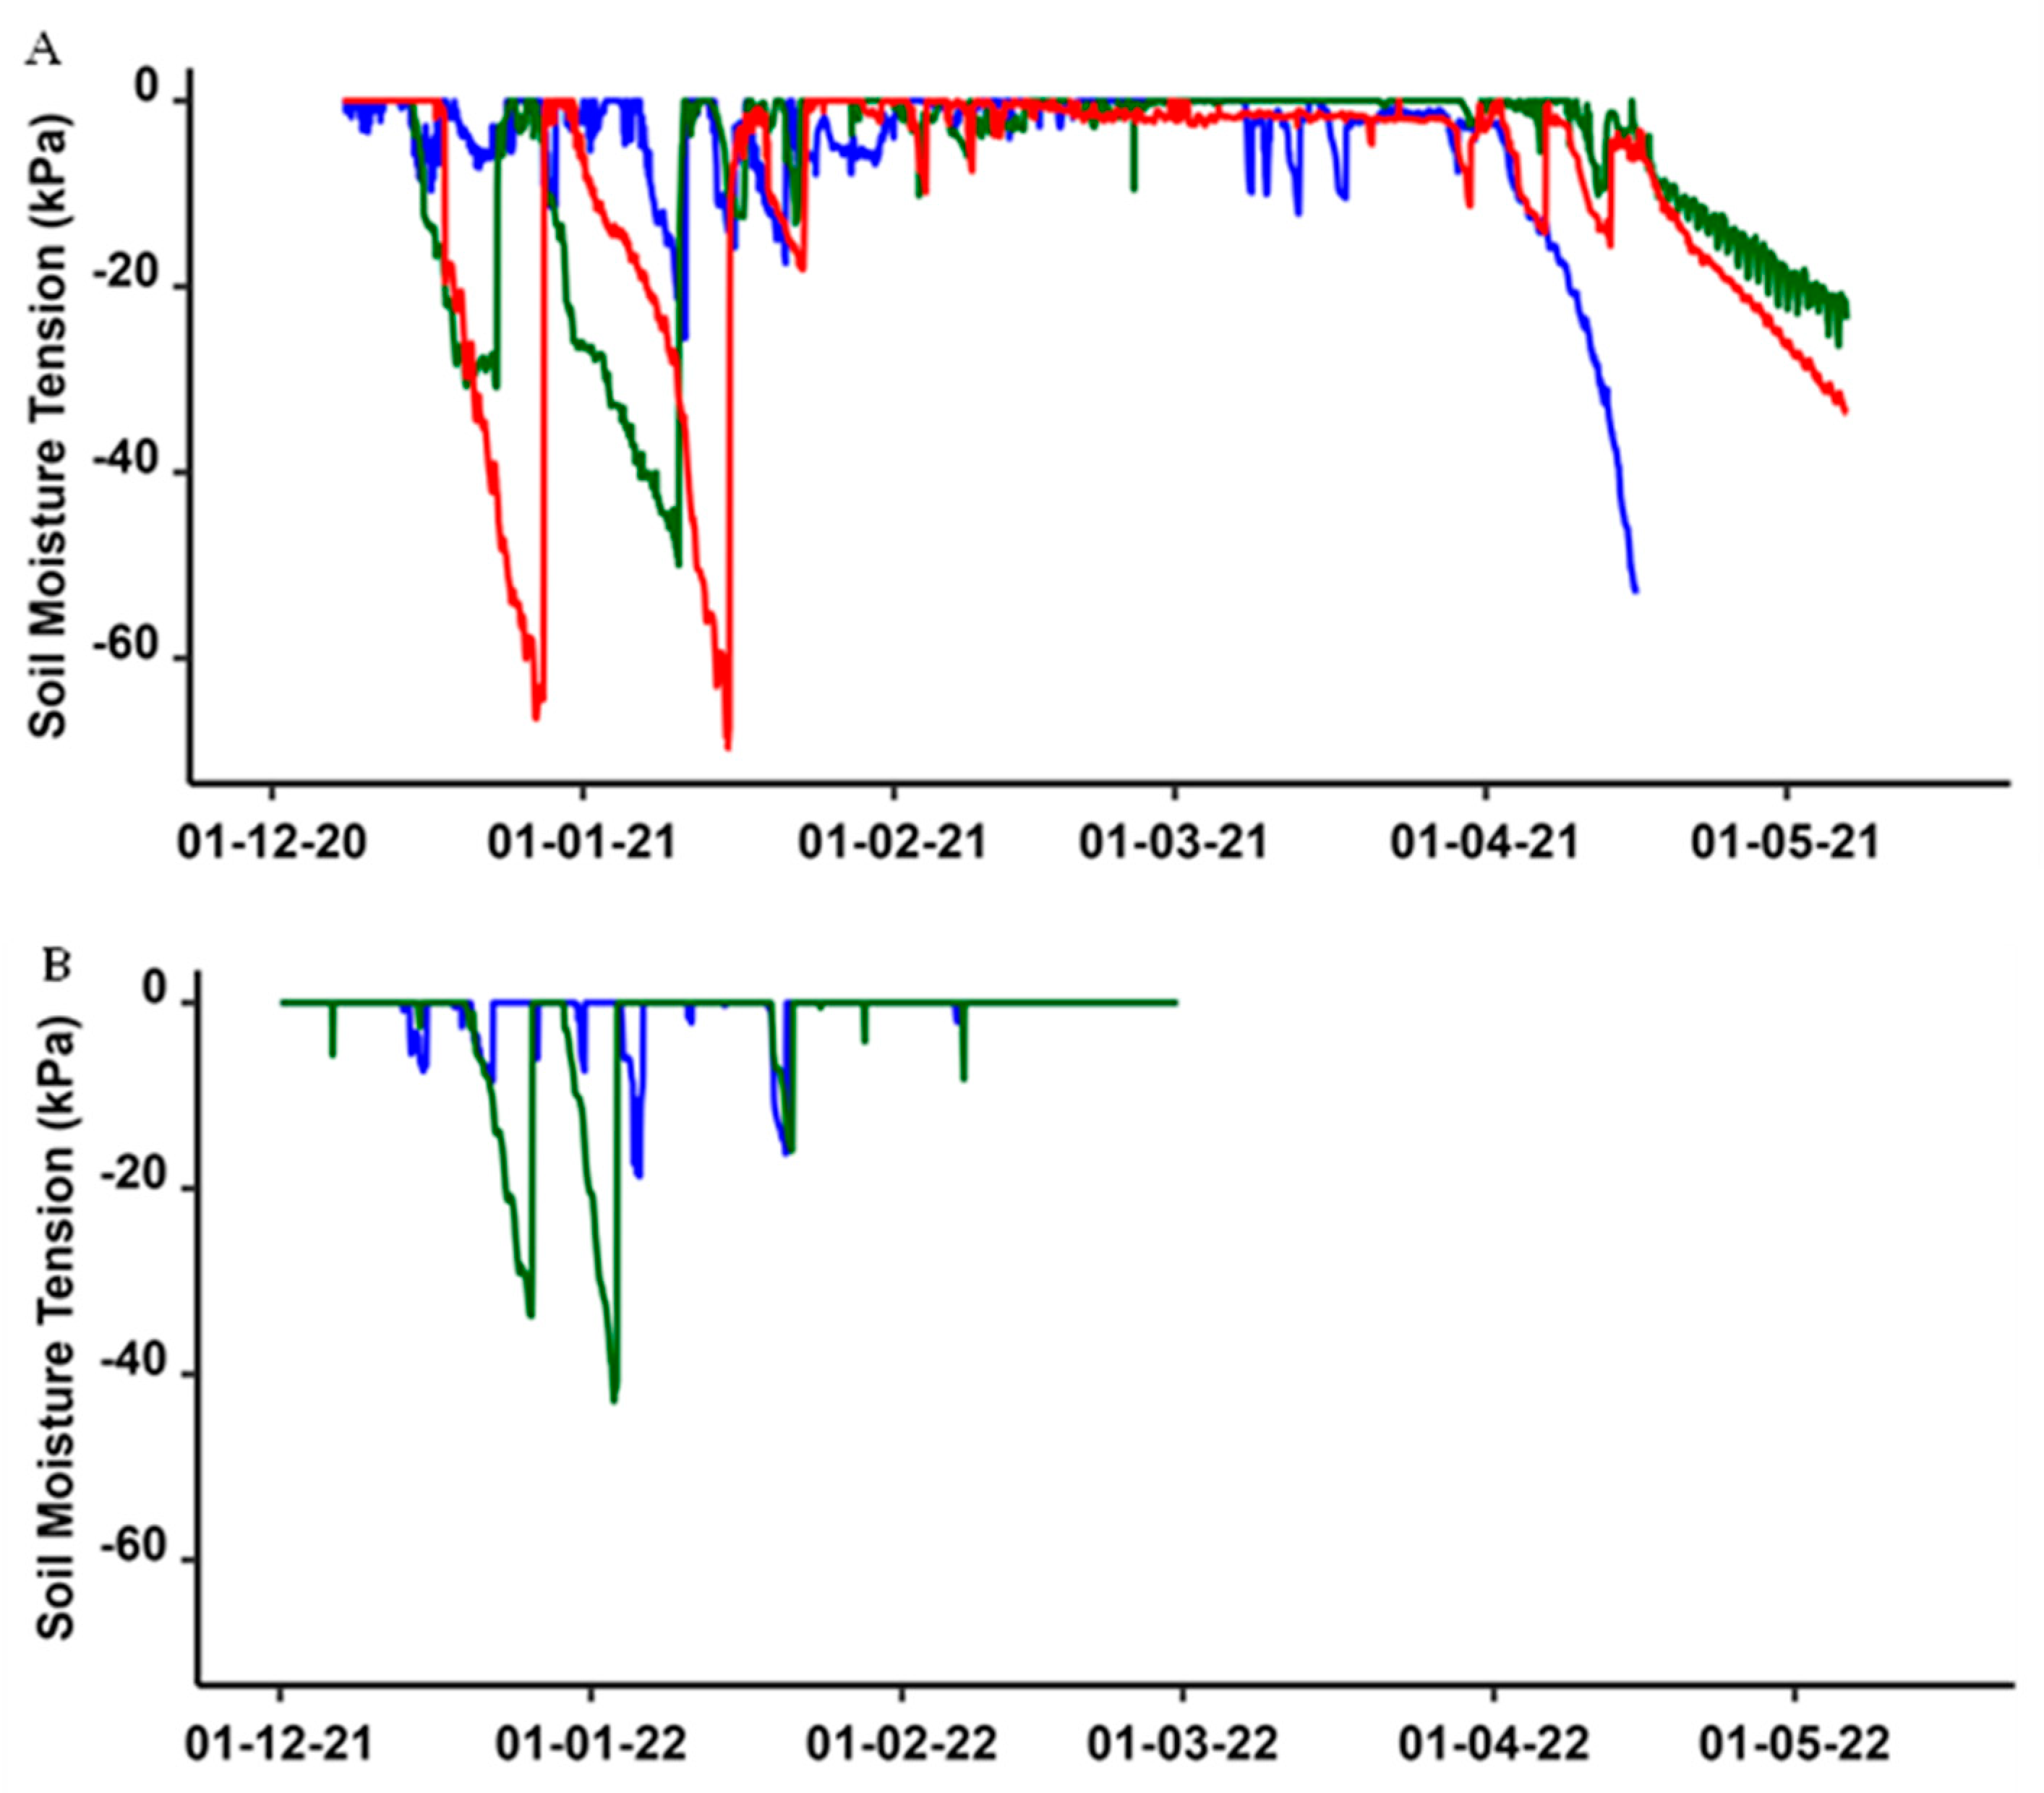
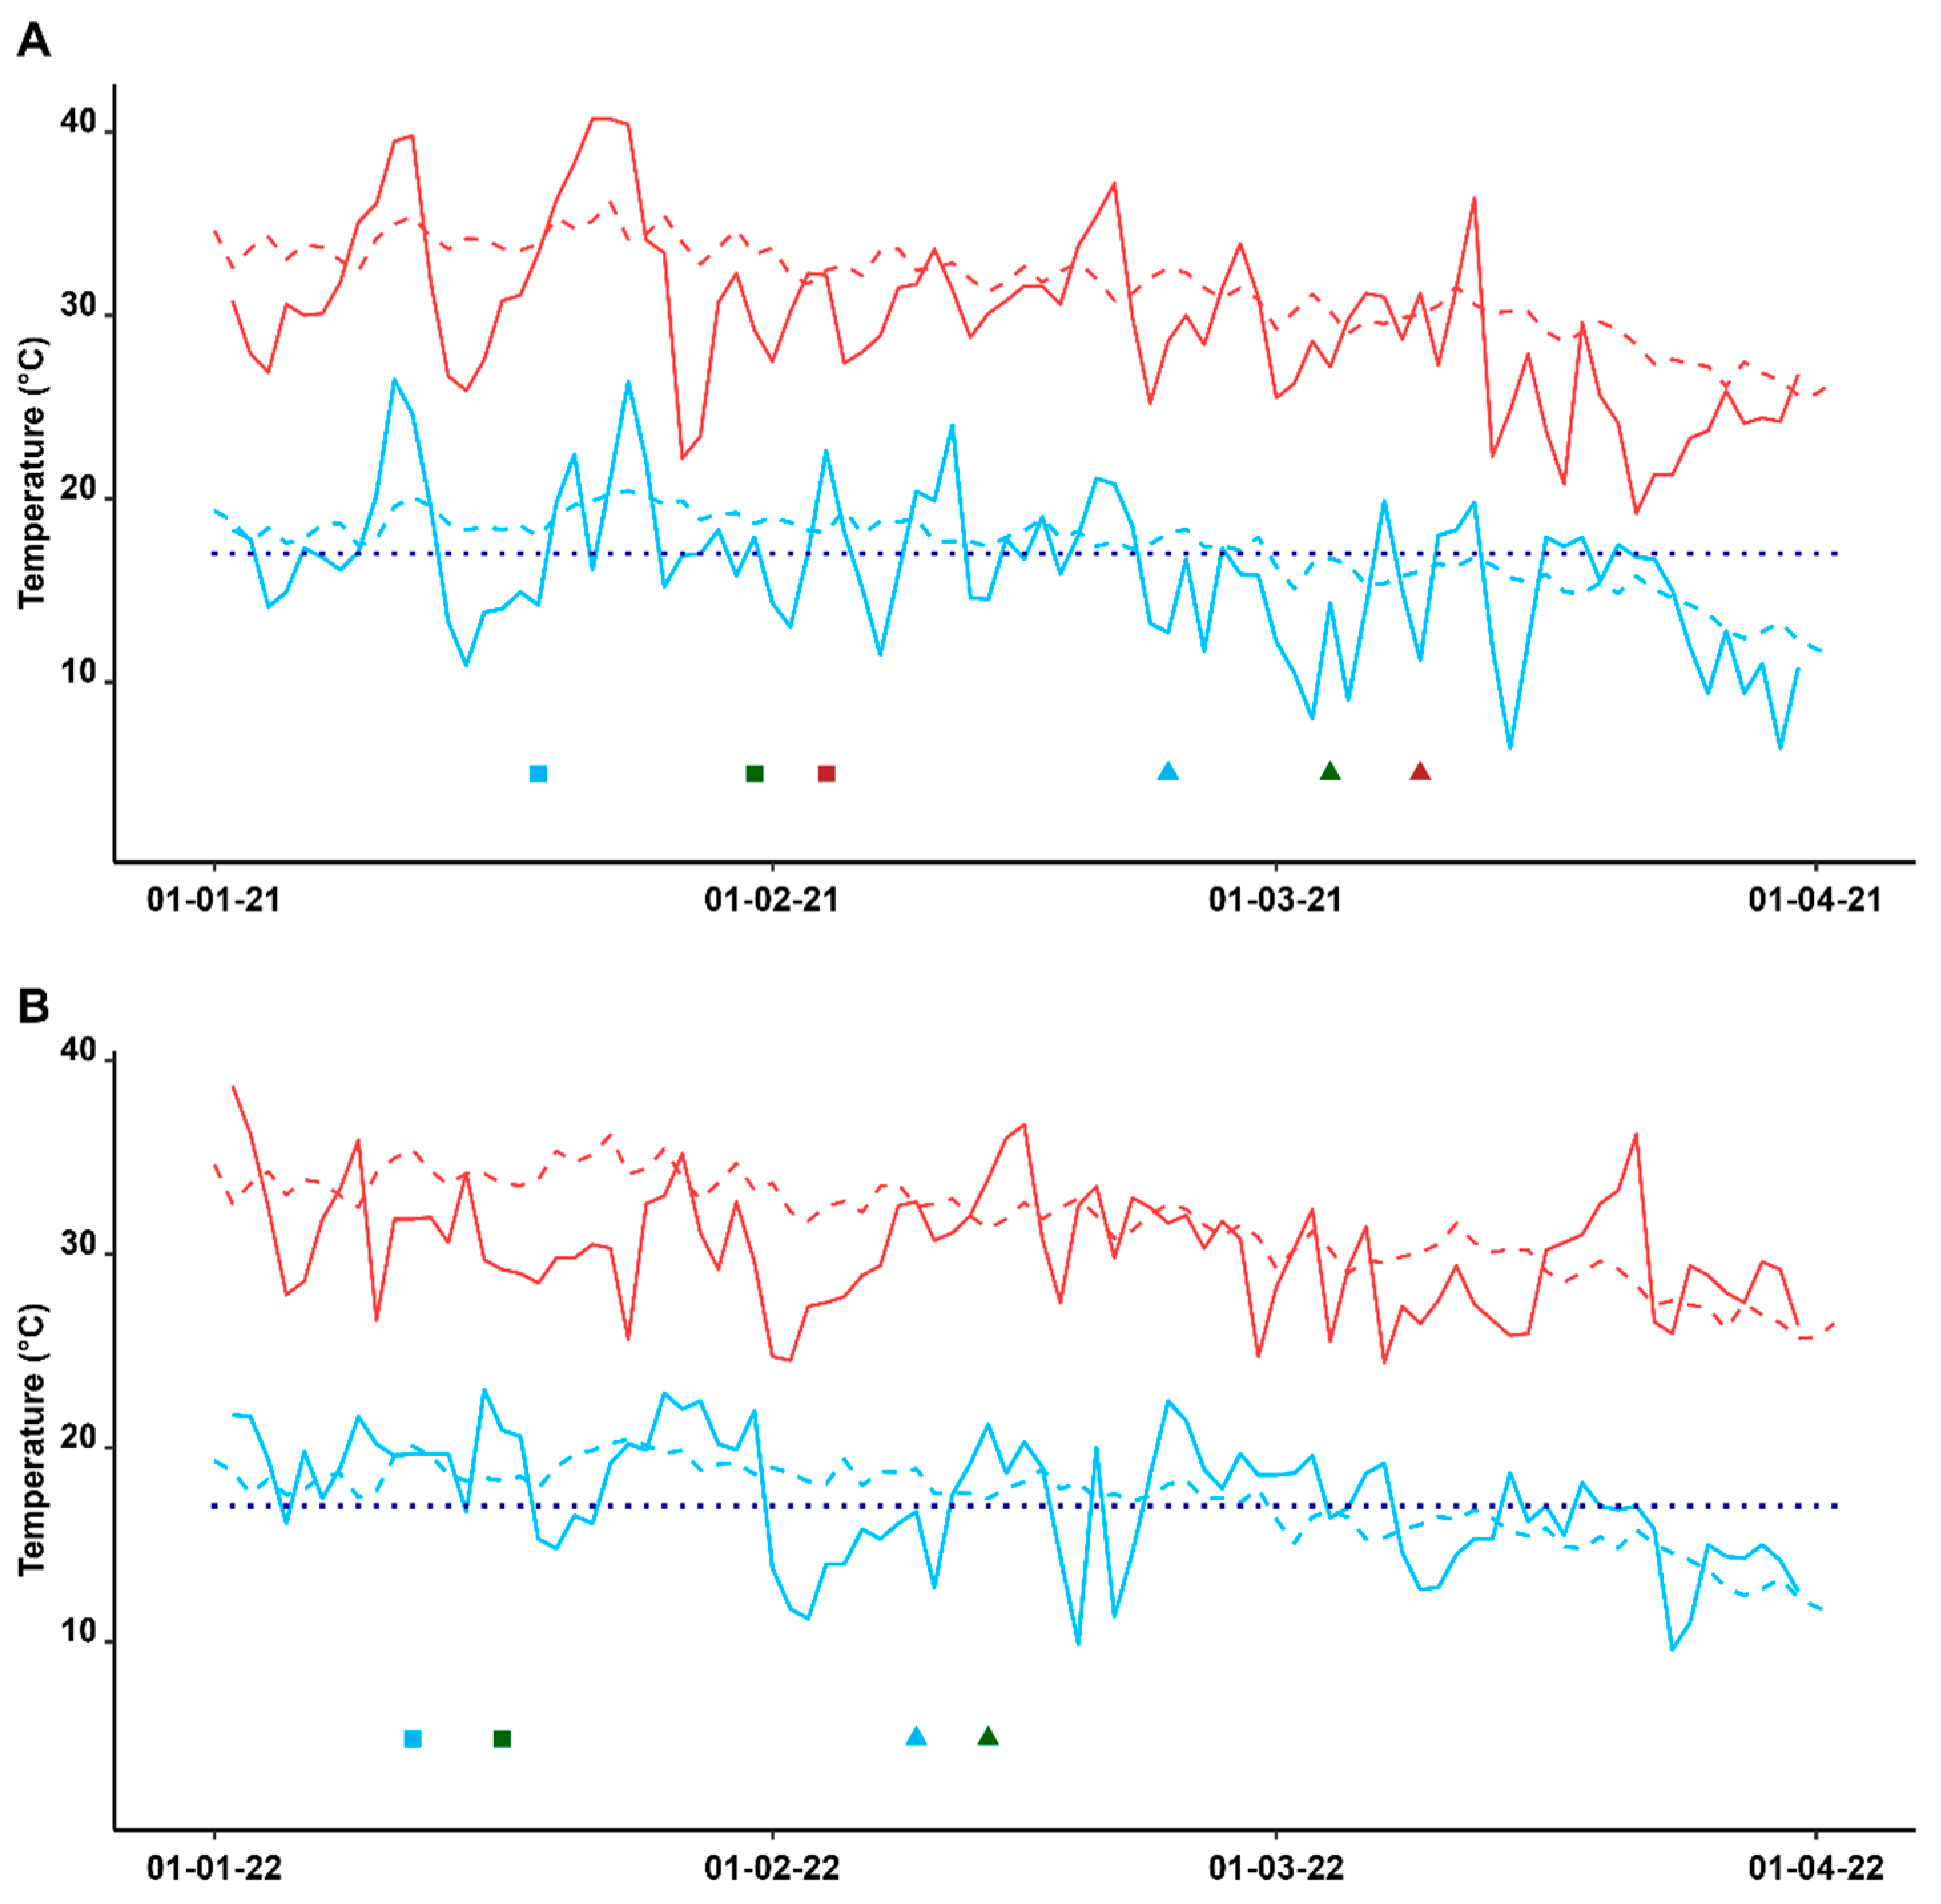
Soil moisture tension describes how strongly water binds to soil and is measured in units of pressure (kPa) with saturated soil measuring > −10 kPa and more negative numbers indicating greater tension and more effort for the plant to extract water from the soil. Soil moisture tension-based thresholds have previously been used to initiate irrigation events in water-saving rice [17,34,35,36,37,38]. Only one such study using soil moisture tension in a temperate environment can be found [35]. These authors reported sprinkler-irrigated aerobic rice yields (7.9–9.4 t/ha) to be equivalent to or higher than continuously flooded rice (8.2 t/ha) when irrigation was triggered at a soil tension of −60 kPa at 20 cm below ground. However, in other regions, the more generally accepted threshold is between −10 and −30 kPa [13,17,24,39]. Using soil tension thresholds determined in studies from other environments may fail in temperate climates. Evidently, there is a need to further investigate the impact of varying degrees of soil moisture deficit in temperate high-yielding production systems with new varieties aimed at maximising water productivity.
Research has shown a physiological delay to panicle initiation (PI) and anthesis in aerobic rice compared to continuous flood [28,29,30,40]. Similarly, Dunn and Gaydon [12] increased the time between irrigations in DPW to delay PI and anthesis, recommending earlier sowing of rice grown under DPW to avoid cold-induced sterility during reproductive periods. Australian rice varieties are sensitive to cold temperatures during early pollen microspore [9], which occurs about two weeks after the more easily identifiable PI. Quantification of the maturity delay associated with soil moisture deficit is required to enable sowing and ease of irrigation scheduling so farmers can manage irrigation water to avoid unfavourable growing conditions during sensitive growth periods.
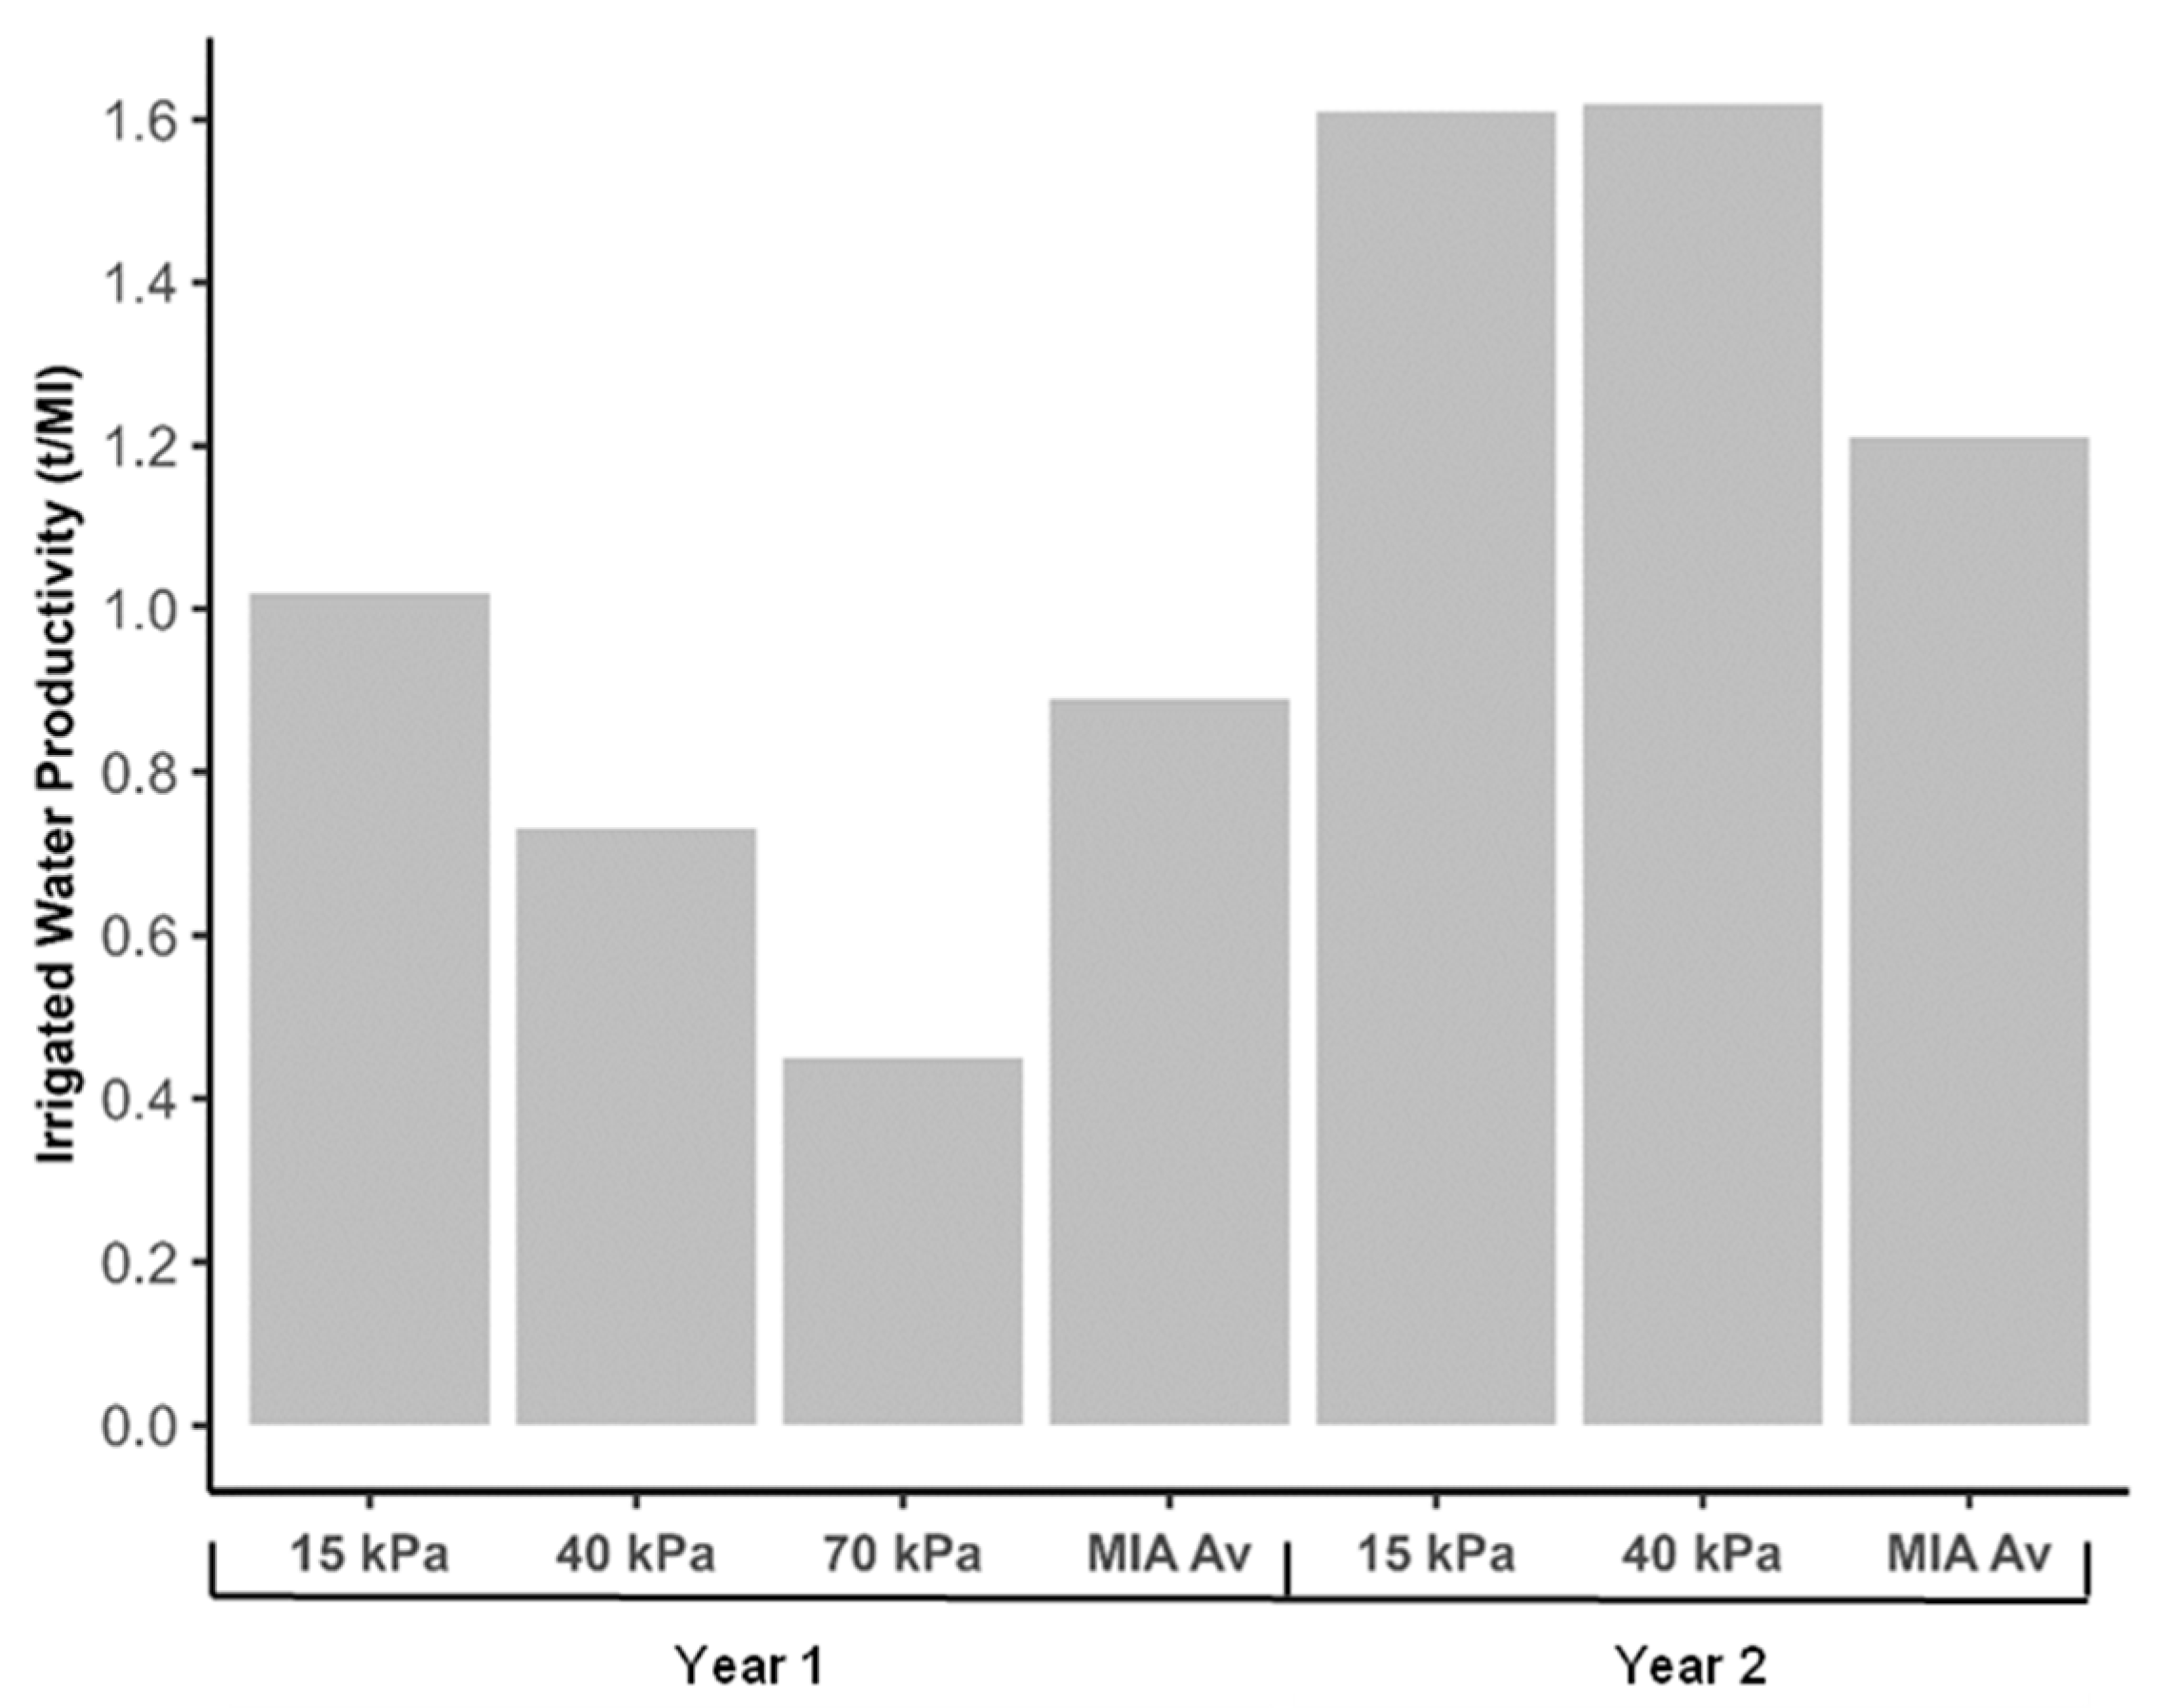
The Australian rice industry has set a water productivity target of 1.5 t/ML (ton/Megalitre) by 2026, which is a significant increase on the current industry average of 0.85 t/ML [26]. This will require a radical shift in the way rice is grown and managed with aerobic rice hypothesised as a potential solution to achieving the ambitious target. However, a better understanding of the impact soil moisture deficit has on yield per ML and quantification of the delay in maturity is required. Enhanced progress to achieve the goal of 1.5 t/ML is likely with breeding efforts focused on cold-tolerant varieties to decrease the likelihood of cold-induced sterility. It is, therefore, imperative to determine an appropriate irrigation schedule for non-ponded rice in high-yielding temperate rice systems.
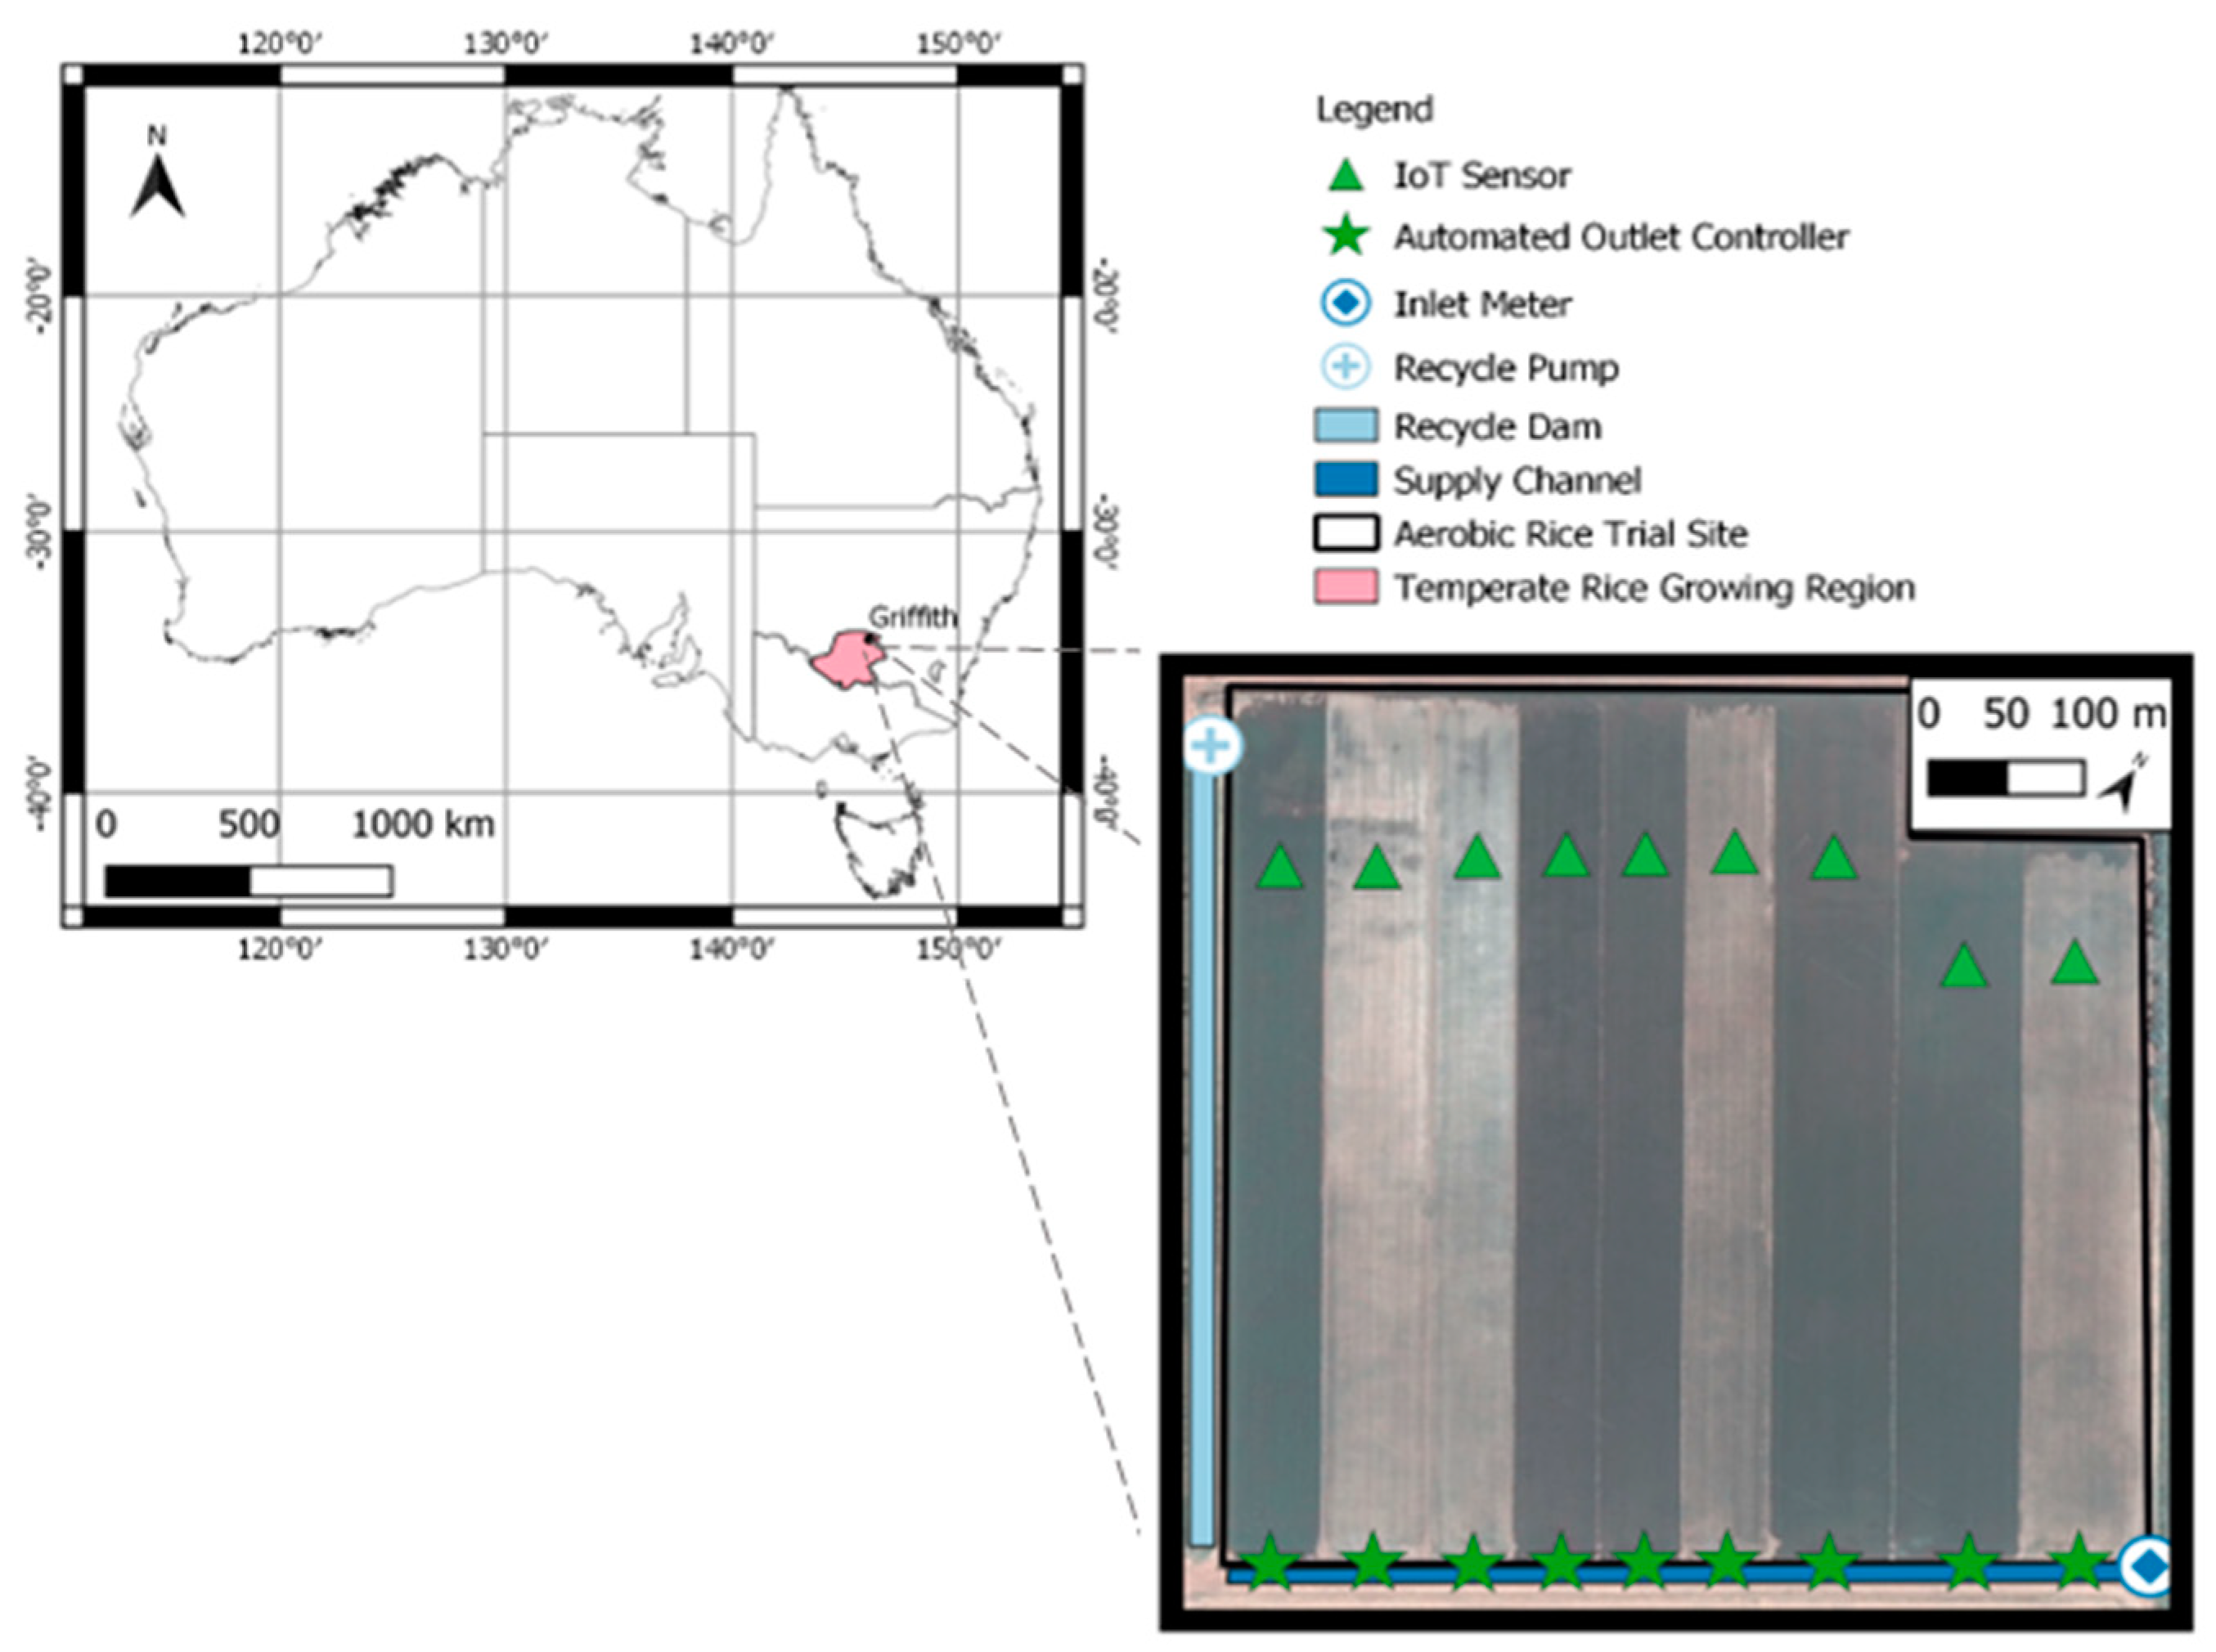
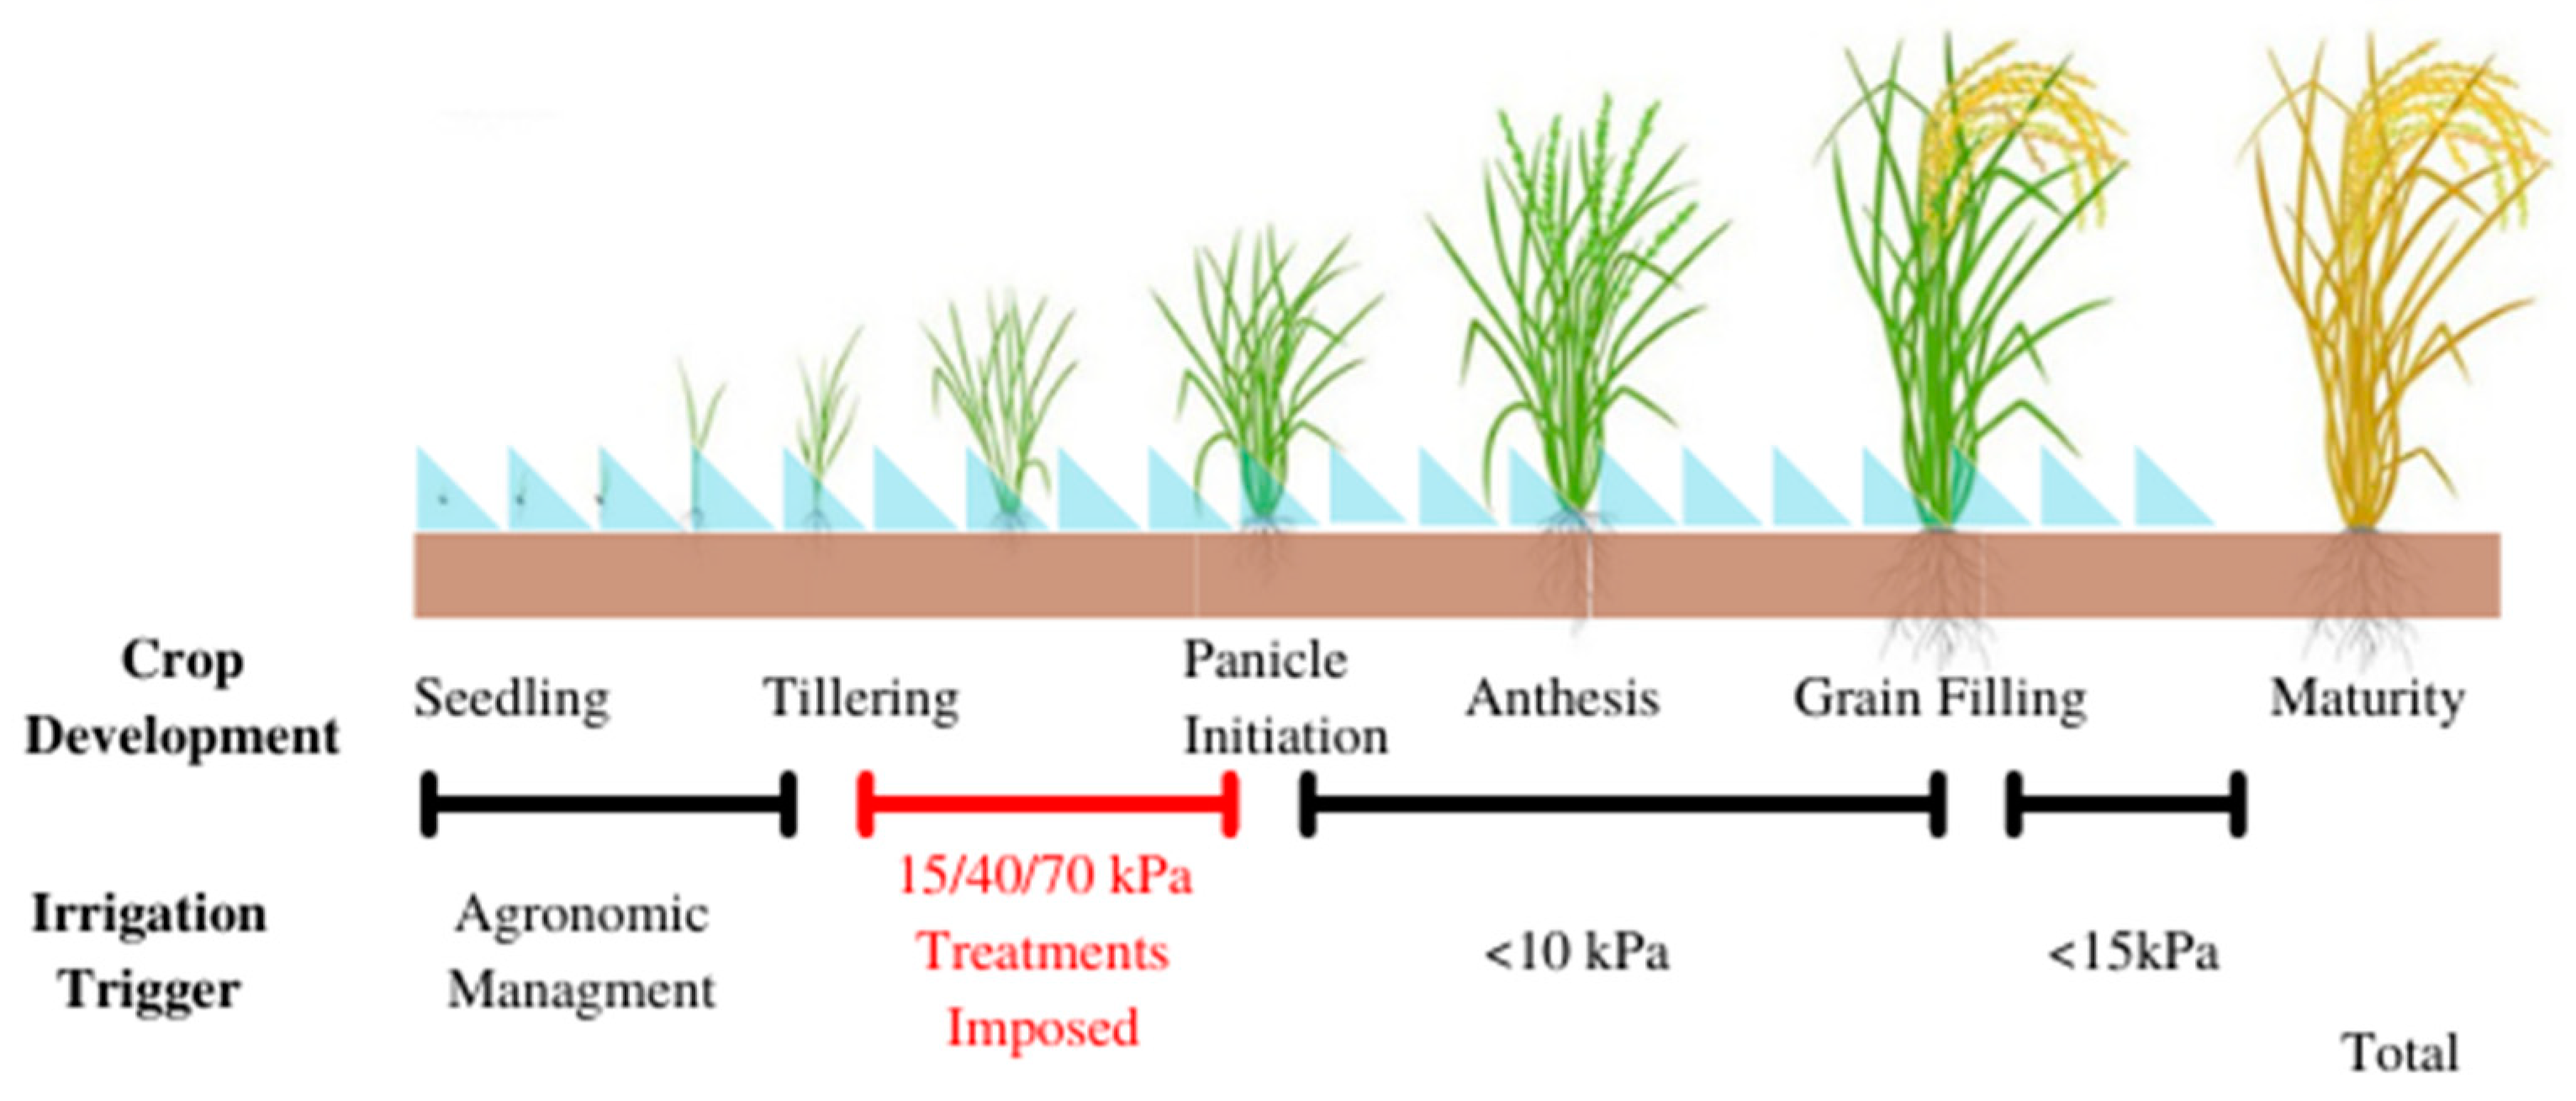
Provided plant water stress is avoided during the reproductive period, it is hypothesised that sound yield and water productivity can be achieved under mild to moderate soil moisture deficit during the vegetative period with severe soil moisture deficit hypothesised to delay plant development. This aerobic rice study implemented various soil moisture deficit thresholds during the vegetative period aimed to determine the most appropriate irrigation regime for aerobic rice in temperate environments. The experiment was conducted on a commercial scale to better understand the real impacts of aerobic rice cultivation and to better engage with rice farmers and industry stakeholders. The specific objectives of the trial were to determine the effect of increasing soil moisture deficit during the vegetative period on (i) crop development, (ii) grain yield, and (iii) water productivity.

2. Materials and Methods

2.1. Site Description

The experiment was conducted over the 2020–2021 (Year 1) and 2021–2022 (Year 2) rice growing seasons (October–May) on a commercial farm located in the Murrumbidgee Valley in south-eastern Australia near Griffith (34°17′18″ S, 146°03′03″ E). The soil was classified as a self-mulching clay with a brown A horizon of 30 cm over a dense red B horizon [41] which is typical of rice-growing soils in the region. Soil samples were collected at 0–15 cm depth before planting in 2020–2021. Physical and chemical characterisation was obtained through laboratory analysis [42] (Table 1).
The Murrumbidgee Valley has a temperate climate typified by hot dry summers with low humidity. The average annual rainfall for Griffith is 385 mm with an average in-season (15 October–30 April) rainfall of 150 mm and evapotranspiration of 1150 mm [8]. Weather observations were taken from a weather station located 10 km from the trial site. Monthly average observations can be seen in Table 2. The 2020–2021 (Year 1) rice season was characterised by very low night-time temperatures experienced during the reproductive period in January, February and March (Figure 1). In-season rainfall was 175 mm. Reference evapotranspiration for the period 15 October–30 April was 1259 mm. The 2021–2022 (Year 2) season started cool with unseasonable wet conditions in November–January with well below average day-time temperatures but adequate night-time temperatures throughout the reproductive period (Figure 1). Well above average in-season rainfall of 352 mm was recorded with below average reference evapotranspiration of 1100 mm for the period 15 October–30 April.
The study was conducted in a 9-bay, down-the-grade border check field (34 ha) (Figure 2). Each bay was 500–600 m long and 50–75 m wide (~3.5 ha each). Each bay was separated by 30 cm high earthen banks and individually connected to a water supply channel. Irrigation water into the field was measured by a Rubicon SlipMeter SMTM (NMI 14/3/62 certified) which is standard across rice farms in the region and averaged across the irrigation area. Irrigation water productivity (t/ML) was calculated: crop yield (t/ha) ÷ irrigation water (ML/ha) [11]. Total water productivity (t/ML) was calculated: crop yield (t/ha) ÷ (irrigation water (ML/ha) + rainfall (mm)) [11]. Drainage was collected at the opposite end of the supply channel and pumped into a recycle dam which was recycled in the same field.

2.2. Irrigation Treatments and Experimental Layout

The experimental design was a randomised complete block design with three irrigation treatments thrice replicated in year 1 and two irrigation treatments replicated four times in year 2. The initial irrigation events of the season were based on agronomic decisions to ensure good establishment and weed control. After this, water management of the different treatments was based on soil moisture tension thresholds at 15 cm depth during the vegetative period—after establishment until panicle initiation (from mid-December until mid-January) with irrigation commencing when the treatment average threshold was reached. A depth of 15 cm was chosen as the majority of roots are concentrated in the top 10 cm [28]; however, cracking to a depth of 10 cm has commonly been observed in heavy clays in the region [31], reducing the reliability of soil moisture sensors. Irrigation thresholds of −15, −40 and −70 kPa were used in Year 1 and based on the results obtained, thresholds of −15 and −40 kPa were used in Year 2. These thresholds were chosen as they were considered minimal, mild and severe soil moisture deficits. In both years, once treatments reached the reproductive period and nitrogen was applied at panicle initiation, all treatments were irrigated every 2 to 3 days to ensure soil moisture did not surpass −10 kPa. Throughout the ripening stage, all treatments were irrigated to ensure soil tension did not surpass −15 kPa to ensure adequate moisture was available for grain filling.

2.3. Soil Moisture Measurements and Water Management

Soil moisture tension was monitored throughout the growing season in two bays per treatment in Year 1 and in all bays in Year 2 by means of two watermark sensors (Model 200SS, Irrometer Company Inc., Riverside, CA, USA) to enable averaging of readings to reduce uncertainty. Sensors were installed after establishment to ensure they were placed next to plants and provided representative readings of the soil tension at the root zone. In Year 1 the sensors were located in the middle of the bay and connected to low-cost, low-power WiField loggers that collect and store data periodically and upload to the Google Cloud platform through an on-farm WiFi network to enable real-time monitoring [44]. In Year 2, watermark sensors were connected to an all-in-one IoT communication station (SensorPro, Padman Automation, Strathmerton, VIC, Australia) located 100 m from the end of each bay. The IoT communication stations contained calibrated pressure transducers and capacitance sensors to sense and measure water height in each bay and in the supply channel. The solar-powered IoT sensors are periodically connected via the LoRaWAN gateway to send data to the Padman Automation webapp platform for real-time monitoring and irrigation control.
Rubber lay-flat inserts were installed to existing concrete water stops which could be opened/closed by a winch cable. Portable self-powered AutowinchPro’s (Padman Automation, Strathmerton, VIC, Australia) were installed at the outlet to control irrigation events. The automated outlet controllers have a graphical user interface for programming at the device and communicated via LoRWAN to receive commands sent via the webapp. The webapp was used to ‘pair’ each SensorPro to the AutowichPro in each respective bay, as well as the subsequent bay to be irrigated. When predetermined water height thresholds were surpassed (20 mm) near the end of each bay, outlet controller commands were triggered to open/close respective outlets.

2.4. Crop Management

Wheaten hay was cut and bailed prior to sowing in Year 1. Medium grain short season semi-dwarf variety, Viand was drill sown into an undisturbed seedbed at 130 kg/ha with 140 kg/ha Granulock Z starter fertilizer on 7 November 2020. The first three irrigation events were conducted manually prior to the installation of automation infrastructure. The timing of the first three irrigation events was based on herbicide and agronomic requirements to ensure good establishment. Crop establishment in all treatments averaged 187 (±49) plants/m2 with no significant difference between treatments. The pre-emergent (first) irrigation occurred 9–12 November with all treatments receiving a second irrigation on 20–21 November and a third irrigation on 3–5 December before irrigation treatments were imposed (Figure 3).
After the Year 1 harvest, the field was left fallow in the winter of 2021 before rice stubble was burnt in early October and the land was re-levelled prior to planting to overcome wheel track compaction from previous operations. Viand was once again drill sown two weeks earlier than the first year, at a reduced rate of 120 kg/ha with 140 kg/ha Granulock Z starter fertiliser on 20 October, 2021. Based on the delay in maturity seen by increasing soil moisture deficit in Year 1, the date of the pre-emergent irrigation after sowing was staggered in an attempt to have both treatments reaching PI at the same time. The 40 kPa treatment received its pre-emergent irrigation on 22 October and second irrigation on 30 October while the pre-emergent irrigation for the 15 kPa treatment occurred on 31 October, prior to substantial rainfall throughout November and early December. Plant establishment did not differ between treatments to an average of 151(±19) plants/m2. Both treatments received irrigation on 15-16 December prior to the deficit irrigation treatments being imposed (Figure 3).
In both years all irrigation treatments received a thrice split N regime in the form of granular urea (46% N). A total of 220 kg/ha N was applied based on the requirements to achieve a high yield (>10 t/ha) for this soil type in the region factoring in higher N losses than normal due to the continued wetting and drying of the soil. To reduce N losses when broadcasting, urea should be applied to dry soil just prior to an irrigation event, and therefore, the timing of irrigation dictated when nitrogen was applied.
In both years, weeds were successfully controlled by the farm manager using commercially available herbicides applied prior to an irrigation event. In Year 1 post-sowing and pre-rice emergence a combination of Paraquat 250 g/L (1 L/ha) and clomazone 480 g/L (0.5 L/ha). Post-rice emergence, dicamba 500 g/L (0.5 L/ha) and pendimethalin 440 g/L (3 L/ha) was applied. Cyhalofop butyl 160 g/L, 12 g/L Florpyrauxifen-Benzyl and 350 g/L N,N-Dimethyloctanamide and N,N-Dimethyldecanmide (2 L/ha) was applied at the time irrigation treatments commenced. In Year 2 post sowing and pre-rice emergence a combination of clomazone 480 g/L (0.5 L/ha) and pendimethalin 440 g/L (3 L/ha) was applied. Post-emergence, Cyhalofop butyl 160 g/L, 12 g/L Florpyrauxifen-Benzyl and 350 g.L N,N-Dimethyloctanamide and N,N-Dimethyldecanmide (2 L/ha) was applied at the time irrigation treatments commenced.

2.5. Crop Measurements

Plant samples (3 × 0.2 m2 at the top, middle and bottom of each bay) for biomass and nitrogen uptake were taken at panicle initiation and analysed for N uptake using NIR spectroscopy [45]. Four above-ground plant samples (1 m2) per replicate were collected at physiological maturity and dried at 80 °C until a constant weight to determine the total dry matter with panicles counted to determine panicles/m2. Samples were threshed through a stationary thresher and the grain was weighed to determine the harvest index. 1000 grain samples were counted and weighed. Grain yield was estimated from an area of 1–1.8 ha (harvested with a commercial combine harvester on April 29 for the 15 kPa and May 21 for the 40 and 70 kPa treatments in Year 1 and on March 24 for both treatments in Year 2) and reported at 14% moisture. Crop phenology was monitored in each replicate to accurately determine the timing of PI and anthesis. PI was declared when the panicle could be identified with the naked eye in three out of 10 tillers [46]. Anthesis was declared when an estimated 50% of anthers on 50% of panicles within the replicate was achieved.

2.6. Statistical Analysis

Statistical analysis consisted of a quantile-quantile plot to test for normality and analysis of variance in R. Differences between means were compared by least-significant difference (LSD) tests at a 5% probability level.

3. Results

3.1. Water Management

During the period when the deficit irrigation treatments were enforced in Year 1, the 15 kPa treatment reached its threshold and was irrigated on four occasions. The 40 kPa treatment reached its threshold and was irrigated on three occasions during this period and the 70 kPa twice (Figure 4). An irrigation event in each treatment during this period can be detected in Figure 4 by a sharp increase in soil moisture tension (less negative values) with readings returning to values ≥ −10 kPa indicative of saturated soil.
Upon reaching irrigation thresholds in the vegetative period, visual symptoms of moisture stress including leaf rolling and colouring to blue were observed in the 40 and 70 kPa treatments. The symptoms were more pronounced in the 70 kPa treatment; however, both treatments recovered immediately following irrigation. Visual plant moisture stress was not observed in the 15 kPa treatments during the vegetative period.
Increasing soil moisture deficit in the vegetative period delayed crop development, and therefore, during the reproductive period the 40 kPa treatment received five more irrigations than the 15 kPa treatment, and the 70 kPa treatment received six more than the 15 kPa treatment (Table 3). It must be noted that substantial runoff occurred in Year 2 due to extreme rainfall events with useful rainfall likely much less than the total in-season rainfall. Soil moisture did not exceed −10 kPa during this period, as seen in Figure 4. During grain ripening the 40 and 70 kPa treatments were irrigated three times and the 15 kPa treatment received four irrigations. In total for Year 1, the 15 kPa treatment received 30 irrigations, with the 40 and 70 kPa treatments both receiving an extra three irrigations due to the early season soil moisture deficit causing a delay in plant maturity and extending the growing season. A total of 7.95 ML/ha irrigation water was applied in Year 1.
In Year 2, the 15 kPa treatment received two irrigations during establishment and the 40 kPa received three due to the earlier pre-emergent irrigation date. From 22 December until 5 January the 15 kPa treatment reached its threshold and was irrigated on three occasions with the 40 kPa treatment reaching its threshold and irrigated on two occasions (Figure 4). Significant rainfall events occurred from January 6 to 15 with irrigation not commencing again until 20 January. By this stage, both treatments had reached PI and were irrigated 15 times until the end of anthesis with soil moisture not exceeding −10 kPa. A further three irrigations occurred during ripening. The total number of irrigations for the 15 and 40 kPa treatments in Year 2 was 23 with a total of 4.65 ML/ha irrigation water applied, much less than in Year 1 due to the increased rainfall received. It must be noted that substantial runoff occurred in Year 2 due to extreme rainfall events with useful rainfall much less likely than the total in-season rainfall.

3.2. Crop Phenology and N Uptake

Increasing soil moisture deficit between irrigations in the vegetative period in Year 1 had a significant impact on rice physiological development. Relative to the 15 kPa treatment, the number of days from pre-emergent irrigation until PI was 13 and 17 days longer in the 40 and 70 kPa treatments, respectively, with time to anthesis occurring 10 and 15 days later than the 15 kPa treatment (Figure 5, Table 4).
In Year 2, relative to the 15 kPa treatment, the number of days from pre-emergent irrigation until PI was 14 days longer for the 40 kPa treatment, with anthesis delayed by 12 days. Consequently, delaying pre-emergent irrigation for the 15 kPa treatment meant both treatments reached PI within 4–5 days of each other (Figure 5, Table 4).
No statistically significant differences in plant N uptake were recorded at either sampling date in Year 1 among treatments, averaging 68 kg N/ha on January 18 (prior to final N application) and 130 kg N/ha on February 3, respectively. In Year 2 on January 16 prior to the final N application, the total N uptake averaged 107 kg/ha with no statistically significant differences between treatments.

3.3. Grain Yield & Water Productivity

Irrigation treatment affected grain yield in Year 1 (Table 5). The 15 kPa treatment yielded significantly more (4.5 t/ha) than the 70 kPa treatment. However, no statistically significant differences were observed between the intermediate treatment (40 kPa) and the other two treatments. Irrigated water productivity and total water productivity (irrigation and rainfall) for the 15 kPa treatment (1.02 t/ML and 0.84 t/ML, respectively) were significantly greater than in the 70 kPa treatment (0.45 t/ML and 0.37 t/ML, respectfully). No yield difference between the 15 kPa and 40 kPa treatments was observed in Year 2 (Table 5) with irrigated water productivity of 1.62 t/ML and total water productivity of 0.92 t/ML.
Conversely, for the yield in Year 1, plant dry matter at physiological maturity in the 70 kPa treatment was significantly greater than in the 15 kPa treatment with no statistically significant differences found between the 15 and 40 kPa treatments in either year. The harvest index of the 15 kPa treatment was significantly higher than both the 40 and 70 kPa treatments in Year 1 with no difference between treatments in Year 2. One thousand grain weight did not differ between treatments in either year, averaging 21.5 g in Year 1 and 21.7 g in Year 2.

4. Discussion

4.1. Quantificaiton of the Delay in Physiological Development

Quantification of the maturity delay associated with soil moisture deficit is required to determine optimal sowing windows and irrigation scheduling. This can provide farmers and future researchers with irrigation recommendations to manage water to avoid unfavourable growing conditions during sensitive growth periods and maximise water productivity. Research in water-saving rice has generally assessed the delay in crop development in relation to the frequency of irrigation rather than to the soil moisture deficit imposed [28,29,30]. Increasing soil moisture deficit during the vegetative period in both years of the present study caused a significant delay in plant physiological maturity. Initiating irrigation at −40 kPa instead of −15 kPa resulted in one less irrigation event during the vegetative stage and delayed PI by 13–14 days and the number of days to anthesis by 10–12 days in Years 1 and 2, respectively. Extending soil moisture deficit to −70 kPa resulted in one less irrigation event for the 70 kPa treatment with respect to the 40 kPa treatment in Year 1 and resulted in a further 4-day delay to reach PI and a 5-day delay to reach anthesis. Similarly, Dunn and Gaydon [12] reported the anthesis of DPW rice to be delayed by 3–18 days (depending on ET0 irrigation threshold) compared to the flooded control, concluding that sowing of DPW needs to be brought forward by 7–10 days. Conventionally drill-seeded Viand (the variety used in the present study) takes about 90 days from pre-emergent irrigation to reach anthesis [47], with growers implementing a DPW regime advised sowing 10 days earlier to overcome the associated physiological delay to minimise the risk of cold-induced sterility [12,48]. Whilst the present study did not comprise a flooded control treatment, days from pre-emergent irrigation to anthesis for the 15 kPa treatment were 104 and 101 in Years 1 and 2, respectively. It could, therefore, be speculated that an irrigation threshold of −15 kPa during the vegetative stage results in a delay to anthesis of about 11–14 days, compared to flooded rice, with an increasing deficit further extending development. This aligns with findings from [28,29,30,40] who all reported an 8–16 day delay to anthesis between aerobic rice and conventional flooded rice (Table 6). Of these studies that scheduled irrigation based on the number of days since the previous irrigation, only Blackwell et al. [30] reported on the soil-water deficit. Neuron probe measurements showed a soil moisture deficit in the most irrigated treatment (128% of ETo) in the top 30 cm of 14 mm at PI and up to 23 mm during the reproductive period despite an irrigation frequency of 3 days. This would indicate that despite irrigating in excess of ET requirements, minor water stress still occurred, resulting in an 11-day delay to anthesis. Wilting, leaf rolling and leaf senescence observed in weekly irrigated rice by [28,29], suggest that such an irrigation regime also resulted in a substantial soil moisture deficit, delaying anthesis by 16 and 11 days, respectively.
Whilst such physiological delay may not be an issue in some environments, or in some years, it is of much relevance to Australian temperate rice growers. Standard industry practice is to time the sowing and pre-emergent irrigation of rice to achieve PI between January 1 and 15 to ensure EPM occurs January 15–30 as this is the period of least risk of cold (below 17 °C) temperatures [49]. The importance of quantifying the delay in rice development as a result of deficit irrigation and the need to correctly manage the time of pre-emergence irrigation and irrigation scheduling to maximise yield potential was evident in Year 1. The 15 kPa treatment reached PI on January 19 with the 40 and 70 kPa treatments significantly delayed (January 31 and February 4, respectively), resulting in different climatic conditions experienced during early pollen microspore (EPM). The 40 and 70 kPa treatments were exposed to 8 and 12 extra nighttime minimums below 17 °C during the period of EPM to flowering, and the 15 kPa treatment escaped. Much sterility was observed in the 70 kPa treatment, and to a lesser extent in the 40 kPa treatment and was considered the main cause of reduced yield in these treatments with no difference in plants and panicles/m2 nor 1000 grain weight. The 15 kPa treatment was not exposed to the severity nor frequency of cold events, and as such achieved a yield only 10% lower than the industry average for Viand in 2020–2021 (8.8 t/ha) which was below average due to the widespread cold sterility observed in late sown rice [50].
Quantifying the delay from the pre-emergent irrigation to PI in relation to soil moisture tension allowed for better crop management in Year 2 to ensure PI, and evidently, EPM occurred during the optimal window in both the 15 and 40 kPa treatments. Delaying the pre-emergent irrigation of the 15 kPa treatment by 9 days in Year 2 ensured successful alignment of the reproductive period. Consequently, the two treatments experienced similar reproductive climatic conditions. The grain yield of the two treatments was similar (7.5 t/ha), despite the 15 kPa treatment having a significantly greater number of panicles/m2. Results in Year 2 suggest that the increasing soil moisture deficit from −15 to −40 kPa during the vegetative period does not reduce yield under the same climatic conditions, although the treatments were imposed for a short period.
Results from the current study indicate that aerobic rice irrigated at a relatively minor irrigation deficit of −15 kPa during the vegetative period appears to require a similar sowing window/pre-emergence irrigation to DPW rice to reach EPM in the optimal window. For Viand grown under DPW conditions in the region, NSW DPI [48] recommends a sowing window of October 25–November 10. Should growers wish to extend the soil water deficit to −40 kPa during the vegetative period, our results suggest pre-germination irrigation should be brought forward by 2 weeks and a further 4 days under a −70 kPa irrigation regime. This may be problematic for more commonly grown long-season varieties (Reiziq, +15 days [48]) as cold soil temperatures in September can be unfavorable for establishment. As such, further research is required to determine the performance of other high-yielding varieties under aerobic deficit irrigation regimes and to determine the optimal time of sowing to maximise water productivity

4.2. Yield and Water Productivity

Water scarcity and increased competition across multiple irrigation industries in the Murrumbidgee Irrigation Area are driving rice growers and industries to improve water productivity. Moving to an aerobic system, which aims to maximise water will be critical in ensuring the future of the rice industry in a water-constrained environment. Understanding the management requirements and yield and water productivity potential of aerobic rice is essential for growers to consider adopting the practice. A comparison with the Murrumbidgee Irrigation Area regional average water productivity can be seen in Figure 6. It must be noted that the main commercial variety (Reziq) yielded on average ~2 t/ha more than Viand (used in this study) across the region; however, only water productivity values averaged across all varieties were available. With no cold sterility observed in the 15 kPa treatment in Year 1, irrigated water productivity exceeded 1 t/ML with total water productivity of 0.84 t/ML in this treatment. In comparison, the Murrumbidgee Irrigation Area regional average irrigated water productivity (all varieties, 19,166 ha) for ponded rice was 0.89 t/ML [50,51]. As a result of increased rainfall in Year 2, irrigated water productivity of 1.6 t/ML and total water productivity of 0.93 t/ML was achieved in the 15 and 40 kPa treatments, compared to a regional average (all varieties, 23,632 ha) irrigated water productivity of 1.21 t/ML [50,52].
Total water productivity of the 15 kPa treatment in the current study exceeded those from a concurrent (Year 1) nearby aerobic rice study (0.6 t/ML) using crop evapotranspiration to schedule irrigation with yields reportedly reduced to < 7.0 t/ha as a result of cold and mice damage [47]. The total water use (11.3 ML/ha) reported by Dunn and Dunn [47] was slightly higher than in the current study (9.7 ML/ha). In the previous two seasons [47], the reported total water productivity was 0.75 t/ML for aerobic rice with yields of 8.5–9 t/ha, reportedly absent of cold/heat stress or mice damage, as experienced in the third year of their study. Nevertheless, it is inferior to 1.15 and 0.9 t/ML in DPW and drill-sown rice, respectfully [47].
Similar aerobic rice total water productivity results have been reported in Northern China, with aerobic rice achieving 0.3–0.8 t/ML, compared to 0.37–0.65 t/ML for flooded rice [53]. Likewise, aerobic total water productivity was reported at 0.08–0.83 t/ML [54]; however, rice yields in both studies were <5.5 t/ha with flooded rice achieving up to 8.8 t/ha [53]. Soil moisture deficit in these trials exceeded −90 kPa on numerous occasions throughout the season; however, solar radiation reported by [53,54] is in the order of 40% lower than the present study, with similar maximum temperatures. This suggests that plant water requirements may have been less than those in the present study.
Kato et al. [35] found initiating irrigation events at −60 kPa (at 20 cm depth) throughout the vegetative and reproductive period in sprinkler-irrigated rice resulted in equivalent or higher yields (7.9–9.4 t/ha) than continuously flooded rice (8.2 t/ha) in temperate Japan with aerobic total water productivity of 0.8–1 t/ML, similar to the maximums achieved in the current study, despite a 25% reduction in solar radiation compared to this study. Similarly, reflooding AWD fields exposed to soil moisture deficit of ~35 kPa and ~70 kPa during the late vegetative to mid-anthesis period was found to have no reduction in yield compared to continuously flooded rice (11–14 t/ha) in temperate USA [55]. However, it is possible yields were maintained due to a shallow ground water table or from a capillary uprise of water in aerobic conditions [55].
Biomass production is closely associated with plant transpiration and is generally constant for a particular species in a particular climate with higher water use efficiency often a trade-off with reduced biomass production [56]. However, the harvest index is variable within genotypes [35,57] and can be improved as a result of greater translocation of assimilates from stems and leaves to grain and increasing growth rate during grain filling [57]. Variation is generally associated with different nitrogen and water management [12,29,35] as well as sowing dates [57]. Whilst harvest index values above 0.6 have been reported in Australia [9,58], generally, they range from 0.35 to 0.48 [9,12,29,59] with the maximum commercial values of 0.40–0.53 considered realistic in Australia by Unkovich et al. [60]. A harvest index of 0.48 in the 15 kPa in Year 1 and an average of 0.55 in Year 2 are on the upper end of reported values, highlighting reproductive efficiency in this study.
Similar to previous Australian research [28,29,47], the results in the present study did not find that aerobic rice yields could meet or surpass industry average ponded rice yields in the same region. However, this study demonstrated for the first time at a commercial scale, that sound water productivity can be achieved with aerobic rice cultures in temperate Australia, providing cold temperatures during early pollen microspores are avoided. With over 20 irrigations in Year 2 and 30 in Year 1, such high-frequency irrigation would not have been feasible without automated irrigation technology due to the high cost of limited labour resources. To the best of our knowledge, this is the first time gravity surface automated irrigation technology has been used to grow water-saving rice at a commercial scale [33]. Much interest and engagement from rice growers and industry stakeholders at field days highlight the potential adoption of the practice. In both years aerobic rice irrigated at a threshold of −15 kPa during the reproductive period achieved a yield over 7.5 t/ha with total water productivity exceeding 0.84 ML/ha. Results from Year 2 suggest that an irrigation threshold of −40 kPa during the vegetative period can achieve equivalent yields to a −15 kPa irrigation regime; however, timing of the pre-emergence irrigation must be managed to ensure EPM occurs during the appropriate period. It is likely the same delay in plant phenological development would be seen in DPW under the same deficits; however, this requires further investigation. This study suggests aerobic rice may assist the Australian rice industry to increase t/ML, however, at the expense of t/ha.

5. Conclusions

The research presented in this paper stems from the need to understand the effect of deficit irrigation on non-flooded rice to determine the most appropriate irrigation thresholds to initiate irrigation for water-saving rice in temperate rice-growing regions. Specific thresholds can provide farmers confidence in irrigation scheduling to maximise water productivity whilst minimising the chance of unfavourably cold conditions (<17 °C) during early pollen microspore. This temperate Australian research demonstrates that aerobic rice requires in excess of 20 irrigation events for the season, which is unfeasible with limited labour availability. As such, parameters that can be cost-effectively and accurately measured, such as soil moisture tension, lend themselves to incorporation into automated gravity surface irrigation systems. This study used soil moisture tension to schedule irrigation which was successfully delivered by gravity surface automated irrigation technology for the first time at a commercial scale to successfully grow aerobic rice with industry and grower involvement. As hypothesised, extending soil moisture deficit beyond −15 kPa in the vegetative period delayed panicle initiation by at least 13–14 days. Delaying early pollen microspores beyond the optimal window resulted in a severe yield penalty due to cold-induced sterility in Year 1. By staggering the pre-emergent irrigation in Year 2, the 15 and 40 kPa treatments were exposed to similar climatic conditions and no difference in grain yield was recorded. Maximum irrigated water productivity and total water productivity achieved in this study ranged from 1.02 to 1.62 t/ML and from 0.84 to 0.93 t/ML, respectively. As hypothesised, sound grain yield and water productivity were achieved when rice was subjected to minimal to moderate soil moisture deficit during the vegetative period. However, increasing the soil moisture deficit beyond −15 kPa was shown to delay crop development and should be an important management consideration for future adoption. This research can assist irrigators with irrigation scheduling to ensure critical crop development milestones are achieved when required and demonstrate that commercial aerobic rice can achieve high water productivity in temperate environments.

Author Contributions

Conceptualisation, J.H., C.B. and M.C.; methodology, M.C., J.H. and C.B.; formal analysis, M.C.; investigation, M.C.; writing—original draft preparation, M.C.; writing—review and editing, C.B. and J.H.; funding acquisition, J.H. All authors have read and agreed to the published version of the manuscript.

Funding

This project was funded through AgriFutures and the Cotton Research and Development Corporation as part of the Australian Government, Department of Agriculture, Water and the Environment Smarter Irrigation for Rural R&D for Profit program.

Institutional Review Board Statement

Not applicable.

Informed Consent Statement

Not applicable.

Data Availability Statement

The data presented in this study are available on request from the corresponding author.

Acknowledgments

The authors acknowledge Darrell Fiddler and DeBortoli Wines for providing the trial site and their assistance throughout the study.

Conflicts of Interest

The authors declare no conflict of interest.

References

  1. Portmann, F.T.; Siebert, S.; Döll, P. MIRCA2000-Global Monthly Irrigated and Rainfed Crop Areas around the Year 2000: A New High-Resolution Data Set for Agricultural and Hydrological Modeling. Glob. Biogeochem. Cycles 2010, 24, 1–24. [Google Scholar] [CrossRef]
  2. GRiSP (Global Rice Science Partnership). Rice Almanac, 4th ed.; International Rice Research Institute: Los Baños, Philippines, 2013. [Google Scholar]
  3. Bouman, B.A.M.; Humphreys, E.; Tuong, T.P.; Barker, R. Rice and Water. Adv. Agron. 2007, 92, 187–237. [Google Scholar] [CrossRef]
  4. Pimentel, D.; Berger, B.; Filiberto, D.; Newton, M.; Wolfe, B.; Karabinakis, E.; Clark, S.; Poon, E.; Abbett, E.; Nandagopal, S. Water Resources: Agricultural and Environmental Issues. Food Energy Soc. Third Ed. 2004, 54, 909–918. [Google Scholar] [CrossRef] [Green Version]
  5. IPCC. Climate Change 2022: Impacts, Adaptation and Vulnerability, Contributi; Pörtner, H.-O., Roberts, D.C., Tignor, M., Poloczanska, E.S., Mintenbeck, K., Alegría, A., Craig, M., Langsdorf, S., Löschke, S., Möller, V., et al., Eds.; Cambridge University Press: Cambridge, UK; New York, NY, USA, 2022. [Google Scholar] [CrossRef]
  6. Bouman, B.A.M.; Lampayan, R.M.; Tuong, T.P. Water Management in Irrigated Rice: Coping with Water Scarcity; IRRI: Los Banos, Philippines, 2007. [Google Scholar]
  7. Guerra, L.C.; Bhuiyan, S.I.; Tuong, T.P.; Barker, R. Producing More Rice with Less Water from Irrigated Systems. Int. Water Manag. Inst. 1998, pp. 1–33, SWIM Paper 5. Available online: https://www.google.ca/url?sa=t&rct=j&q=&esrc=s&source=web&cd=&ved=2ahUKEwi69Kjp56z8AhV61zgGHW_3BnoQFnoECAsQAQ&url=http%3A%2F%2Fbooks.irri.org%2FDPS29_content.pdf&usg=AOvVaw0aXtaIx7h85p8XHw5UGBW2 (accessed on 30 December 2022).
  8. Humphreys, E.; Lewin, L.G.; Khan, S.; Beecher, H.G.; Lacy, J.M.; Thompson, J.A.; Batten, G.D.; Brown, A.; Russell, C.A.; Christen, E.W.; et al. Integration of Approaches to Increasing Water Use Efficiency in Rice-Based Systems in Southeast Australia. Field Crop. Res. 2006, 97, 19–33. [Google Scholar] [CrossRef]
  9. Williams, R.L.; Angus, J.F. Deep Floodwater Protects High-Nitrogen Rice Crops from Low-Temperature Damage. Aust. J. Exp. Agric. 1994, 34, 927–932. [Google Scholar] [CrossRef]
  10. IRRI. Saving Water with Alternate Wetting Drying (AWD). Rice Knowledge Bank IRRI. Available online: http://www.knowledgebank.irri.org/training/fact-sheets/water-management/saving-water-alternate-wetting-drying-awd (accessed on 1 August 2022).
  11. Tuong, T.P.; Bouman, B.A.M.; Mortimer, M. More Rice, Less Water—Integrated Approaches for Increasing Water Productivity in Irrigated Rice-Based Systems in Asia. Plant Prod. Sci. 2005, 8, 231–241. [Google Scholar] [CrossRef]
  12. Dunn, B.; Gaydon, D. Rice Growth, Yield and Water Productivity Responses to Irrigation Scheduling Prior to the Delayed Application of Continuous Flooding in South-East Australia. Agric. Water Manag. 2011, 98, 1799–1807. [Google Scholar] [CrossRef]
  13. Bouman, B.A.M.; Tuong, T.P. Field Water Management to Save Water and Increase Its Productivity in Irrigated Lowland Rice. Agric. Water Manag. 2001, 49, 11–30. [Google Scholar] [CrossRef]
  14. Carracelas, G.; Hornbuckle, J.; Rosas, J.; Roel, A. Irrigation Management Strategies to Increase Water Productivity in Oryza Sativa (Rice) in Uruguay. Agric. Water Manag. 2019, 222, 161–172. [Google Scholar] [CrossRef]
  15. Hatta, S. Water Consumption in Paddy Field and Water Saving Rice Culture in the Tropical Zone. Jpn. J. Trop. Agric. 1967, 11, 106–112. [Google Scholar]
  16. Tabbal, D.F.; Lampayan, R.M.; Bhuiyan, S.I. Water Efficient Irrigation Technique for Rice. Philipp. J. Crop Sci. 1993, 18. [Google Scholar]
  17. Chlapecka, J.L.; Hardke, J.T.; Roberts, T.L.; Mann, M.G.; Ablao, A. Scheduling Rice Irrigation Using Soil Moisture Thresholds for Furrow Irrigation and Intermittent Flooding. Agron. J. 2021, 113, 1258–1270. [Google Scholar] [CrossRef]
  18. De Datta, S.K.; Abilay, W.P.; Kalwar, G.N. Water Stress Effects in Flooded Tropical Rice. In Water Management in Philippine Irrigation Systems: Research and Operations; IRRI: Los Banos, Philippines, 1973; pp. 19–36. [Google Scholar]
  19. Kato, Y.; Katsura, K. Rice Adaptation to Aerobic Soils: Physiological Considerations and Implications for Agronomy. Plant Prod. Sci. 2014, 17, 1–12. [Google Scholar] [CrossRef]
  20. El Sherbiny, H.A.; El-Hashash, E.F.; Abou El-Enin, M.M.; Nofal, R.S.; Abd El-Mageed, T.A.; Bleih, E.M.; El-Saadony, M.T.; El-Tarabily, K.A.; Shaaban, A. Exogenously Applied Salicylic Acid Boosts Morpho-Physiological Traits, Yield, and Water Productivity of Lowland Rice under Normal and Deficit Irrigation. Agronomy 2022, 12, 1860. [Google Scholar] [CrossRef]
  21. Boonjung, H.; Fukai, S. Effects of Soil Water Deficit at Different Growth Stages on Rice Growth and Yield under Upland Conditions. 2. Phenology, Biomass Production and Yield. Field Crop. Res. 1996, 48, 47–55. [Google Scholar] [CrossRef]
  22. Shi, Y.; Shen, Q.R.; Mao, Z.S.; Li, W. Biological Response of Rice Crop Cultivated on Upland Soil Condition and the Effect of Mulching on It. Plant Nutr. Fert. Sci. 2001, 7, 271–277. [Google Scholar]
  23. Stevens, G.; Vories, E.; Heiser, J.; Rhine, M. Experimentation on Cultivation of Rice Irrigated with a Center Pivot System. In Irrigation Systems and Practices in Challenging Environments; Shui-Lee, T., Ed.; IntTech: Rijeka, Croatia, 2012. [Google Scholar] [CrossRef] [Green Version]
  24. Sudhir-Yadav; Humphreys, E.; Kukal, S.S.; Gill, G.; Rangarajan, R. Effect of Water Management on Dry Seeded and Puddled Transplanted Rice. Part 2: Water Balance and Water Productivity. Field Crop. Res. 2011, 120, 123–132. [Google Scholar] [CrossRef]
  25. FAOSTAT. Food and Agriculture Organization of the United Nations: Rome, Italy. 2022. Available online: https://www.fao.org/faostat/en/#data/ (accessed on 17 October 2022).
  26. Groat, M. The Future of Australian Rice Production: A Focus on Water Use Efficiency in the Australian Temperate Rice System; No. Project 1704; Nuffield Australia: Sydney, NSW, Australia, 2020; pp. 1–44. [Google Scholar]
  27. Fukai, S.; Wade, L.J. Rice. In Crop Physiology: Case Histories for Major Crops; Sadras, V., Calderini, D., Eds.; Elsevier Inc.: Amsterdam, The Netherlands, 2021; pp. 44–97. [Google Scholar] [CrossRef]
  28. Heenan, D.P.; Thompson, J.A. Growth, Grain Yield and Water Use of Rice Grown Under Restricted Water Supply in New South Wales. Aust. J. Exp. Agric. 1984, 24, 104–109. [Google Scholar] [CrossRef]
  29. Muirhead, W.A.; Blackwell, J.; Humphreys, E.; White, R.J.G. The Growth and Nitrogen Economy of Rice under Sprinkler and Flood Irrigation in South East Australia-I. Crop Response and N Uptake. Irrig. Sci. 1989, 10, 183–199. [Google Scholar] [CrossRef]
  30. Blackwell, J.; Meyer, W.S.; Smith, R.C.G. Growth and Yield of Rice Under Sprinkler Irrigation on A Free-Draining Soil. Aust. J. Exp. Agric. 1985, 25, 636–641. [Google Scholar] [CrossRef]
  31. Champness, M. Determining Trigger Points for Irrigation in Drill Sown Rice; Deakin University: Griffith, NSW, Australia, 2021; p. 2, (unpublished). [Google Scholar]
  32. Jones, H.G. Irrigation Scheduling: Advantages and Pitfalls of Plant-Based Methods. J. Exp. Bot. 2004, 55, 2427–2436. [Google Scholar] [CrossRef] [PubMed] [Green Version]
  33. Champness, M.; Ballester-Lurbe, C.; Filev-Maia, R.; Hornbuckle, J. Smart Sensing and Automated Irrigation for Sustainable Rice Systems: A State of the Art Review. In Advances in Agronomy; Academic Press: Cambridge, MA, USA, 2022. [Google Scholar] [CrossRef]
  34. Djaman, K.; Mel, V.C.; Diop, L.; Sow, A.; El-Namaky, R.; Manneh, B.; Saito, K.; Futakuchi, K.; Irmak, S. Effects of Alternatewetting and Drying Irrigation Regime and Nitrogen Fertilizer on Yield and Nitrogen Use Efficiency of Irrigated Rice in the Sahel. Water 2018, 10, 711. [Google Scholar] [CrossRef] [Green Version]
  35. Kato, Y.; Okami, M.; Katsura, K. Yield Potential and Water Use Efficiency of Aerobic Rice (Oryza Sativa L.) in Japan. Field Crop. Res. 2009, 113, 328–334. [Google Scholar] [CrossRef]
  36. Kukal, S.S.; Hira, G.S.; Sidhu, A.S. Soil Matric Potential-Based Irrigation Scheduling to Rice (Oryza Sativa). Irrig. Sci. 2005, 23, 153–159. [Google Scholar] [CrossRef]
  37. Sudhir-Yadav; Gill, G.; Humphreys, E.; Kukal, S.S.; Walia, U.S. Effect of Water Management on Dry Seeded and Puddled Transplanted Rice. Part 1: Crop Performance. Field Crop. Res. 2011, 120, 112–122. [Google Scholar] [CrossRef]
  38. Zhang, H.; Xue, Y.; Wang, Z.; Yang, J.; Zhang, J. An Alternate Wetting and Moderate Soil Drying Regime Improves Root and Shoot Growth in Rice. Crop Sci. Soc. Am. 2009, 49, 2246–2260. [Google Scholar] [CrossRef]
  39. Cabangon, R.J.; Tuong, T.P.; Abdullah, N.B. Comparing Water Input and Water Productivity of Transplanted and Direct-Seeded Rice Production Systems. Agric. Water Manag. 2002, 57, 11–31. [Google Scholar] [CrossRef]
  40. Dunn, B. Aerobic Rice Delay in Development. 2022; (Personal communication). [Google Scholar]
  41. Hornbuckle, J.; Christen, E. Physical Properties of Soils in the Murrumbidgee and Coleambally Irrigation Areas; Technical Report; CSIRO Land and Water: Griffith NSW, Australia, 1999; Volume 17, 175p. [Google Scholar]
  42. Environmental Analysis Laboratory Southern Cross University. Routine Agricultural Soil Analysis Report. Available online: https://www.scu.edu.au/media/scueduau/eal/documents/Agricultural-soil-methods7b60.pdf (accessed on 6 June 2022).
  43. BOM. Evapotranspiration Calculations. Available online: http://www.bom.gov.au/watl/eto/tables/nsw/griffith_airport/griffith_airport.html (accessed on 6 June 2022).
  44. Brinkhoff, J.; Hornbuckle, J.; Quayle, W.; Lurbe, C.B.; Dowling, T. WiField, an IEEE 802.11-Based Agricultural Sensor Data Gathering and Logging Platform. In Proceedings of the 2017 Eleventh International Conference on Sensing Technology (ICST), Sydney, NSW, Australia, 4–6 December 2017; pp. 1–6. [Google Scholar]
  45. Dunn, B. Crop Sampling Instructions—NIR Rice PI Tissue Tests. Available online: https://riceextension.org.au/documents/2020/12/15/crop-sampling-instructions-nir-rice-pi-tissue-tests (accessed on 1 June 2022).
  46. Dunn, T.; Dunn, B. Identifying Panicle Initiation in Rice; New South Wales Department of Primary Industries: Yanco, Australia, 2014; Volume 1278, 3p. [Google Scholar]
  47. Dunn, B.; Dunn, T. Rice Variety Nitrogen and Agronomic Management; Agrifutures Australia: Wagga, Australia, 2021; Available online: https://agrifutures.com.au/product/rice-variety-nitrogen-and-agronomic-management/ (accessed on 6 May 2022).
  48. NSW DPI. Rice Variety Guide 2020–2021; Troldahl, D., Ed.; NSW Department of Primary Industries: Yanco, Australia, 2021. [Google Scholar]
  49. NSW DPI. Rice Growing Guide, 2nd ed.; Ward, R., Ed.; NSW Department of Primary Industries: Yanco, Australia, 2021. [Google Scholar]
  50. Sunrice Grower Services; Rice Water Productivity. (Leeton, NSW, Australia). Personal communication, 2022.
  51. Murrumbidgee Irrigation. 2021 Annual Compliance Report; Murrumbidgee Irrigation: Hanwood, Australia, 2021; Available online: https://www.mirrigation.com.au/water/annual-compliance-report (accessed on 30 December 2022).
  52. Murrumbidgee Irrigation. 2022 Annual Compliance Report; Murrumbidgee Irrigation: Hanwood, Australia, 2022; Available online: https://www.mirrigation.com.au/water/annual-compliance-report (accessed on 30 December 2022).
  53. Xiaoguang, Y.; Bouman, B.A.M.; Huaqi, W.; Zhimin, W.; Junfang, Z.; Bin, C. Performance of Temperate Aerobic Rice under Different Water Regimes in North China. Agric. Water Manag. 2005, 74, 107–122. [Google Scholar] [CrossRef]
  54. Xue, C.; Yang, X.; Bouman, B.A.M.; Deng, W.; Zhang, Q.; Yang, J.; Yan, W.; Zhang, T.; Rouzi, A.; Wang, H.; et al. Effects of Irrigation and Nitrogen on the Performance of Aerobic Rice in Northern China. J. Integr. Plant Biol. 2008, 50, 1589–1600. [Google Scholar] [CrossRef]
  55. Carrijo, D.R.; Akbar, N.; Reis, A.F.B.; Li, C.; Gaudin, A.C.M.; Parikh, S.J.; Green, P.G.; Linquist, B.A. Impacts of Variable Soil Drying in Alternate Wetting and Drying Rice Systems on Yields, Grain Arsenic Concentration and Soil Moisture Dynamics. Field Crop. Res. 2018, 222, 101–110. [Google Scholar] [CrossRef]
  56. Zhang, J.; Yang, J. Crop Yield and Water Use Efficiency. In Water Use Efficiency in Plant Biology; Bacon, M., Ed.; Blackwell Publishing: Oxford, UK, 2004; pp. 189–218. [Google Scholar]
  57. Pal, R.; Mahajan, G.; Sardana, V.; Chauhan, B.S. Impact of Sowing Date on Yield, Dry Matter and Nitrogen Accumulation, and Nitrogen Translocation in Dry-Seeded Rice in North-West India. Field Crop. Res. 2017, 206, 138–148. [Google Scholar] [CrossRef]
  58. Dunn, B.W.; Beecher, H.G. Green Manuring Legume Pasture for Aerial-Sown Rice. Aust. J. Exp. Agric. 1994, 34, 967–975. [Google Scholar] [CrossRef]
  59. Wood, R.M.; Dunn, B.; Waters, D.L.E.; Blanchard, C.L.; Mawson, A.J.; Oli, P. Effect of Agronomic Management on Rice Grain Quality Part III: Australian Water-Saving Irrigation Practices. Cereal Chem. 2020, 98, 249–262. [Google Scholar] [CrossRef]
  60. Unkovich, M.; Baldock, J.; Forbes, M. Variability in Harvest Index of Grain Crops and Potential Significance for Carbon Accounting: Examples from Australian Agriculture, 1st ed.; Elsevier Inc.: Amsterdam, The Netherlands, 2010; Volume 105. [Google Scholar] [CrossRef]
Figure 1. Maximum (red) and minimum (blue) temperatures and rainfall (bars) recorded in Year 1 (A) and Year 2 (B).
Agronomy 13 00168 g001
Figure 2. Location of the commercial field site where the 2-year study was conducted in relation to the Australian temperate rice region.
Agronomy 13 00168 g002
Figure 3. Irrigation management at the different crop growth stages.
Agronomy 13 00168 g003
Figure 4. Soil moisture tension during the vegetative period when irrigation scheduling treatments were enforced; (A): Year 1 (above), (B): Year 2 (below), 15 kPa (green), 40 kPa (blue), 70 kPa.
Agronomy 13 00168 g004
Figure 5. Long-term mean (21 years) maximum and minimum temperatures (dashed red/blue line, respectively) and maximum and minimum temperatures recorded [43] (solid red/blue line, respectively) in Year 1 (A) and Year 2 (B) with dotted dark blue line at 17 °C to show the critical minimum temperature for rice during early pollen microspore and anthesis. Square dots represent date of panicle initiation with triangles representing anthesis (blue: 15 kPa, green: 40 kPa, brown: 70 kPa treatments).
Agronomy 13 00168 g005
Figure 6. Irrigated water productivity of aerobic rice versus Murrumbidgee (MIA) regional average (all rice varieties) in Year 1 and Year 2 of the study [50,51,52].
Agronomy 13 00168 g006
Table 1. Initial physical and chemical properties of the experiment soil.
Parameter0–15 cm
pH (1:5) (CaCl2)7.31
EC (1:5) (dS/m)0.28
P-Colwell (mg/kg)127
CEC (cmol/kg)22
Ca:Mg ratio2.47
Total C (%)1.32
Silt (%)9%
Clay (%)56%
Sand (%)34%
Table 2. Monthly rainfall and daily average values of minimum and maximum temperature, solar radiation, and ET0 during the cropping seasons of 2020–2021 (Yr 1) and 2021–2022 (Yr 2) at Griffith, NSW [43].
Rain (mm)Min Temp (°C)Max Temp (°C)Solar Rad (MJ/m2)ET0 (mm)
MonthYr 1Yr 2Yr 1Yr 2Yr 1Yr 2Yr 1Yr 2Yr 1Yr 2
October583111.38.525.323.019.821.55.04.8
November128415.213.332.124.826.619.37.84.8
December104114.614.930.931.426.128.77.87.5
January7317217.719.832.332.325.824.07.86.6
February12216.916.631.331.324.023.67.16.7
March695313.515.826.829.117.317.54.94.9
April01068.110.224.222.015.413.13.52.8
May18126.25.120.217.811.211.12.41.9
Table 3. Number of irrigation events during various growth stages in both years.
YearTreatmentEstablishmentTreatments ImposedReproductive PeriodGrain FillingTotal
Year115 kPa3419430
40 kPa3324333
70 kPa3225333
Year 215 kPa2315323
40 kPa3215323
Table 4. Rice establishment, nitrogen uptake and crop development results for Year 1 and Year 2. Values ± standard deviation with different letters between rows indicating statistical significance at 0.05.
TreatmentsPlants/m2Panicles/m2N Uptake Jan 18/16N Uptake Feb 3Days to PIDays to 50% Anthesis
Year 1
15193 ± 48766 ± 10784 ± 33130 ± 3069 ± 1 a104 ± 2 a
40174 ± 36770 ± 7063 ± 13138 ± 1382 ± 1 b114 ± 1 b
70195 ± 60804 ± 9857 ± 14121 ± 2986 ± 5 c119 ± 4 b
p valuen.s.n.s.n.s.n.s.<0.0010.001
Year 2
15151 ± 15674 ± 110 a112 ± 11 73 a101 ± 2 a
40151 ± 22585 ± 61b102 ± 22 87 ± 2 b113 ± 2 b
p valuen.s.0.04n.s. <0.001<0.001
Table 5. Grain yield, yield components and water productivity for Year 1 and Year 2. Values ± standard deviation with different letters between rows indicating statistical significance at 0.05.
TreatmentsYield (t/ha)Dry Matter (kg/ha)Harvest Index1000 grain weight (g)Irrigation WP (t/ML)Total WP (t/ML)
Year 1
158.1 ± 1.0 a9.6 ± 2.20.48 ± .10 a22.1 ± 1.81.02 ± 0.13 a0.84 ± 0.10 a
405.8 ± 1.40 ab11.6 ± 1.80.33 ± 0.06 b21.4 ± 1.00.73 ± 0.18 ab0.59 ± 0.14 ab
703.6 ± 1.74 b12.4 ± 4.40.23 ± 0.15 b20.9 ± 1.00.45 ± 0.22 b0.37 ± 0.28 b
p value0.021n.s.<0.001n.s.0.02130.0213
Year 2
157.5 ± 1.96.7 ± 1.00.54 ± 0.0421.5 ± 1.01.61 ± 0.400.92 ± 0.23
407.5 ± 0.76.5 ± 1.30.55 ± 0.0222.0 ± 0.81.62 ± 0.140.93 ± 0.08
p valuen.s.n.s.n.s.n.s.n.s.n.s.
Table 6. Number of days anthesis was delayed relative to traditional flooded controls in previous Australian water-saving rice research. * in the current study, the delay of the 15 kPa versus flooded rice is estimated, with the extra delay in the 40 & 70 kPa treatments added to the estimate with the value of Year 1 listed before Year 2.
Author[28][30][29][40]Current Study
Irrigation methodFloodSprinklerSprinklerFloodFlood
Variety Irrigation FrequencyCalroseCalroseCalroseReiziq, SherpaViand
3/week 8
2/week 118
1/week16 11
N.A. 16
15 kPa * 14, 11
40 kPa * 24, 23
70 kPa * 29, -
Disclaimer/Publisher’s Note: The statements, opinions and data contained in all publications are solely those of the individual author(s) and contributor(s) and not of MDPI and/or the editor(s). MDPI and/or the editor(s) disclaim responsibility for any injury to people or property resulting from any ideas, methods, instructions or products referred to in the content.

