Article

Productivity and Quality Sugarcane Broth at Different Soil Management

by
Murilo Battistuzzi Martins
1,*,
Aldir Carpes Marques Filho
2,
Lucas Santos Santana
2,
Wellingthon da Silva Guimarães Júnnyor
1,
Fernanda Pacheco de Almeida Prado Bortolheiro
1,
Eduardo Pradi Vendruscolo
1,
Cássio de Castro Seron
1,
Edilson Costa
1 and
Kelly Gabriela Pereira da Silva
1
1
Cassilândia University Unit, Agronomy Department, Mato Grosso do Sul State University-UEMS, 306 Road, Km 6, Cassilândia CEP 79540-000, MS, Brazil
2
Agricultural Engineering Department, Federal University of Lavras, Lavras CEP 37200-000, MG, Brazil
*
Author to whom correspondence should be addressed.
Agronomy 2023, 13(1), 170; https://doi.org/10.3390/agronomy13010170
Submission received: 9 December 2022 / Revised: 29 December 2022 / Accepted: 31 December 2022 / Published: 5 January 2023
(This article belongs to the Topic Innovation and Solution for Sustainable Agriculture)

Abstract

:
The quality of sugarcane broth can be affected by soil management. In compacted soils the productivity is reduced, and the raw material is poor. This research aimed to evaluate productivity and quality of sugarcane for four soil management types: (CT) heavy harrow + light harrow; (CTI) Subsoiler + light harrow; (MT) Subsoiler and (NT) no soil movement. The variables investigated were resistance to soil penetration (SPR), the chemical raw material quality (broth) and crop yield. In crop rows, SPR did not reach severe levels up to 0.3 m for sugarcane root development. However, below this layer, MT, NT, and CTI reached SPR limiting values of 2.50, 2.35 and 1.95 MPa, respectively. In inter-crop rows, compaction was concentrated in soil surface layers (0–0.3 m). In addition, all adopted managements presented SPR above the critical value (2 MPa). The soil preparation forms qualitatively affected the sugarcane broth, showing higher fiber and protein contents in NT, MT, and CT. The PS, Brix, TRS, and Pol were not affected by soil management. Still, higher absolute values were found in the NT, indicating an increase in broth quality when applying conservation management. The highest yields were obtained by reduced tillage (MT), surpassing the lowest yield management (NT) with an increase of 10.5 Mg ha−1.

1. Introduction

Brazil is recognized as one of the sugarcane (Saccharum officinarum L.) world’s largest producers, a crop of significant commercial importance for the country [1]. The commercial applications of sugarcane are diverse, emphasizing ethanol production, sugar, and electricity. Traditionally, this crop has contributed to reducing environmental impacts, mainly by reducing dependence on fossil fuels in the global energy sector [2].
Sugarcane demands the most intensive machine traffic, as it is a semi-perennial crop. The intense machine traffic causes soil compaction and affects crop productivity [3,4,5,6,7,8]. Understanding soil preparation effects on crop productivity becomes important to achieve a sustainable agriculture model [9,10].
In soil conservation management, the main types of soil preparation are no-tillage and minimum tillage [6,11,12]. No-tillage planting of sugarcane keeps harvest residues on the crop surface (Farhate et al.) [5], thus reducing the greenhouse gases emission effect and improving soil temperature and humidity conditions [13,14,15].
Conventional tillage promotes intensive mechanization and disturbs the internal soil structure [7], intensifying on bare soils that are more subject to compaction [16]. Therefore, conservationist tillage has grown in sugarcane crops with a view to greater plant development, lower production costs and environmental benefits.
Soil management affects sugarcane productivity and broth quality; in addition, compacted soils provide productivity, and raw material quality decline. Soil compaction in sugarcane fields has been mainly attributed to harvesting at inadequate soil moisture conditions [17]. Mechanized operations performed in sugarcane with wet soils degrade the physical soil structure (Farhate et al.) [5], causing erosion due to intensive tillage [18]. Soil compaction levels can be inferred from penetration resistance methods. This parameter is correlated with the plant’s root system development. In the sugarcane crop, soil resistance values to penetration above 2 MPa can be considered limiting to full root development [15].
This research aimed to evaluate the productive sugarcane performance, after the soybean crop cycle, under four soil preparations: no-tillage (NT), minimum tillage (MT), and two conventional managements (CT and CTI). Specifically, the results obtained related crop productivity and raw material (broth) characteristics in response to each type of soil management.

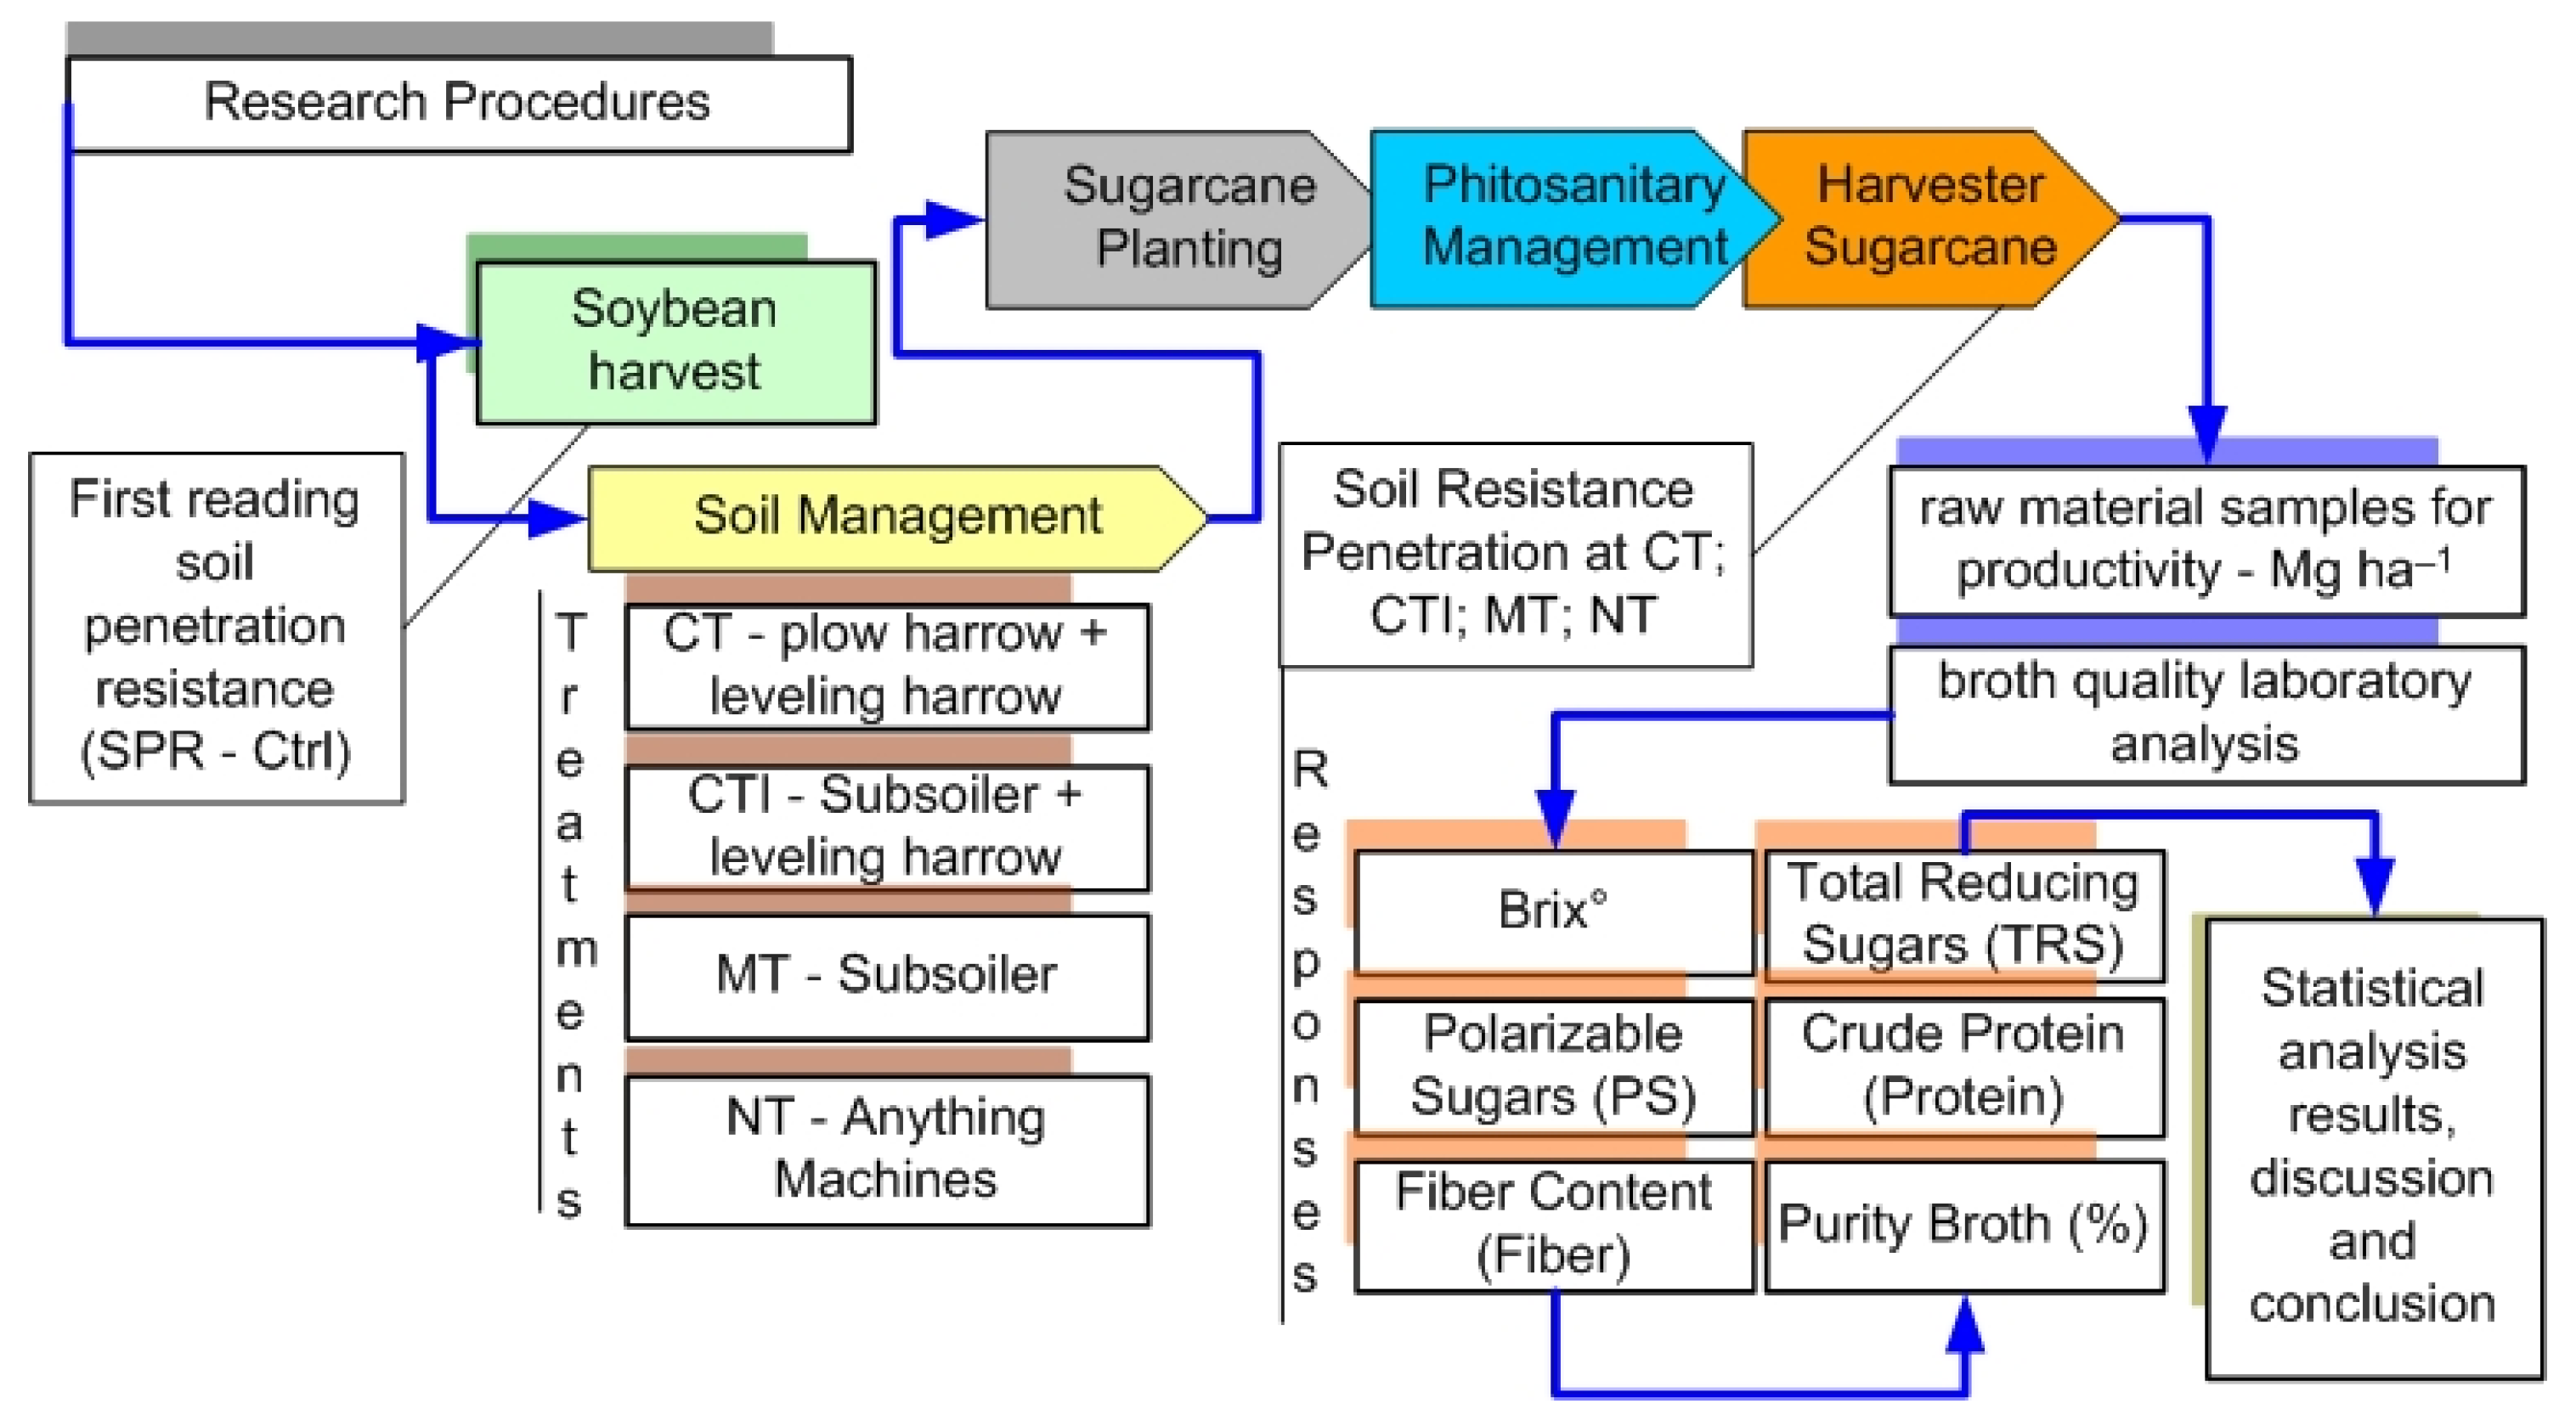
2. Materials and Methods

2.1. Site of Study

The experiment was carried out in a commercial sugarcane production located in the Tietê municipality/SP Brazil, with geographical coordinates latitude 22°57′ S and longitude 47°47′ W at an average altitude of 508 m. In the previous crop cycle, it was cultivated with soybeans. The soil in the experimental area was classified as Latossolo Vermelho Eutrófico”, according to Brazilian soil classification [19] as Oxisol Rhodic Eutrudox, according to the soil taxonomy, system clayey texture [20].
The local climate is CWA, a humid subtropical climate with a dry winter season and an average annual temperature of 22 °C, according to Köppen-Geiger [21]. The rainy season is concentrated between November and March, with an annual average of 1293 mm.

2.2. Soil Management

Four soil preparation systems, two conservationist, and two conventional, were carried out in 4 homogeneous areas. The preparations applied were conventional (CT) heavy harrow + light harrow; conventional I (CTI) subsoiler + light harrow; minimum tillage (MT) subsoiler only and no-tillage (NT) no soil movement.
The CT was performed by passing a heavy harrow, offset model, double section with a total width of 5.0 m, containing 20 discs, 30” in diameter, operating at a depth of 0.20 m, followed by two passages of a levelling harrow, offset model, double section, with 44 discs, 22” in diameter and total width of 4.8 m, operating a depth of 0.10 m. In CTI, deep decompression was carried out with a subsoiler with seven curved rods, with a total width of 2.5 m, with 0.06 m tips without wings, at a working depth of 0.35 m, followed by two passages of a levelling harrow. Soil preparation MT consisted only of sub-soiling with seven curved rods at a working depth of 0.35 m; in the NT treatment, there was no soil disturbance.
An agricultural tractor type 4 × 2 TDA pulled all equipment used in soil preparation systems with an engine power of 132.3 kW. After preparing the soil, furrows were opened in all areas for sugarcane planting, using a 2-line furrower. After opening furrows, mechanized planting was carried out using a chopped cane distributor model DCP5000 with a capacity for 15 Mg of propagation material and pulled by a 132.3 kW tractor. The sugarcane variety implanted was RB92579 in all experimental areas, with 1.5 m spacing between rows and an average of 12 stalks (0.3 ± 0.05 m each) per meter of row. After planter passage, the furrows were closed with a line covering equipment, pulled by a 4 × 2 TDA agricultural tractor with a 73.5 kW engine power.
Phytosanitary management, pesticide spraying, and corrective fertilization were equally carried out in all experimental plots, being considered an observed covariate in this research. At 18 months after planting, mechanized harvesting in experimental plots was carried out with a single-line harvester and a tractor-transshipment set with a load capacity of 12 tons. Evaluation of total sugarcane mass in treatments was conducted to determine the total productivity, and samples were taken to evaluate the raw material quality (broth) at different soil preparations. Figure 1 describes the experimental process and the research procedure adopted.

2.3. Experimental Arrangement

Randomized blocks in experimental design composed of four tillage systems (CT, CTI, MT, NT). Each experimental plot consisted of crop strips 30 m wide and 300 m long (9000 m2), with six replications. Sugarcane was planted with spacing of 1.5 m, in each experimental plot; five external rows were considered borders. In these lines, no plants were collected, to minimize environmental effects and interaction between plots. All data collection to evaluate soil physical conditions, biometric characteristics and crop productivity was performed randomly in the central plot strips.

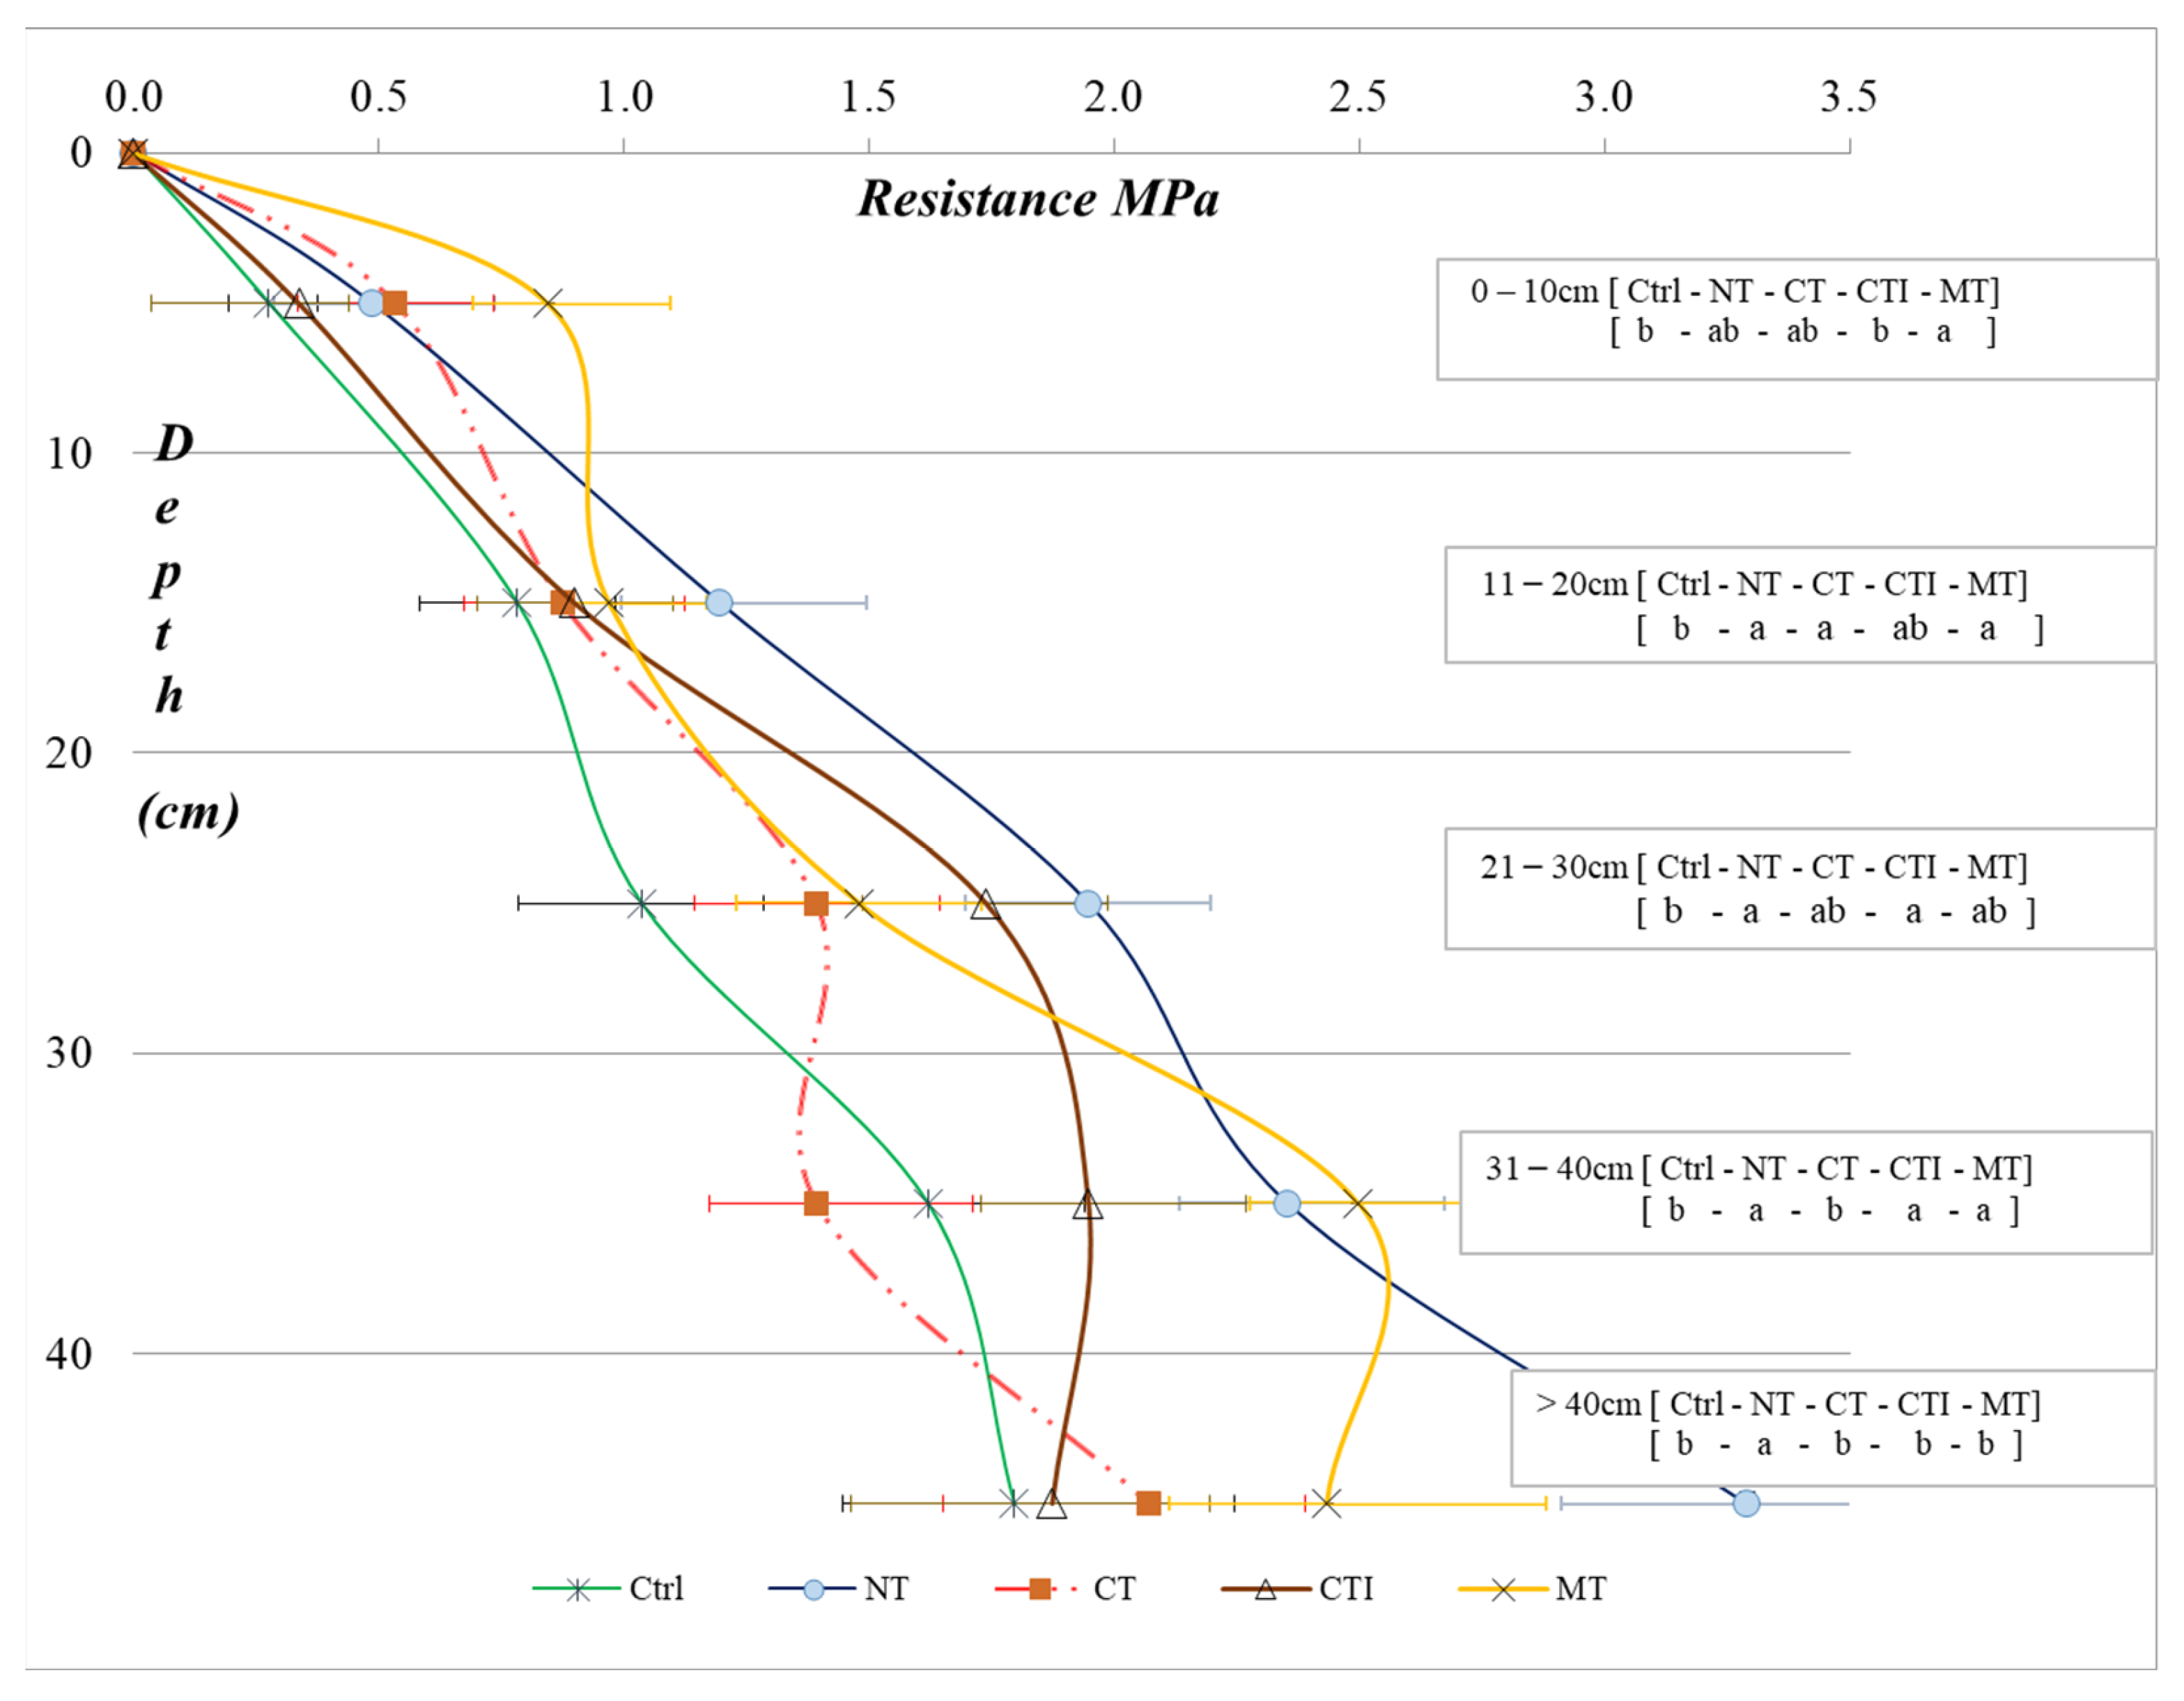
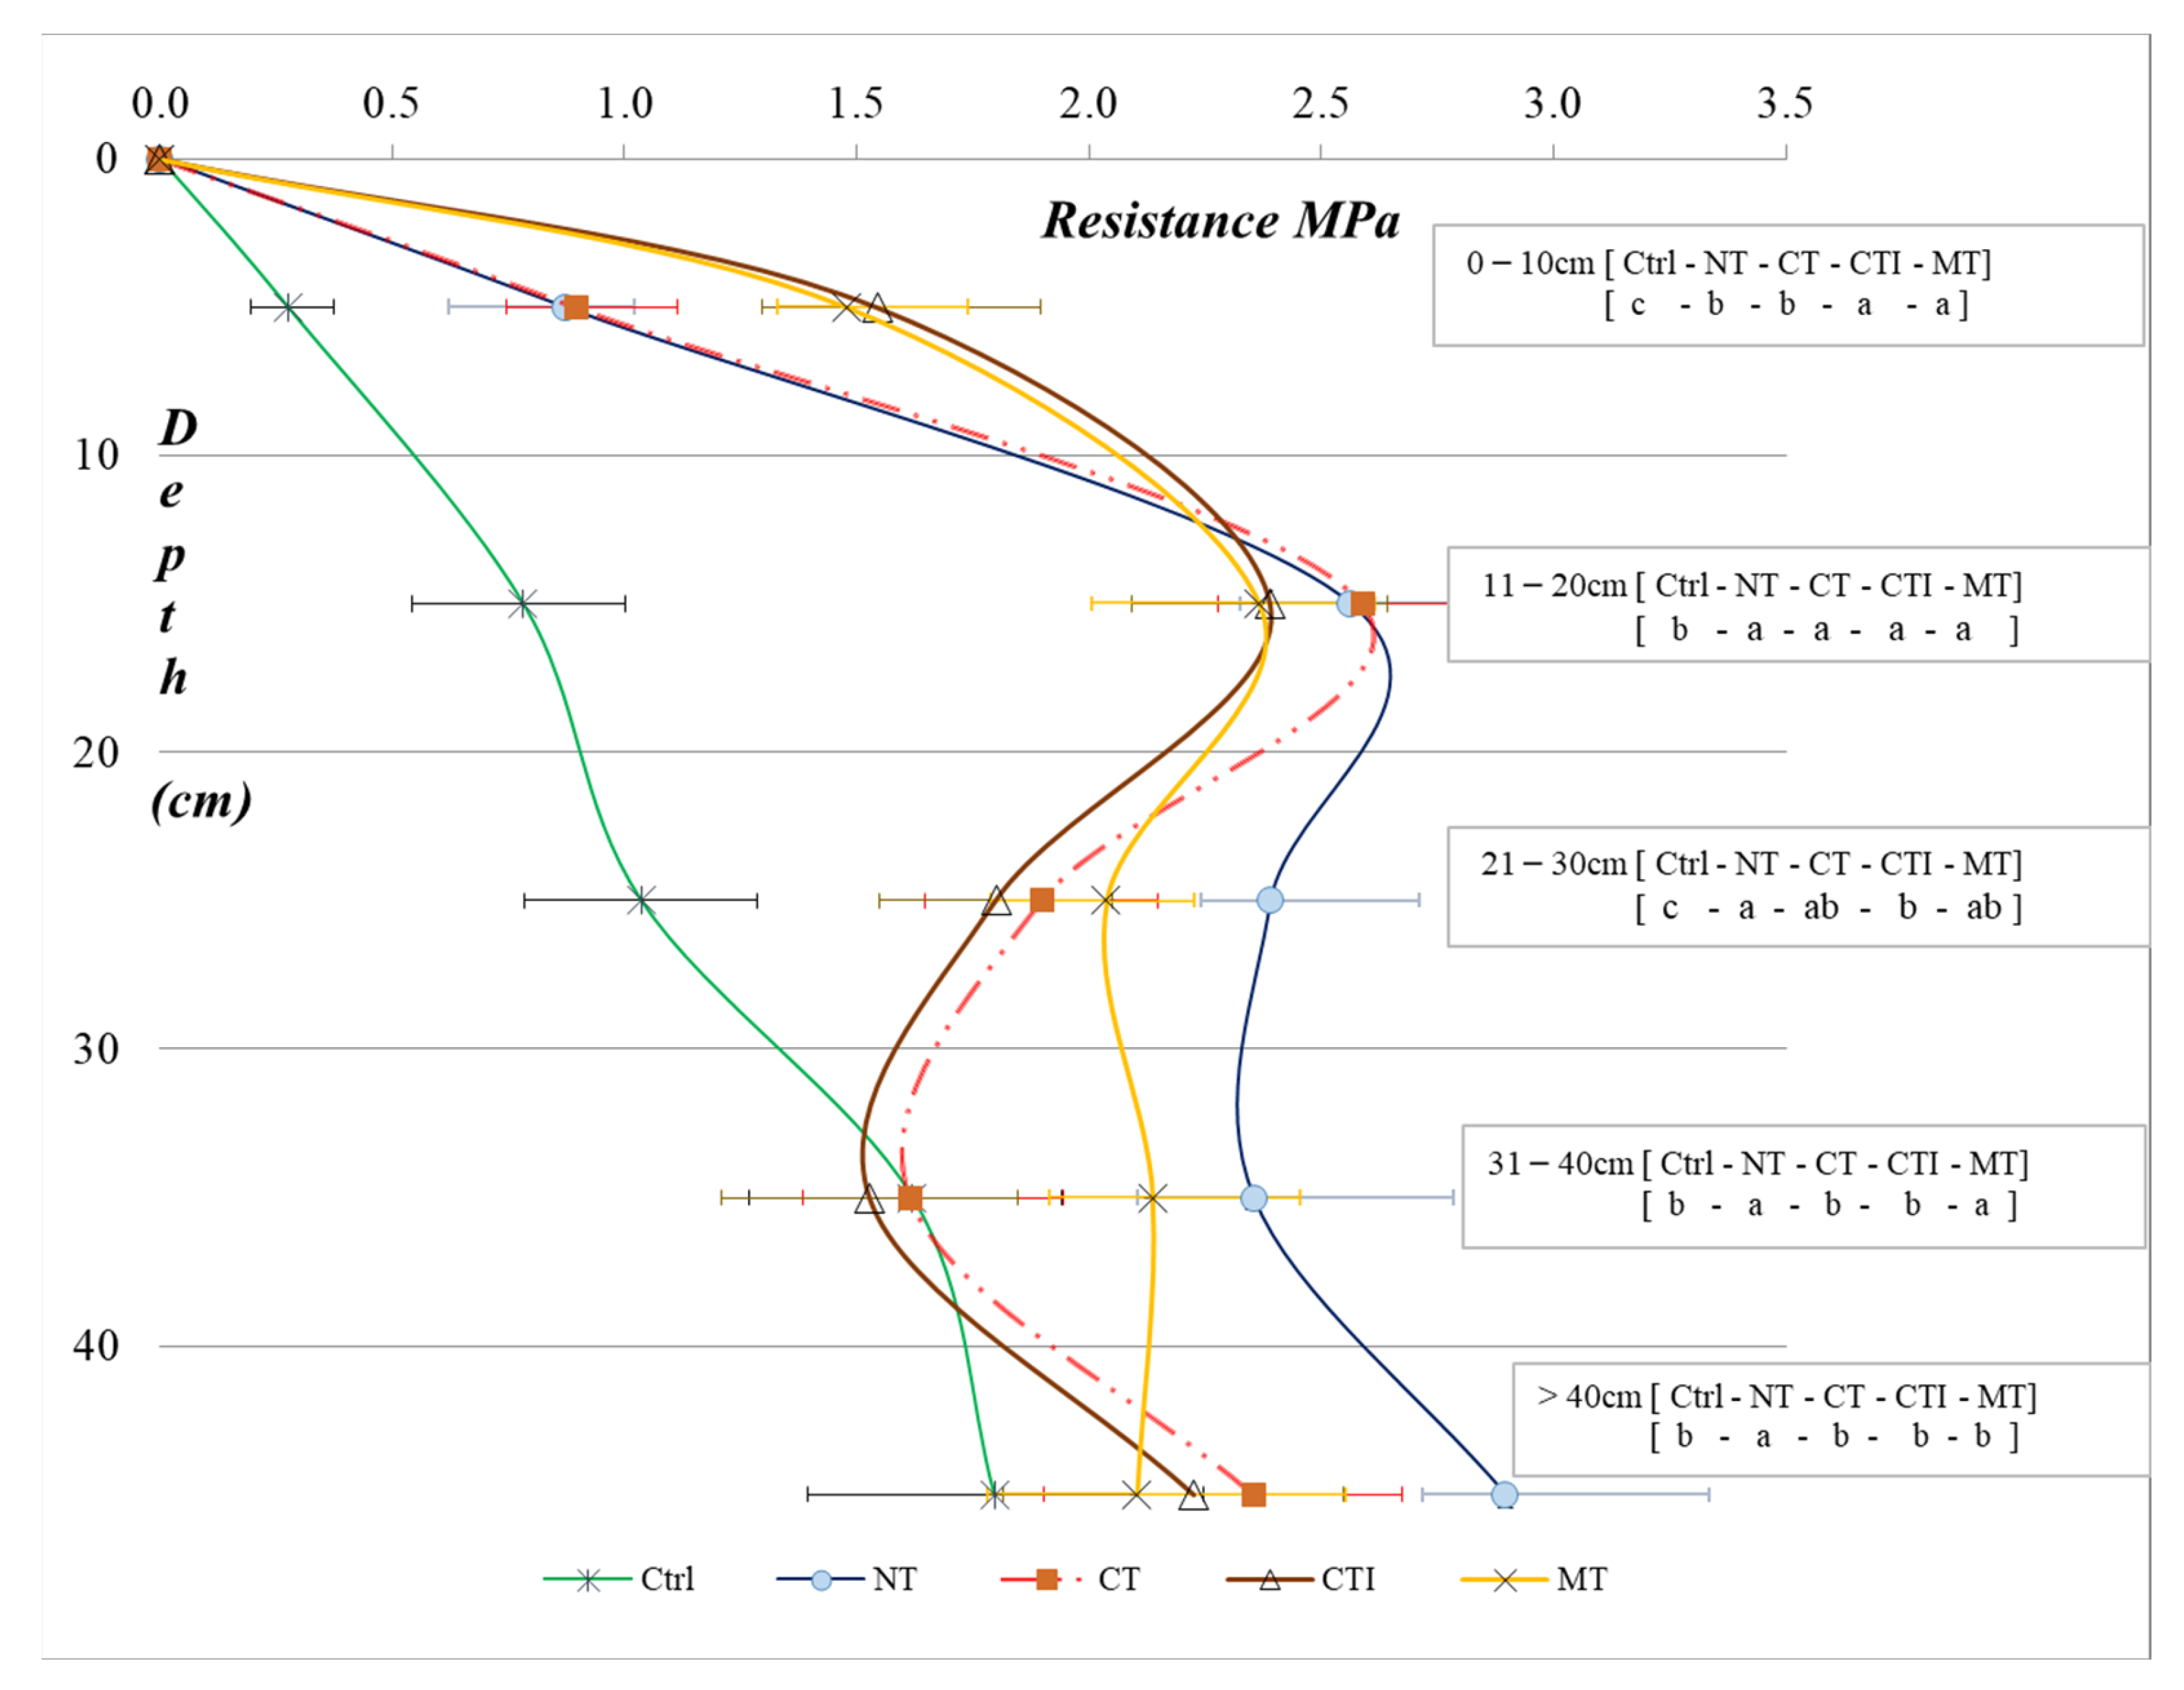
2.4. Soil Resistance to Penetration (SPR)

Soil penetration resistance was carried out with a SoilControl-625 manual penetrograph, taking samples up to a depth of 0.5 m. Penetration resistance analysis was carried out randomly with six repetitions in the crop, with two locations for each treatment, in the crop rows (rows) and the agricultural machinery traffic lines (inter rows). Along with the resistance to penetration, a deformed soil sample was collected at each point to determine the water content using the gravimetric method.
Soil samples were collected at a depth of 0–0.5 m, totaling 16 samples in each treat-ment, with 6 repetitions. Soil samples were taken from random holes in the soil in each plot. In the laboratory, the soil was dried in an oven at 105 °C for 24 h and the water content was obtained by the difference between the dry and wet masses samples. Using an analytical balance with a precision of ±0.001 g, water content was performed according to Equation (1).
θ = ((MU − MS)/MS)
where: θ = water content (m3 m−3); MU = wet soil a (g); MS = dry soil mass (g).
The first SPR collections were performed after the previous harvest (soybean) was harvested. This data collection was called control (Ctrl) and refers to the initial soil state without preparation; after the soybean cycle, they were then compared with the SPR after the sugarcane crop cycle in each treatment.
The average water content at the time of penetration resistance collections was established at 0.212 m3 m−3 in the crop rows and 0.209 m3 m−3 in inter rows. Averages of resistance to soil penetration in layers from 0–10; 11–20; 21–30; 31–40; and >40 cm, were subjected to normality tests; variance similarity and a Tukey mean test at 5% were also performed. The differences found were mounted on the cone index graph.

2.5. Productivities and Broth Characteristics

After harvesting, four full-load vehicles were identified and weighed in each experimental plot using a processing scale. After this procedure, the simple average of these loads was calculated, estimating the total productivity of each treatment as a harvested area function per plot (Mg ha−1).
The chemical characteristics were analyzed by collecting thirty sugarcane stalks (six replications with five stalks) separated from each treatment, totaling 120 samples. These were then sent to the plant’s chemical analysis laboratory for qualitative evaluation of the raw material for determination of total polarizable sugars (PS), total soluble solids (°Brix), fiber content (fiber), total reducing sugars (TRS), crude protein (Protein), apparent sucrose content (Pol) and purity (%). All laboratory evaluations were performed with fresh matter.
The soluble solids determination (°Brix), total polarizable sugars (PS) and crude protein (Protein) were performed by a digital benchtop refractometer, with automatic temperature correction, the final value being expressed as the temperature of 20 °C, according to Consecana [22].
The sugarcane fiber content was determined using Equation (2):
Fiber = (0.08 × PBU) + 0.876
where: Fiber = Fiber Content; PBU = mass of wet bagasse from the press, g.
The reducing sugar content at broth (TRS) was determined by Equation (3):
TRS = 3.641 − 0.0343 × purity
where: TRS = reducing sugar content; purity = broth purity.
The apparent sucrose content in broth (Pol) was determined using Equation (4):
Pol = Lpb × (0.2605 − 0.0009882 × Brix)
where: Lpb = saccharimetric reading equivalent to lead subacetate; Brix = soluble solids.
The broth purity was determined using Equation (5):
Purity = 100 × (Pol/Brix)
where: Purity = broth purity; Pol = apparent sucrose content of the broth; Brix = soluble solids.

2.6. Statistical Analysis

Statistical broth quality analysis applied was the Shapiro–Wilk normality test, followed by Levene’s test of similarity between variances and variance analysis (ANOVA). Tukey’s test was applied at a 5% probability when a significant difference was detected between the means. The multivariate test of principal components analyses (PCA) was applied to sugarcane’s biometric responses to define the variables’ interdependence. All statistical analyses and tests were developed using Minitab v.16 software (State College, PA, USA).

3. Results and Discussion

3.1. Soil Resistance Penetration in Rows

Figure 2 shows that soil resistance of penetration (SPR) increased in depth at all treatments. In terms of statistical differences of SPR at 0–10 cm depth, the highest values were observed in MT (0.84 MPa), CT (0.53 MPa), and NT (0.48 MPa) when compared with Ctrl (0.27 MPa) and CTI (0.34 MPa).
Recent studies show sugarcane development root system is confined to surface soil layers [6,23,24]; initial soil layers must have low penetration resistance. Our results showed that SPR did not reach values limiting to 2 MPa [25] in superficial layers. However, critical SPR was found below 30 cm depth in no-tillage (NT) and minimum tillage (MT). This occurred due to non-mobilization soil layer in these treatments.
Figure 2. SPR in rows at different soil depths; control (Ctrl); no-tillage (NT); minimum tillage (MT); conventional preparation (CT) and conventional preparation I (CTI). In the boxes next to the graph, means followed by the same letter for each depth interval do not differ by Tukey’s test, at 5% significance.
Agronomy 13 00170 g002
Averages did not differ statistically from soil tillage methods to 11–20 cm depth, but differences were shown in treatment control. The highest SPR was found in the NT (1.2 MPa), followed by MT (0.97 MPa); CTI (0.90 MPa); CT (0.89 MPa) and Ctrl (0.78 MPa).
Between 21–30 cm depth, preparations soil averages did not differ significantly, as in the previous stratum. The resistance highlighted was NT (1.95 MPa) and CTI (1.74 MPa), with the highest absolute values. In this soil layer, the average resistances were MT (1.48 MPa), CT (1.39 MPa) and Ctrl (1.04 MPa). Luz et al. [7] stated that conservationist tillage alone could not preserve the physical soil structure so other management practices are necessary. Lima et al. [6] showed that lower SPR might not be related to greater volume roots in sugarcane; however, the machines’ transit lines present a 35% reduction in root volume.
Among 31 to 40 cm, was a different preparations average regarding control. The highest means were MT (2.50 MPa), NT (2.35 MPa) and CTI (1.95 MPa), with higher absolute values. In the background, averages of CT (1.39 MPa) and Ctrl (1.62 MPa) are observed. Arcoverde et al. [26] observed lower SPR in a sugarcane row at no-tillage areas compared to minimum tillage. Our results show even after 18 months, preserved physical soil structure remained in most layers, regardless of the method prepared; SPR remained below the 2 MPa critical limit. However, studies by Luz et al. [27] indicate that adopting transit zones improved soil structure preservation in sugarcane fields. Farhate et al. [5] concluded that cover crops application and conservationist soil management are promising techniques to improve sugarcane fields.
The highest SPR are observed in NT, related to loading accumulation applied by machinery on the ground due to the absence of turning-over soil. This compacted layer can hinder root development, impairing root access in-depth and, consequently, lower resistance to drought, affecting the sugarcane productivity field [28,29].
Between 41 to 50 cm, at a deeper zone, there was a difference in preparation averages and control. The highest means obtained were NT (3.29 MPa) and MT (2.43 MPa) in superior absolute values, CT (2.07 MPa) and CTI (1.87 MPa) in sequence, and finally, control treatment 1.80 (MPa). In NT, vegetation cover directly interferes with machine load soil distribution [16]. Adequate ground cover levels promote maintenance of a higher water content and reduce SPR effects [6,30,31].
Castioni et al. [32], relating soil compaction and sugarcane cover straw, find cover maintenance interfered with compaction and soils with greater cover are more resistant to machine traffic. Sá et al. [24], evaluating soil compaction in sugarcane, stated 3.8 MPa of SPR limits plant root growth. However, Souza et al. [15] found that critical root development is above 2 MPa.
In our study, SPR did not reach limiting root sugarcane growth up to 30 cm deep; however, the average 21% water content and soil texture contributed to low resistance penetration. Suppose this soil has a lower water content, which occurs throughout crop’s cycle, roots may find impediments to development, since reduction water content increases SPR proportionally.
Conventional soil management did not present advantages to the conservationist system. However, the mechanized intervention cost was higher than NT and MT management, as it required less intensity using machines. Luz et al. [7] found similar results, indicating traditional soil management does not benefit to alleviate compaction when compared to a conservationist system. According to Souza et al. [15], soil preparation is a high-cost operation in sugarcane renovation fields, and results from soil preparation are not maintained during the crop cycle; this occurs due to heavy machine traffic and rearrangement of soil particles in wheel interaction (Marques Filho et al.) [16] and weathering agents such as rain and wind [18].

3.2. Soil Resistance Penetration in Inter Rows

Between crop rows, there was a significantly increasing value of SPR (Figure 3). Statistical differences showed in SPR at 0 to 10 cm depth. The highest values were observed in MT (1.48 MPa) and CTI (1.54 MPa). In sequence, NT (0.57 MPa), CT (0.90 MPa) and control 0.27 (MPa). Greater SPR in surface traffic line is shown, thus indicating a physical impediment to root sugarcane development at 10–20 cm depth for all treatments except control (Ctrl). According to Lima et al. [6], in areas with conventional soil management, the soil’s physical depth structure is compromised in the first sugarcane cycle, causing damaged development of root crops. Farias et al. [13] show that conventional tillage areas increase greenhouse gas emissions, contributing to unsustainable sugarcane farming. Thomaz, Marcatto and Antoneli [18] verified erosion of sugarcane potential soils at different textures and show intensive soil preparation and bare soil could increase soil losses up to 7 Mg ha−1 Yr−1. Therefore, increased SPR harms the infiltration water rate, contributing to the erosive process.
At an 11–20 cm depth, averages did not differ statistically according to soil tillage methods, but differences in control were found. Regardless of soil preparation, this layer showed the highest SPR, between 2.37 MPa (MT) and 2.59 MPa (CT). Between 21–30 cm, average types of soil preparation differed statistically, especially NT, with a resistance of 2.39 MPa, followed by MT (2.14 MPa). In this soil layer, SPR of CT (1.80 MPa) and CTI (1.90 MPa) remained below the conservationist systems. Tormena and Roloff [30] observed greater SPR in no-tillage systems due to no revolving soil and intense agricultural machinery traffic; according to Beutler et al. [33] and Assis et al. [31], this is a great handicap to no-till.
Higher values of SPR are found in the inter rows control area (Ctrl), caused by the traffic machine performance in the sugarcane field. These results are similar to Cavichiolli et al. [34] and Lima et al. [6], where SPR averages were higher in sugarcane inter rows; this was due to heavy machine traffic, causing soil profile changes, affecting SPR values. Oliveira et al. [8] obtained sugarcane’s highest productivity in no-tillage areas with high SPR in inter rows, indicating that SPR in this locale does not directly affect crop performance.
Esteban et al. [35] found a 17.9% and 18.5% dry mass increase in sugarcane roots at alternating single and double single spacing, respectively, when controlled traffic was used in the field. These authors stated that controlled traffic implementation provided gains in sugarcane final productivity. Heavy traffic machines increase SPR in surface layers [6].
Higher SPR layers in 10–20 cm was corroborated by Cavalieri et al. [36], who found a higher concentration of SPR from 10 cm depth under the zone of agricultural machinery traffic. Lima et al. [37] also observed similar SPR values at 10–20 and 20–30 cm layers depth in medium-texture Red Latosol sugarcane cultivation.
Between 31–40 cm depth, MT (2.14 MPa) and NT (2.35 MPa) maintained the highest SPR, with an emphasis on conventional preparations, and did not differ from control treatment, CT (1.61 MPa); CTI (1.53 MPa) and Ctrl (1.60 MPa). However, between 41–50 cm, there was a difference between NT (2.90 MPa) and other treatments, CT (2.35 MPa); CTI (2.23 MPa). MT (2.10 MPa) and Ctrl (1.80 MPa) did not differ from each other.
In layers below 25 cm, there was a reduction in SPR, a fact relating to the effect to implements applied in soil preparation; emphasis on traffic machines did not affect soil physical structure in depth, except in the no-tillage system (NT); this becomes evident when comparing Figure 2 and Figure 3 at a 35 cm depth downwards; in this stratum the values are very similar. Lima et al. [38] reported increased SPR with below-layer soil tillage. Otto et al. [39] found lower SPR results than those obtained in our study, but this was demonstrated by a severely affected location, with machine traffic in the inter rows of sugarcane.
Unlike annual crops, where it is possible to periodically carry out a mechanical soil restructuring, sugarcane is susceptible to transit machines every 5 or 6 years until cane fields are reformed. Each year, scarifiers and subsoilers use between sugarcane rows present economic and agronomic inconveniences, such as rupture of lateral roots and greater machines’ energy requirements for soil mobilization.

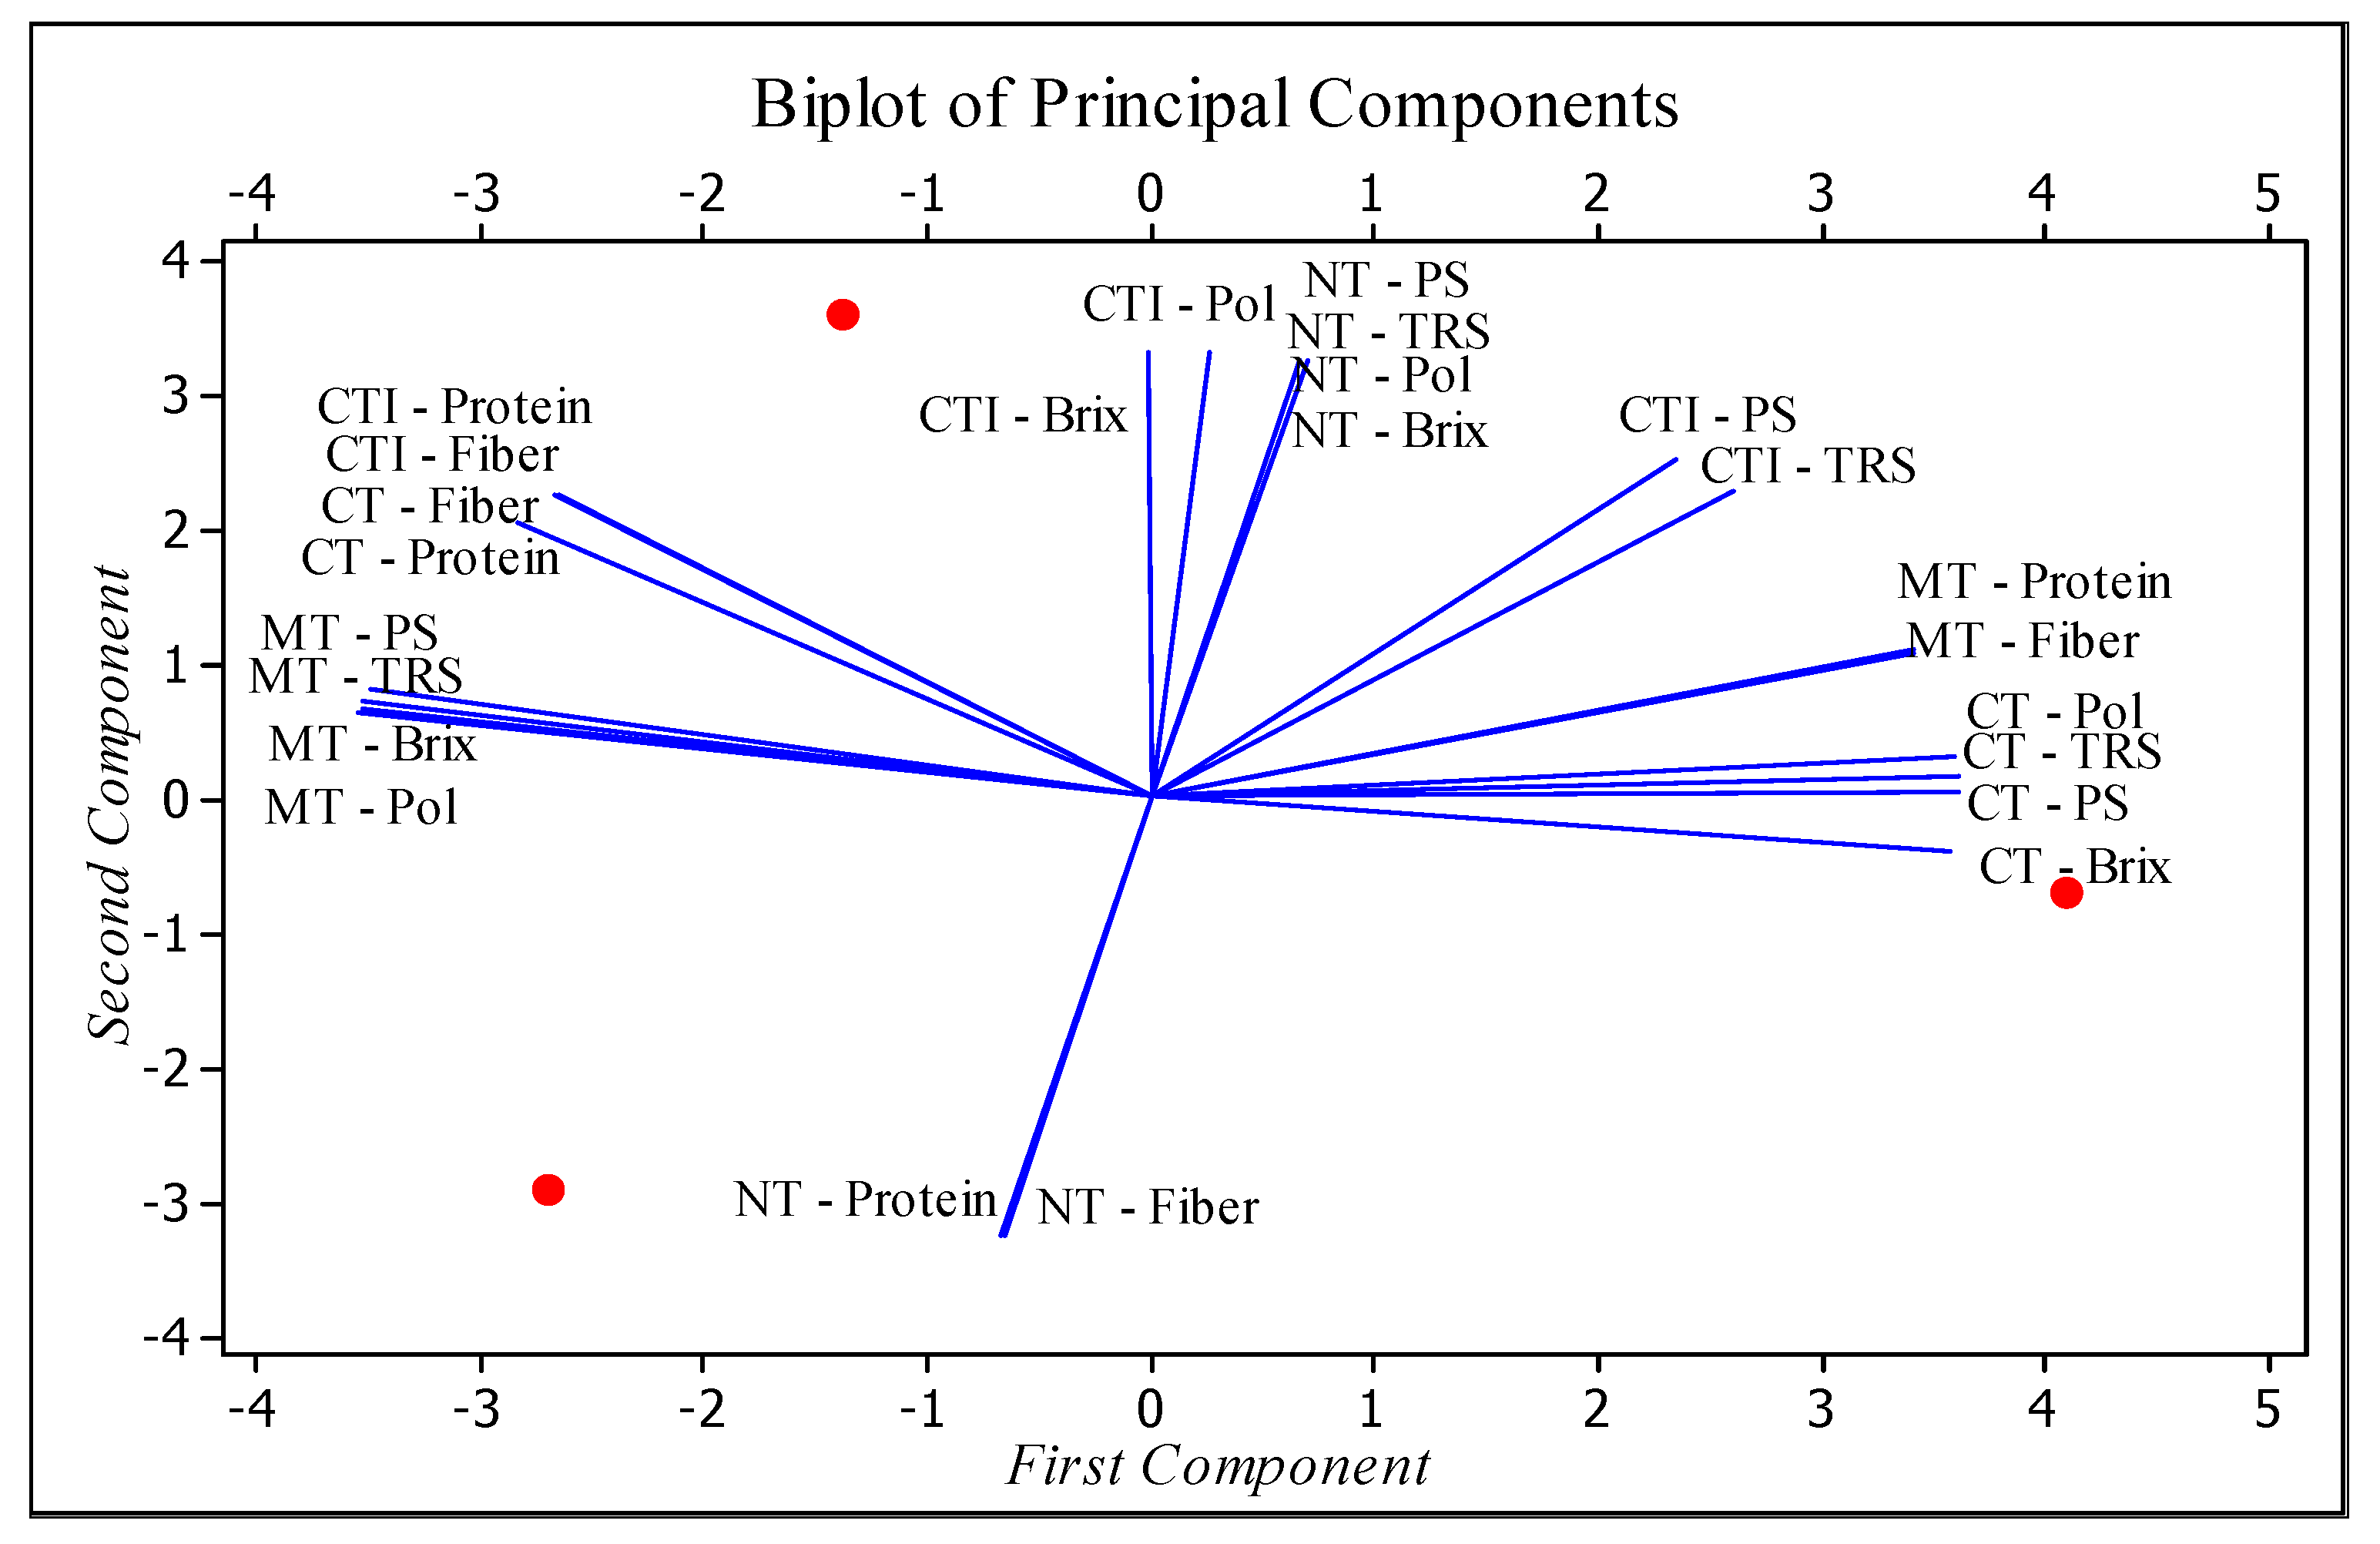
3.3. PCA Broth Characteristics

The perceptual map of the main components that relate to the qualitative sugarcane variables broth is described in Figure 4. Observed in this graph is the dependence between the variables for each mode of soil preparation to raw material qualitative responses: level of solids total solubles (°Brix); Total polarizable sugars (PS); fiber content (Fiber); Total reducing sugars (TRS); crude protein (Protein); apparent sucrose content (Pol).
The results showed that soil preparation methods affect the quality of the broth produced. Campos et al. [40] evaluated that soil tillage models are less influential on the biometric characteristics of sugarcane than adequate soil correction with fertilizers. The authors stated that in corrected soils, the total productivity of sugars in the must is increased; however, the soil preparation method affects the total productivity of stems.
Figure 4. Perceptual map of broth quality: multivariate principal component analysis (PCA) method.
Agronomy 13 00170 g004
Figure 4 presents a biplot-type graph for the chemical variables of sugarcane broth in each soil tillage management. In the multivariate analysis model, the results show the interdependence between the chemical variables and model soil preparations. In NT, there is low dependence between PS, TRS, Pol, and Brix to Protein and Fiber for the same soil preparation method, a fact that indicates different modes of expression of the variables depending on the treatment. Arcoverde et al. [26] observed that the qualitative response of sugarcane juice varies depending on soil preparation; the authors found the highest sugar yields in the no-tillage system.
First component analysis involving the variables shows a high dependence between the protein and fiber content in the traditional management of CT and CTI soil. For minimum cultivation (MT), there is high dependence between PS, TRS, Brix and Pol. In CT management, there is an opposition between Pol, TRS, PS, and Brix to fiber and protein content for the same treatment (Figure 4).
Research of Oliveira et al. [8] found that under no-tillage conditions, sugarcane productivity was increased. The authors found that the soil structure is preserved in soils with conservation management, and the carbon contents in the soil are increased. Soils with higher carbon contents and fine structuring conditions contribute to the formation of complex metabolites that certainly affect the characteristics of the broth.
In CTI, PR, and TRS, analyzing the main component is not related to protein and fiber indices in the same treatment. The PS and TRS contents correlate poorly with the Brix and Pol contents in the CTI treatment. The NT treatment showed behaviour similar to MT, explained by the second component of the perceptual map; there was an opposition between the fiber and protein contents to the PS, TRS, Brix, and Pol contents.
Similar to what happened in NT, there are MT and CT biometric variables. In CTI, PS and TRS variables showed dependence; however, for this soil preparation method, Brix and Pol were strongly correlated, and the same happened with Fiber and Protein variables. The biochemical characteristics that caused such dependencies need to be better investigated, so this research opens new fronts for future investigations. Collaborating with the results of this work, Campos et al. [40] verified through principal component analysis (PCA) the relationship between different soil preparations and doses of lime in sugarcane; the authors verified dependence between the preparations of soil and culture chemical parameters.
Variables behaviour in the different types of multivariate analysis to soil preparation indicates that the form of soil management affects the expression and establishment sugarcane juice qualitative characteristics. Luz et al. [7] showed that soil turning by conventional tillage does not improve water availability and air permeability during the sugarcane cycle. However, traffic control is essential to support the adoption of reduced tillage in the sugarcane fields, preserving water availability in the soil and the air flows for the next crops.

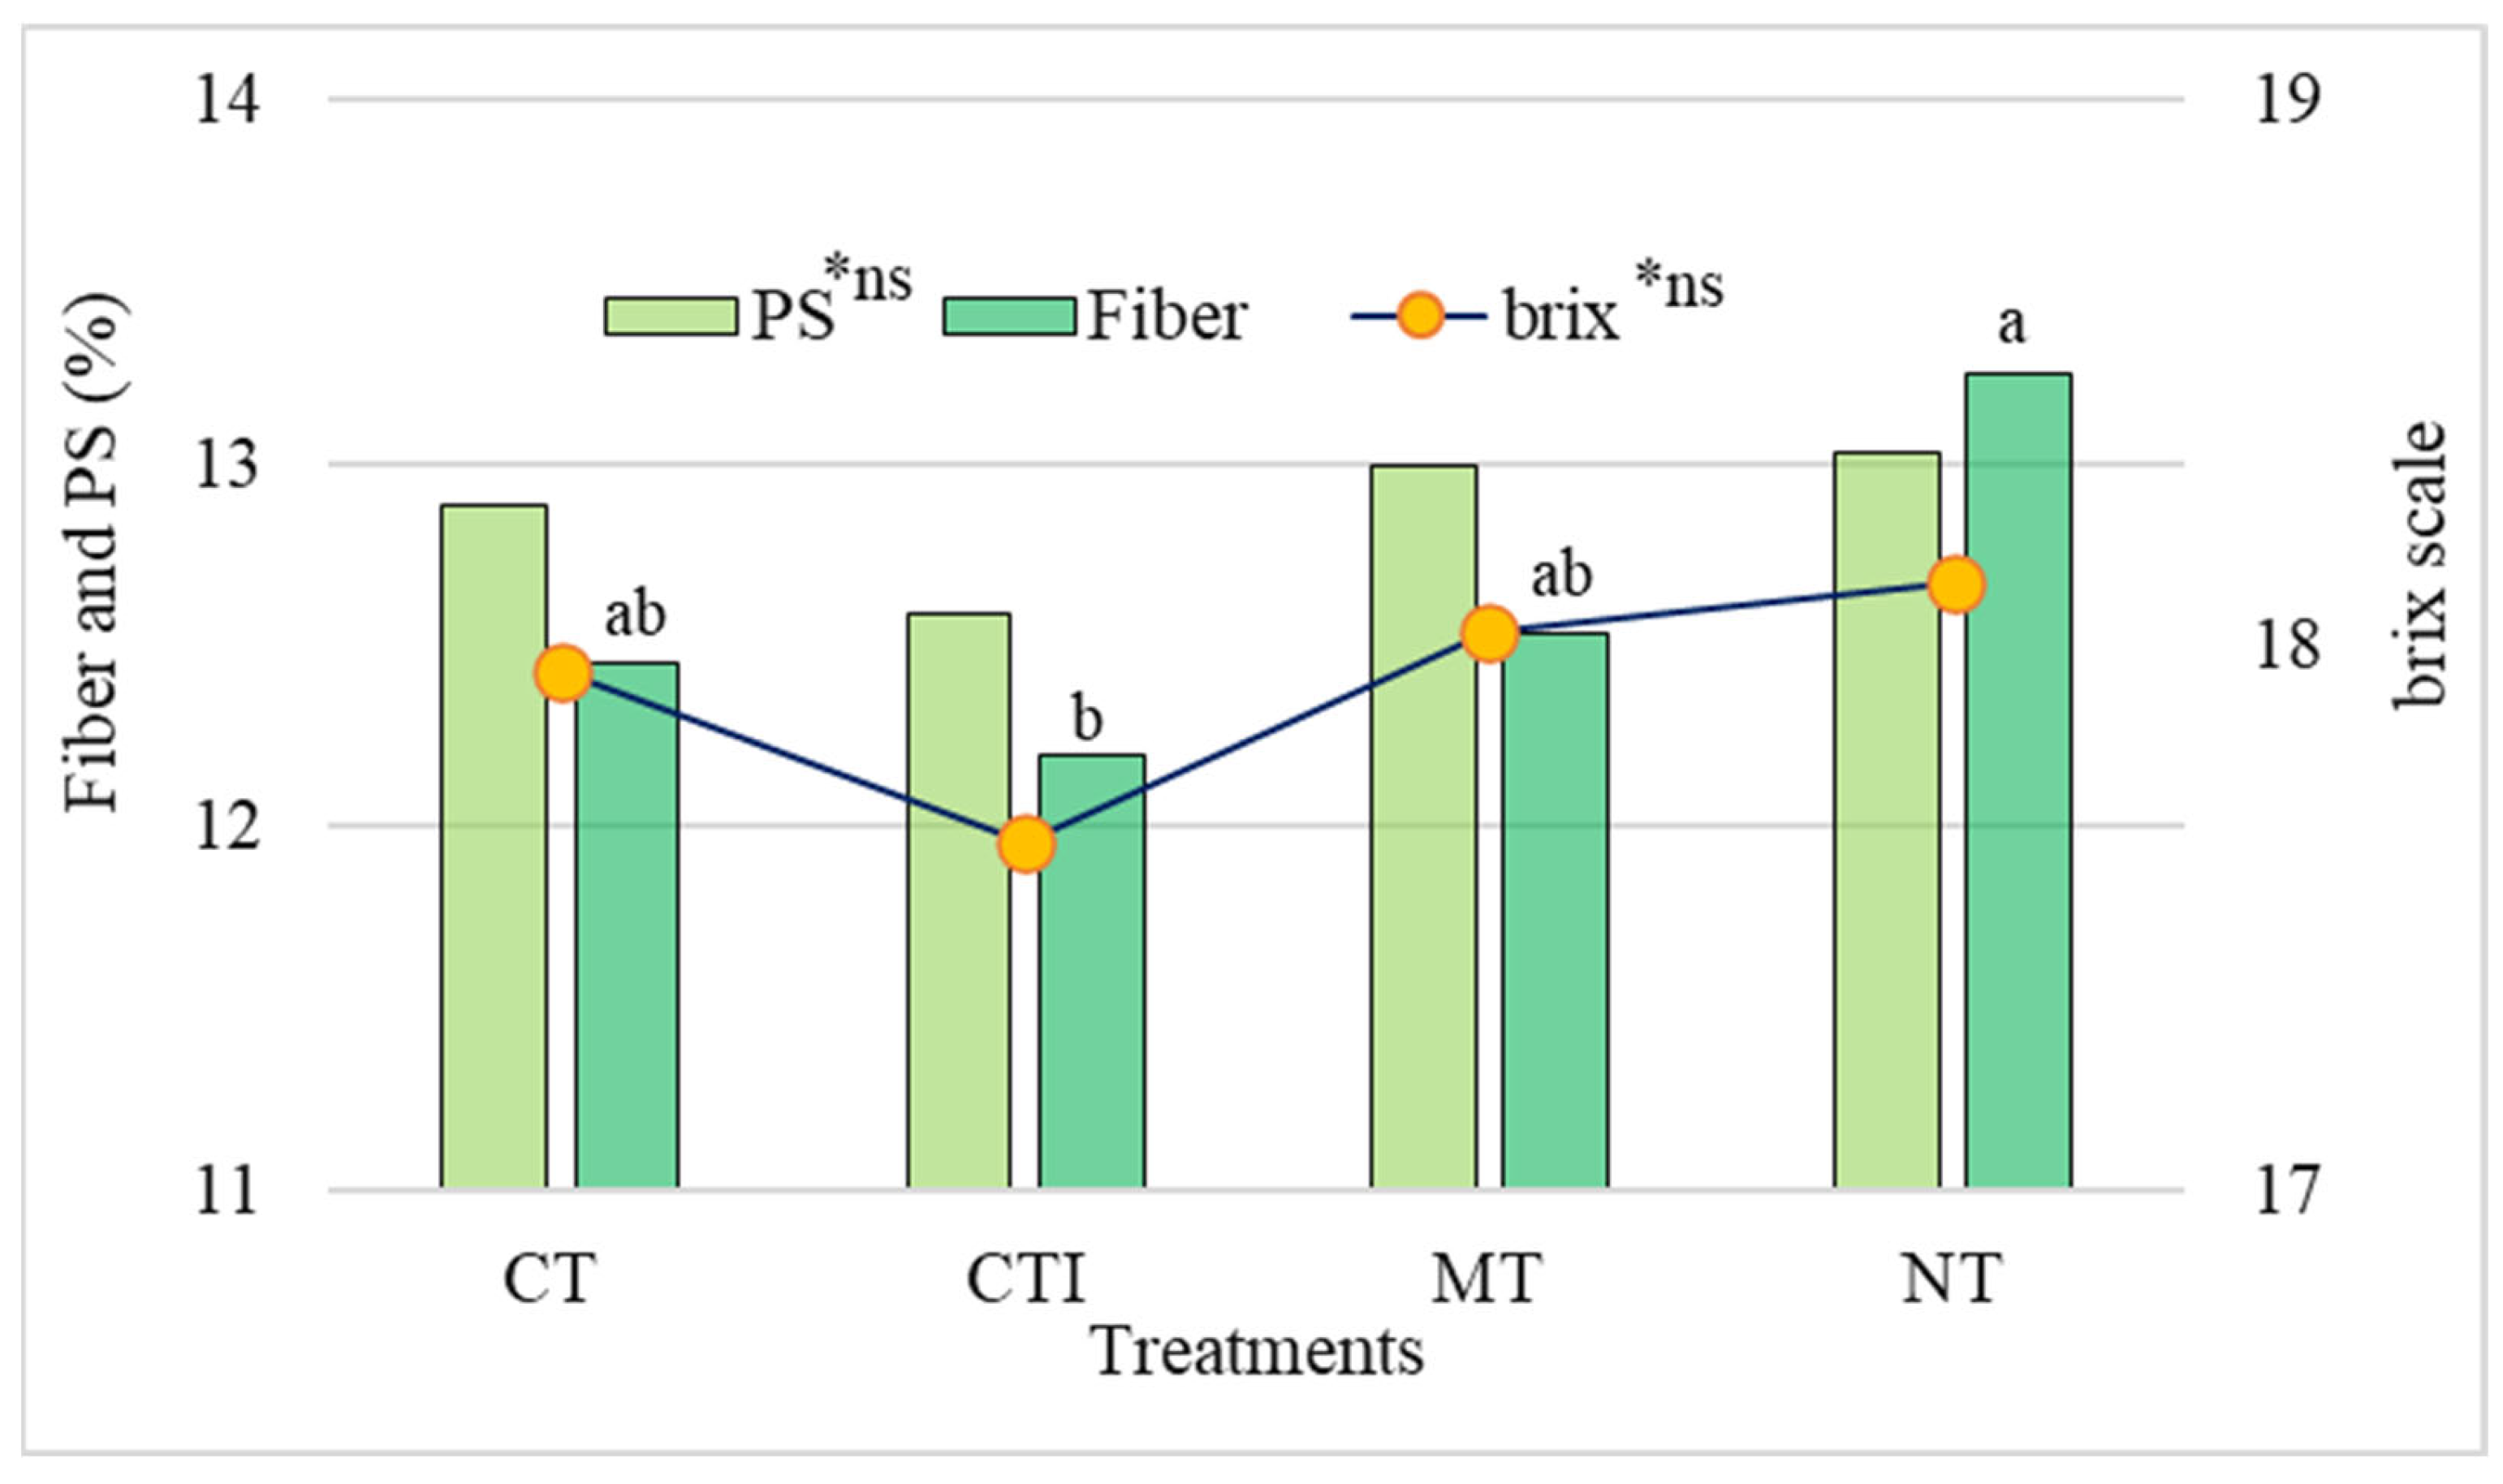
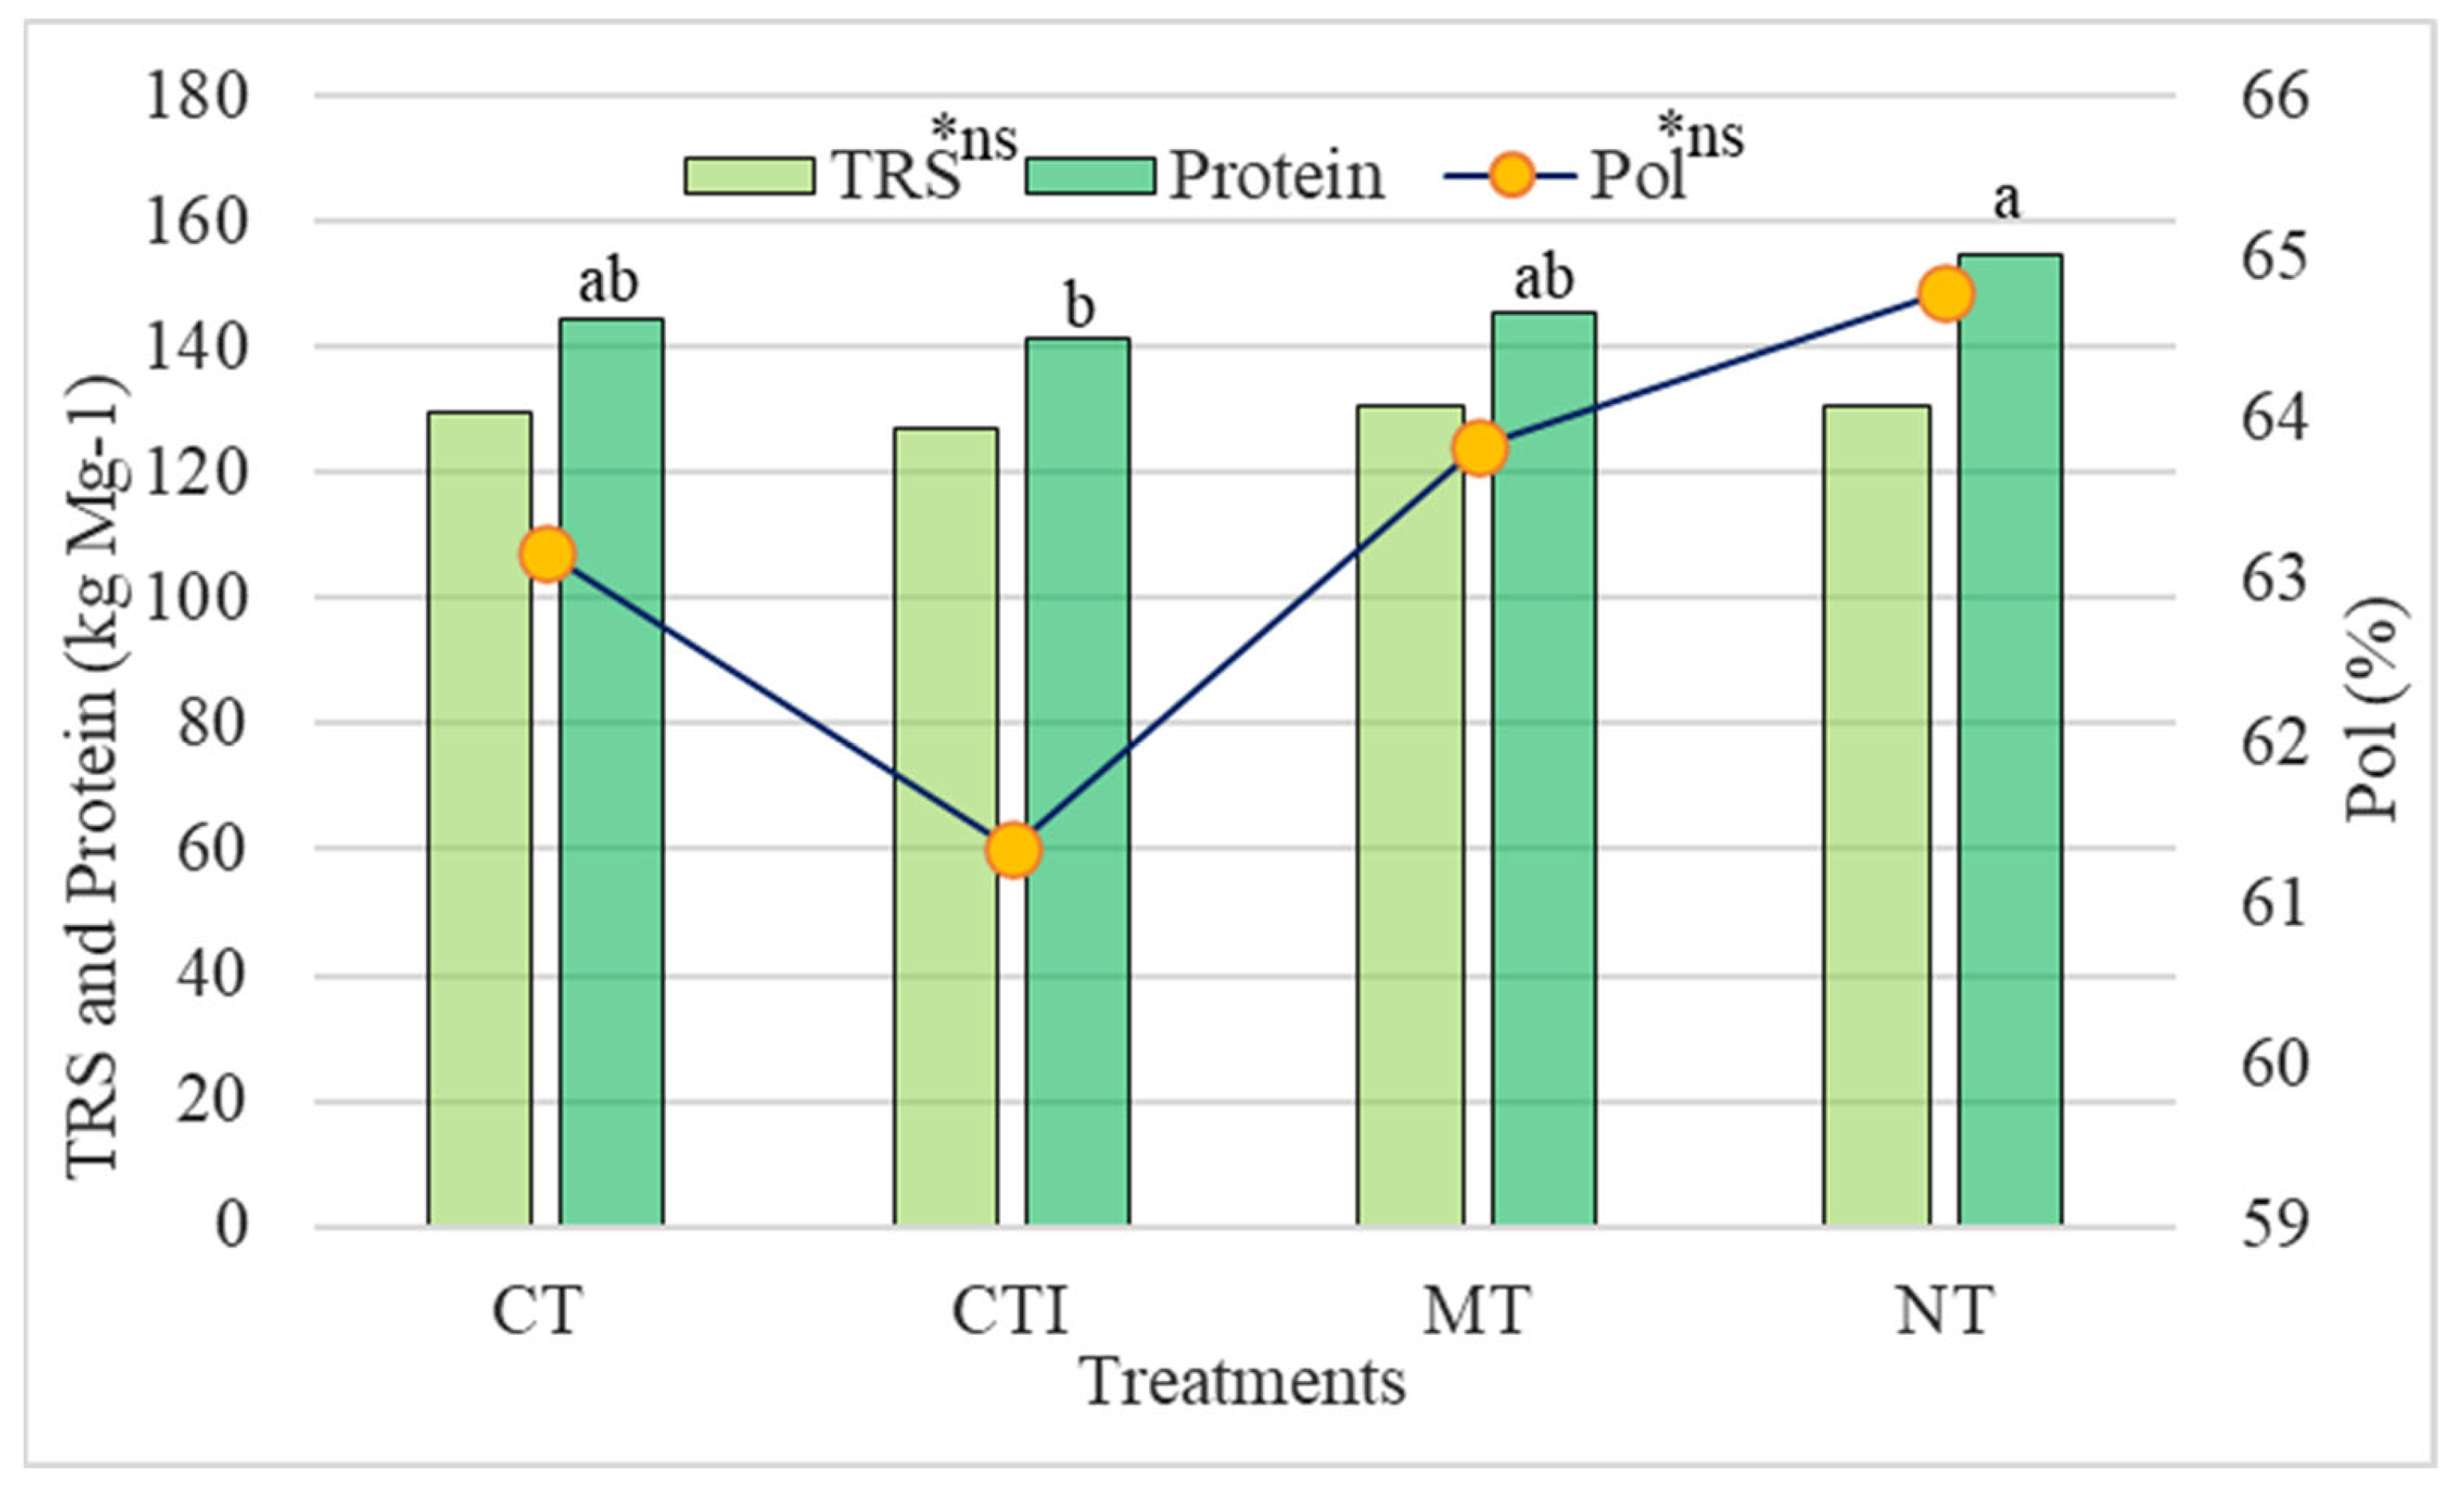
3.4. Broth Characteristics

Brix scale graph and fiber percentage in each treatment are described in Figure 5. It is observed that the highest level of total fibers was obtained in the NT treatment, not differing statistically from the MT and CT treatments. Total polarizable sugars (PS) and the level of total soluble solids (Brix) showed no significant difference between treatments.
Among the quality parameters, a significant difference was observed for the fiber component (Figure 5). The highest Fiber values were obtained in NT, followed by CT, MT, and CTI, respectively. There was no significant difference for the variables Brix and PS by the applied statistical test (Tukey p < 0.05); however, in absolute terms, the lowest values were observed in the CTI treatment.
In absolute values, the conservationist managements NT and MT presented a Brix of 18.1 and 18.0%, respectively. Conventional soil treatments CT and CTI provided Brix of 17.9 and 17.6%, respectively. Therefore, it appears that the soil preparation model did not directly affect the level of soluble solids in the sugarcane samples. The same occurred to polarizable sugars (PS); the lowest value was presented by CTI (12.58%), followed by CT (12.88%), MT (12.99%), and NT (13.0%).
The physical structure of the soil, depending on the management adopted during the sugarcane production period, influences the percentage of root formation (Lima et al.) [6] and the rates of water and nutrient absorption (Luz et al.) [7]. The highest percentage of fiber was found in no-tillage (NT) above 13% and, with the lowest percentage, the conventional tillage I (CTI). In contrast, the minimum tillage (MT) and conventional tillage (CT) did not differ from the other tillage types. However, the values obtained for all treatments are in the ideal fiber range (8–16%) for sugarcane cultivation [41].
Figure 5. Sugarcane chemical variables (fresh matter) evaluation of fiber content (Fiber), polymerizable sugar (PS), and Brix, as a function of treatments: NT, MT, CT and CTI. Means followed by the same letter do not differ by Tukey's test, at 5% significance. * ns indicates no difference between means.
Agronomy 13 00170 g005
Agronomic characteristics such as sugar (Pol) and fiber content are relevant indicators of sugarcane quality [42,43]. For these variables, NT and MT treatments had the best performance. The significant differences obtained for the biometric variables indicate that the content of these elements varies depending on the management; conservationist soil managements allow positive differentiation in these characteristics.
Resistance to soil penetration directly affects the crop’s uptake of nutrients and water, which implies less formation of metabolites and structural elements, ultimately resulting in a lower content of the organic characteristics necessary for the industry. The proper development of the root system allows the crop to access greater depths and volumes of soil, providing better nutrition and development (Colombi and Keller) [44], as evidenced in this research. Farhate et al. [5] obtained increased productivity in the range of 9 to 11 Mg ha−1 of sugarcane in intercropping with cover crops in conservation management, indicating the feasibility of applying cover crops to protect and preserve the physical structure of the crop ground.
In Figure 6 lists each treatment’s TRS, Protein, and Pol variables. The results showed that for the variables Pol and TRS, no significant difference was obtained at the 5% level of significance in the Tukey test. However, the protein content varied according to the soil management method.
TRS values are the main indicators of sugarcane quality in Brazil, as it is a parameter used to remunerate sugarcane producers for the quality of their production (Cardozo et al.) [45], so it is important to have adequate production management to improve sugarcane juice quality. Luz et al. [27] indicate that reducing soil preparation and controlling traffic are two of the most important pillars of reducing soil compaction and promoting the sustainability of sugarcane production in Brazil.
Figure 6. Sugarcane broth chemical evaluation (fresh matter) of total reducing sugars (TRS), crude protein (Protein), and apparent sucrose content (Pol) as a function of treatments: NT; MT; CT, and CTI. Means followed by the same letter do not differ by Tukey's test, at 5% significance. *ns indicates no difference between means.
Agronomy 13 00170 g006
Pol represents the sucrose content in sugarcane and is an important qualitative measure for harvest remuneration, as it can determine the potential for ethanol generation with the raw material obtained. In absolute terms, the lowest Pol obtained was 61.3% in CTI and 63.1% in CT. The conservationist managements MT and NT presented the highest absolute values of Pol, with 63.8 and 64.7%, respectively.
TRS total recoverable sugar contents were also higher in conservation systems, with 130.5 kg Mg−1 in MT and NT. The conventional preparation systems presented 129.6 and 126.9 kg Mg−1 for TC and CTI, respectively.

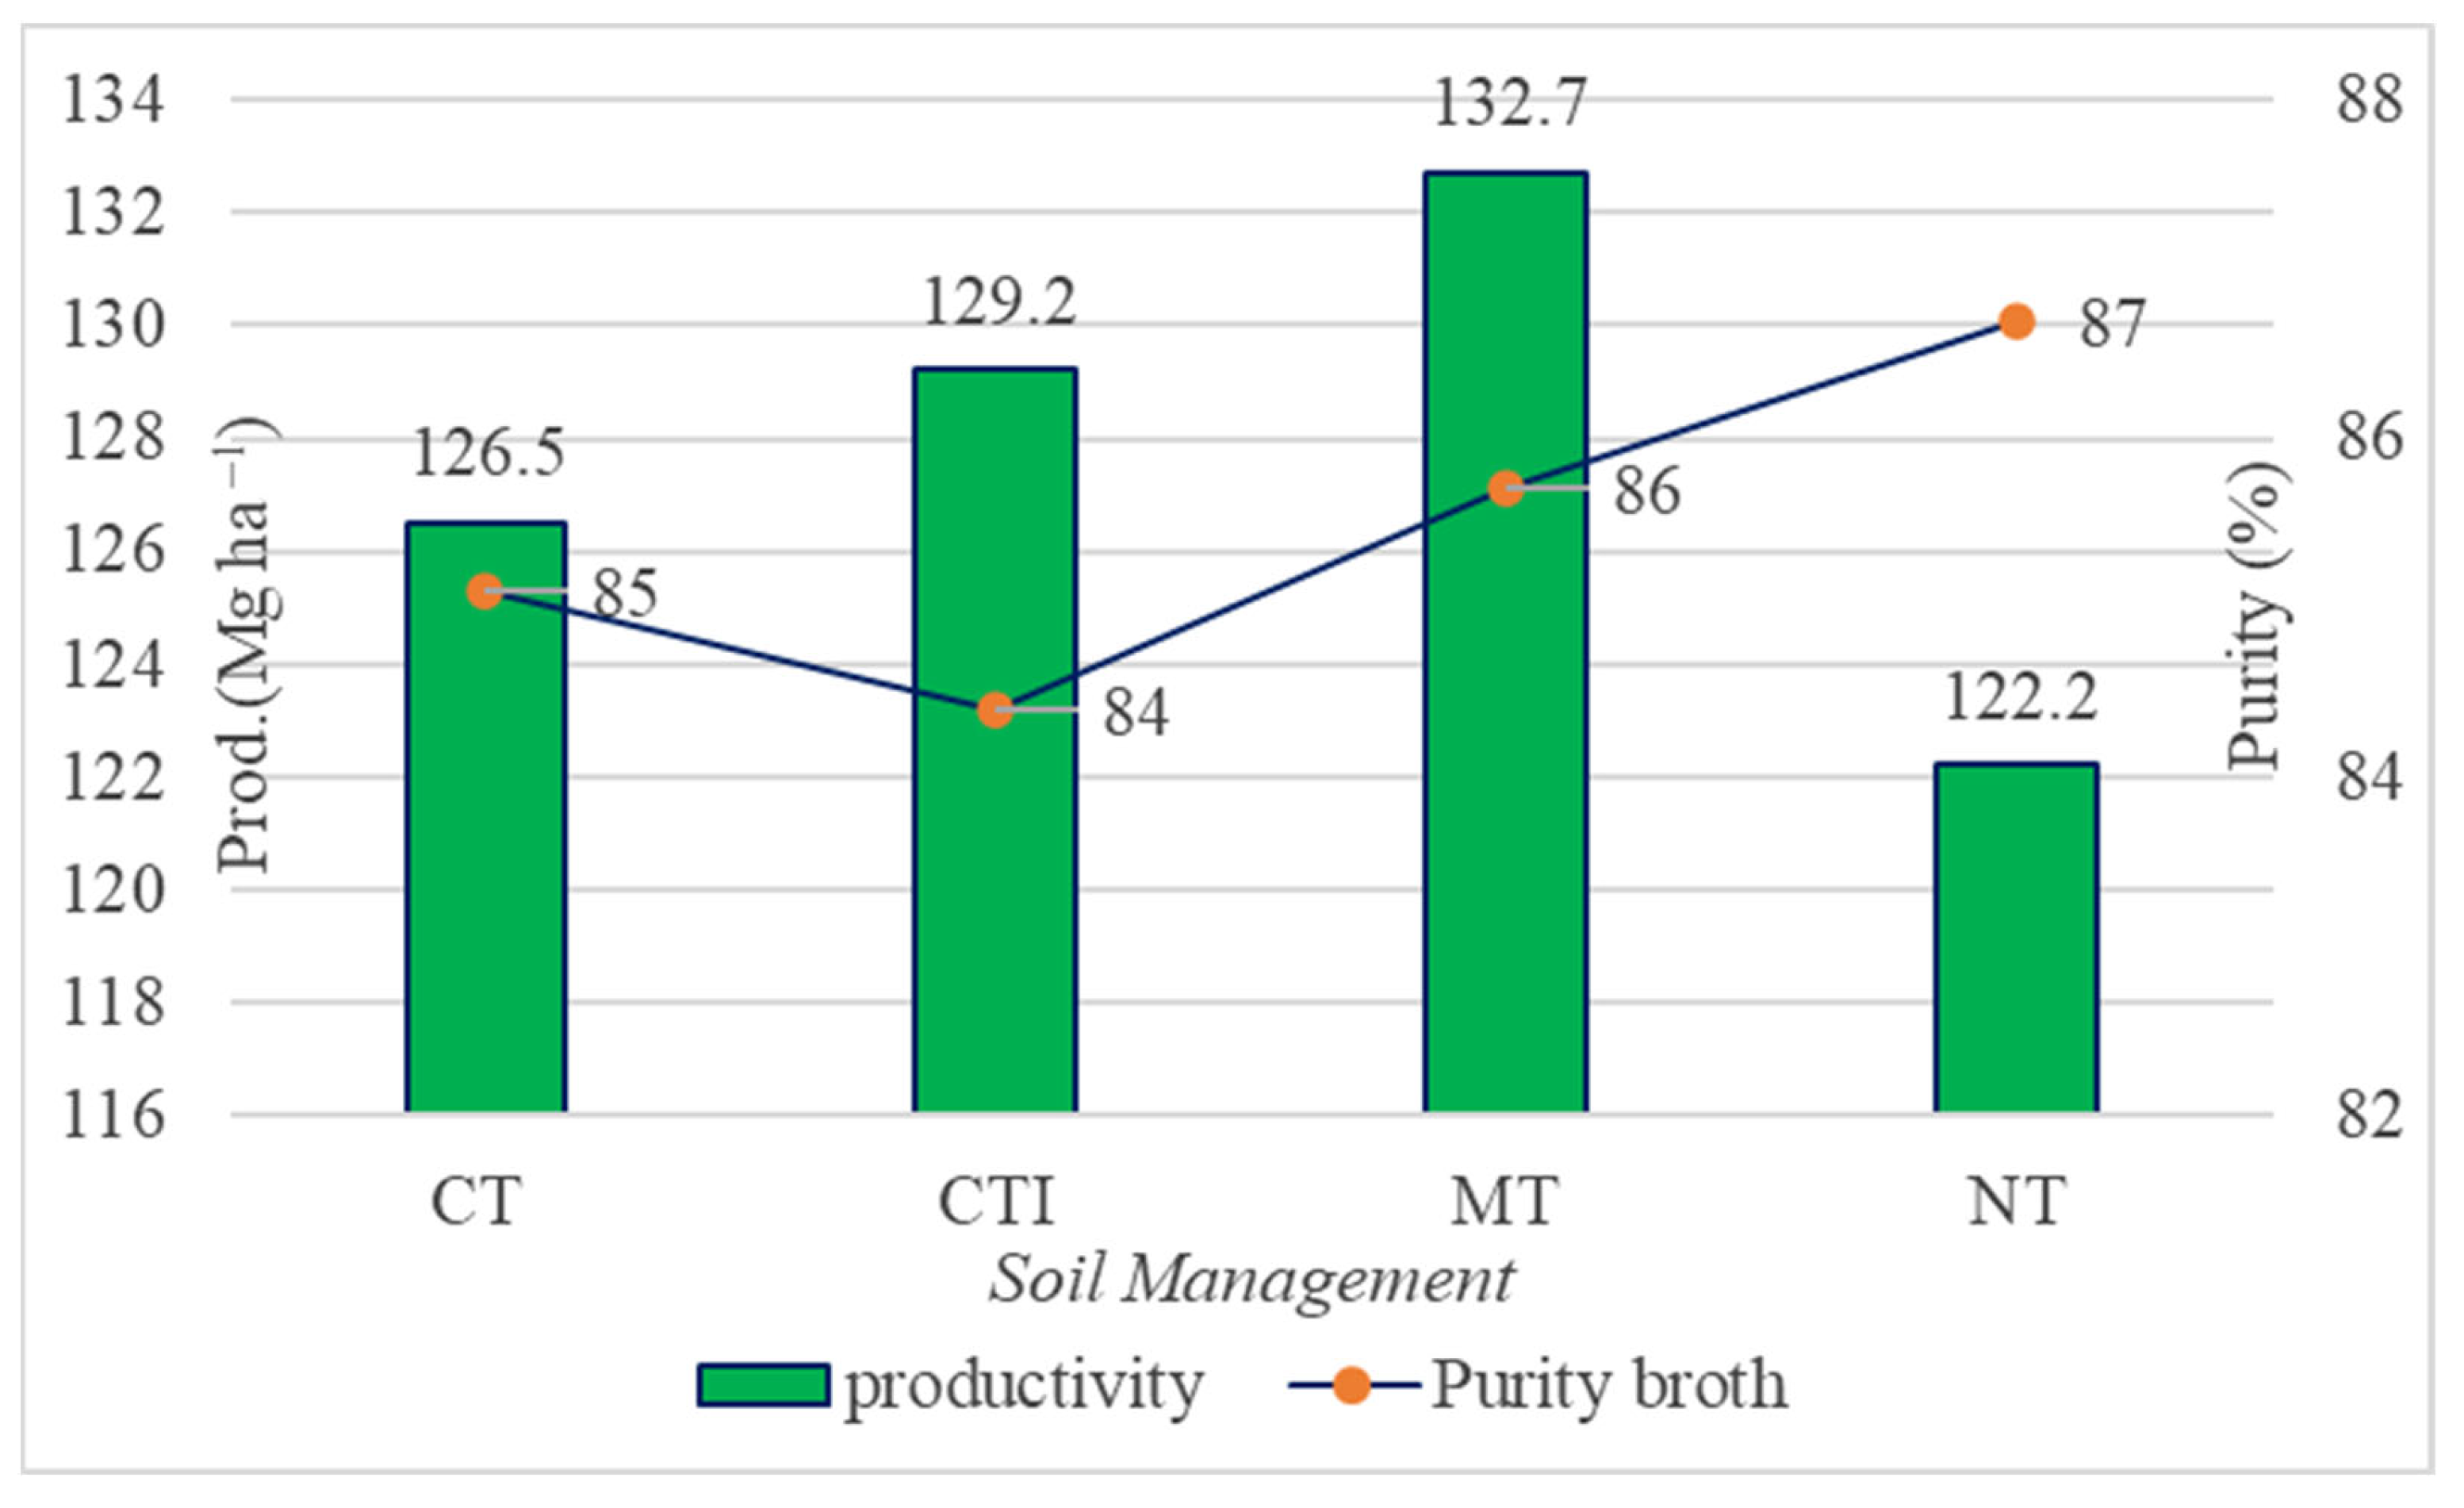
3.5. Sugarcane: Productivity and Broth Purity

The highest crop yields were obtained in the minimum soil tillage system (MT) with 132.7 Mg ha−1 followed by the conventional managements CTI (129.2 Mg ha−1) and CT (126.5 Mg ha−1). The broth purity characteristic was lower in conventional soil preparations and presented the highest values in conservation systems (Figure 7).
The NT treatment presented the highest broth purity index; however, the productivity of this treatment was the lowest among the other management modes. When compared to the highest yield (MT), NT yield was 8.5% lower; however, NT broth purity was 1.1% higher.
The minimum tillage showed the highest productivity of 132.7 Mg ha−1, and the other treatments showed a reduction in this value. The lowest productivity was expressed by NT, with 122.2 Mg ha−1. These differences in productivity can be justified based on soil preparation; that is, the use of a subsoiler in minimum tillage (MT) provided a soil breakdown in depth, in conventional preparations (CTI and CT) and no-tillage (NT) occurred a more superficial compaction respectively, which can promote greater root development and consequently impact productivity. Contrary to our results, Oliveira et al. [8] found an increase in productivity of 15 Mg ha−1 sugarcane in NT on soybean residue.
An increase in sugarcane productivity with deeper soil tillage was also found in the research by Marasca et al. [46] comparing conventional and deep soil tillage with different implements. Gomes et al. [47] state that the cultivation of sugarcane, due to its deep root system, often requires deeper soil preparation operations. Campos et al. [40] found better productive performance of sugarcane in deep soil tillage; the authors claim that the tillage model affects the number of stalks per hectare and, consequently, the sugar contents for the industry.
Figure 7. Sugarcane yield and purity of the broth (fresh matter).
Agronomy 13 00170 g007
Deep soil preparations can increase calcium and magnesium levels in depth, favoring the quality of industrial raw materials [4]. Furthermore, the root system and its volume affect nutrient absorption in water deficiency conditions, harming the crop’s development (Aquino et al.) [29] and productivity (Girardello) [48].
Although no-tillage has shown lower productivity, the use of this system can be advantageous from an economic point of view, as there is a reduction in energy expenditure in soil preparation and thus it becomes a viable alternative to sugarcane cultivation, as it presents stalk productivity similar to other soil preparations [49]. The costs involved in the soil preparation process can also impact the decision of which model to use (Souza et al.) [50], such as fuel consumption, which is one of the main costs involved, where Martins et al. [51], studying the fuel consumption between two soil preparation systems for planting sugarcane, found that in conventional soil preparation there is the highest fuel consumption due to the greater number of implements needed for the activity.

4. Conclusions

Sugarcane productive performance traits were significantly affected by soil tillage techniques. Higher fiber and protein contents were obtained in NT, MT and CT.
The PS, Brix, TRS and Pol values showed no difference between soil management. However, the highest absolute values were found in the NT, indicating that this conservationist management increases broth quality. The reduced tillage (MT) obtained the highest final productivity, surpassing the management’s lowest productivity (NT), with an increase of 10.5 Mg ha−1.
Among the management techniques, the traditional soil showed an advantage over the conservationist management when evaluating resistance to soil penetration. In all treatments, the compaction levels were concentrated in the surface layer of the soil. In addition, all adopted managements showed an increase in SPR above the critical value (2 MPa) of the control treatment.

Author Contributions

Conceptualization, M.B.M. and A.C.M.F.; methodology, M.B.M. and F.P.d.A.P.B.; software, A.C.M.F. and E.P.V.; validation, M.B.M., W.d.S.G.J., C.d.C.S. and A.C.M.F.; formal analysis, M.B.M., E.C., L.S.S. and K.G.P.d.S.; investigation, F.P.d.A.P.B. and M.B.M.; resources, E.P.V., C.d.C.S., E.C., M.B.M. and W.d.S.G.J.; data curation, L.S.S. and A.C.M.F.; writing—original draft preparation, M.B.M. and A.C.M.F.; writing—review and editing, M.B.M., L.S.S. and A.C.M.F.; visualization, K.G.P.d.S. and F.P.d.A.P.B.; supervision, M.B.M.; project administration, M.B.M. and E.P.V.; funding acquisition, M.B.M. and W.d.S.G.J. All authors have read and agreed to the published version of the manuscript.

Funding

This research received no external funding.

Conflicts of Interest

The authors declare no conflict of interest.

References

  1. Acompanhamento de Safra Brasileira de Cana-de-Açúcar; Companhia Nacional de Abastecimento—(CONAB): Brasília, Brazil, 2022.
  2. Cardoso, T.F.; Watanabe, M.D.B.; Souza, A.; Chagas, M.F.; Cavalett, O.; Morais, E.R.; Nogueira, L.A.H.; Leal, M.R.L.V.; Braunbeck, O.A.; Cortez, L.A.B.; et al. A regional approach to determine economic, environmental and social impacts of different sugarcane production systems in Brazil. Biomass Bioenergy 2019, 120, 9–20. [Google Scholar] [CrossRef]
  3. Silva, W.M.; Bianchini, A.; Cunha, C.A.D. Modeling and correction of soil penetration resistance for variations in soil moisture and soil bulk density. Eng. Agric. 2016, 36, 449–459. [Google Scholar] [CrossRef] [Green Version]
  4. Campos, M.; Rossato, O.B.; Marasca, I.; Martello, J.M.; de Siqueira, G.F.; Garcia, C.P.; Rossetto, R.; Calonego, J.C.; Cantarella, H.; Crusciol, C.A.C. Deep tilling and localized liming improve soil chemical fertility and sugarcane yield in clayey soils. Soil Tillage Res. 2022, 222, 105425. [Google Scholar] [CrossRef]
  5. Farhate, C.V.V.; de Souza, Z.M.; Cherubin, M.R.; Lovera, L.H.; de Oliveira, I.N.; da Guimarães Júnnyor, W.S.; La Scala Junior, N. Soil physical change and sugarcane stalk yield induced by cover crop and soil tillage. Rev. Bras. Cienc. Solo 2022, 46, e0210123. [Google Scholar] [CrossRef]
  6. Lima, C.C.; De Maria, I.C.; da Silva Guimarães Júnnyor, W.; Figueiredo, G.C.; Dechen, S.C.F.; Bolonhezi, D. ROOT parameters of sugarcane and soil compaction indicators under deep strip tillage and conventional tillage. Sci. Rep. 2022, 12, 18537. [Google Scholar] [CrossRef]
  7. Luz, F.B.; Carvalho, M.L.; Castioni, G.A.F.; de Oliveira Bordonal, R.; Cooper, M.; Carvalho, J.L.N.; Cherubin, M.R. Soil structure changes induced by tillage and reduction of machinery traffic on sugarcane—A diversity of assessment scales. Soil Tillage Res. 2022, 223, 105469. [Google Scholar] [CrossRef]
  8. De Oliveira, I.N.; de Souza, Z.M.; Bolonhezi, D.; Totti, M.C.V.; de Moraes, M.T.; Lovera, L.H.; de Lima, E.S.; Esteban, D.A.A.; Oliveira, C.F. Tillage systems impact on soil physical attributes, sugarcane yield and root system propagated by pre-sprouted seedlings. Soil Tillage Res. 2022, 223, 105460. [Google Scholar] [CrossRef]
  9. Olubanjo, O.O.; Yessoufou, M.A. Effect of Soil Compaction on the Growth and Nutrient Uptake of Zea mays L. Sustain. Agric. Res. 2019, 8, 46. [Google Scholar] [CrossRef] [Green Version]
  10. Hargreaves, P.R.; Baker, K.L.; Graceson, A.; Bonnett, S.; Ball, B.C.; Cloy, J.M. Soil compaction effects on grassland silage yields and soil structure under different levels of compaction over three years. Eur. J. Agron. 2019, 109, 125916. [Google Scholar] [CrossRef]
  11. De Bordonal, R.O.; Carvalho, J.L.N.; Lal, R.; de Figueiredo, E.B.; de Oliveira, B.G.; La Scala, N. Sustainability of sugarcane production in Brazil. A review. Agron. Sustain. Dev. 2018, 38, 13. [Google Scholar] [CrossRef]
  12. Farhate, C.V.V.; de Souza, Z.M.; Cherubin, M.R.; Lovera, L.H.; de Oliveira, I.N.; Carneiro, M.P.; La Scala, N. Abiotic soil health indicators that respond to sustainable management practices in sugarcane cultivation. Sustainability 2020, 12, 9407. [Google Scholar] [CrossRef]
  13. Da Silva Farias, P.G.; da Silva Souza, C.B.; Rosset, J.S.; Ozório, J.M.B.; Panachuki, E.; Schiavo, J.A.; Lima, P.R.; Marra, L.M. Physical fractions of organic matter and mineralizable soil carbon as quality indicators in areas under different forms of use in the Cerrado-Pantanal Ecotone. Environ. Monit. Assess. 2022, 194. [Google Scholar] [CrossRef]
  14. Moitinho, M.R.; Padovan, M.P.; Panosso, A.R.; Scala Junior, N.L. Efeito Do Uso Anterior Do Solo E Da Calagem No Potêncial De Sequestro De Co 2 Do Sistema Plantio Direto. Rev. Bras. Ciência Solo 1998, 2, 2–3. [Google Scholar]
  15. Souza, C.M.A.; Suárez, A.H.T.; Arcoverde, S.N.S.; Armando, E.J.; Maciak, P.A.G. Least limiting water range in Oxisol under two conservation tillage systems in sugarcane farming. Rev. Ceres 2022, 69, 586–593. [Google Scholar] [CrossRef]
  16. Marques Filho, A.C.; de Medeiros, S.D.S.; Martins, M.B.; dos Santos Moura, M.; Lanças, K.P. Can the Straw Remaining on the Ground Reduce the Wheelsets Impact on Sugarcane Crop? Sugar Tech. 2022, 24, 1814–1820. [Google Scholar] [CrossRef]
  17. De Dias Júnior, M.S.; de Oliveira, L.F.C.; de Castro, M.B.; de Oliveira, G.C.; de Costa, K.A.P.; da Severiano, E.C. Compactação de solos cultivados com cana-de-açúcar: I -modelagem e quantificação da compactação adicional após as operações de colheita. Eng. Agrícola 2010, 30, 404–413. [Google Scholar]
  18. Thomaz, E.L.; Marcatto, F.S.; Antoneli, V. Soil erosion on the Brazilian sugarcane cropping system: An overview. Geogr. Sustain. 2022, 3, 129–138. [Google Scholar] [CrossRef]
  19. Santos, H.G.; Jacomine, P.K.T.; Anjos, L.H.C.; Oliveira, V.Á.; Lumbreras, J.F.; Coelho, M.R.; Almeida, J.A.; de Filho, J.C.A.; Oliveira, J.B.; Cunha, T.J.F. Sistema Brasileiro de Classificação de Solos; Centro Nacional de Pesquisa de Solos: Rio de Janeiro, Brazil, 2018; ISBN 978-85-7035-198-2.
  20. Staff, S.S. Keys to Soil Taxonomy; Government Printing Office: Washingthon, DC, USA, 2014.
  21. Alvares, C.A.; Stape, J.L.; Sentelhas, P.C.; De Moraes Gonçalves, J.L.; Sparovek, G. Köppen’s climate classification map for Brazil. Meteorol. Zeitschrift 2013, 22, 711–728. [Google Scholar] [CrossRef]
  22. Consecana Conselho dos Produtores de Cana-de-Açúcar, Açúcar e Álcool do Estado de São Paulo. In Manual de Instruções, 5th ed.; Consecana-SP: Piracicaba, Brazil, 2006.
  23. Ohashi, A.Y.P.; de Matos Pires, R.C.; Ribeiro, R.V.; de Oliveira Silva, A.L.B. Root growth and distribution in sugarcane cultivars fertigated by a subsurface drip system. Bragantia 2015, 74, 131–138. [Google Scholar] [CrossRef] [Green Version]
  24. De Sá, M.A.C.; dos Santos Junior, J.d.D.G.; Franz, C.A.B.; Rein, T.A. Qualidade física do solo e produtividade da cana-de-açúcar com uso da escarificação entre linhas de plantio. Pesqui. Agropecu. Bras. 2016, 51, 1610–1622. [Google Scholar] [CrossRef] [Green Version]
  25. Taylor, H.M.; Brar, G.S. Effect of soil compaction on root development. Soil Tillage Res. 1991, 19, 111–119. [Google Scholar] [CrossRef]
  26. Arcoverde, S.N.S.; de Souza, C.M.A.; Cortez, J.W.; Maciak, P.A.G.; Suárez, A.H.T. Soil physical attributes and production components of sugarcane cultivars in conservationist tillage systems. Eng. Agric. 2019, 39, 216–224. [Google Scholar] [CrossRef]
  27. Luz, F.B.; Castioni, G.A.F.; Tormena, C.A.; dos Santos Freitas, R.; Carvalho, J.L.N.; Cherubin, M.R. Soil tillage and machinery traffic influence soil water availability and air fluxes in sugarcane fields. Soil Tillage Res. 2022, 223. [Google Scholar] [CrossRef]
  28. Costa, L.G.; Marin, F.R.; Nassif, D.S.P.; Pinto, H.M.S.; Lopes-Assad, M.L.R.C. Simulação do efeito do manejo da palha e do nitrogênio na produtividade da cana-de-açúcar. Rev. Bras. Eng. Agrícola Ambient. 2014, 18, 469–474. [Google Scholar] [CrossRef] [Green Version]
  29. Aquino, G.S.; De Conti Medina, C.; Junior, A.L.P.; Santos, L.O.; Cunha, A.C.B.; Kussaba, D.A.O.; Dos Santos Júnior, J.H.; Almeida, L.F.; Santiago, A.D. Sistema radicular e produtividade de soqueiras de cana-de-açúcar sob diferentes quantidades de palhada. Pesqui. Agropecu. Bras. 2015, 50, 1150–1159. [Google Scholar] [CrossRef] [Green Version]
  30. Tormena, C.A.; Silva, A.P.; Libardi, P.L. Caracterização do intervalo hídrico ótimo de um latossolo roxo sob plantio direto. Rev. Bras. Ciência Solo 1998, 22, 573–581. [Google Scholar] [CrossRef]
  31. Assis, R.L.; Lazarini, G.D.; Lanças, K.P.; Filho, A.C. Evaluation of soil resistance to penetration in different soils with varying moisture contents. Eng. Agric. 2009, 29, 558–568. [Google Scholar] [CrossRef] [Green Version]
  32. Castioni, G.A.F.; Cherubin, M.R.; de Bordonal, R.O.; Barbosa, L.C.; Menandro, L.M.S.; Carvalho, J.L.N. Straw Removal Affects Soil Physical Quality and Sugarcane Yield in Brazil. Bioenergy Res. 2019, 12, 789–800. [Google Scholar] [CrossRef]
  33. Beutler, A.N.; Silva, M.L.N.; Curi, N.; Ferreira, M.M.; Cruz, J.C.; Pereira Filho, I.A. Resistência à penetração e permeabilidade de latossolo vermelho distrófico típico sob sistemas de manejo na região dos cerrados. Rev. Bras. Ciência Solo 2001, 25, 167–177. [Google Scholar] [CrossRef] [Green Version]
  34. Cavichioli, F.A.; Fulani, C.E.A.; Toledo, A.; Silva, R.P.; Ribeiro, C.A. Resistência Mecânica Do Solo À Penetração Na Fileira E Entrefileira De Canade- Açúcar Em Função Da Mecanização. Rev. Eng. Na Agric.—Reveng. 2012, 20, 46–51. [Google Scholar] [CrossRef]
  35. Aguilera Esteban, D.A.; de Souza, Z.M.; Tormena, C.A.; Lovera, L.H.; de Souza Lima, E.; de Oliveira, I.N.; de Paula Ribeiro, N. Soil compaction, root system and productivity of sugarcane under different row spacing and controlled traffic at harvest. Soil Tillage Res. 2019, 187, 60–71. [Google Scholar] [CrossRef]
  36. Cavalieri, K.M.V.; da Silva, Á.P.; Arvidsson, J.; Tormena, C.A. Influência da carga mecânica de máquina sobre propriedades físicas de um cambissolo háplico. Rev. Bras. Ciência Solo 2009, 33, 477–485. [Google Scholar] [CrossRef]
  37. Silva, S.D.A.; Lima, J.S.D.S.; Xavier, A.C.; Teixeira, M.M. Variabilidade espacial de atributos químicos de um Latossolo Vermelho-Amarelo cultivado em plantio direto. Rev. Cienc. Agron. 2013, 44, 16–23. [Google Scholar] [CrossRef]
  38. Santos, F.; Rosas, J.; Martins, R.; Araújo, G.; Viana, L.; Gonçalves, J. Quality assessment of coffee beans through computer vision and machine learning algorithms. Coffee Sci. 2020, 15, e151752. [Google Scholar] [CrossRef]
  39. Otto, R.; Silva, A.P.; Franco, H.C.J.; Oliveira, E.C.A.; Trivelin, P.C.O. High soil penetration resistance reduces sugarcane root system development. Soil Tillage Res. 2011, 117, 201–210. [Google Scholar] [CrossRef]
  40. Campos, M.; Martello, J.M.; de Siqueira, G.F.; Garcia, A.; Scudeletti, D.; Dias, P.P.; Rossetto, R.; Calonego, J.C.; Cantarella, H.; Crusciol, C.A.C. Lime Rate in Clayey Soils Influences Chemical Fertility and Sugarcane Yield. Plants 2022, 11, 2110. [Google Scholar] [CrossRef]
  41. Bernardes, M.S.; de Castro Belardo, G. Espaçamentos Para a Cultura da Cana de Açúcar 2006. Available online: https://edisciplinas.usp.br/pluginfile.php/4318454/mod_resource/content/1/Bernardes%20%20Belardo%202015%20Espa%C3%A7amento%20cana.pdf (accessed on 18 October 2022).
  42. Mancini, M.C.; Leite, D.C.; Perecin, D.; Bidóia, M.A.P.; Xavier, M.A.; Landell, M.G.A.; Pinto, L.R. Characterization of the Genetic Variability of a Sugarcane Commercial Cross Through Yield Components and Quality Parameters. Sugar Tech. 2012, 14, 119–125. [Google Scholar] [CrossRef]
  43. Souza, A.P.; Grandis, A.; Leite, D.C.C.; Buckeridge, M.S. Sugarcane as a Bioenergy Source: History, Performance, and Perspectives for Second-Generation Bioethanol. Bioenergy Res. 2014, 7, 24–35. [Google Scholar] [CrossRef]
  44. Colombi, T.; Keller, T. Developing strategies to recover crop productivity after soil compaction—A plant eco-physiological perspective. Soil Tillage Res. 2019, 191, 156–161. [Google Scholar] [CrossRef]
  45. Cardozo, N.P.; Sentelhas, P.C.; Panosso, A.R.; Palhares, A.L.; Ide, B.Y. Modeling sugarcane ripening as a function of accumulated rainfall in Southern Brazil. Int. J. Biometeorol. 2015, 59, 1913–1925. [Google Scholar] [CrossRef]
  46. Marasca, I.; Gladenucci, J.; Spadim, E.R.; Barbosa, R.D.; Lanças, K.P. Geoestatística Aplicada Na Determinação Da Compactação Do Solo No Cultivo Da Cana-De-Açúcar. Rev. Agric. Neotrop. 2017, 4, 49–55. [Google Scholar] [CrossRef] [Green Version]
  47. Gomes de Sousa, S.F.; Marasca, I.; Paludo, V.; Arbex Silva, P.R.; Lanças, K.P. Produtividade Da Cultura De Cana De Açúcar Com E Sem a Aplicação De Fósforo Em Profundidade Utilizando Equipamento De Preparo Profundo Mecanizado. Energ. Na Agric. 2015, 30, 276. [Google Scholar] [CrossRef]
  48. Girardello, V.; Amado, T. Revista A Granja; Editora Centaurus: Porto Alegre, Brazil, 2021; pp. 1–4. [Google Scholar]
  49. De Moraes, E.R.; da Silva Domingues, L.A.; Medeiros, M.H.; Peixoto, J.V.M.; Lana, R.M.Q. Produtividade E Características Agronômicas Da Cana-De-Açúcar Em Diferentes Sistemas De Preparo Do Solo. Rev. Agric. Neotrop. 2016, 3, 27–32. [Google Scholar] [CrossRef] [Green Version]
  50. Souza, F.C.A.; Fernandes, M.M.H.; Coelho, A.P.; Pinheiro, D.P.; Perecin, D.; Fernandes, C. Do Alterations in Soil Physical Attributes Resulting from Chiseling Persist after Sugarcane Planting? Commun. Soil Sci. Plant Anal. 2022, 53, 521–532. [Google Scholar] [CrossRef]
  51. Martins, M.B.; de Almeida Prado Bortolheiro, F.P.; Testa, J.V.P.; Sartori, M.M.P.; Crusciol, C.A.C.; Lanças, K.P. Fuel Consumption Between Two Soil Tillage Systems for Planting Sugarcane. Sugar Tech. 2021, 23, 219–224. [Google Scholar] [CrossRef]
Figure 1. Research procedure, treatments, and response variables.
Agronomy 13 00170 g001
Figure 3. SPR inter rows of sugarcane (traffic line) at different soil depths for treatments: control (Ctrl); no-tillage (NT); minimum cultivation (MT); conventional preparation (CT), and conventional preparation I (CTI). In the boxes next to the graph, means followed by the same letter for each depth interval do not differ by Tukey’s test, at 5% significance.
Agronomy 13 00170 g003
Disclaimer/Publisher’s Note: The statements, opinions and data contained in all publications are solely those of the individual author(s) and contributor(s) and not of MDPI and/or the editor(s). MDPI and/or the editor(s) disclaim responsibility for any injury to people or property resulting from any ideas, methods, instructions or products referred to in the content.

