Article

Responses of the Growth Characteristics of Spinach to Different Moisture Contents in Soil under Irrigation with Magnetoelectric Water

State Key Laboratory of Eco-hydraulics in Northwest Arid Region of China, Xi’an University of Technology, Xi’an 710048, China
*
Authors to whom correspondence should be addressed.
Agronomy 2023, 13(3), 657; https://doi.org/10.3390/agronomy13030657
Submission received: 30 December 2022 / Revised: 19 February 2023 / Accepted: 20 February 2023 / Published: 24 February 2023
(This article belongs to the Special Issue Water Saving in Irrigated Agriculture)

Abstract

:
Spinach (Spinacia oleracea L.) is a worldwide vegetable crop with rich nutritional value, and drought is the main factor restricting its growth. Magnetized water and de-electronated water have shown potential for improving yield and quality in some crops. To assess the influence of magnetized-de-electronated water (denoted magnetoelectric water) on the growth characteristics of spinach, five soil moisture gradients were developed, including 45–55%, 55–65%, 65–75%, 75–85%, and 85–95% of field capacity (FC). The results demonstrated that the influence of irrigation by magnetoelectric water on the growth of spinach was obvious. All the spinach indicators with each soil moisture gradient under irrigation by magnetoelectric water were higher than those of irrigation by conventional water, including the fresh weight of shoots, chlorophyll content, and the total nitrogen content in the leaves. In particular, the improvement in fresh weight of shoots and the total nitrogen contents in the leaves had the highest values, as demonstrated by increases of 52.26% and 25.87%, respectively, under 65–75% of the gradient of FC. Additionally, the fitting results of the photo response curve by different light response models varied. The modified rectangular hyperbolic model was the most accurate for all the treatment groups and thus was the optimized model for the photosynthetic characteristics of spinach under irrigation by magnetoelectric water analysis. The parameters of the photo response curve showed that the dark respiration rate, apparent quantum efficiency, light saturation point, and maximum net photosynthetic rate all increased following irrigation by magnetoelectric water with different soil moisture gradients compared with conventional water irrigation. These research results can provide new technical support for improving the water use efficiency of irrigation water and increasing vegetable production.

1. Introduction

A shortage of water resources is a prominent problem in agricultural production worldwide, particularly in arid and semiarid regions, where agricultural irrigation and water usage frequently exceed the sustainable supply [1]. To improve the efficiency of the production of agricultural water resources, many researchers have conducted extensive and in-depth studies. Irrigation water activation technology, including magnetization and de-electronation treatments, has attracted the extensive attention of researchers owing to its use of simple equipment, low energy consumption and investment, lack of pollution, and high efficiency.
In 1930, Savostin first reported that the magnetic field could promote the growth of crop seedlings [2]. Indeed, treatment by magnetic fields could promote the growth and development of crop roots and has a greater effect on roots than shoots [3,4]. Nevertheless, it was difficult to directly apply a magnetic field to field production, while the treatment of irrigation water by a magnetic field was relatively convenient and effective. In a fixed magnetic field environment formed by permanent magnets or electromagnets, conventional water passes along the direction perpendicular to the magnetic field line at a certain flow rate. Conventional water that changes its physical and chemical properties owing to the treatment by a magnetic field is called magnetized water. The results of a study by Abdulrahman et al. showed that magnetized irrigation water could significantly promote an increase in the Pennisetum glaucum leaf area and increase the chlorophyll content [5]. Zareei et al. demonstrated that the use of magnetized water irrigation by conventional water could stimulate the biosynthesis of phenolic compounds in grape (Vitis vinifera) plants [6], which could strengthen the physiological and metabolic functions of crops. Mohammadi et al. found that magnetized water was able to improve the leaf area index, relative leaf water content, and the special product analysis division (SPAD) index of vegetation (i.e., Nitraria, Haloxylon, and Atriplex) in the arid region of northeastern Iran [7]. The results obtained by Li et al. showed that magnetized water irrigation effectively enhanced root growth, the root−shoot ratio, and water use efficiency of soybean, and alleviated the negative effects of drought stress under severe drought conditions [8]. Wang et al. reported that magnetized water irrigation improved plant height, leaf area, aboveground biomass, and photosynthetic characteristics of winter wheat at various growth stages [9]. Additionally, de-electronated water refers to the ground wire on the metal pipe; when the water flows through the metal pipe, a certain number of electrons in the water body are enriched on the pipe wall, and they are introduced into the ground through the ground wire to change the physical and chemical properties of the irrigation water [10]. De-electronated water treatment has been proposed by the ECO1ST Technology Group (Huntington Beach, CA, USA) and is widely applied in industrial water-oil separation [11], while its application in agriculture has also recently attracted attention. It is primarily used to neutralize the high salinity of poor-quality irrigation water, thereby reducing the adverse effects of irrigation with poor-quality water on crops and promoting crop growth. The results obtained by Wang et al. indicated that de-electronated brackish water could increase the absorption rate of the Philip infiltration formula, the saturated water conductivity of the Green-Ampt infiltration formula, and the suction power at the wet front, and significantly improved the water holding efficiency of soil and the leaching effect of upper soil salt [12].
To sum up, magnetized and de-electronated water irrigation is effective in promoting the growth of different crops. However, because magnetized or de-electronated water has a short maintenance time after its physical and chemical properties are changed, the continuous effect on the whole crop growth process is not as good as the combined treatment of the two [13,14]. Further analysis should be required for the effects of irrigation water treated with a combination of magnetization and de-energization on crop growth. Spinach (Spinacia oleracea L.) not only requires a large amount of water but is also very sensitive to moisture [15], so it is suitable as the test material for this experiment. Therefore, taking spinach as the research object, this study aims to clarify the response law of spinach growth to different soil moisture contents under magnetoelectric water irrigation, explore the influence mechanism of magnetoelectric water irrigation on spinach productivity, and provide a theoretical basis for magnetoelectric water irrigation of spinach crops.

2. Materials and Methods

2.1. Study Site and Soil Description

The experiment was carried out in the artificial climate greenhouse of Xi’an University of Science and Technology. The daytime temperature (8:00–18:00) was set to 25 °C, the night temperature (18:00–8:00) was set to 15 °C, the humidity was 50%, and the light was set to 40 Klux. The test soil samples were collected from Yangling, Shaanxi Province, and 0–20 cm topsoil of farmland soil was collected. A Mastersizer 2000 laser particle size analyzer (Malvern Instrument Co., Ltd., Shanghai, China) was used to determine the physical sand and silt volume fractions of the soil samples, which were 36.3% and 53.31%, respectively. According to the international soil texture classification standard, the soil sample was determined to be silty loam, and the mass field water holding capacity was 30%. The tested spinach seeds were Dayu ideal No. 1 (Hebei Dayu Seed Industry Co., Ltd; Cangzhou, Hebei, China). The pot experiment was conducted with 1.2 kg soil in each pot, and urea (150 mg·kg−1 nitrogen), phosphorus dioxide (75 mg·kg−1 phosphorus), and potassium sulfate (75 mg·kg−1 potassium) were applied to the basal fertilizer, respectively. Six spinach seeds were planted in each pot. Three seedlings with the same growth vigor were retained in each pot at the four-leaf stage, and three replicates were set for each treatment.
Irrigation water was divided into two groups: conventional water (CK) and magnetoelectric water (MD). Soil moisture content was controlled at 45–55%, 55–65%, 65–75%, 75–85%, and 85–95% of field capacity (FC) by the daily weighing method, respectively. A total of 10 treatments (Table 1) were repeated three times. The conventional water flowed through the permanent magnet (Baotou Xinda Magnetic Material Factory; Baotou, Inner Mongolia, China) with a magnetic field intensity of 3000 Gs at a fixed flow rate (0.5 m·s−1), so that the conventional water was magnetized and flowed into the de-electronation device. The device exported the electrons in the magnetized water through the grounding resistance of the external connection, so as to complete the preparation of magnetoelectric water.

2.2. Determination Content and Method

The measurement method of spinach aboveground fresh weight (FWA): the fresh weight of the aboveground part of each treatment group was measured by an electronic scale (precision 0.01 g) during the harvest period.
The total nitrogen measurement method of spinach leaves (LTN): during the harvest period, the sample was dried, ground, and passed through a 0.2 mm sieve, and the LTN was determined by the salicylic acid-zinc powder reduction method.
The measurement method of spinach chlorophyll content: 0.5 g spinach leaves were weighed, and 100 mL extract (acetone:ethanol = 1:1, v/v) was added. The absorbance (A) values were measured by a UV spectrophotometer at 663 nm and 645 nm, respectively. The calculation method of chlorophyll mass fraction was as follows [16]:
ω a = ( 12.70 A 663 2.69 A 645 ) V m × 1000
ω b = ( 22.90 A 645 4.68 A 663 ) V m × 1000
ω T = ( 20.21 A 645 + 8.02 A 663 ) V m × 1000
where V is the extraction volume, mL; m is the fresh weight of the sample; ωa is the mass fraction of chlorophyll a (Chl a); ωb is the mass fraction of chlorophyll b (Chl b); ωT is the total chlorophyll mass fraction (Chl a + b).
The measurement method of the light response characteristics of spinach was as follows: During the vegetative growth period of spinach, the sunny weather was selected, and the observation time was 09:00−11:00. Each treatment randomly selected spinach leaves with good growth and fully expanded upper part for observation. Each leaf was observed three times and the average value was taken. The net photosynthetic rate, stomatal conductance, and intercellular CO2 concentration of spinach leaves under different photosynthetically active radiation gradients were measured with the red and blue light source of the LC-pro portable photosynthesis instrument. The illumination range set a 15 light intensity gradient, due to the need for light induction in the measurement process, so according to 2500, 2200, 2000, 1800, 1600, 1400, 1200, 1000, 800, 600, 400, 200, 100, 50, and 0 µmol m−2·s−1 order for the automatic recording of data. According to the net photosynthetic rate under different photosynthetically active radiation, the light response curve of the photosynthetic rate could be plotted to determine the apparent quantum efficiency (α), maximum net photosynthetic rate (Pnmax), light compensation point (Ic), light saturation point (Is) and dark respiration rate (Rd) of spinach.

2.3. Models Used

2.3.1. Logistic Model

The logistic model was used to fit the fresh weight of aboveground parts of spinach:
F W A = F W A max 1 + e A - B t
where FWA is the fresh weight of the aboveground part; FWAmax is the theoretical maximum of aboveground fresh weight; and A, B are fitting parameters.
The relationship (v) between the growth rate of the aboveground fresh weight and time and the maximum growth rate (vmax) were obtained by derivation of Equation (4):
v = F W A max B e A B t ( 1 + e A B t ) 2
v max = F W A max B 4

2.3.2. Light Response Model

In this paper, four models were used to simulate and analyze the light response curve of spinach. The specific model formula was as given below.
The theoretical formula of the rectangular hyperbolic model [17]:
P n = α I P n max α I + P n max R d
The calculation formula of the light compensation point (Ic):
I c = R d P n max α ( P n max - R d )
The line y = Pnmax intersects with the line y = αI − Rd, and the value of x axis corresponding to the intersection point is the light saturation point (Is).
The theoretical formula of the modified rectangular hyperbolic model:
P n = α 1 β I 1 + γ I ( I I c )
where β is the photoinhibition coefficient and γ is the coefficient independent of I.
For I = 0, the dark respiration rate (Rd):
R d = P n ( I = 0 ) = α I c
The light saturation point (Is):
I s a t = α ( β + γ ) ( 1 + γ I c ) / β 1 γ
The maximum net photosynthetic rate (Pnmax):
P n max = α 1 β I s a t 1 + γ I s a t ( I s a t I c )
The theoretical formula of the non−rectangular hyperbolic model [18]:
P n = α I + P n max ( α I + P n max ) 2 4 I α k P n max 2 k R d
where k is the curve angle of the light response curve.
The light compensation point (Ic):
I c = R d P n max k R d 2 α ( P n max R d )
The line y = Pnmax intersects with the line y = α − Rd, and the value of x axis corresponding to the intersection point is the light saturation point (Is).
The theoretical formula of the exponential model [19]:
P n = p n max ( 1 e α I P n max ) R d
When Is is estimated, it is assumed that the light intensity corresponding to Pn of 0.99Pnmax is the saturated light intensity.

2.4. Data Processing

The experimental data were processed and mapped by Microsoft Office 2016 (Redmond, Washington, DC, USA; Microsoft), while Origin 2021 (Northampton, MA, USA; OriginLab Corporation) and IBM SPSS Statistics 25 (Armonk, NY, USA; IBM Corp) were used for fitting and statistical analysis of model parameters, and the LSD method was used for the explicitness test (p < 0.05).

3. Results and Analysis

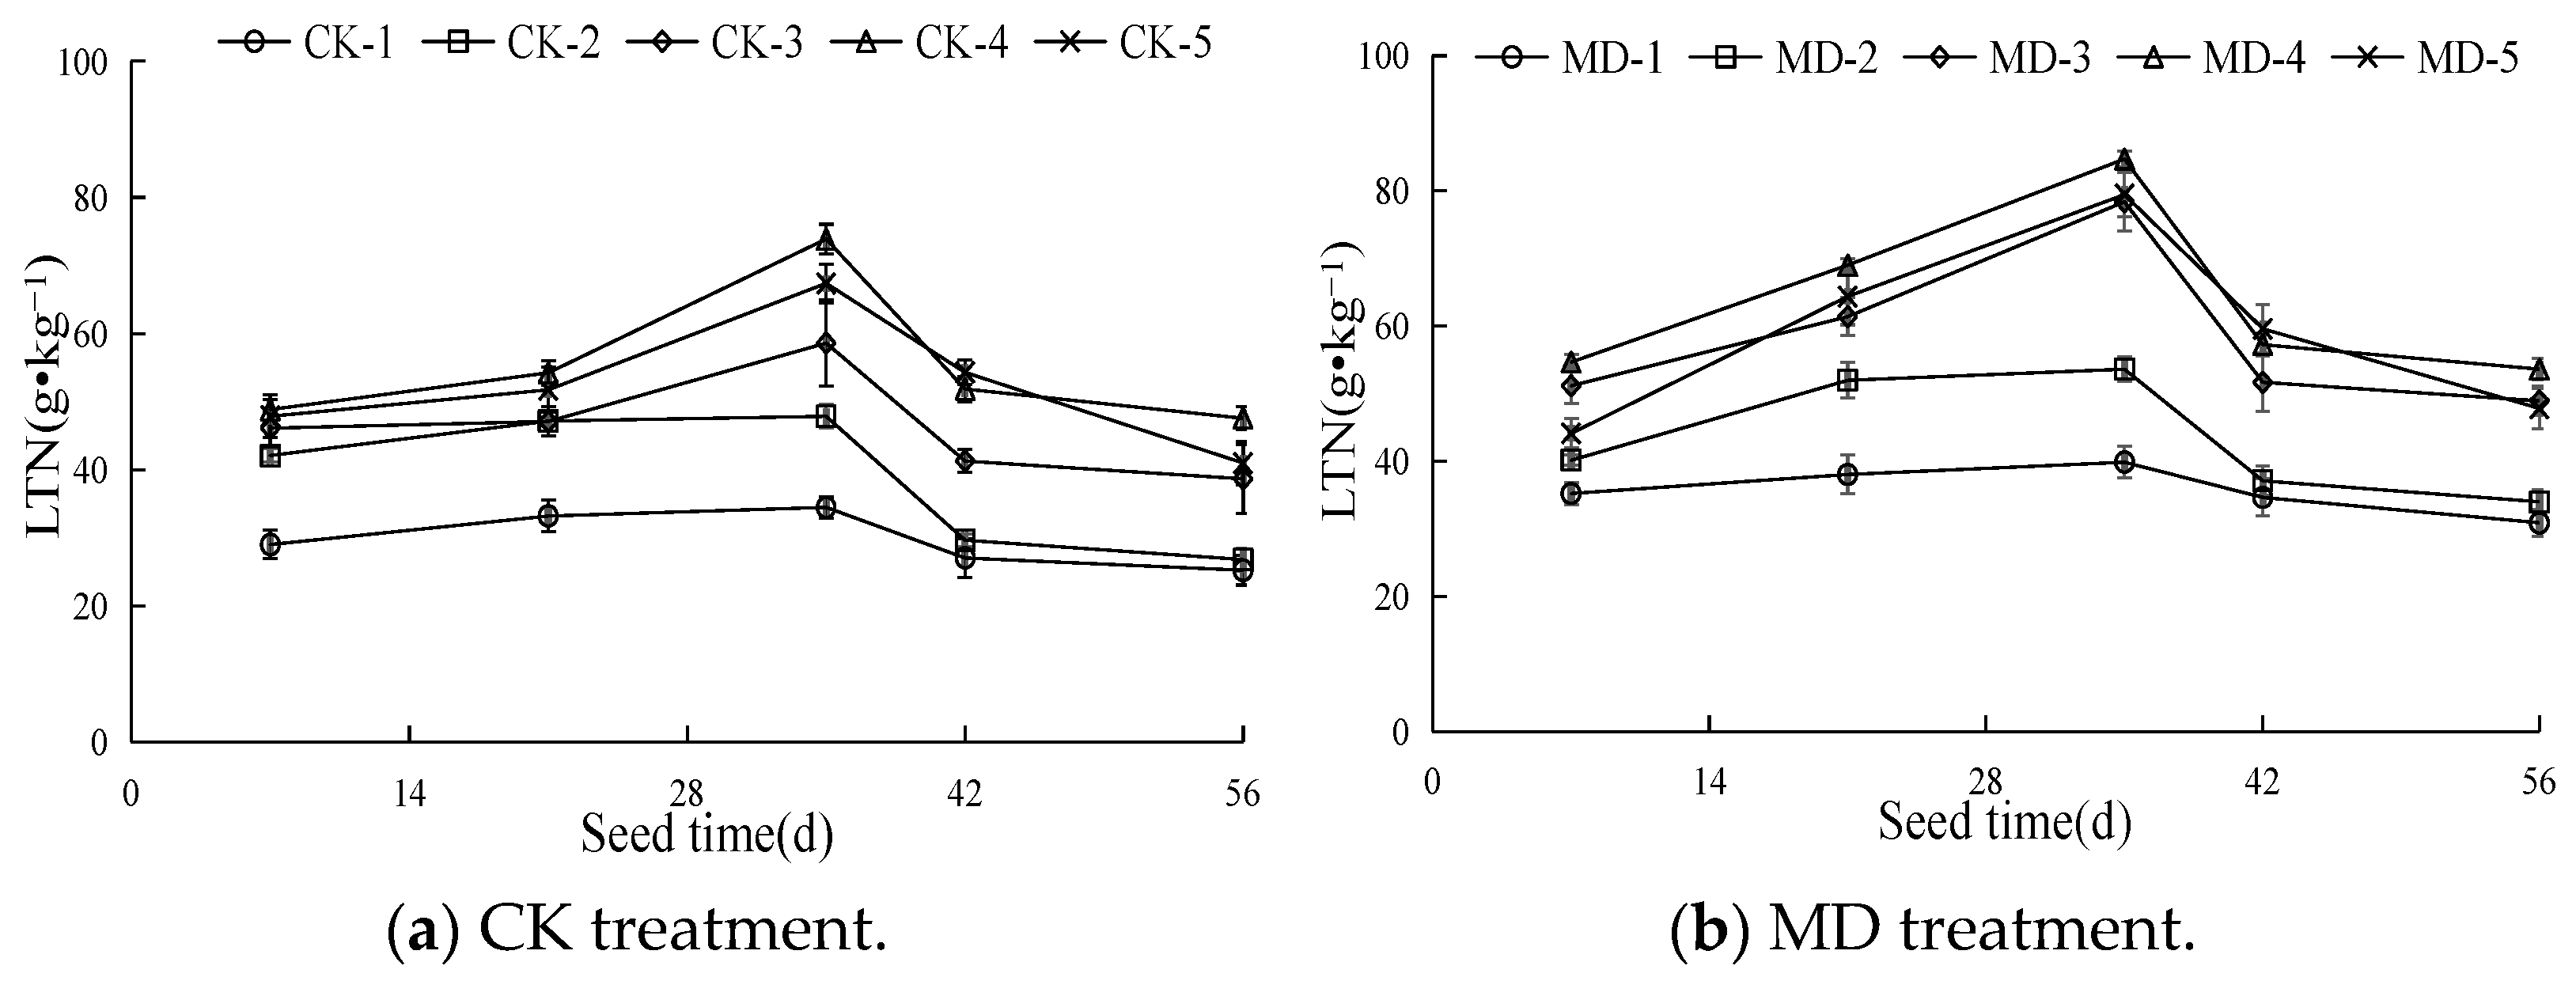
3.1. Dynamic Characteristics of the Total Nitrogen Content in Spinach Leaves

Figure 1 shows the trends of total nitrogen content in spinach leaves in different treatment groups. As observed, the total nitrogen content in the leaves in all the treatment groups first increased and then decreased with an increase in sowing time. In other words, the total nitrogen content in the leaves in all the treatment groups increased first and then decreased with the increase in soil moisture content. Indeed, magnetoelectric water could increase the total nitrogen content in leaves. Compared with CK-1, CK-2, CK-3, CK-4, and CK-5, the total nitrogen content in the spinach leaves in MD-1, MD-2, MD-3, MD-4, and MD-5 increased by 20.23%, 11.21%, 25.87%, 15.56%, and 11.27%, respectively (p < 0.05).

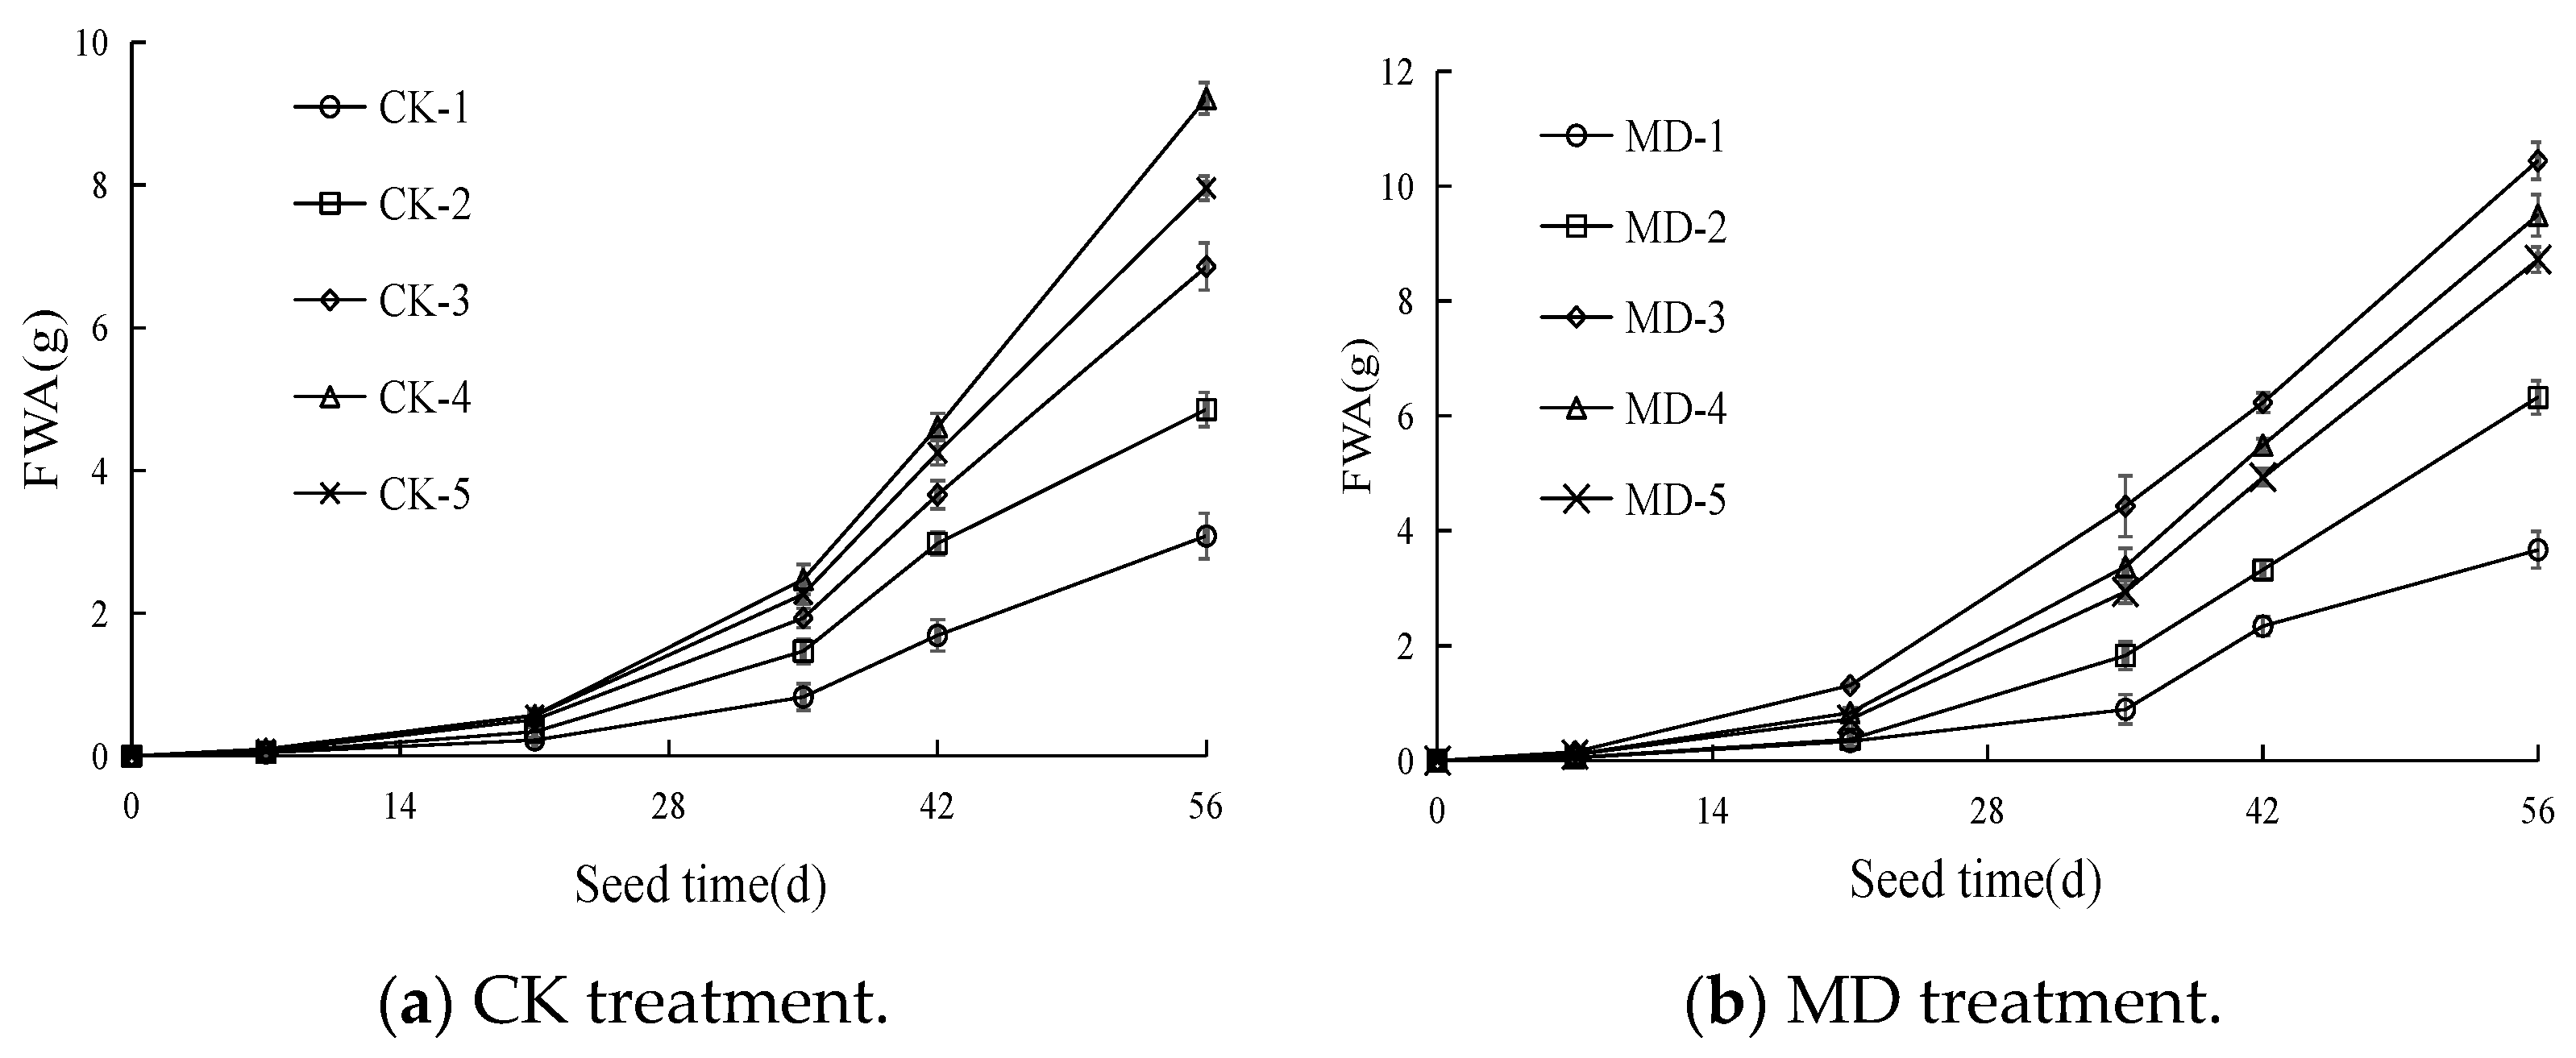
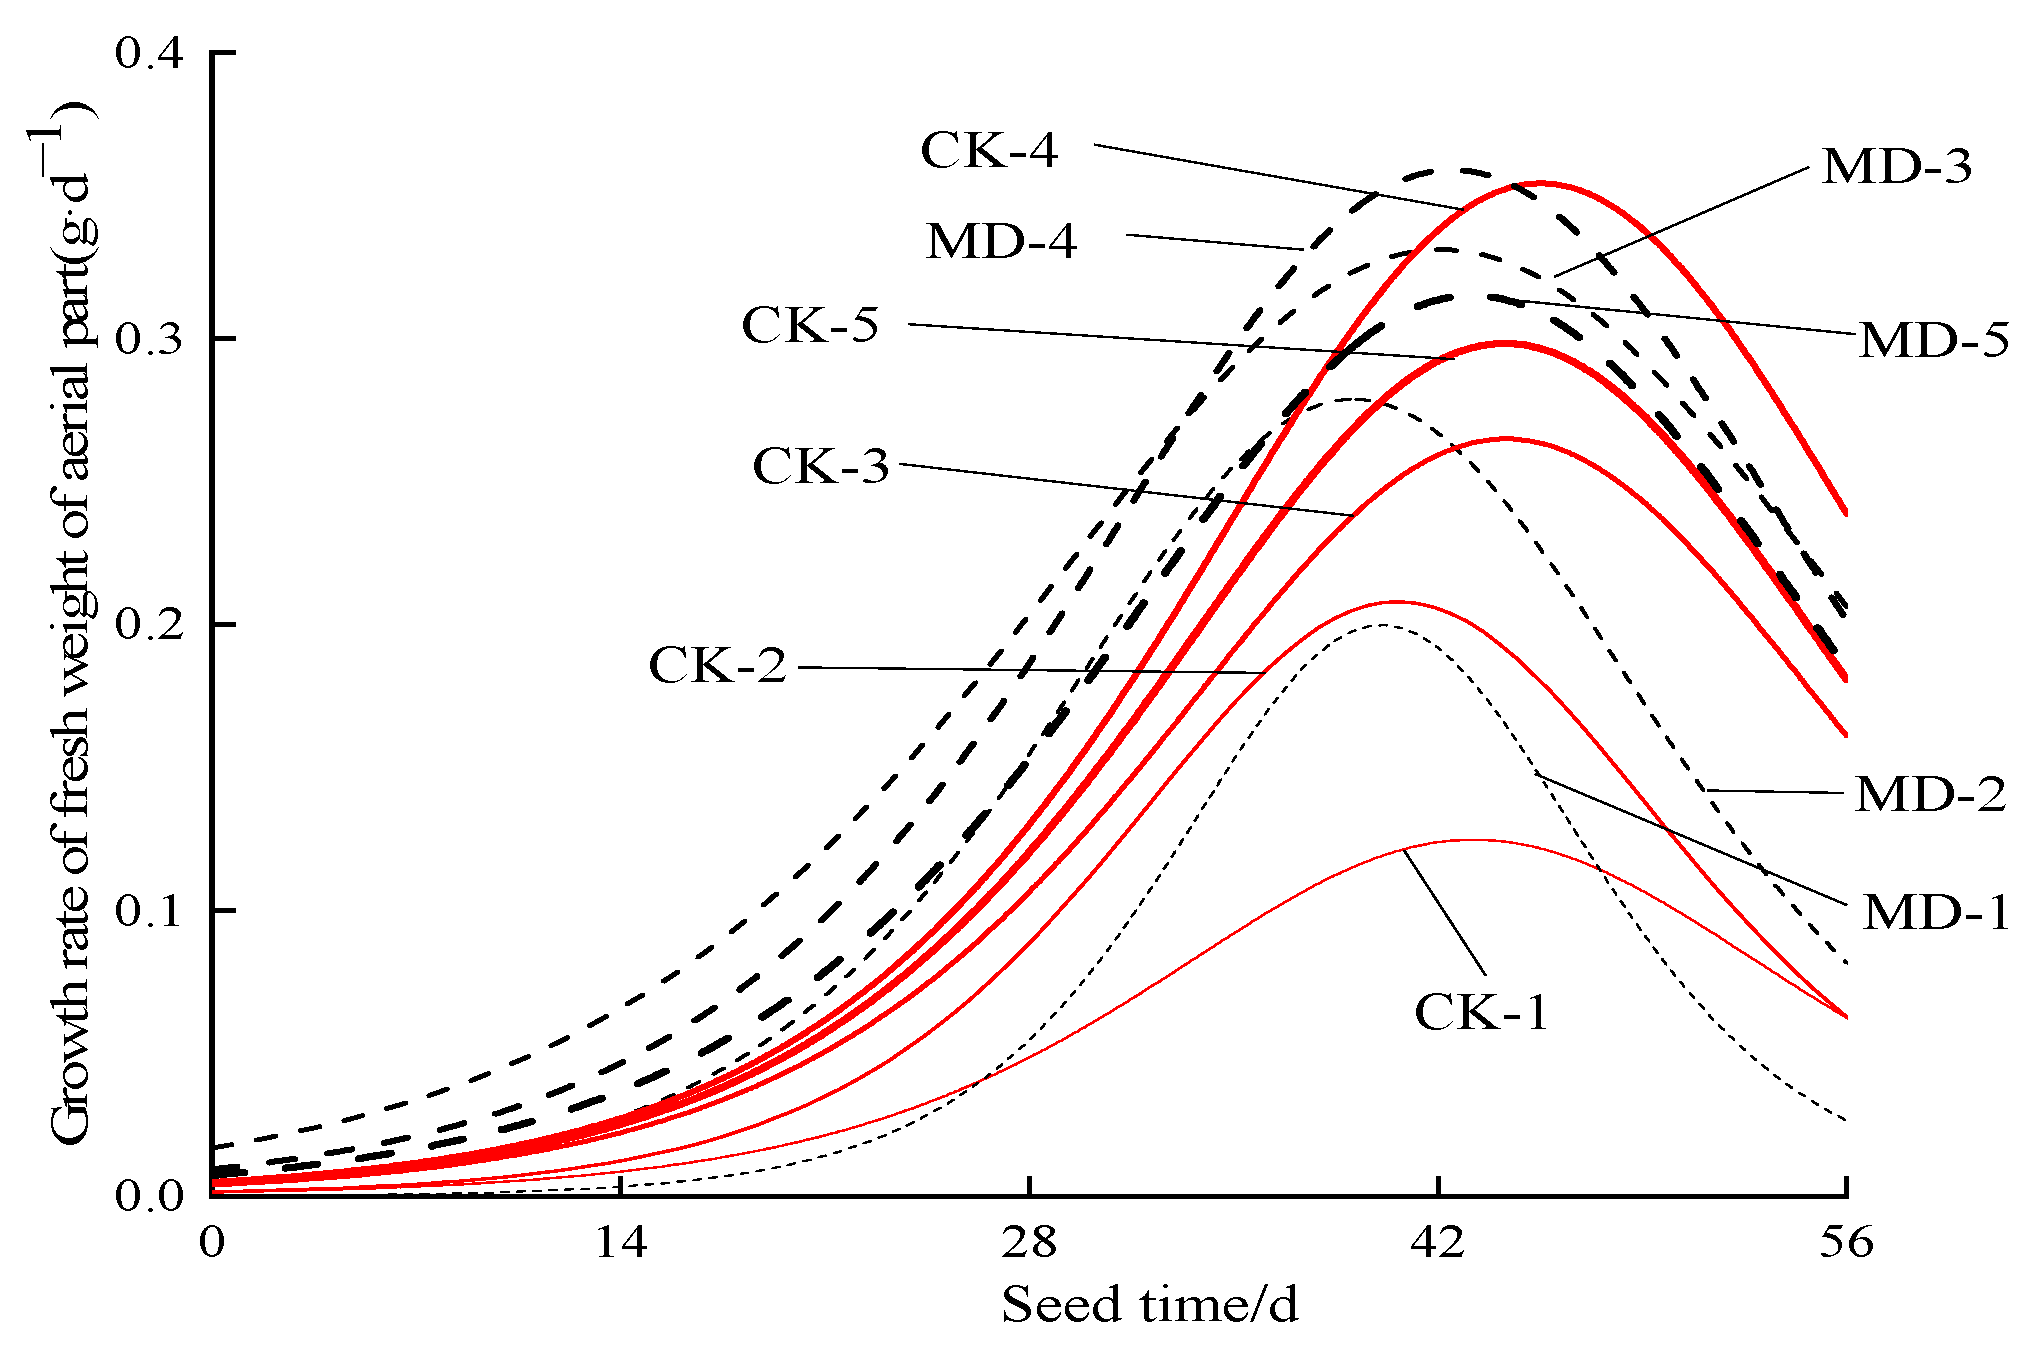
3.2. Dynamic Characteristics of the Fresh Weight of Spinach Shoots

Figure 2 illustrates the dynamic changes in the fresh weight of spinach shoots in different treatment groups. As observed, the fresh weight of shoots of both the MD and CK groups first increased and then decreased as the soil moisture content increased during a constant sowing time. Among the CK groups, the shoots of the CK-4 treatment had the highest fresh weight. Among the MD groups, the MD-3 treatment had the largest fresh weight of the shoots. Compared with irrigation by conventional water, irrigation by magnetoelectric water could increase the fresh weight of spinach shoots. After 56 days of sowing, compared with CK-1, CK-2, CK-3, CK-4, and CK-5, the fresh weight of the shoots of MD-1, MD-2, MD-3, MD-4, and MD-5 increased by 19.03%, 30.18%, 52.26%, 3.02%, and 9.52%, respectively (p < 0.05). Thus, when the soil moisture content was 65–75% FC, irrigation by magnetoelectric water caused the largest increase in the yield of the fresh weight of spinach shoots.
Equation (4) was used to fit the curve of the fresh weight of shoots in different treatment groups with time, and the fitting results are shown in Table 2. As observed, the fitted R2 values of all the treatment groups were >0.99, indicating that the fitting was effective. The theoretical maximum of the shoots of both the MD and CK groups increased first and then decreased with the increase in the soil moisture content. The MD treatment promoted the theoretical maximum of the fresh weights of shoots under the same soil moisture content. Compared with CK-1, CK-2, CK-3, CK-4, and CK-5, the theoretical maximum fresh weight of the shoots of MD-1, MD-2, MD-3, MD-4, and MD-5 increased by 5.25%, 45.09%, 52.91%, 6.47%, and 8.73%, respectively. Thus, when the soil moisture content is 65–75% of the FC, irrigation by magnetoelectric water could obtain the theoretical maximum fresh weight of spinach shoots.
Table 3 shows the effect of the two factors of irrigation water type and soil moisture content on the total nitrogen content in the spinach leaves and the fresh weight of shoots. As observed, irrigation water type and soil moisture content had extremely significant effects on the total nitrogen content in spinach leaves and the fresh weight of shoots (p < 0.01). The interaction between the two had no significant effect on the total nitrogen content in spinach leaves (p > 0.05), but it had a significant effect on the fresh weight of spinach shoots (p < 0.01). By comparing the F and p values, the overall order of the main effects was as follows: soil moisture content > type of irrigation water.
To further analyze the effect of different treatments on the fresh weight of shoots, the curve of the growth rate of shoot fresh weight of spinach in different treatment groups with time was obtained based on Equation (5) (Figure 3). As shown in Figure 3, the growth rates of the fresh weight of spinach shoots in different treatment groups exhibited consistent trends, such as a slow initial growth rate, followed by the maximum growth rate, and then a decrease in the growth rate. In comparison with conventional water, the effect of magnetoelectric integrated water on the growth rate of spinach shoots as determined by the fresh weight differed based on different soil moisture conditions. Compared with CK-1, CK-2, CK-3, CK-4, and CK-5, the maximum growth rate of MD-1, MD-2, MD-3, MD-4, and MD-5 had increased by 60.27%, 34.41%, 24.95%, 1.24%, and 2.48%, respectively. Different treatment groups reached the maximum growth rate at different times, MD-1, MD-2, MD-3, MD-4, and MD-5 were 3 d, 2 d, 2 d, 3 d, and 1 d ahead of CK-1, CK-2, CK-3, CK-4, and CK-5, respectively.

3.3. Analysis of Chlorophyll Content in Spinach and Its Photosynthetic Characteristics

Since the maximum growth rate of fresh weight of spinach shoots in different treatment groups mostly appeared around day 42 after sowing, the chlorophyll content and photosynthetic characteristics, including the photoresponse curve, stomatal conductance, and intercellular CO2 concentration measured at this culture time were selected for analysis.
Table 4 shows the chlorophyll contents in spinach in different treatment groups. The amount of chlorophyll a, b, and chlorophyll a + b in both the MD and CK groups increased first and then decreased with the increase in soil moisture content. Compared with CK-1, CK-2, CK-3, CK-4, and CK-5, the total mass fraction of chlorophyll in MD-1, MD-2, MD-3, MD-4, and MD-5 increased by 38.14%, 19.82%, 27.10%, 9.74%, and 5.29%, respectively. The rules for change from large to small were as follows: MD-4, CK-4, MD-3, MD-5, CK-5, CK-3, MD-2, CK-2, MD-1, CK-1, which was basically similar to the growth rate change rule. For chlorophyll a, the MD groups were significantly higher than those of the CK in other soil moisture gradients (p < 0.05), except that the MD and CK groups did not differ significantly (p > 0.05) under the 75–85% FC and 85–95% FC gradients (p > 0.05). For chlorophyll b, the MD groups were only significantly higher than the CK at 45–55% FC (p < 0.05), and the difference was not significant at other soil moisture gradients (p > 0.05). It was apparent that the magnetoelectric water primarily affected the content of chlorophyll a in spinach leaves. Additionally, for chlorophyll a/b under different soil moisture gradients, the chlorophyll a/b of the MD groups was significantly higher than that of the CK groups (p < 0.05), suggesting that the magnetoelectric water enhanced the light-capturing efficiency of spinach leaves.
On day 42 during sowing, the relationship between the increase in chlorophyll content of the MD groups relative to the CK groups was fitted with the increase in total nitrogen content in the leaves and the shoot growth rate, as shown in Figure 4. Under different soil water contents, the increase in chlorophyll of the spinach in magnetoelectric water relative to conventional water showed a good linear relationship with the growth rate of aboveground fresh weight and the increase in leaf total nitrogen content. Respectively, the fitting accuracy was greater than 0.90, indicating that there was a correlation between chlorophyll, aerial fresh weight, and leaf total nitrogen content.
Figure 5a shows the trends of the net photosynthetic rate of spinach leaves in different treatment groups with photosynthetically active radiation. As observed, the change in dynamics of the photoresponse curves of MD and CK groups under different soil moisture contents and different photosynthetically active radiation treatments were similar. When the photosynthetically active radiation was constant, the spinach net photosynthetic rate first increased and then decreased with the increase in the soil moisture content. When the photosynthetically active radiation increased, and the soil moisture content was constant, the spinach net photosynthetic rate first increased rapidly and then began to level off when the photosynthetically active radiation reached 1000 µmol·m−2·s−1, before finally decreasing. This indicated that spinach leaves would be subject to photoinhibition and light saturation under strong light irradiation. For example, when the photosynthetically active radiation was 1800 µmol·m−2·s−1 in the range of photosynthetically active radiation with a relatively stable net photosynthetic rate, compared with MD-1, MD-2, MD-3, MD-4, and MD-5, the stomatal conductance of CK-1, CK-2, CK-3, CK-4, and CK-5 increased by 81.28%, 90.45%, 80.27%, 19.87%, and 8.08%, respectively. Figure 5c shows the variation in intercellular CO2 concentration in the spinach leaves in different treatment groups with photosynthetically active radiation. As observed, the intercellular CO2 concentration first decreased and then increased with the increase of soil moisture content. Magnetoelectric water reduced the intercellular CO2 concentration in leaves. For example, when the photosynthetically active radiation was 1800 µmol·m−2·s−1, compared with CK-1, CK-2, CK-3, CK-4, and CK-5, the intercellular CO2 concentrations of MD-1, MD-2, MD-3, MD-4, and MD-5 decreased by 9.0%, 6.76%, 35.74%, 22.89%, and 13.03%, respectively.

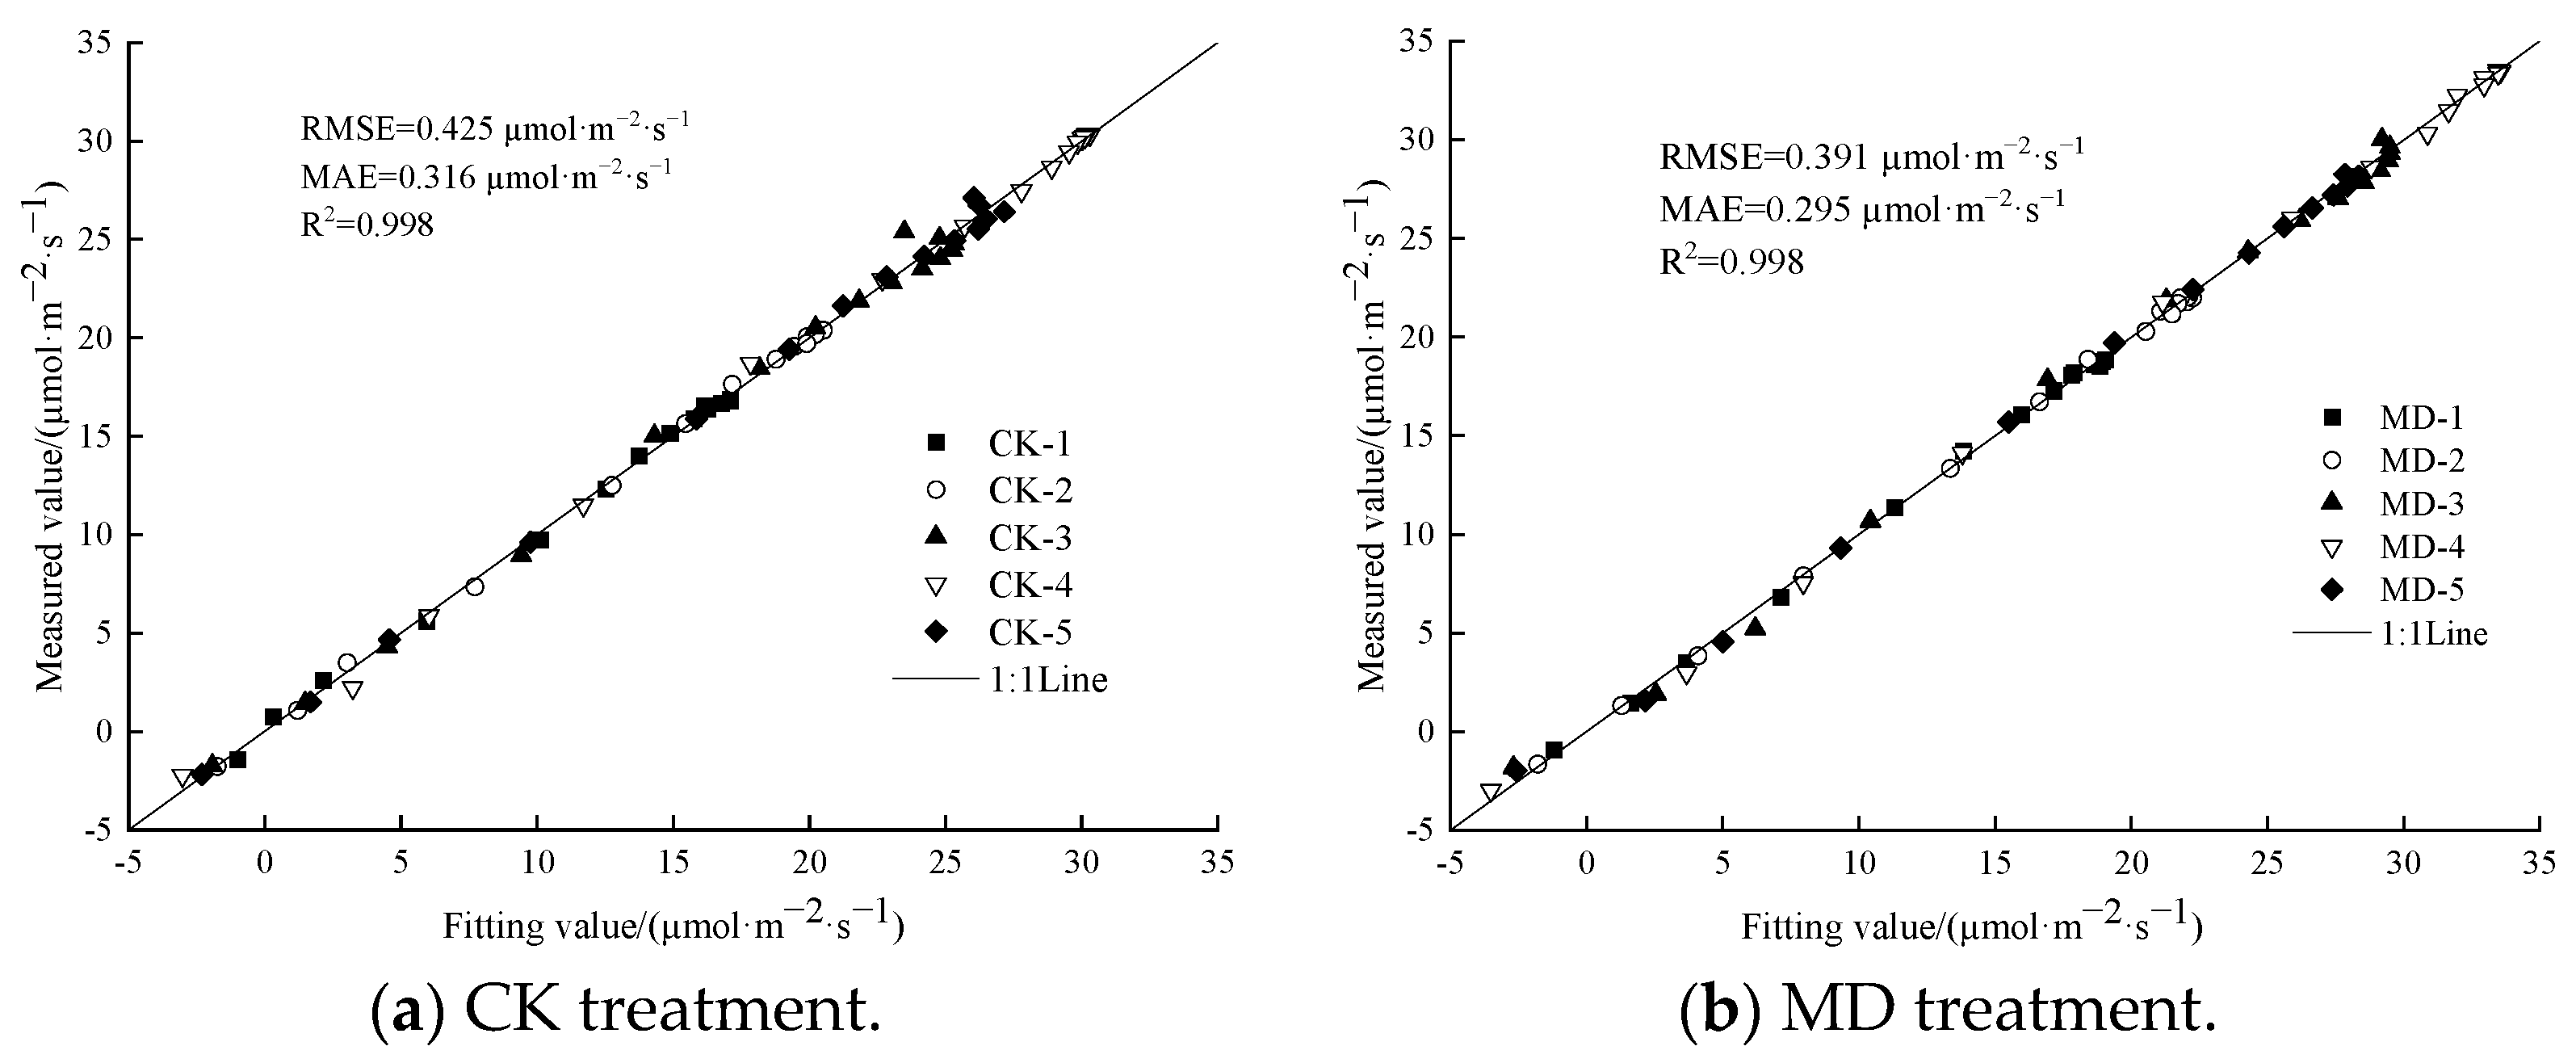
3.4. Determination of a Suitable Model for the Photoresponse Curve

To quantitatively analyze the effect of magnetoelectric water on spinach photosynthetic characteristics and determine the appropriate photoresponse curve, rectangular hyperbolic, non-rectangular hyperbolic, modified rectangular hyperbolic, and exponential models were used to fit the photoresponse curve of spinach leaves under different soil moisture contents.
Figure 6 shows the fitting curve of the four models to the spinach net photosynthetic rate. The net photosynthetic rates of spinach in all the treatment groups showed a trend of first decreasing and then increasing with the increase in photosynthetically active radiation. When the photosynthetically active radiation was 2500 µmol·m−2·s−1, the fitted values of rectangular hyperbolic, non-rectangular hyperbolic, and exponential models were basically larger than the measured values. This could be attributed to the fact that the rectangular hyperbolic, non-rectangular hyperbolic, and exponential models were all monotonically increasing functions, which could not effectively fit the photo-inhibition and photo-saturation phenomena of spinach leaves under strong light. The modified rectangular hyperbolic model could effectively fit the process of change in the net photosynthetic rate of spinach leaves under different levels of photosynthetically active radiation. Table 5 shows the comparison of the simulation accuracy of the photoresponse curve by the four models. A comparative analysis indicated that, compared with the other models, the fitting curve of the modified rectangular hyperbolic model was the closest to the measured value, while R2 was closer to 1, and the root mean square error (RMSE) and mean absolute error (MAE) were smaller.

3.5. Light Response Fitting and Parameter Variation Characteristics of Spinach as Shown by the Modified Rectangular Hyperbolic Model

The modified rectangular hyperbolic model was used to simulate and calculate the net photosynthetic rate of spinach leaves of the CK and MD groups under five types of soil moisture content, and the fitted values were compared with the measured values. The results are shown in Figure 7. The error calculation and analysis indicated that the coefficient of determination R2 between the simulated and measured values of CK and MD was >0.99 in both cases; the RMSEs were 0.425 and 0.391 µmol·m−2·s−1, respectively; and the MAEs were 0.316 and 0.295 µmol·m−2·s−1, respectively. Therefore, there was a strong goodness of fit index between the simulated and measured values. This indicated that the modified rectangular hyperbolic model could be used to simulate the net photosynthetic rate of spinach leaves under different soil moisture contents.
The photoresponse curve mathematical model was used to calculate Pnmax. Parameters that reflect the physiological significance of crops, such as the light compensation point Ic, light saturation point Isat, and dark respiration rate Rd, among others, are widely used in the research on crop growth and agricultural production [20]. To accurately compare and analyze the effects of magnetoelectric water and conventional water on spinach photosynthesis under different soil moisture contents, the photosynthetic characteristic parameters, such as α, Pnmax, Ic, Is, and Rd, of spinach in different treatment groups (Table 6) were calculated based on the fitting results of the modified rectangular hyperbolic model.
Apparent quantum efficiency is an indicator of the ability of a crop to absorb, convert and utilize light energy in low light [21]. As shown in Table 6, the apparent quantum efficiency of the spinach leaves of both the CK and MD groups increased first and then decreased with the increase in the soil moisture content. Under different soil moisture contents, the apparent quantum efficiency of spinach leaves in the MD groups was greater than that of the CK groups, indicating that irrigation by magnetoelectric water could increase the ability of spinach leaves to utilize weak light. Compared with CK-1, CK-2, CK-3, CK-4, and CK-5, the spinach leaf apparent quantum efficiency of MD-1, MD-2, MD-3, MD-4, and MD-5 increased by 27.60%, 23.93%, 35.62%, 30.43%, and 10.17%, respectively. The apparent quantum efficiency of MD-4 was the highest of spinach leaves.
The light compensation and light saturation points of crop leaves reflect the light conditions requirements of a crop and are an important indicator for evaluating whether a crop can tolerate shade and utilize strong light [22]. As the light compensation point decreases, the ability of a crop to utilize low light intensity increases [23], while a higher light saturation point indicates a stronger ability of the crop to utilize strong light [24]. As shown in Table 6, the spinach leaf light compensation points of both the CK and MD groups showed a trend of first decreasing and then increasing with the increase in soil moisture content, and the light saturation point increased first and then decreased with the increase in the soil moisture content. The spinach leaf light compensation point of the MD groups was lower than that of the CK under different soil moisture contents, and the light saturation point was higher than that of the CK. The results demonstrated that irrigation by magnetoelectric water could increase the range of light intensity utilized by spinach leaves. Compared with the CK-1, CK-2, CK-3, CK-4, and CK-5, the spinach leaf light compensation points of MD-1, MD-2, MD-3, MD-4, and MD-5 decreased by 10.06%, 10.44%, 13.25%, 10.85%, and 1.94%, respectively; and the light saturation point increased by 4.05%, 15.91%, 14.41%, 8.27%, and 1.75%, respectively. The MD−4 treatment had the lowest spinach leaf light compensation point and the highest light saturation point.
The Rd of crops refers to the respiration rate of crops when there is no light. Most of the energy released by crops during Rd is lost in the form of heat, and a small portion is used for the physiological activities of crops [25]. Therefore, to some extent, a larger Rd indicates a higher physiological activity of the crop leaves. As shown in Table 6, the spinach leaf Rd of both the CK and MD groups first increased and then decreased with the increase in the soil moisture content. Under the same soil moisture content, the Rd of the MD groups was significantly higher than that of the CK groups (p < 0.05). Compared with CK-1, CK-2, CK-3, CK-4, and CK-5, the spinach leaf Rd of MD-1, MD-2, MD-3, MD-4, and MD-5 increased by 14.59%, 10.96%, 17.60%, 16.22%, and 8.05%, respectively. The maximum net photosynthetic rate of both the CK and MD groups first increased and then decreased with the increase in the soil moisture content, and the maximum net photosynthetic rates of the MD groups were higher than those of the CK groups. Compared with CK-1, CK-2, CK-3, CK-4, and CK-5, the maximum net photosynthetic rate of the spinach leaves of MD-1, MD-2, MD-3, MD-4, and MD-5 increased by 22.34%, 34.22%, 7.51%, 8.34%, and 26.38%, respectively. Among them, the MD−4 treatment exhibited the highest maximum net photosynthetic rate of the spinach leaves.

4. Discussion

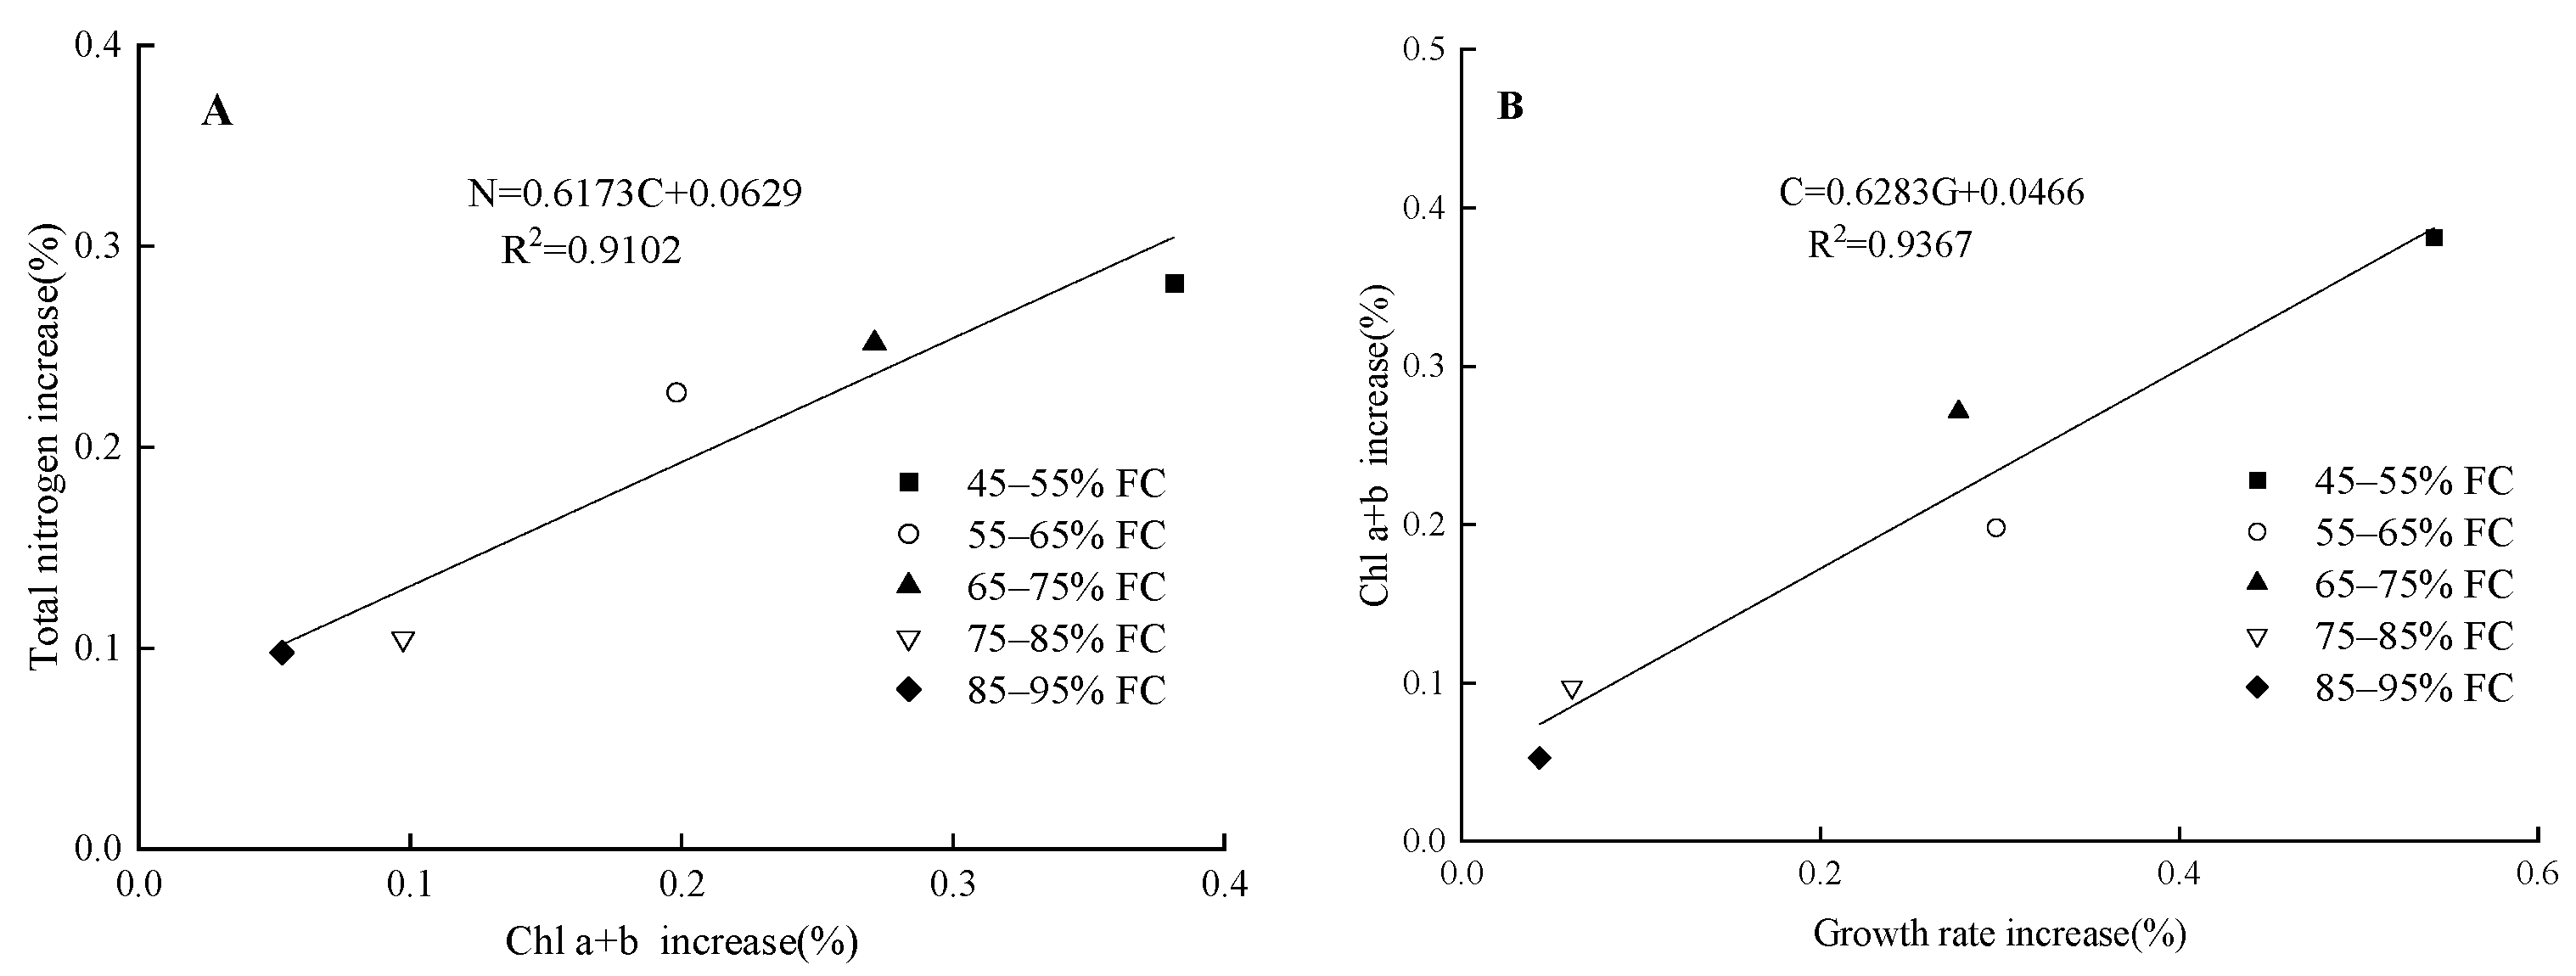
4.1. Effects of Soil Moisture Content and Magnetoelectric Water on the Total Nitrogen Content and Chlorophyll in Spinach Leaves

Nitrogen is a key macroelement that is necessary for crop growth and development, primarily in chloroplasts and proteins [26], and it is an important factor that limits the rate of crop growth and photosynthetic capacity [27]. In this experiment, the dynamics of total nitrogen content in the spinach leaves in different treatment groups were similar. At the early stage of growth, the nitrogen content of spinach leaves was at a high level, and with the rapid growth of leaves, the photosynthetic capacity of the spinach increased. Then, the rate of nitrogen consumption was greater than the rate of absorption [28], and the nitrogen content of the leaves began to decrease. The soil moisture condition affected the nitrogen content of spinach. With the increase in the soil moisture content, the total nitrogen content of spinach tended to first increase and then decrease. This could be attributed to the fact that more nutrients were absorbed by crops while absorbing water, and the increase in soil water content could make crops absorb more nitrogen. When the soil moisture contents were excessively high, the soil pores would be filled with water, making it difficult for outside air to enter, causing soil hypoxia, increasing soil acidity, and hindering the ability of crops to absorb nitrogen [29].
This study found that under different soil moisture gradients, the total nitrogen content in spinach leaves under irrigation by magnetoelectric water was significantly higher than that of irrigation by conventional water (Figure 1), demonstrating that magnetoelectric water could promote the absorption and utilization of nitrogen by spinach. Previous research also found that magnetization could increase the contents of N, P, K, Mg, Ca, and other mineral elements in crops, such as wheat (Triticum aestivum), tomato (Solanum lycopersicum), and soybean (Glycine max) [30,31,32]. This is probably because the surface tension of water decreases, and the amount of dissolved oxygen increases after conventional water is magnetized and de-electronated. The hydrogen bond between water molecules is weakened, and monomer water molecules with higher activity and permeability are generated. The improved solubility of various mineral salts and the availability of soil nutrients help the crop to absorb and utilize mineral nutrients, which may be the reason for the increase in the nitrogen content of spinach leaves under magnetoelectric water irrigation.
Higher plants primarily contain chlorophyll a and chlorophyll b, which are important pigments that convert light energy into chemical energy. The function of chlorophyll b is primarily to collect the light energy, while chlorophyll a primarily uses the collected light energy for photochemical activity. The chlorophyll a/b ratio reflects the stacking degree of thylakoids, and as the stacking degree increases, the photoinhibition effect becomes weaker. The soil moisture conditions affected the synthesis of spinach chlorophyll. This study found that suitable soil moisture content (75–85% FC) could maximize the chlorophyll content in spinach, while higher or lower soil moisture contents would reduce the chlorophyll content in spinach.
Severe soil moisture stress causes the thylakoids to gradually disintegrate, resulting in a complete loss of chloroplast activity and a decrease in chlorophyll content [33]. By contrast, when the soil moisture is high, the chlorophyll is diluted, and the chlorophyll content will decrease accordingly. Moreover, nitrogen is a component of chloroplasts, particularly in chlorophyll, and a lack of nitrogen in crops will inhibit the synthesis of chlorophyll. This experiment found that magnetoelectric water increased the chlorophyll content in spinach (Table 4), which was consistent with the findings of previous studies [34]. Additionally, this study found that irrigation by magnetoelectric water correlated to some degree with irrigation by conventional water in the growth rate of chlorophyll content and total nitrogen content in leaves (Figure 4). This result indicated that irrigation by magnetoelectric water could increase the total nitrogen content in the spinach plant, so that more nitrogen would be distributed to chloroplasts and participate in photosynthesis [35]. An increase in the amount of nitrogen that was involved in photosynthesis resulted in a higher proportion of nitrogen allocated to chlorophyll and 1,5-bisphosphate carboxylase/oxygenase (RuBisCo) [36], which would increase physiological metabolism, thereby increasing the growth rate of spinach.

4.2. Effects of Soil Moisture Content and Magnetoelectric Water on Photosynthetic Characteristics and Aboveground Fresh Weight of Spinach

Soil moisture affects crop photosynthesis, which can be divided into stomatal factors and non-stomatal factors [37]. The former refers to the lack of water absorption and water supply capacity of roots owing to soil drought, resulting in a decrease in the content of leaf guard cytosol; the water potential increases and the water loss diminishes, thus, decreasing the turgor pressure [38]. Some stomata are closed, or their degree of opening is reduced, resulting in a low ability of the leaf stomata to conduct the transport of CO2. A reduction in the concentration of CO2 in the photosynthetic raw material will eventually reduce the photosynthetic capacity. The latter refers to the decrease in photosynthetic capacity, such as the chlorophyll RuBisCo activities of mesophyll cells, resulting in an insufficient supply of ATP and nicotinamide adenine dinucleotide phosphate (NADPH). The increase in the concentration of intercellular CO2 directly affects the photosynthetic capacity of leaves. Therefore, the change in the concentration of intercellular CO2 can be used as the basis for evaluating whether the reduction in photosynthetic rate is caused by stomatal or non-stomatal factors [39]. In this study, analyses of the changes in spinach stomatal conductance and intercellular CO2 concentration with the soil moisture content (Figure 5) indicated that the intercellular CO2 concentration increased when the soil moisture content decreased. Therefore, the non-stomatal factors mainly dominated the effect of soil moisture content on spinach leaf photosynthesis, which indicated that the stress of soil moisture led to the inhibition of spinach photosynthesis.
Under stress conditions, such as drought, waterlogging, low temperature, or salinity, active oxygen will accumulate in crops, resulting in peroxidative damage to lipids, nucleic acids, and sugars. Crops primarily rely on antioxidase activities in vivo to resist the damage caused by peroxidation [40,41,42], so the level of antioxidase activity in crops reflects their tolerance to adversity. Some researchers have found that when water is magnetized or de-electronated, the positive and negative ions in the water will move, and the generated electron flow will produce O2 in the water, which generates superoxide ions (O2) and hydrogen peroxide (H2O2) [43]. H2O2 is a toxic molecule of active oxygen produced during the metabolism of crop cells [44]. However, H2O2 can also be used as an exogenous signal molecule, involved in the regulation of crop growth and development [45] and the process of responding to various adversity stresses. Thus, H2O2 has a dual role of protection and toxicity on crops [46]. Ahmed et al. reported that low concentrations of H2O2 could induce the establishment of antioxidant defense mechanisms in crops [47]. Additionally, the use of exogenous H2O2 could increase the tolerance of tomatoes, bell peppers, and watermelons to cold stress [48,49,50], improve the drought tolerance of soybeans, tobacco, and rapeseed [51,52,53], and improve the salt tolerance of wheat, tomatoes, and other crops [54,55,56,57]. Darmanti et al. reported that under drought conditions, exogenous H2O2 treatment enhanced the net photosynthetic rate and stomatal conductance of soybean leaves [58], while reducing the contents of the oxidative product malondialdehyde (MDA), which was induced by drought stress and H2O2.
This experiment found that when the soil moisture content was low or high, the apparent quantum efficiency, light saturation point, and stomatal conductance of spinach leaf decreased, while the light compensation point and intercellular concentration of CO2 increased. This result suggested that the photosynthesis of spinach was inhibited. However, the apparent quantum efficiency, light saturation point, and stomatal conductance of spinach under irrigation by magnetoelectric water were higher than those in spinach plants irrigated with conventional water. Both the light compensation point and intercellular CO2 concentration were lower than those under irrigation by conventional water (Figure 5 and Table 6), indicating that irrigation by magnetoelectric water could effectively improve the stomatal regulatory ability of spinach leaves under water stress, reduce stomatal resistance, increase the range of available light intensity and the fluorescence efficiency of chlorophyll, and maintain normal photosynthesis. An additional combination of the data on the fresh weight of spinach shoots (Figure 2) under the same soil moisture gradient indicated that the fresh weight of spinach shoots under irrigation by magnetoelectric water was significantly higher than that of shoots irrigated by conventional water. This could be attributed to the fact that the H2O2 in the magnetoelectric water promoted the establishment of the spinach antioxidant defense mechanism, alleviated the damage to the spinach photosynthetic apparatus caused by active oxygen accumulation induced by water stress, and thus improved the ability of the spinach to assimilate photosynthetic carbon. Experiments have demonstrated that magnetized water could enhance antioxidase activities in kidney beans (Phaseolus vulgaris) and lettuce (Lactuca sativa) to enhance stress resistance [59,60].
Through this experiment, it is found that the use of magnetoelectric water irrigation can improve the photosynthetic capacity and yield of spinach, which provides new technical approaches for the effective use of water resources, and the large-scale use of magnetoelectric water for spinach irrigation in the future is expected to increase the yield by 15–20%. However, the effect of magnetoelectric water on spinach growth under a fixed magnetic field intensity (3000 Gs) was determined in this study, and only one magnetoelectric water was used as the irrigation water. In the future, the influence of different magnetic field intensities and different activation times on spinach growth can be explored.

5. Conclusions

Through experimental research, we found that under different soil water content conditions, magnetoelectric water irrigation could increase the total nitrogen content, chlorophyll content, and net photosynthetic rate of spinach leaves, thereby accelerating the growth process of spinach, and ultimately leading to an increase in yield. Among them, spinach yield was the highest when the soil water content was maintained at 65–75% FC with magnetoelectric water irrigation. In addition, the modified right-angle hyperbolic model fits the spinach light response curve well. Therefore, under magnetoelectric water irrigation, the soil water content of 65–75% FC was more conducive to increasing vegetable yield. The results of this study can provide a theoretical basis and method support for improving the efficiency of irrigation water resources.

Author Contributions

Conceptualization, Y.S. and Q.W.; methodology, Y.S. and J.W.; software, J.W.; validation, J.W. and C.W.; formal analysis, J.W. and C.W.; investigation, J.W.; writing—original draft, J.W.; writing—review and editing, Y.S. All authors have read and agreed to the published version of the manuscript.

Funding

This work was financed by the National Natural Science Foundation of China (41830754, 52179042, 41907010), Key Research and Development Projects of Shaanxi Province (2022NY-077), and Major Science and Technology Projects of Autonomous Regions (2020A01003-3).

Institutional Review Board Statement

Not applicable.

Informed Consent Statement

Not applicable.

Data Availability Statement

The data presented in this study are available on request from the corresponding author.

Conflicts of Interest

The authors declare no conflict of interest.

References

  1. Liu, J.J.; Fu, Z.H.; Liu, W.F. Impacts of Precipitation Variations on Agricultural Water Scarcity under Historical and Future Climate Change. J. Hydrol. 2023, 617, 128999. [Google Scholar] [CrossRef]
  2. Mu, Y.; Zhao, G.Q.; Zhao, Q.Q.; Liu, H.; Wang, Q.J. Advances in the Application of Activated Water Irrigation. J. Agric. Resour. Environ. 2019, 36, 403–411. [Google Scholar] [CrossRef]
  3. Mian, S.H.; Ghulam, D.; Amir, M.A.; Shahbaz, H.; Rana, R.K. Eco-friendly Magnetic Field Treatment to Enhance Wheat Yield and Seed Germination Growth. Environ. Nanotechnol. Monit. Manag. 2020, 14, 100299. [Google Scholar] [CrossRef]
  4. Georgii, S.; Yurii, K.; Alla, B. Formation of the Quality of Wheat Grain by Extremely Low Frequency Electromagnetic Field Treatment. Tech. Audit Prod. Rsrv. 2022, 4, 38–44. [Google Scholar] [CrossRef]
  5. Abdulrahman, S.A.; Halimah, O.A.K. The Effect of Magnetically Treated Water on the Germination and Growth of a Local Variety of Millet Pennisetum Glaucum. Life Sci. J. 2018, 15, 16–28. [Google Scholar] [CrossRef]
  6. Zareei, E.; Zaare-Nahandi, F.; Oustan, S.; Hajilou, J. Effects of Magnetic Solutions on Some Biochemical Properties and Production of Some Phenolic Compounds in Grapevine (Vitis vinifera L.). Sci. Hortic. 2019, 253, 217–226. [Google Scholar] [CrossRef]
  7. Mohammadi, R.; Dastorani, M.T.; Akbari, M.; Ahani, H. The Impacts of Magnetized Water Treatment on Different Morphological and Physiological Factors of Plant Species in Arid Regions. Water Supply 2019, 19, 2016–2026. [Google Scholar] [CrossRef] [Green Version]
  8. Li, J.; Fan, J.; Zhu, Z.M. Effects of Activated Water Irrigation on Growth Characteristics of Soybean under Drought Stress. J. Appl. Ecol. 2020, 31, 3711–3718. [Google Scholar] [CrossRef]
  9. Wang, H.; Fan, J.; Fu, W. Effect of Activated Water Irrigation on the Yield and Water Use Efficiency of Winter Wheat under Irrigation Deficit. Agronomy 2022, 12, 1315. [Google Scholar] [CrossRef]
  10. Wang, Q.J.; Sun, Y.; Ning, S.R.; Zhang, J.H.; Zhou, B.B.; Su, L.J.; Shan, Y.Y. Effects of Activated Irrigation Water on Soil Physicochemical Properties. Adv. Earth Sci. 2019, 34, 660–670. [Google Scholar] [CrossRef]
  11. Scott, A.C.; Zubot, W.; Davis, C.W.; Brogly, J. Bioaccumulation Potential of Naphthenic Acids and Other Ionizable Dissolved Organics in Oil Sands Process Water (OSPW)-a Review. Sci. Total Environ. 2019, 712, 134558. [Google Scholar] [CrossRef] [PubMed]
  12. Wang, Q.J.; Xu, Z.Y.; Shan, Y.Y.; Zhang, J.H. Effect of Salinity of De-electronic Brackish Water on Characteristics of Water and Salt Movement in Soil. Trans. Chin. Soc. Agric. Eng. 2018, 34, 125–132. [Google Scholar] [CrossRef]
  13. Zhang, W.W.; Zhang, Z.F.; Bo, H.T.; Chen, D.F.; Sun, X. Study on the Timeliness of Performance of Magnetized Water. Mech. Electr. Eng. Technol. 2020, 49, 71–73. [Google Scholar] [CrossRef]
  14. Li, Z.Y.; Wang, Q.J.; Zhang, J.H.; Xie, J.B.; Wei, K. Effect of Magnetization-de-electronic Integrated Activation Water on Water-salt Transport Characteristics of Salinized Soil. J. Soil Water Conserv. 2021, 35, 290–295. [Google Scholar] [CrossRef]
  15. Magnee, K.J.H.; Scholten, O.E.; Postma, J.; Lammerts, V.B.; Edith, T.; Groot, S.P.C. Sensitivity of Spinach Seed Germination to Moisture is Driven by Oxygen Availability and Influenced by Seed Size and Pericarp. Seed Sci. Technol. 2020, 48, 117–131. [Google Scholar] [CrossRef]
  16. Lichtenthaler, H.K.; Wellburn, A.R. Determinations of Total Carotenoids and Chlorophylls a and b of Leaf Extracts in Different Solvents. Biochem. Soc. Trans. 1983, 11, 591–592. [Google Scholar] [CrossRef] [Green Version]
  17. Lewis, J.D.; Lucash, M.; Olszyk, D.; Tingey, D.T. Seasonal Patterns of Photosynthesis in Douglas Fir Seedlings During the Third and Fourth Year of Exposure to Elevated CO2 and Temperature. Plant Cell Environ. 2001, 24, 539–548. [Google Scholar] [CrossRef] [Green Version]
  18. Gates, D.M. Mathematical Models in Plant Physiology: A Quantitative Qpproach to Problems in Plant and Crop Physiology. Q. Rev. Biol. 1976, 1, 97. [Google Scholar] [CrossRef]
  19. Bassman, J.H.; Zwier, J.C. Gas Exchange Characteristics of Populus Trichocarpa, Populus Deltoides and Populus Trichocarpa × p. Deltoides Clones. Tree Physiol. 1991, 8, 145–159. [Google Scholar] [CrossRef]
  20. Zhu, T.T.; Li, J.; Liu, Y.Y.; Tong, X.J.; Yu, Q. Leaf Photosynthetic Light Response of Summer Maize: Comparison of Models and Analysis of Parameters. Photosynthetica 2020, 58, 19–28. [Google Scholar] [CrossRef]
  21. Song, X.; Yue, X.; Chen, W.; Jiang, H.; Li, X. Detection of Cadmium Risk to The Photosynthetic Performance of Hybrid Pennisetum. Front. Plant Sci. 2019, 10, 798–812. [Google Scholar] [CrossRef] [PubMed]
  22. Liang, S.; Jie, W.; Liu, B.; Nara, K.; Lian, C.; Shen, Z.; Yan, X.; Chen, Y. Ectomycorrhizal Fungi Reduce the Light Compensation Point and Promote Carbon Fixation of Pinus Thunbergii Seedlings to Adapt to Shade Environments. Mycorrhiza 2017, 27, 823–830. [Google Scholar] [CrossRef] [Green Version]
  23. Liu, Q.; Li, F.R.; Xie, L.F. Optimal Model of Photosynthesis-Light Response Curve in Canopy of Planted Larix Olgensis Tree. Chin. J. Appl. Ecol. 2016, 27, 2420–2428. [Google Scholar] [CrossRef]
  24. Li, Y.H.; Liu, J.H.; Lv, P.; Mi, J.Z.; Zhao, B.P. Silicon Improves the Photosynthetic Performance of Oat Leaves Infected with Puccinia Graminis f. sp. Avenae. Front. Plant Sci. 2022, 13, 1037136. [Google Scholar] [CrossRef]
  25. Coast, O.; Shah, S.; Ivakov, A.; Gaju, O.; Wilson, P.B.; Posch, B.C.; Bryant, C.J.; Negrini, A.C.; Evans, J.R.; Condon, A.G.; et al. Predicting Dark Respiration Rates of Wheat Leaves from Hyperspectral Reflectance. Plant Cell Environ. 2019, 42, 2133–2150. [Google Scholar] [CrossRef] [PubMed] [Green Version]
  26. Gendy, A.; Gohary, A.; Omer, E.A.; Hendawya, S.F.; Husseina, M.S.; Stancheva, I. Effect of Nitrogen and Potassium Fertilizer on Herbage and Oil Yield of Chervil Plant (Anthriscus cerefolium L.). Ind. Crops Prod. 2015, 69, 167–174. [Google Scholar] [CrossRef]
  27. Fei, C.; Fan, H.; Fan, X.X.; Xu, G. Estimation of Total Nitrogen content in Sugar Beet Leaves Based on Chlorophyll Fluorescence Parameters. Photosynthetica 2020, 58, 869–872. [Google Scholar] [CrossRef]
  28. Budiyanto, G. The Influence of Organic Materials to Nitrogen Content of Leaf Tissue of Corn Planted in Coastal Sand soil. Adv. Sci. Lett. 2018, 24, 9138–9140. [Google Scholar] [CrossRef]
  29. Yao, X.; Xiao, B.; Kidron, G.J. Respiration Rate of Moss-Dominated Biocrusts and their Relationships with Temperature and Moisture in Asemiarid Ecosystem-sciencedirect. Catena 2019, 183, 104195. [Google Scholar] [CrossRef]
  30. Rania, M.A.N.; Mohamed, S.B.; Mercedes, B. Physiological and Nnatomical Studies of Two Wheat Cultivars Irrigated with Magnetic Water under Drought Stress Conditions-Sciencedirect. Plant Physiol. Biochem. 2019, 135, 480–488. [Google Scholar] [CrossRef]
  31. Selim, A.F.H.; El-Nady, M.F. Physio-Anatomical Responses of Drought Stressed Tomato Plants to Magnetic Field. Acta Astronaut 2011, 69, 387–396. [Google Scholar] [CrossRef]
  32. Radhakrishnan, R.; Kumari, B. Pulsed Magnetic Field: A Contemporary Approach Offers to Enhance Plant Growth and Yield of Soybean. Plant Physiol. Biochem. 2012, 51, 139–144. [Google Scholar] [CrossRef]
  33. Zhang, F.J.; Zhang, K.K.; Du, C.Z.; Li, J.; Xing, Y.X.; Yang, L.T.; Li, Y.R. Effect of Drought Stress on Anatomical Structure and Chloroplast Ultrastructure in Leaves of Sugarcane. Sugar Tech. 2015, 17, 41–48. [Google Scholar] [CrossRef]
  34. Al-Khazan, M.; Abdullatif, B.M.; Al-Assaf, N. Effects of Magnetically Treated Water on Water Status, Chlorophyll Pigments and Some Elements Content of jojoba (Simmondsia chinensis L.) at Different Growth Stages. Afr. J. Environ. Sci. Technol. 2011, 5, 722–731. [Google Scholar] [CrossRef]
  35. Wang, X.H.; Kong, X.J.; Li, L.J.; Jia, P.P.; Cheng, X.G.; Zhang, X.T.; Zhang, L.; Xue, H.Y.; Khan, A.; Zhang, Z.Y. Rubisco Small Subunits’ Genome-Wide Identification and their Function from Gene Expression to Rubisco Activity and Photosynthesis Among Peanut Genotypes under Different Nitrogen Levels. Agronomy 2022, 12, 2316. [Google Scholar] [CrossRef]
  36. Akita, R.; Kamiyama, C.; Hikosaka, K. Polygonum Sachalinense Alters the Balance Between Capacities of Regeneration and Carboxylation of Ribulose1, 5-Bisphosphate in Response to Growth CO2 Increment But Not the Nitrogen Allocation Within the Photosynthetic Apparatus. Physiol. Plant 2012, 146, 404–412. [Google Scholar] [CrossRef] [PubMed]
  37. Jiao, L.; Wang, L.; Zhou, Q.; Huang, X. Stomatal and Non-stomatal Factors Regulated the Photosynthesis of Soybean Seedlings in the Present of Exogenous Bisphenol a. Ecotoxicol. Environ. Saf. 2017, 145, 150–160. [Google Scholar] [CrossRef]
  38. Buckley, T.N. Modeling Stomatal Conductance. Plant Physiol. 2017, 174, 572–582. [Google Scholar] [CrossRef] [Green Version]
  39. Farquhar, G.D.; Sharkey, T.D. Stomatal Conductance and Photosynthesis. Annu. Rev. Plant Physiol. 1982, 33, 317–345. [Google Scholar] [CrossRef]
  40. Ogbe, A.A.; Finnie, J.F.; Van Staden, J. The Role of Endophytes in Secondary Metabolites Accumulation in Medicinal Plants under Abiotic Stress. S. Afr. J. Bot. 2020, 134, 126–134. [Google Scholar] [CrossRef]
  41. Vellosillo, T.; Vicente, J.; Kulasekaran, S.; Hamberg, M.; Castresana, C. Emerging Complexity in Reactive Oxygen Species Production and Signaling During the Response of Plants to Pathogens. Plant Physiol. 2010, 154, 444–448. [Google Scholar] [CrossRef] [Green Version]
  42. Yu, X.C.; Li, Y.; Chang, J.Z.; Ihsan, M.; Xun, B.Z.; Hong, D.Z. Effects of Soaking Seeds in Exogenous Vitamins on Active Oxygen Metabolism and Seedling Growth under Low-Temperature Stress. Saudi J. Biol. Sci. 2021, 28, 3254–3261. [Google Scholar] [CrossRef]
  43. Wang, Q.J.; Zhang, J.H.; Meng, Q.; Tan, S.; Zhou, L.W.; Liu, X.Y. Experiment on Physical and Chemical Characteristics of Activated Brackish Water. Trans. Chin. Soc. Agric. Eng. 2016, 32, 60–66. [Google Scholar] [CrossRef]
  44. Kilani, B.R.; Delphine, L.V.; Isabel, L.D.; Leprince, A.S.; Marianne, B.; Maldiney, R.; Asma, J.; Chedly, A.; Arnould, S. Hydrogen Peroxide Produced by NADPH Oxidases Increases Proline Accumulation During Salt or Mannitol Stress in Arabidopsis Thaliana. New Phytol. 2015, 208, 1138–1148. [Google Scholar] [CrossRef] [Green Version]
  45. Liao, W.; Huang, G.; Yu, J.; Zhang, M.; Shi, X. Nitric Oxide and Hydrogen Peroxide are Involved in Indole-3-Butyric Acid-Induced Adventitious root Development in Marigold. J. Pomol. Hortic. Sci. 2015, 86, 159–165. [Google Scholar] [CrossRef]
  46. Hu, J.Y.; Yan, C.; Li, S.; Tang, H.; Chen, Y.H. Comparative Physiological Responses and Transcriptome Analysis Revealing the Metabolic Regulatory Mechanism of Prunella vulgaris L. Induced by Exogenous Application of Hydrogen Peroxide. Ind. Crops Prod. 2023, 192, 116065. [Google Scholar] [CrossRef]
  47. Li, X.; Bao, Z.Y.; Chen, Y.N.; Lan, Q.Q.; Song, C.B.; Shi, L.Y.; Chen, W.; Cao, S.F.; Yang, Z.F.; Zheng, Q.B. Exogenous Glutathione Modulates Redox Homeostasis in Okra (Abelmoschus esculentus) During Storage. Postharvest Biol. Technol. 2023, 195, 112145. [Google Scholar] [CrossRef]
  48. Liu, T.; Ye, X.L.; Li, M.; Li, J.M.; Qi, H.Y.; Hu, X.H. H2O2 and NO are Involved in Trehalose-regulated Oxidative Stress Tolerance in Cold-stressed Tomato Plants. Environ. Exp. Bot. 2020, 171, 103961. [Google Scholar] [CrossRef]
  49. Yao, M.M.; Ge, W.Y.; Zhou, Q.; Zhou, X.; Luo, M.L.; Zhao, Y.B.; Wei, B.D.; Ji, S.J. Exogenous Glutathione Alleviates Chilling Injury in Postharvest Bell Pepper by Modulating the Ascorbate-Glutathione (AsA-GSH) Cycle. Food Chem. 2021, 352, 129458. [Google Scholar] [CrossRef] [PubMed]
  50. Xu, A.Q.; Cheng, F.; Zhou, S.; Hu, H.; Bie, Z.L. Chilling-Induced H2O2 Signaling Activates the Antioxidant Enzymes in Alleviating the Photooxidative Damage Caused by Loss of Function of 2-Cys Peroxiredoxin in Watermelon. Plant Stress 2022, 6, 100108. [Google Scholar] [CrossRef]
  51. Rahman, M.A.; Alam, I.; Sharmin, S.A.; Kabir, A.H.Y.; Kim, Y.G.; Liu, G.S.; Lee, B.H. Physiological and Proteomic Analyses Reveal the Protective Roles of Exogenous Hydrogen Peroxide in Alleviating Drought Stress in Soybean Plants. Plant Biotechnol. Rep. 2021, 15, 805–818. [Google Scholar] [CrossRef]
  52. Diana, S.L.O.; Morales, L.O.; Strid, A.; Torres, P.I.; Guevara, G.R.G. UV-B Exposure and Exogenous Hydrogen Peroxide Application Lead to Cross-tolerance Toward Drought in Nicotiana tabacum L. Physiol. Plant 2021, 173, 666–679. [Google Scholar] [CrossRef]
  53. Lee, B.R.; La, V.H.; Park, S.H.; Mamun, M.A.; Bae, D.W.; Kim, T.H. H2O2-Responsive Hormonal Status Involves Oxidative Burst Signaling and Proline Metabolism in Rapeseed Leaves. Antioxidants 2022, 11, 566. [Google Scholar] [CrossRef] [PubMed]
  54. Shaila, S.T.; Moklasur, R.; Farjana, R.; Mehera, A.S.; Muhammad, H.K.; Anamul, H.; Mohammad, S.R. Seed Priming with Salicylic Acid (SA) and Hydrogen Peroxide (H2O2) Improve Germination and Seedling Growth of Wheat (Triticum aestivum) under Salt Stress. Asian J. Res. Crop Sci. 2021, 6, 60–69. [Google Scholar] [CrossRef]
  55. Yang, J.Y.; Wang, P.J.; Li, S.Z.; Liu, T.; Hu, X.H. Polyamine Oxidase Triggers H2O2-Mediated Spermidine Improved Oxidative Stress Tolerance of Tomato Seedlings Subjected to Saline-Alkaline Stress. Int. J. Mol. Sci. 2022, 23, 1625. [Google Scholar] [CrossRef] [PubMed]
  56. Tania, S.S.; Rhaman, M.S.; Rauf, F.; Rahaman, M.M.; Kabir, M.H.; Hoque, M.A.; Murata, Y. Alleviation of Salt-Inhibited Germination and Seedling Growth of Kidney Bean by Seed Priming and Exogenous Application of Salicylic Acid (SA) and Hydrogen Peroxide (H2O2). Seeds 2022, 1, 87–98. [Google Scholar] [CrossRef]
  57. Yao, X.; Zhou, M.L.; Ruan, J.J.; Peng, Y.; Ma, C.; Wu, W.J.; Gao, A.J.; Weng, W.F.; Cheng, J.P. Physiological and Biochemical Regulation Mechanism of Exogenous Hydrogen Peroxide in Alleviating NaCl Stress Toxicity in Tartary Buckwheat (Fagopyrum tataricum (L.) Gaertn). Int. J. Mol. Sci. 2022, 23, 10698. [Google Scholar] [CrossRef]
  58. Darmanti, S.; Hastuti, E.D.; Suedy, S.W.A. Exogenous Hydrogen Peroxide Induce an Antioxidative Defense System Against Drought Stress in Soybeanglycine Max (L.) Merr Crops. J. Biol. Sci. 2020, 31, 213–220. [Google Scholar] [CrossRef]
  59. Moussa, H.R. The Impact of Magnetic Water Application for Improving Common Bean (Phaseolus vulgaris L.) Production. Nyc. Sci. J. 2015, 4, 15–20. [Google Scholar] [CrossRef]
  60. Gao, Y.; Sun, Y.F.; Zhang, R.X.; Chu, G. Effects of Magnetic Water Irrigation on the Growth, N Uptake and Antioxidant Enzyme Activities of Cotton Seedlings. J. Agric. Sci. Technol. 2017, 7, 9. [Google Scholar] [CrossRef]
Figure 1. Dynamic changes in leaf total nitrogen under different treatments. CK-1, CK-2, CK-3, CK-4, and CK-5 indicate that the soil moisture content is controlled at 45–55%, 55–65%, 65–75%, 75–85%, and 85–95% of the field capacity with conventional water, respectively; MD-1, MD-2, MD-3, MD-4, and MD-5 indicate that the soil moisture content is controlled at 45–55%, 55–65%, 65–75%, 75–85%, and 85–95% of the field capacity with magnetoelectric water, respectively.LTN, leaf total nitrogen.
Agronomy 13 00657 g001
Figure 2. Dynamic changes in the fresh weight of the aerial part of spinach under different treatments. CK-1, CK-2, CK-3, CK-4, and CK-5 indicate that the soil moisture content is controlled at 45–55%, 55–65%, 65–75%, 75–85%, and 85–95% of the field capacity with conventional water, respectively; MD-1, MD-2, MD-3, MD-4, and MD-5 indicate that the soil moisture content is controlled at 45–55%, 55–65%, 65–75%, 75–85%, and 85–95% of the field capacity with magnetoelectric water, respectively. LTN, leaf total nitrogen; FWA, fresh weight of the aerial part.
Agronomy 13 00657 g002
Figure 3. Daily growth rate of the fresh weight of the aerial part of spinach under different treatments.CK-1, CK-2, CK-3, CK-4, and CK-5 indicate that the soil moisture content is controlled at 45–55%, 55–65%, 65–75%, 75–85%, and 85–95% of the field capacity with conventional water, respectively; MD-1, MD-2, MD-3, MD-4, and MD-5 indicate that the soil moisture content is controlled at 45–55%, 55–65%, 65–75%, 75–85%, and 85–95% of the field capacity with magnetoelectric water, respectively.
Agronomy 13 00657 g003
Figure 4. The increase in chlorophyll was related to the increase in total nitrogen amount (A) and growth rate (B), respectively. N, leaf total nitrogen; C, chlorophyll a + b increase; G, growth rate increase; FC, field capacity.
Agronomy 13 00657 g004
Figure 5. Response of the photosynthetic characteristics of spinach to photosynthetic effective radiation under different treatments. FC, field capacity. The left figure shows CK processing, and the right figure shows MD processing.
Agronomy 13 00657 g005aAgronomy 13 00657 g005b
Figure 6. Comparison of the fitting effects of four models of two irrigation water on spinach light response curve under different soil moisture contents. CK-1, CK-2, CK-3, CK-4, and CK-5 indicate that the soil moisture content is controlled at 45–55%, 55–65%, 65–75%, 75–85%, and 85–95% of the field capacity with conventional water, respectively; MD-1, MD-2, MD-3, MD-4, and MD-5 indicate that the soil moisture content is controlled at 45–55%, 55–65%, 65–75%, 75–85%, and 85−95% of the field capacity with magnetoelectric water, respectively.
Agronomy 13 00657 g006
Figure 7. Fitting value and the measured value of Pn by the modified rectangular hyperbolic model under different soil moisture contents. CK-1, CK-2, CK-3, CK-4, and CK-5 indicate that the soil moisture content is controlled at 45–55%, 55–65%, 65–75%, 75–85%, and 85–95% of the field capacity with conventional water, respectively; MD-1, MD-2, MD-3, MD-4, and MD-5 indicate that the soil moisture content is controlled at 45–55%, 55–65%, 65–75%, 75–85%, and 85−95% of the field capacity with magnetoelectric water, respectively. RMSE, root mean square error; MAE, mean absolute error.
Agronomy 13 00657 g007
Table 1. Experimental treatments combination.
TreatmentIrrigation TypeSoil Moisture Content
CK-1conventional water45–55%FC
CK-2conventional water55–65%FC
CK-3conventional water65–75%FC
CK-4conventional water75–85%FC
CK-5conventional water85–95%FC
MD-1magnetoelectric water45–55%FC
MD-2magnetoelectric water55–65%FC
MD-3magnetoelectric water65–75%FC
MD-4magnetoelectric water75–85%FC
MD-5magnetoelectric water85–95%FC
CK-1, CK-2, CK-3, CK-4, and CK-5 indicate that the soil moisture content is controlled at 45–55%, 55–65%, 65–75%, 75–85%, and 85–95% of the field capacity with conventional water, respectively; MD-1, MD-2, MD-3, MD-4, and MD-5 indicate that the soil moisture content is controlled at 45–55%, 55–65%, 65–75%, 75–85%, and 85–95% of the field capacity with magnetoelectric water, respectively. FC, field capacity.
Table 2. Parameters of the logistic model for the fresh weight of aerial part of different treatments.
TreatmentLogistic Model Parameter ValuesRMSER2
FWAmaxAB
CK-13.62 ± 0.55 i5.9580.1380.0220.998
MD-13.81 ± 0.28 i8.3970.2100.0680.993
CK-25.3 ± 0.43 h6.3780.1570.0340.998
MD-27.69 ± 0.12 g5.6710.1450.0070.999
CK-38.41 ± 0.35 f5.5850.1260.0280.999
MD-312.86 ± 0.19 a4.3370.1030.0920.998
CK-411.43 ± 0.26 c5.6450.1245.0130.998
MD-412.17 ± 0.23 b5.0130.1180.0150.999
CK-59.74 ± 0.24 e5.5800.1260.0260.997
MD−510.59 ± 0.32 d5.1360.1190.0180.999
CK-1, CK-2, CK-3, CK-4, and CK-5 indicate that the soil moisture content is controlled at 45–55%, 55–65%, 65–75%, 75–85%, and 85–95% of the field capacity with conventional water, respectively; MD-1, MD-2, MD-3, MD-4, and MD-5 indicate that the soil moisture content is controlled at 45–55%, 55–65%, 65–75%, 75–85%, and 85–95% of the field capacity with magnetoelectric water, respectively. A; B, fitting parameters; FWAmax, theoretical maximum of aboveground fresh weight; RMSE, root mean square error. Mean ± SD (n = 3) followed by different lowercase letters in the same column differ significantly at p < 0.05.
Table 3. Analysis of variance of the total nitrogen in spinach leaves, fresh weight of aerial parts, and interaction between irrigation water type and soil moisture content.
TreatmentLTNFWA
FPFP
Irrigation water type49.2858.24 × 10−7175.382.33 × 10−11
Soil moisture content81.6194.28 × 10−12505.368.88 × 10−20
Irrigation water type × Soil moisture content0.7070.59735.667.73 × 10−9
R20.9270.988
LTN, leaf total nitrogen; FWA, fresh weight of the aerial part. F; P, Indicates a significant difference.
Table 4. Chlorophyll content of spinach under different treatments.
TreatmentChl a
(mg·g−1)
Chl b
(mg·g−1)
Chl a/b
(mg·g−1)
Chl a + b
(mg·g−1)
CK-10.87 ± 0.13 h0.38 ± 0.02 e2.29 ± 0.07 i1.25 ± 0.12 i
MD-11.24 ± 0.06 g0.51 ± 0.04 d2.43 ± 0.05 f1.75 ± 0.09 h
CK-21.49 ± 0.11 f0.56 ± 0.04 d2.66 ± 0.1 e2.04 ± 0.06 g
MD-21.84 ± 0.05 e0.62 ± 0.02 cd2.97 ±0.06 cd2.46 ± 0.07 f
CK-31.87 ± 0.08 de0.63 ± 0.05 bcd2.98 ±0.05 c2.48 ± 0.09 ef
MD-32.41 ± 0.11 b0.75 ± 0.0 8 b3.21 ±0.07 ab3.16 ± 0.15 c
CK-43.32 ± 0.31 a1.05 ± 0.08 a3.16 ±0.02 b4.37 ± 0.11 b
MD-43.47 ± 0.22 a1.11 ± 0.11 a3.13 ±0.06 a4.58 ± 0.12 a
CK-51.97 ± 0.09 cd0.69 ± 0.06 bc2.86 ±0.09 d2.66 ± 0.11 de
MD-52.11 ± 0.08 c0.7 ± 0.08 b3.01 ±0.07 bc2.81 ± 0.08 d
CK-1, CK-2, CK-3, CK-4, and CK-5 indicate that the soil moisture content is controlled at 45–55%, 55–65%, 65–75%, 75–85%, and 85–95% of the field capacity with conventional water, respectively; MD-1, MD-2, MD-3, MD-4, and MD-5 indicate that the soil moisture content is controlled at 45–55%, 55–65%, 65–75%, 75–85%, and 85–95% of the field capacity with magnetoelectric water, respectively. Chl a, chlorophyll a; chl b, chlorophyll b; chl a/b, chlorophyll a/b; chl a + b, chlorophyll a + b. Mean ± SD (n = 3) followed by different lowercase letters in the same column differ significantly at p < 0.05.
Table 5. Precision comparison of simulation values of light response curves by four light response models.
ModelsTreatmentRMSE
µmol·m−2·s−1
MAE
µmol·m−2·s−1
R2ModelsTreatmentsRMSE
µmol·m−2·s−1
MAE
µmol·m−2·s−1
R2
Rectangular hyperbolic modelCK-10.5830.4530.992Non-
rectangular hyperbolic model
CK-10.3730.3020.997
MD-10.6560.5330.991MD-10.5100.4090.994
CK-20.7950.6350.989CK-20.5120.4340.995
MD-20.7770.5990.991MD-20.5340.440.996
CK-30.7580.5550.993CK-30.6640.490.995
MD-30.8630.6950.993MD-30.7710.6620.995
CK-40.7680.6410.995CK-40.6740.5550.996
MD-40.5880.4780.998MD-40.5340.4490.998
CK-50.5290.3920.997CK-50.4580.3540.998
MD-50.5110.4070.998MD-50.4690.3950.998
Modified rectangular hyperbolic modelCK-10.3150.2920.998Exponential
model
CK-10.3550.310.997
MD-10.2210.190.999MD-10.3890.3020.997
CK-20.2330.1850.999CK-20.3920.3270.997
MD-20.2170.1740.999MD-20.3850.2980.998
CK-30.4390.3690.998CK-30.6020.5040.996
MD-30.4450.3640.998MD-30.630.5460.997
CK-40.4290.2960.999CK-40.5860.4320.997
MD-40.3670.3030.999MD-40.7230.5780.996
CK-50.3590.3010.999CK-50.5770.4870.996
MD-50.3160.2580.999MD-50.5020.4110.998
CK-1, CK-2, CK-3, CK-4, and CK-5 indicate that the soil moisture content is controlled at 45–55%, 55–65%, 65–75%, 75–85%, and 85–95% of the field capacity with conventional water, respectively; MD-1, MD-2, MD-3, MD-4, and MD-5 indicate that the soil moisture content is controlled at 45–55%, 55–65%, 65–75%, 75–85%, and 85–95% of the field capacity with magnetoelectric water, respectively. RMSE, root mean square error; MAE, mean absolute error.
Table 6. Parameters of the spinach light response curve from the modified rectangular hyperbolic model.
TreatmentαPnmax
µmol·m−2·s−1
Ic
µmol·m−2·s−1
Is
µmol·m−2·s−1
Rd
µmol·m−2·s−1
R2ΔI = IsIc
µmol·m−2·s−1
CK-10.038 ± 0.003 i13.88 ± 0.59 g29.98 ± 0.42 a1680.73 ± 12.35 h1.15 ± 0.05 h0.9981650.75
MD-10.049 ± 0.004 h16.99 ± 0.97 f26.96 ± 0.36 c1748.88 ± 8.52 f1.32 ± 0.06 g0.9991721.91
CK-20.048 ± 0.005 h16.97 ± 0.68 f27.80 ± 0.51 b1726.72 ± 10.37 g1.36 ± 0.04 g0.9991698.92
MD-20.061 ± 0.002 g22.77 ± 0.51 e24.90 ± 1.14 e2001.42 ± 45.54 e1.51 ± 0.06 f0.9991976.5
CK-30.067 ± 0.003 f24.68 ± 0.33 d26.82 ± 0.63 e1991.70 ± 28.73 e1.80 ± 0.06 e0.9981964.88
MD-30.091 ± 0.003 c26.53 ± 0.82 c23.26 ± 0.31 f2278.81 ± 16.22 c2.12 ± 0.02 c0.9982255.54
CK-40.099 ± 0.003 b31.13 ± 1.25 b22.76 ± 0.24 g2325.34 ±14.84 b2.24 ± 0.05 b0.9992302.58
MD-40.129 ± 0.005 a33.73 ± 1.13 a20.29 ± 0.53 h2517.71 ± 65.41 a2.61 ± 0.14 a0.9992497.43
CK-50.072 ± 0.002 e24.46 ± 0.65 d25.09 ± 0.22 d2212.51 ± 23.68 d1.80 ± 0.04 e0.9992187.42
MD-50.079 ± 0.003 d31.03 ± 1.37 b24.64 ± 0.21 e2251.21 ± 9.34 d1.95 ± 0.08 d0.9992226.61
CK-1, CK-2, CK-3, CK-4, and CK-5 indicate that the soil moisture content is controlled at 45–55%, 55–65%, 65–75%, 75–85%, and 85–95% of the field capacity with conventional water, respectively; MD-1, MD-2, MD-3, MD-4, and MD-5 indicate that the soil moisture content is controlled at 45–55%, 55–65%, 65–75%, 75–85%, and 85–95% of the field capacity with magnetoelectric water, respectively. α, apparent quantum efficiency; Pnmax, maximum net photosynthetic rate; Ic, light compensation point; Is, light saturation point; Rd, dark respiration rate; ΔI, available light intensity range. Mean ± SD (n = 3) followed by different lowercase letters in the same column differ significantly at p < 0.05.
Disclaimer/Publisher’s Note: The statements, opinions and data contained in all publications are solely those of the individual author(s) and contributor(s) and not of MDPI and/or the editor(s). MDPI and/or the editor(s) disclaim responsibility for any injury to people or property resulting from any ideas, methods, instructions or products referred to in the content.

