Next Article in Journal
The Birds and the Bees: Producing Beef and Conservation Benefits on Working Grasslands
Next Article in Special Issue
Strategy for Selection of Drought-Tolerant Arabica Coffee Genotypes in Brazil
Previous Article in Journal
Phenotypic Broad Spectrum of Bacterial Blight Disease Resistance from Thai Indigenous Upland Rice Germplasms Implies Novel Genetic Resource for Breeding Program
Previous Article in Special Issue
Association of Altitude and Solar Radiation to Understand Coffee Quality
 
 
agronomy-logo
Article Menu
Article

The New Standpoints for the Terroir of Coffea canephora from Southwestern Brazil: Edaphic and Sensorial Perspective

by
Cristhiane Altoé Filete
1,
Taís Rizzo Moreira
2,
Alexandre Rosa dos Santos
2,
Willian dos Santos Gomes
3,
Rogério Carvalho Guarçoni
4,
Aldemar Polonini Moreli
1,
Maria Imaculada Augusto
1,
Raabe de Oliveira Abreu
1,
Marinalva Maria Bratz Simmer
1,
Alice Dela Costa Caliman
1,
Cleidiana Vieira Guimarães
1,
Savio da Silva Berilli
5,
Maria Amélia Gava Ferrão
6,
Aymbiré Francisco Almeida da Fonseca
6,
Fábio Luiz Partelli
7,
Ana Paula Candido Gabriel Berilli
5,
Emanuele Catarina da Silva Oliveira
1 and
Lucas Louzada Pereira
1,*
1
Federal Institute of Education Science and Technology of Espírito Santo, Venda Nova do Imigrante, Vitória 29375-000, Brazil
2
Center for Agrarian Sciences and Engineering, Federal University of Espírito Santo, Av. Gov. Lindemberg, 316—Centro, Jerônimo Monteiro, Vitória 29375-000, Brazil
3
Genetic Improvement Program, Federal University of Espírito Santo, S/N Guararema, Alegre—ES, Vitória 29375-000, Brazil
4
Capixaba Institute for Research, Technical Assistance and Rural Extension, Venda Nova do Imigrante, Vitória 29375-000, Brazil
5
Laboratory of Plant Science and Production, Federal University of Espírito Santo, Alegre, Vitória 29375-000, Brazil
6
Brazilian Agricultural Research Company/Incaper, Area of Research and Genetic Improvement, Rua Afonso Sarlo, 160, Bento Ferreira, Vitória 29375-000, Brazil
7
Department of Agricultural and Biological Sciences, Federal University of Espírito Santo, Highway BR 101, Km 60, Vitória 29375-000, Brazil
*
Author to whom correspondence should be addressed.
Agronomy 2022, 12(8), 1931; https://doi.org/10.3390/agronomy12081931
Submission received: 12 July 2022 / Revised: 11 August 2022 / Accepted: 15 August 2022 / Published: 17 August 2022
(This article belongs to the Special Issue Coffee—from Plant to Cup)

Abstract

:
The sensory profile from the Coffea canephora stands out for being denser, less sweet, presenting less acidity, and having characteristics of a marked aroma of roasted cereals. Coffee is essentially a terroir product, that is, directly influenced by environmental aspects, both natural and anthropic, in this sense, it has been argued that Coffea canephora is linked to the context of inferior coffees in sensory terms by the terroir conditions. This study aimed to characterize and investigate the terroir in different areas of Conilon coffee production, with the application of different fermentation methods, and to observe their possible gains and losses in the sensory quality of Coffea canephora. Cherry coffee samples were collected in six municipalities in the state of Espírito Santo, Brazil, which has an altitude variation from 376 m to 866 m. The study showed that the local characteristics of altitude and temperature directly influence the sensory quality, as well as demonstrated that natural fermentation in a specific altitude zone delivered good results, fixing the terroir factor. Finally, it was demonstrated that induced fermentation helps to improve sensory quality for higher altitude areas, indicating the possibility of reformulating the terroir of Conilon coffee production.

1. Introduction

Coffee is one of the most important agricultural commodities, with coffee beans available in the world in about 60 tropical and subtropical countries, and in some of the main countries it stands out as the agricultural product exported [1]. The main coffee species produced and marketed are Coffea arabica L. and Coffea canephora Pierre ex A. Froehner, which represent 63% and 37%, respectively, of world production [2].
There are differences between the two species such as geographic distribution, genetics, physiology, chemistry, sensory attributes, industrial use, market segments, and price. The popularity and consumption of C. canephora have increased in recent years due to the expansion of markets in emerging economies, in the soluble coffee industry, and in the composition of blends with arabica coffee [3].
The C. canephora is outstanding, usually for presenting neutrality in terms of sweetness and acidity, having a marked aroma of roasted cereals, and standing out for its more pronounced body when compared to arabica coffee. Thus, in recent years there has been a collective effort in the development of studies with the objective of enhancing the quality curve of this species. Among the several possibilities, the fermentation of the beans has been considered promising for the improvement of the sensorial quality, since the process plays an important role in the degradation of the mucilage, conferring several metabolic products precursors of aroma and flavor to the coffee beverage [4].
Another attempt to advance C. canephora concerns the expansion of cultivation regions, commonly, C. canephora is cultivated at low altitudes (100 to 600 m of altitude), adapting well to warmer climates, with average temperatures between 22 and 26 °C and with precipitation above 1200 mm per year [5,6,7,8]. In recent years, the variability for adaptation of the species in higher altitude areas has been studied. This demand comes from its adaptation in some transition areas for planting C. arabica and C. canephora, combined with climate change scenarios for the coming decades [9,10,11].
As coffee is a terroir product, the terrain where the plants are grown has a highly significant impact on the pursuit of unique characteristics of the beverage [5], as well as other factors. Thus, terroir is more than a mere geographical link between product and land. It relates to the idea that products are a unique expression of different environmental and sociocultural characteristics of a specific location [12].
Terroir has been recognized as an important factor in the quality of cultivated products, the study of the theme is related to the understanding of a certain territory, in which different local factors provide products with different qualities. When under the influence of these factors, products carry with them all the characteristics inherent to the specific elements of the geographical area, thus promoting their differentiation [13].
Although terroir is often characterized as a fixed and territorially defined conception, anthropological studies clearly show that terroir is actually a dynamic and ever-changing discursive strategy used to advance the claims of individual, regional, and even national interests [14]. The terroir mystifies and naturalizes agricultural landscapes that are being transformed, recreated, and that present unique characteristics.
While the expansion of C. canephora cultivation offers new opportunities for mountain coffee cultivation, it is questionable whether such changes collaborate with the development of the quality of the beverage [15]. There is evidence regarding the role of terroir in coffee quality, especially in Coffea arabica [16], but little is known about the impact of this change on the sensory quality of Conilon coffee in altitude zones.
Thus, the present study investigated the impact of terroir on the sensory quality of Coffea canephora grown in different locations (farms) in the mountain region of the state of Espírito Santo and subjected to different processing and fermentation treatments. The purpose of this study lies in the understanding of the new dynamics of production of Coffea canephora in Brazil, with the Espírito Santo region having the largest area of representation of the Conilon culture, thus making up the new trajectory of production of canephora with quality, thus demonstrating the characterization and contours of this terroir.

2. Materials and Methods

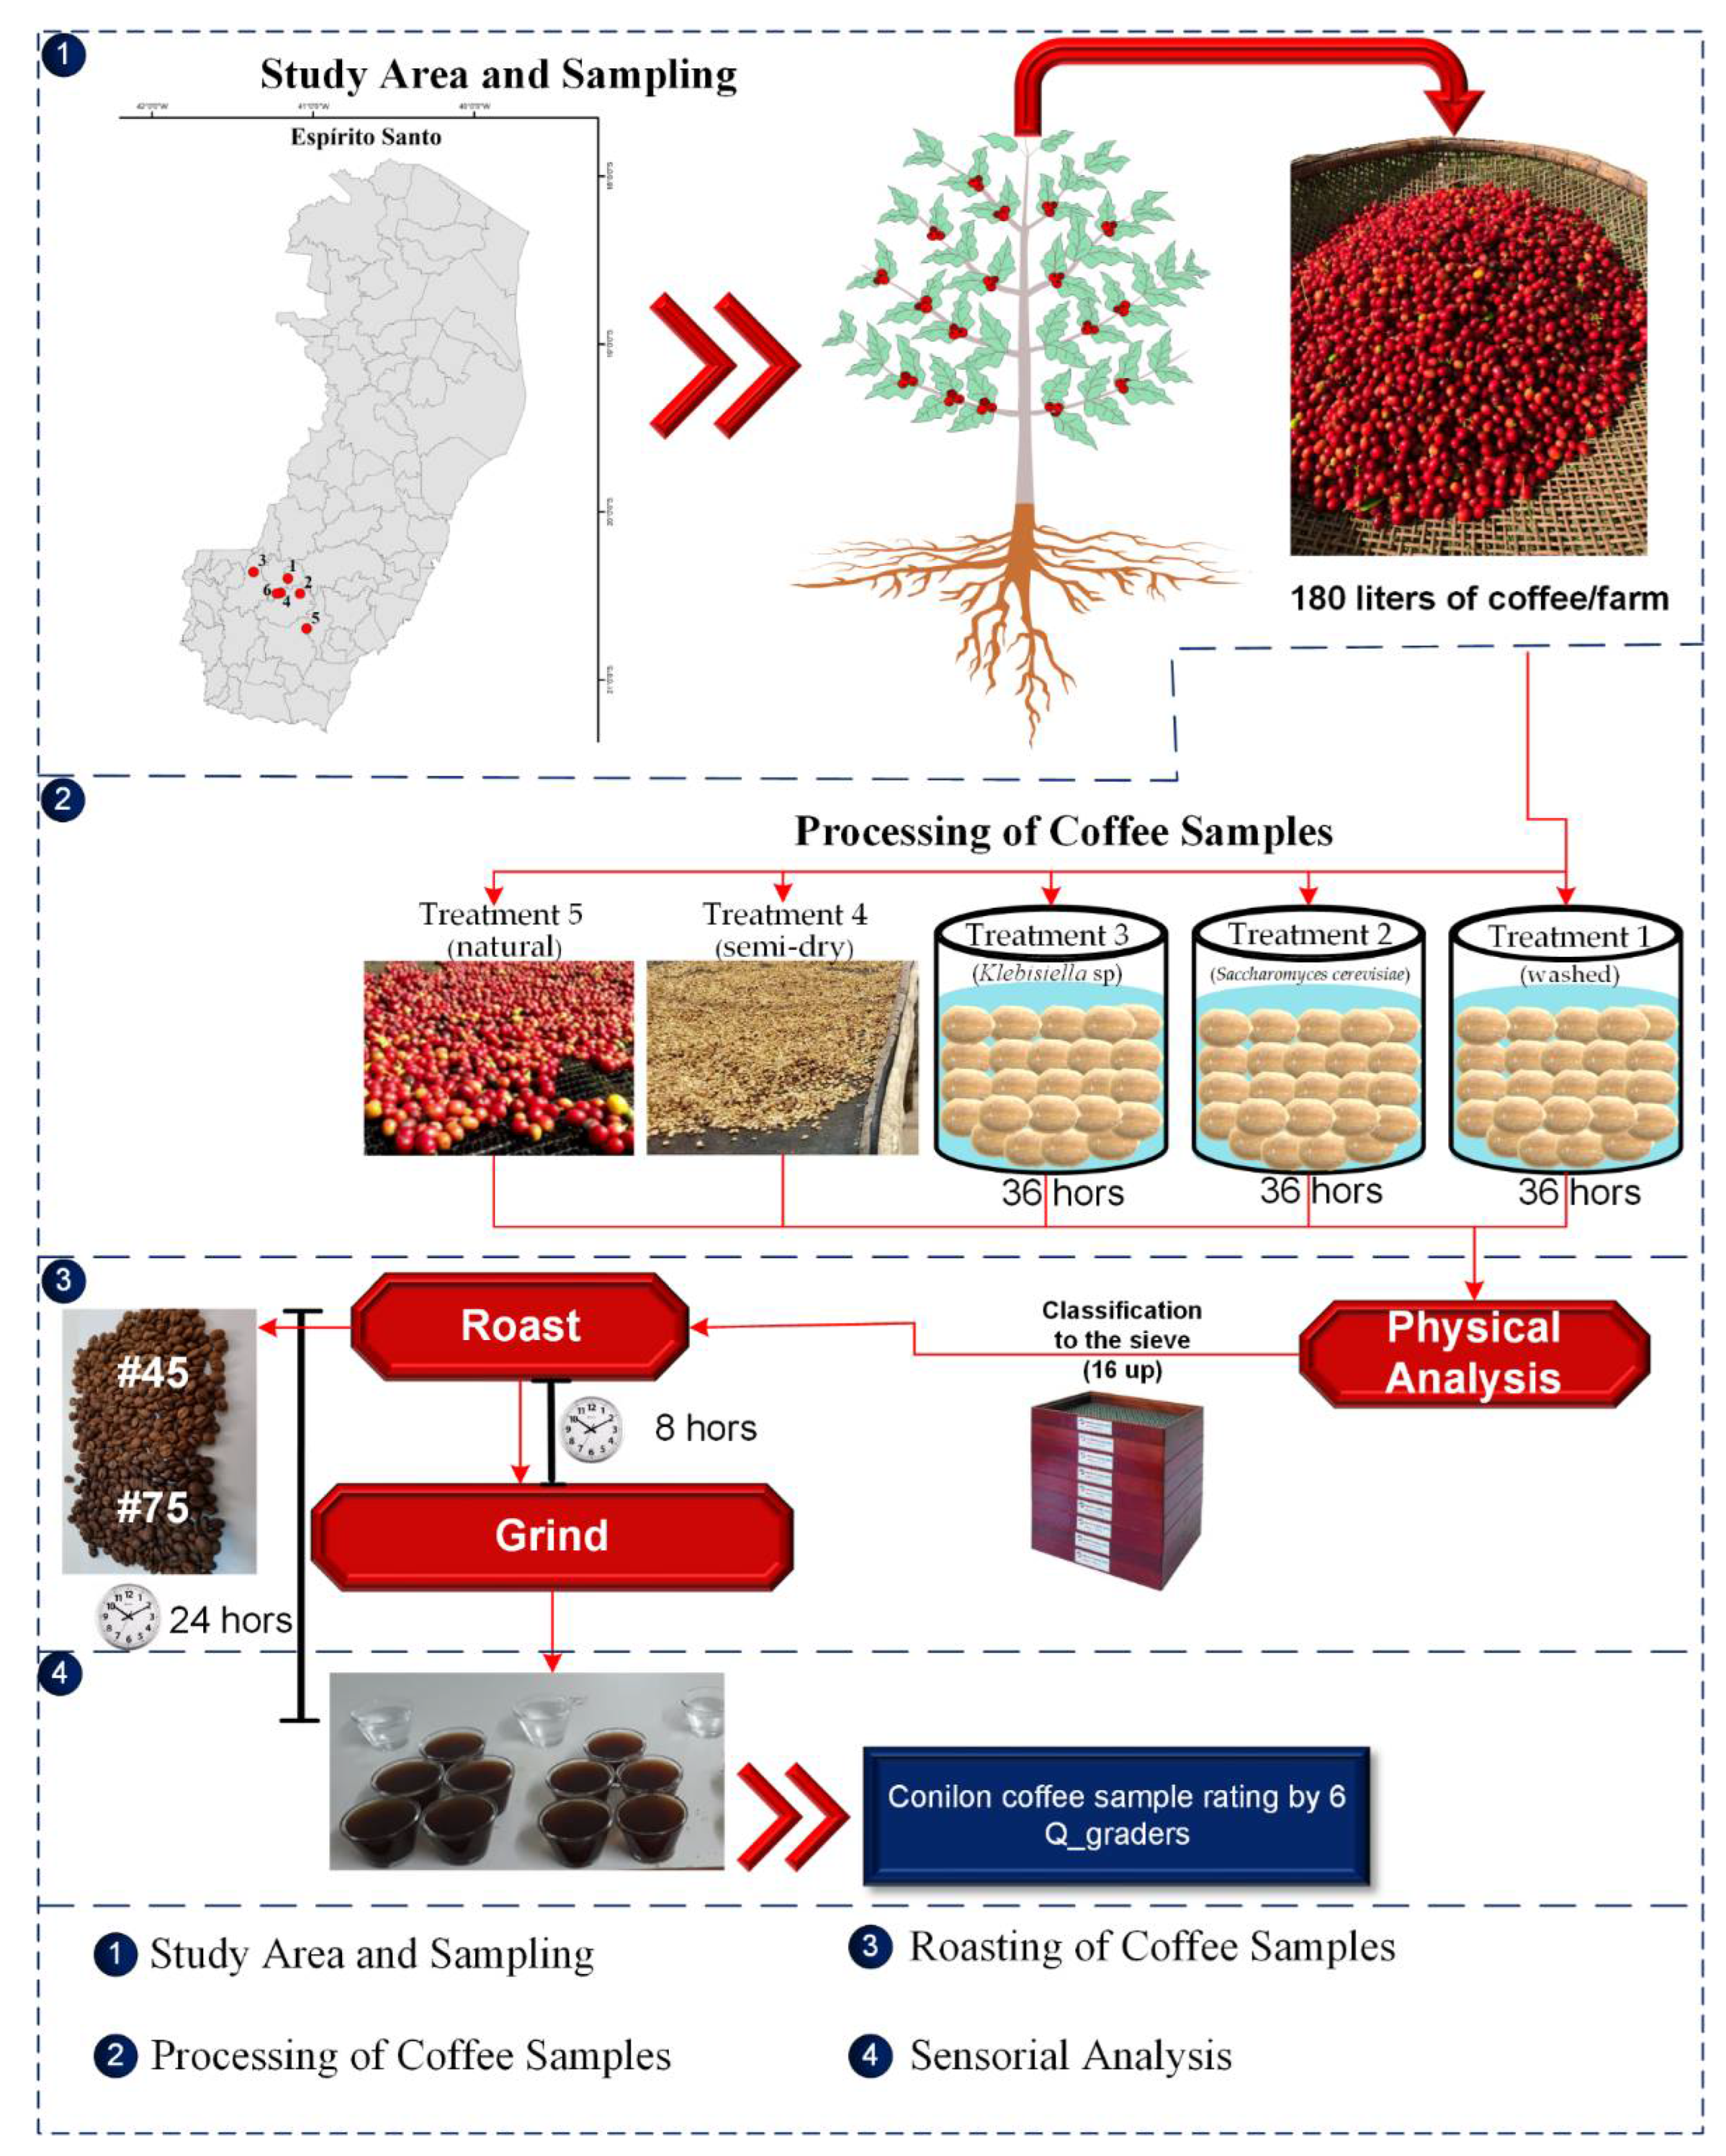
2.1. Study Area and Sampling

The coffees selected for this study were Coffea canephora var. Conilon from the 2020 crop, belonging to the clonal cultivar “Vitória”. The harvest of fruits in the cherry stage with maturation greater than 90% was carried out manually and selectively, without contact with the soil. The experiment was carried out in five municipalities in the Serrana and Caparaó region of the State of Espírito Santo: Venda Nova do Imigrante (1), Castelo (2), Muniz Freire (3), Conceição do Castelo 1 (4), Vargem Alta (5), and Conceição do Castelo 2 (6) (Figure 1).

2.2. Edaphoclimatic Characterization

Information from meteorological stations in the state of Espírito Santo and neighboring regions was used to obtain temperature and precipitation data for the study areas (Figure A1 and Figure A2). After data acquisition, they were pre-analyzed and spatialized in a GIS environment according to the methodology proposed by Santos et al. [16].
Precipitation data were calculated based on the monthly average of accumulated precipitation for the years 1977 to 2011 and temperature data were obtained through the monthly average of data from 1982 to 2011 (Table 1).
Data from Cunha et al. [17] and the Shuttle Radar Topography Mission (SRTM) were used to obtain the soil types of the study areas and their altitudes, respectively. Data were pre-processed in a GIS environment and information was extracted based on the geographic coordinates of each point (Table 1). Then, the quantitative data of temperature, precipitation, and altitude were grouped using the fuzzy Cmeans technique in the R application [18,19]. The parameters used for the fuzzy Cmeans technique were the maximum number of interactions of 100, the distance was calculated using the Euclidean technique that considers the squared error to calculate the variables belonging to each cluster, and the degree of fuzzification equal to 2, the higher, more diffuse are the membership values of the clustered data points (Figure 2).

2.3. Processing of Coffee Samples

The coffee was sent, after harvesting, to the processing unit located at the Coffee Analysis and Research Laboratory—LAPC at the Federal Institute of Espírito Santo—IFES, Campus Venda Nova do Imigrante.
In this step, the fruits went through the washing process, where the coffees that float in the water (dry, brocaded, malformed, and immature), commonly called “float”, were separated from the cherry and green fruits. After washing, part of the fruit was peeled using the BLASI-10 equipment (coffee peeler), from Blasi©. The drinking water used in the coffee processing in both experiments is in accordance with the CONAMA Directive nº. 357/2005, which deals with the classification of water bodies [20].
The experiment was carried out in a randomized block design with four replications and five treatments, described below:
  • Treatment 1 (washed): 2 L of peeled cherry coffee, without removing the mucilage, with the addition of 2 L of water, placed in a fermentation tank for 36 h, followed by drying on a suspended terrace.
  • Treatment 2 (Saccharomyces cerevisiae): 2 L of peeled cherry coffee, without removing the mucilage, with the addition of 1% (part by volume) of Saccharomyces cerevisiae, with the addition of 2 L of water, placed in a fermentation tank for 36 h, followed by drying on a suspended terrace [21].
  • Treatment 3 (Klebisiella sp.): 2 L of peeled cherry coffee, with the addition of lactic acid bacteria at a concentration of 107 (Klebisiella sp.), with the addition of water (2 L), placed in a fermentation tank for 36 h, followed by drying on a suspended terrace.
  • Treatment 4 (semi-dry): 2 L of peeled cherry coffee put directly to rest on a suspended terrace for the drying process.
  • Treatment 5 (natural): 2 L of natural coffee put directly to rest on a suspended terrace for the drying process.
Treatments 1, 2, and 3 were placed in a nontoxic polypropylene container, with a capacity of 20 L, without oxygen for 36 h.
After the fermentation period, treatments 1, 2, and 3 were taken to the drying stage (Figure A3). The coffees were dried in the sun until they reached approximately 12% moisture content (wet basis) for a period that varied from 15 to 18 days in a covered environment in a suspended system (plastic cover), with an average temperature of 19.33 °C, with a maximum of 27.75 °C (day) and a minimum of 13.00 °C (at night). The temperature was monitored by the Arduino Uno R3 system—Bluetooth Module Hc-06 Rs232—Humidity and Temperature Sensor Dht22 Am2302—SD Card Module.

2.4. Roasting of Coffee Samples

The samples were prepared in the sensory analysis laboratory of the Federal Institute of Espírito Santo, Venda Nova do Imigrante campus. The roasting process was carried out using the Probatino roaster from Probat© with the Agtron-SCAA disk set, and the roasting point of these samples was between the colors determined by disks #75 and #45 for specialty coffees [22]. The roasting process was carried out 24 h in advance and the grinding respected the 8 h rest time after roasting. All samples were roasted between 8.5 min and 12 min and, with an initial temperature of 160 °C and a final roasting temperature of 192 °C, after roasting and cooling, the samples remained sealed, according to the sensory analysis methodology established by the ICO.

2.5. Sensorial Analysis

Coffee samples were ground with a Bunn G3 electric grinder, with medium/coarse particle size. Each batch of coffee was tasted with 5 cups, and the optimal concentration of 8.75 g of ground coffee in 150 mL of water was adopted, according to the protocol [22]. The infusion point of the water was when the water reached 92−95 °C. The Q-Graders started the evaluations when the temperature of the glasses reached 55 °C, respecting the time of 4 min for tasting after the infusion.
The coffee quality was assessed using the Uganda Coffee Development Authority Sensory Analysis Protocol (2010) with 6 Q-Graders. The number of Q-Graders in a sensory panel was initially proposed by Pereira et al. [23]. The quality of a coffee, once evaluated through the UCDA protocol (2010), is expressed by a centesimal numerical scale. The tasting method offers the possibility to evaluate eleven (11) important attributes for the coffee: fragrance/aroma, flavor, aftertaste, sanity/acidity, sweetness, body, balance, uniformity, clean cup, global assessment, and global score.

2.6. Statistical Analysis

Joint analysis of variance of the six experiments, composed of five processings, arranged in a randomized block design, were performed for the final score data, and the means were compared by the Scott–Knott test, at 5% probability (Table A1).
In order to group the 30 coffees from the 6 experiments and 5 treatment combinations, principal component analyzes were performed regarding the sensory characteristics and nuances of the coffee, through visual examinations in graphic dispersions.
For statistical analyses, the “easyanova” and “Factoshiny” packages of the R program were used [19].

3. Results

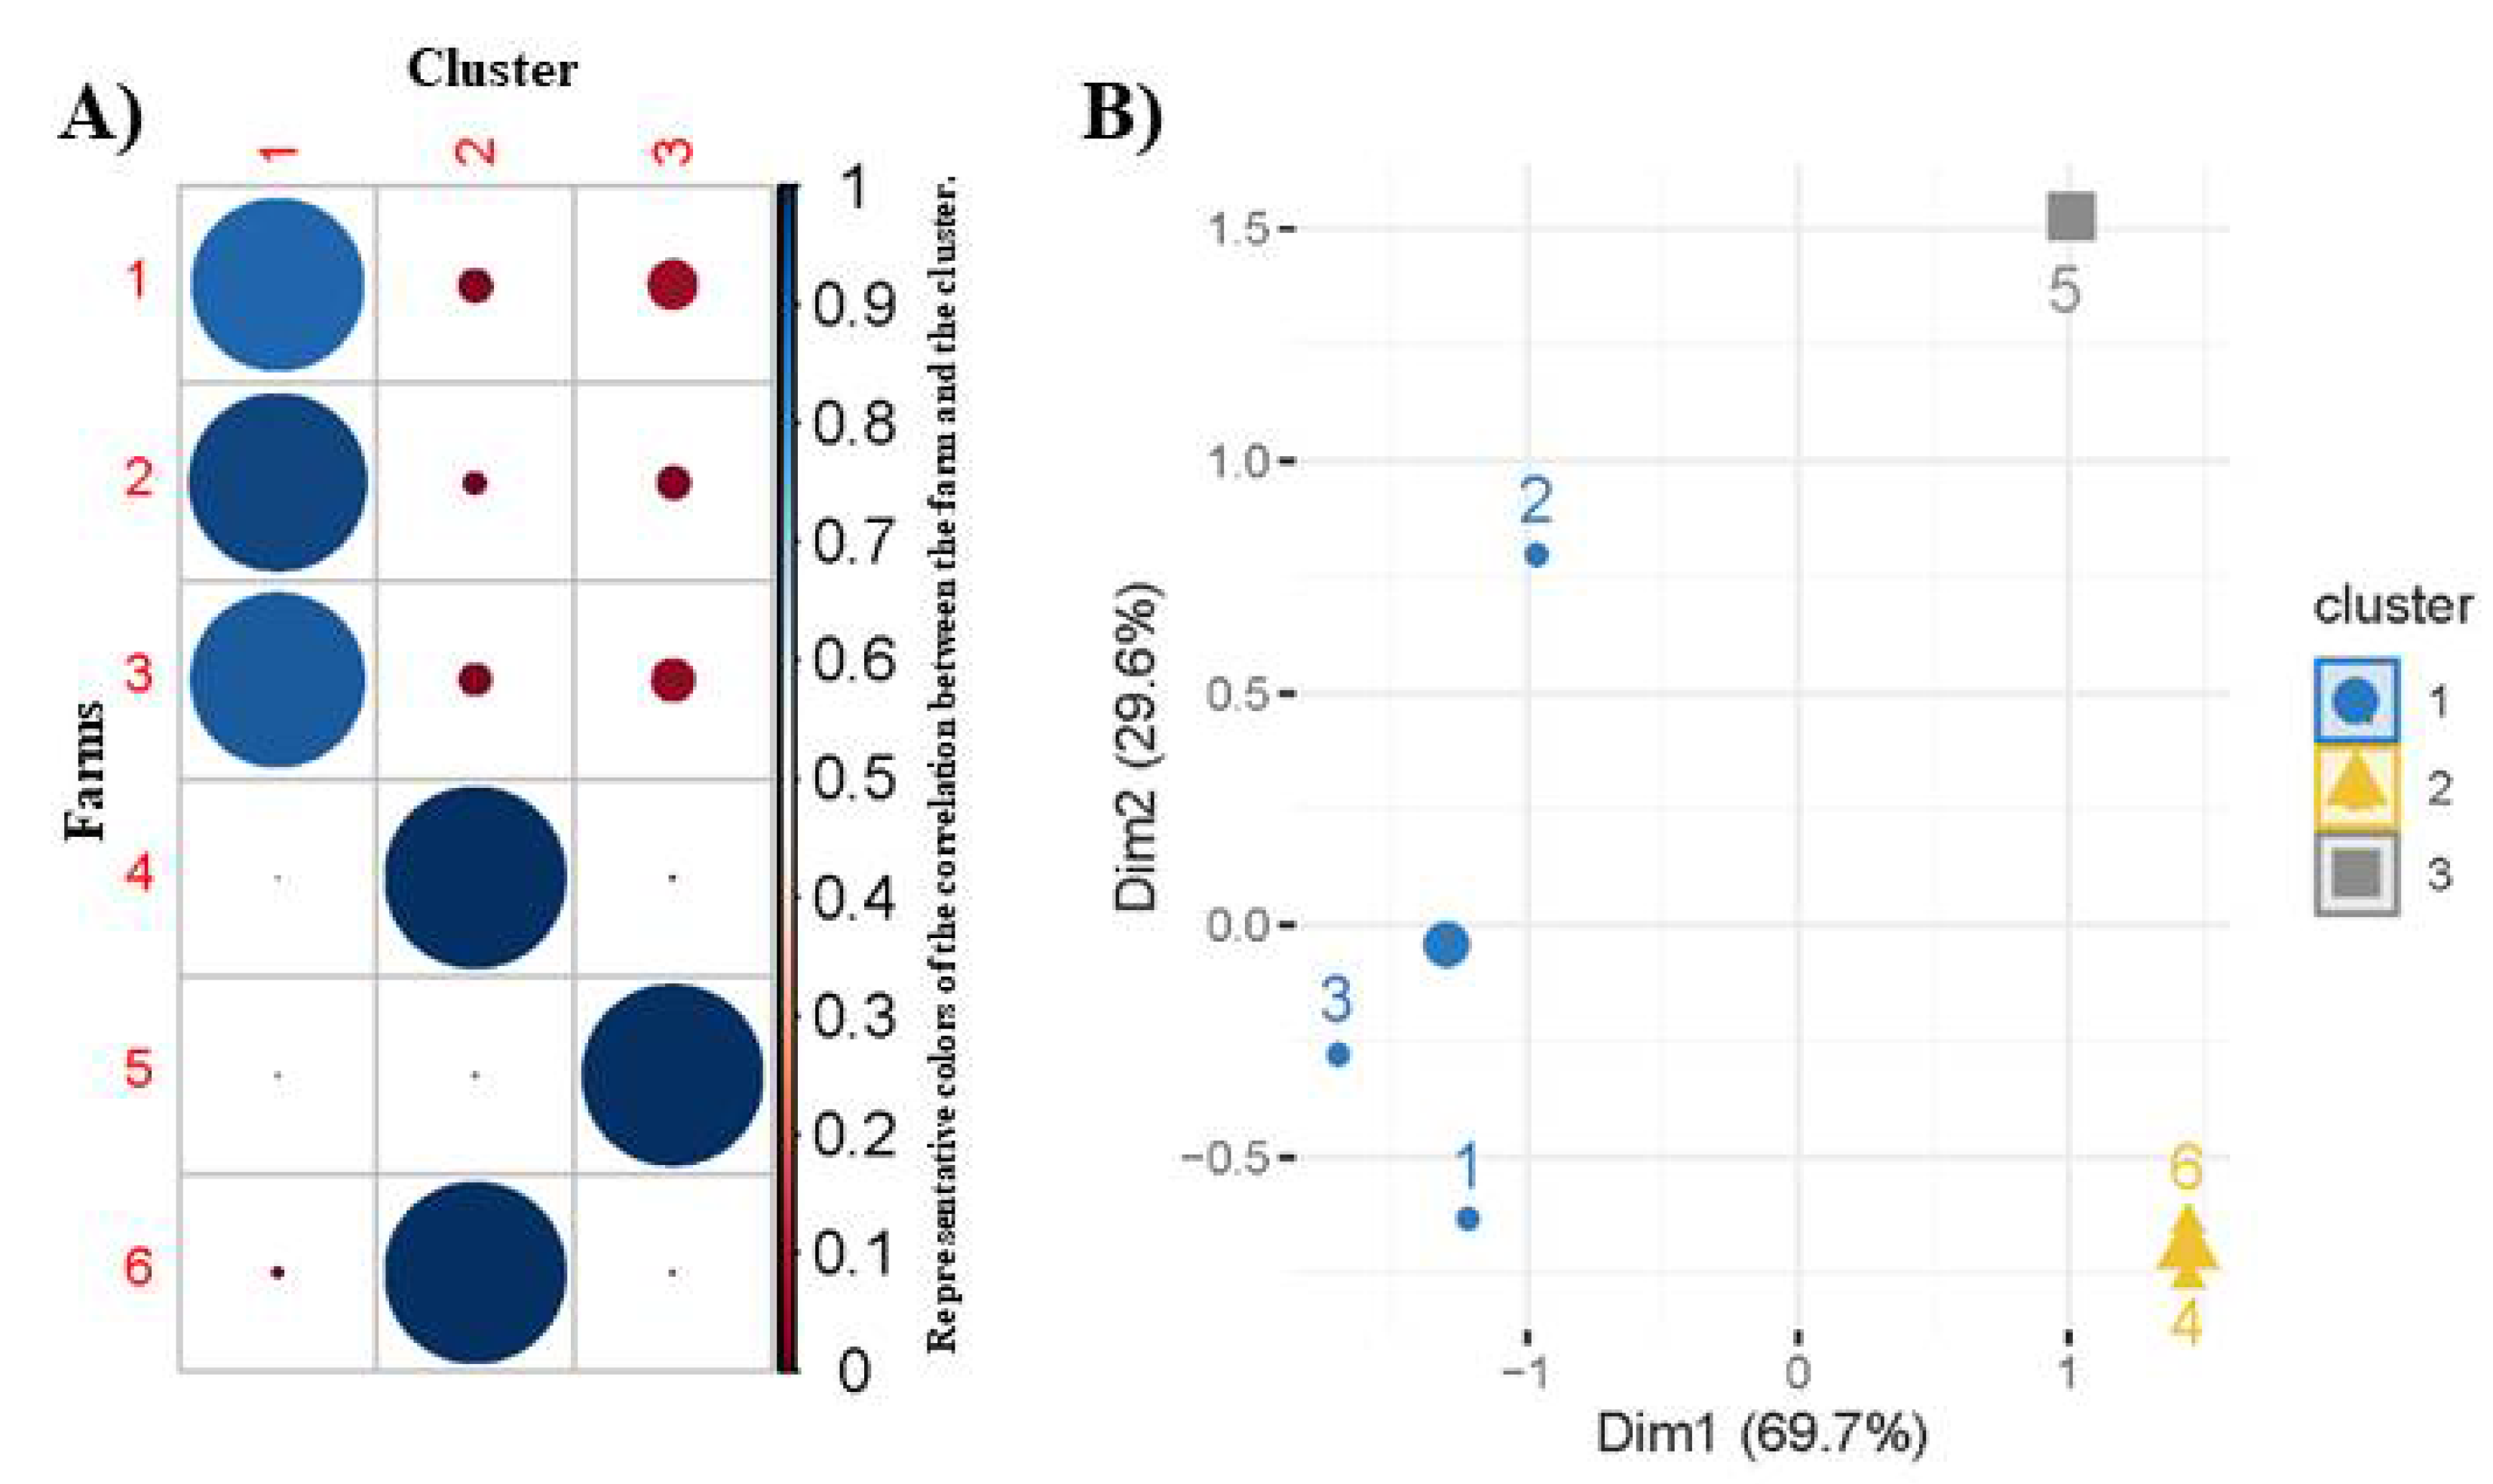
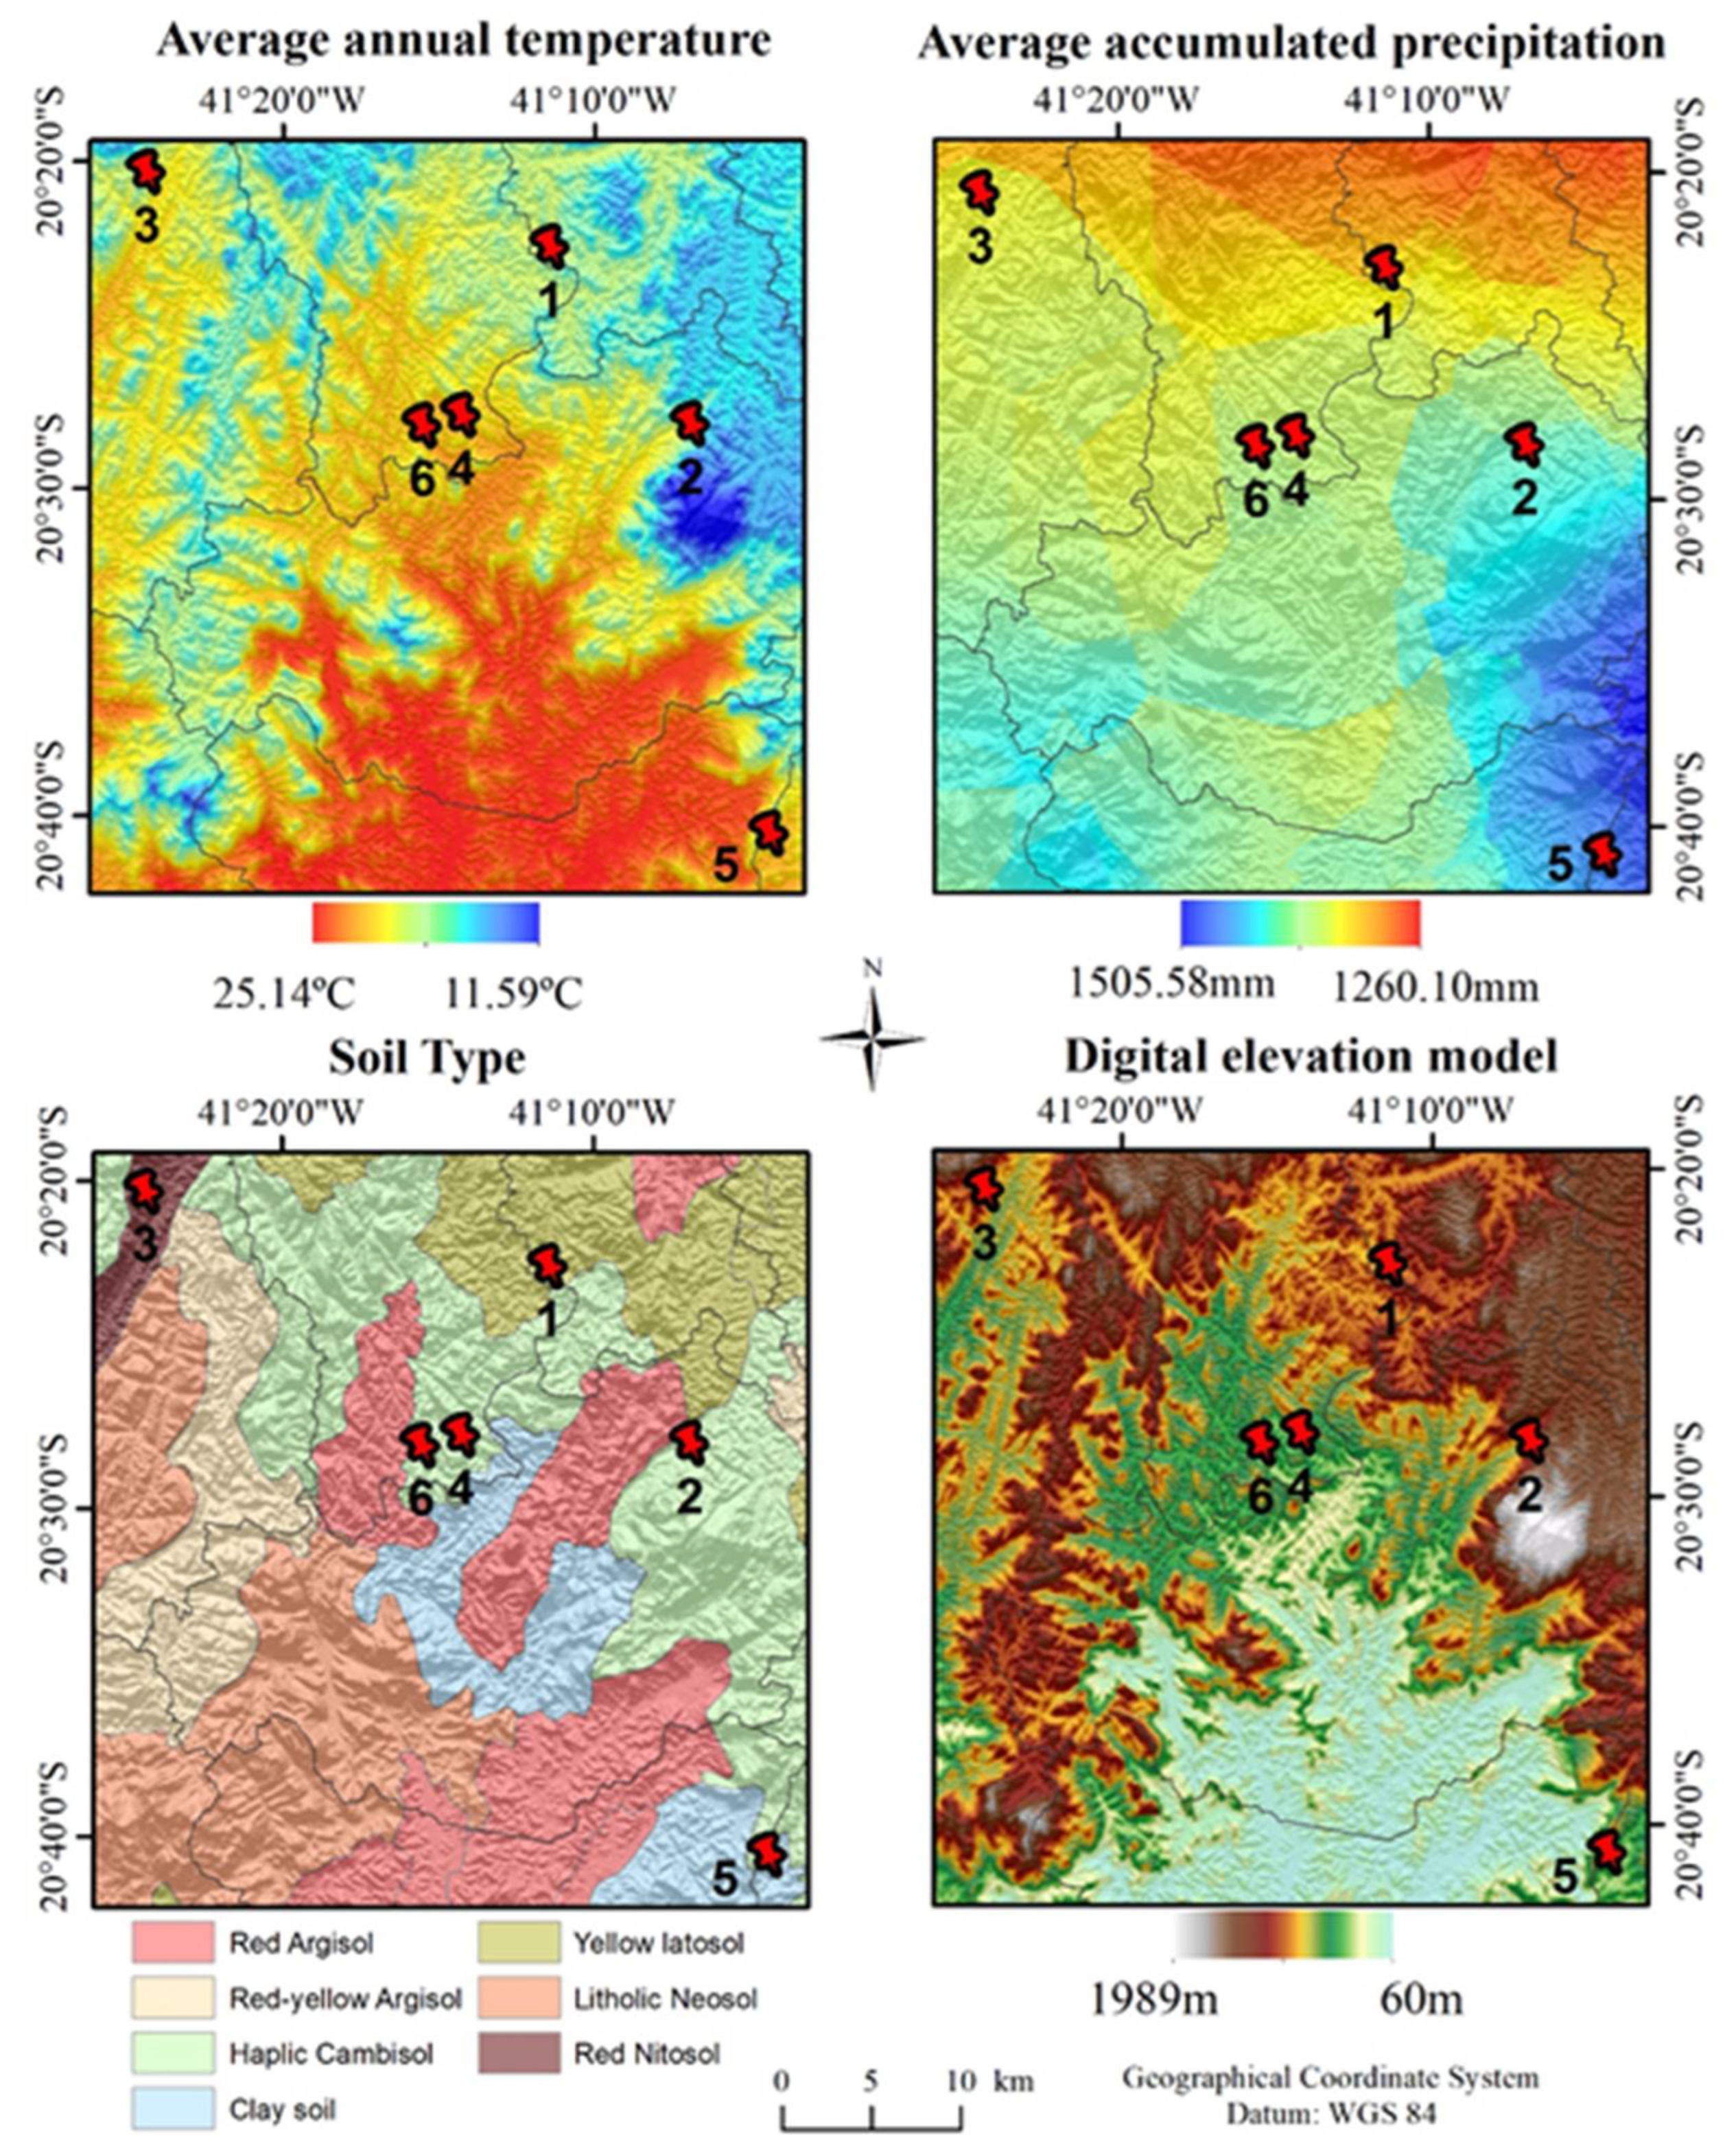
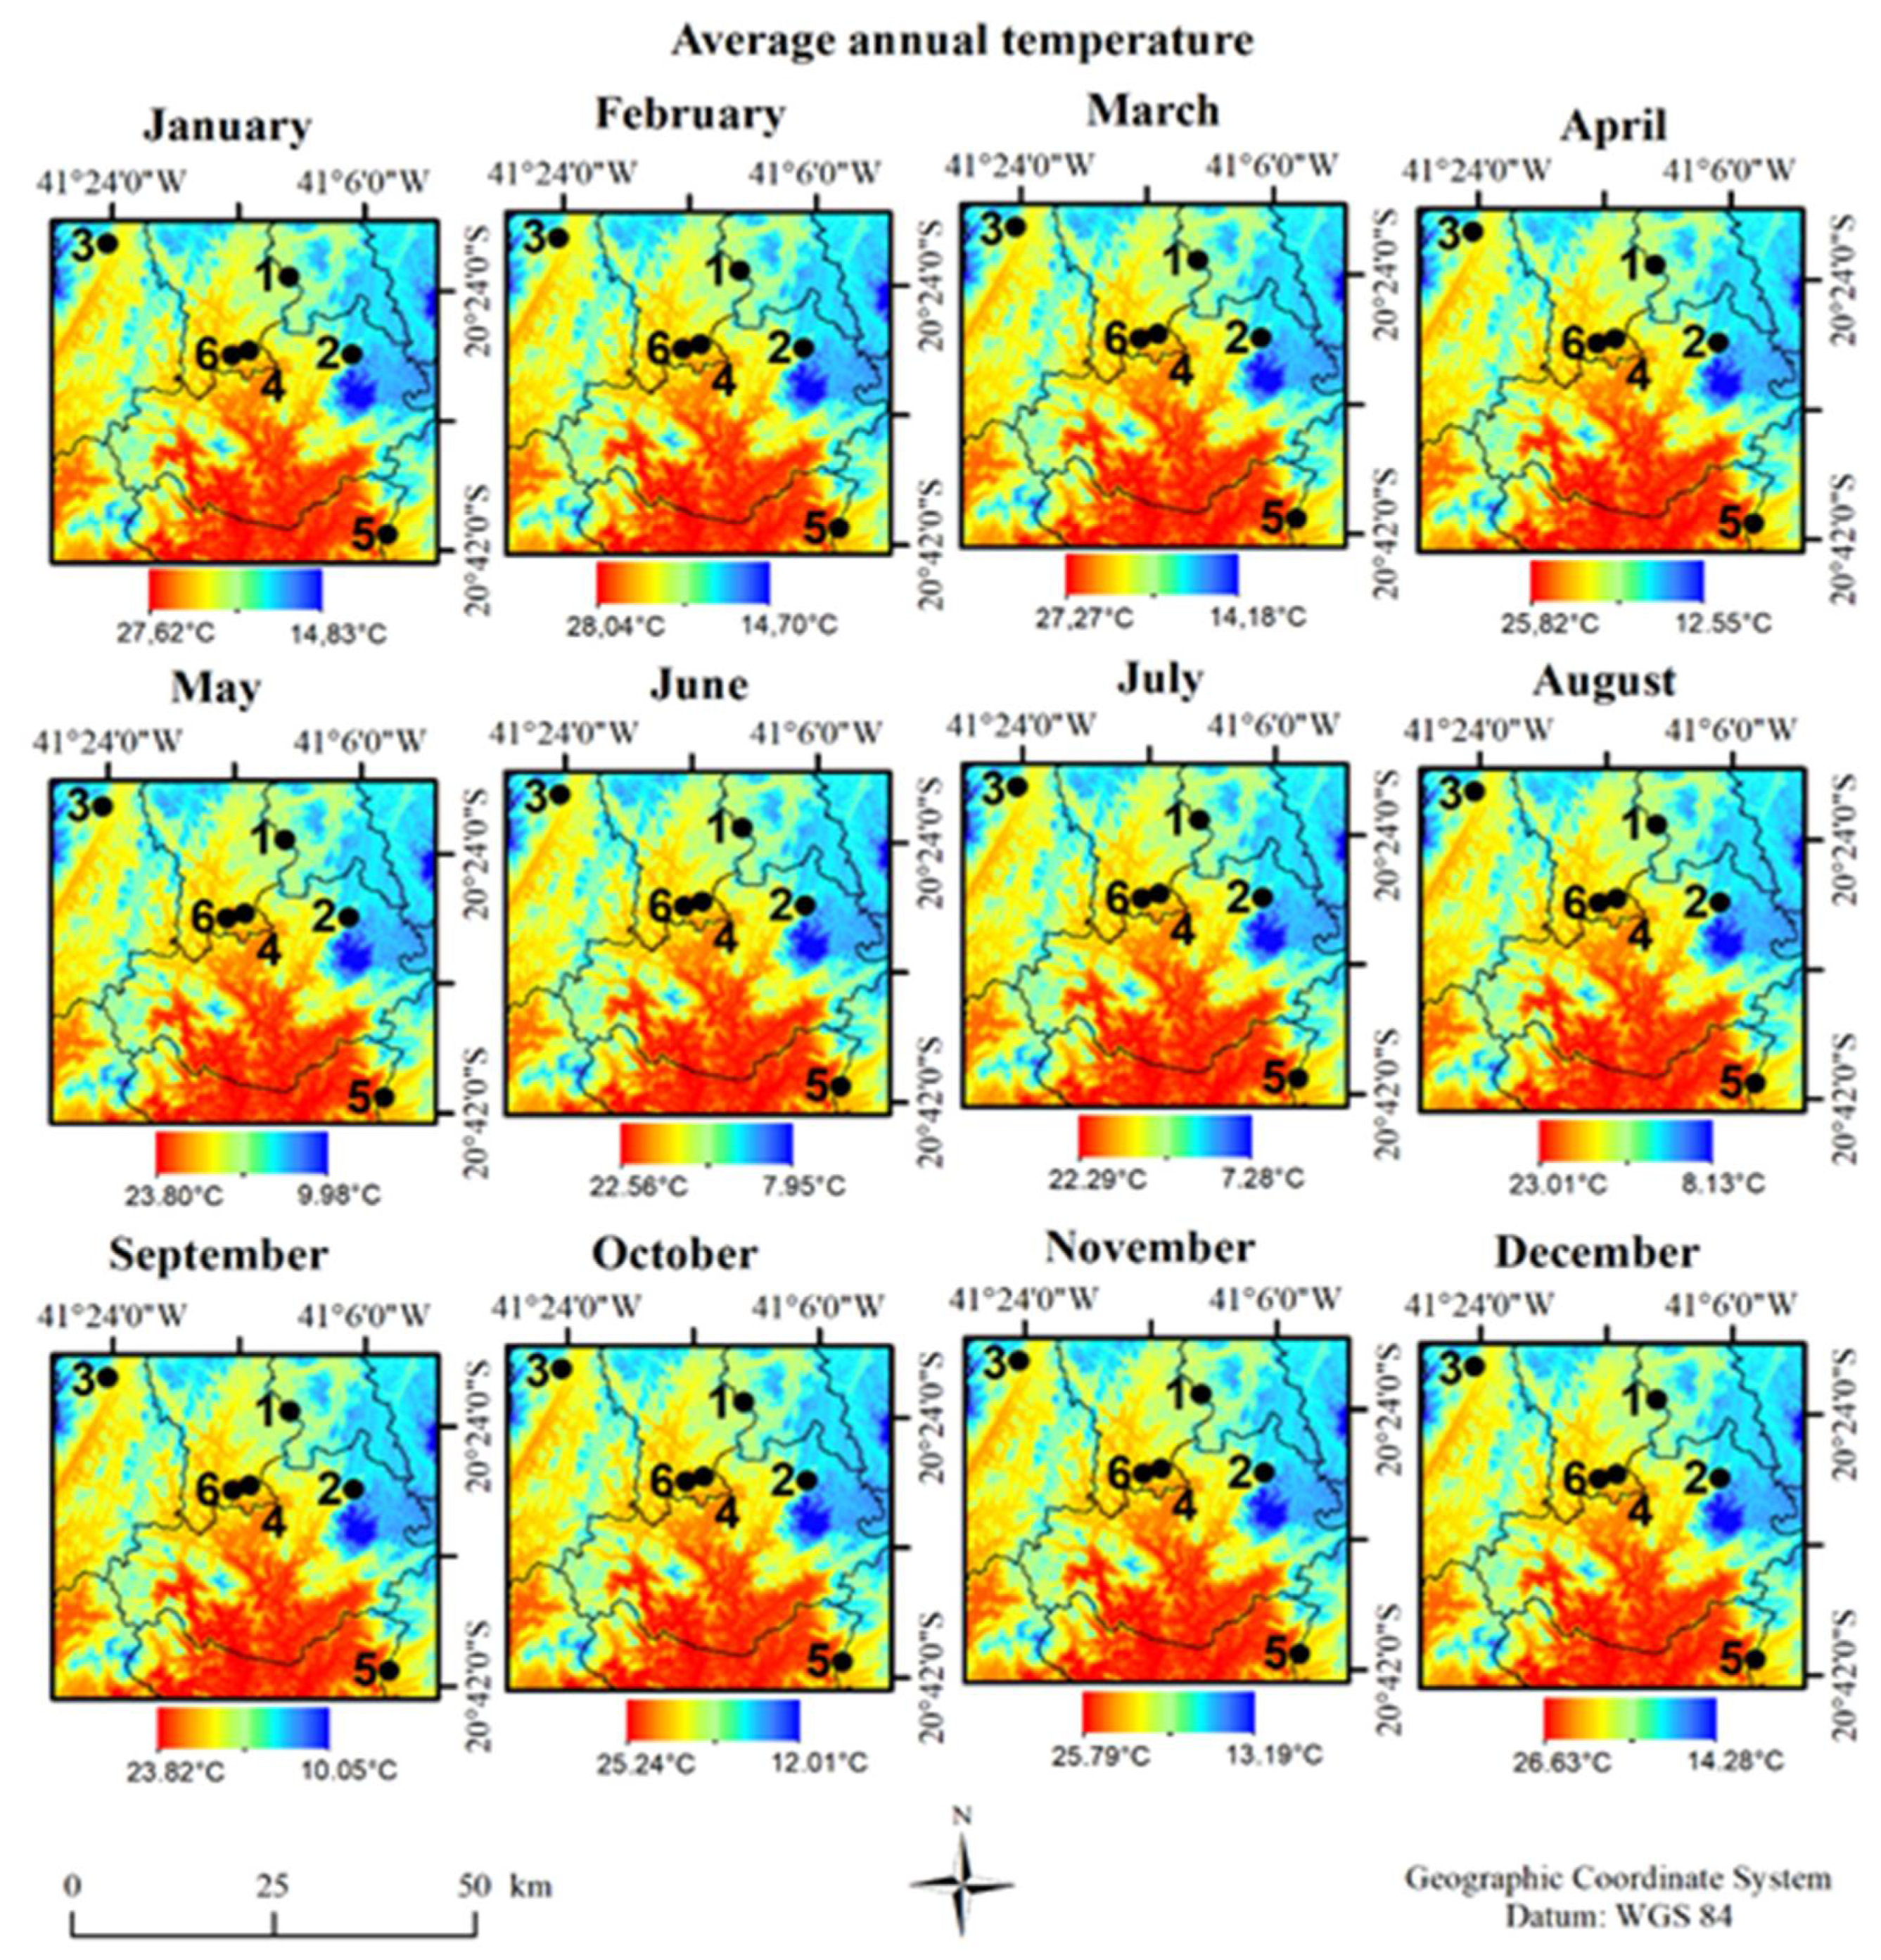
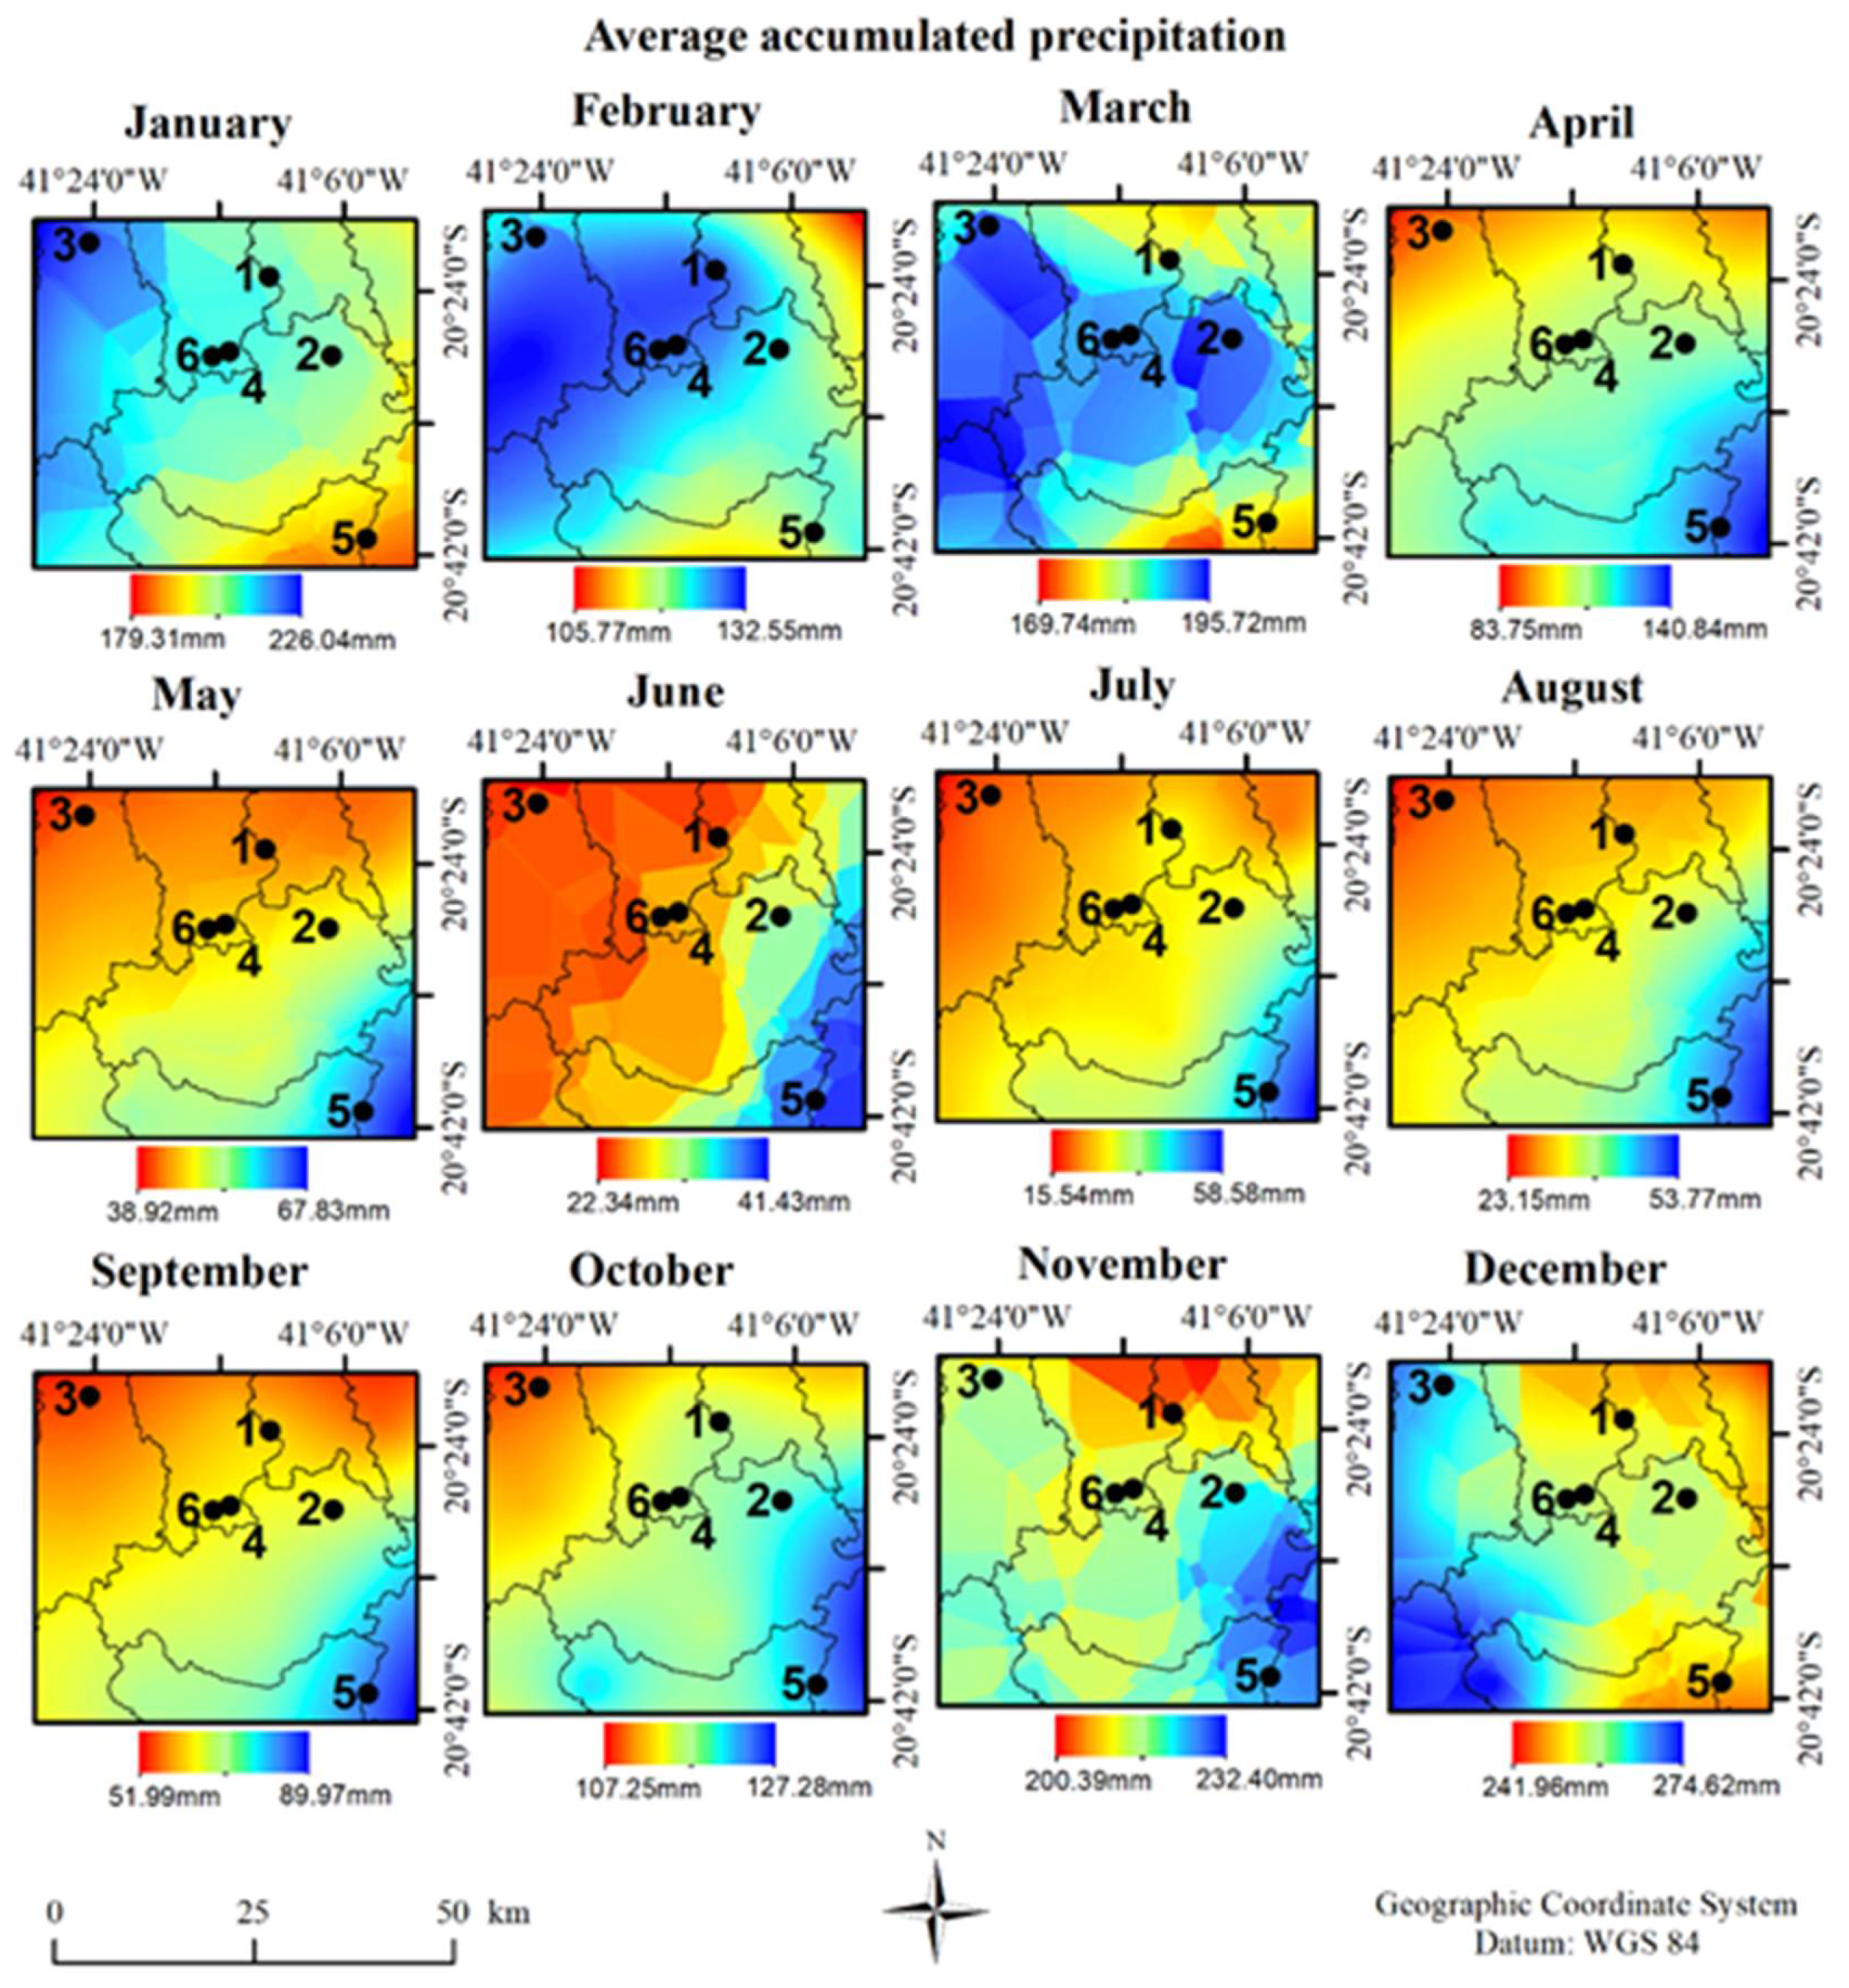
3.1. Edaphoclimatic Characterization

Figure 3 contains the edaphoclimatic characterization of the locations under study, showing the initial characterization of the terroir. The temperature and precipitation variables are grouped through the annual average of the period under analysis. Table 2 shows the values referring to temperature, precipitation, and altitude, and the types of soil corresponding to each location (farm).
The groups shown in Figure 2 were formed based on the quantitative variables in Table 2.
The farms under analysis were grouped into 3 different clusters (Figure 2) according to their edaphoclimatic characteristics; the first, formed by farms 1, 2, and 3; the second, by farms 4 and 6, and finally, the third cluster formed by farm 5. Cluster 1 is formed by farms with higher altitudes and lower average temperatures, cluster 2 by lower altitudes and higher average temperatures, and cluster 3 by the intermediate value, among those analyzed, in relation to altitude and average temperature. It can be observed, then, that the stratification for Conilon coffee production in southeastern Brazil presents three classes of soil and climate contours (Figure 2).

3.2. Sensory Analysis Panel

The results in Table 1 show that for farms 2, 4, 5, and 6, no differences in final score were observed between treatment means, however, for farm 1, treatments 2 (Saccharomyces cerevisiae) and 5 (natural) were superior to other treatments. For farm 3, the semi-dry treatment was inferior to the others. In the averages of the farms, treatments 2 (Saccharomyces cerevisiae) and 5 (natural) were superior to the other treatments.
Considering the locations (farms), no significant differences were observed between the final score averages for the treatments washed, Saccharomyces cerevisiae, Klebsiella sp., and natural, however, for the semi-dry, the farms 1, 5, and 6 presented superior final scores to the other farms.
In order to group the thirty coffees from the six regions and five treatments in terms of sensory characteristics, the first two main components (dimensions) were used for the composition of Equations (1) and (2).
CP 1 ( Dim 1 ) = 0.84 FR + 0.91 FL + 0.91 AF + 0.91 AC + 0.90 SW + 0.86 MF + 0.93 BA + 0.94 OV + 0.89 FS
CP 2 ( Dim 2 ) = 0.17 FR + 0.14 FL 0.30 AF 0.30 AC + 0.31 SW + 0.23 MF + 0.02 BA 0.12 OV 0.13  
where the letters refer to the different nuances of the coffees: FR is fragrance; FL is flavor, AF is aftertaste, AC is acidity, SW is sweet, MF is mouthfeel, BA is balance, OV is overall, and FS is the final score.
We perceive an interaction between all the variables in the formation of the first principal component, according to Equation (1) and Figure 4A The variables aftertaste, acidity, and sweetness stood out in the second main component, according to Equation (2) and Figure 4A. It was also observed that the correlations of the variables are higher in relation to CP1 when compared to CP2, according to the acute angles formed between them.
According to Equation (1) and Figure 4A, we perceive an interaction between all the variables in the formation of the first principal component. According to Equation (2) and Figure 4A, in the second main component, the variables aftertaste, acidity, and sweetness stood out. It was also observed that the correlations of the variables are higher in relation to CP1 when compared to CP2, according to the acute angles formed between them.
The graph in Figure 4B shows the dispersion of regions and treatments (Table 1) in terms of sensory characteristics, and it can be seen that the dispersion is based on the coordinates relative to the first two main components, CP1 and CP2 (dimensions), which formed three distinct groups and that the two components absorbed 85.59% of the variation existing in the original characteristics, with CP1 (Dim1) with 81.01% and CP2 (Dim2) with 4.58%.
Figure 4B shows the formation of three groups and that these results confirm those of Table 1, with group A formed by the highest final grade of 83.10, referring to the natural treatment of farm 5, represented by the color black, followed by group B, formed by coffees of the Saccharomyces cerevisiae treatment from farm 5, with a final grade of 81.90 (coffee 22), Saccharomyces cerevisiae treatment from farm 1, with a final grade of 81.84 (coffee 2), and the natural treatment of farm 3, with a final grade of 81.81 (coffee 15), (2nd, 3rd, and 4th highest final grades), represented by the color red, then the C group, formed by lower final grades, represented by the green color.
Regarding the characteristics of the sensory descriptors used by the tasters who evaluated the coffees, the first two main components (dimensions) were used to group the thirty coffees from the six regions and five treatments.
According to Figure 5A, in the first main component, sensory descriptors such as citrus, floral, and fruity stood out. In the second main component, the descriptors cereal, chocolate, full-bodied, and toasted stood out.
The graph in Figure 5B shows the dispersion of the 30 coffees obtained in the six regions in the five different treatments, regarding the characteristics of the coffee sensory descriptors, and it can be observed that the dispersion based on the coordinates relative to the first two main components, CP1 and CP2 (Dimensions), which formed four distinct groups and that the two components absorbed 32.05% of the variation existing in the original characteristics: CP1 (Dim1) with 16.95% and CP2 (Dim2) with 15.10%.
Figure 5B shows that four groups were formed, with A having the highest final grade of 83.10 referring to the natural treatment of the experiment at farm 5, represented by the color black, followed by group B formed by coffee with a final grade of 81.15 (fifth-highest final grade) of the experiment in 1 with natural treatment, represented by the red color. Then, group C was formed by coffees 2, 15, and 20 (3rd, 4th, and 9th highest scores), respectively, with the treatment Saccharomyces cerevisiae of 1, natural of 3, and natural of 4, represented by the green color. Finally, group D is formed by the other coffees, represented by the blue color.
On the one hand, the coffee with the highest final grade of 83.10, referring to the natural treatment of the experiment at farm 5, represented by the black color, had a contribution, mainly, from the sensory descriptors such as citrus, fruity, alcoholic, and floral, referring to CP1 and the cereal and caramel nuances, referring to CP2. On the other hand, coffees with lower scores had contributions mainly from the descriptors such as woody, referring to CP1, and the toasted nuance, referring to CP2.
These results show that the groupings regarding the nuances of coffee characteristics were less accurate to group superior coffees than the sensory characteristics, due to the fact that the two components absorbed 32.05% of the variation existing in the original characteristics, a value lower than recommended by Rencher [24] who suggests that at least 70% of the total variance must be explained by the first principal components.
According to Table 1 and Figure 4 and Figure 5, we note that even though there is no statistical difference, coffees from treatment with Saccharomyces cerevisiae from farm 1 and farm 5 and natural from farm 5 and farm 3 obtained sensory prominence, presenting nuances considered exotic, such as citrus, floral, and fruity.
The sensory panel indicated that in all altitude strata/localities where the studies were carried out, some post-harvest processing method was effective in proposing to produce specialty coffees, that is, with a global sensory score above 80.00 points.

4. Discussion

According to Martins et al. [25], the productivity of Coffea canephora presents more satisfactory values in areas of altitude below 500 m with an average annual temperature of 22 to 26 °C. The species has been produced in a wide range of altitudes (Table 2), with genetic improvement and climate change as contributing factors for this modification [26,27], a result also evidenced by Tanques et al. [28] where the authors describe that the species present adaptation and distribution in mountainous areas, located at altitudes close to 700 m. Thus demonstrating a new reconfiguration of the terroir of Conilon coffee production.
According to the results presented in Figure 2, the coffee processed by the natural fermentation method, located in farm 5, stood out as the best coffee, among those analyzed in this study, this one belongs to cluster 3 (altitude 514 m) and intermediate average temperature (21.93 °C). The second-best coffee for the Saccharomyces cerevisiae treatment also comes from this same location. The third best sensory result refers to the coffee from farm 1, with the treatment of Saccharomyces cerevisiae, and the fourth from the natural treatment from farm 3, both coming from localities that belong to cluster 1 (Figure 2) in terms of soil and climatic characteristics. Promising sensory results with the use of Saccharomyces cerevisiae in the post-harvest fermentation phase of Conilon coffee have already been described by Fioresi et al. [17], where the authors demonstrate quality gains and a change in the chemical composition of Conilon coffee when applying this microorganism culture in the fermentation.
The results found are in line with what was reported by Joet et al. [29], demonstrating that terroir has a significant impact on quality, and the edaphoclimatic conditions in the region directly affect the quality of the coffee beverage. With these characteristics, coffee is essentially a terroir product, where each region has unique soil and climate characteristics and these affect the development of the plant and the different cultivation methods, as well as the different harvesting and drying techniques that reflect the locale, and these determine the sensory characteristics of the final product, in terms of body, aroma and flavor complexity [30].
The studies carried out by Bytof et al. [31] and Ribeiro et al. [32] showed that the processing affects the grain chemistry and the subsequent quality, a result that corroborates with what was presented in this work, which was observed that for some farms (locations), the processing methods positively modified the sensory quality of the coffee beverage.
We note that the results of the present work are similar to those found by Araújo [33] where there is an improvement in the sensory quality of the beverage resulting from treatment with induced fermentation. In the present study, the coffee from the treatment with yeast showed some prominence in terms of sensory quality. However, the coffee from the natural treatment of intermediate altitude areas also stood out due to the conditions of the locality.
Faced with the variation of sensory characteristics of coffees from different locations, studies on the microbiota have introduced a new perspective on such sensory variation. These studies have approached that the knowledge of the autochthonous microorganisms found in the fruits, in the soil, and in different altitude ranges can influence the fermentation process. In C. arabica, Veloso et al. [34] identified that environmental factors contribute to the structuring of bacterial and fungal communities, and may consequently influence the quality of coffee drinks. Although the microbial diversity associated with C. canephora at higher altitudes is still unknown, it is suggested that the quality of the species is also influenced by such factors.
In this study, it was observed that, on average, coffees grown in intermediate altitude regions (500 m) presented superior sensory performance for the natural treatment. The treatment involving the inoculation of Saccharomyces cerevisiae showed sensory superiority, in the regions between 700 and 800 m, suggesting a beneficial effect of the induced fermentation in comparison to the natural microbiota of these regions. Fermentation involving S. cerevisiae has been consolidated as beneficial for the sensory quality of C. canephora [35,36,37], and in this case, it is suggested that the limited sensory performance presented by the species when grown at altitudes between 700 and 800 m can be minimized through induced fermentation.
The grouping of the main components related to sensory analysis (Figure 4B) showed the formation of three groups, where the first was formed by naturally processed coffee for farm 5, which presented the best sensory result, this farm also formed a group based on its soil and climate characteristics, that is, the terroir has a significant effect on the factors that relate to the quality of the coffees.
The second group was formed by farms 1, 3, and 5, in the constitution of this group we noticed that the farms belonging to the same cluster (farms 1 and 3) stood out as well as farm 5, it was also evident that the fermentation with Sacharomyces cerevisiae was efficient for coffees processed in farms 1 and 5, as well as the natural treatment for farm 3, positioning itself among the best sensory results. This result confirms that the contours of the terroir can also undergo changes resulting from anthropic actions, and this proposition is presented in [13].
In this context, terroir is considered one of the determinants of the beneficial effect of natural treatments. This is because the composition of the microbiota may differ depending on the characteristics of the production region, such as humidity, temperature, face of sun exposure, soil microbial population, variety, and post-harvest treatment [38].
The principal component analysis (Figure 5B) also indicated that the best sensory performances were given by the coffees whose nuances perceived by the Q-Graders were related to complex flavors and aromas such as citrus, floral, and fruity. Although there are limited reports on the sensory diversity of Coffea canephora, justified by its recent entry into the refined coffee markets [39], this study suggests that the adoption of fermentation methods and terroir enhancement can enhance the quality of this beverage species.
According to Smith [40], buyers of specialty coffees focus not only on the lack of defects but also on coffee with a distinctive flavor, often on a flavor profile associated with a specific terroir. That some features of this sensory profile depend on dominant coffee varieties and local treatment systems rather than on soil and climate details is certainly clear, though often overlooked in terroir rhetoric.
The results presented are in agreement with those of Conley et al. [41], where the preference for fruity flavors, complex profile and jasmine nuances, acidic, caramel, and floral notes was highlighted, these profiles and descriptors are influenced by terroir and are also valued by auction buyers.
The results shown in Table 1 and in Figure 4 and Figure 5, the coffees evaluated with the lowest final scores showed nuances of woody, caramel, cereal, toasted, and almonds, characteristics until a few years ago considered traditional for the quality of the Coffea canephora beverage, justifying its important position as a raw material in the solubilization industry [42], and as a component in the formulation of blends, as it gives body to the drink and reduces the acidity provided by arabica coffee [7].
The study in question presents a new perspective of understanding the contours of Conilon coffee production, demonstrating that there are specific typologies of soil and climate conditions that exert a significant effect on the final quality and, from another perspective, that there is a possibility of sensorial reconfiguration of the beverage with the introduction of new processes, thus consisting of two fronts, the first comprising the natural contours of the terroir and the second presenting the possibilities of reformulating the terroir with the introduction of technological processes for quality gains.

5. Conclusions

The study showed that the best sensory results in altitude zones and lower average temperatures were the result of natural processing.
The combination of soil types, precipitation, temperature, and altitude was efficient in the characterization of terroir and allowed us to identify changes in sensory attributes.
For some locations, it was observed that the processing methods positively modified the sensory quality of the coffee beverage. The treatment with inoculation of Saccharomyces cerevisiae was highlighted in terms of sensory quality, however, with greater sensory evidence, the coffee from the natural treatment of areas of intermediate altitude also stood out due to the conditions of the locality.
The best coffees presented nuances perceived by the Q-Graders that were related to complex flavors and aromas such as citrus, floral, and fruity.
More studies are needed to correlate high altitudes and the chemical and sensory quality of the Coffea canephora beverage to better understand the influence of terroir on the chemical panel, and thus better understand the effect of high altitudes on Conilon coffee.
Finally, a terroir formed by environmental conditions and agricultural techniques can produce coffee with a set of unique sensory characteristics that can be used to determine its origin and are exclusive to that terroir.

Author Contributions

Conceptualization, T.R.M., C.A.F., W.d.S.G. and L.L.P.; methodology, M.I.A., R.d.O.A., M.M.B.S., A.D.C.C., C.A.F. and C.V.G.; validation, A.P.M.; formal analysis, L.L.P., A.R.d.S. and T.R.M.; investigation, L.L.P., T.R.M., A.R.d.S. and W.d.S.G.; data curation, R.C.G., A.R.d.S. and T.R.M.; writing—original draft preparation, T.R.M., W.d.S.G. and L.L.P.; writing—review and editing, L.L.P., S.d.S.B., M.A.G.F., A.F.A.d.F., F.L.P., A.P.C.G.B. and E.C.d.S.O.; visualization, T.R.M. and W.d.S.G.; supervision, L.L.P. and T.R.M.; project administration, L.L.P. and A.P.M.; funding acquisition L.L.P., E.C.d.S.O. and A.P.M. All authors have read and agreed to the published version of the manuscript.

Funding

The authors thank the Consortium Pesquisa Café–Embrapa Café 20/2018 (10.18.20.056.00.00), the Coordination for the Improvement of Higher Education Personnel–CAPES and the National Council for Scientific and Technological Development–CNPq, the Federal Institute of Espírito Santo-Campus Venda Nova do Imigrante for financial support and support for research and public notice through PRPPG no. 12/2021–Researcher in Productivity Program–PPP.

Data Availability Statement

Not applicable.

Acknowledgments

The authors thank the Consortium Pesquisa Café–Embrapa Café 20/2018 (10.18.20.056.00.00), the Coordination for the Improvement of Higher Education Personnel—CAPES and the National Council for Scientific and Technological Development—CNPq, the Federal Institute of Espírito Santo-Campus Venda Nova do Imigrante for financial support and support for research and public notice through PRPPG no. 12/2021—Researcher in Productivity Program–PPP, to the Capixaba Institute of Technical Assistance and Rural Extension–INCAPER, and to the Q-Graders for their collaboration in this study. In addition to the coffee growers: Ediano José Mauro, Eduardo Tozzi, Edalmo Pessin, Luciano Destefani, Marcos Marchiori and Tiago Zaqui for harvesting and donating the fruits for the experiment.

Conflicts of Interest

The authors declare no conflict of interest.

Appendix A

Figure A1. Average annual temperature of the Conilon-producing areas under study. Location: Venda Nova do Imigrante (1), Castelo (2), Muniz Freire (3), Conceição do Castelo 1 (4), Vargem Alta (5), and Conceição do Castelo 2 (6).
Agronomy 12 01931 g0a1
Figure A2. Mean accumulated rainfall in mm in the Conilon-producing areas under study. Location: Venda Nova do Imigrante (1), Castelo (2), Muniz Freire (3), Conceição do Castelo 1 (4), Vargem Alta (5), and Conceição do Castelo 2 (6).
Agronomy 12 01931 g0a2
Figure A3. Flowchart representing the methodological steps from coffee collection to sensory analysis.
Agronomy 12 01931 g0a3
Table A1. Joint analysis of variance of the final score evaluated in six farms and five treatments.
Source of VariationGLQM
Blocks/Farms182.58
Treatments (T)416.07 *
Farms (F)510.74 ns
T × F106.02 ns
Residue315.12
Average80.13
CV (%)2.82
* Significant at the 5% probability level by the F test. ns–not significant by the F and t tests.

References

  1. Esquivel, P.; Jiménez, V.M. Functional properties of coffee and coffee by-products. Food Res. Int. 2012, 46, 488–495. [Google Scholar] [CrossRef]
  2. ICO-International Coffee Organization. Total Production by All Exporting Countries. 2019. Available online: http://www.ico.org/prices/po-production.pdf (accessed on 24 January 2022).
  3. Campuzano-Duque, L.F.; Herrera, J.C.; Ged, C.; Blair, M.W. Bases for the Establishment of Robusta Coffee (Coffea canephora) as a New Crop for Colombia. Agronomy 2021, 11, 2550. [Google Scholar] [CrossRef]
  4. Lee, L.W.; Cheong, M.W.; Curran, P.; Yu, B.; Liu, S.Q. Coffee fermentation and flavor—An intricate and delicate relationship. Food Chem. 2015, 185, 182–191. [Google Scholar] [CrossRef]
  5. ConilonBarbosa, D.; Rodrigues, W.; Vieira, H.; Partelli, F.L.; Viana, A. Adaptability and stability of Conilon coffee in areas of high altitude. Genet. Mol. Res. 2014, 13, 7879–7888. [Google Scholar]
  6. Cubry, P.; De Bellis, F.; Pot, D.; Musoli, P.; Leroy, T. Global analysis of Coffea canephora Pierre ex Froehner (Rubiaceae) from the Guineo-Congolese region reveals impacts from climatic refuges and migration effects. Genet. Resour. Crop Evol. 2012, 60, 483–501. [Google Scholar] [CrossRef]
  7. Ferrão, R.G.; da Fonseca, A.F.A.; Ferrão, M.A.G.; De Muner, L.H. Conilon Coffee, 3rd ed.; Technical, E., Ed.; Incaper: Vitória, Brazil, 2019.
  8. Montagnon, C.; Cubry, P.; Leroy, T. Coffee Coffea canephora Pierre genetic improvement: Acquired knowledge, strategies and perspectives. Cah. Agric. 2012, 21, 143–153. [Google Scholar] [CrossRef]
  9. Ferrão, M.A.G.; Riva Souza, E.M.; Fonseca, A.F.A.; Ferrão, R.G.; Santos, W.G.; Spadeto, J. Indicação de Cultivares de Café Arábica Para o Estado do Espírito Santo e Avaliação Comparativa Com o Conilon Em Altitude Elevada; CIRCULAR TÉCNICA 6; Embrapa Café: Brasília, Brazil, 2021; 46p. [Google Scholar]
  10. IPCC-Intergovernmental Panel on Climate Change, III, A.R. Working Group III. Mitigation of Climate Change. 2014. Available online: https://www.ipcc.ch/ (accessed on 24 January 2021).
  11. Martins, M.Q.; Partelli, F.L.; Golynski, A.; Pimentel, N.D.S.; Ferreira, A.; Bernardes, C.D.O.; Ribeiro-Barros, A.I.; Ramalho, J. Adaptability and stability of Coffea canephora genotypes cultivated at high altitude and subjected to low temperature during the winter. Sci. Hortic. 2019, 252, 238–242. [Google Scholar] [CrossRef]
  12. Escobar, F.B.; Petit, O.; Velasco, C. Virtual Terroir and the Premium Coffee Experience. Front. Psychol. 2021, 12, 586983. [Google Scholar] [CrossRef]
  13. Silva, S.D.A.; de Queiroz, D.M.; Santo, N.T.; Pinto, F.D.A.D.C. Influence of climate, soil, topography and variety on the terroir and on coffee quality. J. Exp. Agric. Int. 2018, 24, 1–15. [Google Scholar] [CrossRef]
  14. Demossier, M. Beyond terroir: Territorial construction, hegemonic discourses, and French wine culture. J. R. Anthropol. Inst. 2011, 17, 685–705. [Google Scholar] [CrossRef]
  15. Pinheiro, C.A.; Pereira, L.L.; Fioresi, D.B.; da Silva Oliveira, D.; Osório, V.M.; da Silva, J.A.; Pereira, U.A.; Gava Ferrao, M.A.; Riva-Souza, E.M.; da Fonseca, A.F.A.; et al. Physical-chemical properties and Sensory profile of Coffea canephora genotypes in high-altitude. Aust. J. Crop Sci. 2019, 13, 2046–2052. [Google Scholar] [CrossRef]
  16. Santos, A.R.; Ribeiro, C.A.A.S.; Sediyama, G.C.; Peluzio, J.B.E.; Pezzodane, J.; Bragança, R. Espacialização de Dados Meteorológicos No ArcGIS 10.3 Passo a Passo; CAUFES: Alegre, Brazil, 2015. [Google Scholar]
  17. Cunha, A.d.M.; Feitoza, H.N.; Feitoza, L.R.; de Oliveira, F.S.; Luiz Lani, J.; Cardoso, J.K.F.; Trindade, F.S. Atualização da legenda do mapa de reconhecimento de solos do estado do espírito Santo e implementação de interface no Geobases para uso dos dados em SIG. Geografares 2016, 2, 32–65. [Google Scholar] [CrossRef]
  18. Askari, S. Fuzzy C-Means clustering algorithm for data with unequal cluster sizes and contaminated with noise and outliers: Review and development. Expert Syst. Appl. 2021, 165, 113856. [Google Scholar] [CrossRef]
  19. R CORE TEAM. R: A Language and Environment for Statistical Computing; R Foundation for Statistical Computing: Viena, Áustria, 2014; Available online: https://www.R-project.org (accessed on 13 January 2021).
  20. Prezotti, L.C.; Gomes, J.A.; Dadalto, G.G.; Oliveira, J.A. Manual de Recomentação de Calagem e Adubação Para o Estado do Espírito Santo: 5ª Aproximação; SEEA; Incaper; CEDAGRO: Vitória, Brazil, 2007; 305p.
  21. Pereira, L.L. Novas Abordagens Para Produção de Cafés Especiais a Partir do Processamento Via-Úmida. Ph.D. Thesis, Universidade Federal do Rio Grande do Sul, Porto Alegre, Brazil, 2017. [Google Scholar]
  22. ICO-International Coffee Organization. Agregação de Valor aos Robustas. Uganda Coffee Development Authority. Junho de 2010. Available online: http://www.ico.org/documents/pscb-123-p-robusta.pdf (accessed on 10 December 2021).
  23. Pereira, L.L.; Guarconi, R.; De Souza, G.S.; Junior, D.B.; Moreira, T.R.; Caten, C.S.T. Propositions on the optimal number of Q-Graders and R-Graders. J. Food Qual. 2018, 2018, 3285452. [Google Scholar]
  24. Rencher, A.C. Methods of Multivariate Analysis, 2nd ed.; John Wiley & Sons, Inc., Publication: Hoboken, NJ, USA, 2002; p. 727. [Google Scholar]
  25. Martins, D.D.S.; Fornazier, M.J.; Ventura, J.A.; Pirovani, V.D.; Uramoto, K.; Guarçoni, R.C.; Culik, M.P.; Ferreira, P.S.F.; Zanuncio, J.C. Coffea arabica and C. canephora as host plants for fruit flies (Tephritidae) and implications for commercial fruit crop pest management. Crop Prot. 2022, 156, 105946. [Google Scholar] [CrossRef]
  26. Ferrão, M.A.G.; de Mendonça, R.F.; Fonseca, A.F.A.; Ferrão, R.G.; Senra, J.F.B.; Volpi, P.S.; Filho, A.C.V.; Comério, M. Characterization and genetic diversity of Coffea canephora accessions in a germplasm bank in Espírito Santo, Brazil. Crop Breed. Appl. Biotechnol. 2021, 21, 1–10. [Google Scholar] [CrossRef]
  27. Zhang, S.; Liu, X.; Li, R.; Wang, X.; Cheng, J.; Yang, Q.; Kong, H. AHP-GIS and MaxEnt for delineation of potential distribution of Arabica coffee plantation under future climate in Yunnan, China. Ecol. Indic. 2021, 132, 108339. [Google Scholar] [CrossRef]
  28. Taques, R.C.; Dadalto, G.G. Zoneamento Agroclimático Para a Cultura do Café Conilon no Estado do Espírito Santo, 2nd ed.; Ferrão, R.G., da Fonseca, A.F.A., Braganca, S.M., Ferrao, M.A.G., De Muner, L.H., Eds.; Café Conilon; Incaper: Vitória, Brazil, 2017; pp. 69–79.
  29. Joët, T.; Laffargue, A.; Descroix, F.; Doulbeau, S.; Bertrand, B.; de Kochko, A.; Dussert, S. Influence of environmental factors, wet processing and their interactions on the biochemical composition of green Arabica coffee beans. Food Chem. 2010, 118, 693–701. [Google Scholar] [CrossRef]
  30. Alves, M.R.; Barbosa, J.N.; Borém, M.F.; Volpato, M.M.L.; Vieira, T.G.C.; Lacerda, M.P.C. Relações entre ambiente e qualidade sensorial de cafés em Minas Gerais. In Araxá-MG: VII Simpósio de Pesquisa dos Cafés do Brasil; Embrapa–Café: Brasília, Brazil, 2011. [Google Scholar]
  31. Bytof, G.; Knopp, S.-E.; Kramer, D.; Breitenstein, B.; Bergervoet, J.H.W.; Groot, S.P.C.; Selmar, D. Transient occurrence of seed germination processes during coffee post-harvest treatment. Ann. Bot. 2007, 100, 61–66. [Google Scholar] [CrossRef]
  32. Ribeiro, D.E. Interação de genótipo, ambiente e processamento na expressão da composição química e qualidade sensorial do café arábica. J. Afr. Pesqui. Agrícola 2016, 11, 2412–2422. [Google Scholar]
  33. de Freitas Araújo, G.A. Novos Processos de Fermentação Para Potencializar o Perfil Sensorial dos Cafés Obtidos No Município de Coromandel, MG; Centro Universitário do Cerrado: Patrocínio, Brazil, 2018. [Google Scholar]
  34. Veloso, T.G.R.; Silva, M.D.C.S.D.; Cardoso, W.S.; Guarçoni, R.C.; Kasuya, M.C.M.; Pereira, L.L. Effects of environmental factors on microbiota of fruits and soil of Coffea arabica in Brazil. Sci. Rep. 2020, 10, 14692. [Google Scholar] [CrossRef] [PubMed]
  35. Fioresi, D.B.; Pereira, L.L.; Oliveira, E.C.D.S.; Moreira, T.R.; Ramos, A.C. Mid infrared spectroscopy for comparative analysis of fermented arabica and robusta coffee. Food Control 2020, 121, 107625. [Google Scholar] [CrossRef]
  36. Oliveira, E.C.D.S.; Guarçoni, R.V.C.; De Castro, E.V.R.; De Castro, M.G.; Pereira, L.L. Chemical and sensory perception of robusta coffees under wet processing. Coffee Sci. 2020, 15, 1–8. [Google Scholar] [CrossRef]
  37. Oliveira, E.C.D.S.; Filgueiras, P.R.; Moreli, A.P.; De Oliveira, A.C.; Venturim, L.H.C.; Pereira, L.L. Espectroscopia de infravermelho para estudo de café Conilon fermentado. Braz. J. Dev. 2020, 6, 19248–19259. [Google Scholar] [CrossRef]
  38. Vaughan, M.J.; Mitchell, T.; McSpadden Gardener, B.B. What’s inside that seed we brew? A new approach to mining the coffee microbiome. Appl. Environ. Microbiol. 2015, 81, 6518–6527. [Google Scholar] [CrossRef]
  39. Bortolin, B. Café: A Questão do Blend; Inovação Uniemp: Campinas, Brazil, 2005; Volume 1, pp. 42–44. [Google Scholar]
  40. Smith, J. Paisagens do café: Cafés especiais, terroir e rastreabilidade na Costa Rica. Cult. Agric. Aliment. E Meio Ambiente 2018, 40, 36–44. [Google Scholar]
  41. Conley, J.; Wilson, B. Coffee terroir: Cupping description profiles and their impact upon prices in Central American coffees. GeoJournal 2020, 85, 67–79. [Google Scholar] [CrossRef]
  42. Ribeiro, B.B.; Mendonça, L.M.V.L.; Assis, G.A.; Mendonça, J.M.A.D.; Malta, M.R.; Montanari, F.F. Avaliação química e sensorial de blends de Coffea canephora Pierre e Coffea arabica L. Coffee Sci. 2014, 9, 178–186. [Google Scholar]
Figure 1. Location map of the farms, showing the climate and altitude of the areas under study. Farms are represented by their identification numbers that range from 1 to 6, where Venda Nova do Imigrante (1), Castelo (2), Muniz Freire (3), Conceição do Castelo 1 (4), Vargem Alta (5), and Conceição do Castelo 2 (6).
Agronomy 12 01931 g001
Figure 2. (A) Correlation of each farm, based on the variables under analysis, with the cluster to which it belongs and with the other clusters, values closer to 1 (darker blue) mean greater correlation and closer to zero (red) less correlation (color palette associated with the degree of correlation is on the right of Figure 2A), it is possible to visualize 3 clusters (columns) and 6 farms (rows), and (B) representation of the groups formed by the farms from the analyzed variables (temperature, precipitation, and altitude), it is possible observed 3 clusters (different colors) formed by the variables of the 6 farms, each farm is represented by its identification number that varies from 1 to 6. We verified that, with the parameters used, the farms formed 3 distinct groups, based on these edaphoclimatic characterization results: group 1 formed by farms 1, 2, and 3; group 2 formed by farms 4 and 6; group 3 formed by farm 5.
Agronomy 12 01931 g002
Figure 3. Average temperature (°C), average accumulated precipitation (mm), soil types and digital measurement model (meters) of the analyzed Conilon coffee farms. Farms are represented by their identification numbers that range from 1 to 6, where Venda Nova do Imigrante (1), Castelo (2), Muniz Freire (3), Conceição do Castelo 1 (4), Vargem Alta (5), and Conceição do Castelo 2 (6).
Agronomy 12 01931 g003
Figure 4. Variables eigenvectors: Variables: fragrance (FR), flavor (FL), aftertaste (AF), acidity (AC), sweet (SW), taste (MF), balance (BA), overall (OV) and final score (FS) (A). Scatter diagram in relation to the first two principal components, obtained from the sensory characteristics, of 30 coffees obtained from 5 treatments of Conilon (Coffea canephora) and 6 farms (B). Conilon.
Agronomy 12 01931 g004
Figure 5. Principal component analysis in relation to the first two components, obtained from the nuances (A). Scatter diagram in relation to the first two main components, obtained from the nuances characteristics of 30 coffees obtained from 5 treatments of Conilon (Coffea canephora) and 6 locations (B).
Agronomy 12 01931 g005
Table 1. Edaphoclimatic characterization of Conilon properties under study.
FarmTemperature (°C)Precipitation (mm)Type of SoilsAltitude (m)
120.661344.83Yellow latosol721
220.491403.36Cambisol Haplic755
320.521353.91Red Nitosol866
423.121374.56Cambisol Haplic382
521.931456.55Cambisol Haplic514
623.081379.12Cambisol Haplic376
Table 2. Means of the final characteristic score evaluated in five treatments of CConilon (Coffea canephora) and in six farms.
TreatmentsFarmsAverage
123456
Washed79.71b A80.15a A79.95a A79.28a A80.93a A79.54a A79.93 b
S. cerevisiae81.84a A81.01a A80.20a A79.67a A81.90a A79.77a A80.73 a
Klebsiella sp.78.81b A79.79a A80.15a A79.40a A81.03a A79.56a A79.79 b
Semi-dry79.74b A78.83a B76.63b B78.06a B80.67a A80.50a A79.07 b
Natural81.15a A79.91a A81.81a A80.73a A83.10a A80.20a A81.15 a
Average80.25B79.94B79.75B79.43B81.53A79.91B
Means followed by the same lowercase letter vertically and the same uppercase letter horizontally do not differ from each other by the Scott and Knott test at 5% probability.
Publisher’s Note: MDPI stays neutral with regard to jurisdictional claims in published maps and institutional affiliations.

