Article

Transcriptome and Re-Sequencing Analyses Reveal Photosynthesis-Related Genes Involvement in Lutein Accumulation in Yellow Taproot Mutants of Carrot

1
College of Horticulture, Shanxi Agricultural University, Jinzhong 030801, China
2
Key Laboratory of Genetic Improvement and Ecophysiology of Horticultural Crop, Institute of Horticulture, Anhui Academy of Agricultural Sciences, Hefei 230001, China
*
Authors to whom correspondence should be addressed.
These authors contributed equally to this work.
Agronomy 2022, 12(8), 1866; https://doi.org/10.3390/agronomy12081866
Submission received: 28 June 2022 / Revised: 2 August 2022 / Accepted: 2 August 2022 / Published: 8 August 2022
(This article belongs to the Special Issue Vegetables Breeding for Stress Tolerance and Quality Improvement)

Abstract

:
Carrots accumulate numerous carotenoids in the root, resulting in different colors. Orange carrots are primarily high in α- and β-carotene, while yellow carrots are packed with lutein. This study was designed to explore the molecular mechanism underlying the yellow mutation involving lutein using a recently obtained yellow root mutant carrot (ym) via mutagenesis of an orange root wild type (wt). Microscopes were used to observe the variations in histological and cellular structures, and transcriptome and resequencing analyses were conducted for ym and wt. The root callus of ym contained fewer colored crystals and globular chromoplasts than those of wt. Based on ribonucleic acid sequencing (RNA-seq) data analysis, 19 photosynthesis-related differentially expressed genes (DEGs) were enriched. Among them, there were 6 photosynthesis-related genes experiencing nonsynonymous mutations, including PSAL, PSB27-1, psbB, and three homologs of LHCB1.3, and Lut 5, the mapped gene regulating lutein content in carrot root, also had nonsynonymous mutations in ym. These 7 genes were shown to be significantly differently expressed at one or more time points during the lutein accumulation process. It is predicted that the 6 photosynthesis-related genes and Lut 5 are candidate genes for lutein accumulation, which results in root color mutation. The candidate genes identified in this study can provide a new insight into the molecular mechanism of lutein modulation.

1. Introduction

Carrots (Daucus carota L.) are one of the most important vegetables cultivated worldwide and the main source of dietary provitamin A. All carrot varieties accumulate numerous carotenoids in the root, resulting in different colors, such as yellow, orange, and red. The main carrot cultivars have yellow and orange taproots. The root color of yellow cultivars is a result of the lutein accumulation, though less α- and β-carotene are also synthesized. The pigment of orange carrots derives from the large amount of β-carotene and α-carotene, and these carrots have little lutein and cannot accumulate lycopene [1].
Chromoplasts are the main site of carotenogenesis, which are classified into crystalline, globular, membranous, and tubular types [2,3]. Previous studies have shown that carrot chromoplasts contain carotenoids in the solid-crystalline physical state [4]. However, the four chromoplast types were all observed in dark orange carrot callus, dominated by the crystalline chromoplasts. Meanwhile, a scarcity of crystalline chromoplasts in pale-yellow callus indicates the occurrence of complex plastid biogenesis in carrots [5].
Numerous studies have been conducted to elaborate the mechanisms of carotenoid accumulation in carrots. Forty-four genes in the isoprenoid biosynthetic pathway and 24 genes in the carotenoid biosynthetic pathway in carrots have been identified [6,7]. The relative expression of carotenoid genes is also increased during development, but the increases in gene expression are usually many-fold less than those in pigment accumulation [8,9,10,11,12]. For example, carotenoid accumulation during root development exhibits a correlation with the expression profiles of PSY2, PDS, ZDS2, LCYB1, LCYE, ZEP and NCED1 [10]. The expression of lycopene β-cyclase (DcLcyb1) is increased 14-fold in mature orange roots [13]. Overexpression of Lut 5 (CYP97A3) in orange transformed carrots results in a lower α-carotene content in leaves and a reduced root carotenoid level [14]. However, Arias et al. [15] hypothesized that genes involved in photomorphogenesis and light perception such as PHYA, PHYB, PIF3, PAR1, CRY2, FYH3, FAR1 and COP1, participate in the synthesis of carotenoids and the development of the carrot storage root.
In carrots, the Y and Y2 loci explain most phenotypic variations in white, yellow, and orange storage roots [6,7,16]. DCAR_032551, the candidate gene for the Y locus, was identified as a homologous gene of the Arabidopsis homolog PEL (Pseudo-Etiolation in Light), which is involved in the regulation of photomorphogenesis and de-etiolation [6]. Y2 is mapped to a 650 kb region containing 72 predicted genes, and 2 cleaved amplified polymorphic sequences (CAPS) markers cosegregated with color in this region were developed [17]. Chromoplasts are carotenoid-enriched plastids, in which various lipoprotein substructures (e.g., globules, crystals, membranes, fibrils, and tubules) sequester carotenoids [18,19]. The orange (Or) gene is the third gene associated with the accumulation of β-carotene and other provitamin A carotenoids [20]. Lut 5, the only pathway gene, is mapped to be associated with the accumulation of most carotenoids in carrots with the exception of lutein [21].
For carotenoid accumulation in carrots, the involvement of other regulatory mechanisms outside of the pathway has been identified in previous studies, but the regulatory networks are still not well understood. In this study, the taproots of an ethyl methyl sulfone (EMS)-induced yellow taproot mutant (ym) and an orange taproot wild type (wt) were used for callus culture to explore the changes of chromoplasts in ym. To distinguish the possible molecular mechanisms underlying yellow mutation, analysis of differentially expressed genes (DEGs) and gene variations of enriched genes were compared between wt and ym by means of transcriptome sequencing and resequencing, respectively. The results of this study provide insight into a new regulatory mechanism for the accumulation of carotenoids.

2. Materials and Methods

2.1. Plant Materials

The two inbred lines used for transcriptome and resequencing analyses in this study were orange taproot wild-type (wt) and yellow taproot mutant (ym) carrots. wt is an inbred line with orange and conic root (Figure 1A) developed from a landrace. ym is a mutagenic inbred line with yellow and conic root (Figure 1D) developed from EMS-induced wt mutagenesis. The roots of wt and ym were surface-sterilized and cross-cut into 1–2 mm thick discs, which were then cultured on MS medium supplemented with 0.5 mg/L 6-benzylamino-purine and 30 g/L sucrose (pH 5.8), and then solidified with 2 g/L Phytagel at 26 °C in the dark. Consecutive subculture was conducted once every 3–4 weeks under the same conditions. After 3 months, the orange (Figure 1B,C) callus and the pale-yellow callus (Figure 1E,F) produced stable lines.

2.2. Carotenoid Evaluation in the Taproot and Callus

Carotenoid content in the lyophilized root and callus tissues was quantified for high-performance liquid chromatography (HPLC) analysis [20]. A total of 0.1 g of lyophilized carrot taproots and callus tissues were crushed and then soaked in 2.0 mL of petroleum ether at 4 °C. Then, the petroleum ether extract (300 mL) was added to 700 mL of methanol after 14 h, eluted through an AZ0012 Robusta 100A C18 (250 × 4.6 mm) column, and analyzed on a Thermo U3000 HPLC system. The reference standard for calibration was synthetic β-carotene (Sigma-Aldrich, Shanghai, China). Next, lutein, α-carotene and β-carotene were quantified by absorbance at 450 nm. Two technical replicates were performed for each sample and the results were averaged and described in μg·g−1 dry weight (DW).

2.3. Microscopic Identification of Carotenoid Crystals

Fresh callus samples were fixed in 50% FAA (Wuhan Servicebio Technology Co., Ltd. Hubei, China) for 24 h and then put into a 15% sucrose solution for dehydration. Next, the tissues completely sinking to the bottom were placed into a 30% sucrose solution for dehydration in a refrigerator at 4 °C. After that, the dehydrated tissues, embedded with optimal cutting temperature (OCT) compounds, were cut into 8–10 µm-thick sections and photographed using a slide scanner (Pannoramic MIDI, 3D Histech, Budapest, Hungary).
Subsequently, fresh callus samples were quickly frozen in liquid nitrogen and cut into 8 μm-thick sections. Then, the sections were placed on clean slides and photographed under an Axioskop 40 (Carl Zeiss) polarization microscope equipped with a MOTICAM580 5.0 MP digital camera with the corresponding software (Nikon). At least three sections were used and photographed from each callus line.

2.4. Transmission Electron Microscopy (TEM)

Fresh callus samples were fixed in 4% glutaraldehyde buffer, kept at 4 °C for 24 h or even longer, and then rinsed in 0.1 M phosphate buffer (pH 7.4) for 15 min. Next, the samples were fixed in 1% osmium acid for 7 h, dehydrated in a graded series of ethanol concentrations, and gradually embedded in resin. Ultrathin (60–80 nm in thickness) sections were obtained with the Leica EM UC6 ultramicrotome and collected onto copper grids (150 mesh, Formvar Film, Haide Chuangye (Beijing, China) Biotechnology Co., Ltd.). Grids with sections were stained with a 2% saturated solution of uranylacetate (Polysciences) in 50% ethanol for 8 min and 2.6% lead citrate agents (Sigma-Aldrich) for 8 min, and then they were analyzed under a HT7800 high-resolution electron microscope (Hitachi, Tokyo, Japan). TEM images were taken for at least three samples from each callus line.

2.5. Transcriptome Sequencing of Taproots of wt and ym

Carrot root tissues were collected from wt and ym at 35 d after planting (dap) with three biological replicates. The total ribonucleic acid (RNA) was extracted from taproot tissues using the RNAprep Pure Cell Kit (TIANGEN Biotech (Beijing, China) Co., Ltd.), in accordance with the manufacturer’s protocol. Qualified RNAs were cut into reads of 200–300 bp by means of ion disruption. Next, the reads with adapter at 3′ end and those of low quality were removed from the raw sequencing data. In addition, the filtered reads from each replicate were independently mapped to the reference sequences using HISAT2. The original gene expression level was calculated by HTSseq and normalized with FPKM. The false discovery rate (FDR) < 0.001 and |log2-fold change| ≥ 1 were considered to have significant differences in gene expressions. The quality of the transcriptome sequencing is listed in Table S1. Gene Ontology (GO) and Kyoto Encyclopedia of Genes and Genomes (KEGG) enrichments were performed using TopGO and ClusterProfiler programs, respectively [22,23].

2.6. Quantitative Real-Time Polymerase Chain Reaction (qRT-PCR) and Gene Expression Analysis

The RNA was isolated from the roots of wt and ym at 25, 35, 45, and 55 dap. Then, complementary deoxyribonucleic acid (cDNA) was prepared with 2 μg of the total RNA using a PrimeScriptTM RT reagent Kit with gDNA Eraser (TaKaRa, Code No. RR047A). In accordance with the manufacturer’s instructions, the expression levels of Lut 5 and 19 photosynthesis-related genes in the taproots of wt and ym at four time points of root development were analyzed by means of qRT-PCR on the Roche LightCycler 96 Real-Time PCR System using SYBR Premix Ex Taq kit (TaKaRa). Three independent samples of carrot root were used for qRT-PCR experiments. Each gene and sample were run in triplicate. The reaction mixture (20 μL in total) was composed of 2 μL of 10× diluted cDNA strands, 10 μL of SYBR Premix Ex Taq, 6.4 μL of deionized water, and 0.8 μL of each primer (20 mM). The Ct value of each gene was investigated and normalized to the Ct value of UBQ, and the relative gene expression level was calculated by the 2−ΔΔCT method [24]. The primers used for qRT-PCR were designed with Primer Premier 5 software by intron spanning and listed in Table S2. Finally, the qRT-PCR data were statistically analyzed using SAS 9.2 with t-test at a significant difference level of 0.05. The heatmap of gene expression was generated in R 4.0.4 with the pheatmap package.

2.7. Resequencing of wt and ym

DNA extraction of wt and ym was performed by the CTAB method. Sequencing libraries of 400 bp paired-end reads were constructed and sequenced to 30× depths using Next-Generation Sequencing based on the IlluminaHiSeq platform. FastQC software was employed to control the data quality. High-quality data were aligned to the reference carrot genome with bwa (0.7.12-r1039) [25] after filtering. Thereafter, GATK software [26] was used to identify single-nucleotide polymorphisms (SNPs) between wt and ym. The quality of resequencing data is presented in Table S3.

3. Results

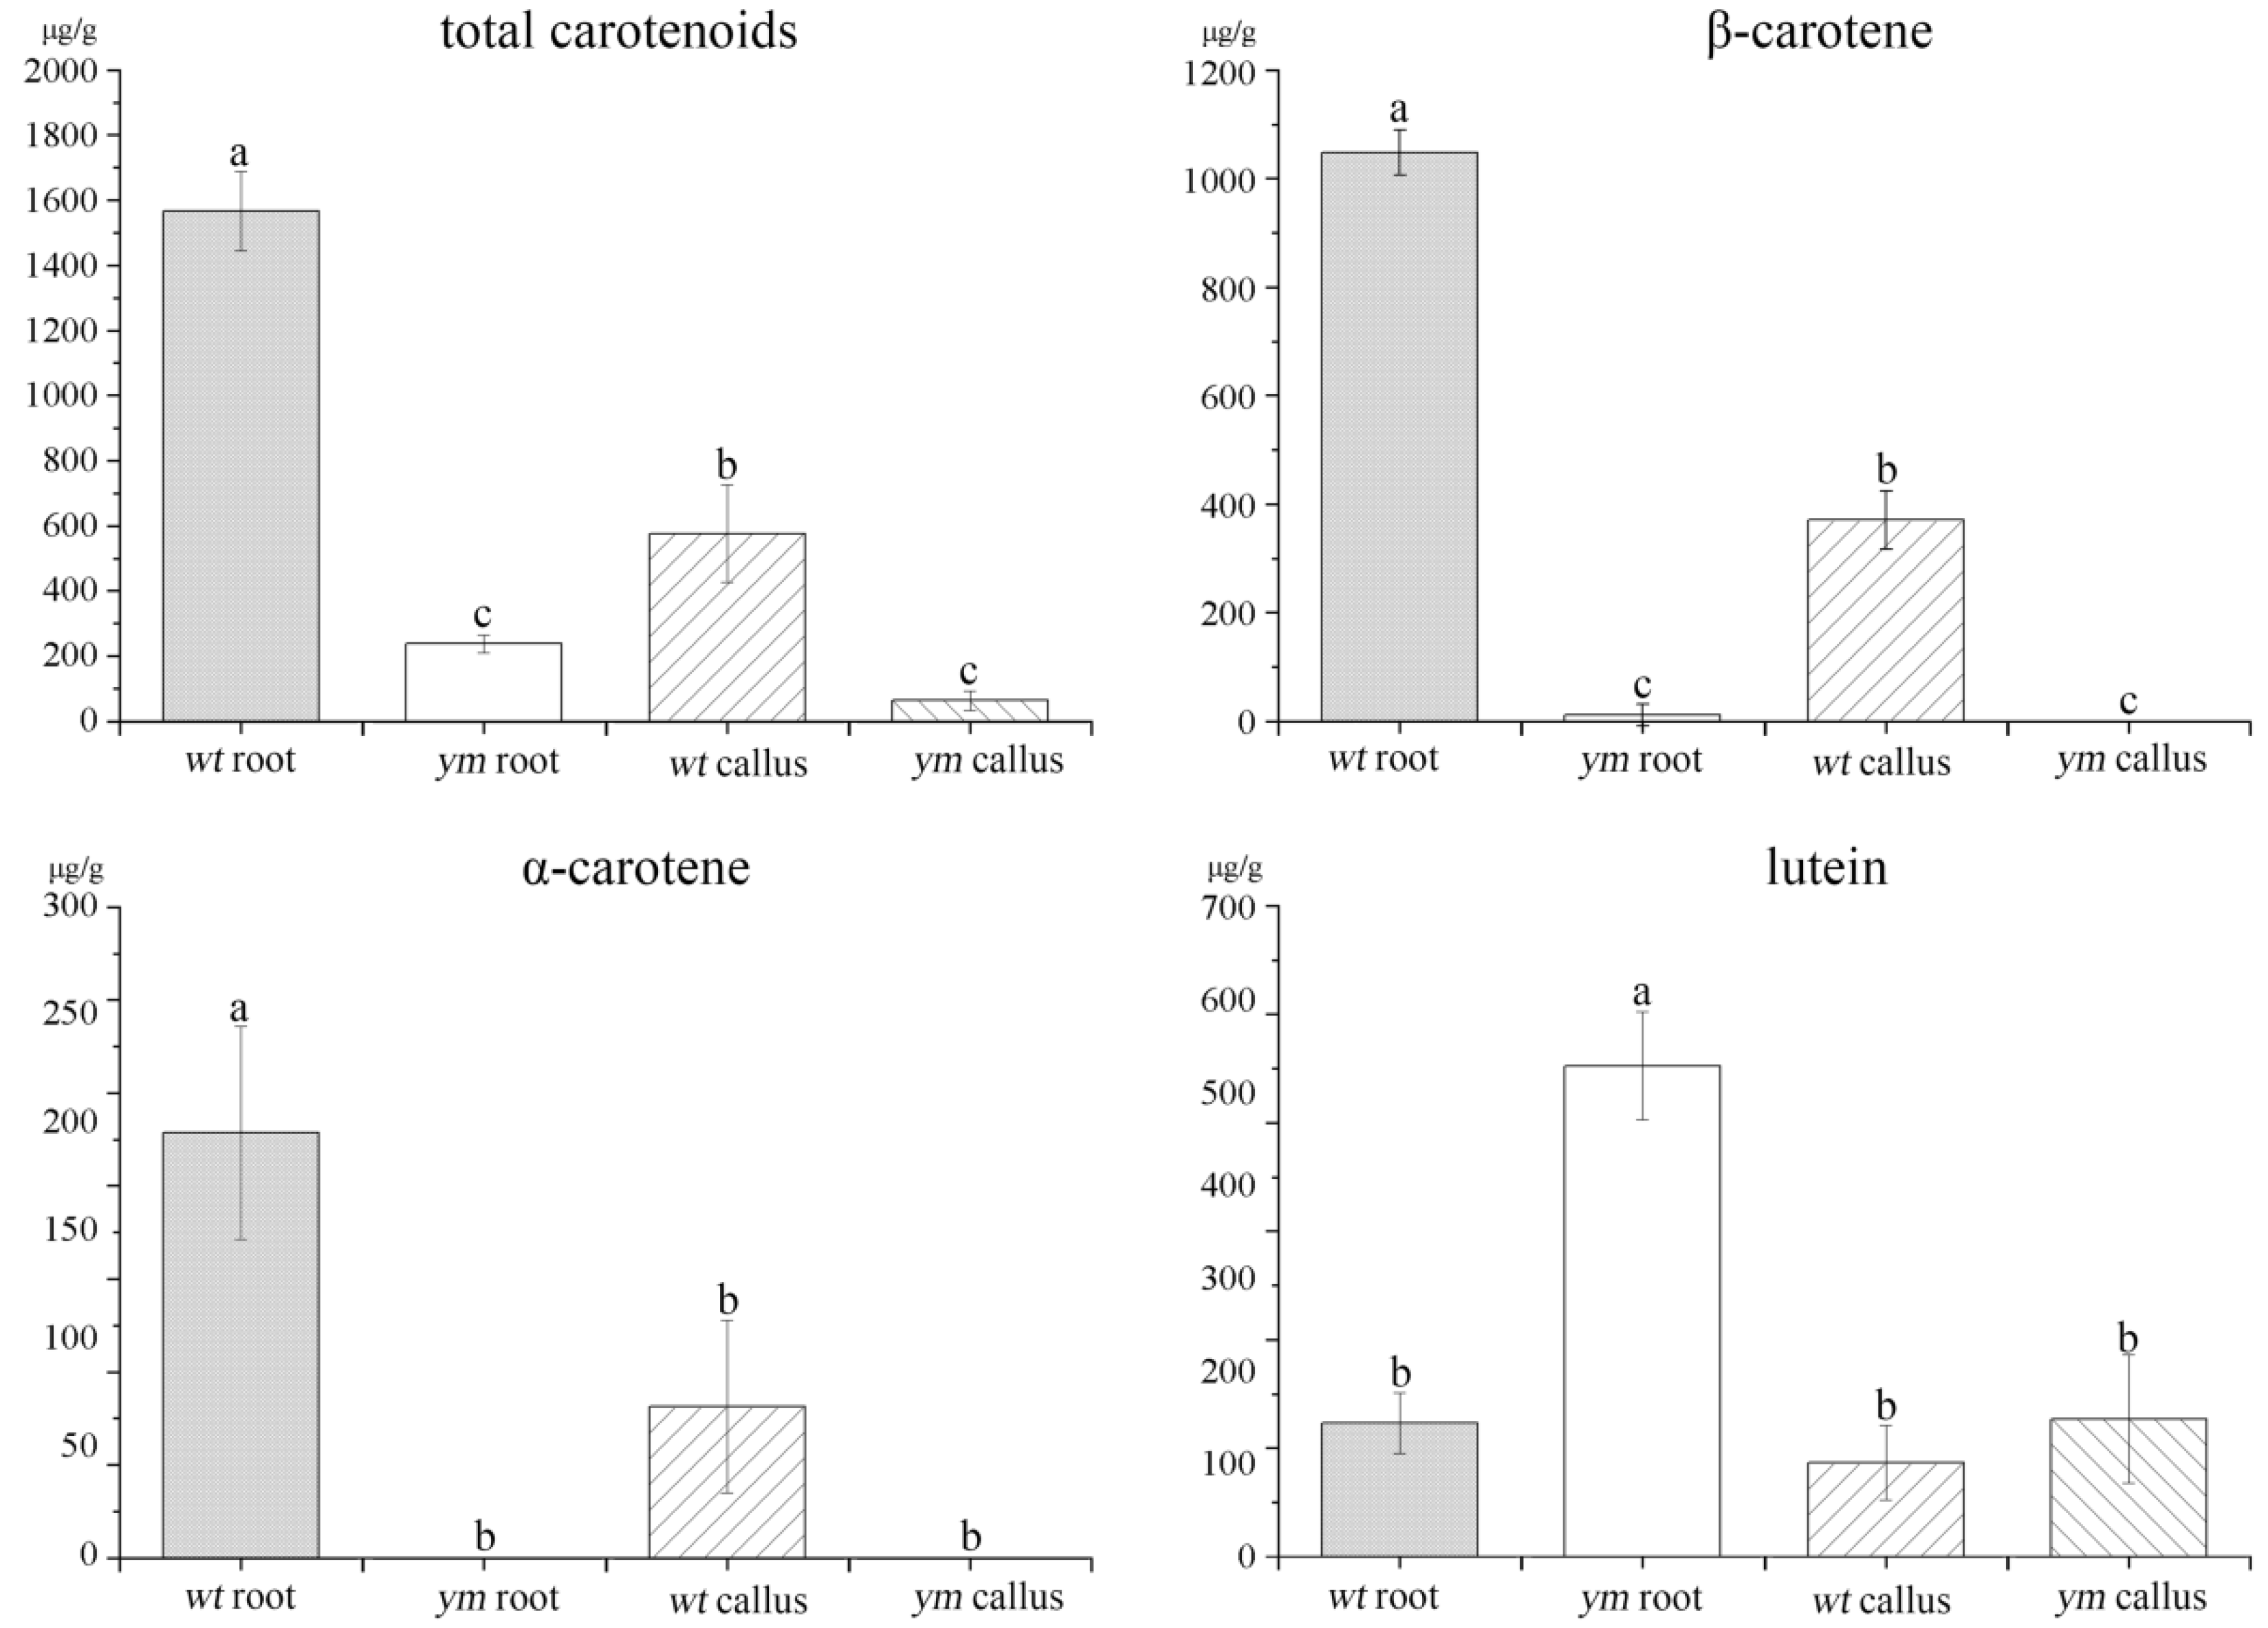
3.1. Carotenoid Content in the Roots and Calli of wt and ym

The results of HPLC analysis and comparison of carotenoid content in the root (Figure 1A,D) and callus (Figure 1B,C,E,F) of wt and ym revealed that the total carotenoid content in the root of wt was high (1566.8 µg/g DW), which was a result from the presence of three main compounds (Figure 2). β-carotene predominated in the root and accounted for 67% of all carotenoids, while α-carotene and lutein constituted only 29% and 4%, respectively. In contrast, the wt callus exhibited a similar ratio of α-carotene (28%), β-carotene (64%), and lutein (8%), but contained lower content of carotenoids (576.4 µg/g DW) than the wt root (p < 0.05). Moreover, the total carotenoid content in the root of ym (237.5 µg/g DW) was significantly lower than that in the root and callus of wt, but lutein accounted for 95% of all carotenoids. The ym callus contained considerably low content of carotenoids (63.5 µg/g DW) with 100% lutein.
The above results indicated that the observed orange callus of wt and yellow callus of ym can be attributed to the accumulation of carotenoid pigments, β-carotene and lutein, respectively, that are present in a similar ratio in the root.

3.2. Obvious Differences in the Callus of wt and ym at the Histological and Ultrastructural Levels

Observations with a slide scanner revealed that the tissues of wt callus were rich mainly in orange structures of regular shapes (Figure 3A), and were also obviously visible under a polarization microscope (Figure 3B). In contrast, ym callus tissues were almost transparent (Figure 3D) and very few birefringent crystals were observed under polarized light (Figure 3E). The callus of wt contained large numbers of globular chromoplasts and amylochromoplasts that had many plastoglobuli enclosed inside the stroma (Figure 3C), while that of ym only contained a small number of globular chromoplasts with few plastoglobuli (Figure 3F). Large starch grains and mitochondria were observed in the wt callus (Figure 3C), but were absent in the ym callus (Figure 3F).

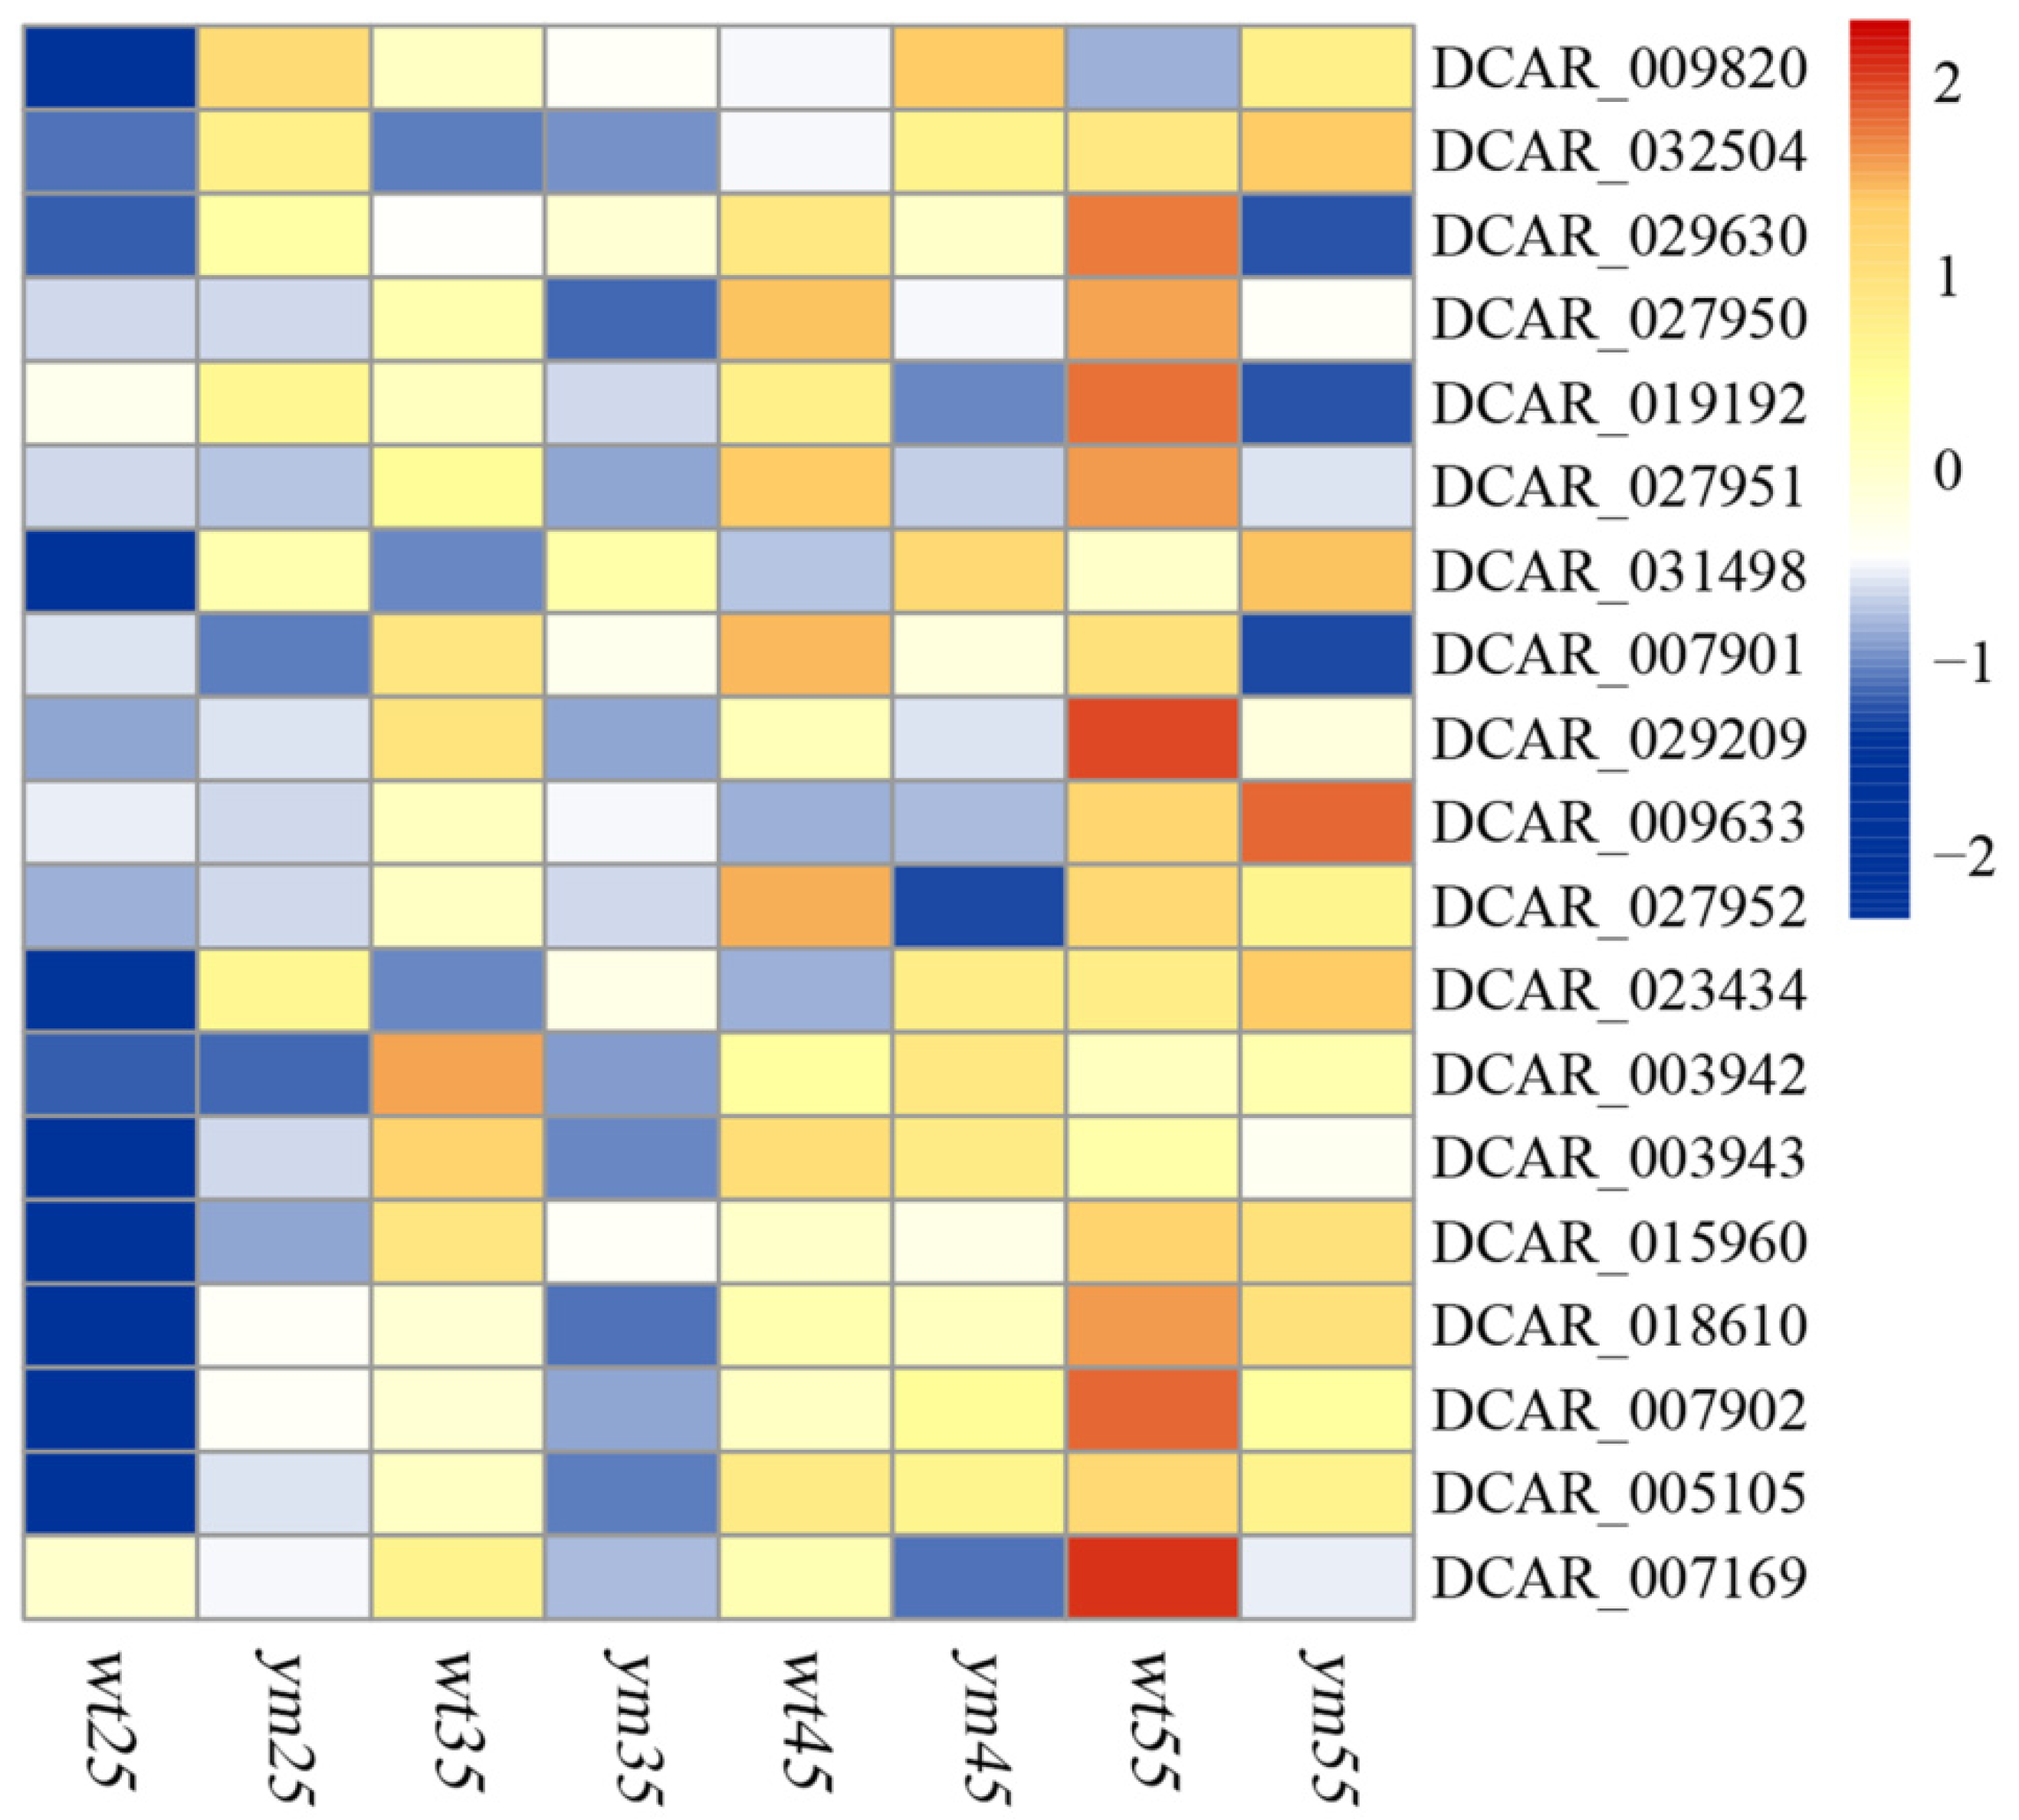
3.3. Analysis Results of DEGs between wt and ym

The roots of wt and ym carrots started to accumulate a lot of carotenoids at 35 dap (Figure S1). Therefore, transcriptome analysis of the root at this time point was conducted. There were 2810 DEGs between wt and ym. Among them, 1549 genes were significantly downregulated and 1261 genes were significantly upregulated (Figure 4A). GO enrichment analysis was performed in all DEGs. The most representative biological processes (BPs) and the top 20 terms are presented in Figure 4B. Three photosynthesis-related categories containing 19 genes were enriched in the top 10 terms, including light harvesting and reaction (Figure 4B).
Enrichment analysis of all DEGs was also performed by the Kyoto Encyclopedia of Genes and Genomes (KEGG) (Figure 4C). It was found that there were 8 enriched pathways between wt and ym according to the standard significance of p < 0.05, namely, photosynthetic antenna proteins, starch and sucrose metabolism, phenylpropanoid biosynthesis, arachidonic acid metabolism, glycine, serine and threonine metabolism, cyanoamino acid metabolism, monoterpenoid biosynthesis, and arginine biosynthesis. The photosynthetic antenna protein is the top 1 pathway with the lowest p value (4.102 × 10⁻⁵) and the highest rich factor (4.39). This pathway contained 9 genes that were also included in the 19 genes of the 3 photosynthesis-related categories.
Nineteen photosynthesis-related DEGs clustered by GO and KEGG were analyzed by qRT-PCR at different development stages (Figure 5). α-carotene and β-carotene were the leading carotenoids of wt, while lutein was the leading carotenoid of ym (Figure 2). From 35 dap, the levels of α-carotene and β-carotene were significantly increased in wt, while the level of lutein was significantly increased in ym (Figure S1). The correlation between the level of carotenoids in the root and 19 DEGs was determined by the Pearson correlation coefficient based on the data of four development stages. Among them, 11 DEGs were significantly associated with lutein content in the root of ym (Table 1). DCAR_003942 and DCAR_009633 were significantly correlated with lutein (r = 0.732 and 0.687, p < 0.01 and p < 0.05, respectively) (Table 1), and were significantly upregulated at 45 and 55 dap in ym, respectively, compared with those in wt (Figure 5 and Figure S2). DCAR_019192 and DCAR_029630 were negatively correlated with lutein but positively correlated with α-carotene and β-carotene (p < 0.01) (Table 1). In comparison with those in wt, these two genes were both significantly downregulated at 45 and 55 dap in ym (Figure 5 and Figure S2). Five genes, DCAR_005105, DCAR_007902, DCAR_018610, DCAR_023434 and DCAR_031498, were significantly correlated with lutein, α-carotene and β-carotene (p < 0.01) (Table 1). The expression level of DCAR_005105 was significantly lower in ym than in wt at 35 dap, 45 dap and 55 dap (p < 0.05). The expression levels of DCAR_007902 and DCAR_018610 were significantly lower in ym than in wt at 55 dap. The expression level of DCAR_023434 was significantly higher in ym than in wt at 45 and 55 dap. Moreover, the expression level of DCAR_031498 was significantly higher in ym than in wt at four development stages (p < 0.05) (Figure 5 and Figure S2). DCAR_015960 and DCAR_032504 were significantly correlated with lutein and β-carotene (p < 0.01) and lutein (p < 0.05) and α-carotene (p < 0.01), respectively (Table 1). The expression level of DCAR_015960 was significantly lower in ym than in wt at 35 dap. DCAR_032504 was expressed at a significantly higher level in ym than in wt at 45 and 55 dap (Figure 5 and Figure S2).

3.4. Identification of Variations of 19 Photosynthesis-Related Genes and 4 Mapped Genes Controlling Carotenoids in the Root of wt and ym

In order to further explore the reasons for lutein accumulation in ym, resequencing was conducted to identify the variations in the coding sequence (CDS) regions of wt and ym. There were 4,407,439 SNPs in wt and 5,500,413 SNPs in ym. It was found that 22,889 genes contained 216,984 SNPs in the CDS regions that led to nonsynonymous mutations in ym (Table S3). The SNPs of 11 photosynthesis-related DEGs significantly associated with lutein accumulation were screened from the resequencing data. There were 6 DEGs that contained nonsynonymous variations within the CDS regions of wt and ym, namely, DCAR_005105, DCAR_007902, DCAR_018610, DCAR_019192, DCAR_023434, DCAR_029630 (Table 2). These genes contained one deletion mutation, two insertion mutations, two insertion and one deletion mutations, four insertion mutations, two insertion mutations, and one deletion mutation, respectively (Table 2).
Most variations among white, yellow and orange carrot roots can be explained by four genes of Y, Y2, Or and Lut 5. Nonsynonymous mutations of these genes were also identified in wt and ym. A previous study proved that there was no difference in Y and Y2 between wt and ym [27]. In addition, Or showed no nonsynonymous mutations (Figure S3). However, Lut 5 (DCAR_023843, CYP97A3) contained three insertion mutations that resulted in the changes of three amino acids (Table 2). The expression level of Lut 5 was consistently significantly higher in ym than in wt at 35, 45 and 55 dap (Figure S2).

4. Discussion

4.1. The Origin of Globular Chromoplasts in ym Callus Might Be Different from That in wt Callus

Chromoplasts are terminated plastids and are derived from other plastids, including proplastids, amyloplasts, and chloroplasts. Amylochromoplasts, a class of chromoplasts developing from amyloplasts, maintain starch grains and can include globular structures, making classification of chromoplasts ambiguous [28]. A number of amylochromoplasts containing a lot plastoglobuli structures indicate that chromoplasts are originated from amyloplasts in the wt callus. Plastoglobuli are considered as the most common carotenoid-containing structures in chromoplasts [2]. The large number of plastoglobuli may explain the significantly higher carotenoid content in wt callus. Chromoplasts are classified into globular, crystalloid, tubular and membranous types, depending on the chemical composition and ultrastructure [2,3,18]. It is well known that crystalloid chromoplasts store carotenoids in the crystalline form of different shapes in the carrot root [29,30,31]. Kim et al. [32] found a small number of globular chromoplasts in carrot root tissues. In this study, globular chromoplasts are the only type found in the ym callus. The small number of globular chromoplasts with few plastoglobuli observed in the cells of the ym callus could only accumulate few carotenoids. It can be included that the origin of globular chromoplasts in the ym callus might be different from that in the wt callus.

4.2. Lut 5 Was the Only Gene of All Mapped Genes Controlling Carotenoids in the Carrot Root That Contained Nonsynonymous Mutations in ym

Orange carrots are mainly high in α-carotene and β-carotene, while yellow carrots are packed with lutein [33]. The HPLC results of wt and ym in this study were consistent with those of previous research (Figure 1). In carrots, several quantitative trait loci (QTLs) were identified to be associated with carotenoid accumulation, and the Y and Y2 loci were firstly mapped to chromosomes 5 and 7, which explained most phenotypic variations among orange, yellow, and white storage roots [34,35,36]. DCAR_032551, the candidate gene for Y locus, was identified [6]. Y2 was mapped within the 650 kb region, and two closely linked codominant markers, 4135Apol1 and 4144ApeKI, were associated with β-carotene accumulation [17]. It has been previously manifested that sequence alignment within the CDS region of DCAR_032551 and polymorphism identification of Y2 with the two linked CAPs markers between wt and ym exhibit no differences [27].
Or gene (DCAR_009172) was also demonstrated to control carotenoid presence in carrots due to a nonsynonymous mutation at 5,228,434 bp cosegregating with carotenoid content [20,21]. However, in this study, no nonsynonymous mutation was found within the Or CDS region of wt and ym (Figure S3). Therefore, Y, Y2 and Or were all excluded from the candidate gene list for lutein accumulation in ym. The Lut 5 homolog (DCAR_023843, CYP97A3), a β-ring carotene hydroxylase, was mapped within the fourth QTL [21] and was the only carotenoid pathway-related gene associated with α-carotene and total carotenoids in orange carrots [14]. Arango et al. [14] also found an 8 nt insertion in the allele in orange carrots, resulting in a truncated and nonfunctional protein. Overexpression of Lut 5 (CYP97A3) in transgenic orange carrots significantly reduces carotenoid levels in roots [14]. In this study, the expression level of Lut 5 (CYP97A3) in ym was also significantly higher than in wt during lutein accumulation (Figure S2), and three SNPs of Lut 5 produced nonsynonymous mutations. Therefore, Lut 5 could be a candidate gene for lutein accumulation in ym, although it contains different variations compared with the mutation detected in the previous report.

4.3. Photosynthesis-Related Genes Might Be Involved in Lutein Accumulation

Until now, Lut 5 was the only carotenoid pathway-related gene that was mapped to control carotenoids in carrot roots. The candidate gene of Y, DCAR_032551, regulates photosystem (PS) development and controls a portion of carotenoid in carrot roots [6]. The Or gene is responsible for the biogenesis of chromoplasts, where carotenoids are stored [37]. Light inhibits carotenoid accumulation in carrot roots, suggesting the existence of other regulatory mechanisms outside of the carotenoid pathway. Arias et al. [15] found that dark-grown carrot roots accumulated high levels of carotenoids compared with light-grown roots, because several genes involved in photomorphogenesis and light perception such as PHYA, PHYB, PIF3, PAR1, CRY2, FYH3, FAR1 and COP1 were highly expressed. PS-related genes in highly pigmented carrot roots have been upregulated in comparison with white roots [6]. The above results suggest that PS-related genes are involved in the regulation of carotenoid biosynthesis in the carrot root with or without light.
Interestingly, according to GO and KEGG analyses by transcriptome sequencing, 19 photosynthesis-related DEGs were also enriched in wt and ym in this study. Six DEGs contained nonsynonymous mutations in the CDS region, including DCAR_005105 (LHCB1.3), DCAR_007902 (LHCB1.3), DCAR_018610 (PSAL), DCAR_019192 (PSB27-1), DCAR_023434 (psbB), and DCAR_029630 (LHCB1.3). Except for DCAR_023434 (psbB), the remaining five genes were expressed significantly higher at one or more time points during lutein accumulation in wt than in ym. DCAR_005105, DCAR_007902 and DCAR_029630 are all homologs of LHCB1.3, which is a subunit of light-harvesting complex II (LHCII). LHCII absorbs light and is responsive to phytochromes in etiolated seedlings [38]. DCAR_018610 (PSAL) encodes PSI reaction center subunit L, which is believed to function as a docking site for LHCII [39,40]. DCAR_019192 (PSB27) is a chloroplast lumen localized protein that is involved in adaptation to changes in light intensity [41]. PSII is a pigment-protein complex in the thylakoid membrane. DCAR_023434 (psbB) encodes CP47, a subunit of the PSII reaction center involved in binding chlorophyll [42].
In the F2 population derived from the cross of wt and ym, dark-orange, orange, orange-yellow, yellow-orange, yellow and light-yellow roots were observed (unpublished). These phenotypes demonstrate that carotenoids are controlled by at least two genes or more. Therefore, in addition to Lut 5, there must be other genes controlling carotenoids that result in ym from wt mutagenesis. The six photosynthesis-related genes can be regarded as candidate genes as well.

5. Conclusions

Root calli of ym contained fewer colored crystals and globular chromoplasts compared with those of wt. Based on RNA-seq data analysis, 19 photosynthesis-related DEGs were enriched. Six of them had nonsynonymous mutations, including PSAL, PSB27-1, psbB, and three homologs of LHCB1.3. Lut 5, the mapped gene regulating lutein content in the carrot root, also had nonsynonymous mutations in ym. These 7 genes were shown to be significantly differently expressed at one or more time points during the lutein accumulation process. To sum up, it is predicted that the 6 photosynthesis-related genes and Lut 5 are candidate genes for lutein accumulation, which results in root color mutation. The candidate genes identified in this study can provide a new insight into the molecular mechanism of lutein modulation.

Supplementary Materials

The following supporting information can be downloaded at: https://www.mdpi.com/article/10.3390/agronomy12081866/s1, Table S1: Statistics of transcriptome sequencing quality of wt and ym; Table S2: qRT-PCR primer sequences of reference gene, 19 DEGs and Lut 5; Table S3: Information of total reads, resequencing data quality and sequence variation of wt and ym; Figure S1: Carotenoid compositions of the root of wt and ym at different development stages. Means (±standard errors) per unit of DW. Figure S2: Expression level of 11 DEGs significantly associated with lutein content and Lut 5 by quantitative real-time PCR. Lowercase letters indicate the least significant difference at 0.05 between wt and ym at different development stages. Values are the mean ± t * SE, with t value from a student-t table. Figure S3: Sequence alignment of Or gene between wt and ym.

Author Contributions

Conceptualization, Z.W. and L.J.; investigation, H.X. and D.L.; formal analysis, Z.L., L.L. and X.Y.; writing—original draft, Z.W.; writing review and editing, Z.W., X.Y. and H.X. All authors have read and agreed to the published version of the manuscript.

Funding

This work was supported by the General Program of the Natural Science Foundation of Shanxi Province (20210302123412), the Key Research and Development Plan of Shanxi Province (201903D221063), the National Natural Science Foundation of China (31601751), Shanxi Scholarship Council of China (2021-066), the Science and Technology Innovation Project of Shanxi Agricultural University (2016ZZ02) and the China Agriculture Research System of MOF and MARA (CARS-23-G40).

Institutional Review Board Statement

Not applicable.

Informed Consent Statement

Not applicable.

Data Availability Statement

Not applicable.

Conflicts of Interest

The authors declare no conflict of interest.

References

  1. Surles, R.L.; Weng, N.; Simon, P.W.; Tanumihardjo, S.A. Carotenoid profiles and consumer sensory evaluation of specialty carrots (Daucus carota L.) of various colors. J. Agric. Food Chem. 2004, 52, 3417–3421. [Google Scholar] [CrossRef] [PubMed]
  2. Schweiggert, R.M.; Carle, R. Carotenoid deposition in plant and animal foods and its impact on bioavailability. Crit. Rev. Food Sci. Nutr. 2017, 57, 1807–1830. [Google Scholar] [CrossRef]
  3. Solymosi, K.; Keresztes, A. Plastid structure, diversification and interconversions II. land plants. Curr. Chem. Biol. 2013, 6, 187–204. [Google Scholar] [CrossRef]
  4. Schweiggert, R.M.; Mezger, D.; Schimpf, F.; Steingass, C.B.; Carle, R. Influence of chromoplast morphology on carotenoid bioaccessibility of carrot, mango, papaya, and tomato. Food Chem. 2012, 135, 2736–2742. [Google Scholar] [CrossRef] [PubMed]
  5. Oleszkiewicz, T.; Klimek-Chodacka, M.; Milewska-Hendel, A.; Zubko, M.; Stroz, D.; Kurczynska, E.; Boba, A.; Szopa, J.; Baranski, R. Unique chromoplast organisation and carotenoid gene expression in carotenoid-rich carrot callus. Planta 2018, 248, 1455–1471. [Google Scholar] [CrossRef]
  6. Iorizzo, M.; Ellison, S.; Senalik, D.; Zeng, P.; Satapoomin, P.; Huang, J.; Bowman, M.; Iovene, M.; Sanseverino, W.; Cavagnaro, P.; et al. A high-quality carrot genome assembly provides new insights into carotenoid accumulation and asterid genome evolution. Nat. Genet. 2016, 48, 657–666. [Google Scholar] [CrossRef] [Green Version]
  7. Just, B.J.; Santos, C.A.; Fonseca, M.E.; Boiteux, L.S.; Oloizia, B.B.; Simon, P.W. Carotenoid biosynthesis structural genes in carrot (Daucus carota): Isolation, sequence-characterization, single nucleotide polymorphism (SNP) markers and genome mapping. Theor. Appl. Genet. 2007, 114, 693–704. [Google Scholar] [CrossRef]
  8. Bowman, M.J.; Willis, D.K.; Simon, P.W. Transcript Abundance of Phytoene Synthase 1 and Phytoene Synthase 2 is associated with natural variation of storage root carotenoid pigmentation in carrot. J. Am. Soc. Hortic. Sci. 2014, 139, 63–68. [Google Scholar] [CrossRef] [Green Version]
  9. Clotault, J.; Peltier, D.; Berruyer, R.; Thomas, M.; Briard, M.; Geoffriau, E. Expression of carotenoid biosynthesis genes during carrot root development. J. Exp. Bot. 2008, 59, 3563–3573. [Google Scholar] [CrossRef] [Green Version]
  10. Fuentes, P.; Pizarro, L.; Moreno, J.C.; Handford, M.; Rodriguez-Concepcion, M.; Stange, C. Light-dependent changes in plastid differentiation influence carotenoid gene expression and accumulation in carrot roots. Plant Mol. Biol. 2012, 79, 47–59. [Google Scholar] [CrossRef]
  11. Ma, J.; Li, J.; Xu, Z.; Wang, F.; Xiong, A. Transcriptome profiling of genes involving in carotenoid biosynthesis and accumulation between leaf and root of carrot (Daucus carota L.). Acta Biochim. Biophys. Sin. (Shanghai) 2018, 50, 481–490. [Google Scholar] [CrossRef] [PubMed] [Green Version]
  12. Wang, H.; Ou, C.G.; Zhuang, F.Y.; Ma, Z.G. The dual role of phytoene synthase genes in carotenogenesis in carrot roots and leaves. Mol. Breed. 2014, 34, 2065–2079. [Google Scholar] [CrossRef] [PubMed] [Green Version]
  13. Moreno, J.C.; Pizarro, L.; Fuentes, P.; Handford, M.; Cifuentes, V.; Stange, C. Levels of lycopene beta-cyclase 1 modulate carotenoid gene expression and accumulation in Daucus carota. PLoS ONE 2013, 8, e58144. [Google Scholar] [CrossRef] [Green Version]
  14. Arango, J.; Jourdan, M.; Geoffriau, E.; Beyer, P.; Welsch, R. Carotene hydroxylase activity determines the levels of both alpha-carotene and total carotenoids in orange carrots. Plant Cell 2014, 26, 2223–2233. [Google Scholar] [CrossRef] [PubMed] [Green Version]
  15. Arias, D.; Maldonado, J.; Silva, H.; Stange, C. A de novo transcriptome analysis revealed that photomorphogenic genes are required for carotenoid synthesis in the dark-grown carrot taproot. Mol. Genet. Genom. 2020, 295, 1379–1392. [Google Scholar] [CrossRef]
  16. Buishand, J.G.; Gabelman, W.H. Investigations on the inheritance of color and carotenoid content in phloem and xylem of carrot roots (Daucus carota L.). Euphytica 1979, 28, 611–632. [Google Scholar] [CrossRef]
  17. Ellison, S.; Senalik, D.; Bostan, H.; Iorizzo, M.; Simon, P. Fine mapping, transcriptome analysis, and marker development for Y2, the gene that conditions beta-carotene accumulation in carrot (Daucus carota L.). G3 2017, 7, 2665–2675. [Google Scholar] [CrossRef] [Green Version]
  18. Egea, I.; Barsan, C.; Bian, W.; Purgatto, E.; Latche, A.; Chervin, C.; Bouzayen, M.; Pech, J.C. Chromoplast differentiation: Current status and perspectives. Plant Cell Physiol. 2010, 51, 1600–1611. [Google Scholar] [CrossRef] [Green Version]
  19. Li, L.; Yuan, H. Chromoplast biogenesis and carotenoid accumulation. Arch. Biochem. Biophys. 2013, 539, 102–109. [Google Scholar] [CrossRef]
  20. Ellison, S.L.; Luby, C.H.; Corak, K.E.; Coe, K.M.; Senalik, D.; Iorizzo, M.; Goldman, I.L.; Simon, P.W.; Dawson, J.C. Carotenoid presence is associated with the Or gene in domesticated carrot. Genetics 2018, 210, 1497–1508. [Google Scholar] [CrossRef] [Green Version]
  21. Coe, K.M.; Ellison, S.; Senalik, D.; Dawson, J.; Simon, P. The influence of the Or and Carotene Hydroxylase genes on carotenoid accumulation in orange carrots [Daucus carota (L.)]. Theor. Appl. Genet. 2021, 134, 3351–3362. [Google Scholar] [CrossRef] [PubMed]
  22. Yu, G.; Wang, L.G.; Han, Y.; He, Q.Y. ClusterProfiler: An R package for comparing biological themes among gene clusters. Omics 2012, 16, 284–287. [Google Scholar] [CrossRef] [PubMed]
  23. Alexa, A.; Rahnenführer, J. Gene set enrichment analysis with topGO. Encycl. Syst. Biol. 2007, 9, 589. Available online: https://mirrors.nju.edu.cn/bioconductor/3.2/bioc/vignettes/topGO/inst/doc/topGO.pdf (accessed on 3 May 2016).
  24. Pfaffl, M.W. A new mathematical model for relative quantification in real-time RT-PCR. Nucleic Acids Res. 2001, 29, e45. [Google Scholar] [CrossRef]
  25. Li, H.; Durbin, R. Fast and accurate short read alignment with Burrows-Wheeler transform. Bioinformatics 2009, 25, 1754–1760. [Google Scholar] [CrossRef] [Green Version]
  26. Zhu, P.; He, L.; Li, Y.; Huang, W.; Xi, F.; Lin, L.; Zhi, Q.; Zhang, W.; Tang, Y.T.; Geng, C.; et al. OTG-snpcaller: An optimized pipeline based on TMAP and GATK for SNP calling from ion torrent data. PLoS ONE 2014, 9, e97507. [Google Scholar] [CrossRef] [Green Version]
  27. Wu, Z.; Liu, Z.; Chang, S.; Zhao, Y. An EMS mutant library for carrot and genetic analysis of some mutants. Breed. Sci. 2020, 70, 540–546. [Google Scholar] [CrossRef]
  28. Hempel, J.; Schadle, C.N.; Sprenger, J.; Heller, A.; Carle, R.; Schweiggert, R.M. Ultrastructural deposition forms and bioaccessibility of carotenoids and carotenoid esters from goji berries (Lycium barbarum L.). Food Chem. 2017, 218, 525–533. [Google Scholar] [CrossRef]
  29. Paolillo, D.J., Jr.; Garvin, D.F.; Parthasarathy, M.V. The chromoplasts of Or mutants of cauliflower (Brassica oleracea L. var botrytis). Protoplasma 2004, 224, 245–253. [Google Scholar] [CrossRef]
  30. Roman, M.; Marzec, K.M.; Grzebelus, E.; Simon, P.W.; Baranska, M.; Baranski, R. Composition and (in)homogeneity of carotenoid crystals in carrot cells revealed by high resolution Raman imaging. Spectrochim. Acta. A Mol. Biomol. Spectrosc. 2015, 136, 1395–1400. [Google Scholar] [CrossRef]
  31. Vásquez-Caicedo, A.L.; Heller, A.; Neidhart, S.; Carle, R. Chromoplast morphology and β-carotene accumulation during postharvest ripening of mango Cv. ‘Tommy Atkins’. J. Agric. Food Chem. 2006, 54, 5769–5776. [Google Scholar] [CrossRef] [PubMed]
  32. Kim, J.E.; Rensing, K.H.; Douglas, C.J.; Cheng, K.M. Chromoplasts ultrastructure and estimated carotene content in root secondary phloem of different carrot varieties. Planta 2010, 231, 549–558. [Google Scholar] [CrossRef] [PubMed]
  33. Arscott, S.A.; Tanumihardjo, S.A. Carrots of many colors provide basic nutrition and bioavailable phytochemicals acting as a functional food. Compr. Rev. Food Sci. Food Saf. 2010, 9, 223–239. [Google Scholar] [CrossRef]
  34. Santos, C.A.; Simon, P.W. QTL analyses reveal clustered loci for accumulation of major provitamin A carotenes and lycopene in carrot roots. Mol. Genet. Genom. 2002, 268, 122–129. [Google Scholar] [CrossRef]
  35. Just, B.J.; Santos, C.A.; Yandell, B.S.; Simon, P.W. Major QTL for carrot color are positionally associated with carotenoid biosynthetic genes and interact epistatically in a domesticated x wild carrot cross. Theor. Appl. Genet. 2009, 119, 1155–1169. [Google Scholar] [CrossRef] [PubMed] [Green Version]
  36. Cavagnaro, P.F.; Chung, S.-M.; Manin, S.; Yildiz, M.; Ali, A.; Alessandro, M.S.; Iorizzo, M.; Senalik, D.A.; Simon, P.W. Microsatellite isolation and marker development in carrot—Genomic distribution, linkage mapping, genetic diversity analysis and marker transferability across Apiaceae. BMC Genom. 2011, 12, 386. [Google Scholar] [CrossRef] [Green Version]
  37. Lu, S.; Van Eck, J.; Zhou, X.; Lopez, A.B.; O’Halloran, D.M.; Cosman, K.M.; Conlin, B.J.; Paolillo, D.J.; Garvin, D.F.; Vrebalov, J.; et al. The cauliflower Or gene encodes a DnaJ cysteine-rich domain-containing protein that mediates high levels of beta-carotene accumulation. Plant Cell 2006, 18, 3594–3605. [Google Scholar] [CrossRef] [Green Version]
  38. Karlin-Neumann, G.A.; Sun, L.; Tobin, E.M. Expression of light-harvesting chlorophyll a/b-protein Genes is phytochrome-regulated in etiolated Arabidopsis thaliana seedlings. Plant Physiol. 1988, 88, 1323–1331. [Google Scholar] [CrossRef] [Green Version]
  39. Qin, X.; Wang, W.; Wang, K.; Xin, Y.; Kuang, T. Isolation and characteristics of the PSI-LHCI-LHCII supercomplex under high light. Photochem. Photobiol. 2011, 87, 143–150. [Google Scholar] [CrossRef]
  40. Zhang, S.; Scheller, H.V. Light-harvesting complex II binds to several small subunits of photosystem I. J. Biol. Chem. 2004, 279, 3180–3187. [Google Scholar] [CrossRef] [Green Version]
  41. Hou, X.; Fu, A.; Garcia, V.J.; Buchanan, B.B.; Luan, S. PSB27: A thylakoid protein enabling Arabidopsis to adapt to changing light intensity. Proc. Natl. Acad. Sci. USA 2015, 112, 1613–1618. [Google Scholar] [CrossRef] [PubMed] [Green Version]
  42. Vermaas, W.F.; Williams, J.G.; Arntzen, C.J. Sequencing and modification of psbB, the gene encoding the CP-47 protein of Photosystem II, in the cyanobacterium Synechocystis 6803. Plant Mol. Biol. 1987, 8, 317–326. [Google Scholar] [CrossRef] [PubMed]
Figure 1. Roots of wt (A) and ym (D) used for callus induction. wt callus developed from the cambium of root discs and cultured on MS mineral medium in vitro (B), and its image observed at higher magnification (C). ym callus developed from the cambium of root discs and cultured on MS mineral medium in vitro (E), and its image observed at higher magnification (F).
Agronomy 12 01866 g001
Figure 2. Carotenoid compositions of the root and callus of wt and ym at 55 dap. Means (±standard errors) per unit of DW. Lowercase letters a, b and c indicate significant differences at the 0.05 level.
Agronomy 12 01866 g002
Figure 3. Callus tissues under the slide scanner (A,D) and polarization microscope (B,E), and ultrastructure of cells from wt callus (C) and ym callus (F). Tissues from wt were filled with orange crystals ((A,B), red, open arrows). In contrast, ym callus was rarely observed crystals ((D,E), red, open arrows). Globular chromoplasts (black, open arrows) were observed in the cells of wt and ym, but amylochromoplasts (arrow) were only observed in wt; many plastoglobuli (double arrow) were detected in wt but very few in ym. Crystal remnants (triple arrow) were present in both wt and ym. cw: cell wall, ld: lipid droplet, m: mitochondria, sg: starch grain.
Agronomy 12 01866 g003
Figure 4. Screening and enrichment analysis of DEGs between wt and ym. (A) Volcano plot of DEGs. grey dots: genes with no significant difference; red dots: significantly up-regulated genes; green dots: significantly down-regulated genes. (B) Top 20 terms of GO enrichment analysis of DEGs. The GO analysis classifified the genes with corrected p-values of less than 0.05 into DEGs. (C) Top 20 pathways of KEGG analysis of DEGs.The KEGG analysis classifified the genes with corrected p-values of less than 0.05 into DEGs. The five-pointed star represents photosynthesis-related items or pathways.
Agronomy 12 01866 g004
Figure 5. Heatmap of the 19 photosynthesis-related genes between wt and ym during the accumulation of carotenoids.
Agronomy 12 01866 g005
Table 1. Correlation between the expression levels of 19 photosynthesis-related genes and carotenoid content in different carrots.
Gene IDα-Carotene Contentβ-Carotene ContentLutein Content
DCAR_003942−0.204−0.3550.732 **
DCAR_0039430.2310.511 *0.469
DCAR_0051050.932 **0.841 **0.883 **
DCAR_0071690.681 *0.735 **−0.214
DCAR_0079010.696 *0.557 *0.015
DCAR_0079020.793 **0.727 **0.677 *
DCAR_0096330.5530.2320.687 *
DCAR_0098200.0540.700 **0.103
DCAR_0159600.5260.685 **0.762 **
DCAR_0186100.795 **0.755 **0.787 **
DCAR_0191920.850 **0.691 **−0.885 **
DCAR_0234340.734 **0.804 **0.685 **
DCAR_0279500.952 **0.783 **0.448
DCAR_0279510.927 **0.0530.479
DCAR_0279520.798 **0.769 **0.573
DCAR_0292090.642 *0.720 **0.369
DCAR_0296300.892 **0.764 **−0.778 **
DCAR_0314980.720 **0.742 **0.901 **
DCAR_0325040.777 **0.1010.590 *
Significance at * p < 0.05; ** p < 0.01.
Table 2. Variation information of candidate genes.
Gene Name Gene IDChromosomeMutation (wtym/Location)Protein (wtym)Annotation
LHCB1.3DCAR_0051052T→\:5310926Ser→GlnChlorophyll a-b binding protein 1
LHCB1.3DCAR_0079022\→A:38079097; \→G:38079148Ser→Phe;
His→Pro
Chlorophyll a-b binding protein 1
PSALDCAR_0186105\→T:31527204; \→A:31527207; T→\:31527877Leu→Thr;
Val→Cys;
Gln→Arg
Photosystem I reaction center subunit XI
PSB27-1DCAR_0191925\→T:36996224; \→T:36996230; \→C:36996242; \→C:36996245Leu→Thr;
Leu→Thr;
Gln→Ala;
*→Val
Photosystem II repair protein PSB27-H1
psbBDCAR_0234347\→G:1473188; \→C:1473283Ser→Thr;
Gln→Thr
Photosystem II CP47 protein
LHCB1.3DCAR_0296309A→\: 9939156Ser→LeuChlorophyll a-b binding protein 1
Lut5DCAR_0238437\→G:6068378; \→C:6071826; \→C:6071862Cys→Met;
Met→Ser;
Ile→Ser
Protein Lutein deficient 5
Publisher’s Note: MDPI stays neutral with regard to jurisdictional claims in published maps and institutional affiliations.

