Article

Silencing CaTPS1 Increases the Sensitivity to Low Temperature and Salt Stresses in Pepper

College of Horticulture, Gansu Agricultural University, Lanzhou 730070, China
*
Author to whom correspondence should be addressed.
These authors contributed equally to this work.
Agronomy 2023, 13(2), 319; https://doi.org/10.3390/agronomy13020319
Submission received: 16 December 2022 / Revised: 17 January 2023 / Accepted: 17 January 2023 / Published: 20 January 2023
(This article belongs to the Special Issue Vegetables Breeding for Stress Tolerance and Quality Improvement)

Abstract

:
Trehalose, as a non-reductive disaccharide, plays a vital role in plant growth and development and resistance to abiotic stress. Trehalose-6-phosphate synthase (TPS) is a key enzyme in the synthesis mechanism of trehalose and TPS1 genes play a crucial role in the response to abiotic stress in plants. However, it has rarely been reported that CaTPS1 responds to cold and salt stresses in pepper. To verify the function of CaTPS1 in response to cold and salt stresses, CaTPS1 was silenced by virus-induced gene silencing (VIGS). Subsequently, the expressions of CaTPS1, plant morphology and some physiological indexes were analyzed after cold and salt stresses in pepper. The results showed that the expression of CaTPS1 was significantly lower in CaTPS1-silenced (pTRV2-CaTPS1) plant than that in the non-VIGS (CK) and negative control (PTRV2-00) plants. The parameters of response to cold and salt stresses have changed accordingly. The chlorophyll content decreased, while the trehalose content, peroxidase (POD) activity, catalase (CAT) activity and ascorbate peroxidase (APX) activity increased in all treatments. However, these parameters of response to cold and salt stresses were significantly lower in pTRV2-CaTPS1 plant than in CK and PTRV2-00 plants. This study suggested that CaTPS1 was involved in the response to cold and salt stresses in pepper.

1. Introduction

Chili peppers (Capsicum annuum L.) are widely grown around the world as vegetable and spice crops due to their high nutrient and capsaicin content [1,2]. However, many biotic and abiotic factors contributed to the decline in the production and quality of pepper [3]. Low temperature and salt are the primary abiotic stresses that seriously restrict the growth and development of plants, including pepper [4,5], which led to a significant drop in yield and quality in Europe [6] and Australia [7].
As an energy substance and a stress protectant, trehalose (α-D-glucopyranosyl-1; 1-α-D-glucopyranose-side) plays a very important role in the growth and development of plants [8,9]. Trehalose is considered to be a potential osmotic protective agent for plants, mainly in the following ways to enhance plant tolerance: First, trehalose absorbs nutrients by improving the integrity of the membrane and the water relationship of plants, reducing electrolyte leakage and lipid oxidation; second, trehalose improves the gas exchange characteristics, protects the photosynthetic mechanism from the oxidative damage caused by salinity, and causes the change in the ultrastructure in plants. Third, the antioxidant activity of plants and the expression of stress-responsive proteins and genes were improved. Fourthly, it participates in the signal connection with signal molecules and plant hormones [10]. In addition, as a carbon source and structural component in fungi, bacteria, invertebrates, and insects, trehalose also functions as a key protectant of proteins and membranes during stress conditions such as high salinity, dehydration, hypoxia, nutrient starvation, and cold [11]. The biosynthesis of trehalose is regulated by two main enzymes, trehalose phosphate synthase (TPS) and trehalose-phosphatase (TPP). TPS first catalyzes glucose 6-phosphate (G6P) and uridine diphosphate glucose (UDP-Glc) to form trehalose 6-phosphate (T6P), then TPP catalyzes the dephosphorylation of T6P to form trehalose (Figure S1) [8,12,13]. TPS is a pivotal enzyme in the trehalose synthesis pathway and regulates the synthesis efficiency of trehalose.
TPS gene families have been identified in many species. For example, there is a gene family containing 53 TPSs members in cotton (Gossypium hirsutum) [14], 23 TPSs genes were found in soybean (Glycine max) [15], and eight TPSs genes were found in potato (Solanum tuberosum) [16]. Eleven TPSs genes have been found in pepper, Arabidopsis (Arabidopsis thaliana) and rice (Oryza sativa) [9,17]. In addition, most TPSs genes have two typical characteristic structural domains, the N-terminal TPS (Pfam: Glyco_transf_20) and the C-terminal TPP (Pfam: Trehalose_PPase) [14]. A total of 11 pepper TPS genes were identified in the whole genome database of pepper, except CaTPS3, which contains one TPS and two TPP structural domains, while the rest contain one TPS and one TPP structural domain, respectively. The expression of CaTPS1 in leaves is about five–six times higher than that in roots and stems, indicating that the ex-pression of CaTPS1 has obvious tissue specificity [9]. Yeast functional complementation experiments showed that only OsTPS1, out of 11 OsTPSs genes, had TPSase activity but not TPPase activity in rice [18]. In Arabidopsis, only AtTPS1 also has TPSase activity and no TPPase activity [17]. Currently, it was found that, among most TPSs gene families, only TPS1 has TPS activity. Brewer’s yeast (Saccharomyces cerevisiae) ScTPS1 functions as a metabolic enzyme and stress responder and transcript levels of TPS1 are often correlated with TPS activity and trehalose content [19].
Simultaneously, most TPSs genes in different organisms are also involved in stress-resistant processes in plants [20]. For example, the overexpression of OsTPS1 improved the tolerance to high salinity, drought, and cold treatments in rice [21,22]. Transfer of the yeast TPS gene into potato revealed that, during drought treatment, the transgenic plants had delayed wilting and higher stomatal conductance, net photosynthetic rate, and CO2 assimilation rate than wild-type plants, resulting in increased resistance to abiotic stresses. [23]. The overexpression of the SlTPS gene in tomatoes (Solanum lycopersicum) resulted in enhanced photosynthesis and increased tolerance to drought and salt stresses in transgenic plants [24]. Freezing stress induced the high expression of the TaTPS gene in winter wheat (Triticum aestivum), suggesting that the TaTPS gene could be involved in signaling pathways in response to freezing in winter wheat [25]. The overexpression of the OsTPS1 gene in rice led to increased tolerance to low temperature, salt, and drought stresses of rice seedlings, as well as grown trehalose and proline content in rice plants, and up-regulated expression of some stress-related genes, including OsWSI18, OsRAB16C, OsHSP70 and OsELIP genes [21]. The expression of CsTPS1, CsTPS9 and CsTPPA were highest under at least one abiotic stress, and it was speculated that these three genes might play a key role in the response of tea plants (Camellia sinensis L.) to abiotic stresses [26]. Under cold stress, the expression level of OsTPP1 would be improved, which would increase trehalose content and resistance to cold injury [27,28].
At present, as one of the most convenient methods for the indirect verification of gene function, virus-induced gene silencing (VIGS) has been widely used in some plants whose transgenic system is still immature [29]. Silencing StSSH2, StWTF, StUGT, StBHP, and StFLTP of potatoes by VIGS could accelerate plant senescence and decrease tuber number and size and dry matter contents [30]. The resistance to M. grisea of BMV (Brome mosaic virus): OsMED16 and BMV: OsMED25-infiltrated seedlings was reduced by regulating H2O2 accumulation and the expression of defense-related genes. Additionally, the tolerance to cold of BMV: OsMED16 infiltrated seedlings was reduced by increasing malondialdehyde (MDA) content and decreasing the expression of cold-responsive genes [31]. CaPIF8-silenced pepper plants obtained by VIGS showed a high sensitivity to cold and salt stresses significantly increased the relative electrolyte leakage (REL) and altered the expression of stress-related genes [32]. Silencing GhGLK1 in cotton brought more damage to plants under drought and cold stresses compared to wild-type (WT) [33].
Given that TPS1 genes play an important role in the response to abiotic stress in many plants, the response to abiotic stress of CaTPS1 in pepper has seldom been reported. In this study, we explored the function of CaTPS1 genes in cold and salt stresses in pepper by VIGS. It will be beneficial for understanding the biological function of CaTPS1 and contribute to the study of the molecular mechanism of abiotic stress resistance in pepper, thus providing new genes for the molecular breeding of pepper low temperature and salt stress.

2. Materials and Methods

2.1. Plant Materials and Growth Conditions

The cultivar ‘Qiangfeng 101′ (Capsicum annuum L.), provided by the College of Horticulture, Gansu agricultural university, China, was used in this study. Pick the pepper seeds with full grain and wrap them with gauze, soak them in hot water at 55 °C for 20 min, disinfect them with 20% trisodium phosphate for 20 min, germinate at 28 °C for 72 h, and sow them in the matrix of the nutrition bowl (vermiculite: Nutrient soil = 3:1), incubated in a light incubator. The pepper was planted in the nutrition bowl and grown in an artificial climate chamber with a 16 h light/8 h dark cycle at 28 °C and 23 °C, daytime light was 20,000 Lx.

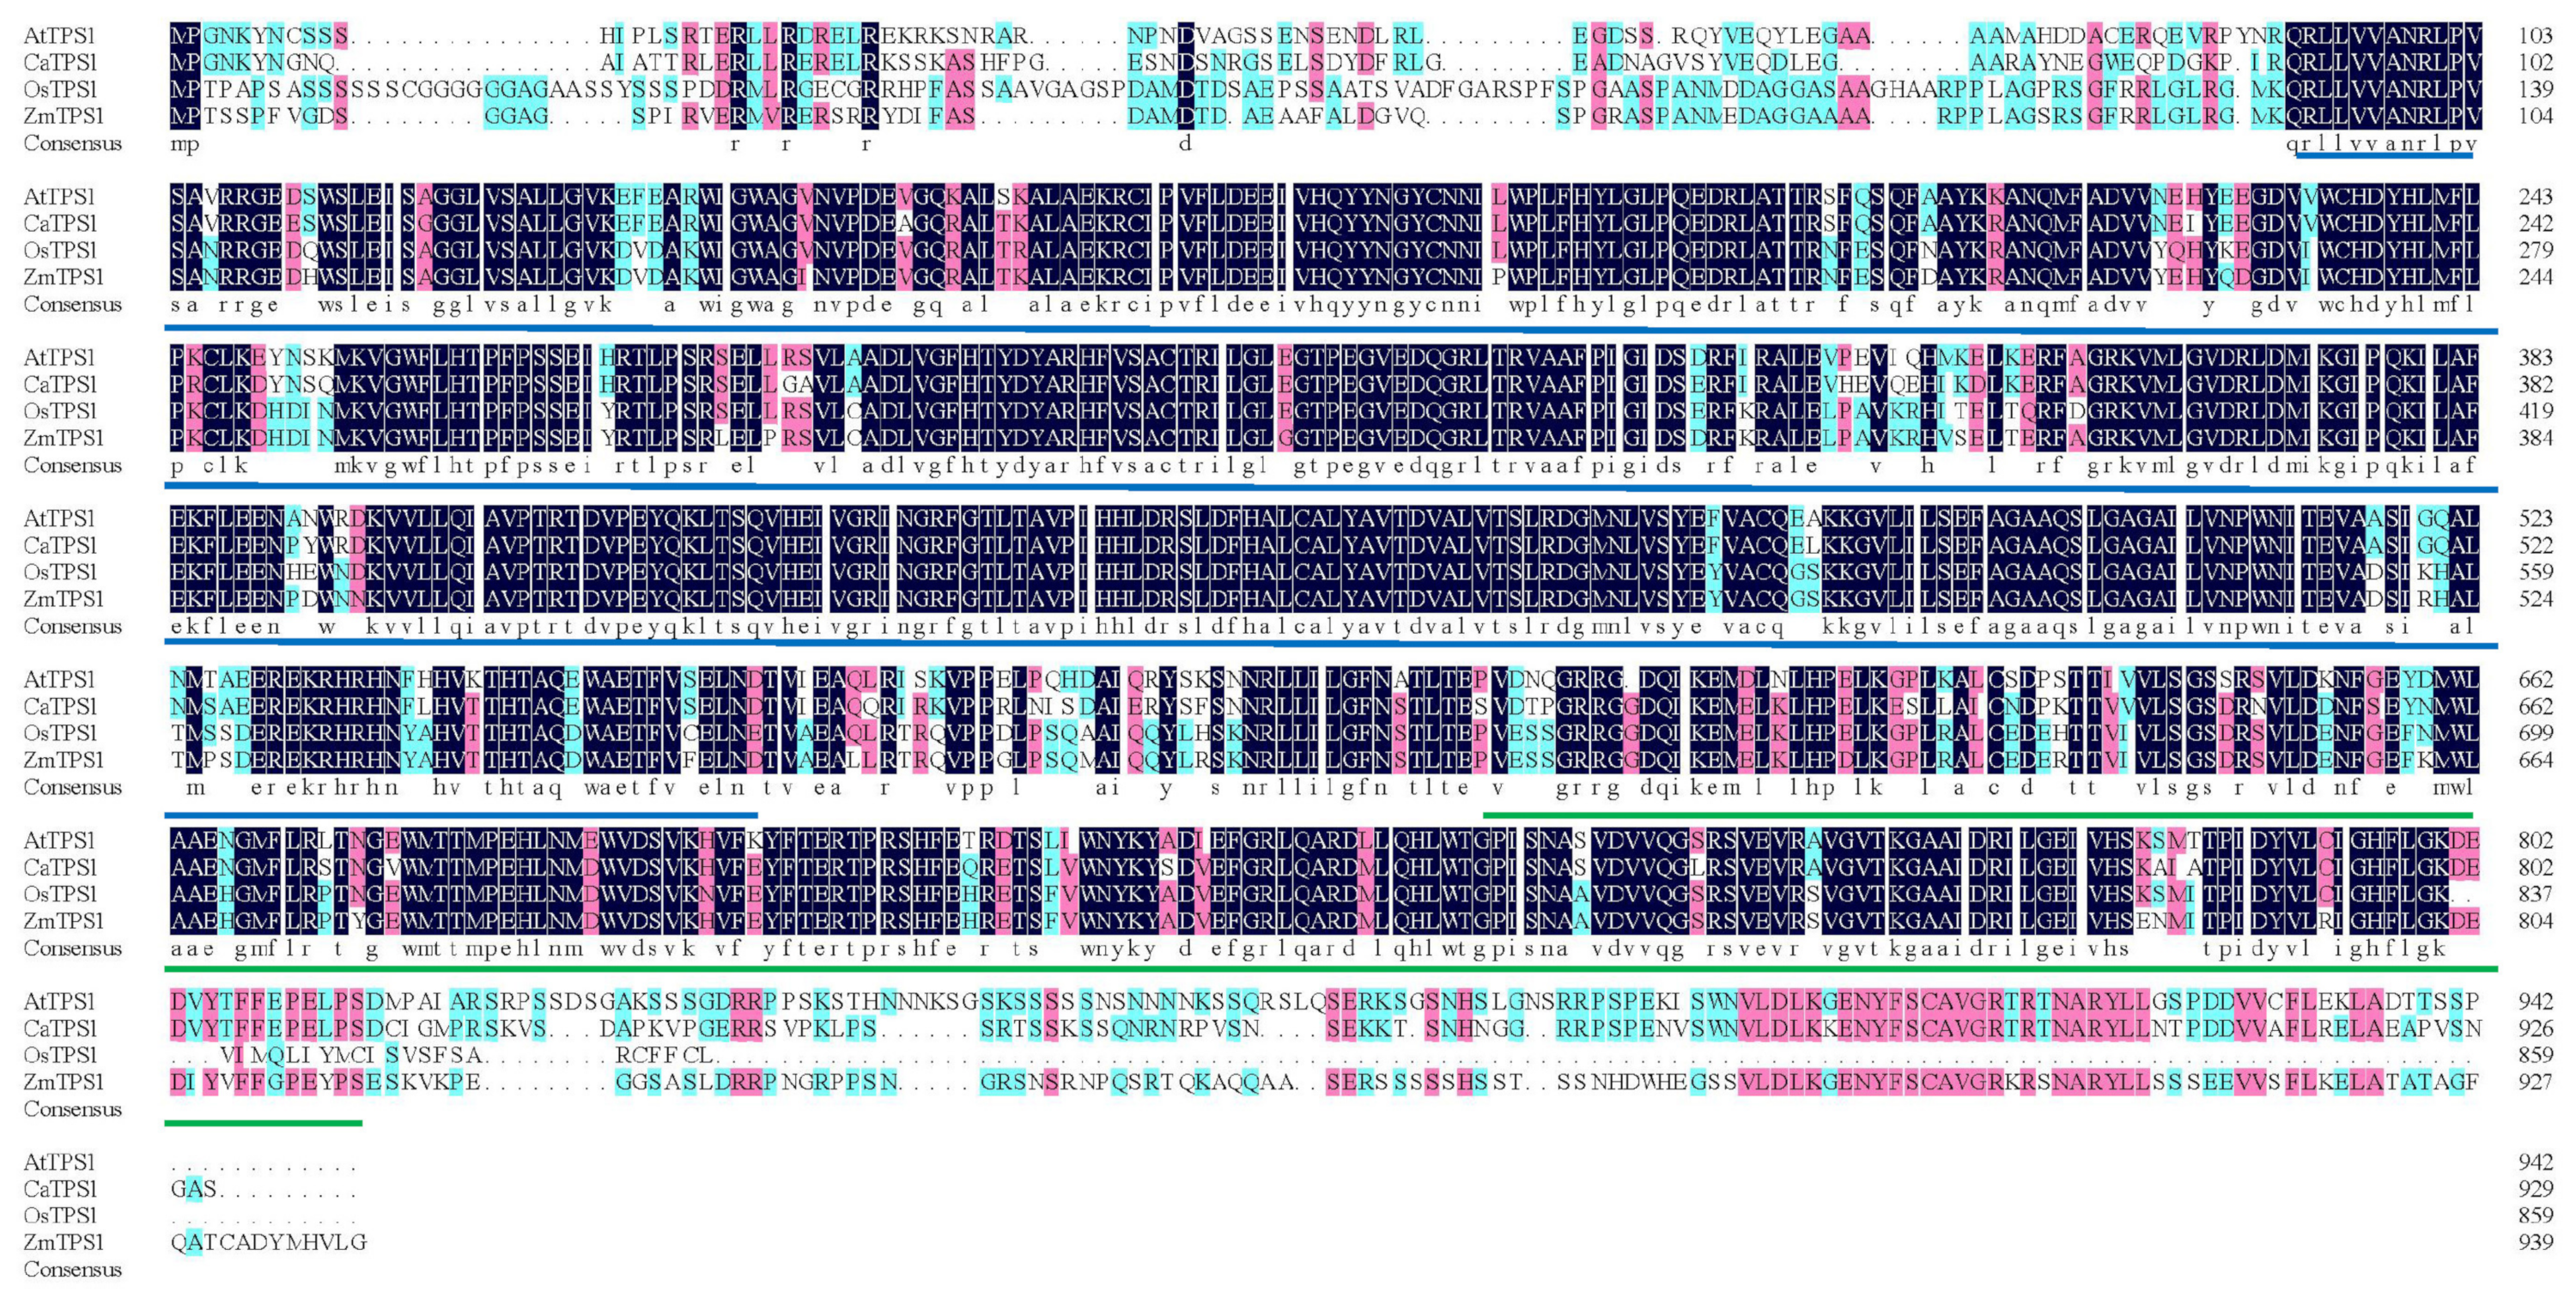
2.2. Homologous Sequence Alignment of CaTPS1

In order to describe the sequence similarity between CaTPS1 and the TPS proteins that have been characterized in other species (Rice (OsTPS1), Arabidopsis (AtTPS1) and Zea mays maize (ZmTPS1)), we searched their respective protein sequences according to the literature [17,34], and then performed multiple sequence alignments on them using DNAMAN.6 software [35]. Set the parameter to the default value. Their domains were analyzed using the online web site SMART (https://smart.embl.de/smart) accessed on 16 January 2023 and visualized using Photosho.2020 software [36]

2.3. Construction of Silencing Vectors and Infection of Plants

The pTRV1 and pTRV2 vectors (tobacco rattle virus) were used to construct the VIGS system. CaTPS1 was amplified by the gene-specific primers V2-CaTPS1 (Table 1). PCR product was purified and inserted into the pTRV2 vector with SoSoo homologous recombinase (Qingke, Beijing, China) at 50 °C for 15 min, and then transformed into E.coli DH5α. A single colony with an appropriate fragment size was cultured in LB liquid with 50 μg/mL kanamycin, and the bacterial liquid culture samples were sequenced to verify the results of the recombinant vector (Shenggong, Shanghai, China). Then, the recombinant plasmid of pTRV2-CaTPS1 was obtained according to the sequencing results. The negative control empty pTRV2-00 recombinant plasmid was constructed in the same method as described above. Subsequently, the constructed vectors pTRV2-00 and pTRV2-CaTPS1 were introduced into Agrobacterium tumefaciens GV3101.
The A. tumefaciens solutions carrying pTRV1, pTRV2-00 and pTRV2-CaTPS1 were grown on LB medium with 50 μg/mL kanamycin, 50 μg/mL gentamicin and 50 μg/mL rifampicin. The reconstituted colony was transferred to LB liquid medium containing the above antibiotics and incubated at 28 °C and 220 rpm for 24 h. A. tumefaciens was then concentrated by centrifugation and resuspended in an infiltration buffer IM. A. tumefaciens cells containing pTRV1 were mixed with cells containing the pTRV2-CaTPS1 construct vector or the pTRV2 -00 empty vector in a 1:1 volume ratio. The mixed bacterial liquid was infiltrated into pepper seedlings at two true leaf periods using a 1 mL syringe and the infected plants were cultured in the light incubator at 16 h light/8 h dark cycle at 22 °C/18 °C, the light intensity was 20,000 Lx [37].

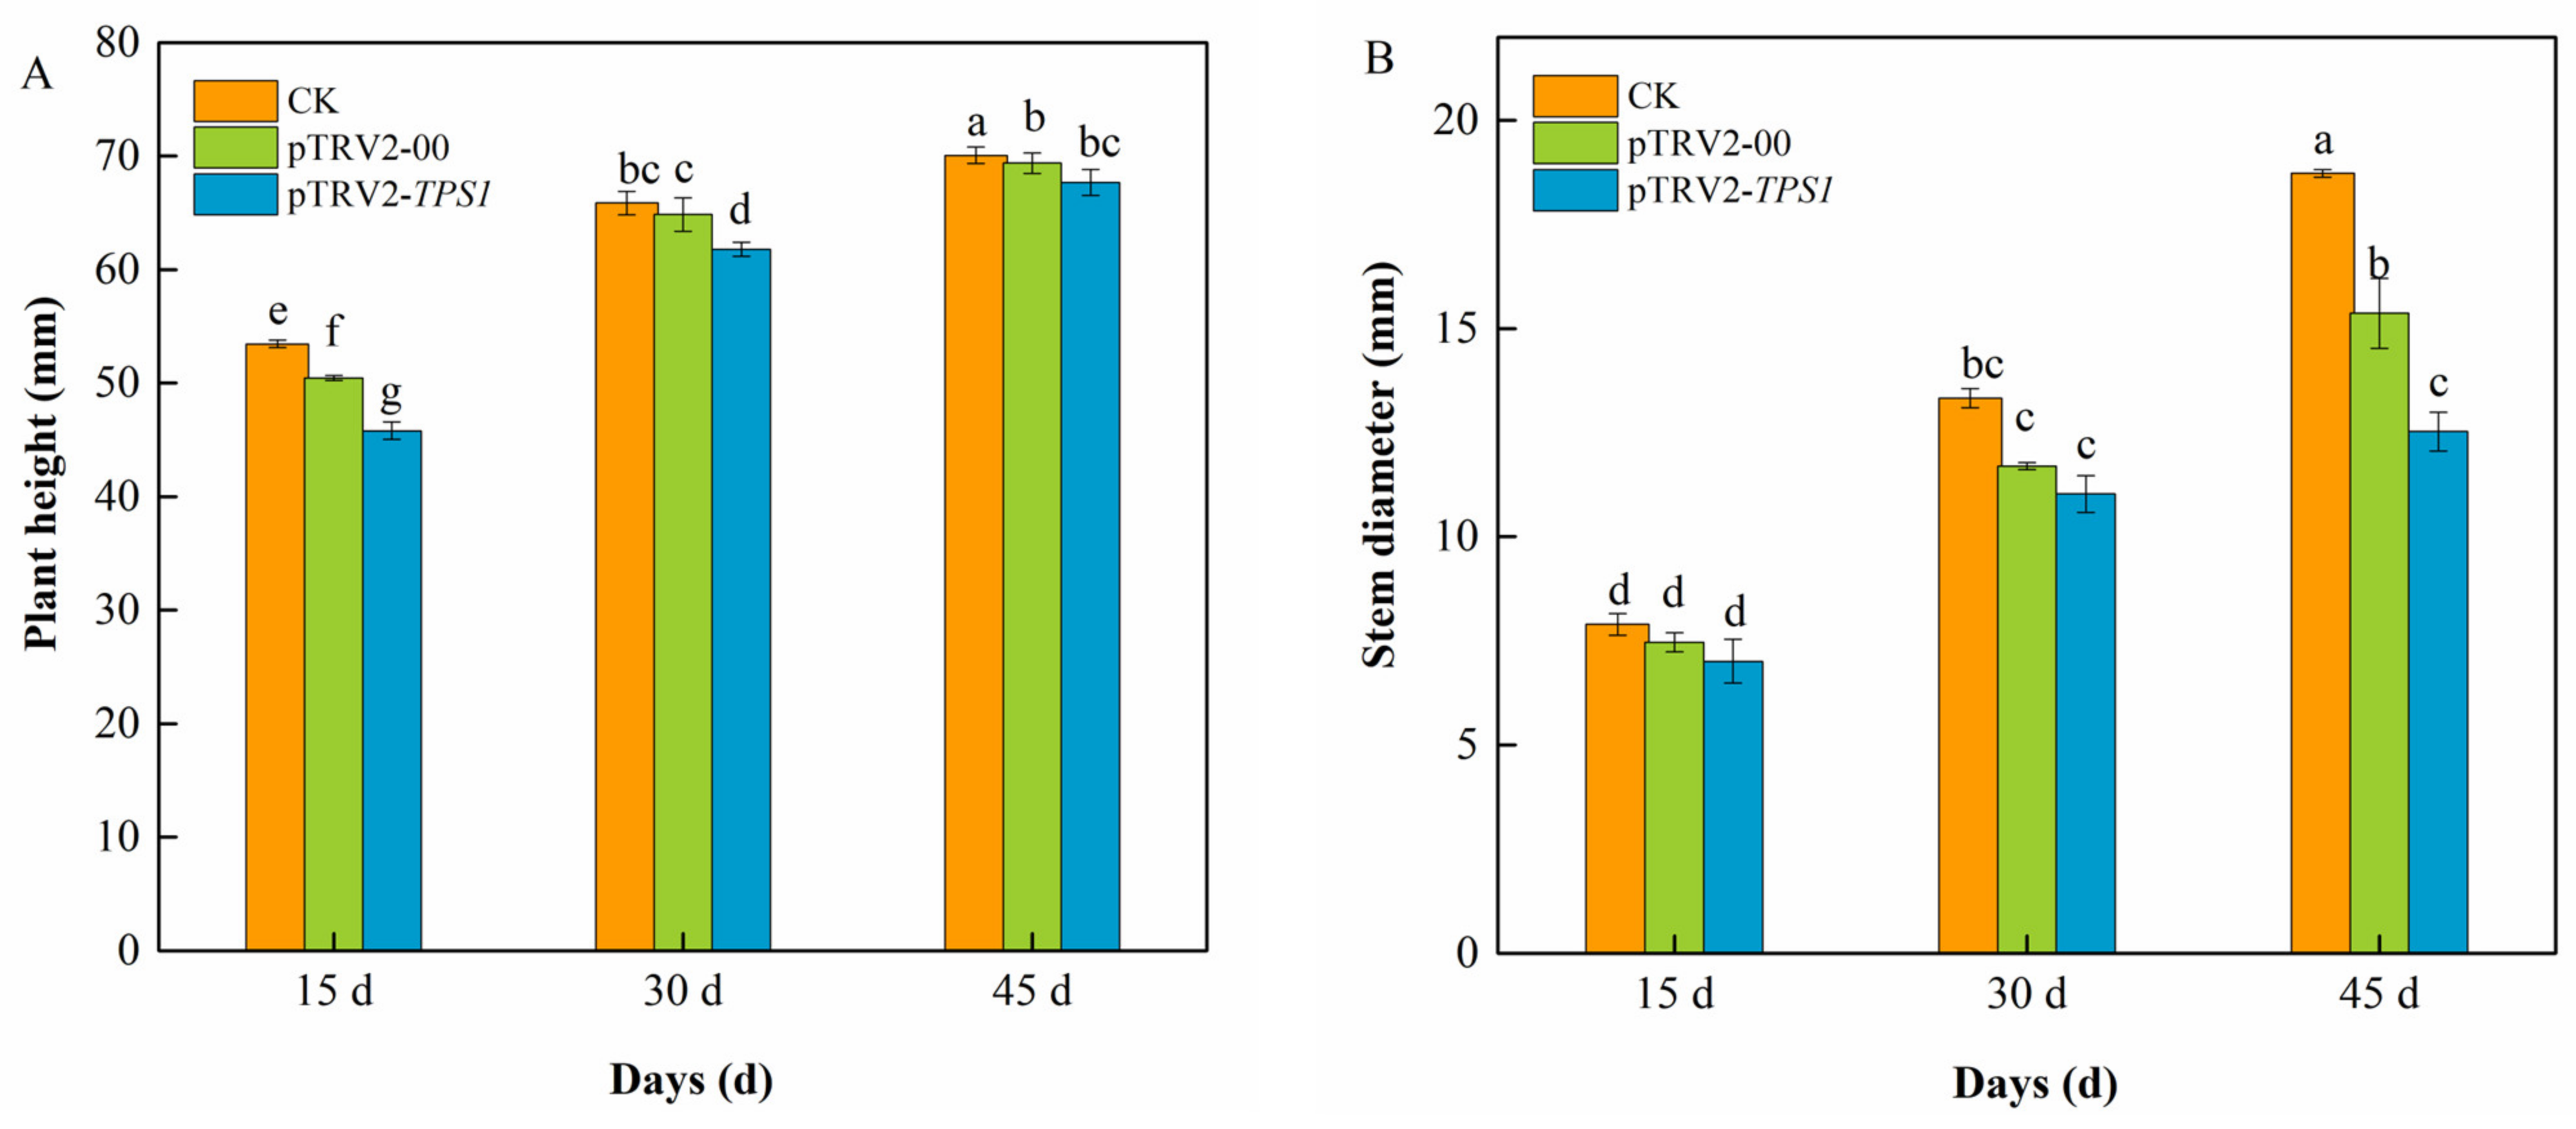
2.4. The Plant Growth of Silenced Plants

Silent Plants (the non-VIGS (CK), Negative control/empty vector (pTRV2-00), and CaTPS1-silenced (pTRV2-CaTPS1) plants) Plant height and stem diameter were measured in silenced plants (CK, pTRV2-00 and pTRV2-CaTPS1 plants) 15, 30 and 45 days after infiltration.

2.5. RNA Isolation and qRT-PCR Analysis

Total RNA was extracted using the RNA simple Total RNA Kit (Tiangen Biotech, Beijing, China) and following the kit’s instructions. cDNA was synthesized using Prime ScriptTM RT kit with gDNA Eraser (TaKaRa Biotechnology, Dalian, China) according to the manufacturer’s instructions. To identify the silencing efficiency of VIGS and the response of CaTPS1 to cold and salt stresses, the relative expression of the CaTPS1 levels of the CK, pTRV2-00 and pTRV2-CaTPS1 were measured by qRT-PCR under cold and salt stresses. qRT-PCR was performed on StepOnePlus (U.S. Applied Biosystems China Company Products, Beijing, China) and the conditions of qRT-PCR were as follows: denaturation at 95 °C for 30 s, followed by 40 cycles of denaturation at 98 °C for 5 s, annealing at 60 °C for 30 s. Actin (GenBank Accession: GQ339766.1) was used as an internal control to normalize PCR efficiency. The relative expression level was calculated using the 2−△△CT method [38].

2.6. Salt and Cold Stresses Assays

The infected seedlings with seven or eight true leaves were used for abiotic stress. For cold treatment, normal plants and silent Plants (the CK, TRV2-00, and TRV2-CaTPS1 plants) were cultured at 15 °C day/10 °C night for 3 days [39]. For salt treatment, initially, 100 mM NaCl was used, then the NaCl concentration in the Hoagland nutrient solution was gradually increased to 150, 200 and 300 mM at 12-h intervals and poured into the matrix of the plants to be treated to prevent salt shock from the high NaCl. The pepper leaves of normal plants and silent Plants (the CK, TRV2-00, and TRV2-CaTPS1 plants) were disposed of 300 mM NaCl treatment for 3 days [40]. Seedlings under normal growth conditions were used as control. Normal plants were collected after 0, 1, 3, 6, 12, 24, 36, 48, and 72 h of treatments and silent plants were collected after 0, 12, 36, and 48 h of treatments, immediately frozen in liquid nitrogen, and stored at −80 °C.

2.7. Determination of Chlorophyll and Trehalose Content, and Antioxidant Enzyme Activities

All physiological indicators of CK, pTRV2-00 and pTRV2-CaTPS1 plants were measured after 36 h of cold and salt treatment and normal control.
The chlorophyll contents and trehalose contents of CK, pTRV2-00, and pTRV2-CaTPS1 plants were measured. A SPAD-502 chlorophyll (Konica Minolta Co., Tokyo, Japan) was used to determine the chlorophyll content of pepper leaves [41]. The determination of trehalose content was carried out according to the instructions of the trehalose content detection kit (Sinobestbio, Shanghai, China).
The metabolic enzyme activities of CK, pTRV2-00, and pTRV2-CaTPS1 plants were measured. Peroxidase (POD) activity was measured by the nitroblue tetrazolium (NBT) illumination method, catalase (CAT) activity was determined by the guaiacol method, and ascorbate peroxidase (APX) activity was measured by estimating the decreasing rate of ascorbate oxidation at 290 nm [39,42].

2.8. Statistical Analysis

The results were subjected to analysis of variance (ANOVA) using the SPSS statistical package (version 22.0, SPSS, Chicago, IL, USA). The statistical divergence among treatments was analyzed through Duncan’s multiple range test (p < 0.05).

3. Results

3.1. Homologous Sequence Alignment of CaTPS1

From Figure 1, the length of the TPS structural domain domain of TPS1 in these four species is much larger than that of TPP. The TPS and TPP structural domains of CaTPS1 and AtTPS1, OsTPS1, ZmTPS1 are all relatively conserved, and the sequence similarity is basically greater than or equal to 75%. It can be concluded that CaTPS1 may have the protein function of catalyzing G6p like AtTPS1, OsTPS1 and ZmTPS1.

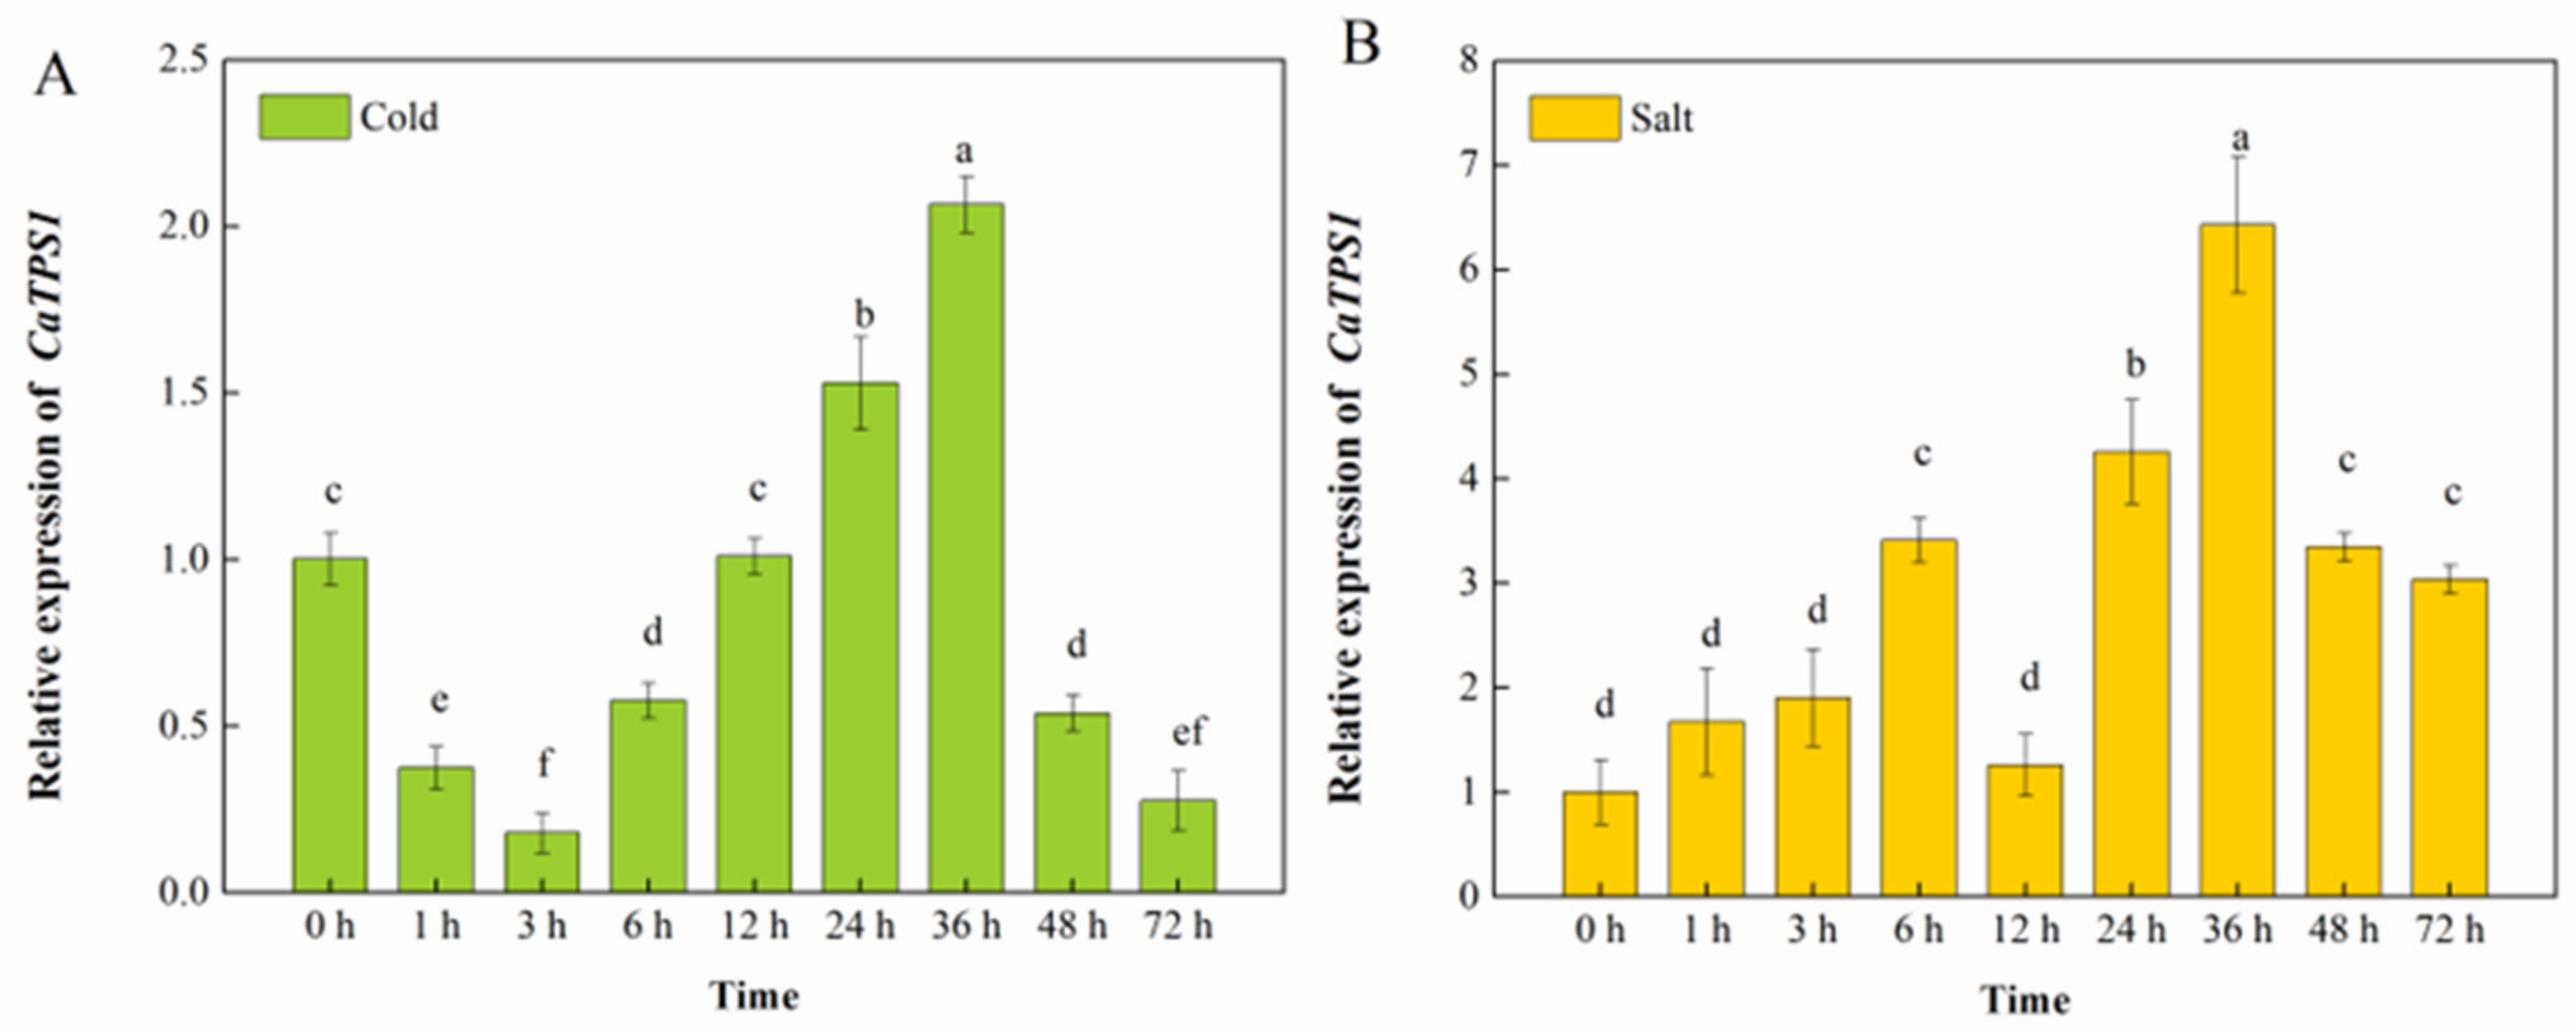
3.2. The Expression of CaTPS1 among Different Stress Treatments

TPS1 plays a crucial role in all aspects of plant development and stress response, and its function has been less studied in pepper. To explore the expression pattern of the CaTPS1 gene under abiotic stress, we analyzed the expression levels of this gene in the pepper material “Qiangfeng 101” after treatment with low temperature and NaCl (Figure 2). Under low-temperature treatment, we found that the relative expression of CaTPS1 peaked at 36 h, with CaTPS1 expression rising by 100% relative to 0 h. In NaCl treatment, CaTPS1 expression rose and then fell and then rose and then fell again, with its highest expression exhibited after 36 h of salt treatment.

3.3. The Plant Growth of Silenced Plants

To observe the effect of infection on plant growth, plant height (Figure 3A), and stem diameter (Figure 3B) were measured at different periods after infection. Plant height and stem diameter of CK, pTRV2-00 and pTRV2-CaTPS1 plants increased significantly with increasing infestation time. The plant height of pTRV2-00 and pTRV2-CaTPS1 plants was significantly reduced after 15, 30 and 45 days of infiltration, indicating that the TRV2 virus affects plant height. At the same time, the significant reduction of pTRV2-CaTPS1 plants compared to CK, and pTRV2-00 plants indicates that CaTPS1 affects the plant height of pepper plants. The stem diameter of pTRV2-00 and pTRV2-CaTPS1 plants was reduced after 15, 30 and 45 days of infiltration, indicating that TRV2 and CaTPS1 also affect the stem diameter of the plants. There was no significant difference in stem thickness between pTRV2-00 and pTRV2-CaTPS1 plants after 15 and 30 days of infiltration. However, after 45 days of infiltration, the stem thickness of pTRV2-CaTPS1 plants was significantly lower than that of CK and pTRV2-00 plants. These results indicate that the increase in plant height and stem diameter of pTRV2-CaTPS1 is significantly reduced, further affecting normal plant growth and development, suggesting that CaTPS1 may be associated with plant growth.

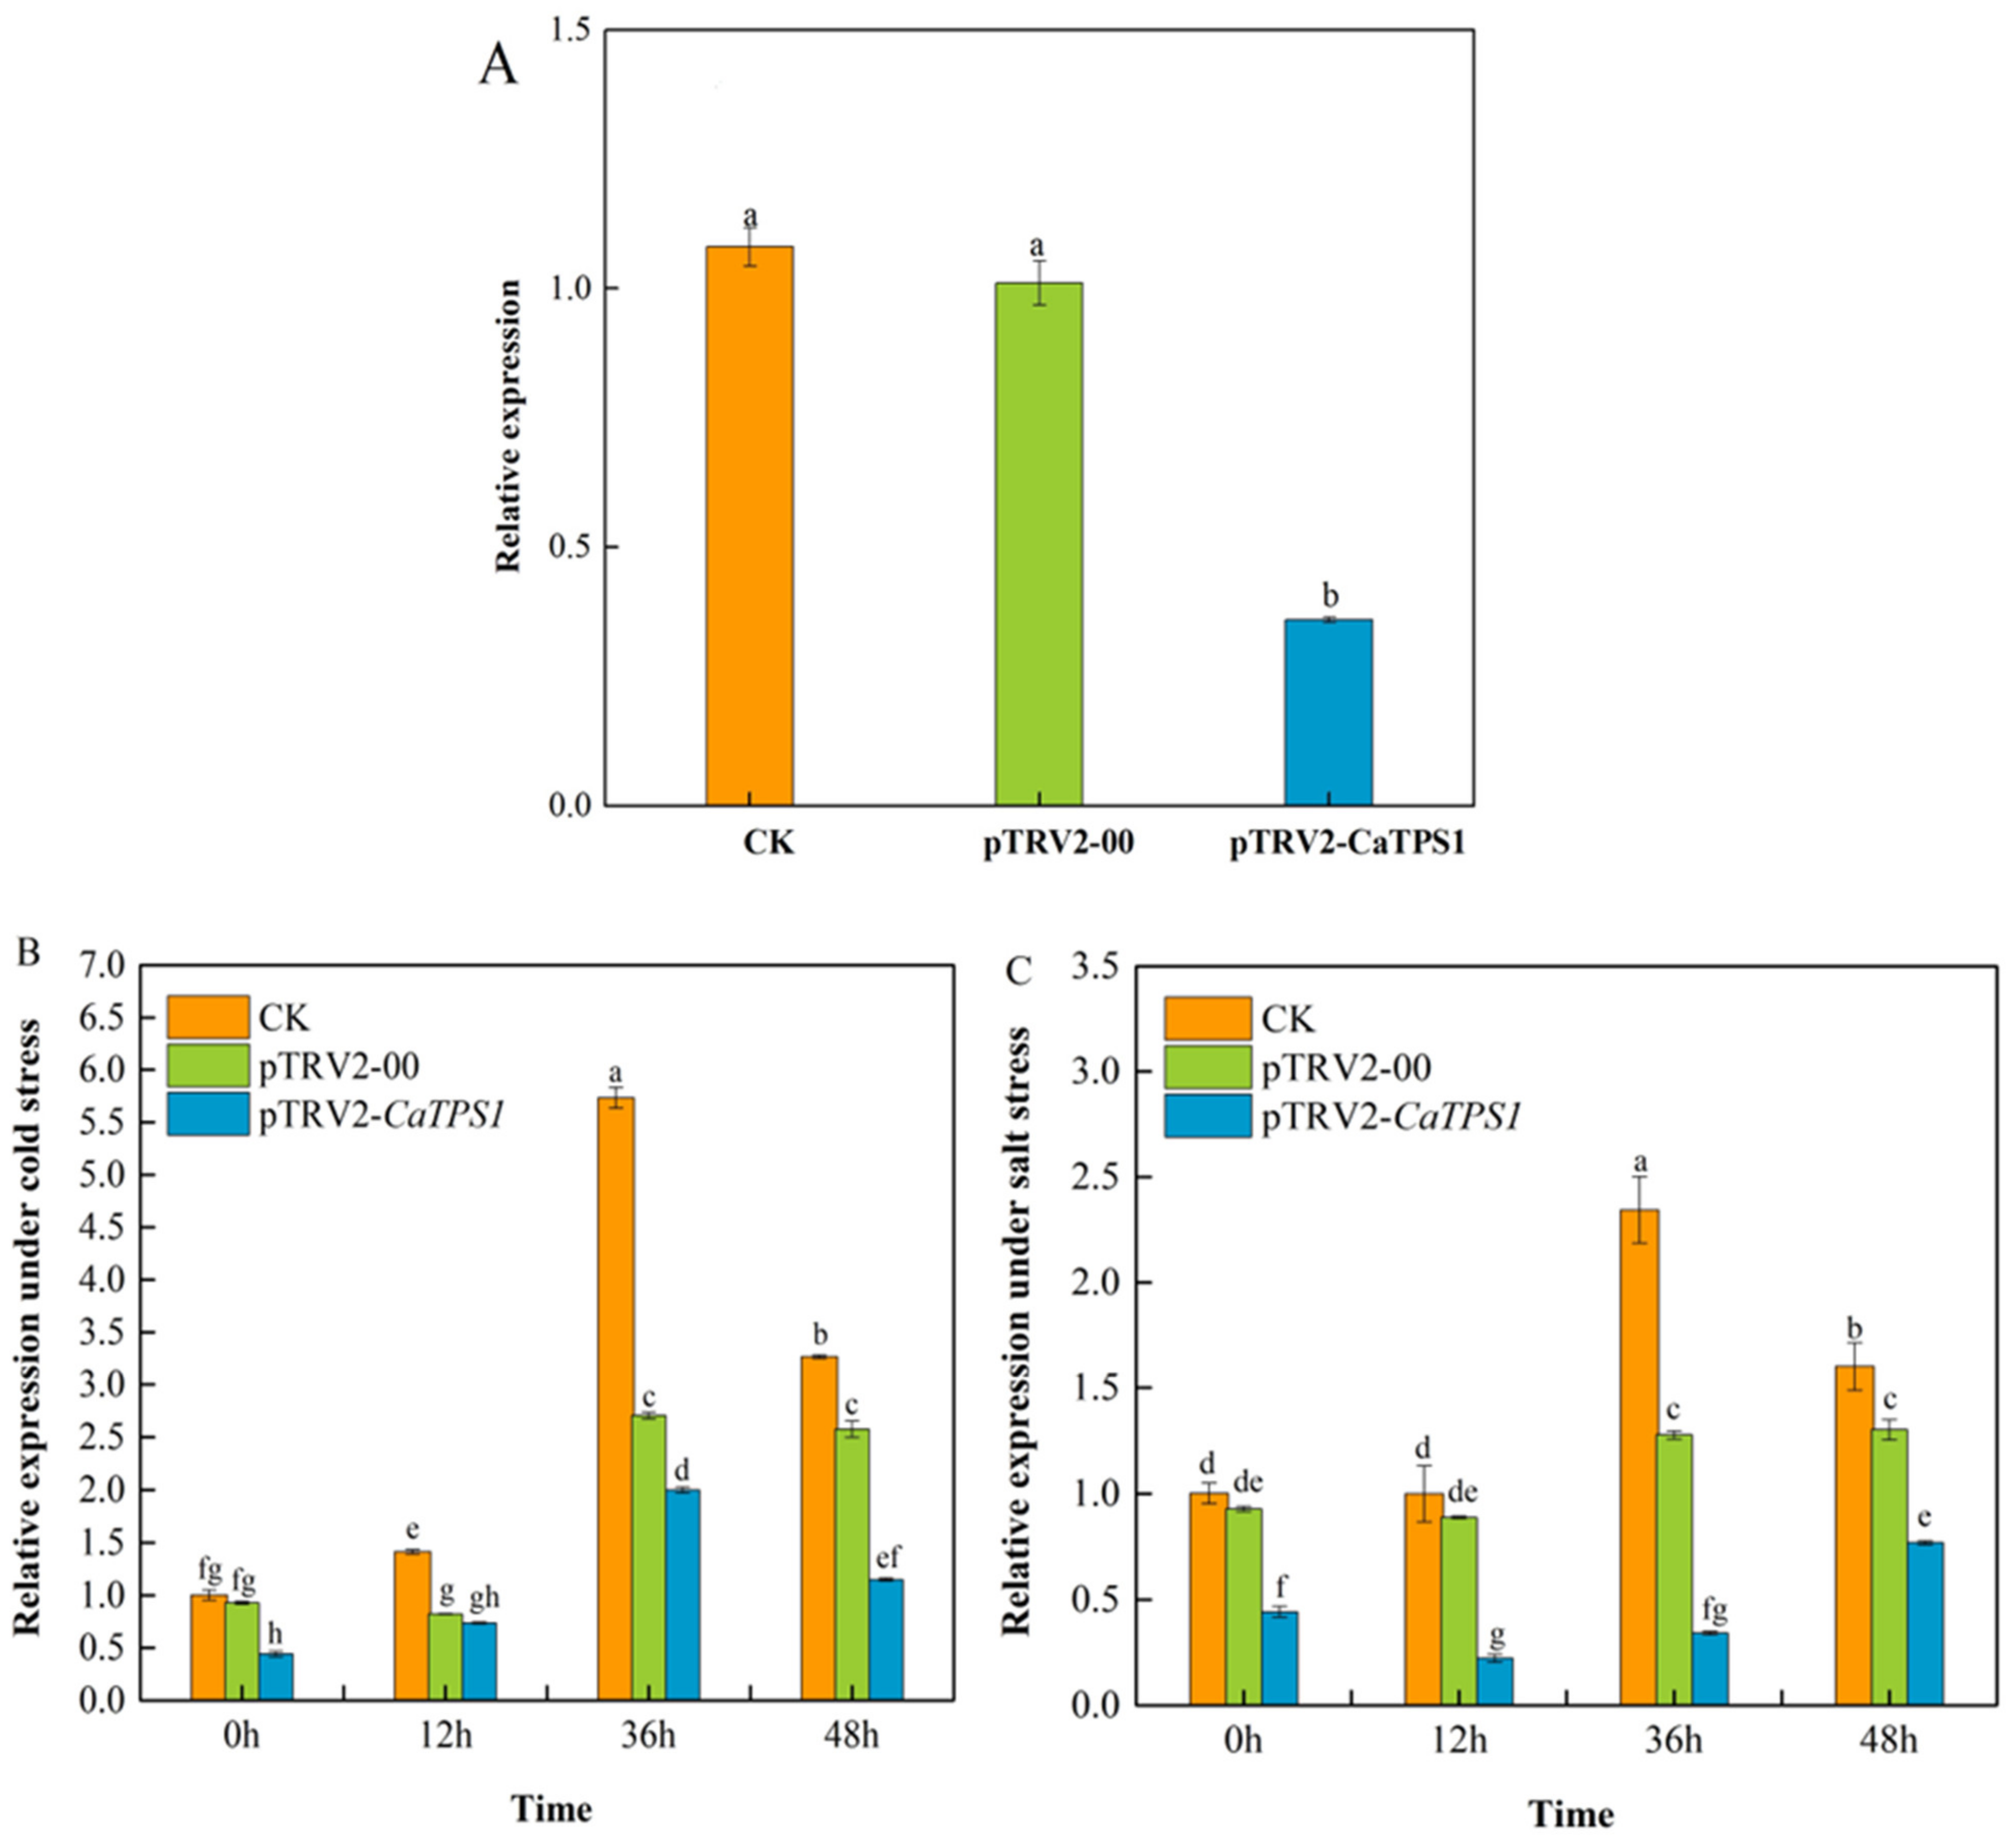
3.4. The Expression of CaTPS1 among Silenced Plants under Different Treatments

In this study, we would attempt to silence CaTPS1 by VIGS assay in pepper. The results showed that there was little expressional difference in CaTPS1 between pTRV2-00 and CK plants, but the expression of CaTPS1 was significantly lower in pTRV2-CaTPS1 than that in pTRV2-00 and CK plants respectively (Figure 4A). Compared to CK, the expression of CaTPS1 in the pTRV2-CaTPS1 plant was reduced by 64.3%, which indicated that the expression of CaTPS1 was efficiently inhibited in pTRV2-CaTPS1 plants by VIGS.
After low-temperature treatment, the expression of CaTPS1 increased first and then decreased with the extension of time and peaked at 36 h (Figure 4B). Generally, the expression of CaTPS1 was lower at different stages in the pTRV2-CaTPS1 plant than in pTRV2-00 and CK plants, and they were significantly different among pTRV2-CaTPS1 and pTRV2-00 plants at 0, 36 and 48 h, except for 12 h.
After salt treatment, the expression of CaTPS1 increased first and then decreased with the extension of time and peaked at 36 h in the CK plant. However, it showed a decrease first and then an increase in the pTRV2-CaTPS1 plant (Figure 4C). In general, the expression of CaTPS1 was significantly lower at every stage in the pTRV2-CaTPS1 plant than in the pTRV2-00 and CK plants, respectively.

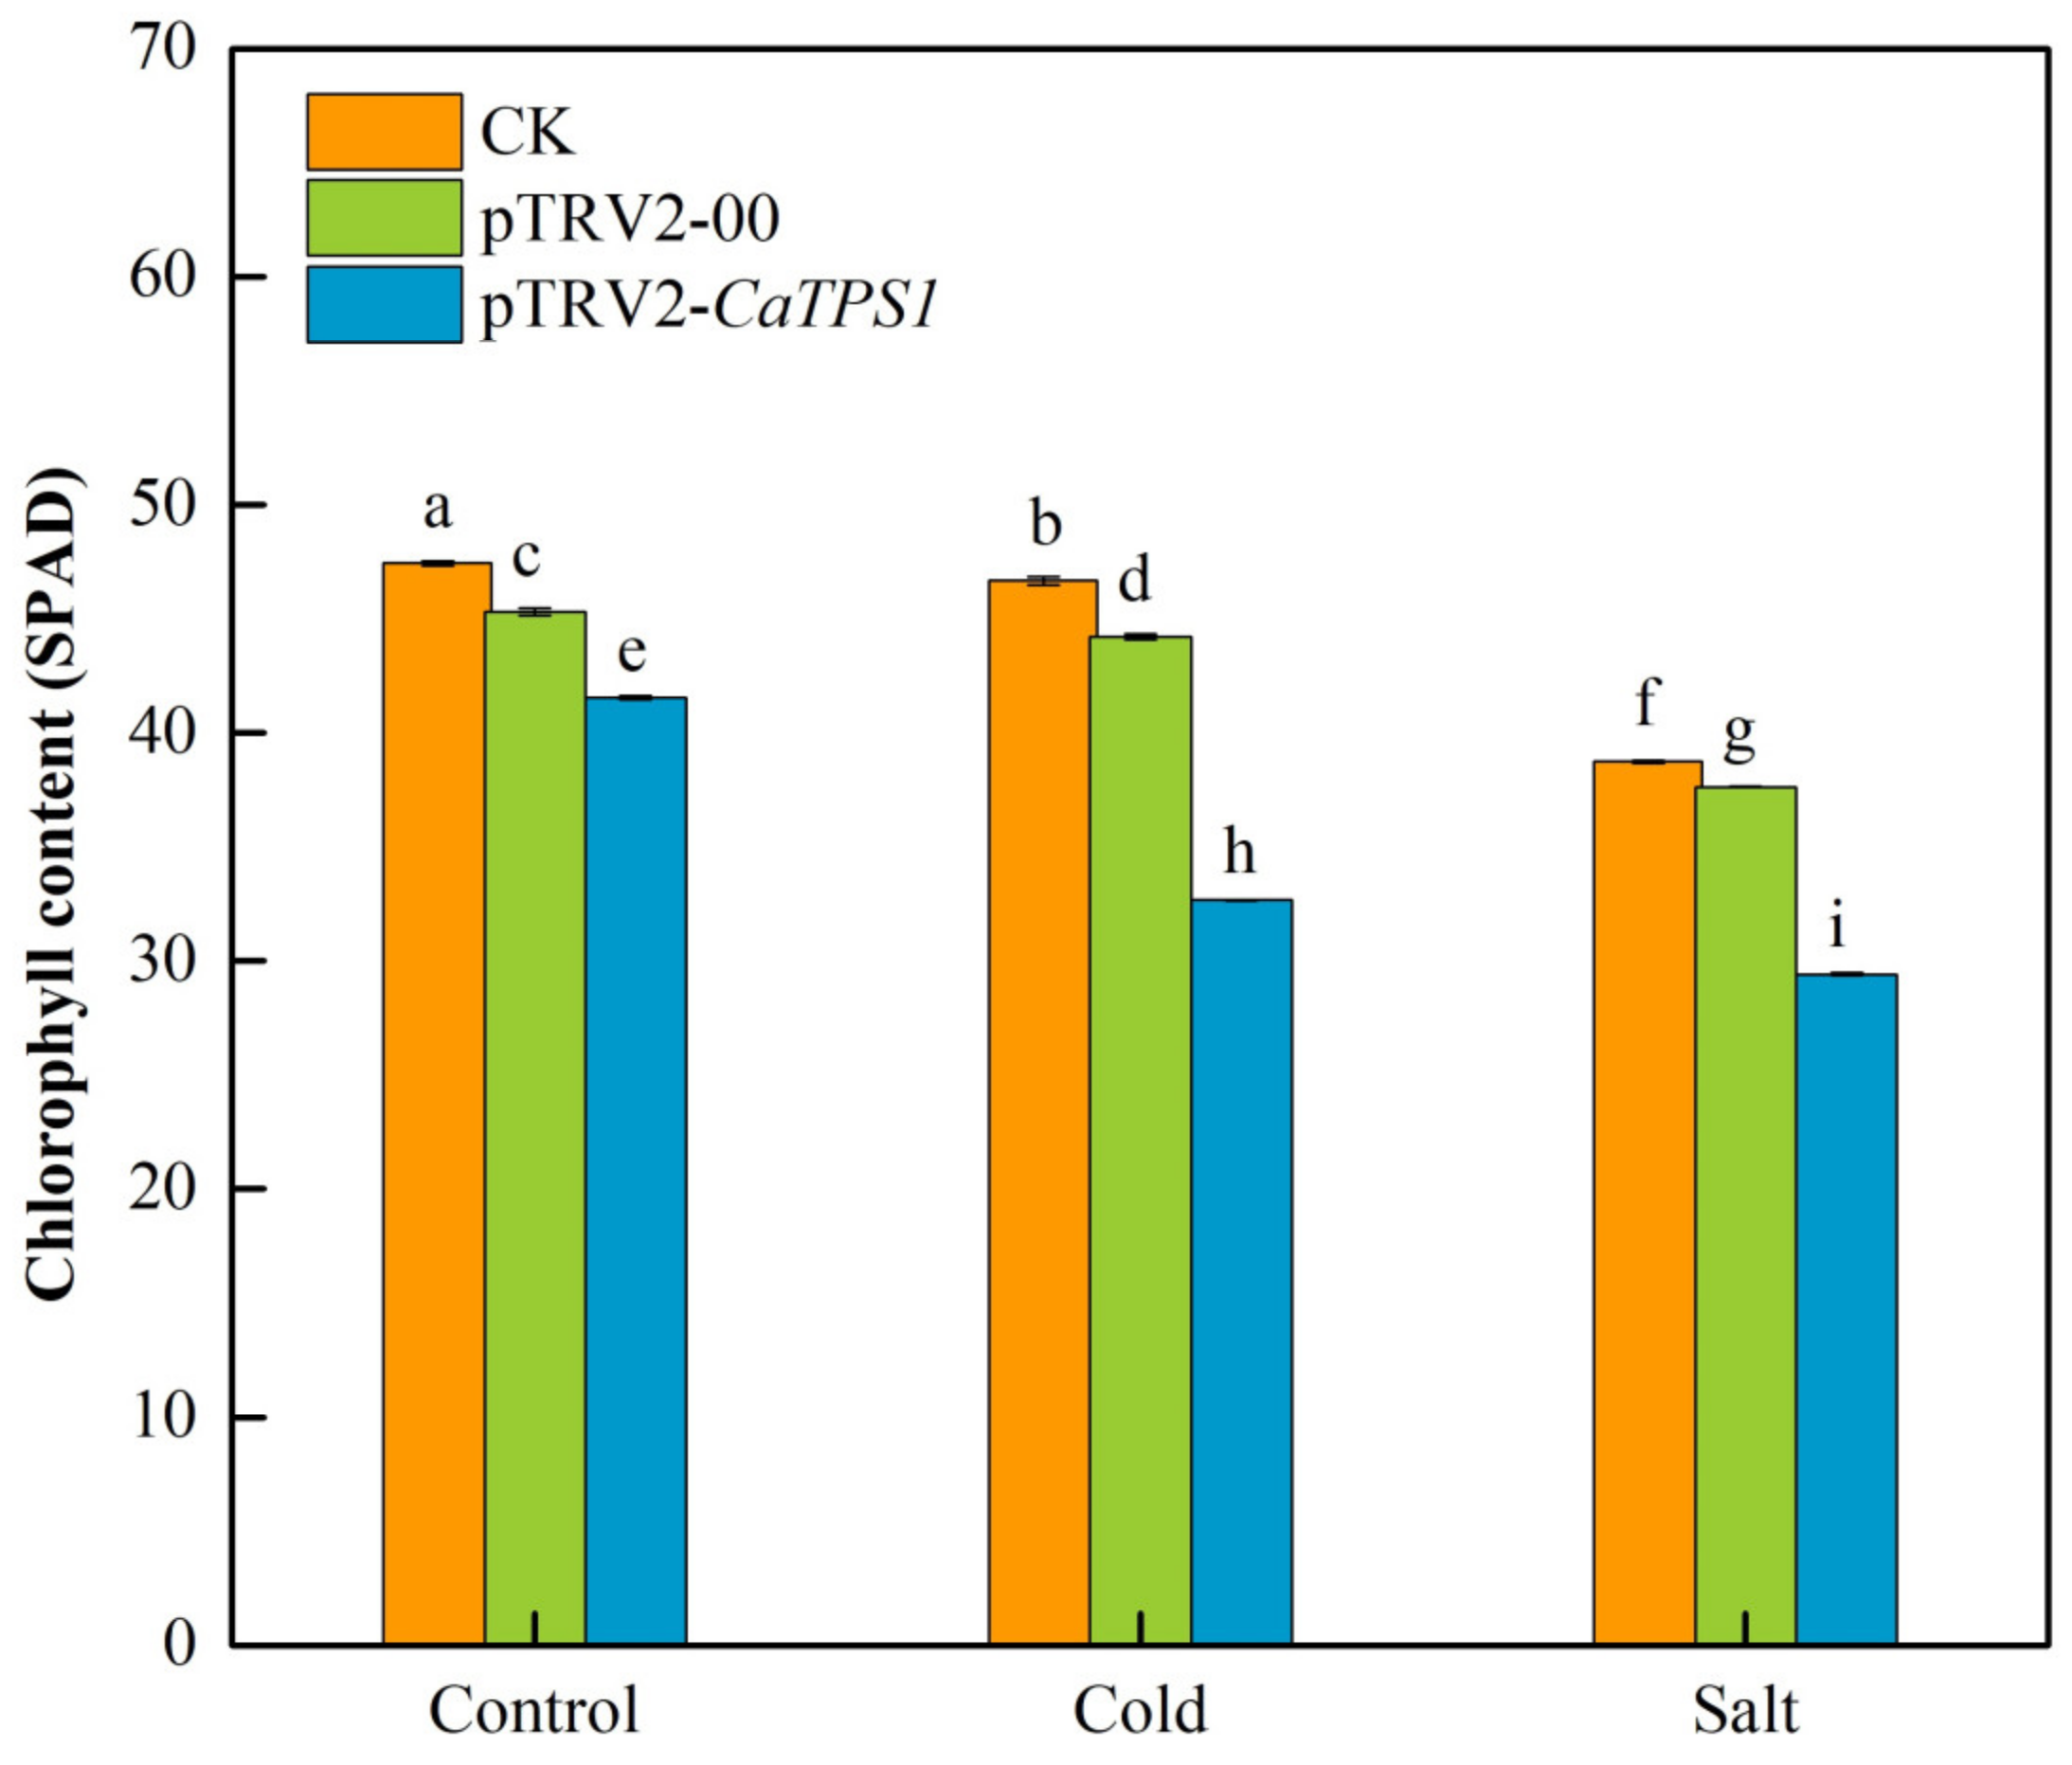
3.5. Chlorophyll Content of Silencing CaTPS1 under Cold and Salt Stresses

The chlorophyll contents of leaves in CK, pTRV2-00 and pTRV2-CaTPS1 plants were observed under cold and salt stresses. Whether under untreated or under low temperature and salt stresses, the total chlorophyll content of the pTRV2-CaTPS1 plant was significantly lower than that of CK and pTRV2-00 plants (Figure 5). Under low temperatures and salt stresses, the total chlorophyll contents were obviously decreased in all samples, especially in the pTRV2-CaTPS1 plant. It was also shown that the decrements of chlorophyll contents under salt stress were more than that under cold stress in the pTRV2-CaTPS1 plant (Figure 5).

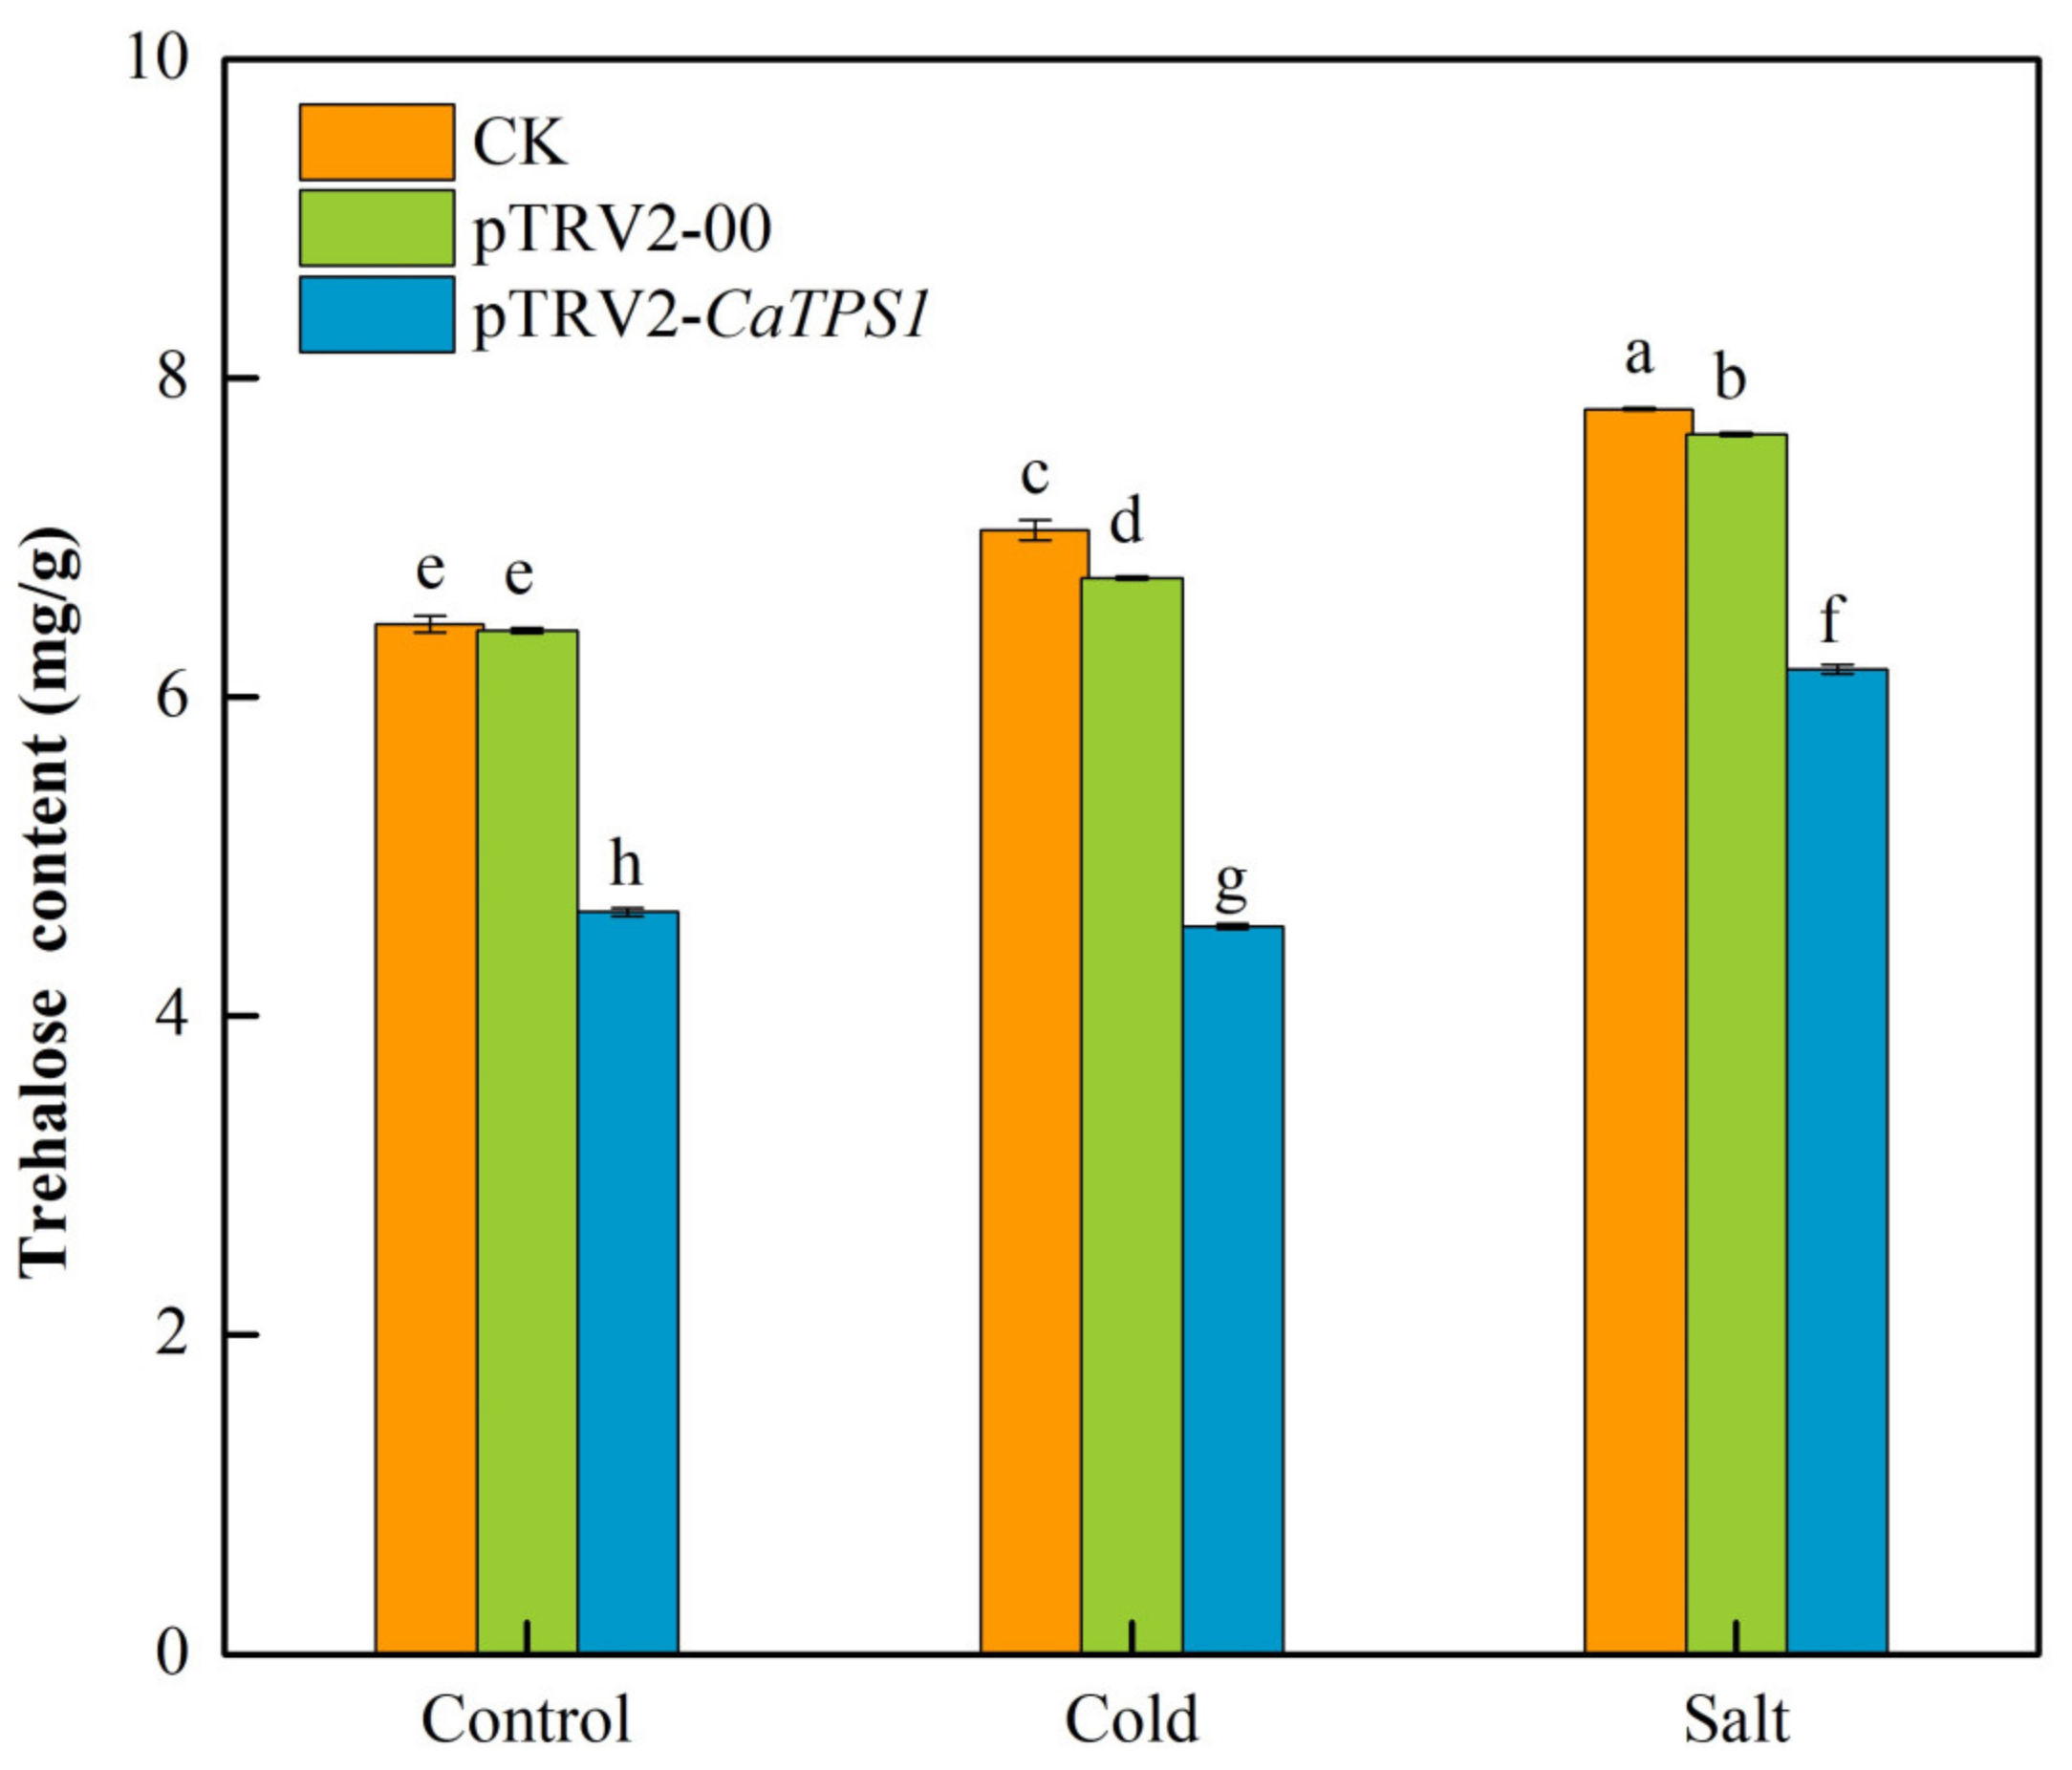
3.6. Trehalose Content of Silencing CaTPS1 under Cold and Salt Stresses

Compared to the control, the trehalose contents improved significantly in CK, pTRV2-00 and pTRV2-CaTPS1 plants under cold stress and salt stresses (Figure 6). In addition, the trehalose contents were significantly higher under salt stress than under cold stress. Further, the trehalose content is obviously lower in the pTRV2-CaTPS1 plant than in CK and pTRV2-00 plants under control, cold and salt stresses.

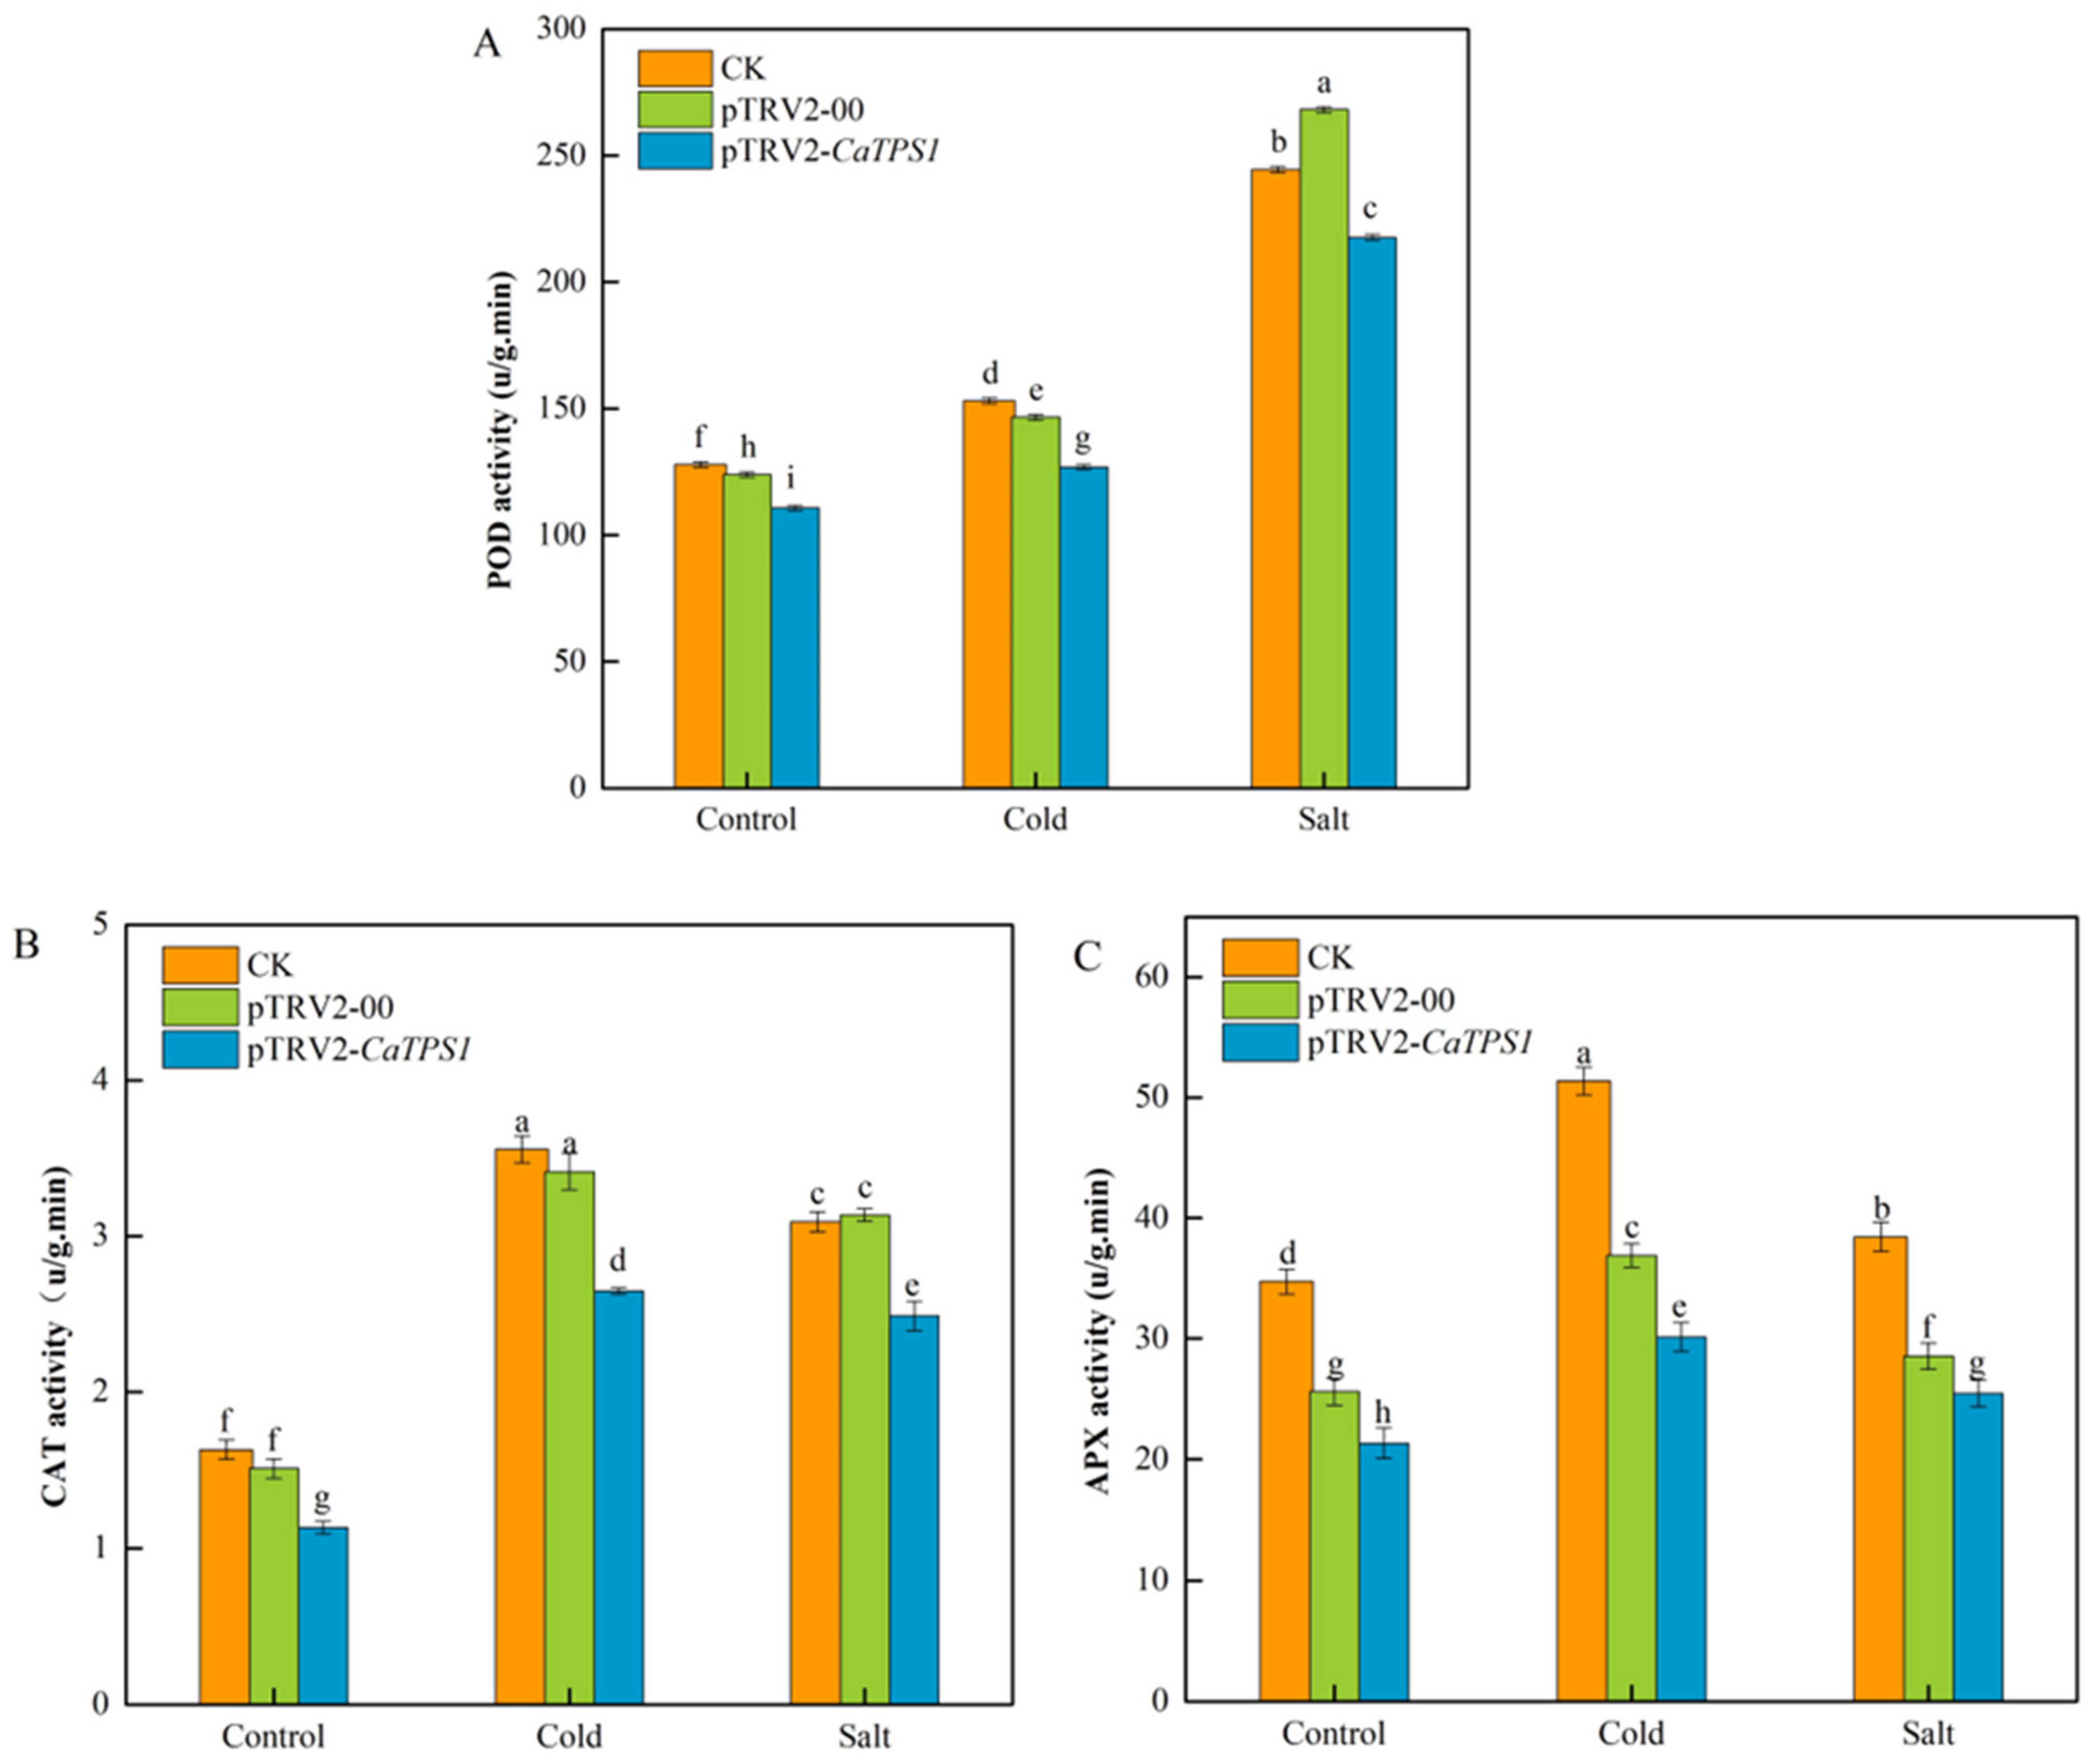
3.7. Antioxidant Enzymes of Silencing CaTPS1 under Cold and Salt Stresses

The activities of peroxidase (POD) (Figure 7A), catalase (CAT) (Figure 7B), and ascorbate peroxidase (APX) (Figure 7C) were measured in the CK, pTRV2-00 and pTRV2-CaTPS1 plants under normal, cold and salt stress conditions.
It was indicated that the activities of POD, CAT and APX increased in CK, pTRV2-00 and pTRV2-CaTPS1 plants under cold and salt stresses. However, the activities of POD, CAT and APX were obviously lower in the pTRV2-CaTPS1 plant than in CK and pTRV2-00 plants under all treatments. Additionally, it was also suggested that the activities of POD were higher under salt stress than under cold stress. However, the activities of CAT and APX were higher under cold stress than under salt stress.

4. Discussion

Abiotic stress is the key factor plaguing crop production, and studies on tolerance to low temperatures and salt have been a focus of attention [43]. The most sensitive part of the plant to stress is the cell membrane system, which is also the key structure for sensing cold damage and resisting it [44]. At low temperatures and salt stresses, plants are generally damaged, and leaves are prone to premature [45]. Numerous transgenic studies have also demonstrated the involvement of trehalose in the induction of stress-response genes [46,47]. Plant endogenous synthesized trehalose can be involved in signal transduction and induced the expression of stress-related genes [26]. In addition, as a key enzyme in trehalose synthesis, most TPS genes are also involved in stress tolerance in plants. Rice resistance to high salinity, drought and cold treatments was increased after overexpression of OsTPS1 [22]. CsTPS1, CsTPS9 and CsTPPA were the most highly expressed in response to at least one abiotic stress and hypothesized that these three genes may be involved in the abiotic stress pathway in tea tree [26]. The high expression of the TaTPS gene in winter wheat was induced by freezing stress, indicating that the TaTPS gene may participate in the signal pathway of winter wheat coping with freezing damage [25].
In this study, the CaTPS1 gene was efficiently silenced by VIGS and the expression of CaTPS1 was reduced by 64.3% in pTRV2-CaTPS1 compared to the control. While CaTPS1 was up-regulated first and then down-regulated under cold and salt stresses, the expression of CaTPS1 in the pTRV2-CaTPS1 plant was significantly lower than that in CK and pTRV2-00 plants. This result indicates that low temperature and salt stresses can induce the expression of CaTPS1 to respond to cold and salt stresses in the short term in pepper. There was a higher expression of CsTPS1, CsTPS9 and CsTPPA in abiotic stress, which is consistent with the above results [26].
The difference between CK (blank control) and pTRV2-00 (negative control) without injection of TRV2 vectors was mainly to rule out detection errors caused by the viral vector itself. While some indicators in pTRV2-00 were significantly lower than those in CK, pTRV2-CaTPS1 was also significantly lower than those in pTRV2-00, indicating that TRV2 virus was responsible for these indicators. (Plant height, stem diameter, chlorophyll content, POD, APX enzyme activity) The impact is greater, but the change of each indicator after CaTPS1 is silenced is not affected.
The chlorophyll content is a key indicator for monitoring plant physiological status, assessing plant health and estimating photosynthetic potential [44]. In this study, chlorophyll content was significantly lower in all samples under low temperature and salt stresses, and chlorophyll content of the pTRV2-CaTPS1 plant was significantly lower than that of the CK and pTRV2-00 plants, illustrating that CaTPS1 is a positive response to the effects of abiotic stress on chlorophyll content. Numerous experimental results have shown that chlorophyll content decreases under abiotic stress [48].
Interestingly, trehalose might be a ubiquitous sugar and a protective agency in response to stress in many organisms. Trehalose content also was on the rise under cold and salt stresses, but the trehalose content of the pTRV2-CaTPS1 plant was significantly lower than the CK and pTRV2-00 plants. On the one hand, abiotic stress could increase trehalose content, on the other hand, trehalose synthesis decreased after CaTPS1 silencing, resulting in a decrease in trehalose content, which was related to the changes in the sugar metabolism and were both convergent and divergent in response to different stresses [17,26].
Furthermore, when plants undergo different environmental stresses, the balance between productivity and clearance of ROS in plants is disrupted, which will lead to remaining toxic ROS, the toxicity negatively impacts the growth and development of plants [31]. Endogenous protective enzymes play an important role in protecting against and reversing ROS-induced damage and improving the ability of plants to respond to stresses by altering their activity [31,32]. Antioxidant enzymes are important substances to scavenge ROS, and the change in their content can indirectly measure the degree of damage caused by ROS to plants. CAT, POD and APX can reduce the production rate of superoxide anion radicals and the content of hydrogen peroxide [10,39]. CAT, POD and APX are important antioxidant enzymes and play a crucial role in protecting plant tissues under abiotic stress. In this study, the POD activities, APX activities, and CAT activities of the CK, pTRV2-00, and pTRV2-CaTPS1 plants increased after suffering from cold and salt stresses, but the values of the pTRV2-CaTPS1 plant were lower than the CK and pTRV2-00 plants. The culture environment and other conditions of CK, pTRV2-00 and pTRV2-CaTPS1 plants were consistent. Since the seedlings after VIGS treatment were cultured in a climate box at 22 °C during the day and 18 °C at night, the control group and salt stress may have some low-temperature stress. The slightly lower temperature of the culture environment resulted in mild stress, resulting in significantly higher antioxidant enzyme activity in the CK group than in the pTRV2-CaTPS1 group under normal conditions (similar to that in the low-temperature stress group). This suggests that low temperature and salt stresses increase antioxidant enzyme activity and that CaTPS1 is positively regulated to abiotic stress-induced damage. Silencing of CaDHN4 in salt and low-temperature stresses treatment resulted in a significant increase in the enzymatic activities of antioxidant enzymes such as SOD, POD, CAT and APX activities, which was similar to the results of this experiment [48]. Besides, POD, SOD and CAT activities were raised with the cold and NaCl treatments in wheat, showing that the content of antioxidant enzymes will increase basically under abiotic stress [45].
In conclusion, the expression of CaTPS1 in CK, pTRV2-00 and pTRV2-CaTPS1 plants increased first and then decreased with the accumulation of time under low temperature and salt stresses, reaching a maximum at 36 h of stress treatment. Meanwhile, the expression of CaTPS1 in the pTRV2-CaTPS1 plant was significantly lower than that in CK and pTRV2-00 plants. In low temperature and salt stresses, chlorophyll content of the pTRV2-CaTPS1 plant decreased; the trehalose content, POD activity, CAT activity and APX activity of pTRV2-CaTPS1 plant increased but were significantly lower than those of CK and PTRV2-00 plants. Based on the experimental results obtained above, it can be concluded that silencing of the CaTPS1 gene made the plants more sensitive to low temperature and salt stresses, indicating that the CaTPS1 gene plays an important role in plant growth and development and response to abiotic stresses.

Supplementary Materials

The following supporting information can be downloaded at: https://www.mdpi.com/article/10.3390/agronomy13020319/s1, Figure S1: The main pathway of trehalose metabolism [8,12,13,49,50].

Author Contributions

Conceptualization, B.G., P.D. and B.W.; Data curation, B.G., M.W. and B.W.; Formal analysis, P.D. and S.Z.; Investigation, B.G.; Methodology, B.G., M.W. and N.Y.; Project administration, B.W.; Resources, B.G., P.D. and Y.W.; Software, Y.W. and G.Z.; Supervision, N.Y. and B.W.; Validation, B.G., P.D., S.Z. and B.W.; Visualization, P.D. and Y.W.; Writing–original draft, B.G., P.D., M.W. and S.Z.; Writing–review & editing, P.D., M.W., S.Z., N.Y., G.Z. and B.W. All authors have read and agreed to the published version of the manuscript.

Funding

The work was supported by the National Natural Science Foundation of China (31760572); the Primary Research & Development Plan of Gansu Province, China (21YF5NA091); Lanzhou Talent Introduction Project (2021-RC-65) and Gansu Agricultural University Youth Mentor Support Fund (GAU-QDFC-2020-07).

Data Availability Statement

All relevant data are contained within the article.

Conflicts of Interest

The authors declare no conflict of interest.

References

  1. Pino, J.; Gonzalez, M.; Ceballos, L.; Centurionyah, A.; Trujilloaguirre, J.; Latourneriemoreno, L.; Sauriduch, E. Characterization of total capsaicinoids, colour and volatile compounds of Habanero chilli pepper (Capsicum chinense Jack.) cultivars grown in Yucatan. Food Chem. 2007, 104, 1682–1686. [Google Scholar] [CrossRef]
  2. Pathirana, R. Peppers: Vegetable and Spice Capsicums, 2nd edition, by Paul W. Bosland and Eric J. Votava. N. Z. J. Crop Hortic. Sci. 2013, 41, 102–103. [Google Scholar] [CrossRef] [Green Version]
  3. Zhu, J.K. Abiotic Stress Signaling and Responses in Plants. Cell 2016, 167, 313–324. [Google Scholar] [CrossRef] [PubMed] [Green Version]
  4. Genzel, F.; Dicke, M.D.; Junker-Frohn, L.V.; Neuwohner, A.; Thiele, B.; Putz, A.; Usadel, B.; Wormit, A.; Wiese-Klinkenberg, A. Impact of Moderate Cold and Salt Stress on the Accumulation of Antioxidant Flavonoids in the Leaves of Two Capsicum Cultivars. J. Agric. Food Chem. 2021, 69, 6431–6443. [Google Scholar] [CrossRef] [PubMed]
  5. Chen, X.; Ding, Y.; Yang, Y.; Song, C.; Wang, B.; Yang, S.; Guo, Y.; Gong, Z. Protein kinases in plant responses to drought, salt, and cold stress. J. Integr. Plant Biol. 2021, 63, 53–78. [Google Scholar] [CrossRef] [PubMed]
  6. Trnka, M.; Rotter, R.P.; Ruiz-Ramos, M.; Kersebaum, K.C.; Olesen, J.E.; Zalud, Z.; Semenov, M.A. Adverse weather conditions for European wheat production will become more frequent with climate change. Nat. Clim. Change 2014, 4, 637–643. [Google Scholar] [CrossRef]
  7. Crimp, S.J.; Zheng, B.Y.; Khimashia, N.; Gobbett, D.L.; Chapman, S.; Howden, M.; Nicholls, N. Recent changes in southern Australian frost occurrence: Implications for wheat production risk. Crop Pasture Sci. 2016, 67, 801–811. [Google Scholar] [CrossRef]
  8. Vandesteene, L.; Lopez-Galvis, L.; Vanneste, K.; Feil, R.; Maere, S.; Lammens, W.; Rolland, F.; Lunn, J.E.; Avonce, N.; Beeckman, T.; et al. Expansive evolution of the trehalose-6-phosphate phosphatase gene family in Arabidopsis. Plant Physiol. 2012, 160, 884–896. [Google Scholar] [CrossRef] [Green Version]
  9. Wei, B.; Wang, L.; Zhang, R.; Chen, L.; Zhang, S.; Zhang, J. Identification of CaTPS Gene Family and Expression Analysis of CaTPS1 in Hot Pepper. Acta Hortic. Sin. 2016, 43, 1504–1512. (In Chinese) [Google Scholar]
  10. Nawaz, M.; Hassan, M.U.; Chattha, M.U.; Mahmood, A.; Shah, A.N.; Hashem, M.; Alamri, S.; Batool, M.; Rasheed, A.; Thabit, M.A.; et al. Trehalose: A promising osmo-protectant against salinity stress-physiological and molecular mechanisms and future prospective. Mol. Biol. Rep. 2022, 49, 11255–11271. [Google Scholar] [CrossRef]
  11. Elbein, A.D.; Pan, Y.T.; Pastuszak, I.; Carroll, D. New insights on trehalose: A multifunctional molecule. Glycobiology 2003, 13, 17R–27R. [Google Scholar] [CrossRef] [PubMed]
  12. Paul, M.J.; Oszvald, M.; Jesus, C.; Rajulu, C.; Griffiths, C.A. Increasing crop yield and resilience with trehalose 6-phosphate: Targeting a feast-famine mechanism in cereals for better source-sink optimization. J. Exp. Bot. 2017, 68, 4455–4462. [Google Scholar] [CrossRef] [PubMed] [Green Version]
  13. Pohane, A.A.; Carr, C.R.; Garhyan, J.; Swarts, B.M.; Siegrist, M.S. Trehalose Recycling Promotes Energy-Efficient Biosynthesis of the Mycobacterial Cell Envelope. Mbio 2021, 12, e02801-20. [Google Scholar] [CrossRef]
  14. Mu, M.; Lu, X.K.; Wang, J.J.; Wang, D.L.; Yin, Z.J.; Wang, S.; Fan, W.L.; Ye, W.W. Genome-wide Identification and analysis of the stress-resistance function of the TPS (Trehalose-6-Phosphate Synthase) gene family in cotton. BMC Genet. 2016, 17, 54. [Google Scholar]
  15. Liu, J.Y.; Huang, F.; Wang, X.; Zhang, M.; Zheng, R.; Wang, J.; Yu, D.Y. Genome-wide analysis of terpene synthases in soybean: Functional characterization of GmTPS3. Gene 2014, 544, 83–92. [Google Scholar] [CrossRef] [PubMed]
  16. Xu, Y.C.; Wang, Y.J.; Mattson, N.; Yang, L.; Jin, Q.J. Genome-wide analysis of the Solanum tuberosum (potato) trehalose-6-phosphate synthase (TPS) gene family: Evolution and differential expression during development and stress. BMC Genom. 2017, 18, 926. [Google Scholar] [CrossRef] [Green Version]
  17. Yang, H.L.; Liu, Y.J.; Wang, C.L.; Zeng, Q.Y. Molecular Evolution of Trehalose-6-Phosphate Synthase (TPS) Gene Family in Populus, Arabidopsis and Rice. PLoS ONE 2012, 7, e42438. [Google Scholar] [CrossRef] [PubMed]
  18. Zang, B.S.; Li, H.W.; Li, W.J.; Deng, X.W.; Wang, X.P. Analysis of trehalose-6-phosphate synthase (TPS) gene family suggests the formation of TPS complexes in rice. Plant Mol. Biol. 2011, 76, 507–522. [Google Scholar] [CrossRef]
  19. Vicente, R.L.; Spina, L.; Gomez, J.P.L.; Dejean, S.; Parrou, J.L.; Francois, J.M. Trehalose-6-phosphate promotes fermentation and glucose repression in Saccharomyces cerevisiae. Microb. Cell 2018, 5, 444–459. [Google Scholar] [CrossRef]
  20. Lin, M.; Jia, R.; Li, J.; Zhang, M.; Chen, H.; Zhang, D.; Zhang, J.; Chen, X. Evolution and expression patterns of the trehalose-6-phosphate synthase gene family in drumstick tree (Moringa oleifera Lam.). Planta 2018, 248, 999–1015. [Google Scholar] [CrossRef]
  21. Li, H.W.; Zang, B.S.; Deng, X.W.; Wang, X.P. Overexpression of the trehalose-6-phosphate synthase gene OsTPS1 enhances abiotic stress tolerance in rice. Planta 2011, 234, 1007–1018. [Google Scholar] [CrossRef]
  22. Stephen, K.; Beena, R.; Kiran, A.G.; Shanija, S.; Saravanan, R. Changes in physiological traits and expression of key genes involved in sugar signaling pathway in rice under high temperature stress. 3 Biotech 2022, 12, 183. [Google Scholar] [CrossRef] [PubMed]
  23. Stiller, I.; Dulai, S.; Kondrak, M.; Tarnai, R.; Szabo, L.; Toldi, O.; Banfalvi, Z. Effects of drought on water content and photosynthetic parameters in potato plants expressing the trehalose-6-phosphate synthase gene of Saccharomyces cerevisiae. Planta 2008, 227, 299–308. [Google Scholar] [CrossRef] [PubMed]
  24. Lyu, J.I.; Min, S.R.; Lee, J.H.; Lim, Y.H.; Kim, J.K.; Bae, C.H.; Liu, J.R. Overexpression of a trehalose-6-phosphate synthase/phosphatase fusion gene enhances tolerance and photosynthesis during drought and salt stress without growth aberrations in tomato. Plant Cell Tissue Org. Cult. 2013, 112, 257–262. [Google Scholar] [CrossRef]
  25. Xie, D.W.; Wang, X.N.; Fu, L.S.; Sun, J.; Zheng, W.; Li, Z.F. Identification of the trehalose-6-phosphate synthase gene family in winter wheat and expression analysis under conditions of freezing stress. J. Genet. 2015, 94, 55–65. [Google Scholar] [CrossRef] [PubMed]
  26. Sun, J.; Dai, Z.G.; Zhang, X.Y.; Tang, Q.; Cheng, C.H.; Liu, C.; Yu, Y.; Xu, G.C.; Xie, D.W.; Su, J.G. Identification of TPS and TPP gene families in Cannabis sativa and their expression under abiotic stresses. Biol. Plant. 2022, 66, 14–23. [Google Scholar] [CrossRef]
  27. Zhang, Z.Y.; Li, J.H.; Li, F.; Liu, H.H.; Yang, W.S.; Chong, K.; Xu, Y.Y. OsMAPK3 Phosphorylates OsbHLH002/OsICE1 and Inhibits Its Ubiquitination to Activate OsTPP1 and Enhances Rice Chilling Tolerance. Dev. Cell 2017, 43, 731–743.e5. [Google Scholar] [CrossRef] [Green Version]
  28. Xia, C.X.; Gong, Y.S.; Chong, K.; Xu, Y.Y. Phosphatase OsPP2C27 directly dephosphorylates OsMAPK3 and OsbHLH002 to negatively regulate cold tolerance in rice. Plant Cell Environ. 2021, 44, 491–505. [Google Scholar] [CrossRef]
  29. Godge, M.R.; Purkayastha, A.; Dasgupta, I.; Kumar, P.P. Virus-induced gene silencing for functional analysis of selected genes. Plant Cell Rep. 2008, 27, 209–219. [Google Scholar] [CrossRef]
  30. Tomar, M.; Sundaresha, S.; Singh, B.; Bhardwaj, V.; Sood, S.; Singh, B.; Salaria, N.; Thakur, K.; Kumar, A.; Sharma, N.; et al. Validation of molecular response of tuberization in response to elevated temperature by using a transient Virus Induced Gene Silencing (VIGS) in potato. Funct. Integr. Genom. 2021, 21, 215–229. [Google Scholar] [CrossRef]
  31. Zhang, H.J.; Zheng, D.W.; Yin, L.F.; Song, F.M.; Jiang, M. Functional Analysis of OsMED16 and OsMED25 in Response to Biotic and Abiotic Stresses in Rice. Front. Plant Sci. 2021, 12, 652453. [Google Scholar] [CrossRef] [PubMed]
  32. Yang, Y.X.; Guang, Y.L.; Wang, F.; Chen, Y.; Yang, W.T.; Xiao, X.F.; Luo, S.; Zhou, Y. Characterization of Phytochrome-Interacting Factor Genes in Pepper and Functional Analysis of CaPIF8 in Cold and Salt Stress. Front. Plant Sci. 2021, 12, 746517. [Google Scholar] [CrossRef] [PubMed]
  33. Liu, J.N.; Mehari, T.G.; Xu, Y.C.; Umer, M.J.; Hou, Y.Q.; Wang, Y.H.; Peng, R.H.; Wang, K.B.; Cai, X.Y.; Zhou, Z.L.; et al. GhGLK1 a Key Candidate Gene From GARP Family Enhances Cold and Drought Stress Tolerance in Cotton. Front. Plant Sci. 2021, 12, 759312. [Google Scholar] [CrossRef] [PubMed]
  34. Jiang, W.; Fu, F.-L.; Zhang, S.-Z.; Wu, L.; Li, W.-C. Cloning and Characterization of Functional Trehalose-6-Phosphate Synthase Gene in Maize. J. Plant Biol. 2010, 53, 134–141. [Google Scholar] [CrossRef]
  35. Dong, Y.; Zhang, L.; Chang, X.; Wang, X.; Li, G.; Chen, S.; Jin, S. Overexpression of LpCPC from Lilium pumilum confers saline-alkali stress (NaHCO(3)) resistance. Plant Signal. Behav. 2022, 17, 2057723. [Google Scholar] [CrossRef]
  36. Letunic, I.; Khedkar, S.; Bork, P. SMART: Recent updates, new developments and status in 2020. Nucleic Acids Res. 2021, 49, D458–D460. [Google Scholar] [CrossRef]
  37. Guo, W.L.; Chen, R.G.; Gong, Z.H.; Yin, Y.X.; Li, D.W. Suppression Subtractive Hybridization Analysis of Genes Regulated by Application of Exogenous Abscisic Acid in Pepper Plant (Capsicum annuum L.) Leaves under Chilling Stress. PLoS ONE 2013, 8, e66667. [Google Scholar] [CrossRef]
  38. Livak, K.J.; Schmittgen, T.D. Analysis of relative gene expression data using real-time quantitative PCR and the 2(-Delta Delta C(T)) Method. Methods 2001, 25, 402–408. [Google Scholar] [CrossRef]
  39. Araz, O.; Ekinci, M.; Yuce, M.; Shams, M.; Agar, G.; Yildirim, E. Low-temperature modified DNA methylation level, genome template stability, enzyme activity, and proline content in pepper (Capsicum annuum L.) genotypes. Sci. Hortic. Amst. 2022, 294, 110761. [Google Scholar] [CrossRef]
  40. Zhao, S.; Gou, B.; Wang, Y.; Yang, N.; Duan, P.; Wei, M.; Zhang, G.; Wei, B. Identification and relative expression analysis of CaFRK gene family in pepper. 3 Biotech 2022, 12, 137. [Google Scholar] [CrossRef]
  41. Pompelli, M.F.; Martins, S.C.; Celin, E.F.; Ventrella, M.C.; Damatta, F.M. What is the influence of ordinary epidermal cells and stomata on the leaf plasticity of coffee plants grown under full-sun and shady conditions? Braz. J. Biol. 2010, 70, 1083–1088. [Google Scholar] [CrossRef] [PubMed] [Green Version]
  42. Shah, K.; Nahakpam, S. Heat exposure alters the expression of SOD, POD, APX and CAT isozymes and mitigates low cadmium toxicity in seedlings of sensitive and tolerant rice cultivars. Plant Physiol. Biochem. 2012, 57, 106–113. [Google Scholar] [CrossRef] [PubMed]
  43. Goulder, D.M.; Harte, F.M. Prevention of low-temperature gelation in milk protein concentrates by calcium-binding salts. J. Dairy Sci. 2022, 105, 32–39. [Google Scholar] [CrossRef] [PubMed]
  44. Cha, S.J.; Park, H.J.; Kwon, S.J.; Lee, J.K.; Park, J.H. Early detection of plant stress using the internal electrical conductivity of Capsicum annuum in response to temperature and salinity stress. Plant Growth Regul. 2021, 95, 371–380. [Google Scholar] [CrossRef]
  45. Liu, L.; Li, H.; Li, N.; Li, S.X.; Guo, J.H.; Li, X.N. Parental salt priming improves the low temperature tolerance in wheat offspring via modulating the seed proteome. Plant Sci. 2022, 324, 111428. [Google Scholar] [CrossRef]
  46. Fichtner, F.; Olas, J.J.; Feil, R.; Watanabe, M.; Krause, U.; Hoefgen, R.; Stitt, M.; Lunn, J.E. Functional Features of TREHALOSE-6-PHOSPHATE SYNTHASE1, an Essential Enzyme in Arabidopsis. Plant Cell 2020, 32, 1949–1972. [Google Scholar] [CrossRef] [Green Version]
  47. Van Leemputte, F.; Vanthienen, W.; Wijnants, S.; Van Zeebroeck, G.; Thevelein, J.M. Aberrant Intracellular pH Regulation Limiting Glyceraldehyde-3-Phosphate Dehydrogenase Activity in the Glucose-Sensitive Yeast tps1 Delta Mutant. Mbio 2020, 11, e02199-20. [Google Scholar] [CrossRef]
  48. Zhang, H.F.; Liu, S.Y.; Ma, J.H.; Wang, X.K.; Haq, S.U.; Meng, Y.C.; Zhang, Y.M.; Chen, R.G. CaDHN4, a Salt and Cold Stress-Responsive Dehydrin Gene from Pepper Decreases Abscisic Acid Sensitivity in Arabidopsis. Int. J. Mol. Sci. 2019, 21, 26. [Google Scholar] [CrossRef] [Green Version]
  49. Gancedo, C.; Flores, C.L. The importance of a functional trehalose biosynthetic pathway for the life of yeasts and fungi. FEMS Yeast Res. 2004, 4, 351–359. [Google Scholar] [CrossRef] [Green Version]
  50. Avonce, N.; Mendoza-Vargas, A.; Morett, E.; Iturriaga, G. Insights on the evolution of trehalose biosynthesis. BMC Evol. Biol. 2006, 6, 109. [Google Scholar] [CrossRef]
Figure 1. Alignment of pepper (CaTPS1), Rice (OsTPS1), Arabidopsis (AtTPS1) and maize (ZmTPS1) protein sequences. The TPS domain is underlined in blue and TPP domain in green. Amino acid residues with 100% similarity in all sequences are shaded in dark blue, while letters with greater than or equal to 75% similarity are shaded in pink and greater than or equal to 50% similarity in blue.
Agronomy 13 00319 g001
Figure 2. Relative expression of CaTPS1. Relative expression of CaTPS1 in leaves from pepper under cold (A) and salt (B) treatments for 0 h, 1 h, 3 h, 6 h,12 h, 24 h, 36 h, 48 h and 72 h. Each value is shown as the mean ± standard error of three biological replicates, and the multiple comparison test for each gene was presented. Different letters stand for significant differences between CK, TRV2-00, and TRV2-CaTPS1 plants (Duncan’s test, p < 0.05).
Agronomy 13 00319 g002
Figure 3. Changes in plant growth after infection. Plant height (A), stem diameter (B) of CK, pTRV2-00, and pTRV2-CaTPS1 at 15 d, 30 d, and 45 d after inoculation. Each value is shown as the mean ± standard error of three biological replicates, and the multiple comparison test for each gene was presented. Different letters stand for significant differences between CK, TRV2-00, and TRV2-CaTPS1 plants (Duncan’s test, p < 0.05).
Agronomy 13 00319 g003
Figure 4. Relative expression of CaTPS1. (A) Relative expression of CaTPS1 in leaves from CaTPS1-silenced and control pepper plants. Relative expression of CaTPS1 in leaves from CaTPS1-silenced and control pepper plants after cold (B) and salt (C) treatments for 0 h, 12 h, 36 h, and 48 h. Each value is shown as the mean ± standard error of three biological replicates, and the multiple comparison test for each gene was presented. Different letters stand for significant differences between CK, TRV2-00, and TRV2-CaTPS1 plants (Duncan’s test, p < 0.05).
Agronomy 13 00319 g004
Figure 5. The chlorophyll content under cold and salt stresses. Each value is shown as the mean ± standard error of three biological replicates, and the multiple comparison tests for each gene was presented. Different letters stand for significant differences between CK, pTRV2-00, and pTRV2-CaTPS1 plants. Each value is shown as the mean ± standard error of three biological replicates, and the multiple comparison test for each gene was presented. Different letters stand for significant differences between CK, TRV2-00, and TRV2-CaTPS1 plants (Duncan’s test, p < 0.05).
Agronomy 13 00319 g005
Figure 6. The trehalose content under cold and salt stresses. Each value is shown as the mean ± standard error of three biological replicates, and the multiple comparison test for each gene was presented. Different letters stand for significant differences between CK, TRV2-00, and TRV2-CaTPS1 plants (Duncan’s test, p < 0.05).
Agronomy 13 00319 g006
Figure 7. The antioxidant enzymes under cold and salt stresses. POD activity (A), CAT activity (B), and APX activity (C) of CK, pTRV2-00, and pTRV2-CaTPS1. Each value is shown as the mean ± standard error of three biological replicates, and the multiple comparison test for each gene was presented. Different letters stand for significant differences between CK, TRV2-00, and TRV2-CaTPS1 plants (Duncan’s test, p < 0.05).
Agronomy 13 00319 g007
Table 1. List of primers used in this study.
UsagePrimer NamePrimer Sequence(5′-3′)
pTRV2-CaTPS1 constructionV2-CaTPS1F: tgtgagtaaggttaccgaattcAACTTTTGTGAGTGAACTAAATGA
R: tgagctcggtaccggatccTACTCACTGAAGTTATCATCTAAG
qRT-PCRq-CaTPS1F: TAAGTGGTGGAGGTCTCGTCAGC
R: ATTCACACCTGCCCAACCAATCC
qRT-PCRq-ActinF: CCCGGAAGAGCACCCTGTC
R: ATGCTGCTGGGAGCCAACG
Notes: Lowercase letters represent the sequence of the gene, and the uppercase letter represents the sequence of the vector.
Disclaimer/Publisher’s Note: The statements, opinions and data contained in all publications are solely those of the individual author(s) and contributor(s) and not of MDPI and/or the editor(s). MDPI and/or the editor(s) disclaim responsibility for any injury to people or property resulting from any ideas, methods, instructions or products referred to in the content.

