
Transcriptome Analysis of Sponge Gourd (Luffa cylindrica) Reveals Candidate Genes Associated with Fruit Size

Abstract
:1. Introduction
2. Materials and Methods
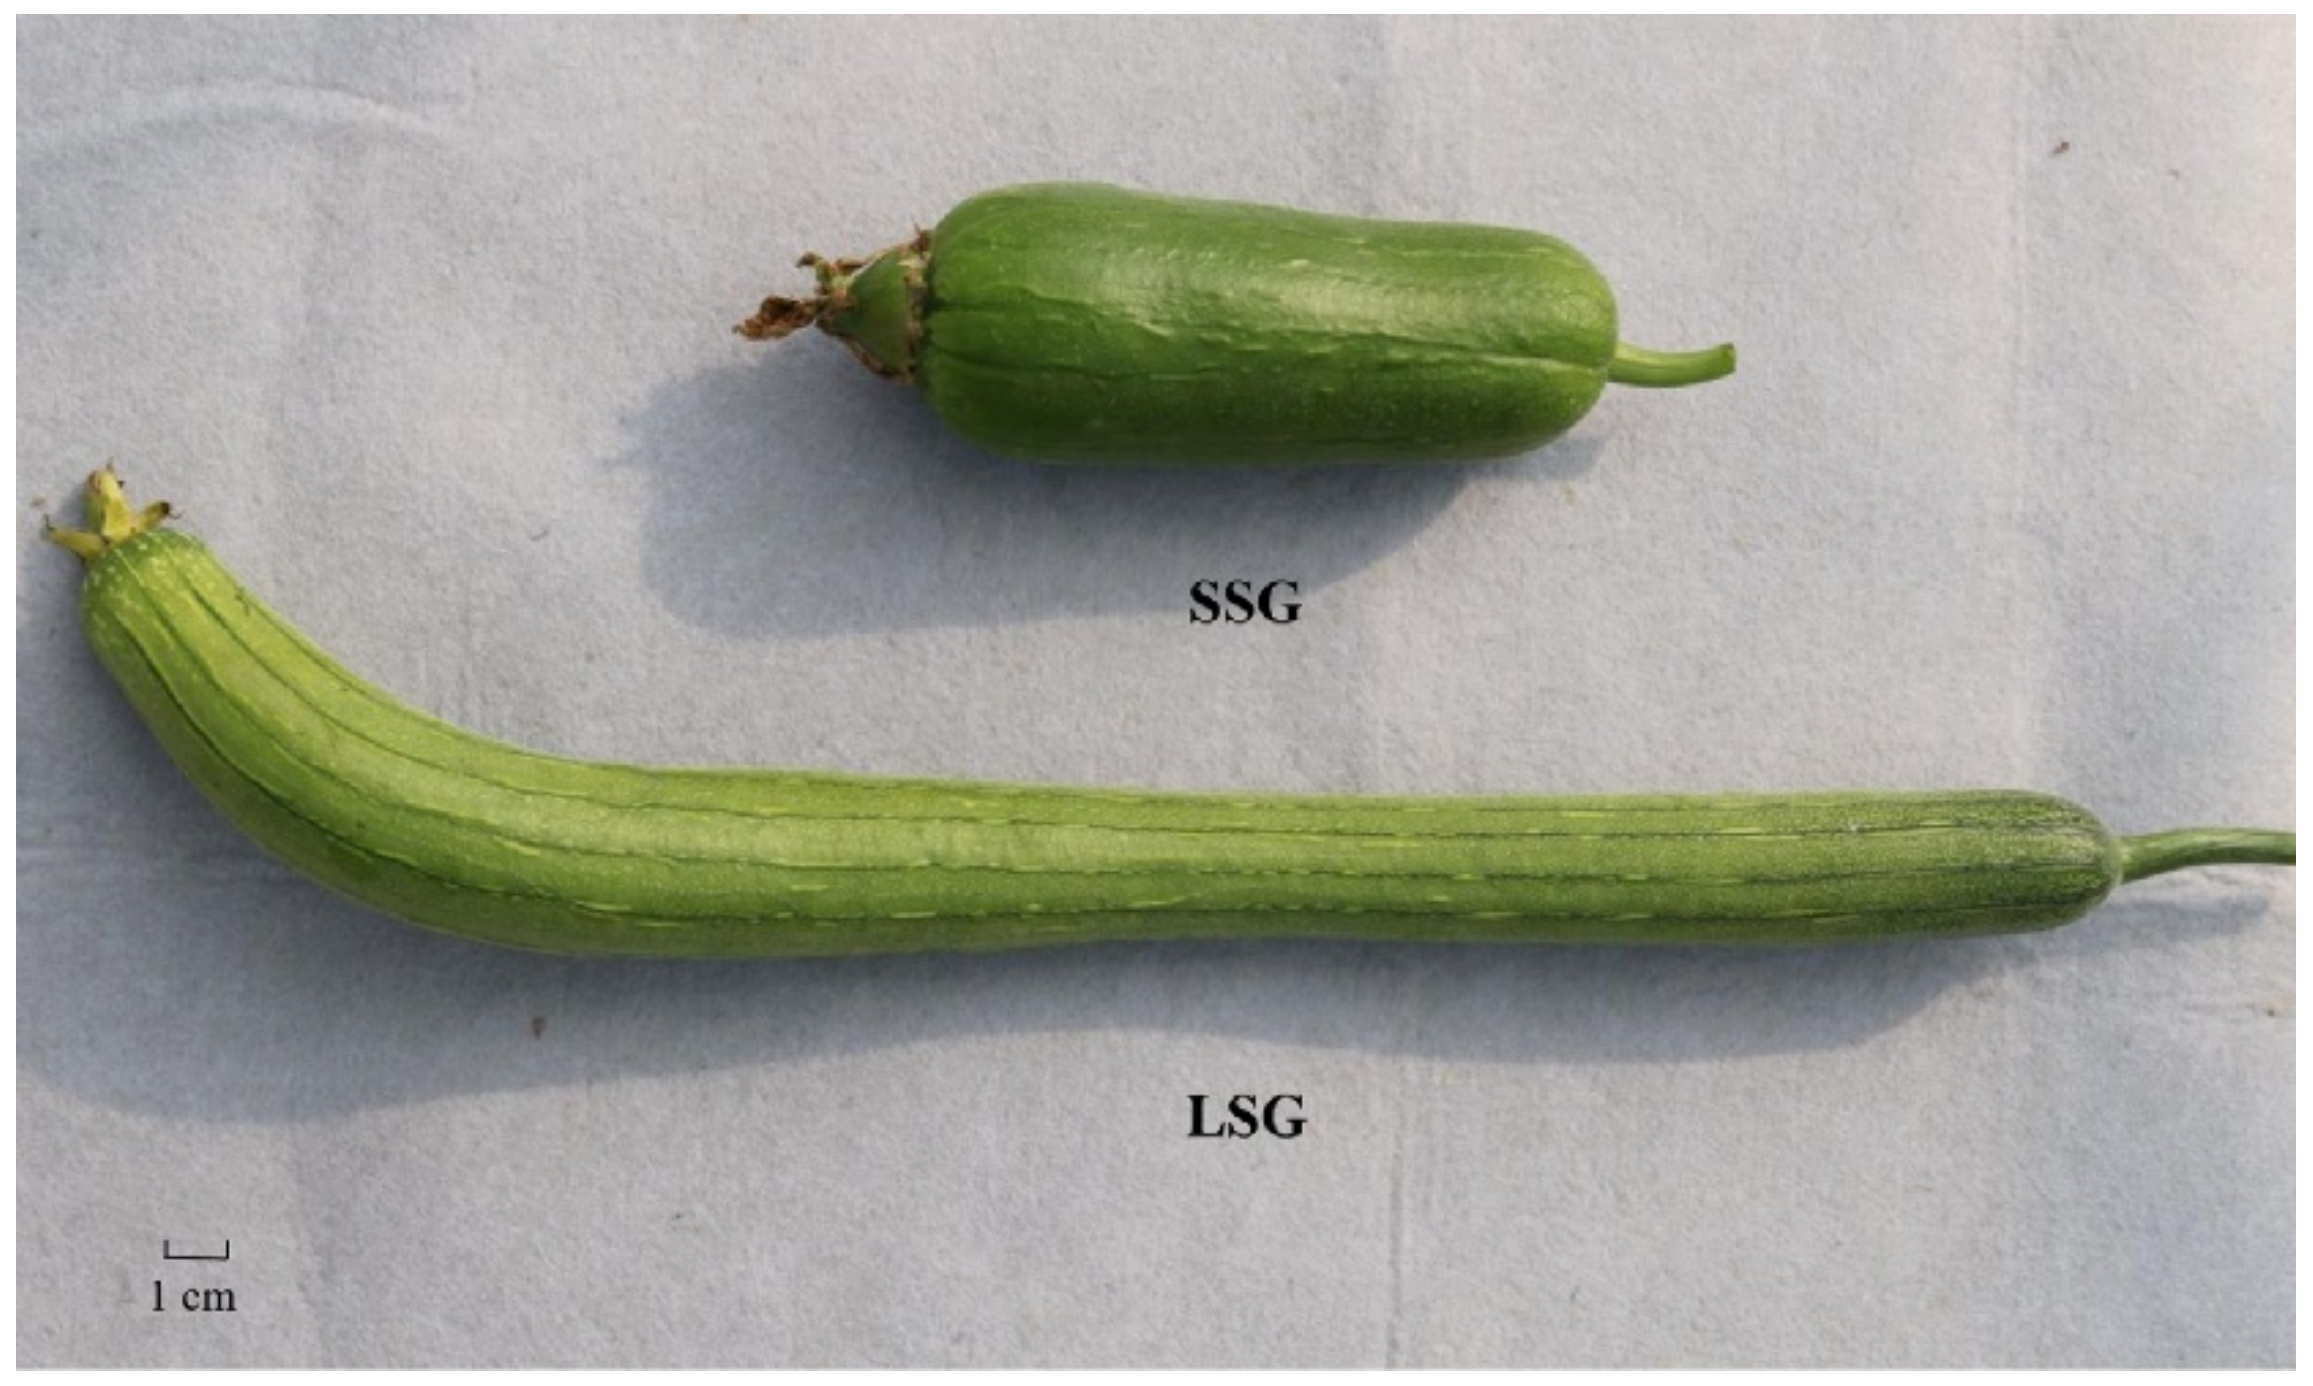
2.1. Plant Materials
2.2. RNA Extraction
2.3. Library Preparation and Transcriptome Sequencing
2.4. Read Quality Control Filtering and Mapping
2.5. Identification and Functional Analysis of Differentially Expressed Genes (DEGs)
2.6. Validation of RNA-Seq Results by Quantitative Real-Time Polymerase Chain Reaction (qRT-PCR) Analysis
3. Results
3.1. Overview of the RNA-Seq Results
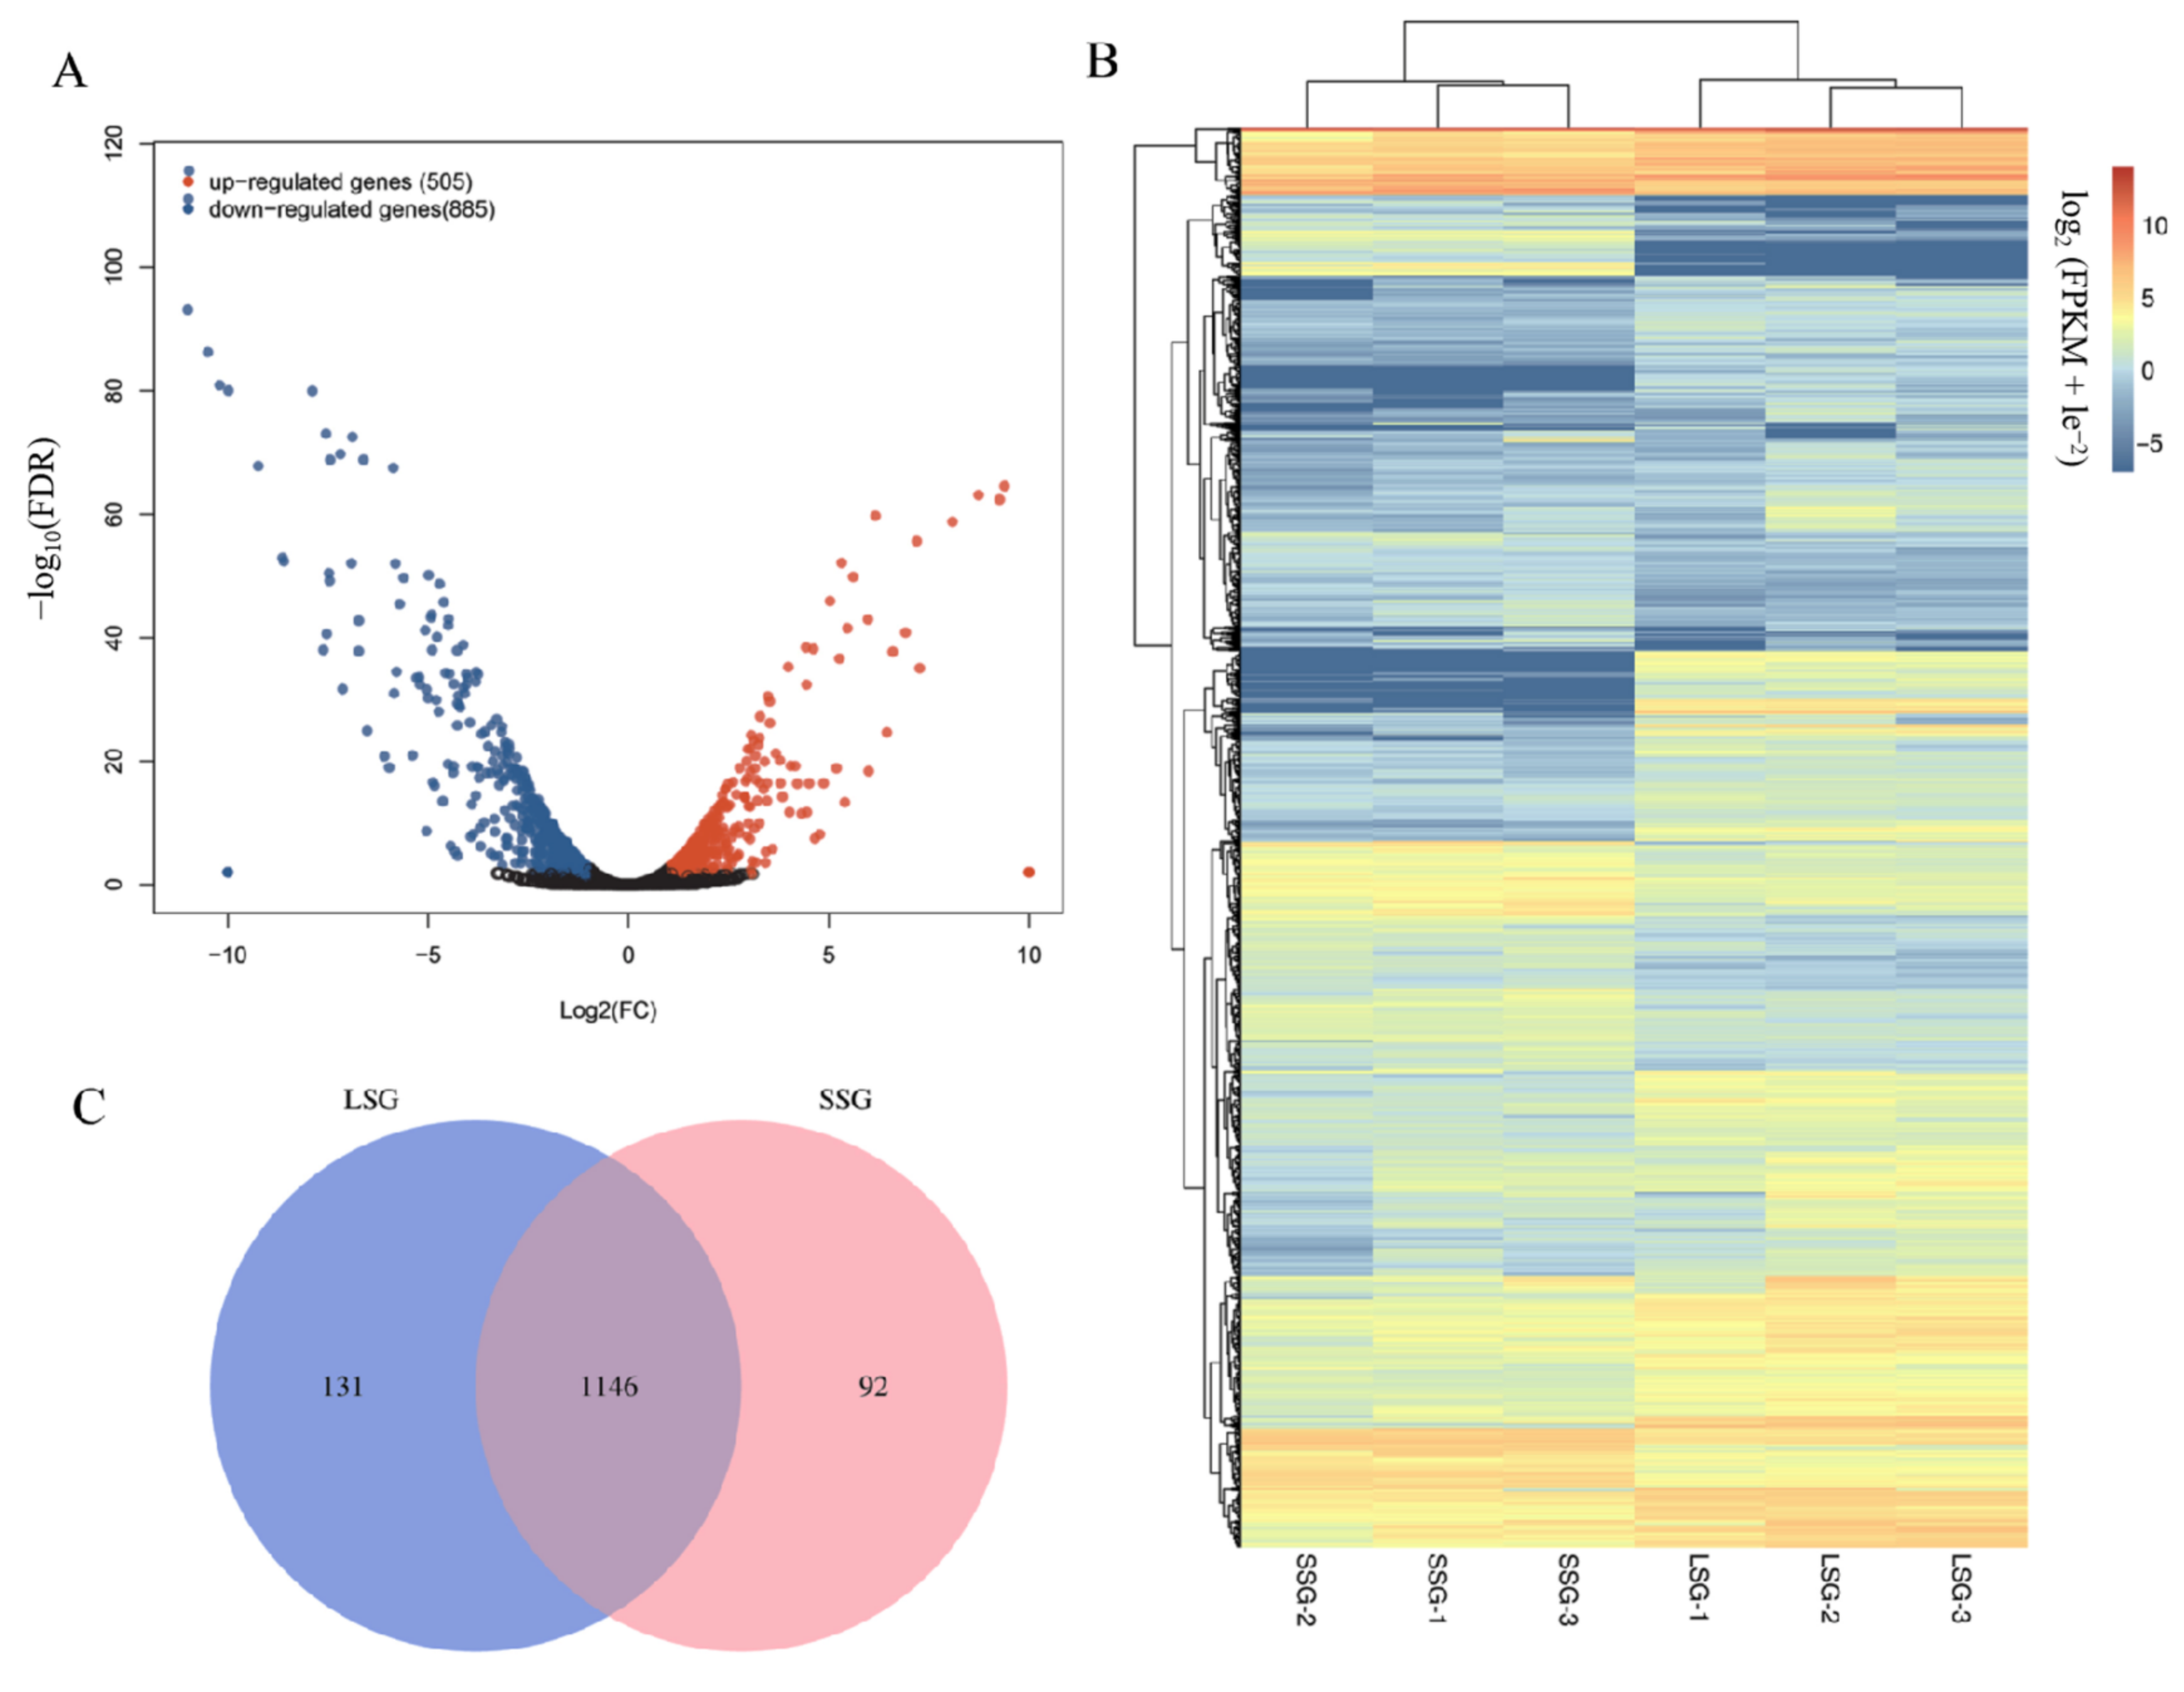
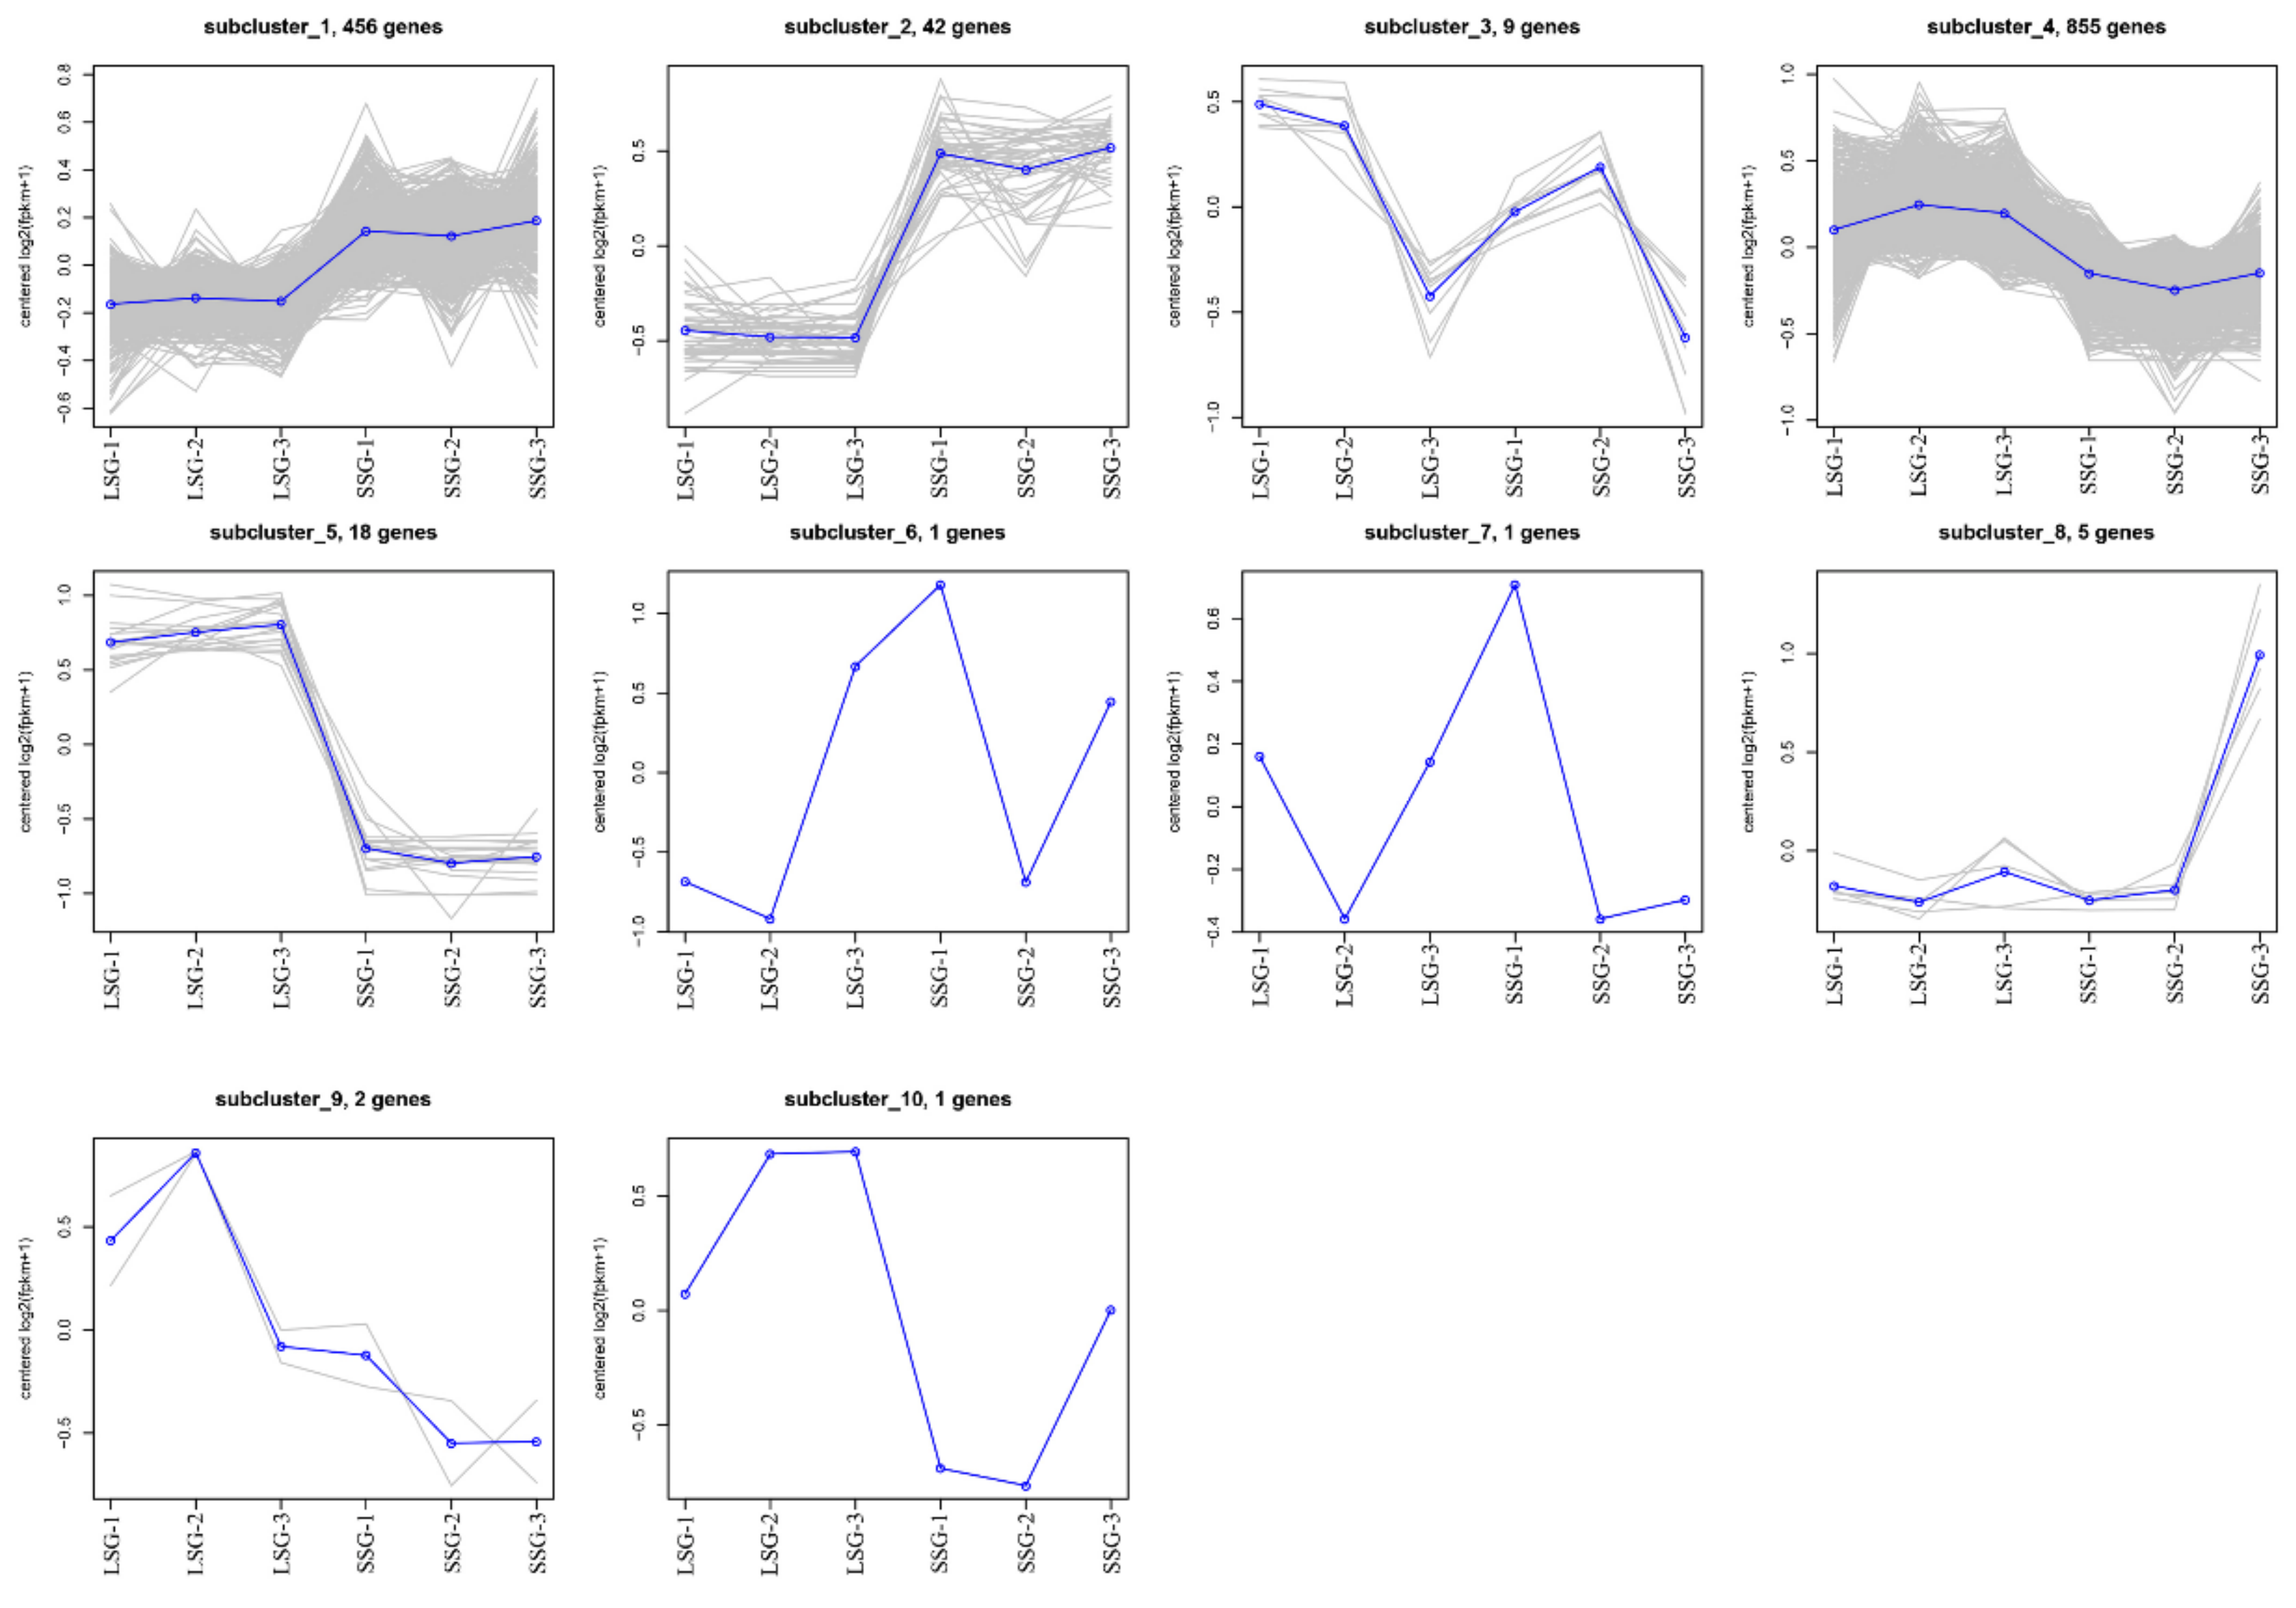
3.2. Identification of Differentially Expressed Genes (DEGs)
3.3. GO and KEGG Enrichment Analyses of DEGs
3.4. DEGs Related to Sponge Gourd Fruit Size Regulation
3.4.1. Transcription Factors (TFs) Related to Sponge Gourd Fruit Size Regulation
3.4.2. DEGs Involved in the Cell Cycle and Cell Expansion
3.4.3. DEGs Associated with Plant Hormone Metabolism
3.4.4. DEGs Involved in MAPK Signaling Pathway
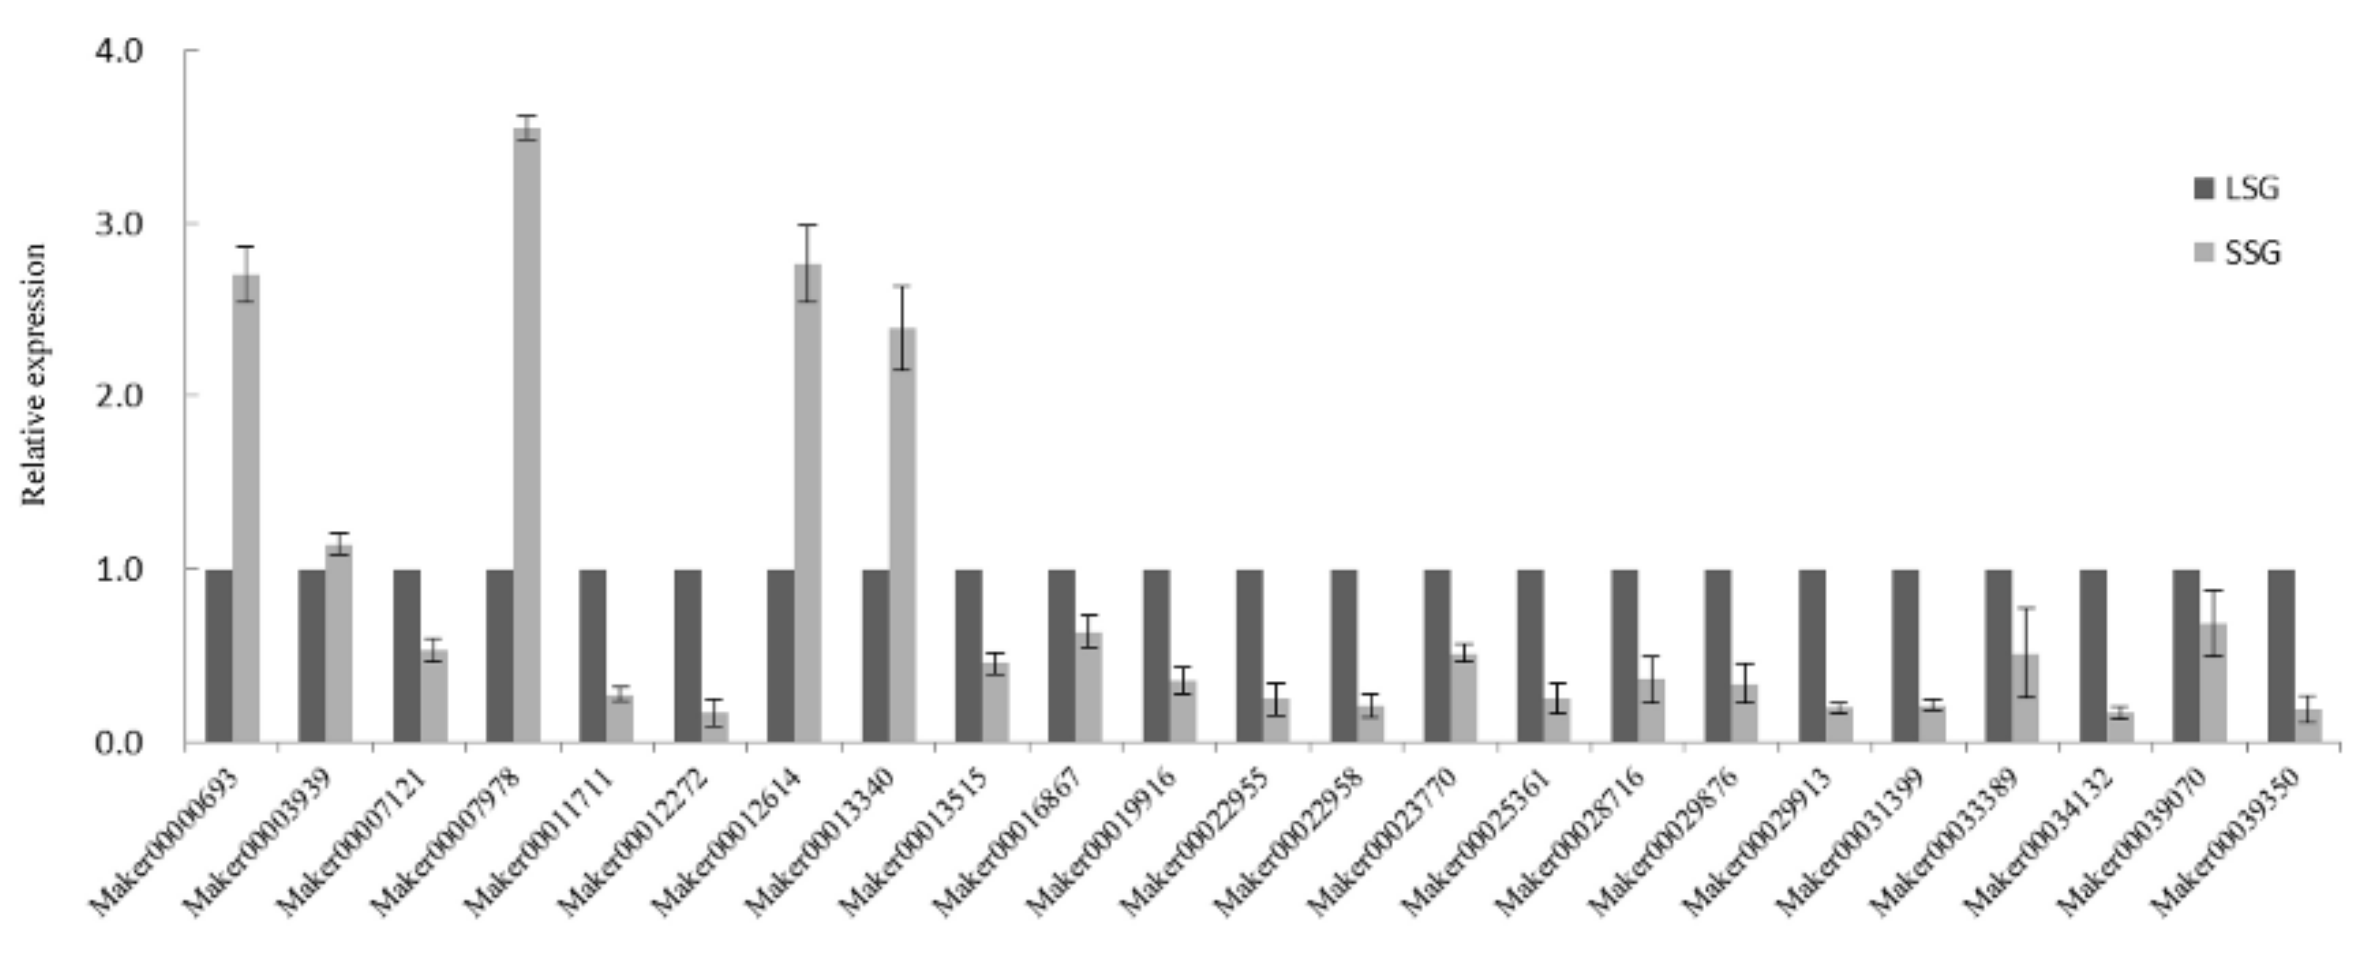
3.5. Validation of Fruit Size-Related DEGs by qRT-PCR Analysis
4. Discussion
4.1. Regulatory Roles of TFs Involved in Sponge Gourd Fruit Size
4.2. Cell Expansion and Cell Cycle Regulating Sponge Gourd Fruit Size
4.3. Plant Hormones Regulating Sponge Gourd Fruit Size
4.4. MAPK Signaling Pathway Regulating Sponge Gourd Fruit Size
5. Conclusions
Supplementary Materials
Author Contributions
Funding
Data Availability Statement
Conflicts of Interest
References
- Tyagi, R.; Sharma, V.; Sureja, A.K.; Das Munshi, A.; Arya, L.; Saha, D.; Verma, M. Genetic diversity and population structure detection in sponge gourd (Luffa cylindrica) using ISSR, SCoT and morphological markers. Physiol. Mol. Biol. Plants 2020, 26, 119–131. [Google Scholar] [CrossRef]
- Rodríguez-Moreno, L.; González, V.M.; Benjak, A.; Martí, M.C.; Puigdomènech, P.; Aranda, M.A.; Garcia-Mas, J. Determination of the melon chloroplast and mitochondrial genome sequences reveals that the largest reported mitochondrial genome in plants contains a significant amount of DNA having a nuclear origin. BMC Genom. 2011, 12, 424. [Google Scholar] [CrossRef] [Green Version]
- Shendge, P.N.; Belemkar, S. Therapeutic potential of Luffa acutangula: A review on its traditional uses, phytochemistry, pharmacology and roxicological aspects. Front. Pharmacol. 2018, 9, 1177. [Google Scholar] [CrossRef] [PubMed] [Green Version]
- Hlel, T.B.; Belhadj, F.; Gül, F.; Altun, M.; Yağlıoğlu, A.Ş.; Demirtaş, I.; Marzouki, M.N. Variations in the bioactive compounds composition and biological activities of loofah (Luffa cylindrica) fruits in relation to maturation stages. Chem. Biodivers. 2017, 14, e1700178. [Google Scholar] [CrossRef] [PubMed]
- Rodríguez, G.R.; Muños, S.; Anderson, C.; Sim, S.C.; Michel, A.; Causse, M.; Gardener, B.B.; Francis, D.; van der Knaap, E. Distribution of SUN, OVATE, LC, and FAS in the tomato germplasm and the relationship to fruit shape diversity. Plant Physiol. 2011, 156, 275–285. [Google Scholar] [CrossRef] [PubMed] [Green Version]
- Monforte, A.J.; Diaz, A.; Caño-Delgado, A.; van der Knaap, E. The genetic basis of fruit morphology in horticultural crops: Lessons from tomato and melon. J. Exp. Bot. 2014, 65, 4625–4637. [Google Scholar] [CrossRef] [PubMed] [Green Version]
- Chu, Y.H.; Jang, J.C.; Huang, Z.; van der Knaap, E. Tomato locule number and fruit size controlled by natural alleles of lc and fas. Plant Direct 2019, 3, e00142. [Google Scholar] [CrossRef] [PubMed] [Green Version]
- Wang, Y.; Clevenger, J.P.; Illa-Berenguer, E.; Meulia, T.; van der Knaap, E.; Sun, L. A comparison of sun, ovate, fs8.1 and auxin application on tomato fruit shape and gene expression. Plant Cell Physiol. 2019, 60, 1067–1081. [Google Scholar] [CrossRef] [Green Version]
- Tan, J.; Tao, Q.; Niu, H.; Zhang, Z.; Li, D.; Gong, Z.; Weng, Y.; Li, Z. A novel allele of monoecious (m) locus is responsible for elongated fruit shape and perfect flowers in cucumber (Cucumis sativus L.). Theor. Appl. Genet. 2015, 128, 2483–2493. [Google Scholar] [CrossRef]
- Pan, Y.; Liang, X.; Gao, M.; Liu, H.; Meng, H.; Weng, Y.; Cheng, Z. Round fruit shape in WI7239 cucumber is controlled by two interacting quantitative trait loci with one putatively encoding a tomato SUN homolog. Theor. Appl. Genet. 2017, 130, 573–586. [Google Scholar] [CrossRef]
- Xin, T.; Zhang, Z.; Li, S.; Zhang, S.; Li, Q.; Zhang, Z.H.; Huang, S.; Yang, X. Genetic regulation of ethylene dosage for cucumber fruit elongation. Plant Cell 2019, 31, 1063–1076. [Google Scholar] [CrossRef] [Green Version]
- Zhao, J.; Jiang, L.; Che, G.; Pan, Y.; Li, Y.; Hou, Y.; Zhao, W.; Zhong, Y.; Ding, L.; Yan, S.; et al. A functional allele of CsFUL1 regulates fruit length through repressing CsSUP and inhibiting auxin transport in cucumber. Plant Cell 2019, 31, 1289–1307. [Google Scholar] [CrossRef]
- Liu, S.; Gao, P.; Zhu, Q.; Zhu, Z.; Liu, H.; Wang, X.; Weng, Y.; Gao, M.; Luan, F. Resequencing of 297 melon accessions reveals the genomic history of improvement and loci related to fruit traits in melon. Plant Biotechnol. Plant Biotechnol. J. 2020, 18, 2545–2558. [Google Scholar] [CrossRef]
- Xanthopoulou, A.; Ganopoulos, I.; Psomopoulos, F.; Manioudaki, M.; Moysiadis, T.; Kapazoglou, A.; Osathanunkul, M.; Michailidou, S.; Kalivas, A.; Tsaftaris, A.; et al. De novo comparative transcriptome analysis of genes involved in fruit morphology of pumpkin cultivars with extreme size difference and development of EST-SSR markers. Gene 2017, 622, 50–66. [Google Scholar] [CrossRef]
- Zhang, H.; Tan, J.; Zhang, M.; Huang, S.; Chen, X. Comparative transcriptomic analysis of two bottle gourd accessions differing in fruit size. Genes 2020, 11, 359. [Google Scholar] [CrossRef] [Green Version]
- Ando, K.; Carr, K.M.; Grumet, R. Transcriptome analyses of early cucumber fruit growth identifies distinct gene modules associated with phases of development. BMC Genom. 2012, 13, 518. [Google Scholar] [CrossRef] [Green Version]
- Ma, L.; Wang, Q.; Mu, J.; Fu, A.; Wen, C.; Zhao, X.; Gao, L.; Li, J.; Shi, K.; Wang, Y.; et al. The genome and transcriptome analysis of snake gourd provide insights into its evolution and fruit development and ripening. Hortic. Res. 2020, 7, 199. [Google Scholar] [CrossRef]
- Zhang, H.; Wang, H.; Yi, H.; Zhai, W.; Wang, G.; Fu, Q. Transcriptome profiling of Cucumis melo fruit development and ripening. Hortic. Res. 2016, 3, 16014. [Google Scholar] [CrossRef] [Green Version]
- Chen, S.; Li, Y.; Zhao, Y.; Li, G.; Zhang, W.; Wu, Y.; Huang, L. iTRAQ and RNA-Seq analyses revealed the effects of grafting on fruit development and ripening of oriental melon (Cucumis melo L. var. makuwa). Gene 2021, 766, 145142. [Google Scholar] [CrossRef]
- Bolger, A.M.; Lohse, M.; Usadel, B. Trimmomatic: A flexible trimmer for Illumina sequence data. Bioinformatics 2014, 30, 2114–2120. [Google Scholar] [CrossRef] [Green Version]
- Zhang, T.; Ren, X.; Zhang, Z.; Ming, Y.; Yang, Z.; Hu, J.; Li, S.; Wang, Y.; Sun, S.; Sun, K.; et al. Long-read sequencing and de novo assembly of the Luffa cylindrica (L.) Roem. genome. Mol. Ecol. Resour. 2020, 20, 511–519. [Google Scholar] [CrossRef] [PubMed]
- Kim, D.; Langmead, B.; Salzberg, S.L. HISAT: A fast spliced aligner with low memory requirements. Nat. Methods 2015, 12, 357–360. [Google Scholar] [CrossRef] [PubMed] [Green Version]
- Okonechnikov, K.; Conesa, A.; García-Alcalde, F. Qualimap 2: Advanced multi-sample quality control for high-throughput sequencing data. Bioinformatics 2016, 32, 292–294. [Google Scholar] [CrossRef] [PubMed]
- Anders, S.; Pyl, P.T.; Huber, W. HTSeq—A Python framework to work with high-throughput sequencing data. Bioinformatics 2015, 31, 166–169. [Google Scholar] [CrossRef]
- Trapnell, C.; Roberts, A.; Goff, L.; Pertea, G.; Kim, D.; Kelley, D.R.; Pimentel, H.; Salzberg, S.L.; Rinn, J.L.; Pachter, L. Differential gene and transcript expression analysis of RNA-seq experiments with TopHat and Cufflinks. Nat. Prtoc. 2012, 7, 562–578. [Google Scholar] [CrossRef] [Green Version]
- Klopfenstein, D.V.; Zhang, L.; Pedersen, B.S.; Ramírez, F.; Warwick Vesztrocy, A.; Naldi, A.; Mungall, C.J.; Yunes, J.M.; Botvinnik, O.; Weigel, M.; et al. GOATOOLS: A Python library for Gene Ontology analyses. Sci. Rep. 2018, 8, 10872. [Google Scholar] [CrossRef]
- Wu, J.; Mao, X.; Cai, T.; Luo, J.; Wei, L. KOBAS server: A web-based platform for automated annotation and pathway identification. Nucleic Acids Res. 2006, 34, W720–W724. [Google Scholar] [CrossRef]
- Livak, K.J.; Schmittgen, T.D. Analysis of relative gene expression data using real-time quantitative PCR and the 2 (-Delta Delta C(T)) method. Method 2001, 25, 402–408. [Google Scholar] [CrossRef]
- Feng, K.; Hou, X.L.; Xing, G.M.; Liu, J.X.; Duan, A.Q.; Xu, Z.S.; Li, M.Y.; Zhuang, J.; Xiong, A.S. Advances in AP2/ERF super-family transcription factors in plant. Crit. Rev. Biotechnol. 2020, 40, 750–776. [Google Scholar] [CrossRef]
- Licausi, F.; Ohme-Takagi, M.; Perata, P. APETALA2/Ethylene Responsive Factor (AP2/ERF) transcription factors: Mediators of stress responses and developmental programs. New Phytol. 2013, 199, 639–649. [Google Scholar] [CrossRef]
- El-Sharkawy, I.; Sherif, S.; Mila, I.; Bouzayen, M.; Jayasankar, S. Molecular characterization of seven genes encoding ethylene-responsive transcriptional factors during plum fruit development and ripening. J. Exp. Bot. 2009, 60, 907–922. [Google Scholar] [CrossRef] [Green Version]
- Sharma, M.; Kumar, R.; Solanke, A.; Sharma, R.; Tyagi, A.; Sharma, A. Identification, phylogeny, and transcript profiling of erf family genes during development and abiotic stress treatments in tomato. Mol. Genet. Genom. 2010, 284, 455–475. [Google Scholar] [CrossRef]
- Yuste-Lisbona, F.J.; Fernández-Lozano, A.; Pineda, B.; Bretones, S.; Ortíz-Atienza, A.; García-Sogo, B.; Müller, N.A.; Angosto, T.; Capel, J.; Moreno, V.; et al. ENO regulates tomato fruit size through the floral meristem development network. Proc. Natl. Acad Sci. USA 2020, 117, 8187–8195. [Google Scholar] [CrossRef] [Green Version]
- Ooka, H.; Satoh, K.; Doi, K.; Nagata, T.; Otomo, Y.; Murakami, K.; Matsubara, K.; Osato, N.; Kawai, J.; Carninci, P.; et al. Comprehensive analysis of NAC family genes in Oryza sativa and Arabidopsis thaliana. DNA Res. 2003, 10, 239–247. [Google Scholar] [CrossRef]
- Olsen, A.N.; Ernst, H.A.; Leggio, L.L.; Skriver, K. NAC transcription factors: Structurally distinct, functionally diverse. Trends. Plant Sci. 2005, 10, 79–87. [Google Scholar] [CrossRef]
- Kou, X.; Zhou, J.; Wu, C.E.; Yang, S.; Liu, Y.; Chai, L.; Xue, Z. The interplay between ABA/ethylene and NAC TFs in tomato fruit ripening: A review. Plant Mol. Biol. 2021, 106, 223–238. [Google Scholar] [CrossRef]
- Moyano, E.; Martínez-Rivas, F.J.; Blanco-Portales, R.; Molina-Hidalgo, F.J.; Ric-Varas, P.; Matas-Arroyo, A.J.; Caballero, J.L.; Muñoz-Blanco, J.; Rodríguez-Franco, A. Genome-wide analysis of the NAC transcription factor family and their expression during the development and ripening of the Fragaria × ananassa fruits. PLoS ONE 2018, 13, e0196953. [Google Scholar] [CrossRef] [Green Version]
- Jia, D.; Jiang, Z.; Fu, H.; Chen, L.; Liao, G.; He, Y.; Huang, C.; Xu, X. Genome-wide identification and comprehensive analysis of NAC family genes involved in fruit development in kiwifruit (Actinidia). BMC Plant Biol. 2021, 21, 44. [Google Scholar] [CrossRef]
- Song, X.M.; Huang, Z.N.; Duan, W.K.; Ren, J.; Liu, T.K.; Li, Y.; Hou, X.L. Genome-wide analysis of the bHLH transcription factor family in Chinese cabbage (Brassica rapa ssp. pekinensis). Mol. Genet. Genom. 2014, 289, 77–91. [Google Scholar] [CrossRef]
- Goossens, J.; Mertens, J.; Goossens, A. Role and functioning of bHLH transcription factors in jasmonate signalling. J. Exp. Bot. 2017, 68, 1333–1347. [Google Scholar] [CrossRef]
- Hao, Y.; Oh, E.; Choi, G.; Liang, Z.; Wang, Z.Y. Interactions between HLH and bHLH factors modulate light-regulated plant development. Mol. Plant 2012, 5, 688–697. [Google Scholar] [CrossRef] [PubMed] [Green Version]
- Li, T.; Yang, S.; Kang, X.; Lei, W.; Qiao, K.; Zhang, D.; Lin, H. The bHLH transcription factor gene AtUPB1 regulates growth by mediating cell cycle progression in Arabidopsis. Biochem. Biophys. Res. Commun. 2019, 518, 565–572. [Google Scholar] [CrossRef] [PubMed]
- Zhang, L.Y.; Bai, M.Y.; Wu, J.; Zhu, J.Y.; Wang, H.; Zhang, Z.; Wang, W.; Sun, Y.; Zhao, J.; Sun, X.; et al. Antagonistic HLH/bHLH transcription factors mediate brassinosteroid regulation of cell elongation and plant development in rice and Arabidopsis. Plant Cell 2009, 21, 3767–3780. [Google Scholar] [CrossRef] [PubMed] [Green Version]
- Du, H.; Zhang, L.; Liu, L.; Tang, X.F.; Yang, W.J.; Wu, Y.M.; Huang, Y.B.; Tang, Y.X. Biochemical and molecular characterization of plant MYB transcription factor family. Biochemistry 2009, 74, 1–11. [Google Scholar] [CrossRef]
- Xiao, R.; Zhang, C.; Guo, X.; Li, H.; Lu, H. MYB transcription factors and its regulation in secondary cell wall formation and lignin biosynthesis during xylem development. Int. J. Mol. Sci. 2021, 22, 3560. [Google Scholar] [CrossRef]
- Kim, W.C.; Kim, J.Y.; Ko, J.H.; Kang, H.; Han, K.H. Identification of direct targets of transcription factor MYB46 provides insights into the transcriptional regulation of secondary wall biosynthesis. Plant Mol. Biol. 2014, 85, 589–599. [Google Scholar] [CrossRef]
- Wu, P.; Peng, M.; Li, Z.; Yuan, N.; Hu, Q.; Foster, C.E.; Saski, C.; Wu, G.; Sun, D.; Luo, H. DRMY1, a myb-like protein, regulates cell expansion and seed production in Arabidopsis thaliana. Plant Cell Physiol. 2019, 60, 285–302. [Google Scholar] [CrossRef]
- Ko, J.H.; Jeon, H.W.; Kim, W.C.; Kim, J.Y.; Han, K.H. The MYB46/MYB83-mediated transcriptional regulatory programme is a gatekeeper of secondary wall biosynthesis. Ann. Bot. 2014, 114, 1099–1107. [Google Scholar] [CrossRef] [Green Version]
- Eulgem, T.; Rushton, P.J.; Robatzek, S.; Somssich, I.E. The WRKY superfamily of plant transcription factors. Trends Plant Sci. 2000, 5, 199–206. [Google Scholar] [CrossRef]
- Chen, J.; Nolan, T.M.; Ye, H.; Zhang, M.; Tong, H.; Xin, P.; Chu, J.; Chu, C.; Li, Z.; Yin, Y. Arabidopsis WRKY46, WRKY54, and WRKY70 transcription factors are involved in brassinosteroid-regulated plant growth and drought responses. Plant Cell 2017, 29, 1425–1439. [Google Scholar] [CrossRef]
- Yang, X.; Li, H.; Yang, Y.; Wang, Y.; Mo, Y.; Zhang, R.; Zhang, Y.; Ma, J.; Wei, C.; Zhang, X. Identification and expression analyses of WRKY genes reveal their involvement in growth and abiotic stress response in watermelon (Citrullus lanatus). PLoS ONE 2018, 13, e0191308. [Google Scholar] [CrossRef]
- Wang, Y.; Zhang, J.; Hu, Z.; Guo, X.; Tian, S.; Chen, G. Genome-wide analysis of the MADS-box transcription factor family in solanum lycopersicum. Int. J. Mol. Sci. 2019, 20, 2961. [Google Scholar] [CrossRef] [Green Version]
- Prasad, K.; Ambrose, B.A. Shaping up the fruit: Control of fruit size by an Arabidopsis B-sister MADS-box gene. Plant Signal Behav. 2010, 5, 899–902. [Google Scholar] [CrossRef] [Green Version]
- Che, G.; Gu, R.; Zhao, J.; Liu, X.; Song, X.; Zi, H.; Cheng, Z.; Shen, J.; Wang, Z.; Liu, R.; et al. Gene regulatory network controlling carpel number variation in cucumber. Development 2020, 147, dev184788. [Google Scholar] [CrossRef]
- Yao, J.L.; Xu, J.; Tomes, S.; Cui, W.; Luo, Z.; Deng, C.; Ireland, H.S.; Schaffer, R.J.; Gleave, A.P. Ectopic expression of the PISTILLATA homologous MdPI inhibits fruit tissue growth and changes fruit shape in apple. Plant Direct 2018, 2, e00051. [Google Scholar] [CrossRef]
- Francis, D. The plant cell cycle—15 years on. New Phytol. 2007, 174, 261–278. [Google Scholar] [CrossRef]
- Cosgrove, D.J.; Li, L.C.; Cho, H.T.; Hoffmann-Benning, S.; Moore, R.C.; Blecker, D. The growing world of expansins. Plant Cell Physiol. 2002, 43, 1436–1444. [Google Scholar] [CrossRef] [Green Version]
- Gao, W.; Li, D.; Fan, X.; Sun, Y.; Han, B.; Wang, X.; Xu, G. Genome-wide identification, characterization, and expression analysis of the expansin gene family in watermelon (Citrullus lanatus). 3 Biotech. 2020, 10, 302. [Google Scholar] [CrossRef]
- Yoon, S.; Devaiah, S.P.; Choi, S.E.; Bray, J.; Love, R.; Lane, J.; Drees, C.; Howard, J.H.; Hood, E.E. Over-expression of the cucumber expansin gene (Cs-EXPA1) in transgenic maize seed for cellulose deconstruction. Transgenic Res. 2016, 25, 173–186. [Google Scholar] [CrossRef]
- Van Sandt, V.S.; Suslov, D.; Verbelen, J.P.; Vissenberg, K. Xyloglucan endotransglucosylase activity loosens a plant cell wall. Ann. Bot. 2007, 100, 1467–1473. [Google Scholar] [CrossRef] [Green Version]
- Shin, Y.K.; Yum, H.; Kim, E.S.; Cho, H.; Gothandam, K.M.; Hyun, J.; Chung, Y.Y. BcXTH1, a Brassica campestris homologue of Arabidopsis XTH9, is associated with cell expansion. Planta 2006, 224, 32–41. [Google Scholar] [CrossRef] [PubMed]
- Li, Y.; Jones, L.; McQueen-Mason, S. Expansins and cell growth. Curr. Opin. Plant Biol. 2003, 6, 603–610. [Google Scholar] [CrossRef] [PubMed]
- John, P.C.; Mews, M.; Moore, R. Cyclin/Cdk complexes: Their involvement in cell cycle progression and mitotic division. Protoplasma 2001, 216, 119–142. [Google Scholar] [CrossRef] [PubMed]
- Stals, H.; Casteels, P.; Van Montagu, M.; Inzé, D. Regulation of cyclin-dependent kinases in Arabidopsis thaliana. Plant Mol. Biol. 2000, 43, 583–593. [Google Scholar] [CrossRef]
- Kumar, R.; Khurana, A.; Sharma, A.K. Role of plant hormones and their interplay in development and ripening of fleshy fruits. J. Exp. Bot. 2014, 65, 4561–4575. [Google Scholar] [CrossRef] [Green Version]
- Medina-Puche, L.; Blanco-Portales, R.; Molina-Hidalgo, F.J.; Cumplido-Laso, G.; García-Caparrós, N.; Moyano-Cañete, E.; Caballero-Repullo, J.L.; Muñoz-Blanco, J.; Rodríguez-Franco, A. Extensive transcriptomic studies on the roles played by abscisic acid and auxins in the development and ripening of strawberry fruits. Funct. Integr. Genom. 2016, 16, 671–692. [Google Scholar] [CrossRef]
- Liu, M.; Chen, Y.; Chen, Y.; Shin, J.H.; Mila, I.; Audran, C.; Zouine, M.; Pirrello, J.; Bouzayen, M. The tomato Ethylene Response Factor Sl-ERF.B3 integrates ethylene and auxin signaling via direct regulation of Sl-Aux/IAA27. New Phytol. 2018, 219, 631–640. [Google Scholar] [CrossRef] [Green Version]
- Rivas-San Vicente, M.; Plasencia, J. Salicylic acid beyond defence: Its role in plant growth and development. J. Exp. Bot. 2011, 62, 3321–3338. [Google Scholar] [CrossRef] [Green Version]
- Li, S.M.; Zheng, H.X.; Zhang, X.S.; Sui, N. Cytokinins as central regulators during plant growth and stress response. Plant Cell Rep. 2021, 40, 271–282. [Google Scholar] [CrossRef]
- Binenbaum, J.; Weinstain, R.; Shani, E. Gibberellin localization and transport in plants. Trends Plant Sci. 2018, 23, 410–421. [Google Scholar] [CrossRef] [Green Version]
- Huang, H.; Liu, B.; Liu, L.; Song, S. Jasmonate action in plant growth and development. J. Exp. Bot. 2017, 68, 1349–1359. [Google Scholar] [CrossRef] [Green Version]
- Xu, J.; Zhang, S. Mitogen-activated protein kinase cascades in signaling plant growth and development. Trends Plant Sci. 2015, 20, 56–64. [Google Scholar] [CrossRef]
- Liang, Y.J.; Yang, W.X. Kinesins in MAPK cascade: How kinesin motors are involved in the MAPK pathway? Gene 2019, 684, 1–9. [Google Scholar] [CrossRef]
- Tena, G.; Asai, T.; Chiu, W.L.; Sheen, J. Plant mitogen-activated protein kinase signaling cascades. Curr. Opin. Plant Biol. 2001, 4, 392–400. [Google Scholar] [CrossRef]
- de Zelicourt, A.; Colcombet, J.; Hirt, H. The role of MAPK modules and ABA during abiotic stress signaling. Trends. Plant Sci. 2016, 21, 677–685. [Google Scholar] [CrossRef]
- Yoo, S.D.; Sheen, J. MAPK signaling in plant hormone ethylene signal transduction. Plant Signal Behav. 2008, 3, 848–849. [Google Scholar] [CrossRef] [Green Version]
- Chang, C. Ethylene signaling: The MAPK module has finally landed. Trends Plant Sci. 2003, 8, 365–368. [Google Scholar] [CrossRef]
- Sethi, V.; Raghuram, B.; Sinha, A.K.; Chattopadhyay, S. A mitogen-activated protein kinase cascade module, MKK3-MPK6 and MYC2, is involved in blue light-mediated seedling development in Arabidopsis. Plant Cell 2014, 26, 3343–3357. [Google Scholar] [CrossRef] [Green Version]


| Samples | Raw Reads | Raw Bases (Gb) | Clean Reads | Mapped Reads | Mapped Rate (%) | Q30% | GC% |
|---|---|---|---|---|---|---|---|
| LSG-1 | 65,119,470 | 9.77 | 62,462,642 | 58,065,272 | 92.96 | 88.16 | 46.55 |
| LSG-2 | 50,343,430 | 7.55 | 49,465,058 | 47,214,397 | 95.45 | 92.02 | 46.91 |
| LSG-3 | 54,085,620 | 8.11 | 52,871,786 | 50,244,058 | 95.03 | 92.23 | 47.23 |
| SSG-1 | 69,397,900 | 10.41 | 67,945,520 | 63,168,949 | 92.97 | 91.23 | 46.89 |
| SSG-2 | 63,220,696 | 9.48 | 61,916,680 | 58,684,629 | 94.78 | 91.95 | 46.65 |
| SSG-3 | 56,234,104 | 8.44 | 55,205,410 | 51,412,798 | 93.13 | 92.25 | 46.77 |
| Gene ID | Description | LSG-1 | LSG-2 | LSG-3 | SSG-1 | SSG-2 | SSG-3 | Log2FC | Regulation |
|---|---|---|---|---|---|---|---|---|---|
| Maker00022449 | ethylene-responsive transcription factor 11-like | 1.0 | 0.7 | 0.6 | 1.0 | 2.2 | 1.8 | 1.10 | up |
| Maker00002693 | ethylene-responsive transcription factor ERF109-like | 4.0 | 34.3 | 27.8 | 3.1 | 2.9 | 9.4 | −2.10 | down |
| Maker00004871 | ethylene-responsive transcription factor ERF113-like | 2.3 | 59.2 | 10.6 | 8.9 | 6.4 | 19.6 | −1.05 | down |
| Maker00008702 | ethylene-responsive transcription factor ERF110-like | 5.8 | 72.3 | 24.1 | 16.6 | 8.4 | 24.3 | −1.05 | down |
| Maker00012352 | ethylene-responsive transcription factor ABR1 | 0.2 | 3.8 | 0.5 | 0.4 | 0.3 | 0.9 | −1.48 | down |
| Maker00013906 | ethylene-responsive transcription factor ERF084 | 2.9 | 1.8 | 0.7 | 0.8 | 0.6 | 0.0 | −1.99 | down |
| Maker00021217 | ethylene-responsive transcription factor 5-like | 12.6 | 29.3 | 27.9 | 9.1 | 7.8 | 10.1 | −1.37 | down |
| Maker00022236 | ethylene-responsive transcription factor ERF017 | 2.8 | 8.8 | 11.3 | 2.1 | 2.7 | 5.4 | −1.16 | down |
| Maker00022840 | ethylene-responsive transcription factor WIN1-like | 0.9 | 3.0 | 4.8 | 3.3 | 0.1 | 0.6 | −1.15 | down |
| Maker00022955 | ethylene-responsive transcription factor ERF105-like | 20.5 | 48.3 | 57.3 | 9.9 | 10.0 | 14.9 | −1.86 | down |
| Maker00022958 | ethylene-responsive transcription factor ERF106-like | 12.1 | 10.7 | 22.0 | 8.3 | 3.9 | 7.0 | −1.22 | down |
| Maker00023340 | ethylene-responsive transcription factor 1B-like | 1.8 | 27.2 | 13.7 | 5.1 | 4.0 | 8.4 | −1.28 | down |
| Maker00024947 | ethylene-responsive transcription factor TINY-like | 1.5 | 2.0 | 1.7 | 1.6 | 0.5 | 0.2 | −1.21 | down |
| Maker00026990 | ethylene-responsive transcription factor ABR1-like | 0.1 | 1.6 | 0.1 | 0.0 | 0.1 | 0.2 | −2.66 | down |
| Maker00031851 | ethylene-responsive transcription factor ERF098-like | 1.0 | 2.1 | 1.0 | 0.3 | 0.0 | 0.2 | −3.06 | down |
| Maker00032087 | ethylene-responsive transcription factor ERF071-like protein | 3.4 | 3.4 | 3.7 | 1.5 | 1.3 | 1.5 | −1.27 | down |
| Maker00038032 | ethylene-responsive transcription factor 1A-like | 0.2 | 2.9 | 0.5 | 0.1 | 0.1 | 0.1 | −3.91 | down |
| Maker00039766 | ethylene-responsive transcription factor ERF020-like | 1.5 | 23.9 | 9.7 | 2.2 | 2.8 | 10.6 | −1.17 | down |
| Maker00012304 | transcription factor bHLH133-like | 2.3 | 0.6 | 0.8 | 1.0 | 4.8 | 5.2 | 1.54 | up |
| Maker00002860 | transcription factor bHLH118-like | 0.0 | 1.0 | 0.6 | 0.0 | 0.1 | 0.0 | −4.44 | down |
| Maker00003086 | transcription factor bHLH118-like | 25.6 | 39.5 | 62.6 | 0.6 | 0.2 | 0.3 | −6.89 | down |
| Maker00008080 | transcription factor bHLH117-like | 1.9 | 1.8 | 0.1 | 0.4 | 0.4 | 0.1 | −2.24 | down |
| Maker00008913 | transcription factor bHLH112-like isoform X1 | 16.4 | 17.9 | 21.5 | 0.0 | 0.0 | 0.0 | −14.18 | down |
| Maker00008926 | transcription factor bHLH112-like isoform X3 | 9.7 | 12.4 | 9.9 | 0.0 | 0.0 | 0.0 | −13.38 | down |
| Maker00024818 | transcription factor bHLH87-like | 0.5 | 2.7 | 3.3 | 0.7 | 0.4 | 1.1 | −1.60 | down |
| Maker00031926 | transcription factor bHLH67 | 4.5 | 3.7 | 8.1 | 3.2 | 1.3 | 2.5 | −1.21 | down |
| Maker00034132 | transcription factor bHLH30-like | 3.3 | 3.5 | 4.1 | 1.0 | 1.1 | 1.0 | −1.81 | down |
| Maker00038530 | myb family transcription factor PHL5-like | 0.3 | 0.2 | 0.1 | 8.1 | 8.5 | 11.1 | 5.47 | up |
| Maker00039664 | transcription factor MYB30-like | 2.1 | 5.5 | 3.4 | 7.4 | 8.5 | 8.4 | 1.15 | up |
| Maker00014658 | transcription factor MYB83-like | 0.8 | 1.4 | 1.0 | 0.8 | 0.2 | 0.5 | −1.14 | down |
| Maker00023477 | MYB103-like protein | 48.8 | 34.1 | 74.5 | 29.7 | 4.4 | 16.2 | −1.65 | down |
| Maker00025361 | transcription factor MYB1-like | 7.0 | 16.0 | 17.6 | 2.9 | 1.5 | 4.6 | −2.17 | down |
| Maker00029958 | myb-related protein 308-like | 1.3 | 0.2 | 0.2 | 0.1 | 0.1 | 0.2 | −2.17 | down |
| Maker00036073 | transcription factor MYB86-like | 1.5 | 5.5 | 3.6 | 2.3 | 0.2 | 1.4 | −1.43 | down |
| Maker00039070 | transcription factor MYB20-like | 14.0 | 14.1 | 19.3 | 7.5 | 4.8 | 4.2 | −1.53 | down |
| Maker00038509 | transcription factor MYB46-like | 1.1 | 1.5 | 1.6 | 0.7 | 0.5 | 0.5 | −1.25 | down |
| Maker00000545 | NAC transcription factor 29-like | 6.0 | 10.2 | 13.7 | 26.1 | 26.9 | 40.0 | 1.63 | up |
| Maker00016510 | NAC transcription factor 56-like | 5.8 | 7.3 | 8.9 | 16.1 | 15.9 | 13.6 | 1.05 | up |
| Maker00017754 | NAC transcription factor 29-like | 0.7 | 0.9 | 0.4 | 1.7 | 3.0 | 1.5 | 1.67 | up |
| Maker00039552 | NAC domain-containing protein 92-like | 2.4 | 2.0 | 1.3 | 5.6 | 3.1 | 4.7 | 1.24 | up |
| Maker00008337 | NAC domain-containing protein 2-like | 27.0 | 102.6 | 72.6 | 39.1 | 13.9 | 40.9 | −1.11 | down |
| Maker00029876 | NAC domain-containing protein 55 | 3.2 | 2.2 | 7.7 | 1.0 | 0.3 | 1.9 | −2.03 | down |
| Maker00037829 | NAC domain-containing protein 21/22-like | 2.5 | 3.8 | 6.0 | 4.2 | 0.2 | 1.1 | −1.17 | down |
| Maker00005830 | putative WRKY transcription factor 33 | 14.4 | 52.4 | 43.6 | 17.0 | 8.2 | 28.5 | −1.04 | down |
| Maker00013204 | probable WRKY transcription factor 49 | 2.3 | 2.2 | 2.4 | 0.4 | 0.8 | 0.1 | −2.51 | down |
| Maker00028716 | WRKY transcription factor 34 | 5.0 | 10.7 | 13.7 | 3.6 | 2.7 | 6.1 | −1.25 | down |
| Maker00031399 | WRKY transcription factor 22-like | 6.9 | 6.1 | 4.5 | 2.5 | 3.0 | 3.3 | −1.00 | down |
| Maker00033191 | putative WRKY transcription factor 70 | 19.7 | 33.0 | 44.9 | 4.6 | 4.8 | 17.2 | −1.88 | down |
| Maker00037564 | probable WRKY transcription factor 75 | 0.2 | 2.5 | 1.4 | 0.4 | 0.3 | 1.1 | −1.14 | down |
| Maker00038968 | probable WRKY transcription factor 40 isoform X2 | 11.8 | 92.3 | 42.2 | 7.2 | 6.3 | 36.2 | −1.56 | down |
| Maker00002571 | MADS-box transcription factor 6-like | 5.5 | 2.1 | 2.9 | 37.1 | 6.9 | 47.1 | 3.12 | up |
| Maker00004005 | MADS-box protein JOINTLESS-like isoform X2 | 19.1 | 18.8 | 15.7 | 8.1 | 3.4 | 4.0 | −1.79 | down |
| Maker00013693 | MADS-box protein EJ2-like | 14.1 | 17.9 | 11.0 | 7.6 | 5.0 | 7.0 | −1.13 | down |
| Maker00014108 | MADS-box protein EJ2-like | 8.7 | 9.5 | 7.4 | 4.7 | 3.1 | 4.2 | −1.10 | down |
| Maker00034410 | MADS-box protein AGL42 isoform X2 | 7.8 | 6.7 | 4.7 | 1.3 | 1.4 | 1.4 | −2.22 | down |
| Maker00034417 | MADS-box protein AGL42 isoform X2 | 7.7 | 6.5 | 2.4 | 1.1 | 1.0 | 1.4 | −2.24 | down |
| Gene ID | Description | LSG-1 | LSG-2 | LSG-3 | SSG-1 | SSG-2 | SSG-3 | Log2FC | Regulation |
|---|---|---|---|---|---|---|---|---|---|
| Maker00030282 | expansin-A12 | 2.8 | 2.6 | 0.1 | 0.7 | 1.0 | 0.1 | −1.56 | down |
| Maker00038088 | expansin-like B1 | 0.1 | 4.0 | 0.7 | 0.2 | 0.0 | 0.5 | −2.95 | down |
| Maker00039350 | expansin A9 | 3.2 | 3.4 | 13.8 | 3.4 | 0.5 | 1.3 | −1.96 | down |
| Maker00039481 | expansin-A10-like | 67.0 | 98.9 | 110.9 | 47.7 | 7.6 | 22.2 | −1.84 | down |
| Maker00006010 | cyclin-dependent kinase C-2-like | 4.4 | 3.0 | 3.1 | 1.4 | 1.0 | 1.2 | −1.54 | down |
| Maker00006013 | cyclin-dependent kinase C-2-like | 9.5 | 8.5 | 6.3 | 4.0 | 3.1 | 3.0 | −1.27 | down |
| Maker00006055 | cyclin-dependent kinase C-2-like | 3.6 | 2.4 | 3.1 | 1.0 | 1.4 | 1.6 | −1.18 | down |
| Maker00019798 | cyclin-dependent kinase C-2-like | 24.5 | 18.6 | 19.0 | 6.6 | 5.5 | 7.2 | −1.68 | down |
| Maker00019916 | cyclin-dependent kinase C-2-like | 49.6 | 35.7 | 37.9 | 9.3 | 9.4 | 10.0 | −2.10 | down |
| Maker00013235 | cyclin-D3-3-like isoform X1 | 10.9 | 8.7 | 9.1 | 17.3 | 22.2 | 19.2 | 1.03 | up |
| Maker00007464 | xyloglucan endotransglucosylase/hydrolase protein 22-like | 40.3 | 112.6 | 106.1 | 63.5 | 14.9 | 47.6 | −1.04 | down |
| Maker00023770 | xyloglucan endotransglucosylase/hydrolase protein 9-like | 12.1 | 8.0 | 4.5 | 2.0 | 2.8 | 4.8 | −1.35 | down |
| Maker00029744 | xyloglucan endotransglucosylase/hydrolase protein 6 | 2.4 | 6.0 | 6.2 | 0.6 | 0.1 | 0.7 | −3.50 | down |
| Maker00029948 | xyloglucan endotransglucosylase/h ydrolase protein 7 | 0.7 | 3.3 | 1.9 | 2.2 | 0.0 | 0.2 | −1.28 | down |
| Maker00038114 | xyloglucan endotransglucosylase/hydrolase protein 30 | 5.1 | 4.3 | 2.2 | 1.4 | 1.0 | 1.6 | −1.51 | down |
| Gene ID | Description | LSG-1 | LSG-2 | LSG-3 | SSG-1 | SSG-2 | SSG-3 | Log2 FC | Regulation |
|---|---|---|---|---|---|---|---|---|---|
| Maker00012983 | salicylic acid-binding protein 2-like | 11.5 | 20.8 | 22.8 | 5.7 | 7.1 | 13.5 | −1.07 | down |
| Maker00013263 | salicylic acid-binding protein 2-like | 8.0 | 20.5 | 15.2 | 10.2 | 2.1 | 3.7 | −1.45 | down |
| Maker00013515 | salicylic acid-binding protein 2 | 13.4 | 13.5 | 10.9 | 4.3 | 1.6 | 1.5 | −2.35 | down |
| Maker00029913 | ethylene synthase | 0.2 | 6.4 | 2.1 | 0.5 | 0.6 | 1.2 | −1.94 | down |
| Maker00016907 | protein reversion-to-ethylene sensitivity1 | 26.6 | 38.0 | 37.0 | 71.7 | 100.8 | 87.4 | 1.36 | up |
| Maker00004222 | gibberellin 2-beta-dioxygenase 1-like | 12.6 | 35.0 | 23.0 | 10.1 | 8.7 | 14.3 | −1.09 | down |
| Maker00007121 | gibberellin-regulated protein 1-like | 5.8 | 6.5 | 5.4 | 2.8 | 2.6 | 2.0 | −1.26 | down |
| Maker00013728 | abscisic acid 8′-hydroxylase 4-like | 4.3 | 2.0 | 8.1 | 2.1 | 1.9 | 2.3 | −1.17 | down |
| Maker00016867 | abscisic acid receptor PYL2 | 14.1 | 27.5 | 39.6 | 15.5 | 8.5 | 8.5 | −1.32 | down |
| Maker00039228 | abscisic acid receptor PYL4-like | 2.9 | 1.4 | 0.6 | 0.4 | 0.6 | 0.4 | −1.84 | down |
| Maker00017853 | abscisic acid 8′-hydroxylase 3-like | 0.3 | 0.3 | 0.1 | 0.8 | 1.1 | 0.6 | 1.75 | up |
| Maker00000589 | auxin-responsive protein SAUR21-like | 2.3 | 1.6 | 2.0 | 0.7 | 0.8 | 0.9 | −1.26 | down |
| Maker00001150 | auxin-responsive protein SAUR23-like | 12.2 | 7.3 | 5.0 | 3.9 | 5.6 | 2.4 | −1.04 | down |
| Maker00014019 | auxin-responsive protein SAUR50-like | 7.3 | 5.6 | 3.8 | 3.0 | 2.3 | 2.1 | −1.18 | down |
| Maker00014874 | Auxin responsive SAUR protein | 0.8 | 1.7 | 0.4 | 0.1 | 0.0 | 0.0 | −4.27 | down |
| Maker00015281 | auxin-responsive protein SAUR50-like | 1.8 | 2.3 | 1.8 | 1.2 | 0.6 | 0.9 | −1.10 | down |
| Maker00021979 | auxin-binding protein ABP19a-like | 108.2 | 125.9 | 305.9 | 112.0 | 9.6 | 58.6 | −1.58 | down |
| Maker00033389 | IAA-amino acid hydrolase ILR1-like 3 | 36.1 | 49.4 | 48.1 | 9.9 | 9.9 | 9.9 | −2.17 | down |
| Maker00039293 | auxin transporter-like protein 2 | 9.6 | 10.0 | 7.9 | 2.5 | 1.9 | 2.3 | −2.03 | down |
| Maker00023875 | auxin-responsive protein IAA14 | 4.2 | 8.4 | 9.2 | 12.9 | 16.5 | 16.5 | 1.07 | up |
| Maker00007027 | cytokinin riboside phosphoribohydrolase LOG3-like | 8.5 | 27.7 | 40.7 | 8.3 | 4.8 | 17.1 | −1.35 | down |
| Maker00031370 | jasmonic acid-amido synthetase JAR1-like | 12.1 | 58.4 | 45.1 | 24.7 | 7.2 | 20.1 | −1.15 | down |
| Gene ID | Description | LSG-1 | LSG-2 | LSG-3 | SSG-1 | SSG-2 | SSG-3 | Log2 FC | Regulation |
|---|---|---|---|---|---|---|---|---|---|
| Maker00004003 | hypothetical protein DKX38_014182 | 28.1 | 69.7 | 78.3 | 22.9 | 39.5 | 18.9 | −1.12 | down |
| Maker00005830 | putative WRKY transcription factor 33 | 14.4 | 52.4 | 43.6 | 17.0 | 8.2 | 28.5 | −1.04 | down |
| Maker00009036 | STS14 protein-like | 219.9 | 140.9 | 84.9 | 83.1 | 62.2 | 47.1 | −1.21 | down |
| Maker00011711 | mitogen-activated protein kinase kinase kinase 18-like | 89.0 | 132.8 | 133.0 | 58.4 | 55.3 | 55.3 | −1.07 | down |
| Maker00012272 | mitogen-activated protein kinase kinase kinase 17-like | 0.3 | 15.2 | 3.1 | 0.3 | 0.5 | 1.5 | −3.03 | down |
| Maker00016867 | abscisic acid receptor PYL2 | 14.1 | 27.5 | 39.6 | 15.5 | 8.5 | 8.5 | −1.32 | down |
| Maker00021373 | transcription factor MYC2-like | 3.5 | 14.8 | 17.3 | 5.6 | 2.7 | 7.3 | −1.18 | down |
| Maker00023340 | ethylene-responsive transcription factor 1B-like | 1.8 | 27.2 | 13.7 | 5.1 | 4.0 | 8.4 | −1.28 | down |
| Maker00029408 | pathogenesis-related protein PRB1-2-like | 0.9 | 1.9 | 4.7 | 0.2 | 0.0 | 0.7 | −3.09 | down |
| Maker00029913 | ethylene synthase | 0.2 | 6.4 | 2.1 | 0.5 | 0.6 | 1.2 | −1.94 | down |
| Maker00031399 | WRKY transcription factor 22-like | 6.9 | 6.1 | 4.5 | 2.5 | 3.0 | 3.3 | −1.00 | down |
| Maker00016907 | protein reversion-to-ethylene sensitivity1 | 26.6 | 38.0 | 37.0 | 71.7 | 100.8 | 87.4 | 1.36 | up |
| Maker00019397 | endochitinase 2-like | 0.1 | 0.2 | 0.7 | 1.6 | 1.1 | 1.0 | 1.78 | up |
| Maker00020996 | transcription factor MYC2-like | 0.7 | 2.5 | 2.3 | 6.8 | 10.7 | 7.0 | 2.14 | up |
Publisher’s Note: MDPI stays neutral with regard to jurisdictional claims in published maps and institutional affiliations. |
© 2022 by the authors. Licensee MDPI, Basel, Switzerland. This article is an open access article distributed under the terms and conditions of the Creative Commons Attribution (CC BY) license (https://creativecommons.org/licenses/by/4.0/).
Share and Cite
Qiao, S.; Xu, Y.; Hu, Q.; Dong, W.; He, S.; Qi, X.; Sun, Y. Transcriptome Analysis of Sponge Gourd (Luffa cylindrica) Reveals Candidate Genes Associated with Fruit Size. Agronomy 2022, 12, 1810. https://doi.org/10.3390/agronomy12081810
Qiao S, Xu Y, Hu Q, Dong W, He S, Qi X, Sun Y. Transcriptome Analysis of Sponge Gourd (Luffa cylindrica) Reveals Candidate Genes Associated with Fruit Size. Agronomy. 2022; 12(8):1810. https://doi.org/10.3390/agronomy12081810
Chicago/Turabian StyleQiao, Shuting, Yufei Xu, Qizan Hu, Wenqi Dong, Shengmi He, Xingjiang Qi, and Yuyan Sun. 2022. "Transcriptome Analysis of Sponge Gourd (Luffa cylindrica) Reveals Candidate Genes Associated with Fruit Size" Agronomy 12, no. 8: 1810. https://doi.org/10.3390/agronomy12081810