Article

Screening Direct Seeding-Related Traits by Using an Improved Mesocotyl Elongation Assay and Association between Seedling and Maturity Traits in Rice

1
National Key Facility for Crop Gene Resources and Genetic Improvement, Institute of Crop Sciences, Chinese Academy of Agricultural Sciences, Beijing 100081, China
2
National Institute for Genomics and Advanced Biotechnology, National Agricultural Research Centre, Park Road, Islamabad 45500, Pakistan
3
Institute of Wetland Agriculture and Ecology, Shandong Academy of Agricultural Sciences, Jinan 250100, China
4
College of Agriculture, Fisheries and Forestry, Fiji National University, Nausori P.O. Box 1544, Fiji
*
Author to whom correspondence should be addressed.
These authors contributed equally to this work.
Agronomy 2022, 12(4), 975; https://doi.org/10.3390/agronomy12040975
Submission received: 19 March 2022 / Revised: 8 April 2022 / Accepted: 11 April 2022 / Published: 18 April 2022
(This article belongs to the Special Issue Agronomy of Direct-Seeded Rice)

Abstract

:
Direct seeding (DS) of rice gained much attention due to labor scarcity and unavailability of water. However, reduced emergence and poor seedling establishment are the main problems of DS which causes significant yield losses. Herein, DS-associated seedling traits of three major rice groups, i.e., Indica (Ind), Japonica (Jap), and aus-type (Aus), were evaluated by using an improved mesocotyl elongation assay. The associations among different traits at the seedling and maturity stage were also studied. Significant variation was observed among the cultivars of different rice groups. The Aus group cultivars showed higher mean values for coleoptile (C, 3.85 cm), mesocotyl (MC, 4.17 cm), shoot length (SL, 13.64 cm), panicle length (PL, 23.44 cm), tillers number (T, 15.95), culm length (CL, 105.29 cm), and plant height (PH, 128.73 cm), while the Indica and Japonica groups showed higher mean values of grain length (GL, 8.69 mm), grain length/width ratio (GL/WR, 3.07), and grain width (GW, 3.31 mm), with 1000 grain weight (TGWt, 25.53 g), respectively. Pairwise correlation analysis showed that MC, C, and SL were positively correlated among themselves and with PL, CL, and PH. Moreover, based on principal component analysis (PCA), C, MC, SL, CL, and PH were identified as the major discriminative factors in the rice cultivars. This study describes the development of desired DS rice variety with long MC and semidwarf in height and suggests that Aus group cultivars can be used as the donor parents of favorable DS-associated traits in rice breeding programs.

1. Introduction

Rice (Oryza sativa L.) is a very important cereal because it feeds half of the world’s population. More than 40,000 worldwide and 15,000 rice varieties in China are being used for cultivation [1]. Asian rice varieties, due to the strong genetic background, can quickly adapt to different climatic conditions [1,2]. This genetic variation created genetic diversity in rice, such as Indica (Oryza sativa subsp. indica) and Japonica (Oryza sativa subsp. japonica) [2,3]. These two groups are commonly grown and can be distinguished based on their phenotypic characteristics. For example, Indica rice has long grains with cylindrical shape, while Japonica has short grains with round shape [4]. In addition to the subdivision of Japonica, Aus-type (Oryza sativa subsp. aus) and Aromatic (Oryza sativa subsp. aromatic) are the other groups of rice [5,6]. The origin of Aus-type is the Indian subcontinent, where Indica and Japonica arrived later [6]. Aus-type is more closely related to Indica type, but they have different genetic makeups [7]. The genotypes of Aus-types are generally tall, heat- and drought-tolerant, and highly efficient in phosphorous (P) uptake [8,9,10]. Indica rice is mainly grown at low altitudes areas of tropical and subtropical, while Japonica rice is cultivated in a range of temperatures because it is more cold-tolerant than Indica [1,11]. Traditionally, rice is cultivated through transplantation of seedlings from nurseries to the puddled field and known as transplanted rice (TPR) [12]. While seeds are directly sowed on the dry soil or puddled soil in the second method known as direct seeding (DS) [13]. The first method of sowing is becoming less profitable due to an increase in labor and energy resources cost, climate-induced water shortage, and labor unavailability [14,15]. Earlier studies also reported that the same varieties showed similar or even higher grain yield in DS compared to TPR with the same cultivation and agronomic practices [14,16]. Due to the ease, convenience, and the above reasons, farmers are now moving from puddled TPR towards DS [17]. In China, 28% area of the total cultivated rice is under DS, and it is increasing day by day [18]. However, poor seedling establishment, weed management, and lodging are the major challenges of this method [17,19].
For DS, rice cultivars with high germination rate, lodging resistance, fast-growing and early-tillering capacity, and well-developed root system are preferred [20]. Uniformly germinated seedlings and high vigor is critical for good crop establishment when cultivating by DS method. Shoot-related parameters such as mesocotyl (the embryonic tissue between the coleoptile node and scutella) elongation and coleoptile (the protective cover outside of the emerging shoot) are central components that support emergence from deeper soil [20,21,22,23] and help in weed management [24,25,26]. DS provides protection from the birds and improves not only lodging resistance but also increase drought resistance in rice because deep root system absorbs more water [27,28,29]. It also reduces the omission of greenhouse gases during the cultivation of rice [30]. Rice breeders are looking for resources with optimum elongated coleoptile and mesocotyl and good seedling establishment and lodging resistance to cross with the high-yielding rice cultivars to develop rice variety suitable for direct seeding.
Most of the previous studies on DS reported the role of mesocotyl elongation and coleoptile in shoot emergence from the deeper soil and mapped different QTLs (qMel-1, qMel-3, and qMel-6) and genes (OsML1 and OsML2) with no detailed validation of the results at maturity stage under field conditions [1,12,26,31,32,33,34,35]. In the life cycle of rice, it needs continuous changes for better growth and development. If the rice plant faces any abnormal conditions at any stage, it will affect the overall growth, development, and ultimately grain yield. Thus, it is necessary to understand the growth stages, association, and strength between the agronomic parameters of different growth stages, which will help in improving genetic selection.
The purpose of this work was to study the association between the seedling and maturity parameters and the evaluation of genotypic variation through an improved mesocotyl elongation assay. These investigations could be used as screening criteria and selection of elite parental material for DS cultivars improvement.

2. Materials and Methods

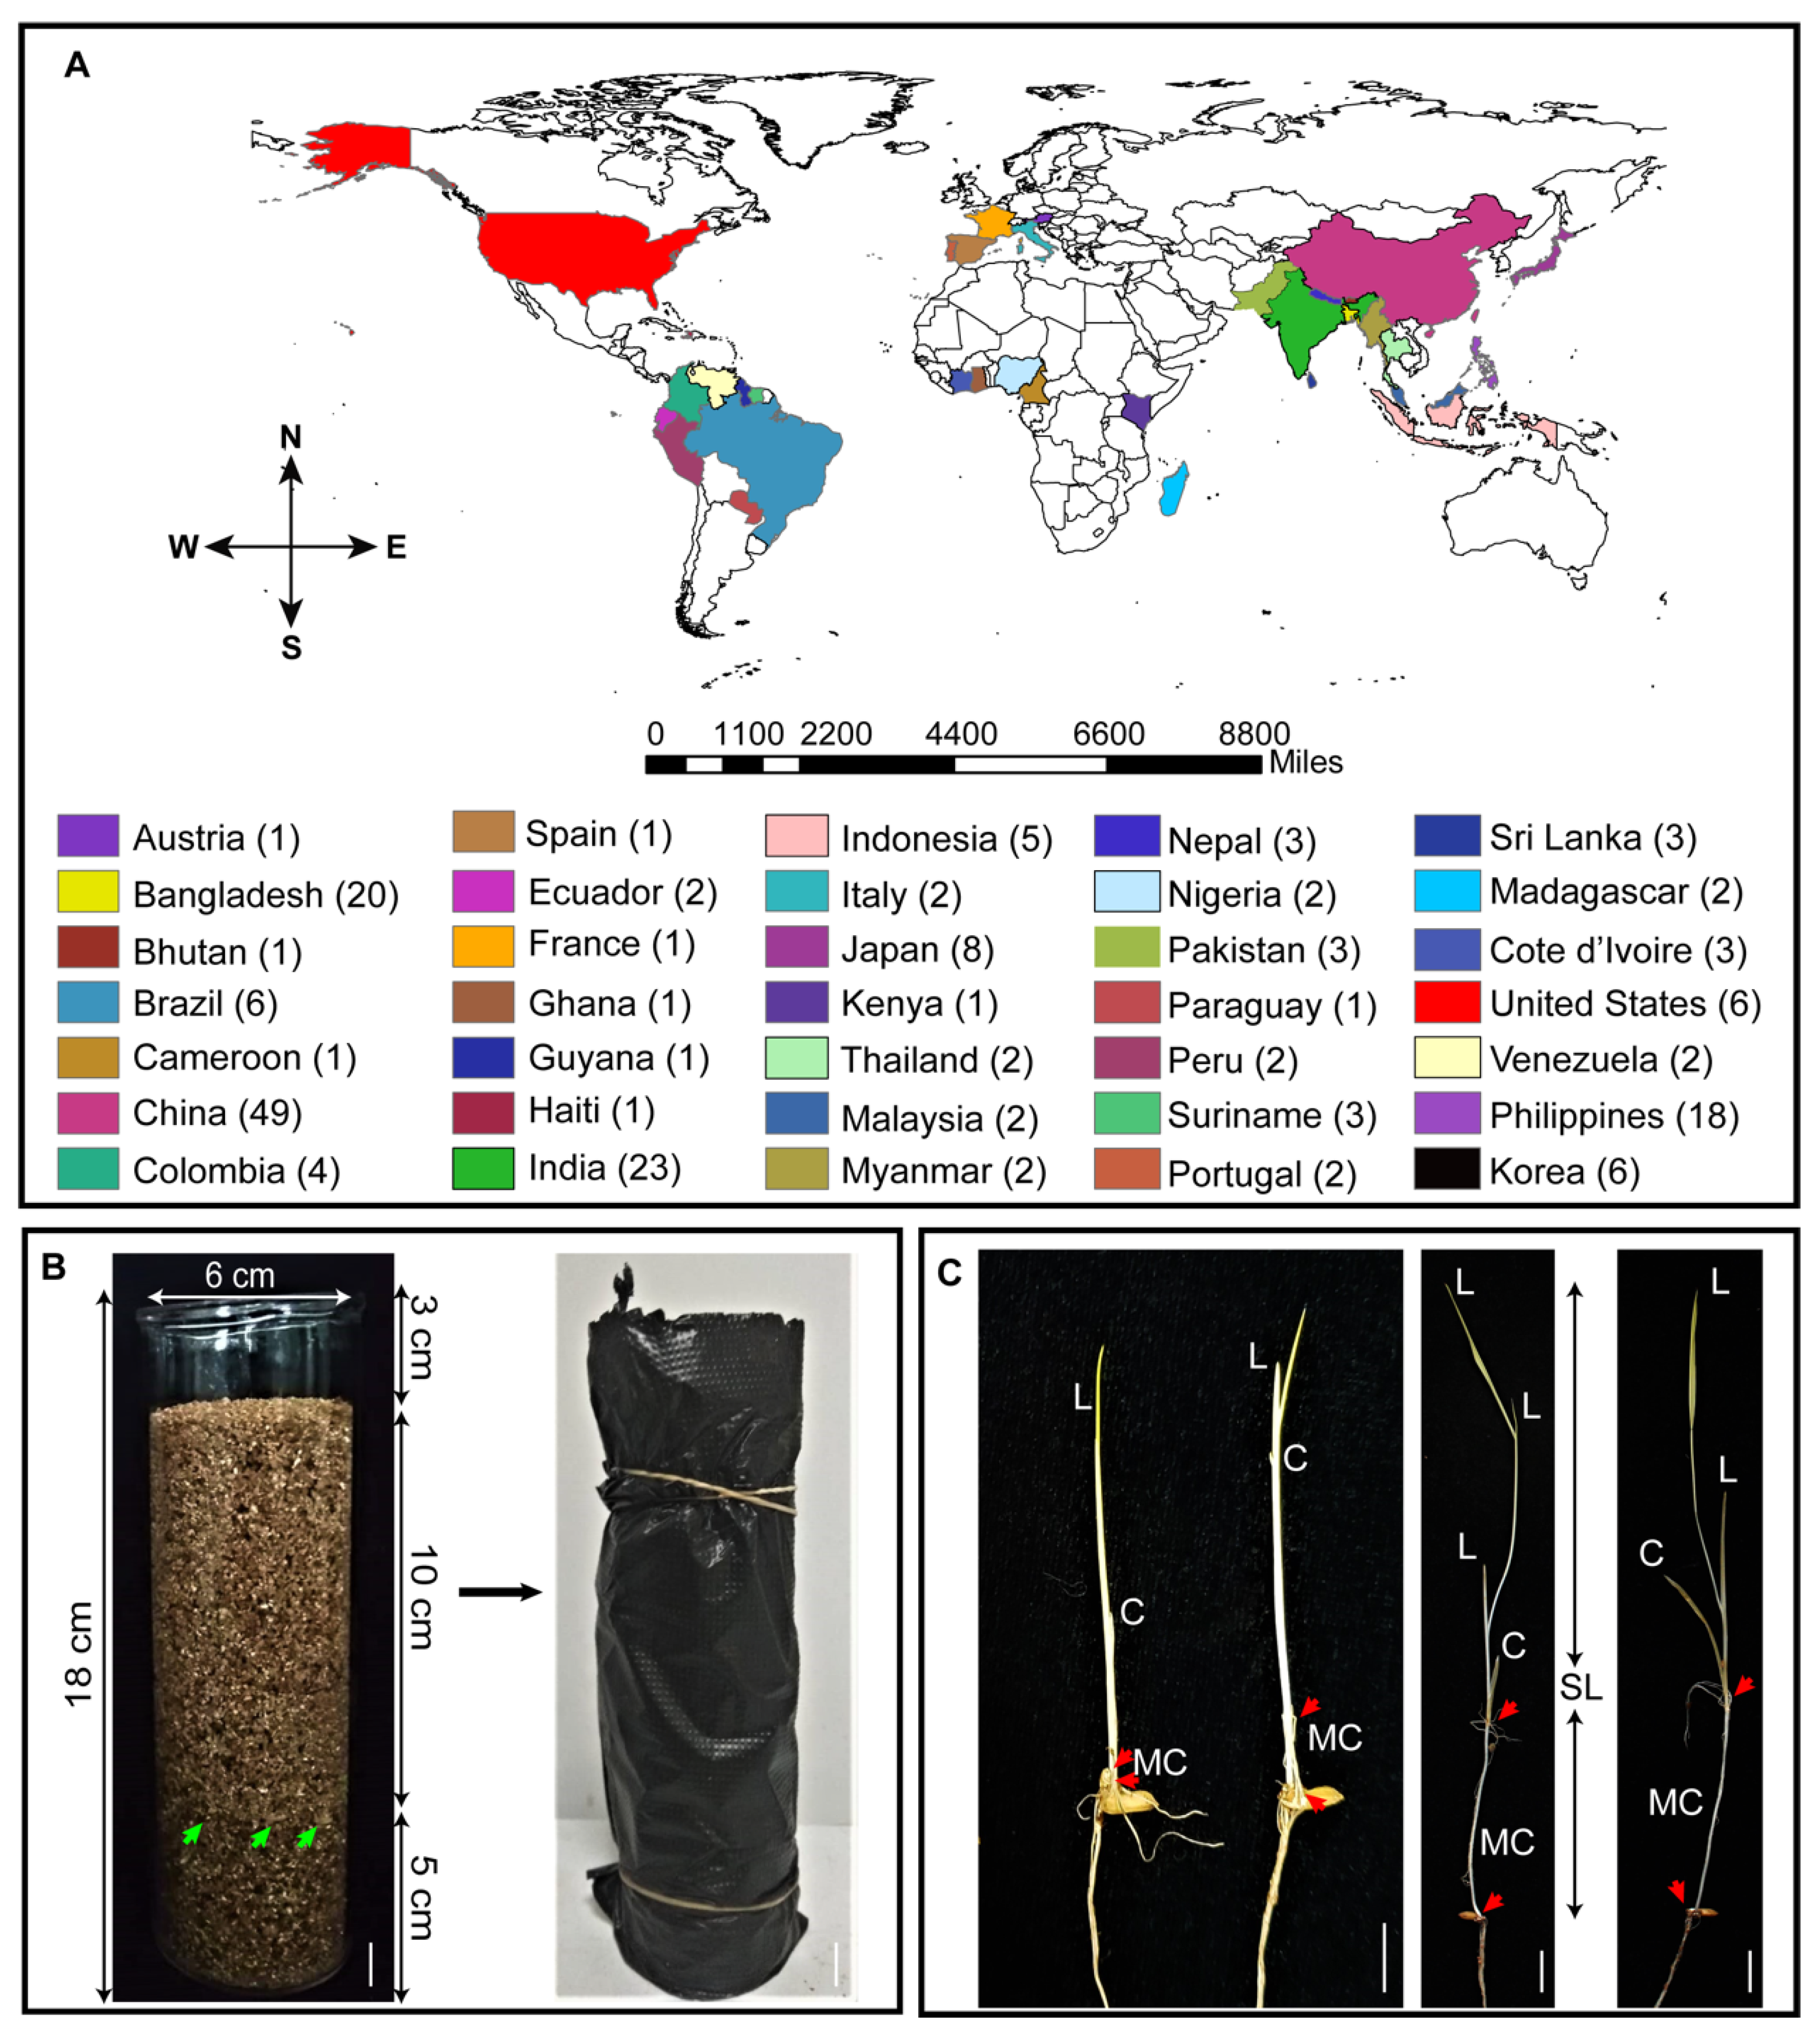
2.1. Experimental Procedure

A diverse panel of 190 rice accessions from the 3000 rice genomes project [36] was used in the present study. The panel contained rice accessions from 35 countries (Figure 1A). From these cultivars, 87 and 69 cultivars belong to Indica and Japonica groups, while 34 cultivars belong to Aus/Boro group. The names and origins of these cultivars are presented in Supplemental Table S1. Fifteen healthy seeds of each genotype were counted and sown 10 cm deep in vermiculite media in the dark at 28 °C by using an improved mesocotyl elongation assay as previously described by our group [22]. In detail, glass bottles of 6 cm in diameter and 18 cm in height were filled with vermiculite medium up to 5 cm, and 15 seeds were placed on it. Then, vermiculite media were added to make an overlayer of 10 cm, and 3 cm from the top was kept empty. An amount of 200 mL of ddH2O was added to each bottle and the pH of the ddH2O was adjusted with 1 M HCl and 1 M NaOH up to 5.8. Bottles were covered with black plastic bags and then placed in cardboard boxes (Figure 1B). These boxes were kept in a growth chamber in complete darkness for 10 days. The entire experiment was performed thrice.

2.2. Data Collection and Statistical Analysis

After 10 days of sowing, uniformly germinated seedlings were selected, and data for MC, C, and SL were recorded with the help of a ruler in centimeters (Figure 1C; Supplemental Table S1). The same cultivars were planted in the field and at the time of maturity, the number of Tillers (T) was counted per genotype [37]. Data for PL and related traits such as GL, GW, GL/WR, and TGWt and height-related characteristics such as CL and PH were obtained from a previously reported study [38] and Rice Functional Genomics & Breeding Database version 2.0. Available online: https://www.rmbreeding.cn/phenotype#ifr2 (accessed on 9 September 2021). Descriptive statistics were performed by using Microsoft Excel 2016 to summarize the data for each agronomic parameter across each group. One-way analysis of variance (ANOVA) and heritability (h2) were calculated by using IciMapping V4.2 (freely available from https://isbreeding.caas.cn/rj/index.htm accessed on 10 October 2021) [39]. Pearson’s correlation (r), principal component analysis (PCA), and visualization of data were carried out with the help of R 3.4.5. ArcGIS ESRI, Redlands, CA, USA (https://www.esri.com/en-us/arcgis/products/arcgis-desktop/resources accessed on 20 August 2021), was used for the visualization of the geographical distribution of the cultivars.

3. Results

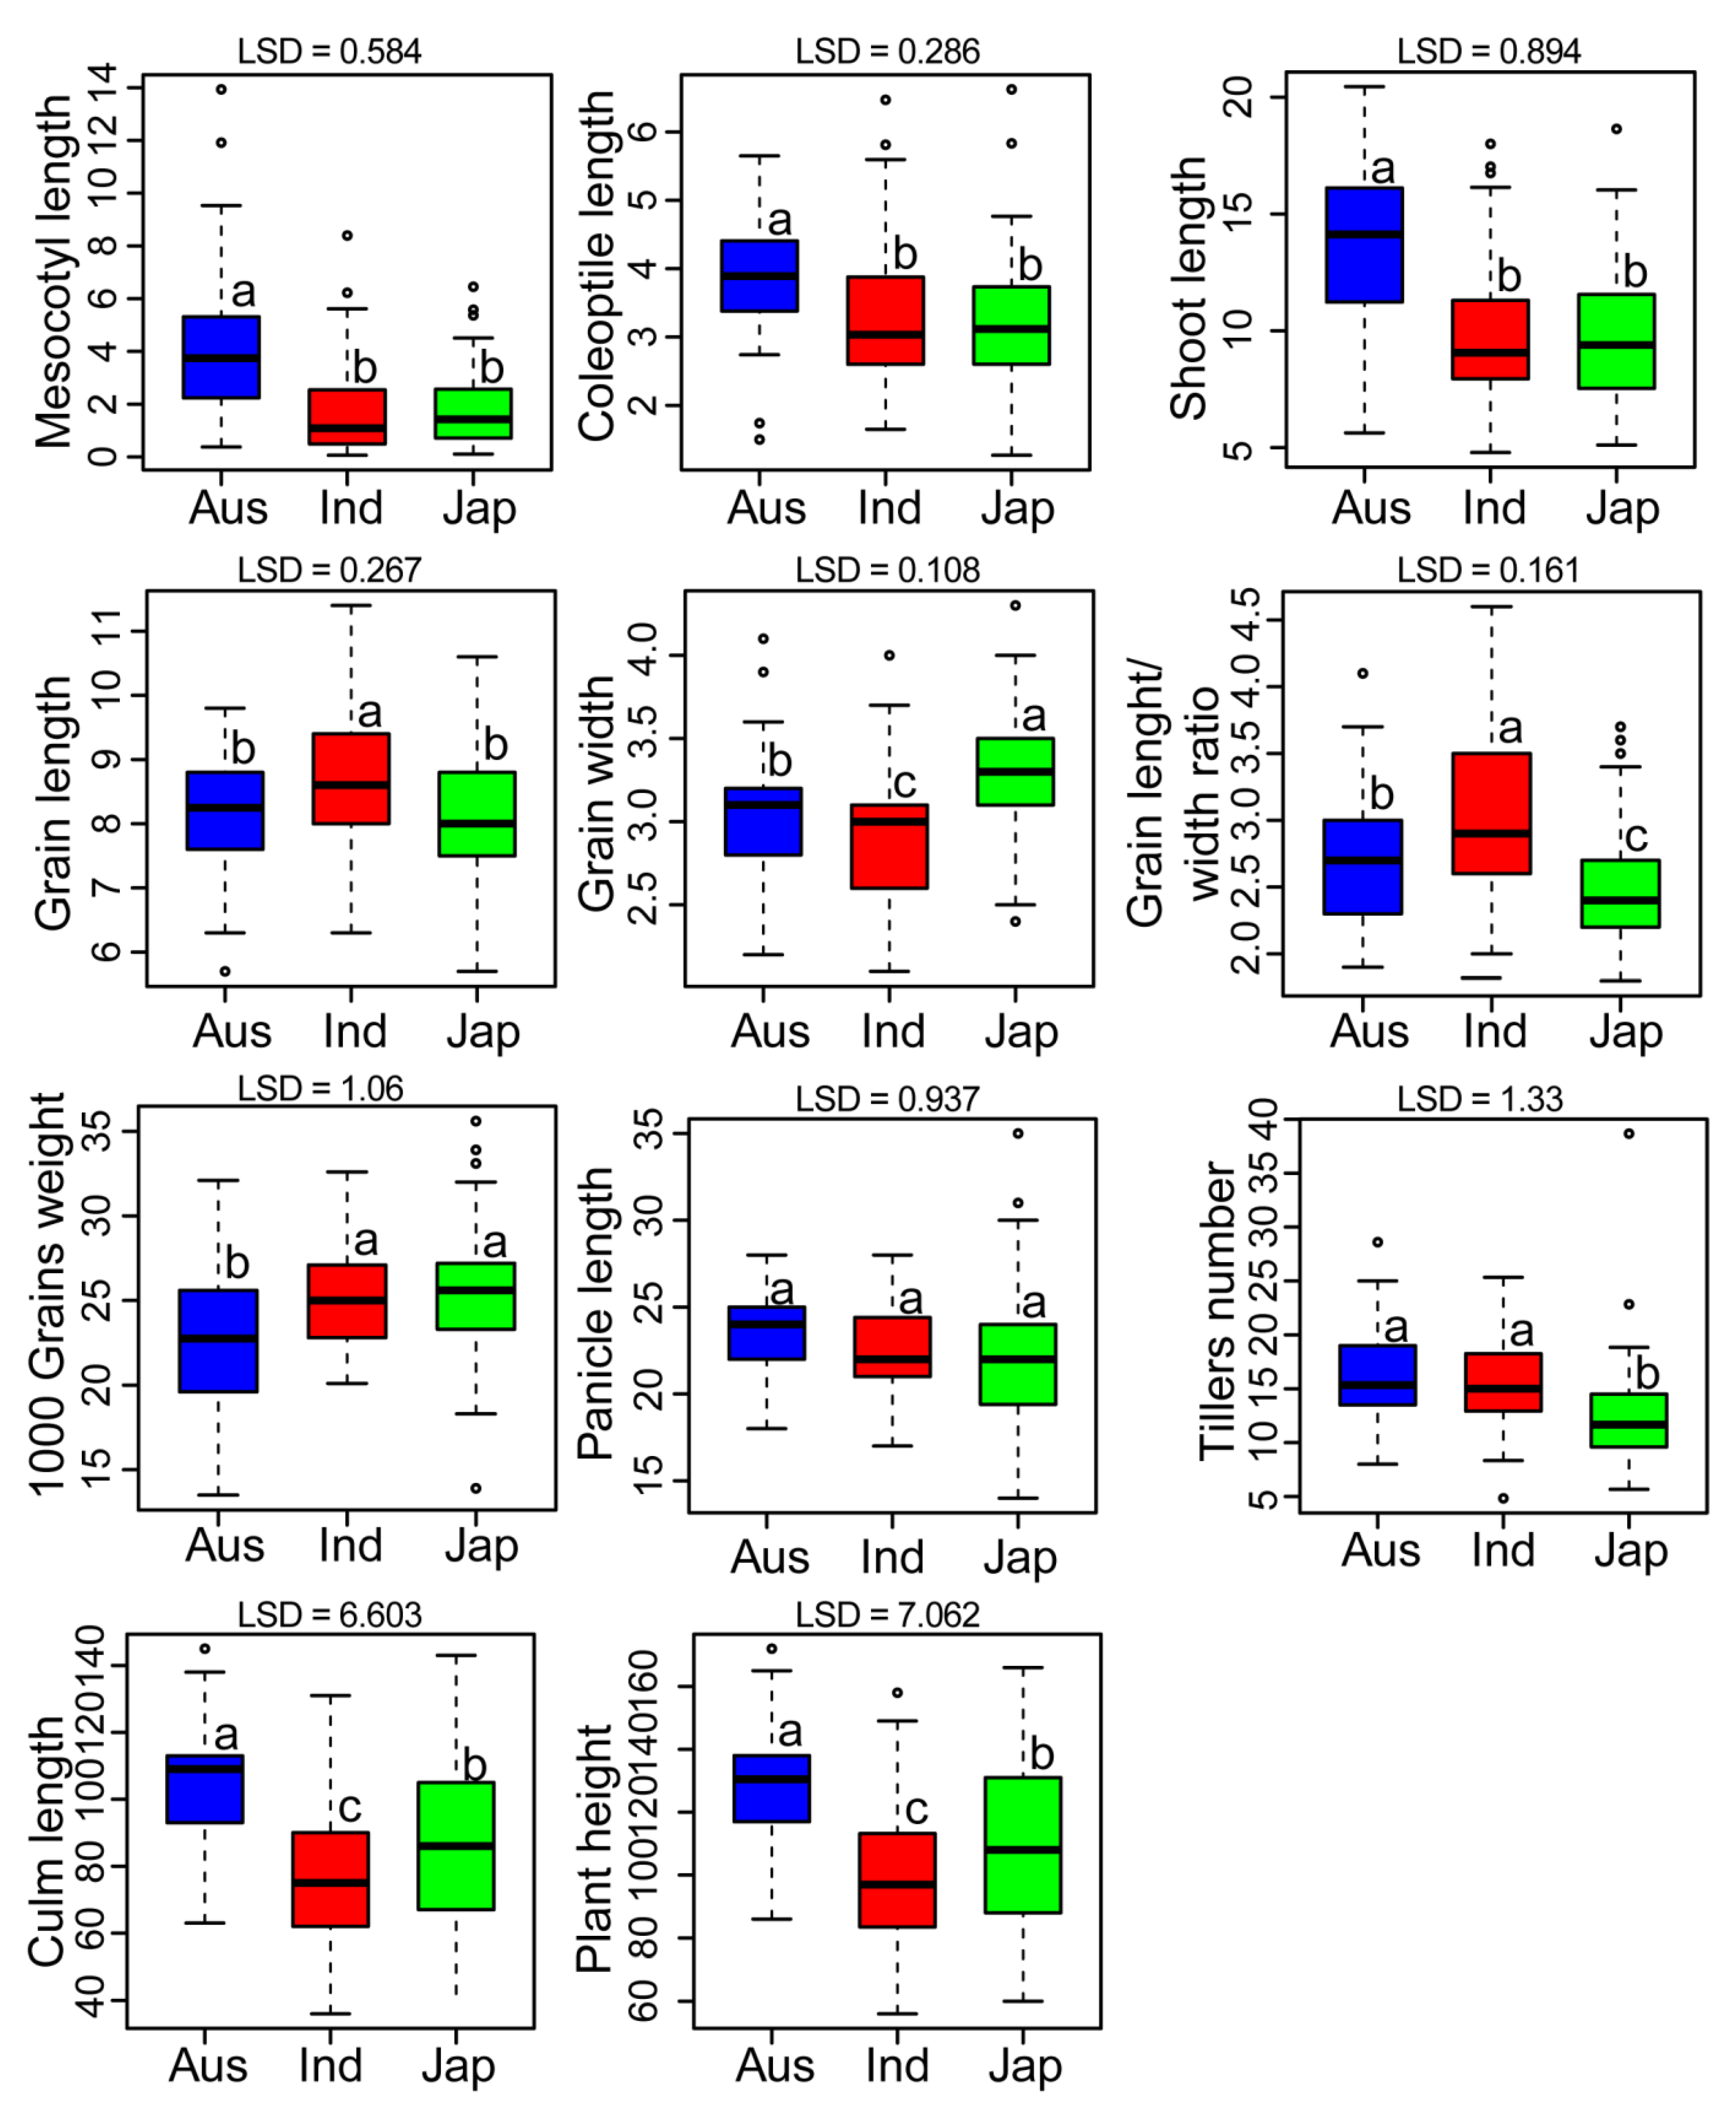
3.1. Mean Performance of Rice Groups and Analysis of Variance (ANOVA)

An improved mesocotyl elongation assay [22] was followed in the present study simply using ten-day-old seedlings to evaluate the pattern of variability for seedling emergence in 190 diverse rice cultivars and provided useful information at the early stage of plant development. ANOVA revealed that highly significant (p ≤ 0.001) differences exist among the cultivars for C, MC, SL, GW, GL/WR, and T, except TGWt (p ≤ 0.01) (Table 1). Groups (Ind, Jap, and Aus) varied significantly (p ≤ 0.01) for all traits. The mean for all traits under study was calculated in an entire population and then in separate groups to study the variation among cultivars and the groups. The values for C vary from 1.27 to 6.62 cm, with a mean of 3.34 cm. The Aus group has a significantly higher mean of 3.85 cm as compared with Indica and Japonica groups (Table 1 and Figure 2). The values for MC vary from 0.06 to 13.93 cm, with an overall mean of 2.24 cm. For MC, the Aus group also showed a significantly higher mean of 4.17 cm, while the Indica (1.79 cm) and Japonica (1.85 cm) had lower MC means (Table 1 and Figure 2). In this population, SL ranged from 4.79 to 20.45 cm, with a mean of 10.51 cm (Table 1). Maximum SL was recorded in the Aus group with a mean of 13.64 cm (Table 1 and Figure 2).
Grain-related traits (GL, GW, GL/WR, TGWt, and PL) played essential roles in improving the overall yield [40,41,42]. GL ranged from 5.7 to 11.4 mm, with a mean of 8.41 mm (Table 1). For GL, Indica group showed a significantly higher mean (8.69 mm) compared to the Aus and Japonica groups (Figure 2). Similarly, GW changed significantly (p < 0.05) among the groups and ranged from 2.1 to 4.3 mm, with a mean of 3.08 mm. The Japonica group had the highest GW (3.31 mm), and the Indica group had the lowest (2.90 mm). The mean values of GL/WR ranged from 1.8 to 4.6 with a combined mean of 2.8 (Table 1). The Indica group showed the significantly highest mean (3.07). TGWt ranged from 13.5 to 35.6 g, with a mean of 24.8 g (Table 1). A significant variation among the groups was found, and the Japonica group had the highest (25.53 g) TGWt compared to Indica (25.10 g) and Aus (22.53 g). In the studied population, PL ranged from 14 to 35 cm with a mean of 22.66 cm. The Aus group had the highest PL (23.44 cm) followed by Indica (22.52 cm) and Japonica (22.46 cm) groups (Figure 2). Similarly, T ranged from 4.83 to 38.66, with a mean of 14.63 (Table 1). The highest mean for T was observed in Aus (15.95) followed by Indica (15.79) and Japonica (12.52) groups. In grasses, culm is composed of nodes and internodes. These are not an actual stem but help in the standing of the crop. CL changed non-significantly from 36 to 145 cm, with a mean of 85.77 cm (Table 1). Among the groups, Aus (105.29 cm) showed the highest CL, followed by Japonica (86.14 cm). The lowest mean for CL was observed in Indica (77.86 cm) group (Figure 2). The plant height of the rice crop is mainly dependent on CL and PL [43,44]. We observed non-significant variations in rice cultivars for PH, which ranged from 56 to 172 cm with a mean of 108.44 cm (Table 1). The Aus group has a higher mean of 128.74 cm compared with Japonica (108.61 cm) and Indica (100.39 cm) groups (Table 1 and Figure 2).

3.2. Estimation of Heritability in 190 Rice Cultivars

Heritability is an important selection parameter because it provides necessary information related to the transfer of a trait from parents to the next generation and guides the breeder to select a plant trait that is highly heritable as compared with a less heritable trait. Heritability was calculated for C, MC, and SL. High broad-sense heritability values related to C (99%), MC (97%), and SL (98%) were obtained (Table 1), which indicate that the presence of reasonable variation. These results were consistent with previous studies [45,46]. Heritability for the rest of the traits was not calculated due to the unavailability of replicated data.

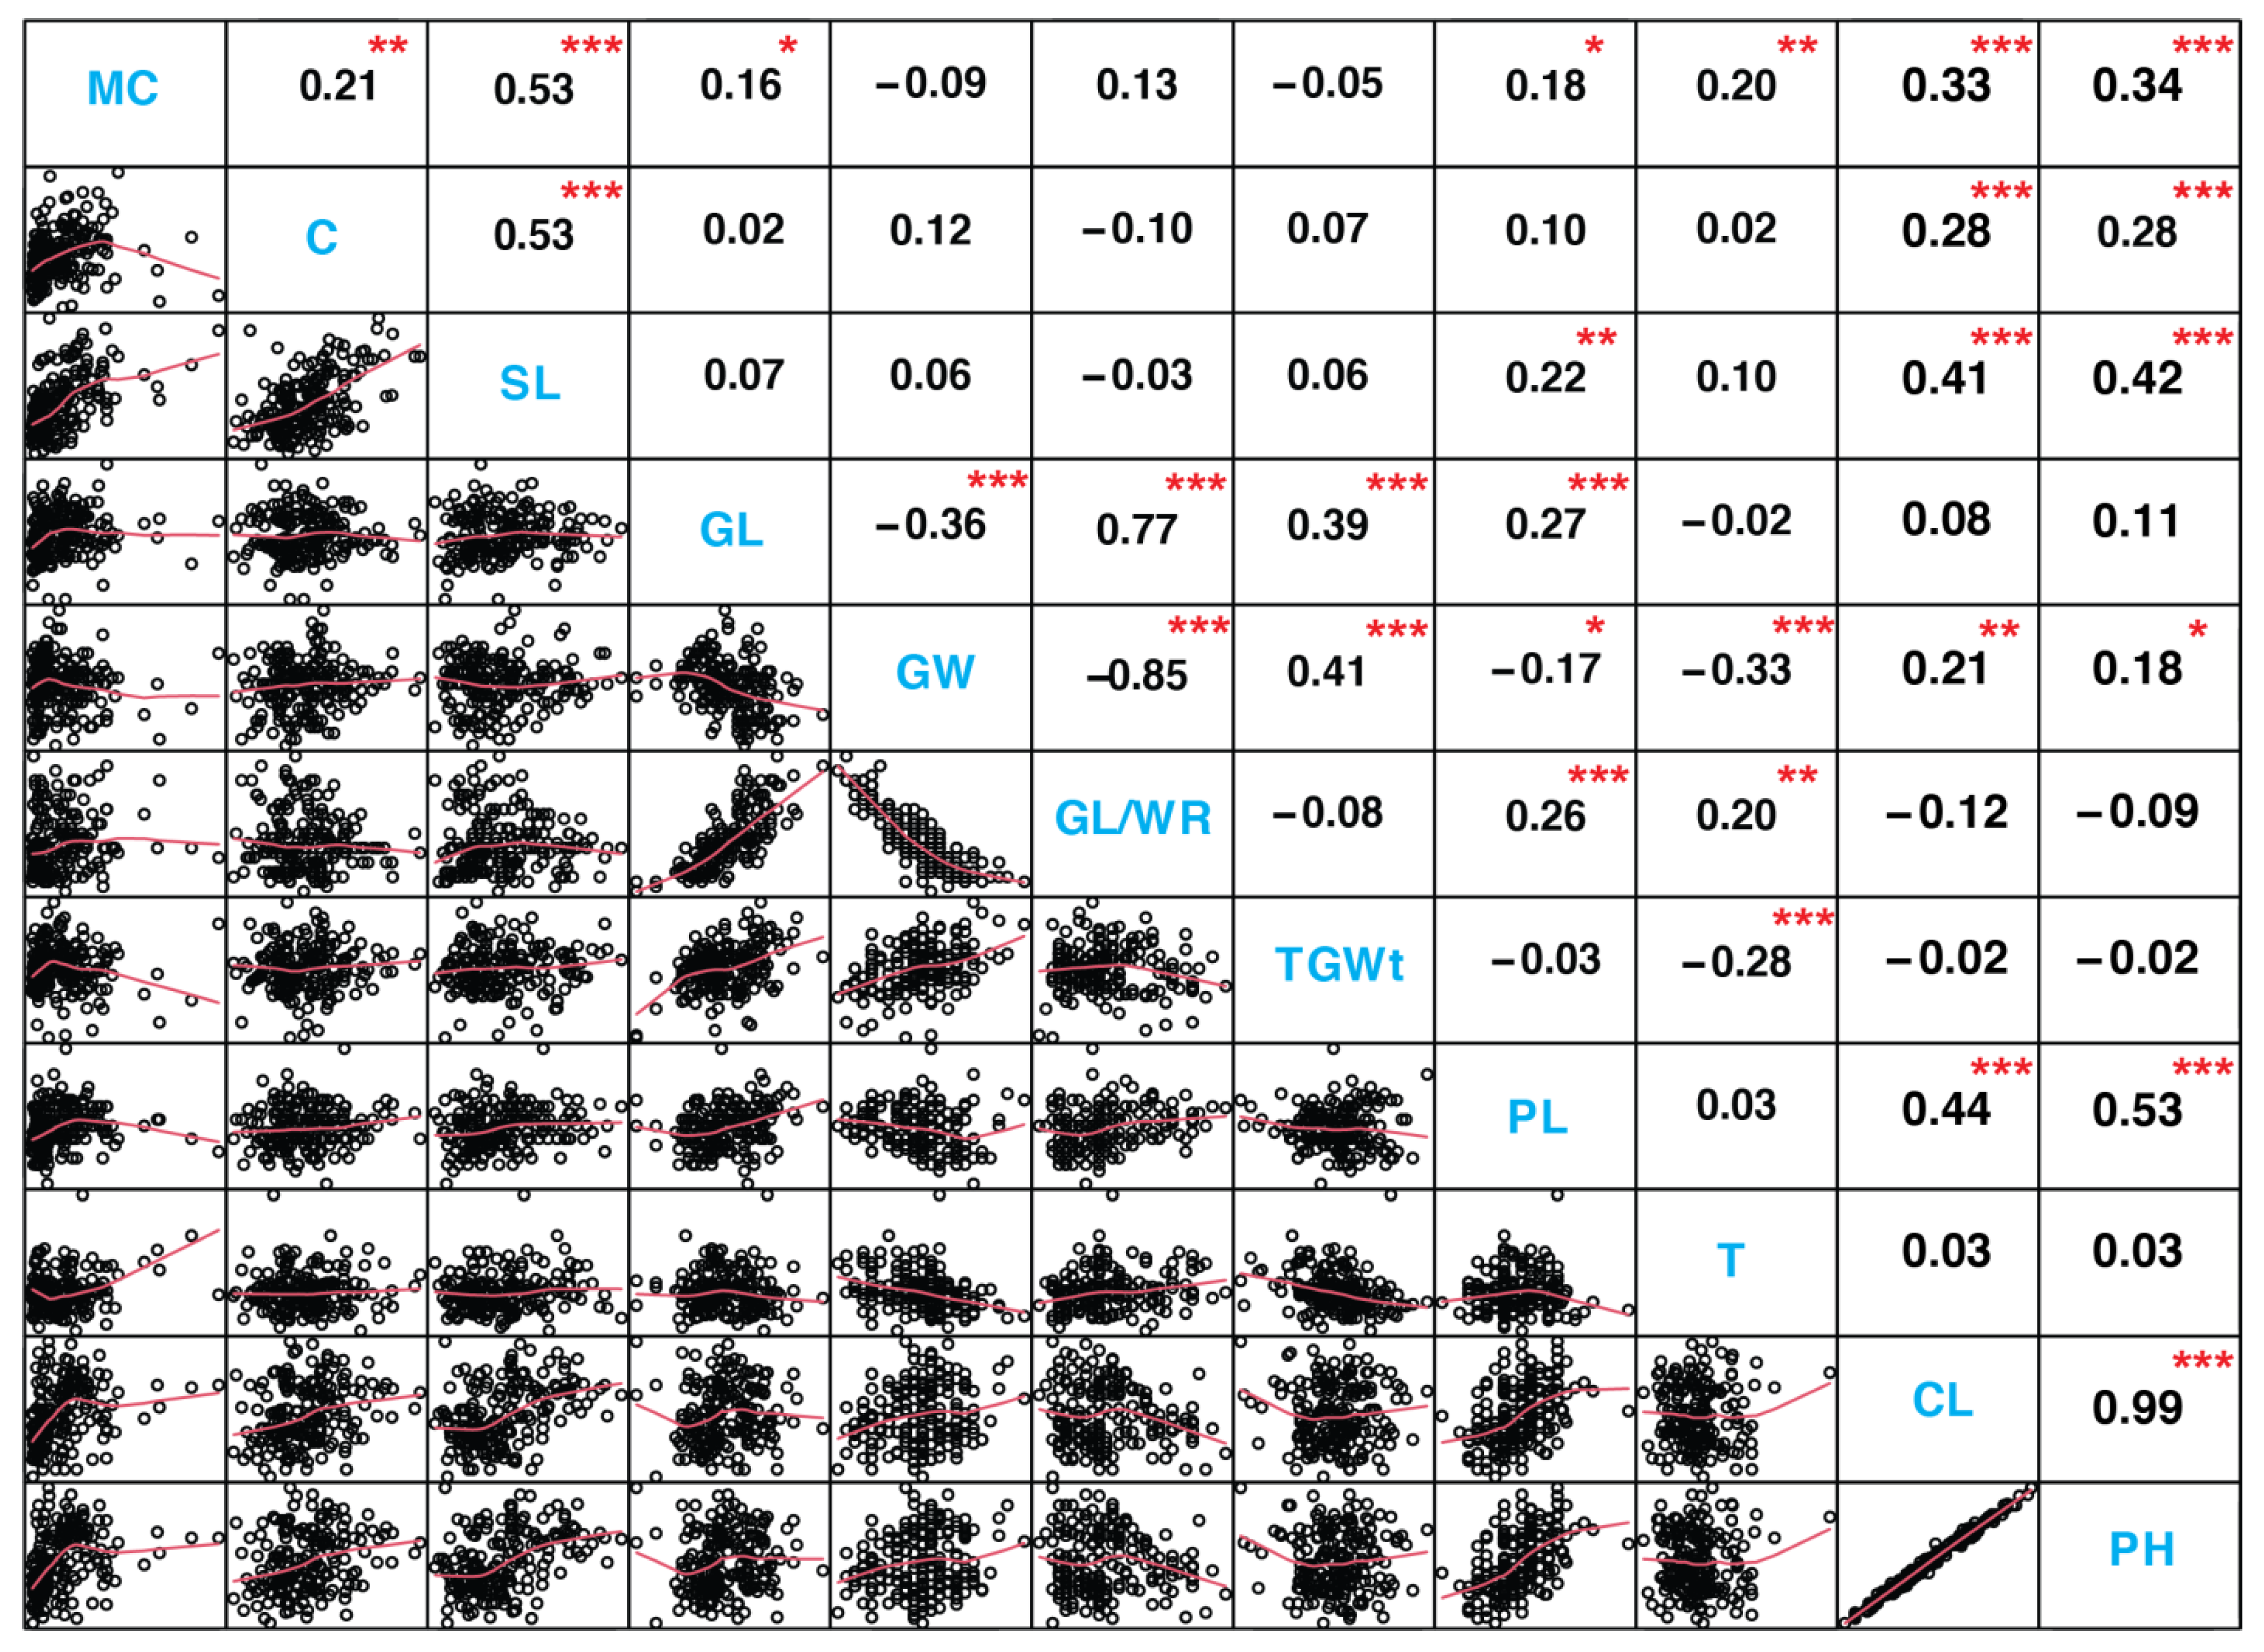
3.3. Relationship between and among the Seedlings and Maturity Traits

Pearson’s correlation analysis was conducted to study the association among seedling and maturity-related traits (Figure 3). Seedling-related traits MC and C played a significant role in seedling emergence. Results indicate that they showed highly significant and positive correlation with SL (r = 0.53 *** and r = 0.53 ***, respectively) and showing the scope of simultaneous improvement of these parameters [17]. SL showed positive and highly significant association with PL, CL, and PH (r = 0.22 **, 0.41 ***, and 0.42 ***, respectively) (Figure 3). PH exhibited a highly positive correlation with all parameters except GL/WR and TGWt. Seedling parameters such as SL (r = 0.42 ***), MC (r = 0.34 ***), and C (r = 0.28 ***) and maturity parameters CL (r = 0.99 ***) and PL (r = 0.53 ***) showed highest positive correlations with PH (Figure 3). While, GW had a lowest positive but significant (r = 0.18 *) correlation with PH. The parameters studied at seedling stage showed highly significant association among themselves and proved a strong relation with maturity-related traits. These findings elaborated that those seedlings of greater vigor could perform better at later stages.

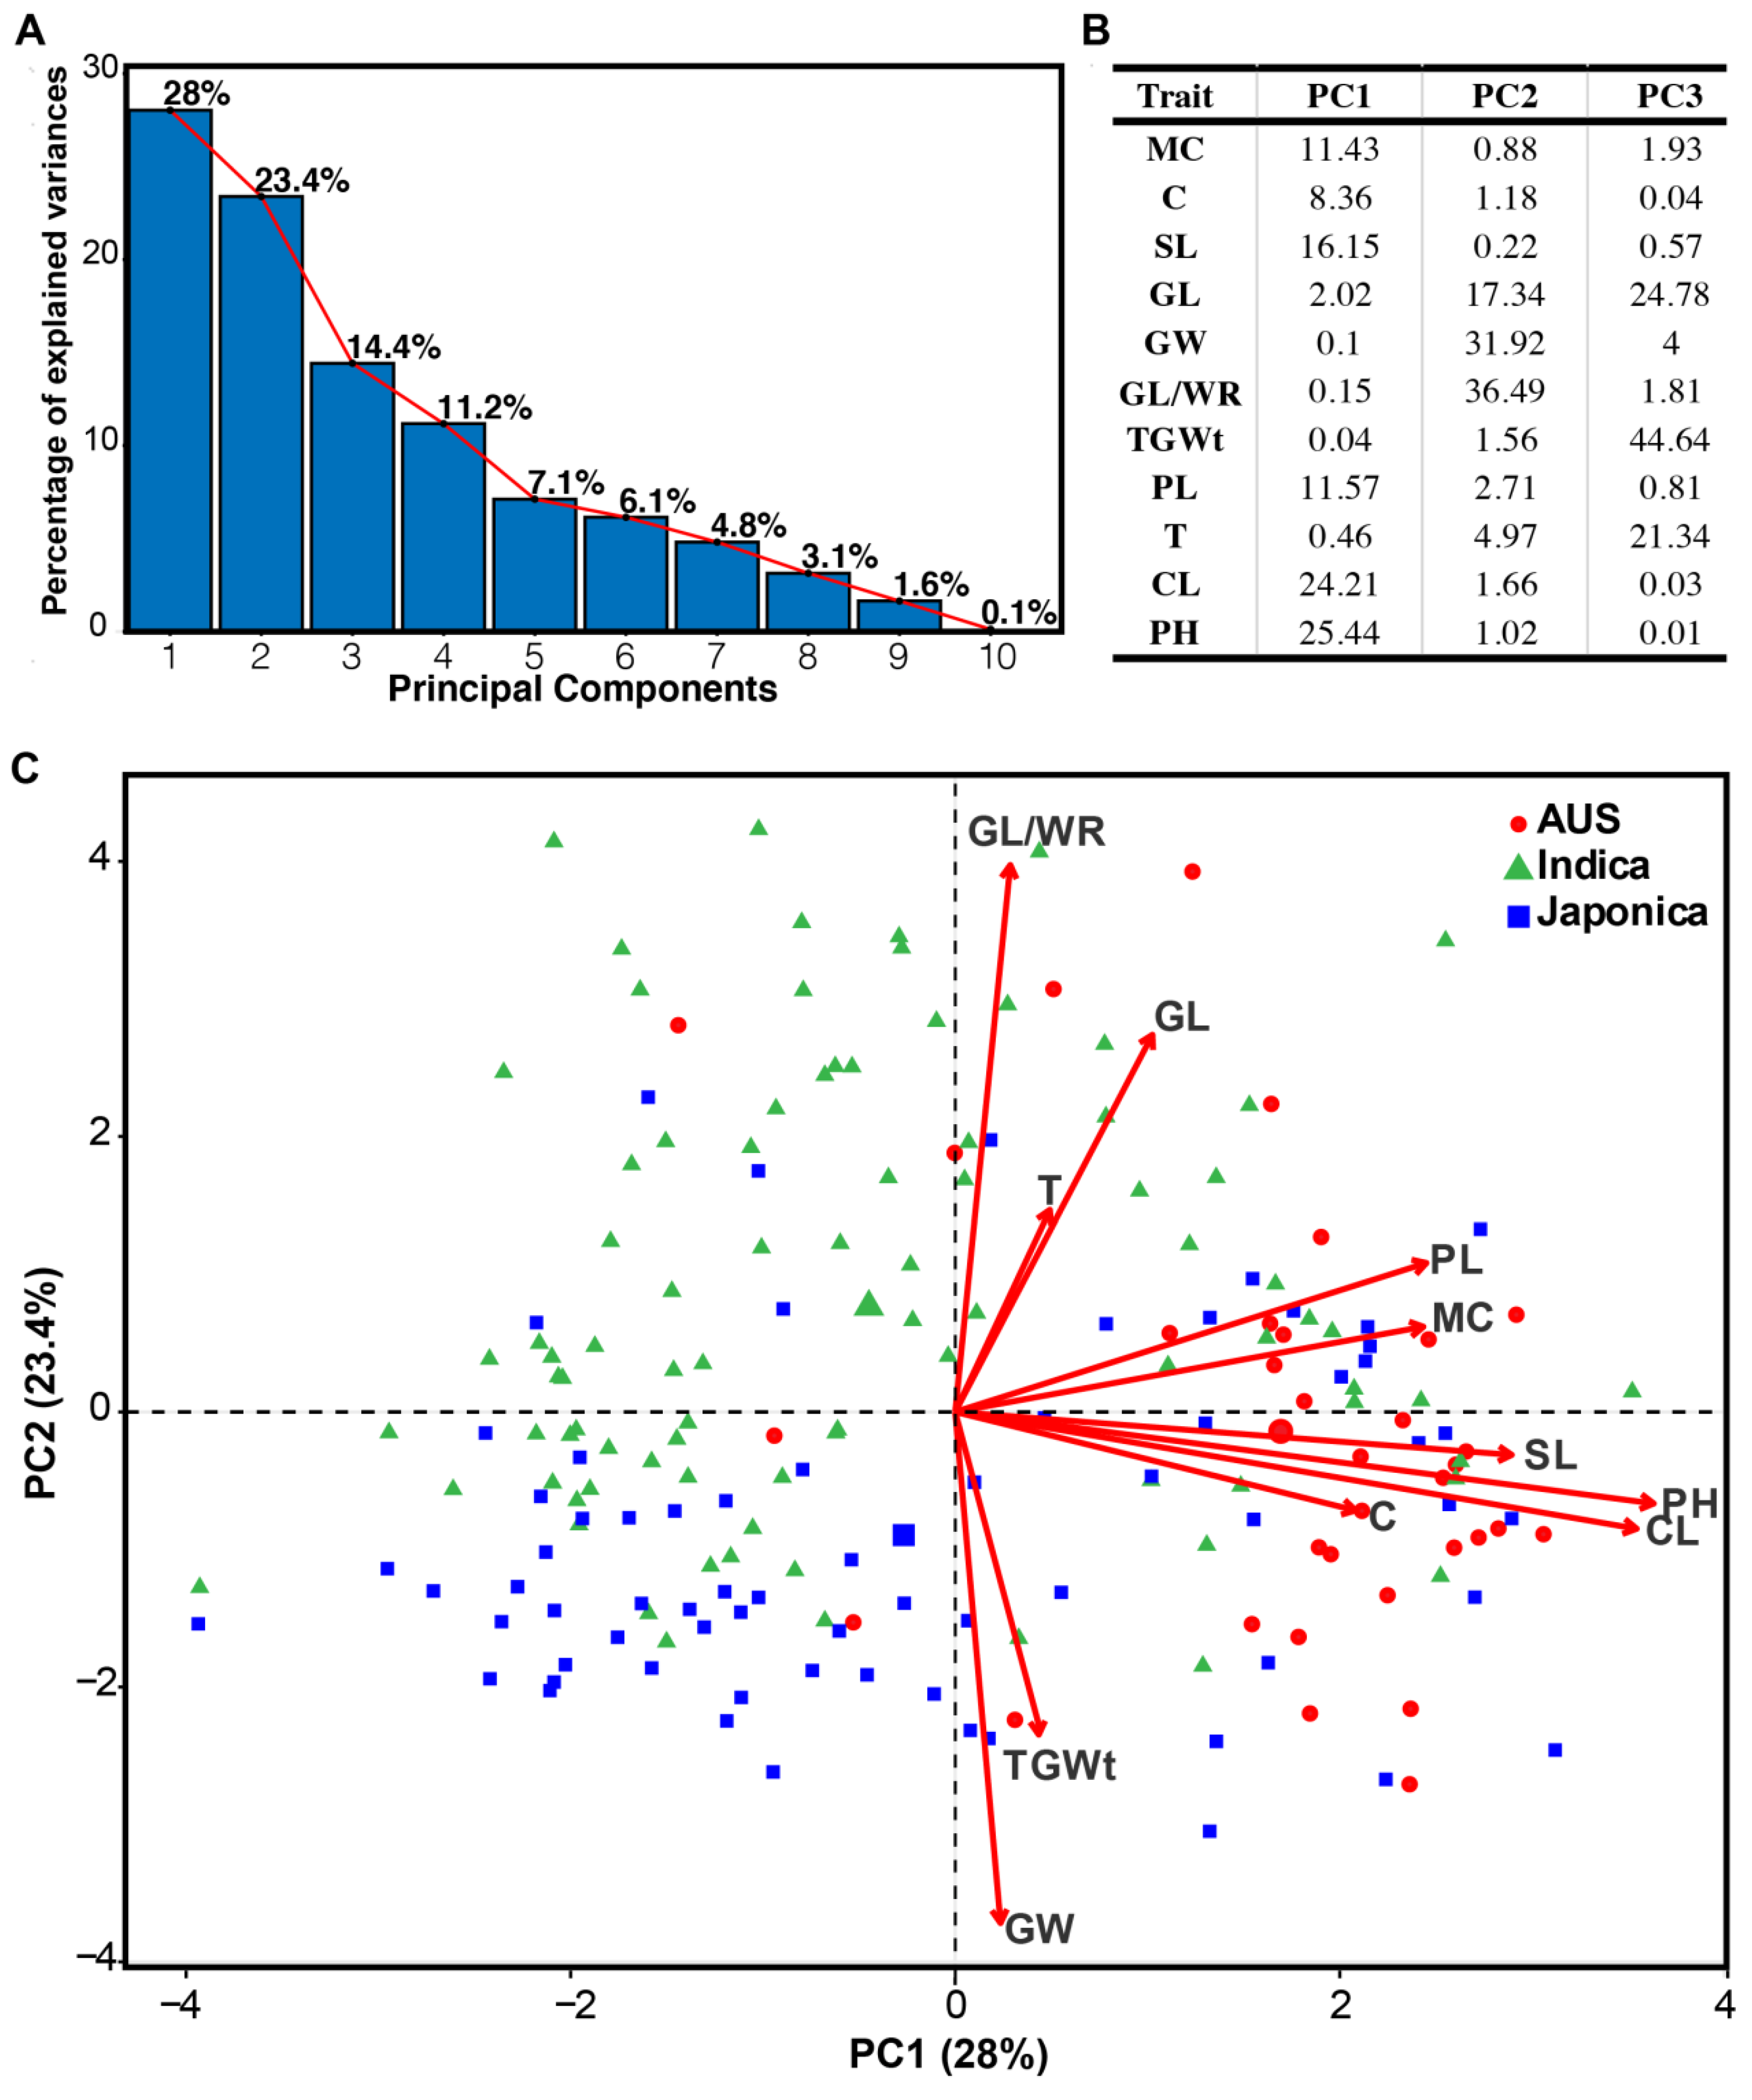
3.4. Principal Components Analysis (PCA)

A principal component analysis (PCA) was performed to analyze the variations and associations of agronomic parameters among the 190 cultivars of different groups originated from different countries of the world. Rice cultivars were scattered in biplots by groups, with agronomic parameters shown as vectors (Figure 4). The first three PCs accounted for 65.8% of the total variability (Figure 4A). Variation in PC1 is mainly attributed to PH, CL, SL, C, MC, and PL for which the eigenvalues are 25.44%, 24.21%, 16.15%, 8.36%, 11.43%, and 11.57%, respectively. While variation is attributed by GL/WR (36.49%), GW (31.92%), and GL (17.34%) (Figure 4B) in the PC2. PC3 was highly related to TGWt (44.64%), GL (24.78%), and T (21.34%) (Figure 4B). Moreover, Indica and Japonica cultivars were more diverse compared with the Aus group (Figure 4C) [47]. This conserveness might be related to a higher seedling emergence of Aus cultivars.

3.5. Estimation of Diversity

Different kinds of analytical analysis are available for the estimation of diversity among the cultivars. In this study, Hierarchical Cluster Analysis (HCA) and Constellation Plot Analysis (CPA) were used to estimate diversity among the rice cultivars (Figure 5). Such analysis provides a better distribution of cultivars under the different environments as well as different groups of cultivars in the same environment. Results indicated that the rice cultivars distributed into three (Aus, Ind and Jap) distinct classification groups and each group further divided into two sub-groups. Group 1 (Aus) showed the highest values for most of the traits such as C, MC, SL, PL, T, CL, and PH. Among these groups, Group 2 (Japonica) performed poorly for all traits except GW and TGWt. Similarly, the third group (Indica) performed better for GL and GL/WR (Figure 5A). The Constellation Plot also indicates that the cultivars distributed into three groups (Figure 5B).

4. Discussion

Previous studies have reported the conventional rice production system (TPR) and explained the performance of rice cultivars at seedling stages as well as at maturity stages separately. The TPR system is no more cost-effective and less profitable. Farmers are now shifting from TPR toward the DS method. A depth of 2–3 cm is recommended for japonica rice, while seedling emergence delayed under the depth of >3 cm [48,49]. In the past decade, efforts were made to explore the genetic variations and some QTLs and genes related to mesocotyl and coleoptile were cloned, but no one explained the role of seedling parameters in seedling emergence and germination, which leads to better crop establishment or production [26]. For deep-sowing tolerance, coleoptile and mesocotyl elongation were thought to be main traits for seedling emergence from deep soil and were studied extensively for understanding QTLs and the genes governing them. In this study, the performance of 190 cultivars comprising three rice groups were evaluated by using an improved mesocotyl elongation assay to explore genetic variation for important seedling traits. This new method is very sophisticated, time- and resource-saving, and required less labor. Variance analysis (Table 1) showed significant effects due to cultivars [48]. Seedling vigor is very important for the better establishment of seedlings [50]. Coleoptile and mesocotyl play important roles in the emergence of DS seedlings from deep soils, and their elongation is controlled by many genetic and environmental factors [20]. Their elongation shows significant variations across rice groups. In this study, Aus cultivars showed longer C, MC, and SL compared with Ind and Jap cultivars (Table 1).
The yield of any crop is a complex trait, which appears from multiplicative interactions of many other parameters that are termed as yield components. Yield is directly or indirectly dependent on the overall net effect produced by various yield-related parameters. Therefore, the identification of yield-related traits is very important for developing efficient breeding strategies for evolving high-yielding varieties. For the improvement of grain yield, it is necessary to improve PL because the architecture of panicle including length determined the overall yield [40,42]. To harvest more grains per panicle, cultivars with larger panicle are required. The Aus group showed longer PL compared with Indica and Japonica groups. The seed length and width determined the overall weight of the grain [41]. In this study, the Japonica group shows higher GW followed by Aus, while the Indica group showed higher GL followed by Aus. Greater seed width may contribute to high TGWt and, thus, higher yield. TGWt is a quantitative trait and depends on three dimensional grain thickness, length, and width [51]. Similarly, the Japonica group showed higher TGWt. The number of fertile tillers helped in the determination of overall crop yield by increasing the number of panicles per plant. In DS plants, it showed faster growth rates and tillering ability compared with TPR [15,52]. The Aus group showed higher number of tillers followed by Indica and Japonica.
In a breeding program, for improving any trait, it is necessary to obtain knowledge about the inter-relationship with other traits. The knowledge of the relative importance of different plant traits can be of value in a crop breeding program [53,54]. Vigorous seedlings are an important indicator of the yield of a plant in a short period of time [55]. We found a strong relationship between seedlings traits C, MC, and SL (Figure 3). Only cultivars that were able to elongate their C, MC, and SL emerged in deep sowing [48,49]. For the development of lodging-resistant cultivars, PH and CL are the main agronomic parameters to be considered. In this study, all seedling parameters (MC, C, and SL) showed highly significant associations with CL. CL had positive correlation with PH (r = 0.99). Previously, it has been reported that the genes controlling PH also linked with genes of MC and C [56]. It is very important to study the genetic basis for the positive correlation between C, MC, and PH. There are two possibilities: (1) tight linkage between genes controlling C, MC, and PH; (2) pleiotropism in which one gene controls more than one trait. During the green revolution of rice breeding, semi-dwarfism (a plant with 50–100% height of the wild type) has been the favorable trait to increase lodging resistance under high rates of N fertilizer [57,58]. Lodging resistance can be achieved through the optimal size of the internodes [59], while Islam et al. 2007 [60] also showed that plant height is not a primary source of lodging. In the case of tight linkage, a large segregating population was needed to break down the linkage between them to select individuals having both semi-dwarfism and long MC. In the case of pleiotropism, screening a favorable allele of the target gene from a large collection of rice germplasm that has mild effects on both MC and PH is recommended [23,52].
PCA (Principal Component Analysis) and PLS-DA (Partial Least Squares-Discriminant Analysis) forms of clustering methods are often employed to explore variations within the samples of different groups and to find out the main parameters [61,62,63]. In this study, PCA on 11 agronomic parameters revealed that PC1, PC2, and PC3 capture 65.8% of variations that primarily impacted seedling and plant height; thus, these PCs are an indicator for SL and PH. PC1 represents that the traits of seedling height and could be useful for selecting cultivars with more extended height. Increasing PH is an effective method of increasing yield [64,65]. Among the rice cultivars groups, the Aus group stood out in PC1 with their higher seedling and plant height. The diverse cultivars (group) recognized here will be helpful in planning crosses for rice seedling emergence and the better establishment of seedlings.

5. Conclusions

In the present study, the significant variations were observed in seedling and maturity parameters. Among three rice groups, the higher values for seedling (C, MC, and SL) and maturity (PL, T, CL, and PH)-related parameters were observed in Aus cultivars. The cultivars of Indica and Japonica group showed higher levels of GL, GL/WR, GW, and TGWt, respectively. To improve seedling emergence in DS rice, cultivars with higher seedlings traits (such as Aus) can be used as parental lines in the breeding program. Furthermore, a significant association was found among C, MC, SL, CL, and PH, which will be helpful in the selection and utilization of the cultivars for not only better seedling establishment but also improved lodging resistance and high yield.

Supplementary Materials

The following supporting information can be downloaded at: https://www.mdpi.com/article/10.3390/agronomy12040975/s1, Table S1: 190 rice cultivars used in this study, their origin and variety group, and data of seedling-related traits.

Author Contributions

Conceptualization, M.U. and X.L.; data curation, S.B.P., A.K. and H.M.; funding acquisition, X.L.; investigation, M.U., S.B.P., H.Z., A.K., H.M., S.A.Z., Y.C., J.F., J.Z. and M.R.K.; methodology, S.B.P.; resources, S.Y.; supervision, X.L.; writing—original draft, M.U.; writing—review and editing, S.B.P. and X.L. All authors have read and agreed to the published version of the manuscript.

Funding

This research was funded by the Agricultural Variety Improvement Project of Shandong Province, China (grant number 2021LZGC020), and the Agricultural Science and Technology Innovation Program of Chinese Academy of Agricultural Sciences.

Institutional Review Board Statement

Not applicable.

Informed Consent Statement

Not Applicable.

Data Availability Statement

All data related to this study are presented in the main text and Supplementary Materials.

Acknowledgments

We thank the China Scholarship Council (CSC) for providing full scholarship to Muhammad Uzair, Suyash B. Patil, Syed Adeel Zafar, Ashmit Kumar, and Humphrey Mkumbwa for their PhD and Master’s degrees, respectively. We thank Zhikang Li from the Institute of Crop Sciences, Chinese Academy of Agricultural Sciences (ICS, CAAS), for providing rice cultivars. We are grateful to Muhammad Azam and Mohsin Ali, at ICS, CAAS, for help in statistical analysis.

Conflicts of Interest

The authors declare no conflict of interest. The funders had no role in the design of the study; in the collection, analyses, or interpretation of data; in the writing of the manuscript; or in the decision to publish the results.

References

  1. Li, R.; Li, M.; Ashraf, U.; Liu, S.; Zhang, J. Exploring the Relationships between Yield and Yield-Related Traits for Rice Varieties Released in China from 1978 to 2017. Front. Plant Sci. 2019, 10, 00543. [Google Scholar] [CrossRef] [PubMed] [Green Version]
  2. Lu, B.R.; Cai, X.X.; Jin, X. Efficient indica and japonica rice identification based on the InDel molecular method: Its implication in rice breeding and evolutionary research. Prog. Nat. Sci.-Mater. 2009, 19, 1241–1252. [Google Scholar] [CrossRef]
  3. Vaughan, D.A.; Lu, B.R.; Tomooka, N. The evolving story of rice evolution. Plant Sci. 2008, 174, 394–408. [Google Scholar] [CrossRef]
  4. Yang, Y.; Zhu, K.; Xia, H.; Chen, L.; Chen, K. Comparative proteomic analysis of indica and japonica rice varieties. Genet. Mol. Biol. 2014, 37, 652–661. [Google Scholar] [CrossRef]
  5. Choi, J.Y.; Platts, A.E.; Fuller, D.Q.; Hsing, Y.I.; Wing, R.A.; Purugganan, M.D. The Rice Paradox: Multiple Origins but Single Domestication in Asian Rice. Mol. Biol. Evol. 2017, 34, 969–979. [Google Scholar] [CrossRef] [Green Version]
  6. Civan, P.; Ali, S.; Batista-Navarro, R.; Drosou, K.; Ihejieto, C.; Chakraborty, D.; Ray, A.; Gladieux, P.; Brown, T.A. Origin of the Aromatic Group of Cultivated Rice (Oryza sativa L.) Traced to the Indian Subcontinent. Genome Biol. Evol. 2019, 11, 832–843. [Google Scholar] [CrossRef] [Green Version]
  7. McNally, K.L.; Childs, K.L.; Bohnert, R.; Davidson, R.M.; Zhao, K.; Ulat, V.J.; Zeller, G.; Clark, R.M.; Hoen, D.R.; Bureau, T.E. Genomewide SNP variation reveals relationships among landraces and modern varieties of rice. Proc. Natl. Acad. Sci. USA 2009, 106, 12273–12278. [Google Scholar] [CrossRef] [Green Version]
  8. Li, X.; Lawas, L.M.; Malo, R.; Glaubitz, U.; Erban, A.; Mauleon, R.; Heuer, S.; Zuther, E.; Kopka, J.; Hincha, D.K. Metabolic and transcriptomic signatures of rice floral organs reveal sugar starvation as a factor in reproductive failure under heat and drought stress. Plant Cell Environ. 2015, 38, 2171–2192. [Google Scholar] [CrossRef]
  9. Xu, K.; Xu, X.; Fukao, T.; Canlas, P.; Maghirang-Rodriguez, R.; Heuer, S.; Ismail, A.M.; Bailey-Serres, J.; Ronald, P.C.; Mackill, D.J. Sub1A is an ethylene-response-factor-like gene that confers submergence tolerance to rice. Nature 2006, 442, 705–708. [Google Scholar] [CrossRef] [Green Version]
  10. Henry, A.; Gowda, V.R.; Torres, R.O.; McNally, K.L.; Serraj, R. Variation in root system architecture and drought response in rice (Oryza sativa): Phenotyping of the OryzaSNP panel in rainfed lowland fields. Field Crops Res. 2011, 120, 205–214. [Google Scholar] [CrossRef]
  11. Wang, Y.Z.; Wang, X.J.; Yuan, L.I.; Hai, X.U.; Chen, W.F. Analysis of Yield and Quality Traits and Their Relationship in Japonica Rice in Northern China. Acta Agron. Sin. 2015, 41, 910–918. [Google Scholar] [CrossRef]
  12. Wu, J.; Feng, F.; Lian, X.; Teng, X.; Wei, H.; Yu, H.; Xie, W.; Yan, M.; Fan, P.; Li, Y.; et al. Genome-wide Association Study (GWAS) of mesocotyl elongation based on re-sequencing approach in rice. BMC Plant Biol. 2015, 15, 218. [Google Scholar] [CrossRef] [PubMed] [Green Version]
  13. Kumar, V.; Ladha, J.K. Direct Seeding of Rice: Recent Developments and Future Research Needs. Adv. Agron. 2011, 111, 297–413. [Google Scholar] [CrossRef]
  14. Wang, W.Q.; Peng, S.B.; Liu, H.Y.; Tao, Y.; Huang, J.L.; Cu, K.H.; Nie, L.X. The possibility of replacing puddled transplanted flooded rice with dry seeded rice in central China: A review. Field Crops Res. 2017, 214, 310–320. [Google Scholar] [CrossRef]
  15. Liu, H.; He, A.; Jiang, G.; Hussain, S.; Nie, L. Faster leaf senescence after flowering in wet direct-seeded rice was mainly regulated by decrease in cytokinin content as compared with transplanted-flooded rice. Food Energy Secur. 2020, 9, e232. [Google Scholar] [CrossRef]
  16. Tao, Y.; Chen, Q.; Peng, S.B.; Wang, W.Q.; Nie, L.X. Lower global warming potential and higher yield of wet direct-seeded rice in Central China. Agron. Sustain. Dev. 2016, 36, 24. [Google Scholar] [CrossRef] [Green Version]
  17. Luo, J.; Tang, S.Q.; Hu, P.S.; Louis, A.; Jiao, G.A.; Tang, J. Analysis on Factors Affecting Seedling Establishment in Rice. Rice Sci. 2007, 14, 27–32. [Google Scholar] [CrossRef]
  18. Zhang, Y.P.; Zhu, D.F.; Xiong, H.; Chen, H.Z.; Xiang, J.; Lin, X.P. Development and transition of rice planting in China. Agric. Sci. Technol. 2012, 13, 1270–1276. [Google Scholar]
  19. Ismail, A.M.; Johnson, D.E.; Ella, E.S.; Vergara, G.V.; Baltazar, A.M. Adaptation to flooding during emergence and seedling growth in rice and weeds, and implications for crop establishment. AoB Plants 2012, 2012, pls019. [Google Scholar] [CrossRef]
  20. Lee, H.S.; Sasaki, K.; Kang, J.W.; Sato, T.; Song, W.Y.; Ahn, S.N. Mesocotyl Elongation is Essential for Seedling Emergence Under Deep-Seeding Condition in Rice. Rice 2017, 10, 32. [Google Scholar] [CrossRef] [Green Version]
  21. Farooq, M.; Barsa, S.M.A.; Wahid, A. Priming of field-sown rice seed enhances germination, seedling establishment, allometry and yield. Plant Growth Regul. 2006, 49, 285–294. [Google Scholar] [CrossRef]
  22. Patil, S.; Zafar, S.A.; Uzair, M.; Zhao, J.F.; Fang, J.J.; Li, X.Y. An Improved Mesocotyl Elongation Assay for the Rapid Identification and Characterization of Strigolactone-Related Rice Mutants. Agronomy 2019, 9, 208. [Google Scholar] [CrossRef] [Green Version]
  23. Zhan, J.H.; Lu, X.; Liu, H.Y.; Zhao, Q.Z.; Ye, G.Y. Mesocotyl elongation, an essential trait for dry-seeded rice (Oryza sativa L.): A review of physiological and genetic basis. Planta 2020, 251, 1–14. [Google Scholar] [CrossRef] [PubMed] [Green Version]
  24. Rao, A.N.; Johnson, D.E.; Sivaprasad, B.; Ladha, J.K.; Mortimer, A.M. Weed management in direct-seeded rice. Advances in Agronomy 2007, 93, 153–255. [Google Scholar] [CrossRef]
  25. Dang, X.; Thi, T.G.T.; Dong, G.; Wang, H.; Edzesi, W.M.; Hong, D. Genetic diversity and association mapping of seed vigor in rice (Oryza sativa L.). Planta 2014, 239, 1309–1319. [Google Scholar] [CrossRef] [PubMed]
  26. Lee, H.S.; Sasaki, K.; Higashitani, A.; Ahn, S.N.; Sato, T. Mapping and characterization of quantitative trait loci for mesocotyl elongation in rice (Oryza sativa L.). Rice 2012, 5, 1–10. [Google Scholar] [CrossRef] [PubMed] [Green Version]
  27. Lin, J.; Zhang, G.; Wu, M.; Cao, L.; Chen, S. Genetic analysis of mesocotyl elongation in rice (Oryza sativa L. subsp.japonica). Acta Agron. Sin. 2006, 32, 249–252. [Google Scholar]
  28. Panda, S.; Majhi, P.K.; Anandan, A.; Mahender, A.; Veludandi, S.; Bastia, D.; Guttala, S.B.; Singh, S.K.; Saha, S.; Ali, J. Proofing Direct-Seeded Rice with Better Root Plasticity and Architecture. Int. J. Mol. Sci. 2021, 22, 6058. [Google Scholar] [CrossRef]
  29. Pantuwan, G.; Fukai, S.; Cooper, M.; Rajatasereekul, S.; O’toole, J.C. Yield response of rice (Oryza sativa L.) genotypes to drought under rainfed lowland: 3. Plant factors contributing to drought resistance. Field Crops Res. 2002, 73, 181–200. [Google Scholar] [CrossRef]
  30. Jiang, Q.; Wang, W.; Chen, Q.; Peng, S.; Huang, J.; Cui, K.; Nie, L. Response of first flood irrigation timing after rice dry-direct-seeding: Productivity and greenhouse gas emissions in Central China. Agric. Water Manag. 2016, 177, 241–247. [Google Scholar] [CrossRef]
  31. Wang, Y.; Liu, J.; Meng, Y.; Liu, H.; Liu, C.; Ye, G. Rapid identification of QTL for mesocotyl length in rice through combining QTL-seq and genome-wide association analysis. Front. Genet. 2021, 12, 713446. [Google Scholar] [CrossRef] [PubMed]
  32. Matusmoto, T.; Yamada, K.; Yoshizawa, Y.; Keimei, O.H. Comparison of Effect of Brassinosteroid and Gibberellin Biosynthesis Inhibitors on Growth of Rice Seedlings. Rice Sci. 2016, 23, 51–55. [Google Scholar] [CrossRef] [Green Version]
  33. Zhao, Y.; Zhao, W.; Jiang, C.; Wang, X.; Xiong, H.; Todorovska, E.G.; Yin, Z.; Chen, Y.; Wang, X.; Xie, J. Genetic architecture and candidate genes for deep-sowing tolerance in rice revealed by non-syn GWAS. Front. Plant Sci. 2018, 9, 332. [Google Scholar] [CrossRef] [PubMed] [Green Version]
  34. Lu, Q.; Zhang, M.; Niu, X.; Wang, C.; Xu, Q.; Feng, Y.; Wang, S.; Yuan, X.; Yu, H.; Wang, Y. Uncovering novel loci for mesocotyl elongation and shoot length in indica rice through genome-wide association mapping. Planta 2016, 243, 645–657. [Google Scholar] [CrossRef] [PubMed] [Green Version]
  35. Chen, K.; Zhang, Q.; Wang, C.-C.; Liu, Z.-X.; Jiang, Y.-J.; Zhai, L.-Y.; Zheng, T.-Q.; Xu, J.-L.; Li, Z.-K. Genetic dissection of seedling vigour in a diverse panel from the 3000 Rice (Oryza sativa L.) Genome Project. Sci. Rep. 2019, 9, 4804. [Google Scholar] [CrossRef] [PubMed]
  36. Wang, W.; Mauleon, R.; Hu, Z.; Chebotarov, D.; Tai, S.; Wu, Z.; Li, M.; Zheng, T.; Fuentes, R.R.; Zhang, F. Genomic variation in 3010 diverse accessions of Asian cultivated rice. Nature 2018, 557, 43–49. [Google Scholar] [CrossRef]
  37. Ren, M.; Huang, M.; Qiu, H.; Chun, Y.; Li, L.; Kumar, A.; Fang, J.; Zhao, J.; He, H.; Li, X. Genome-Wide Association Study of the Genetic Basis of Effective Tiller Number in Rice. Rice 2021, 14, 1–13. [Google Scholar] [CrossRef]
  38. Wang, C.C.; Yu, H.; Huang, J.; Wang, W.S.; Faruquee, M.; Zhang, F.; Zhao, X.Q.; Fu, B.Y.; Chen, K.; Zhang, H.L.; et al. Towards a deeper haplotype mining of complex traits in rice with RFGB v2.0. Plant Biotechnol. J. 2020, 18, 14–16. [Google Scholar] [CrossRef]
  39. Meng, L.; Li, H.H.; Zhang, L.Y.; Wang, J.K. QTL IciMapping: Integrated software for genetic linkage map construction and quantitative trait locus mapping in biparental populations. Crop J. 2015, 3, 269–283. [Google Scholar] [CrossRef] [Green Version]
  40. Hajiaqatabar, A.; Kiani, G.; Kazemitabar, S.K.; Alavi, M. Correlation and Path Coefficient Analysis for Yield and Yield Components in F2 Segregating Populations of Rice. Jordan J. Agric. Sci. 2016, 12, 749–754. [Google Scholar] [CrossRef]
  41. Huang, R.; Jiang, L.; Zheng, J.; Wang, T.; Wang, H.; Huang, Y.; Hong, Z. Genetic bases of rice grain shape: So many genes, so little known. Trends Plant Sci. 2013, 18, 218–226. [Google Scholar] [CrossRef] [PubMed]
  42. Liu, G.L.; Mei, H.W.; Liu, H.Y.; Yu, X.Q.; Zou, G.H.; Luo, L.J. Sensitivities of rice grain yield and other panicle characters to late-stage drought stress revealed by phenotypic correlation and QTL analysis. Mol. Breed. 2010, 25, 603–613. [Google Scholar] [CrossRef]
  43. Wang, Y.; Li, J. The Plant Architecture of Rice (Oryza sativa). Plant Mol. Biol. 2005, 59, 75–84. [Google Scholar] [CrossRef] [PubMed]
  44. Mun, H.H.; Chang, T.T.; Beachell, H.M. The inheritance of culm length, panicle length, duration to heading and bacterial leaf blight reaction in a rice cross: Sigadis × Taichung (Native)1. Jpn. J. Breed. 2008, 18, 7–11. [Google Scholar] [CrossRef] [Green Version]
  45. Mgonja, M.A.; Ladeinde, T.A.O.; Aken’Ova, M.E. Genetic analysis of mesocotyl length and its relationship with other agronomic characters in rice (Oryza sativa L.). Euphytica 1993, 72, 189–195. [Google Scholar] [CrossRef]
  46. Redofia, E.D.; Mackill, D.J. Genetic Variation for Seedling Vigor Traits in Rice. Crop Sci. 1996, 36, 285–290. [Google Scholar]
  47. Hour, A.-l.; Hsieh, W.-H.; Chang, S.-H.; Wu, Y.-P.; Chin, H.-S.; Lin, Y.-R. Genetic diversity of landraces and improved varieties of rice (Oryza sativa L.) in Taiwan. Rice 2020, 13, 82. [Google Scholar] [CrossRef]
  48. Simon, A.; Yuri, S.; Hironobu, S.; Kenji, I. Genotypic variation in coleoptile or mesocotyl lengths of upland rice (Oryza sativa L.) and seedling emergence in deep sowing. Afr. J. Agric. Res. 2012, 7, 6239–6248. [Google Scholar] [CrossRef] [Green Version]
  49. Nam-Jin, C. Elongation habit of mesocotyls and coleoptiles in weedy rice with high emergence ability in direct-seeding on dry paddy fields. Crop Pasture Sci. 2010, 61, 911–917. [Google Scholar]
  50. Kim, S.L.; Chung, Y.S.; Silva, R.R.; Ji, H.; Lee, H.; Choi, I.; Kim, N.; Lee, E.; Baek, J.; Lee, G.S.; et al. The opening of phenome-assisted selection era in the early seedling stage. Sci. Rep. 2019, 9, 9948. [Google Scholar] [CrossRef] [Green Version]
  51. Xie, Q.; Mayes, S.; Sparkes, D.L. Carpel size, grain filling, and morphology determine individual grain weight in wheat. J. Exp. Bot. 2015, 66, 6715–6730. [Google Scholar] [CrossRef] [PubMed] [Green Version]
  52. Liu, H.; Zhan, J.; Li, J.; Lu, X.; Liu, J.; Wang, Y.; Zhao, Q.; Ye, G. Genome-wide association study (GWAS) for mesocotyl elongation in rice (Oryza sativa L.) under multiple culture conditions. Genes 2020, 11, 49. [Google Scholar] [CrossRef] [PubMed] [Green Version]
  53. Hussain, B.; Khan, A.S.; Ali, Z. Genetic variation in wheat germplasm for salinity tolerance atseedling stage: Improved statistical inference. Turk. J. Agric. For. 2015, 39, 182–192. [Google Scholar] [CrossRef]
  54. Adjah, K.L.; Abe, A.; Adetimirin, V.O.; Asante, M.D. Genetic variability, heritability and correlations for milling and grain appearance qualities in some accessions of rice (Oryza sativa L.). Physiol. Mol. Biol. Plants 2020, 26, 1309–1317. [Google Scholar] [CrossRef] [PubMed]
  55. Noorka, I.R.; Amarah, B.; Saeed, R.; Teixeira da Silva, J.; Ashraf, E. Estimation of heterosis in wheat (Triticum aestivum L.) under contrasting water regimes. Int. J. Plant Breed 2013, 7, 55–60. [Google Scholar]
  56. Dilday, R.H.; Mgonja, M.A.; Amonsilpa, S.A.; Collins, F.C.; Wells, B.R. Plant height vs mesocotyl and coleoptile elongation in rice: Linkage or pleiotropism? Crop Sci. 1990, 30, 815–818. [Google Scholar] [CrossRef]
  57. Zhang, J.; Tong, T.; Potcho, P.M.; Huang, S.; Ma, L.; Tang, X. Nitrogen Effects on Yield, Quality and Physiological Characteristics of Giant Rice. Agronomy 2020, 10, 1816. [Google Scholar] [CrossRef]
  58. Khush, G.S. Green revolution: Preparing for the 21st century. Genome 1999, 42, 646–655. [Google Scholar] [CrossRef]
  59. Jun, M.; Wenbo, M.; Yanhua, T.; Jianchang, Y.; Kaida, Z.; Qingsen, Z. The culm lodging resistance of heavy panicle type of rice. Zuo Wu Xue Bao 2004, 30, 143–148. [Google Scholar]
  60. Islam, M.S.; Peng, S.; Visperas, R.M.; Ereful, N.; Bhuiya, M.S.U.; Julfiquar, A. Lodging-related morphological traits of hybrid rice in a tropical irrigated ecosystem. Field Crops Res. 2007, 101, 240–248. [Google Scholar] [CrossRef]
  61. Yano, K.; Morinaka, Y.; Wang, F.; Huang, P.; Takehara, S.; Hirai, T.; Ito, A.; Koketsu, E.; Kawamura, M.; Kotake, K.; et al. GWAS with principal component analysis identifies a gene comprehensively controlling rice architecture. Proc. Natl. Acad. Sci. USA 2019, 116, 21262–21267. [Google Scholar] [CrossRef] [PubMed]
  62. Azam, M.; Zhang, S.; Abdelghany, A.M.; Shaibu, A.S.; Feng, Y.; Li, Y.; Tian, Y.; Hong, H.; Li, B.; Sun, J. Seed isoflavone profiling of 1168 soybean accessions from major growing ecoregions in China. Food Res. Int. 2020, 130, 108957. [Google Scholar] [CrossRef] [PubMed]
  63. Deng, M.; Zhang, X.; Luo, J.; Liu, H.; Xiao, Y. Metabolomic analysis reveals differences in evolution between maize and rice. Plant J. 2020, 103, 1710–1722. [Google Scholar] [CrossRef] [PubMed]
  64. Yuan, L. Progress in super-hybrid rice breeding. Crop J. 2017, 5, 100–102. [Google Scholar] [CrossRef]
  65. Zhang, Y.; Yu, C.; Lin, J.; Liu, J.; Liu, B.; Wang, J.; Huang, A.; Li, H.; Zhao, T. OsMPH1 regulates plant height and improves grain yield in rice. PLoS ONE 2017, 12, e0180825. [Google Scholar] [CrossRef] [Green Version]
Figure 1. Germplasm distribution and an improved mesocotyl elongation assay. (A) The worldwide distribution of 190 rice cultivars. Different countries with the number of cultivars are represented with different colors. (B) The sowing method in which green arrows are representing seeds. (C) Diversity in 10-day-old seedling parameters. Left picture representing indica and japonica, respectively, while the other two pictures representing Aus group. Red arrows showing mesocotyl elongation. C, coleoptile; L, leaves; MC, mesocotyl; Bars = 1 cm.
Agronomy 12 00975 g001
Figure 2. Comparison of 11 agronomic parameters between Aus, Indica (Ind), and Japonica (Jap) groups. Boxplots represent the median (middle line), error bars, and outliers (dots). LSD was used for statistical test. Different letters (a, b and c) above the column differs at p < 0.05.
Agronomy 12 00975 g002
Figure 3. Correlation analysis among the 11 agronomic parameters of rice. The upper diagonal represents the correlation coefficient (r); *, ** and *** represent significance at p < 0.05, 0.01, and 0.001, respectively. The lower diagonal plots show the distribution of each parameter. C; coleoptile length (cm), MC; mesocotyl (cm), SL; shoot length (cm), GL; grain length (mm), GW; grain width (mm), GL/WR; grain length/width ratio (ratio), TGWt; 1000 grains weight (g), PL; panicle length (cm), T; tillers number, CL; culm length (cm), PH; plant height (cm).
Agronomy 12 00975 g003
Figure 4. Principal component analysis (PCA)-based agronomic parameters of rice. (A) Scree plot representing the percentage of variance accounted by principal components. (B) Contribution of 11 agronomic parameters in the first three PCs. (C) Projection of variables. Different cultivars of different rice groups were represented with different color-coded shapes. C, coleoptile length (cm); MC, mesocotyl (cm); SL, shoot length (cm); GL, grain length (mm); GW, grain width (mm); GL/WR, grain length/width ratio (ratio); TGWt, 1000 grains weight (g); PL, panicle length (cm); T, tillers number; CL, culm length (cm); PH, plant height (cm).
Agronomy 12 00975 g004
Figure 5. Hierarchical Cluster Analysis (A) and Constellation Plot (B) of 190 rice cultivars assessed through an improved mesocotyl elongation assay. Cultivars are distributed into three groups. Different colors were used to differentiate rice groups; red denoted to Aus, green to Japonica, and blue color was used for Indica group. C, coleoptile length (cm); MC, mesocotyl (cm); SL, shoot length (cm); GL, grain length (mm); GW, grain width (mm); GL/WR, grain length/width ratio (ratio); TGWt, 1000 grains weight (g); PL, panicle length (cm); T, tillers number; CL, culm length (cm); PH, plant height (cm).
Agronomy 12 00975 g005
Table 1. Summary statistics of 11 agronomic parameters at early seedling stage and maturity stage of 190 rice cultivars.
TraitOverall PopulationAus GroupIndica GroupJaponica GroupANOVA
MeanRangeCVMeanRangeCVMeanRangeCVMeanRangeCVGh2
C3.341.27–6.6229.283.851.5–5.6524.553.241.65–6.4730.373.211.27–6.6228.54***99
MC2.240.06–13.9395.464.170.37–13.9374.871.790.06–8.3994.001.850.10–6.4578.77***97
SL10.514.79–20.4531.5413.645.63–20.4525.469.874.79–1829.039.775.11–18.6429.48***98
GL8.415.7–11.410.978.225.7–9.810.888.696.3–11.410.138.155.7–10.611.06NS-
GW3.082.1–4.313.193.062.2–4.113.212.92.1–4.012.573.312.4–4.310.09***-
GL/WR2.81.8–4.621.312.741.9–4.119.843.072–4.619.942.491.8–3.717.00***-
TGWt24.813.5–35.614.8622.5313.5–32.119.3425.1020.1–32.612.0225.5313.9–35.614.55**-
PL22.6614–3513.8423.4418–2810.7722.5217–2811.4822.4614–3517.49NS-
T14.634.83–38.6632.1315.958–28.629.3915.794.83–25.3326.8612.525.66–38.6636.55***-
CL85.7736–14528.06105.2963–14518.9277.8636–13127.8186.1442–14327.33NS-
PH108.4456–17223.6128.7386–17216.38100.3856–15822.64108.6060–16623.71NS-
ANOVA; Analysis of variance, G; cultivars, ** p ≤ 0.01 and *** p ≤ 0.001; NS, non-significant; h2, heritability (%age); -, missing data; CV, coefficient of variance (%age); C, coleoptile length (cm); MC, mesocotyl (cm); SL, shoot length (cm); GL; grain length (mm); GW, grain width (mm); GL/WR, grain length/width ratio (ratio); TGWt, 1000 grains weight (g); PL, panicle length (cm); T, tillers number; CL, culm length (cm); PH, plant height (cm).
Publisher’s Note: MDPI stays neutral with regard to jurisdictional claims in published maps and institutional affiliations.

