Article

Flux of Root-Derived Carbon into the Nematode Micro-Food Web: A Comparison of Grassland and Agroforest

1
Institute of Biology, Ecology, Humboldt Universität zu Berlin, Philippstraße 13, 10115 Berlin, Germany
2
J. F. Blumenbach Institute of Zoology and Anthropology, University of Göttingen, Untere Karspüle 2, 37073 Göttingen, Germany
3
Key Laboratory for Plant Diversity and Biogeography of East Asia, Chinese Academy of Sciences, Kunming Institute of Botany, Heilongtan, Kunming 650201, China
4
Department of Agricultural Soil Science, University of Göttingen, 37707 Göttingen, Germany
5
Department of Agroecology, Bayreuth Center of Ecology and Environmental Research (BayCEER), University of Bayreuth, Universitätsstraße 30, 95440 Bayreuth, Germany
*
Author to whom correspondence should be addressed.
Agronomy 2022, 12(4), 976; https://doi.org/10.3390/agronomy12040976
Submission received: 21 March 2022 / Revised: 11 April 2022 / Accepted: 13 April 2022 / Published: 18 April 2022
(This article belongs to the Special Issue Nematodes: Drivers of Agricultural Ecosystem Performance)

Abstract

:
Carbon (C) cycling is crucial to agroecosystem functioning. Important determinants for the belowground C flow are soil food webs, with microorganisms and microfaunal grazers, i.e., nematodes, as key biota. The present study investigates the incorporation of plant-derived C into the nematode micro-food web under two different cropping systems, grassland (ryegrass (Lolium perenne L.) and white clover (Trifolium repens L.)) and agroforest (willow (Salix schwerinii Wolf and Salix viminalis L)). To quantify the C flux from the plant into the soil micro-food web, grass and willow were pulse-labeled with 13CO2 and the incorporation of 13C into the nematode trophic groups was monitored 3, 7, 14 and 28 days after labeling. The natural stable isotope signals (13C/12C, 15N/14N) were analyzed to determine the structure of the nematode micro-food web. The natural isotopic δ15N signal revealed different trophic levels for omnivores and predators in grassland and agroforest soils. The incorporation of plant C into nematode tissue was detectable three days after 13CO2 labeling with the highest and fastest C allocation in plant feeders in grassland, and in fungal feeders in agroforest soil. C flux dynamics between the aboveground vegetation and belowground micro-food web varied with cropping system. This demonstrates that crop-specific translocation of C affects the multitrophic interactions in the root environment, which in turn can alter soil nutrient cycling.

1. Introduction

Soils are major carbon (C) pools and store about two-thirds of the global soil C in an organic form [1]. About 20% of the C fixed by crops is transferred to belowground pools [2]. This plant-derived C reaches the soil either via the decomposition of plant litter, by lysates of damaged cells or root exudates secreted by living root cells [3]. Especially, rhizodeposits consisting of easily degradable organic compounds are the primary source of energy for the soil food web [4]. The transfer of C from the crop into the soil is affected by plant type [2]. Changes in land use lead to changes in the soils’ capacity to store C [5,6,7], with the greatest impact attributed to conversion of croplands to native vegetation and vice versa [8].
Perennial crops are characterized by a year-long vegetation cover and greater root biomass, thus contributing more organic C to the soil, providing higher energy inputs for biological activity than annual agricultural systems [9]. Grasslands translocate up to 30% of plant C belowground, resulting in a large pool of labile organic C available for soil biota, while the major C sink in trees is not the root but rather the stem [10]. However, depending on tree age and growth phase, leaves and fine roots can act as alternative C sinks, thereby changing the C flux within the tree [11,12]. Further, associations with mycorrhizal fungi influence the translocation of recently fixed plant C to the soil microbial community and subsequently the uptake of root-derived C by microbial feeders [13].
The deliberate combination of annual crops with perennial grasslands or trees on the same arable land is an example of agroforestry and the most common method in Germany [14,15]. Typically, strips of fast-growing tree species such as poplars (Populus spp. L.) and willows that yield a high amount of woody biomass in a short time are integrated into conventional agricultural sites [16]. After a rotation period of two to ten years, the trees are harvested for the production of bioenergy [17]. Willows are the most suitable energy crops as they have a higher net energy output and the lowest greenhouse gas emissions compared to annual crops used for biofuels, e.g., wheat, rapeseed, and sugar beet [18]. Grasses intercropped with legumes, e.g., clover provide a suitable biogas substrate are also used due to high biomass production and low lignin content [19]. The combination of willows and grass-clover mixtures is thus energetically highly efficient. On the other hand, the environmental benefits of short-rotation agroforestry include reductions in soil erosion and leaching of soil nutrients, improvement of C-sequestration and enhancement of biodiversity [20].
The type of aboveground vegetation shapes the trophic structure of belowground nematode communities: a meta-analysis revealed that fungivore nematode abundance and biomass increases from grassland to cropland and forest, while the opposite pattern can be observed for herbivore nematodes [21]. On the other hand, bacterivore nematodes are the predominant trophic group on a global scale [22]. Omnivores and predators with long life cycles and sensitivity to disturbances are more abundant in mature areas than newly established habitats in grassland [23], as well as forest ecosystems [24].
In soil food webs, C is channeled either along the herbivore or detritivore food chain: While the herbivore food chain is based on primary production and fuels the root C and energy channel, the detritivore food chain is related to the decomposition of dead organic matter and comprises the fungal and bacterial energy channel [25]. In systems with a low substrate C/N ratio (i.e., high quality, easier to decompose), e.g., in grasslands, C is mainly transferred along the bacterial decomposition pathway, while in systems with a high substrate C/N ratio, e.g., forests, decomposition processes are dominated by fungi [26]. Furthermore, due to differing decomposition rates, the bacterial C and energy channel is referred to as fast cycle and the fungal channel as slow cycle [27,28].
One animal group that occupies key positions within the soil food web are nematodes [21]. Both plant parasites as well as beneficial free-living nematodes interact in various ways with crop plants, thereby affecting soil C and nutrient dynamics. Plant-parasitic nematodes impose a C loss on plants either directly via feeding on roots or indirectly via the leakage of cell metabolites from damaged root cells [29]. Further, nematodes regulate microbial composition and decomposition activity by grazing on bacteria and fungi [30]. The subsequent excretion of NH4+ and amino acids makes these nutrients, which are otherwise bound in microbial biomass, accessible for plant uptake [31].
As their activity is regulated by biological and physical soil conditions [29], using nematodes as bioindicators provides a tool for the assessment of soil quality and functioning, especially with regard to land use changes [32]. More precisely, analyzing the presence and abundance of nematode functional guilds (i.e., similar feeding types and life strategies) makes it possible to assess food web structure and condition, i.e., basal, structured or enriched [33]. Applying this faunal analysis concept, it has been shown that the functional succession from bacterivore to fungivore nematodes in an arable soil was driven by the input of high C/N resources [27]. In line with this, the fungivore to bacterivore ratio (f/b ratio) increased following reforestation on degraded soil covering Karst terrain [34].
The present study investigates the incorporation of plant-derived C into the nematode micro-food web under two different perennial land use types, i.e., grassland and agroforest. The objectives were to determine the predominating soil C and energy channels under both land use types, to uncover plant type-dependent differences in the trophic structure of the nematode micro-food webs and to examine the overall plant C flux into the nematode community.

2. Materials and Methods

2.1. Study Site

The study site was located in Reiffenhausen (51°39′83′′ N, 9°98′75′′ E; 325 m a.s.l.) south of Göttingen in Central Germany (Figure S1). The region is characterized by a temperate climate, with both western maritime Atlantic and eastern continental influences. Mean average temperature is 9.2 °C and mean annual precipitation is 642 mm, with 312 mm during the vegetation period from May to September [35].
The study area is characterized by sedimentary deposits of Middle and Upper Triassic sandstone material, partly mixed with clay stone material and covered by loess sediments [36]. The soil types present are Stagnic Cambisol and Haplic Stagnosol, while the soil texture varies from loamy sand in the northeastern part to silty loam in the southwestern part of the site [36].

2.2. Experimental Design and Soil Properties

The experimental plots were established on former arable land in March 2011, with winter barley (Hordeum vulgare L.) as the preceding crop. The study side comprises the two cropping systems, grassland and agroforest, planted in a strip design. The grass strips (n = 3) are each 9 m wide and 75 m long, and consist of a grass–clover mixture (dominated by Lolium perenne L. mixed with Trifolium repens L.) [37]. The grassland represents a low-input system without fertilizer application. However, grass cutting was performed three times per year [38]. The willow strips (n = 3) are each 7.5 m wide and 75 m long and consist of Salix schwerinii Wolf and Salix viminalis L. During the strip installation the willow cuttings were planted in double rows with a distance of 1.5 m between rows and a distance of 0.75 m between cuttings within a row [35]. At the time of sampling, the willow trees were three years old and about 4 m high. The willow strips function as a short-rotation forestry plantation, i.e., a low-input system with a fast-growing energy plant. One rotation cycle lasts three years without fertilizer application. Combining the production of woody biomass as energy feedstock with conventional field crops is an increasingly popular management practice in Germany [15].
The proportions of clay, silt and sand under grassland were 10%, 45% and 45%, respectively. The soil pH was almost neutral at 6.6, bulk density was 1400 kg m−3 [39] and microbial C (Cmic) 2700 g kg−1. The soil under willows consists of 15% clay, 40% silt and 45% sand [37]. The pH was 5.6, while bulk density and Cmic were 1400 kg m−3 and 2400 g kg−1, respectively [35]. Measurements were taken in 0–30 cm soil depth for pH and bulk density, and 0–15 cm for Cmic.

2.3. Pulse Labeling with 13CO2

The pulse labeling took place on 20 June 2017 for willow and on 22 August 2017 for grass. At each plant type, five labeling chambers were installed (Figure S1). For the willow labeling, one strip was selected and chambers were installed at a distance of at least 10 m from each other. Each chamber contained one willow tree with the upper branches bent to fit the height of the chamber. In the grass strips, plots were established as blocks (9.0 × 6.5 m) differing in experimental treatment (e.g., with/without fertilization), not allowing installment of five labeling chambers within the same strip. Therefore, the chambers were set up in two blocks with the same treatment (no fertilizer application). Two chambers were installed in the grass strip next to the selected willow strip (block one) and three in a second grass strip located 50 m away (block two; Figure S1).
Each labeling chamber consisted of a stainless-steel frame (1 × 1 m), which was inserted into the soil to a depth of 10 cm, and an aluminum frame on top. The height of the aluminum frame was 1 m for grass and 2 m for willow. The frame was covered with translucent LDPE (low-density polyethylene) foil. The chambers contained cooling packs to prevent high transpiration by the plant and fans to ensure permanent CO2 dispersal. In the willow plot, understory plants were removed and the ground of each chamber was covered with black plastic foil to prevent 13C assimilation and incorporation into the system by herbaceous plants.
For the 13C labeling, a plastic beaker with 20 g Ca13CO3 as tracer was installed in each chamber. Every two hours, 50 mL of hydrochloric acid (HCl) was applied to the tracer to enable the production of 13CO2. The released 13CO2 circulated inside the chamber for 6 h, then the labeling process was ended and the foil and frame were removed.

2.4. Plant, Soil and Nematode Sampling

Samples of the soil, plants and nematodes were taken 3, 7, 14 and 28 days after the labeling of the grass or willow, respectively. Additionally, unlabeled samples were taken in neighboring grass and willow strips, in which no labeling chambers were installed, to determine the natural stable isotope ratios of 13C/12C and 15N/14N in plant (n = 4) and nematode tissue (n = 5) and in the soil (n = 5) under grass and willows. Per labeling chamber, one soil sample, one nematode sample and one sample of the plant (divided in root and shoot subsamples) were analyzed, resulting in 5 replicates per day and plant type for each sampled material.
Plant subsamples were randomly collected and represented about 20% of the total plant biomass. For willow, the shoot subsample comprised leaves and twigs and the root subsample a mixture of coarse and fine roots. The soil was sampled with a split tube at 0–15 cm depth and sieved to 2 mm. Soil and plant material were dried at 60 °C for 48 h, weighed, milled and stored in a desiccator until stable isotope analysis.
The nematode sampling was carried out with a stainless-steel corer (diameter 8 cm, depth 15 cm). Of these 30 g fresh weight (FW) of each sample were used to determine the soil dry weight (DW) and 50 g FW were subjected to heat-extraction of nematodes after a modified Baermann method [40]. The extraction procedure started at room temperature (20 °C) for 24 h, followed by a gradual heating in 5 °C steps for 6 h, beginning at 20 °C and ending at 45 °C. Afterwards, nematodes were fixed in 4% formaldehyde solution.
The total number of nematodes in a sample was counted, the trophic level determined using the identification key proposed by Bongers [41] and individuals assigned to plant, fungal, and bacterial feeders, omnivores and predators, according to Yeates et al. [42]. In samples which contained more than 1000 individuals, 10% of individuals were identified, whereas in samples with less than 1000 individuals, 100 individuals were inspected. Dauerlarvae of the family Rhabditidae were not included in the following analyses as they represent a non-active resting stage [32].

2.5. Stable Isotope Analysis

2.5.1. Plant and Soil

The plant and soil samples were placed into tin capsules for the measurement of relative N and C isotope abundances using an elemental analyzer (EA) NA1500 (Carlo Erba Instruments, Milano, Italy) coupled to a Delta plus isotope ratio mass spectrometer (IRMS) (Thermo Fisher Scientific, Bremen, Germany) through a ConFlo III interface (Thermo Electron Corporation, Bremen, Germany).

2.5.2. Nematodes

As preparation for stable isotope analysis, nematodes were sorted by trophic group using an inverse light microscope and stored in glass vials. Before further processing, nematode samples were subjected to a washing procedure with deionized water to remove the formaldehyde from the animal tissue. The supernatant of each sample was removed so that 500 µL of the sample remained within the vial. Then, 500 µL of deionized water were added. This procedure was repeated after one hour. Afterwards, the samples were stored overnight in a refrigerator to allow further exchange of water and formaldehyde in the nematode tissue. The following day, the entire supernatant of each sample was removed, the nematode individuals were transferred into silver capsules (4 × 6 mm; IVA Analysetechnik GmbH, Meerbusch, Germany) and dried at 60 °C for six days. Samples for natural variations of isotopes and labeled samples were dried in different drying cabinets to prevent cross-contamination. The weights of empty silver capsules and of dried nematode tissue of each sample were measured using an ultra-micro balance (Mettler Toledo XP6U Comparator, Mettler Toledo, Colombus, OH, USA).
A high-sensitivity elemental analyzer/isotope ratio mass spectrometer setup (µEA/IRMS) was used to perform the measurements of stable isotope ratios. It allowed an accurate analysis of small sample amounts, i.e., up to 1 µg of C or 0.6 µg of N with < 1‰ standard error after blank correction [43]. The EA (Eurovector, Milano, Italy) was equipped with a Blisotec low blank autosampler (Blisotec, Jülich, Germany) and contained smaller oxidation and reduction reactor tubes (i.d. 7.8 mm, o.d. 10.5 mm, length 450 mm) to obtain sharper sample peaks in the mass spectrometer [43]. Further, the EA was coupled to a Thermo Delta Vplus isotope ratio mass spectrometer via a ConFlo IV interface (both from Thermo Fisher Scientific, Bremen, Germany). V-PDB (Vienna Pee Dee belemnite) and atmospheric N2 were used as standards for 13C and 15N, respectively, and acetanilide for internal calibration.
Isotope natural abundance was calculated using the δ notation [‰] relative to a standard (V-PDB and N2 Air) calculated as δnE [‰] = [(RsampleRstandard)/Rstandard)] × 1000, where E is the element, n the weight of the heavier isotope and R the ratio of heavy to light isotopes. The isotopic fractionation was calculated as ∆δnE [‰] = δnEcomsumerδnEfood. Isotopic incorporation of 13C was calculated as the shift in the isotopic signature between labeled and unlabeled control samples as ∆13C [‰] = δ13Clabeled sampleδ13Cunlabeled sample.

2.6. Statistical Analysis

The software R (version 4.0.4. “Lost Library Book”) was used for statistical analyses.
The Kruskal–Wallis rank sum test was performed on isotope natural abundances of nematodes, roots shoots, and the soil utilizing Dunn’s post hoc test with Bonferroni correction (significance level at p < 0.05).
Data concerning the incorporation of 13C into nematode tissue expressed as ∆13C were subjected to analysis of variances (one-way ANOVA) utilizing Tukey’s HSD post hoc test (significance level at p < 0.05).
The incorporation of 13C into nematode tissue was compared between sampling days and trophic groups using linear mixed effects models for each plant type. Sampling days and trophic groups were set as fixed effects. The investigated different spatial scales were nested in a hierarchical structure as follows: “soil core” nested within “chamber”, “chamber” nested within “plant type”. Further, “chamber” and “soil core” nested within “chamber” were set as random effects. ∆13C values of basal resources and the soil were compared between sampling days and plant type with “chamber” and “soil core” nested within “chamber” as random effects. Since chambers in the grass plots were distributed in two blocks, “block” was set as random effect in the models of grass as well.
Differences in the incorporation of 13C into trophic groups between plants were analyzed using the two-sample t-test using data of all sampling dates together (i.e., 3, 7, 14 and 28 days after 13CO2 labeling).

3. Results

3.1. Nematode Density and Trophic Structure

The nematode population density across all samplings, i.e., over a period of 28 days, was similar under both land use types (Table 1). Plant feeders were the predominant trophic group in grassland (47.7 ± 11.8%) as well as in agroforest soils (40.0 ± 16.0%). Plant type-specific differences were most pronounced for microbial grazers: in grassland, bacterial feeders occurred more than twice as often as fungal feeders, with 30.6 ± 9.7% and 12.4 ± 4.7%, respectively. On the other hand, in agroforest soils the proportions of microbial feeders were equal, with 26.5 ± 12.6% for both fungal and bacterial feeders. Accordingly, the fungal feeder/bacterial feeder ratio (f/b ratio) was three times lower under grass compared to willow. However, due to the strong variation in nematode distribution, the reported changes in nematode community structure are not significantly different. Omnivores and predators were scarce and not affected by land use type.

3.2. The Nematode Micro-Food Web

3.2.1. Natural Stable Isotope Ratios of Soil and Basal Food Web Resources

The δ13C signatures of the soil in grassland (−27.3 ± 0.5‰) and agroforest (−27.8 ± 0.2‰) were higher than the δ13C values of the corresponding shoots (grass: −31.5 ± 1.0‰, willow: −28.5 ± 0.2‰) and roots (grass: −30.5 ± 0.6‰, willow: −28.0 ± 1.1‰), respectively (Figure 1). This was significant for grassland soil compared to shoots (p < 0.01). Similarly, the δ15N signatures of the soil with 5.6 ± 0.7 and 4.7 ± 0.2‰ for grass and willow, respectively, were higher than the δ15N signatures of the shoots (grass: 4.4 ± 2.5‰, willow: −0.9 ± 0.8‰) and the roots (grass: 1.7 ± 0.9‰, willow: 1.0 ± 0.5‰) (Figure 1). This was significant for soil compared to roots in grassland (p < 0.05) and to shoots in agroforest (p < 0.01).

3.2.2. Natural Stable Isotope Ratios of Nematode Trophic Groups

The δ13C signatures of nematodes ranged from −32.5 to −26.6‰ in grassland and from −29.4 to −26.3‰ in agroforest (Figure 1). In grassland soil, predators showed the highest δ13C values ranging from −27.4 to −26.6‰, which was significantly higher (p < 0.05) compared to fungal, bacterial and plant feeders with δ13C signatures ranging from −32.5 to −29.3‰, −32.1 to −28.7‰ and −31.4 to −29.6‰, respectively. Omnivores had the narrowest range in δ13C with −29.8 to −29.1‰.
In contrast, in agroforest soil, the omnivores showed the widest range of δ13C with −29.4 to −27.6‰ compared to all other trophic groups (Figure 1). Bacterial feeders and predators had the lowest δ13C values with −27.0 to −26.3‰ and −27.0 to −26.7‰, respectively. Moreover, the δ13C signatures of omnivores under willow were significantly lower compared to those of bacterial feeders (p < 0.01) and predators (p < 0.05).
The δ15N values in nematode tissues spanned over a much wider range in grassland with 0.1 to 16.2‰ compared to agroforest with 3.0 to 11.5‰. In grassland soil, fungal feeders and predators had high δ15N values ranging from 5.9 to 16.2‰ and from 6.5 to 12.2‰, respectively. Plant feeders displayed low δ15N values with 0.1 to 6.0‰, which were significantly lower (p < 0.05) compared to predators. In agroforest soil, predators showed high δ15N signatures ranging from 8.0 to 11.5‰. Plant feeders and fungal feeders had a low δ15N content with 3.0 to 7.8‰ and 3.2 to 8.2‰, respectively, while bacterial feeders hold an intermediate position with 5.9 to 10.3‰.

3.2.3. Isotopic Fractionation across Trophic Levels

Considering the shifts in 13C of nematode trophic groups compared to basal food web resources, in grassland, omnivores were associated to roots as assigned by an enrichment of ∆13C of 1.2 ± 0.3‰ (Table 2). Compared to roots, microbial grazers showed a weak depletion in 13C between −0.3 ± 1.2‰ and −0.1 ± 1.4‰ for bacterial and fungal feeders, respectively. Predators were clearly separated from the isotopic signal of roots by an enrichment of 13C of 3.5 ± 0.3‰. Further, a distinct fractionation of more than 3‰ occurred between predators and plant feeders (3.3 ± 0.9‰), fungal feeders (3.7 ± 1.6‰) and bacterial feeders (3.8 ± 0.9‰). In contrast, the isotopic signal of omnivores was closer to that of plant, fungal and bacterial feeders with a ∆13C of 0.9 ± 0.5‰, 1.3 ± 1.3‰ and 1.4 ± 1.3‰, respectively.
In the agroforest, the δ13C values of all nematode trophic groups (except omnivores) were linked to the isotopic signal of roots (Table 2). Plant and fungal feeders displayed the closest association with roots by a ∆13C of 0.5 ± 0.5‰ and 0.6 ± 0.4‰, respectively, while bacterial feeders showed a higher fractionation with a ∆13C of 1.3 ± 0.3‰. The isotopic signal of omnivores was slightly depleted in ∆13C of −0.3 ± 0.8‰ compared to root tissue. Moreover, omnivores were clearly separated from microbial grazers as well as plant feeders with a ∆13C of −1.6 ± 0.6‰ to −0.9 ± 1.0‰. On the other hand, predators were related to fungal feeders and plant feeders with a ∆13C of 0.5‰.
The 15N enrichment in nematodes compared to the dominant plant resource (i.e., roots) revealed that in grassland soil, omnivores showed the closest relation to roots with a ∆15N of 4.0 ± 1.7‰ (Table 2). All other nematode trophic groups separated from the isotopic signal of the roots. In agroforest soil, all nematode feeding types showed a distinctly higher 15N signal compared to roots, with a ∆15N ranging from 4.5 ± 2.1‰ in plant feeders to 9.0 ± 1.8‰ in predators.
Regarding the 15N enrichment across the different levels of the micro-food web, in grassland, omnivores may act as predators of fungal feeders as indicated by a ∆15N of 3.2 ± 3.2‰. In contrast, predators showed a trophic linkage to bacterial feeders with a ∆15N of 3.3 ± 1.0‰. In agroforest, however, omnivores were neither related to microbial grazers (bacterial feeders: 0.0 ± 2.2‰; fungal feeders: 1.7 ± 2.8‰) nor plant feeders (2.1 ± 2.6‰). Comparably, predators showed no link to possible nematode prey.

3.3. Pulse-Labeling with 13CO2

3.3.1. Incorporation of 13C into Soil and Basal Food Web Resources

The incorporation of 13C in shoots, roots and the soil after 13CO2 pulse labeling varied significantly between these three resources, as well as between these resources and sampling day in grass and willow (Table 3). For both functional plant types, the shoots allocated more 13C compared to roots (Table 4), with shoots more enriched in grass than in willow, albeit not significantly. The highest levels of enrichment with 13C (expressed in log(Δ13C + 2)) in shoots were detected at day 3 with 6.6 ± 0.3‰ for grass and 5.9 ± 0.5‰ for willow, followed by a gradual decrease to a level of 5.6 ± 0.2‰ and 5.0 ± 0.5‰ until day 28 for grass and willow, respectively. This decrease in 13C was significant between day 3 and 28 for willow (p < 0.05; Table 4).
In comparison to shoots, the 13C incorporation (expressed in log(Δ13C + 2)) into roots was much lower. For grass, the enrichment ranged between 4.9 ± 1.0‰ and 5.7 ± 0.6‰, while in willow roots, no enrichment with 13C was detected. The 13C pulse was generally not visible in the soil (Table 4).

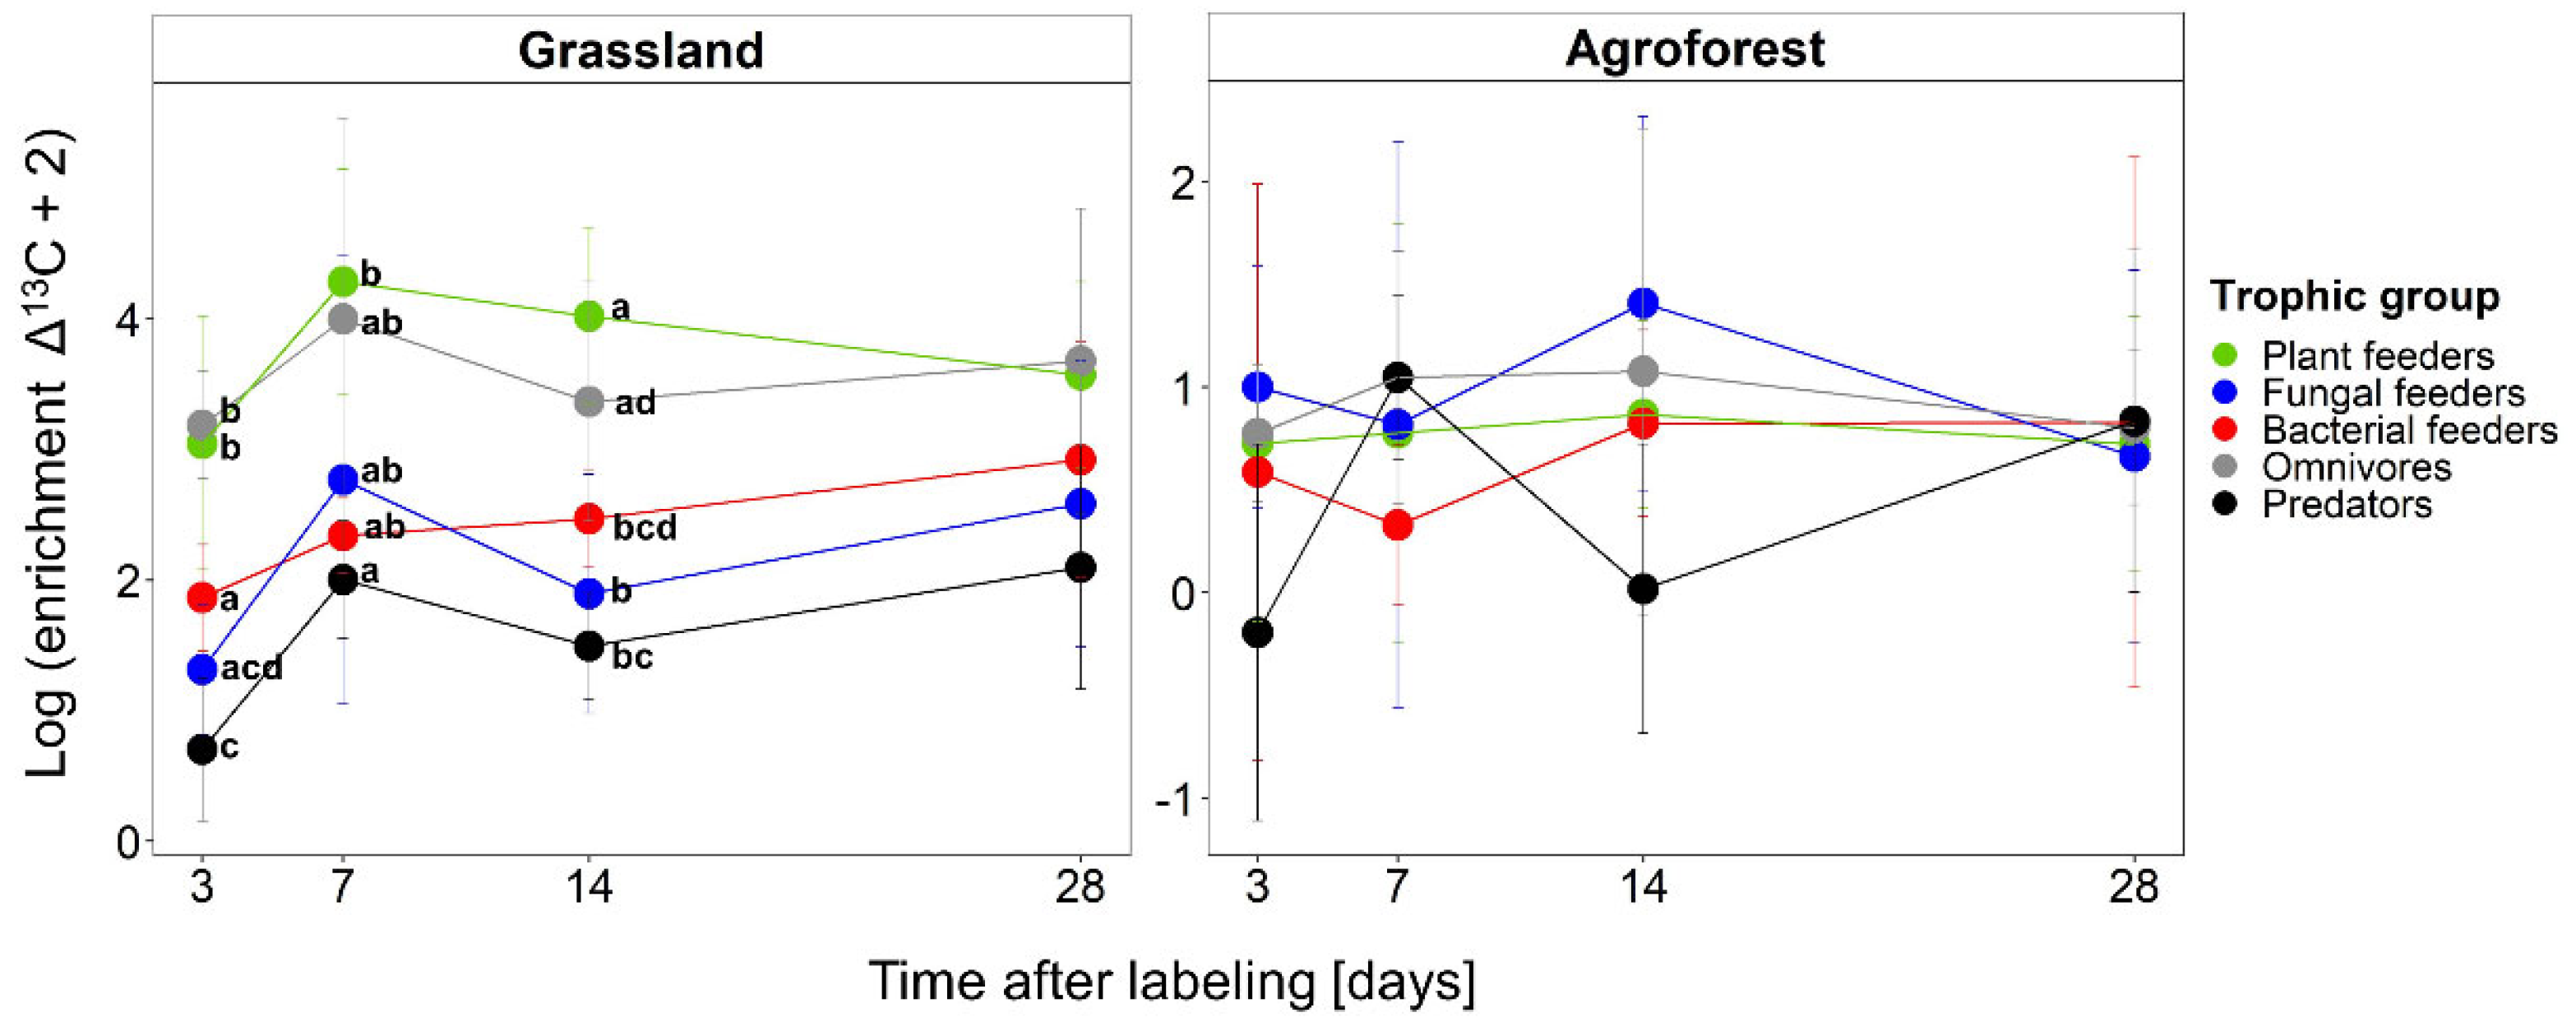
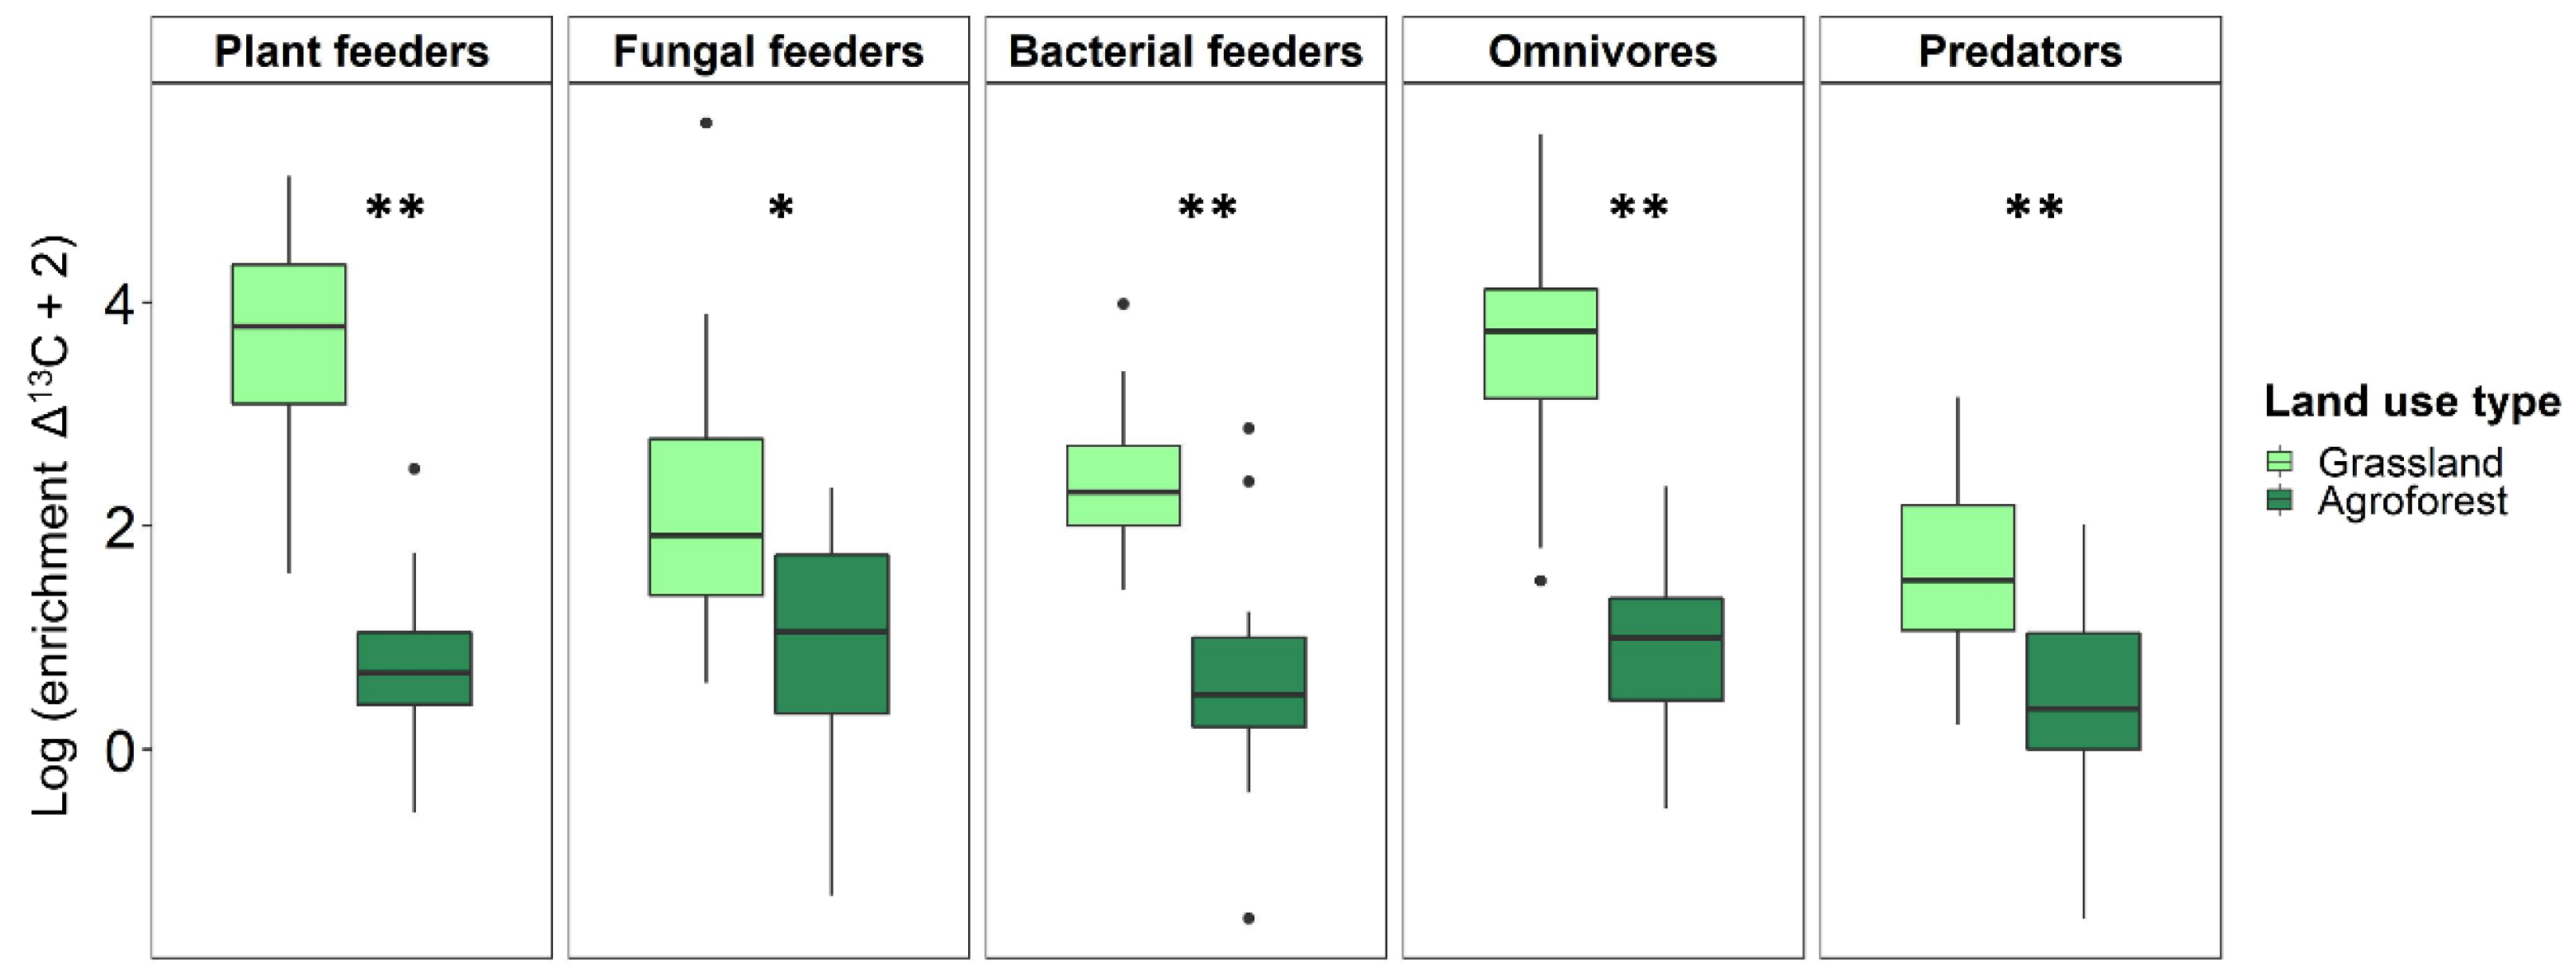
3.3.2. Incorporation of 13C into Nematode Trophic Groups

The enrichment of nematode tissue with 13C varied significantly with trophic group in grassland, showing differences in the incorporation depending on time after labeling (Table 5). The allocation of C derived from recent photo-assimilates was first noticeable at day 3 in plant feeders with Δ13C (log(Δ13C + 2)) values of 3.0 ± 1.0‰, and in omnivores with 3.2 ± 0.4‰ (Figure 2). This was significant in plant feeders as well as omnivores compared to the 13C signal in fungal feeders (p < 0.01), bacterial feeders (p < 0.05), and predators (p < 0.001). The incorporation of plant-derived 13C in plant feeders and omnivores peaked at day 7, followed by a slow decrease until day 28. The allocation of recent photo-assimilates from grass over time was lower in bacterial feeders, omnivores and predators, which was significant at day 14 for fungal feeders and predators compared to plant feeders (p < 0.001) and omnivores (p < 0.05). Predators showed the lowest incorporation of root-derived 13C of all trophic groups.
In agroforest, the incorporation of 13C into nematodes did not differ significantly between trophic groups and stayed relatively constant over time (Table 5). As in grassland, all trophic groups (except predators) under willow soil showed a 13C signal already at day 3, with fungal feeders being most enriched (log(Δ13C + 2): 1.0 ± 0.6‰; Figure 2). Predators reached the peak in 13C allocation at day 7 (Δ13C: 1.0 ± 0.4‰), while fungal feeders and omnivores showed their highest plant C incorporation at day 14 with a Δ13C (log(Δ13C + 2)) of 1.4 ± 0.9‰ and 1.1 ± 1.2‰, respectively, yet not significantly.
Trophic groups in grassland incorporated more 13C than in agroforest (Figure 3), which was significant for plant feeders (t(35) = 10.9, p < 0.001), fungal feeders (t(36) = 3.5, p < 0.01), bacterial feeders (t(37) = 6.8, p < 0.001), omnivores (t(38) = 9.5, p < 0.001) and predators (t(36) = 4.3, p < 0.001). The difference in allocated 13C between plant types was most pronounced for plant feeders and omnivores.

4. Discussion

4.1. Land Use Type Affects The Dominant Soil Carbon and Energy Channel

Grasslands are characterized by a high turnover of shoot and root biomass and consequently by a large pool of organic matter at the soil surface [44]. Further, the grass roots had a low C/N ratio (data not shown). These readily available C resources foster the activity of the bacterial-dominated pathway. Correspondingly, bacterial-feeding nematodes were 18% more abundant under grass than fungal-feeding taxa. In European grasslands bacterial feeders are typically dominant, especially general opportunists of the families Cephalobidae and Plectidae with a high stress tolerance and the ability to survive under food-poor conditions [32,45]. These traits made Cephalobidae also the most abundant nematode family in the investigated grassland soil (Table S1).
The grass–clover mixture of the experimental plots may have additionally enhanced the abundance of bacterial feeders as these are promoted by legumes, while fungal feeders increase under forbs [46]. This is in line with the low f/b ratio averaging 0.4, pointing to a bacteria-mediated decomposition in the grassland soil. Similar f/b ratios have been frequently reported in the literature (e.g., [47,48]). Viketoft et al. [49] monitored the predominating decomposition pathway as indicated by the Nematode Channel Ratio (NCR, ratio between bacterial and fungal feeders) for eight consecutive years in a grassland established on arable soil. They showed that decomposition was mainly bacteria-dominated, even though fungi became more important after year six, when recalcitrant litter has accumulated. A similar trend was reported by Wasilewska [50], who analyzed nematode communities on meadows differing in age (1 to 12 years old): the succession from newly established to permanent meadows led to a shift from bacterial to fungal mediated decomposition, resulting in an overall increase of the f/b ratio with meadow age.
Compared to grassland, forest soil food webs are based on resources with low quality due to the high cellulose and lignin content of leaf litter [51,52]. Accordingly, the C/N ratio of willow twigs and leaves was twice as high as for grass shoots (data not shown). Willow litter contains polyphenols, condensed tannins and glycoside phenols supporting fungal-based decomposition leading to a slow cycling of nutrients [53]. Underlining this, fungal feeders occurred more than twice as often in agroforest than in grassland. This also fits the f/b ratio, which was three times higher under willow compared to grass, with a value of 1.3. Similar results were reported by Háněl [54] who observed the activation of the fungal-based decomposition channel after seven years of succession from abandoned arable field to willow shrub and later forest. A high proportion of fungal feeders in the nematode community is typical for forest systems (e.g., [55,56,57]) and highlights the importance of the fungal-based energy channel under tree cover.
Overall, shifting the arable land to either grassland or agroforest altered the dominance of the soil C and energy channels. The land use change was clearly visible after six years. Culturing willow as short-rotation agroforest led to a switch from bacterial-mediated to fungal-mediated decomposition by accumulation of litter. This changes the conditions in the arable soil from a system with high turnover rates and a rapid nutrient transfer to plants to a slow cycle driven by more complex organic resources [58]. As a result, in agroforest, an increase in soil C sequestration can be expected in the long term.

4.2. The Plant Type Affects Predatory Feeding in Higher Trophic Levels

To what extent plant C is incorporated into the belowground trophic network and fosters higher trophic levels is dependent on plant type and material [59,60]. Unlike grass, trees store C mainly in aboveground organs [61]. Mirroring this, willow shoots were considerably more enriched with 13C than the roots and the soil. Li et al. [62] suggest that high amounts of unlabeled C in the phloem diluted the signal of 13C in roots and more 13C is lost via respiration of aboveground plant parts. Depending on their age, tree leaves can act as either a sink or a source of C and may have additionally affected the C flux between tree and soil. On the other hand, the high turnover of willow fine roots should have stimulated the C flux into the soil leading to an enrichment with organic C [53]. Nevertheless, willows have a high demand on nutrients, particularly when cultivated at high densities [53]. The resulting low availability of basal food web resources in willow soils suppresses bottom-up processes, which can affect food web structure and function.
As a ∆13C of 1‰ between diet and consumer indicates the consumption of this food source, while a ∆15N of 3.4‰ indicates the trophic position of the consumer [63,64], the following patterns were deciphered: in grassland soil, the natural δ13C signatures of omnivores and predators differed clearly from each other, indicating that omnivores do not have the same diet as predators. Moreover, the δ15N was on average 4.1‰ higher than that of omnivores, i.e., predators were one trophic level above omnivores. Thus, the enriched soil conditions, i.e., accumulation of C and nutrients under grass did not foster predatory behavior in omnivores. Rather, the main resources were roots, as suggested by a ∆13C of 1.2‰ and ∆15N of 4.0‰ between omnivores and roots. Presumably, the high number of fine roots of grass can be easily accessed and pierced by their dorylaimoid odontostyle. Supporting this, feeding on plants by different omnivore genera has been previously reported, e.g., Aporcelaimus, Dorylaimellus and Eudorylaimus [42,65], with the latter taxon also detected in the grassland soil of the present study (Table S1).
Surprisingly, predators showed no connection to potential nematode prey, i.e., plant feeders and microbial grazers under grass, as ∆13C exceeded 3‰. Other resources might have been enchytraeids, collembolans, protozoa and rotifers as they are abundant in grassland soils [44,66,67].
In the agroforest soil omnivores had significantly lower δ13C values than predators indicating different C sources. Further, a low ∆15N between omnivores and microbial grazers as well as plant feeders points to a non-predatory diet. Contrasting with this, Kudrin et al. [68] found predatory behavior in omnivores in a spruce forest. In this survey, omnivorous Dorylaimida were enriched by ca. 2‰ and 4‰ compared to bacterial and fungal feeders. However, under willow, omnivores were not only separated from other nematode groups as potential prey, but also from roots by a weak depletion in 13C of −0.3‰ and a distinct enrichment of δ15N by 6.5‰. For Leptonchidae, which occurred in the agroforest soil, fungi were reported as part of the diet [42]. An additional resource might be algae, which are a well-documented food source for omnivorous nematodes [69,70]. Feeding on algae with 13C values below −30‰ [71] would further explain the distinctly lower δ13C values of omnivores in two of the five samples investigated for natural isotope ratios (see Figure 1).
Under willow, predators mainly consumed plant- and fungal-feeding nematodes as indicated by a ∆13C around 0.6‰ and a ∆15N around 4‰. Bacterial feeders were no frequent food source as they showed an isotopic signal comparable to predators with a ∆13C of −0.2‰ only. This finding is interesting as bacterial and fungal feeders were equally abundant in willow soil. Therefore, bacterial feeders might be an unattractive food source, e.g., because of a lower energy content. Supporting this assumption, it has been reported that the bacterial feeder Plectus has less calories than the fungal feeder Aphelenchus [72,73] which both were present in the agroforest soil (Table S1).

4.3. Plant C Flux Is Strongest and Fastest into Basal Trophic Levels

Enrichment with 13C in the nematode tissue was already measurable three days after labeling. Thus, the micro-food webs in both grassland and agroforest were driven by recently fixed plant C. This corresponds with other studies, which detected C enrichment in nematodes two days after labeling with maize as crop [74,75].
As herbivores rely directly on the root as a resource, they are enriched with plant-derived C first [26]. Accordingly, a fast and significant enrichment of 13C in plant feeders occurred under grass. In contrast, in the agroforest soil, plant feeders received plant-derived C slower. Likely, the tougher roots of willow trees are more difficult to penetrate for plant-feeding nematodes compared to grass. Moreover, the nematode community under willow comprised only few plant-parasitic nematodes, but rather more members of the Tylenchidae. These taxa are facultative root and fungal feeders [42] and can change resources if one diet becomes limited [76]. Moreover, willow forms ectomycorrhiza, which can mechanically protect roots against sucking parasites [77]. Supporting this, Háněl [78] suggests that the tylenchid taxon Filenchus feeds on mycorrhiza fungi rather than roots in spruce forest soil.
Compared to plant feeders 13C incorporation into microbial grazers was slower in grassland soil. As bacteria are fast in assimilating root exudates [79,80], bacterial grazers were expected to mirror this by fast enrichment in 13C. This is especially with regard to the high root biomass of perennial grasslands and thus, great availability of plant C due to exudation and rhizodeposition [81]. Further, the f/b ratio indicates that a large portion of C is channeled via the bacterial pathway. However, fungal feeders exhibited an enrichment pattern similar to bacterial feeders. It is likely that, in grassland, fungal feeders are associated with arbuscular mycorrhiza (AM) fungi allocating C directly from their plant host, rather than with saprotrophic fungi relying more on plant litter. Ostle et al. [82] showed that after 13CO2 labeling in grassland 5–8% of the fixed 13C was allocated in AM fungi. Feeding on AM fungi by fungivore nematodes has been reported for members of the families Aphelenchidae and Aphelenchoididae [83,84], both families which occurred in the investigated grassland soil. In contrast to grassland, in an agroforest litter resources become more important. Thus, the relevance of saprotrophic fungi in channeling plant C increases considerably. Accordingly, fungal feeders were the first nematodes that incorporated plant-derived C after labeling.
Due to their higher trophic position in the nematode micro-food web, omnivores and predators are supposed to incorporate plant C with a considerable time lag. Correspondingly, in agroforest soil, the 13C signal in predators was recorded four days later than for the other trophic groups. Contrasting with this, the fast enrichment of 13C in higher trophic levels in grassland soil points to a more rapid transfer of C through the soil food web. Comparably, Strickland et al. [85] reported that labile C propagated within 3 days through a grassland food web, including higher trophic level predators such as mesostigmatid mites.
In sum, the dependence of the nematode micro-food web on photosynthate C as a resource was indicated by the enrichment with 13C, which was higher for each trophic group in grassland than in the agroforest soil. The predominant role of the herbivore food chain in grassland is further highlighted by plant feeders, as the trophic group with the highest 13C allocation. Contrasting with this, the transfer of N to higher trophic levels was mediated by the decomposer food chain with bacteria in a central position (unpubl. data). On the other hand, in the agroforest, C is mainly recruited from soil organic matter (SOM), which fuels the decomposer food web, predominantly fungi and fungal feeders. However, the utilization of SOM by saprotrophic fungi is slower, and thus benefits C sequestration and nutrient retention. Yet, slow decomposition also results in less plant-available N in the agroforest soil, increasing competition for such N forms between plants and soil fauna. The strong links between aboveground vegetation and belowground biota act as drivers for ecosystem processes [86], and, in the case of agroforest as a management practice, can enhance regulating (e.g., C storage) as well as provisioning processes (e.g., biomass production).

5. Conclusions

The trophic structure of the nematode micro-food web, as well as the C flux within differed between grassland and agroforest six years after management change. As soil and environmental conditions were generally homogenous across the field site, these results highlight the role of the land use type in determining the composition and function of the soil food web. The herbivore food chain was promoted in grassland, while the detritivore food chain dominated in agroforest. Agroforestry is an ecologically sustainable management practice and known to, e.g., reduce evaporation, enhance water infiltration, and improve soil structure. The present study indicates that slow decomposition processes are fostered in agroforests, which can increase soil C sequestration. Therefore, this management method should be promoted, especially in view of its potential for a climate change mitigation strategy.

Supplementary Materials

The following supporting information can be downloaded at: https://www.mdpi.com/article/10.3390/agronomy12040976/s1, Table S1: Overview of family structure in grassland and agroforest soil. Figure S1: Overview of study site.

Author Contributions

Experimental design, Methodology, Data curation, L.S. and J.P.; Formal Analysis, Software, C.H. and Z.L.; Validation, Visualization, Writing—Original Draft Preparation, C.H. and L.R.; Investigation, C.H., L.S. and Z.L.; Resources, L.S., J.P. and L.R; Writing—Review & Editing, C.H., L.R. and J.P; Supervision, L.R. and J.P.; Project Administration, J.P. All authors have read and agreed to the published version of the manuscript.

Funding

This research received no external funding.

Institutional Review Board Statement

Not applicable.

Informed Consent Statement

Not applicable.

Data Availability Statement

Not applicable.

Acknowledgments

We gratefully acknowledge the support of Jens Dyckmans and Reinhard Langel (Kompetenzzentrum Stabile Isotope-KOSI, Göttingen) with stable isotope analyses in nematodes. Zhipeng Li was funded by the China Scholarship Council (CSC) (201604910550). The article processing charge was funded by the Deutsche Forschungsgemeinschaft (DFG, German Research Foundation)—491192747 and the Open Access Publication Fund of Humboldt-Universität zu Berlin.

Conflicts of Interest

The authors declare no conflict of interest.

References

  1. Scharlemann, J.P.; Tanner, E.V.; Hiederer, R.; Kapos, V. Global soil carbon: Understanding and managing the largest terrestrial carbon pool. Carbon Manag. 2014, 5, 81–91. [Google Scholar] [CrossRef]
  2. Pausch, J.; Kuzyakov, Y. Carbon input by roots into the soil: Quantification of rhizodeposition from root to ecosystem scale. Glob. Chang. Biol. 2018, 24, 1–12. [Google Scholar] [CrossRef] [PubMed]
  3. Neumann, G.; Romheld, V. The release of root exudates as affected by the plant’s physiological status. In The Rhizosphere; Pinton, R., Varanini, Z., Nannipieri, P., Eds.; CRC Press: Boca Raton, FL, USA, 2007; pp. 23–72. [Google Scholar]
  4. Dennis, P.G.; Miller, A.J.; Hirsch, P.R. Are root exudates more important than other sources of rhizodeposits in structuring rhizosphere bacterial communities? FEMS Microbiol. Ecol. 2010, 72, 313–327. [Google Scholar] [CrossRef] [PubMed] [Green Version]
  5. Kurganova, I.N.; Lopes de Gerenyu, V.O.; Shvidenko, A.Z.; Sapozhnikov, P.M. Changes in the organic carbon pool of abandoned soils in Russia (1990–2004). Eurasian Soil Sci. 2010, 43, 333–340. [Google Scholar] [CrossRef]
  6. Mao, R.; Zeng, D.H.; Hu, Y.L.; Li, L.J.; Yang, D. Soil organic carbon and nitrogen stocks in an age-sequence of poplar stands planted on marginal agricultural land in Northeast China. Plant Soil 2010, 332, 277–287. [Google Scholar] [CrossRef]
  7. Nave, L.E.; Swanston, C.W.; Mishra, U.; Nadelhoffer, K.J. Afforestation effects on soil carbon storage in the United States: A synthesis. Soil Sci. Soc. Am. J. 2013, 77, 1035–1047. [Google Scholar] [CrossRef] [Green Version]
  8. Houghton, R.A.; Goodale, C.L. Effects of land-use change on the carbon balance of terrestrial ecosystems. Ecosyst. Land Use Chang. 2004, 153, 85–98. [Google Scholar]
  9. DuPont, S.T.; Culman, S.W.; Ferris, H.; Buckley, D.H.; Glover, J.D. No-tillage conversion of harvested perennial grassland to annual cropland reduces root biomass, decreases active carbon stocks, and impacts soil biota. Agric. Ecosyst. Environ. 2010, 137, 25–32. [Google Scholar] [CrossRef]
  10. Kuzyakov, Y.; Domanski, G. Carbon input by plants into the soil. J. Plant Nutr. Soil Sci. 2000, 163, 421–431. [Google Scholar] [CrossRef]
  11. Keel, S.G.; Schädel, C. Expanding leaves of mature deciduous forest trees rapidly become autotrophic. Tree Physiol. 2010, 30, 1253–1259. [Google Scholar] [CrossRef] [Green Version]
  12. Barbaroux, C.; Bréda, N.; Dufrêne, E. Distribution of above-ground and below-ground carbohydrate reserves in adult trees of two contrasting broad-leaved species (Quercus petraea and Fagus sylvatica). New Phytol. 2013, 157, 605–615. [Google Scholar] [CrossRef] [PubMed] [Green Version]
  13. Canarini, A.; Kaiser, C.; Merchant, A.; Richter, A.; Wanek, W. Root exudation of primary metabolites: Mechanisms and their roles in plant responses to environmental stimuli. Front. Plant Sci. 2019, 10, 157. [Google Scholar] [CrossRef] [PubMed] [Green Version]
  14. Markwitz, C.; Knohl, A.; Siebicke, L. Evapotranspiration over agroforestry sites in Germany. Biogeosciences 2020, 17, 5183–5208. [Google Scholar] [CrossRef]
  15. Hauk, S.; Wittkopf, S.; Knoke, T. Analysis of commercial short rotation coppices in Bavaria, southern Germany. Biomass Bioenergy 2014, 67, 401–412. [Google Scholar] [CrossRef]
  16. Aylott, M.J.; Casella, E.; Tubby, I.; Street, N.R.; Smith, P.; Taylor, G. Yield and spatial supply of bioenergy poplar and willow short-rotation coppice in the UK. New Phytol. 2008, 178, 358–370. [Google Scholar] [CrossRef]
  17. Kahle, P.; Baum, C.; Boelcke, B.; Kohl, J.; Ulrich, R. Vertical distribution of soil properties under short-rotation forestry in Northern Germany. J. Plant Nutr. Soil Sci. 2010, 173, 737–746. [Google Scholar] [CrossRef]
  18. Börjesson, P.; Tufvesson, L.M. Agricultural crop-based biofuels–resource efficiency and environmental performance including direct land use changes. J. Clean. Prod. 2011, 19, 108–120. [Google Scholar] [CrossRef]
  19. Gissén, C.; Prade, T.; Kreuger, E.; Nges, I.A.; Rosenqvist, H.; Svensson, S.E.; Björnsson, L. Comparing energy crops for biogas production–Yields, energy input and costs in cultivation using digestate and mineral fertilisation. Biomass Bioenergy 2014, 64, 199–210. [Google Scholar] [CrossRef]
  20. Tsonkova, P.; Böhm, C.; Quinkenstein, A.; Freese, D. Ecological benefits provided by alley cropping systems for production of woody biomass in the temperate region: A review. Agrofor. Syst. 2012, 85, 133–152. [Google Scholar] [CrossRef]
  21. Zhao, J.; Neher, D.A. Soil energy pathways of different ecosystems using nematode trophic group analysis: A meta analysis. Nematology 2014, 16, 379–385. [Google Scholar] [CrossRef]
  22. Van Den Hoogen, J.; Geisen, S.; Routh, D.; Ferris, H.; Traunspurger, W.; Wardle, D.A.; Crowther, T.W. Soil nematode abundance and functional group composition at a global scale. Nature 2019, 572, 194–198. [Google Scholar] [CrossRef] [PubMed] [Green Version]
  23. Čerevková, A. Nematode communities in three types of grassland in the Slovak Republic. Helminthologia 2006, 43, 171–176. [Google Scholar] [CrossRef] [Green Version]
  24. Háněl, L. Succession of soil nematodes in pine forests on coal-mining sands near Cottbus, Germany. Appl. Soil Ecol. 2001, 16, 23–34. [Google Scholar] [CrossRef]
  25. Crotty, F.; Blackshaw, R.; Murray, P. Tracking the flow of bacterially derived 13C and 15N through soil faunal feeding channels. Rapid Commun. Mass Spectrom. 2011, 25, 1503–1513. [Google Scholar] [CrossRef]
  26. Moore, J.C.; McCann, K.; Setälä, H.; De Ruiter, P.C. Top-down is bottom-up: Does predation in the rhizosphere regulate aboveground dynamics? Ecology 2003, 84, 846–857. [Google Scholar] [CrossRef]
  27. Ferris, H.; Matute, M. Structural and functional succession in the nematode fauna of a soil food web. Appl. Soil Ecol. 2003, 23, 93–110. [Google Scholar] [CrossRef]
  28. Scheu, S.; Ruess, L.; Bonkowski, M. Interactions between microorganisms and soil micro-and mesofauna. In Microorganisms in Soils: Roles in Genesis and Functions; Buscot, F., Varma, A., Eds.; Springer: Berlin/Heidelberg, Germany, 2005; pp. 253–275. [Google Scholar]
  29. Yeates, G.W.; Bongers, T. Nematode diversity in agroecosystems. Agric. Ecosyst. Environ. 1999, 74, 113–135. [Google Scholar] [CrossRef]
  30. Griffiths, B. A comparison of microbial-feeding nematodes and protozoa in the rhizosphere of different plants. Biol. Fertil. Soils 1990, 9, 83–88. [Google Scholar] [CrossRef]
  31. Gebremikael, M.T.; Steel, H.; Buchan, D.; Bert, W.; De Neve, S. Nematodes enhance plant growth and nutrient uptake under C and N-rich conditions. Sci. Rep. 2016, 6, 1032862. [Google Scholar] [CrossRef]
  32. Bongers, T.; Bongers, M. Functional diversity of nematodes. Appl. Soil Ecol. 1998, 10, 239–251. [Google Scholar] [CrossRef]
  33. Ferris, H.; Bongers, T.; De Goede, R. A framework for soil food web diagnostics: Extension of the nematode faunal analysis concept. Appl. Soil Ecol. 2001, 18, 13–29. [Google Scholar] [CrossRef]
  34. Hu, N.; Li, H.; Tang, Z.; Li, Z.; Tian, J.; Lou, Y.; Li, J.; Li, G.; Hu, X. Community diversity, structure and carbon footprint of nematode food web following reforestation on degraded Karst soil. Sci. Rep. 2016, 6, 28138. [Google Scholar] [CrossRef] [Green Version]
  35. Hartmann, L.; Richter, F.; Busch, G.; Ehret, M.; Jansen, M.; Lamersdorf, N. Establishment of short rotation coppices in the South of Lower Saxony and in Central Thuringia in the context of the BEST-research framework-site characteristics and initial biomass production. Forstarchiv 2014, 85, 134–150. [Google Scholar]
  36. Hartmann, L.; Lamersdorf, N. Site conditions, initial growth and nutrient and litter cycling of newly installed short rotation coppice and agroforestry systems. In Bioenergy from Dendromass for the Sustainable Development of Rural Areas; Manning, D.B., Bemmann, A., Bredemeier, M., Lamersdorf, N., Ammer, C., Eds.; Wiley-VHC Verlag GmbH & Co. KGaA: Weinheim, Germany, 2015; pp. 121–138. [Google Scholar]
  37. Tariq, A.; Gunina, A.; Lamersdorf, N. Initial changes in soil properties and carbon sequestration potential under monocultures and short-rotation alley coppices with poplar and willow after three years of plantation. Sci. Total Environ. 2018, 634, 963–973. [Google Scholar] [CrossRef] [PubMed]
  38. Ehret, M.; Bühle, L.; Graß, R.; Lamersdorf, N.; Wachendorf, M. Bioenergy provision by an alley cropping system of grassland and shrub willow hybrids: Biomass, fuel characteristics and net energy yields. Agrofor. Syst. 2015, 89, 365–381. [Google Scholar] [CrossRef]
  39. Walter, K.; Don, A.; Flessa, H. Net N2O and CH4 soil fluxes of annual and perennial bioenergy crops in two central German regions. Biomass Bioenergy 2015, 81, 556–567. [Google Scholar] [CrossRef]
  40. Ruess, L. Studies on the nematode fauna of an acid forest soil: Spatial distribution and extraction. Nematologica 1995, 41, 229–239. [Google Scholar] [CrossRef]
  41. Bongers, T. De Nematoden van Nederland; Stichting Uitgeverij van de Koninklijke Natuurhistorische Vereniging: Utrecht, The Netherlands, 1994; pp. 1–408. [Google Scholar]
  42. Yeates, G.W.; Bongers, T.D.; De Goede, R.G.M.; Freckman, D.; Georgieva, S. Feeding habits in soil nematode families and genera–an outline for soil ecologists. J. Nematol. 1993, 25, 315–331. [Google Scholar]
  43. Langel, R.; Dyckmans, J. Combined 13C and 15N isotope analysis on small samples using a near-conventional elemental analyzer/isotope ratio mass spectrometer setup. Rapid Commun. Mass Spectrom. 2014, 28, 1019–1022. [Google Scholar] [CrossRef]
  44. Bardgett, R.D.; Cook, R. Functional aspects of soil animal diversity in agricultural grasslands. Appl. Soil Ecol. 1998, 10, 263–276. [Google Scholar] [CrossRef]
  45. Renčo, M. The soil nematodes in natural and semi-natural grasslands and their use as bioindicators. In Grasslands: Types, Biodiversity and Impacts; Zhang, W., Ed.; Nova Science Publishers, Inc.: New York, NY, USA, 2012; pp. 119–145. [Google Scholar]
  46. Viketoft, M.; Sohlenius, B. Soil nematode populations in a grassland plant diversity experiment run for seven years. Appl. Soil Ecol. 2011, 48, 174–184. [Google Scholar] [CrossRef]
  47. Chen, D.; Pan, Q.; Bai, Y.; Hu, S.; Huang, J.; Wang, Q.; Han, X. Effects of plant functional group loss on soil biota and net ecosystem exchange: A plant removal experiment in the Mongolian grassland. J. Ecol. 2016, 104, 734–743. [Google Scholar] [CrossRef] [Green Version]
  48. McSorley, R. Effect of disturbances on trophic groups in soil nematode assemblages. Nematology 2011, 13, 553–559. [Google Scholar] [CrossRef]
  49. Viketoft, M.; Sohlenius, B.; Boström, S.; Palmborg, C.; Bengtsson, J.; Berg, M.P.; Huss Danell, K. Temporal dynamics of soil nematode communities in a grassland plant diversity experiment. Soil Biol. Biochem. 2011, 43, 1063–1070. [Google Scholar] [CrossRef]
  50. Wasilewska, L. The effect of age of meadows on succession and diversity in soil nematode communities. Pedobiologia 1994, 38, 1–11. [Google Scholar]
  51. Ruess, L. Nematode soil faunal analysis of decomposition pathways in different ecosystems. Nematology 2003, 5, 179–181. [Google Scholar] [CrossRef]
  52. Van Der Heijden, M.G.; Bardgett, R.D.; Van Straalen, N.M. The unseen majority: Soil microbes as drivers of plant diversity and productivity in terrestrial ecosystems. Ecol. Lett. 2008, 11, 296–310. [Google Scholar] [CrossRef]
  53. Stauffer, M.; Leyval, C.; Brun, J.-J.; Leportier, P.; Berthelin, J. Effect of willow short rotation coppice on soil properties after three years of growth as compared to forest, grassland and arable land uses. Plant Soil 2014, 377, 423–438. [Google Scholar] [CrossRef] [Green Version]
  54. Háněl, L. An outline of soil nematode succession on abandoned fields in South Bohemia. Appl. Soil Ecol. 2010, 46, 355–371. [Google Scholar] [CrossRef]
  55. Kitagami, Y.; Torii, M.; Matsuda, Y. Characterizations of community and trophic structures of soil nematodes in a coastal Japanese black pine forest. Nematol. Res. Jpn. J. Nematol. 2016, 46, 71–78. [Google Scholar] [CrossRef] [Green Version]
  56. Yeates, G.W. Abundance, diversity, and resilience of nematode assemblages in forest soils. Can. J. For. Res. 2007, 37, 216–225. [Google Scholar] [CrossRef]
  57. Zhang, X.; Guan, P.; Wang, Y.; Li, Q.; Zhang, S.; Zhang, Z.; Liang, W. Community composition, diversity and metabolic footprints of soil nematodes in differently-aged temperate forests. Soil Biol. Biochem. 2015, 80, 118–126. [Google Scholar] [CrossRef]
  58. Ruess, L.; Ferris, H. Decomposition pathways and successional changes. Nematol. Monogr. Perspect. 2004, 2, 547–556. [Google Scholar]
  59. Klarner, B.; Ehnes, R.B.; Erdmann, G.; Eitzinger, B.; Pollierer, M.M.; Maraun, M.; Scheu, S. Trophic shift of soil animal species with forest type as indicated by stable isotope analysis. Oikos 2014, 123, 1173–1181. [Google Scholar] [CrossRef]
  60. Scheunemann, N.; Digel, C.; Scheu, S.; Butenschoen, O. Roots rather than shoot residues drive soil arthropod communities of arable fields. Oecologia 2015, 179, 1135–1145. [Google Scholar] [CrossRef] [PubMed]
  61. Furze, M.E.; Huggett, B.A.; Aubrecht, D.M.; Stolz, C.D.; Carbone, M.S.; Richardson, A.D. Whole-tree nonstructural carbohydrate storage and seasonal dynamics in five temperate species. New Phytol. 2019, 221, 1466–1477. [Google Scholar] [CrossRef]
  62. Li, Z.; Scheunemann, N.; Potapov, A.M.; Shi, L.; Pausch, J.; Scheu, S.; Pollierer, M.M. Incorporation of root-derived carbon into soil microarthropods varies between cropping systems. Biol. Fertil. Soils 2020, 56, 839–851. [Google Scholar] [CrossRef]
  63. Albers, D.; Schaefer, M.; Scheu, S. Incorporation of plant carbon into the soil animal food web of an arable system. Ecology 2006, 87, 235–245. [Google Scholar] [CrossRef]
  64. Middelburg, J. Stable isotopes dissect aquatic food webs from the top to the bottom. Biogeosciences 2014, 11, 2357–2371. [Google Scholar] [CrossRef] [Green Version]
  65. Wood, F.H. Nematode feeding relationships: Feeding relationships of soil-dwelling nematodes. Soil Biol. Biochem. 1973, 5, 593–601. [Google Scholar] [CrossRef]
  66. Curry, J.P. The invertebrate fauna of grassland and its influence on productivity. 1. The composition of the fauna. Grass Forage Sci. 1987, 42, 103–120. [Google Scholar] [CrossRef]
  67. Murray, P.J.; Cook, R.; Currie, A.F.; Dawson, L.A.; Gange, A.C.; Grayston, S.J.; Treonis, M. Interactions between fertilizer addition, plants and the soil environment: Implications for soil faunal structure and diversity. Appl. Soil Ecol. 2006, 33, 199–207. [Google Scholar] [CrossRef]
  68. Kudrin, A.A.; Tsurikov, S.M.; Tiunov, A.V. Trophic position of microbivorous and predatory soil nematodes in a boreal forest as indicated by stable isotope analysis. Soil Biol. Biochem. 2015, 86, 193–200. [Google Scholar] [CrossRef]
  69. McSorley, R. Ecology of the dorylaimid omnivore genera Aporcelaimellus, Eudorylaimus and Mesodorylaimus. Nematology 2012, 14, 645–663. [Google Scholar] [CrossRef]
  70. Ngosong, C.; Buse, T.; Ewald, M.; Richter, A.; Glaser, K.; Schöning, I.; Ruess, L. Influence of management intensity and environmental conditions on microbiota in biological soil crust and crust-free soil habitats of temperate forests. Soil Biol. Biochem. 2020, 144, 107761. [Google Scholar] [CrossRef]
  71. France, R. Carbon-13 enrichment in benthic compared to planktonic algae: Foodweb implications. Mar. Ecol. Prog. Ser. 1995, 124, 307–312. [Google Scholar] [CrossRef]
  72. Croll, N.A.; de Soyza, K. Comparative calorie values of nematodes. J. Nematol. 1980, 12, 132–135. [Google Scholar]
  73. Yeates, G. Nematoda of a Danish beech forest. I. Methods and general analysis. Oikos 1972, 23, 178–189. [Google Scholar] [CrossRef]
  74. Pausch, J.; Kramer, S.; Scharroba, A.; Scheunemann, N.; Butenschoen, O.; Kandeler, E.; Marhan, S.; Riederer, M.; Scheu, S.; Kuzyakov, Y.; et al. Small but active–pool size does not matter for carbon incorporation in below-ground food webs. Funct. Ecol. 2016, 30, 479–489. [Google Scholar] [CrossRef]
  75. Pausch, J.; Hofmann, S.; Scharroba, A.; Kuzyakov, Y.; Ruess, L. Fluxes of root-derived carbon into the nematode micro-food web of an arable soil. Food Webs 2016, 9, 32–38. [Google Scholar] [CrossRef]
  76. Glavatska, O.; Müller, K.; Butenschoen, O.; Schmalwasser, A.; Kandeler, E.; Scheu, S.; Totsche, K.U.; Ruess, L. Disentangling the root-and detritus-based food chain in the micro-food web of an arable soil by plant removal. PLoS ONE 2017, 12, e0180264. [Google Scholar] [CrossRef] [PubMed] [Green Version]
  77. Maboreke, H.R.; Feldhahn, L.; Bönn, M.; Tarkka, M.T.; Buscot, F.; Herrmann, S.; Ruess, L. Transcriptome analysis in oak uncovers a strong impact of endogenous rhythmic growth on the interaction with plant-parasitic nematodes. BMC Genom. 2016, 17, 1–16. [Google Scholar] [CrossRef] [PubMed] [Green Version]
  78. Háněl, L. Soil nematodes in five spruce forests on the Beskydy mountains, Czech Republic. Fundam. Appl. Nematol. 1996, 19, 15–24. [Google Scholar]
  79. Kuzyakov, Y. Priming effects: Interactions between living and dead organic matter. Soil Biol. Biochem. 2010, 42, 1363–1371. [Google Scholar] [CrossRef]
  80. Kuzyakov, Y.; Gavrichkova, O. Time lag between photosynthesis and carbon dioxide efflux from soil: A review of mechanisms and controls. Glob. Chang. Biol. 2010, 16, 3386–3406. [Google Scholar] [CrossRef]
  81. Culman, S.W.; DuPont, S.T.; Glover, J.D.; Buckley, D.H.; Fick, G.W.; Ferris, H.; Crews, T.E. Long-term impacts of high-input annual cropping and unfertilized perennial grass production on soil properties and belowground food webs in Kansas, USA. Agric. Ecosyst. Environ. 2010, 137, 13–24. [Google Scholar] [CrossRef]
  82. Ostle, N.; Whiteley, A.S.; Bailey, M.J.; Sleep, D.; Ineson, P.; Manefield, M. Active microbial RNA turnover in a grassland soil estimated using a 13CO2 spike. Soil Biol. Biochem. 2003, 35, 877–885. [Google Scholar] [CrossRef]
  83. Bakhtiar, Y.; Miller, D.; Cavagnaro, T.; Smith, S. Interactions between two arbuscular mycorrhizal fungi and fungivorous nematodes and control of the nematode with fenamifos. Appl. Soil Ecol. 2001, 17, 107–117. [Google Scholar] [CrossRef]
  84. Hua, J.; Jiang, Q.; Bai, J.; Ding, F.; Lin, X.; Yin, Y. Interactions between arbuscular mycorrhizal fungi and fungivorous nematodes on the growth and arsenic uptake of tobacco in arsenic-contaminated soils. Appl. Soil Ecol. 2014, 84, 176–184. [Google Scholar] [CrossRef]
  85. Strickland, M.S.; Wickings, K.; Bradford, M.A. The fate of glucose, a low molecular weight compound of root exudates, in the belowground foodweb of forests and pastures. Soil Biol. Biochem. 2012, 49, 23–29. [Google Scholar] [CrossRef]
  86. Grigulis, K.; Lavorel, S.; Krainer, U.; Legay, N.; Baxendale, C.; Dumont, M.; Clément, J. Relative contributions of plant traits and soil microbial properties to mountain grassland ecosystem services. J. Ecol. 2013, 101, 47–57. [Google Scholar] [CrossRef] [Green Version]
Figure 1. Natural stable isotope signatures of C (‰ δ13C) and N (‰ δ15N) of the soil, the basal plant resources shoots and roots, and in nematode trophic groups in grassland and agroforest systems.
Agronomy 12 00976 g001
Figure 2. Enrichment with 13C [(log(Δ13C + 2) in‰ ± s.d.] of nematode trophic groups at 3, 7, 14 and 28 days after 13CO2 labeling of grass and willow. Values with no or the same letter are not significantly different according to Tukey’s HSD test at p < 0.05. Letters denote significant differences between Δ13C between the nematode trophic groups for each sampling day.
Agronomy 12 00976 g002
Figure 3. Comparison between the enrichment with 13C [(log(Δ13C + 2) in‰] of nematode trophic groups in grassland and agroforest soils. All sampling dates (i.e., 3, 7, 14 and 28 days after 13CO2 labeling) are bulked together. Two-sample t-test with *, ** at p < 0.01, 0.001.
Agronomy 12 00976 g003
Table 1. Mean nematode population density [Ind. g−1 DW ± s.d.], proportion of trophic groups [% ± s.d.] as well as the fungal to bacterial feeder ratio (f/b ± s.d.) across all sampling days in grassland and agroforest soils.
GrasslandAgroforest
Population density (Ind. g−1)21.3 ± 8.019.5 ± 8.8
Trophic groups (%)
Plant feeders47.7 ± 11.840.0 ± 16.0
Fungal feeders12.4 ± 4.726.1 ± 14.7
Bacterial feeders30.6 ± 9.726.8 ± 10.3
Omnivores6.5 ± 4.45.4 ± 3.9
Predators2.8 ± 2.61.6 ± 1.5
f/b ratio0.4 ± 0.21.3 ± 1.0
Table 2. Isotopic fractionation of 13C [Δ13C in‰ ± s.d.] and 15N stable isotopes [Δ15N in‰ ± s.d] between roots as dominant resource and the different trophic groups of nematodes in the micro-food web of a grassland and agroforest soil.
Land Use TypeResourcePlant FeedersFungal FeedersBacterial FeedersOmnivoresPredators
13C
GrasslandPlant material
root0.2 ± 0.7−0.1 ± 1.4−0.3 ± 1.21.2 ± 0.33.5 ± 0.3
Nematodes
Plant feeders 0.9 ± 0.53.3 ± 0.9
Fungal feeders 1.3 ± 1.33.7 ± 1.6
Bacterial feeders 1.4 ± 1.33.8 ± 0.9
AgroforestPlant material
root0.5 ± 0.50.6 ± 0.41.3 ± 0.3−0.3 ± 0.81.1 ± 0.3
Nematodes
Plant feeders −0.9 ± 1.00.5 ± 0.4
Fungal feeders −0.9 ± 0.50.5 ± 0.3
Bacterial feeders −1.6 ± 0.6−0.2 ± 0.3
15N
GrasslandPlant material
root2.1 ± 2.47.8 ± 4.14.8 ± 1.74.0 ± 1.78.1 ± 2.1
Nematodes
Plant feeders 1.9 ± 3.46.0 ± 3.8
Fungal feeders 3.2 ± 3.20.3 ± 4.5
Bacterial feeders −0.9 ± 2.53.3 ± 1.0
AgroforestPlant material
root4.5 ± 2.14.9 ± 2.26.5 ± 1.66.5 ± 0.99.0 ± 1.8
Nematodes
Plant feeders 2.1 ± 2.64.4 ± 1.1
Fungal feeders 1.7 ± 2.84.8 ± 3.1
Bacterial feeders 0.0 ± 2.23.6 ± 1.8
Table 3. Linear mixed-effect model table of type III error for the effect of basal resources and the soil, sampling day and their interaction on the incorporation of 13C into different plant parts and into the soils of grassland and agroforest.
Land Use TypeFactorSum of SquareMean of Squaredf1df2F Valuep Value
Grasslandres175.0487.70236106.89<0.001
Day2.780.933361.130.35
res × day17.412.906363.540.01
Agroforestres161.6380.81229.20214.55<0.001
Day0.530.18329.260.470.71
res × day8.781.46629.223.880.01
df1 numerator degree of freedom, df2 denominator degree of freedom, res resources.
Table 4. Enrichment with 13C [log(Δ13C + 2) in‰ ± s.d.] in basal food web resources, i.e., the tissues of grass and willow, and the soil underneath at day 3, 7, 14 and 28 after 13CO2 labeling. Values with no or the same letter are not significantly different according to Tukey’s HSD test at p < 0.05. Letters denote significant differences between Δ13C between the four sampling days for each basal resource of grass and willow.
DayGrassWillow
Soil31.1 ± 0.35.6 ± 0.2
71.8 ± 0.91.4 ± 0.7
141.3 ± 0.51.2 ± 0.2
281.2 ± 0.21.3 ± 0.1
Root35.0 ± 0.61.0 ± 1.4
75.0 ± 0.60.7 ± 1.3
144.9 ± 1.02.5 ± 0.6
285.7 ± 0.62.1 ± 1.1
Shoot36.6 ± 0.35.9 ± 0.5 a
74.0 ± 2.55.8 ± 0.1 ab
146.4 ± 0.35.3 ± 0.3 ab
285.6 ± 0.25.0 ± 0.5 b
Table 5. Linear mixed-effect model table of type III error for the effect of trophic group, sampling day and their interaction on the incorporation of 13C into nematode tissue in grassland and agroforest soils.
Land Use TypeFactorSum of SquareMean of Squaredf1df2F Valuep Value
Grasslandtg69.0817.27475.1022.51<0.001
Day16.395.46375.107.12<0.001
tg × day5.040.421275.090.550.08
Agroforesttg3.010.75469.011.150.34
Day0.930.31369.100.480.70
tg × day6.670.561269.040.850.60
df1 numerator degree of freedom, df2 denominator degree of freedom, tg trophic groups.
Publisher’s Note: MDPI stays neutral with regard to jurisdictional claims in published maps and institutional affiliations.

