Article

Subsurface Drip Irrigation with Emitters Placed at Suitable Depth Can Mitigate N2O Emissions and Enhance Chinese Cabbage Yield under Greenhouse Cultivation

1
College of Agricultural Science and Engineering, Hohai University, Nanjing 210098, China
2
Planning and Planning Department, Yixing Water Resources Bureau, Wuxi 214200, China
3
State Key Laboratory of Hydrology-Water Resources and Hydraulic Engineering, Hohai University, Nanjing 210098, China
4
College of Chemical Engineering, Nanjing Forestry University, Nanjing 210037, China
*
Author to whom correspondence should be addressed.
Agronomy 2022, 12(3), 745; https://doi.org/10.3390/agronomy12030745
Submission received: 12 February 2022 / Revised: 10 March 2022 / Accepted: 17 March 2022 / Published: 20 March 2022

Abstract

:
Agricultural practices, such as applying excessive water and nitrogen fertilizer to increase the crop yield, can be a significant source of greenhouse gas emissions (GHGs). Therefore, techniques and proper management are needed to mitigate these emissions without yield reduction. The experiment used three subsurface drip irrigation (SDI) depths with emitters buried at 0.05, 0.10, and 0.15 m below the soil surface, along with two nitrogen fertilizer (Urea, N > 46.2%) application levels of 300 kg N ha−1 (N300) and 240 kg N ha−1 (N240) to investigate the effect of vertical and horizontal water and fertilizer distribution on N2O emissions under different SDI techniques in greenhouse conditions. The results indicated that soil N2O emissions from SDI10 and SDI15 decreased by 7.06% and 10.69%, respectively, compared to SDI5. N2O, WFPS, NH4+-N, and NO3-N were significantly reduced with the increased radial distance from the emitter. N2O was positively correlated to WFPS and NH4+-N while negatively correlated to NO3-N. The NH4+-N and NO3-N concentrations decreased with depth and increased with fertilization events. Furthermore, N2O, WFPS, NH4+-N, and NO3-N were increased under N300 compared to N240 (p > 0.05). The findings demonstrated that the Chinese cabbage yield was significantly enhanced under SDI15 compared to SDI5 and SDI10. Furthermore, N300 can increase the cabbage yield more than N240 among all treatments.

1. Introduction

One of the three major greenhouse gases (GHGs), nitrous oxide (N2O), has a global warming potential 265 times that of an equivalent amount of carbon dioxide (CO2) over 100 years [1]. Agricultural practices such as water and nitrogen (N) management can contribute to GHGs emissions [2]. Agricultural soils are the most significant sources of N2O, contributing about 60–80% of the total global anthropogenic N2O emitted into the atmosphere [3,4]. The microbiological processes of nitrification produce N2O under aerobic conditions and denitrification under anaerobic conditions, which are controlled by several factors, including soil moisture (θ), soil temperature, agricultural activities, and the availability of C, O2, and mineral N [5]. Therefore, proper water and fertilizer management measures are important to reduce soil N2O emissions. Research on this topic will provide essential guidance on how we can slow down the global greenhouse effect.
(θ) is one of the most critical factors affecting N2O emissions since the level and distribution of water in the soil can provide suitable or unsuitable conditions for microorganisms, thereby affecting the activity of soil microorganisms and the discharge of N2O [6,7]. Therefore, managing θ is the most important key to mitigating N2O emissions from agricultural soil. Several studies have investigated the effects of θ on N2O emissions in a greenhouse environment. For example, Ye et al. [8] demonstrated that θ was the main factor affecting soil N2O emissions. Edwards et al. [9] stated that lesser N2O emissions occurred under SDI and DI.
Growers in China are still using high nutrient and water inputs to obtain a higher yield [10,11]. Excessive irrigation watering and N fertilizer application have caused several environmental problems, including GHGs emissions. In contrast, low mineral nutrition affects overall plant growth [12]. SDI is a more effective water management method than other irrigation methods. It has numerous benefits, including water savings, easy fertigation, less surface runoff, and deep percolation [13]. Many studies have demonstrated that different irrigation methods have different effects on θ distribution, and thus, N2O emissions. For example, Sanchez-Martin et al. [14] found that N2O emissions were influenced by the irrigation system and the mineral fertilizer applied. Peaks in N2O are generally driven by fertilizer application or irrigation. In a pair of studies, SDI markedly reduced N2O emissions compared with DI [9,15]. Reducing surface soil wetting through SDI reduces N2O emissions [16,17]. To the best of our knowledge, barely any previous studies have investigated the dynamics of soil water and N and their effects on N2O emissions under different depths of SDI, or investigated the influence of the horizontal water and nutrient distribution on N2O emissions. Thus, we hypothesized that SDI with emitters placed at a suitable depth could mitigate N2O emissions and enhance crop yield. The objectives were: to study the differences in soil moisture, nitrogen, and N2O emissions under different depths of SDI irrigation; to reveal the response of soil N2O emissions to water and nitrogen dynamics; to explore the appropriate buried depth of SDI that provides high-efficiency N2O reduction while maintaining a high crop yield.

2. Materials and Methods

2.1. Descriptions of Study Area

Greenhouse production of Chinese cabbage [Brassica rapa subsp. pekinensis (Lour.) Hanelt] under natural light conditions was carried out at the Water-Saving Park of Hohai University, Nanjing, Jiangsu province, China (31°95′ N, 118°83′ E; elevation 15 m AMSL). The climate of the study area is characterized as humid and is under the influence of the East Asian Monsoon. The mean temperature in the greenhouse was 21.0 °C, and the mean relative humidity was 58% during the experimental period. The experimental plots were manually prepared with conventional tillage to a depth of 0.30 m. The soil of the experimental field was clay loam. The soil’s chemical and physical properties were described in our previous work [18].

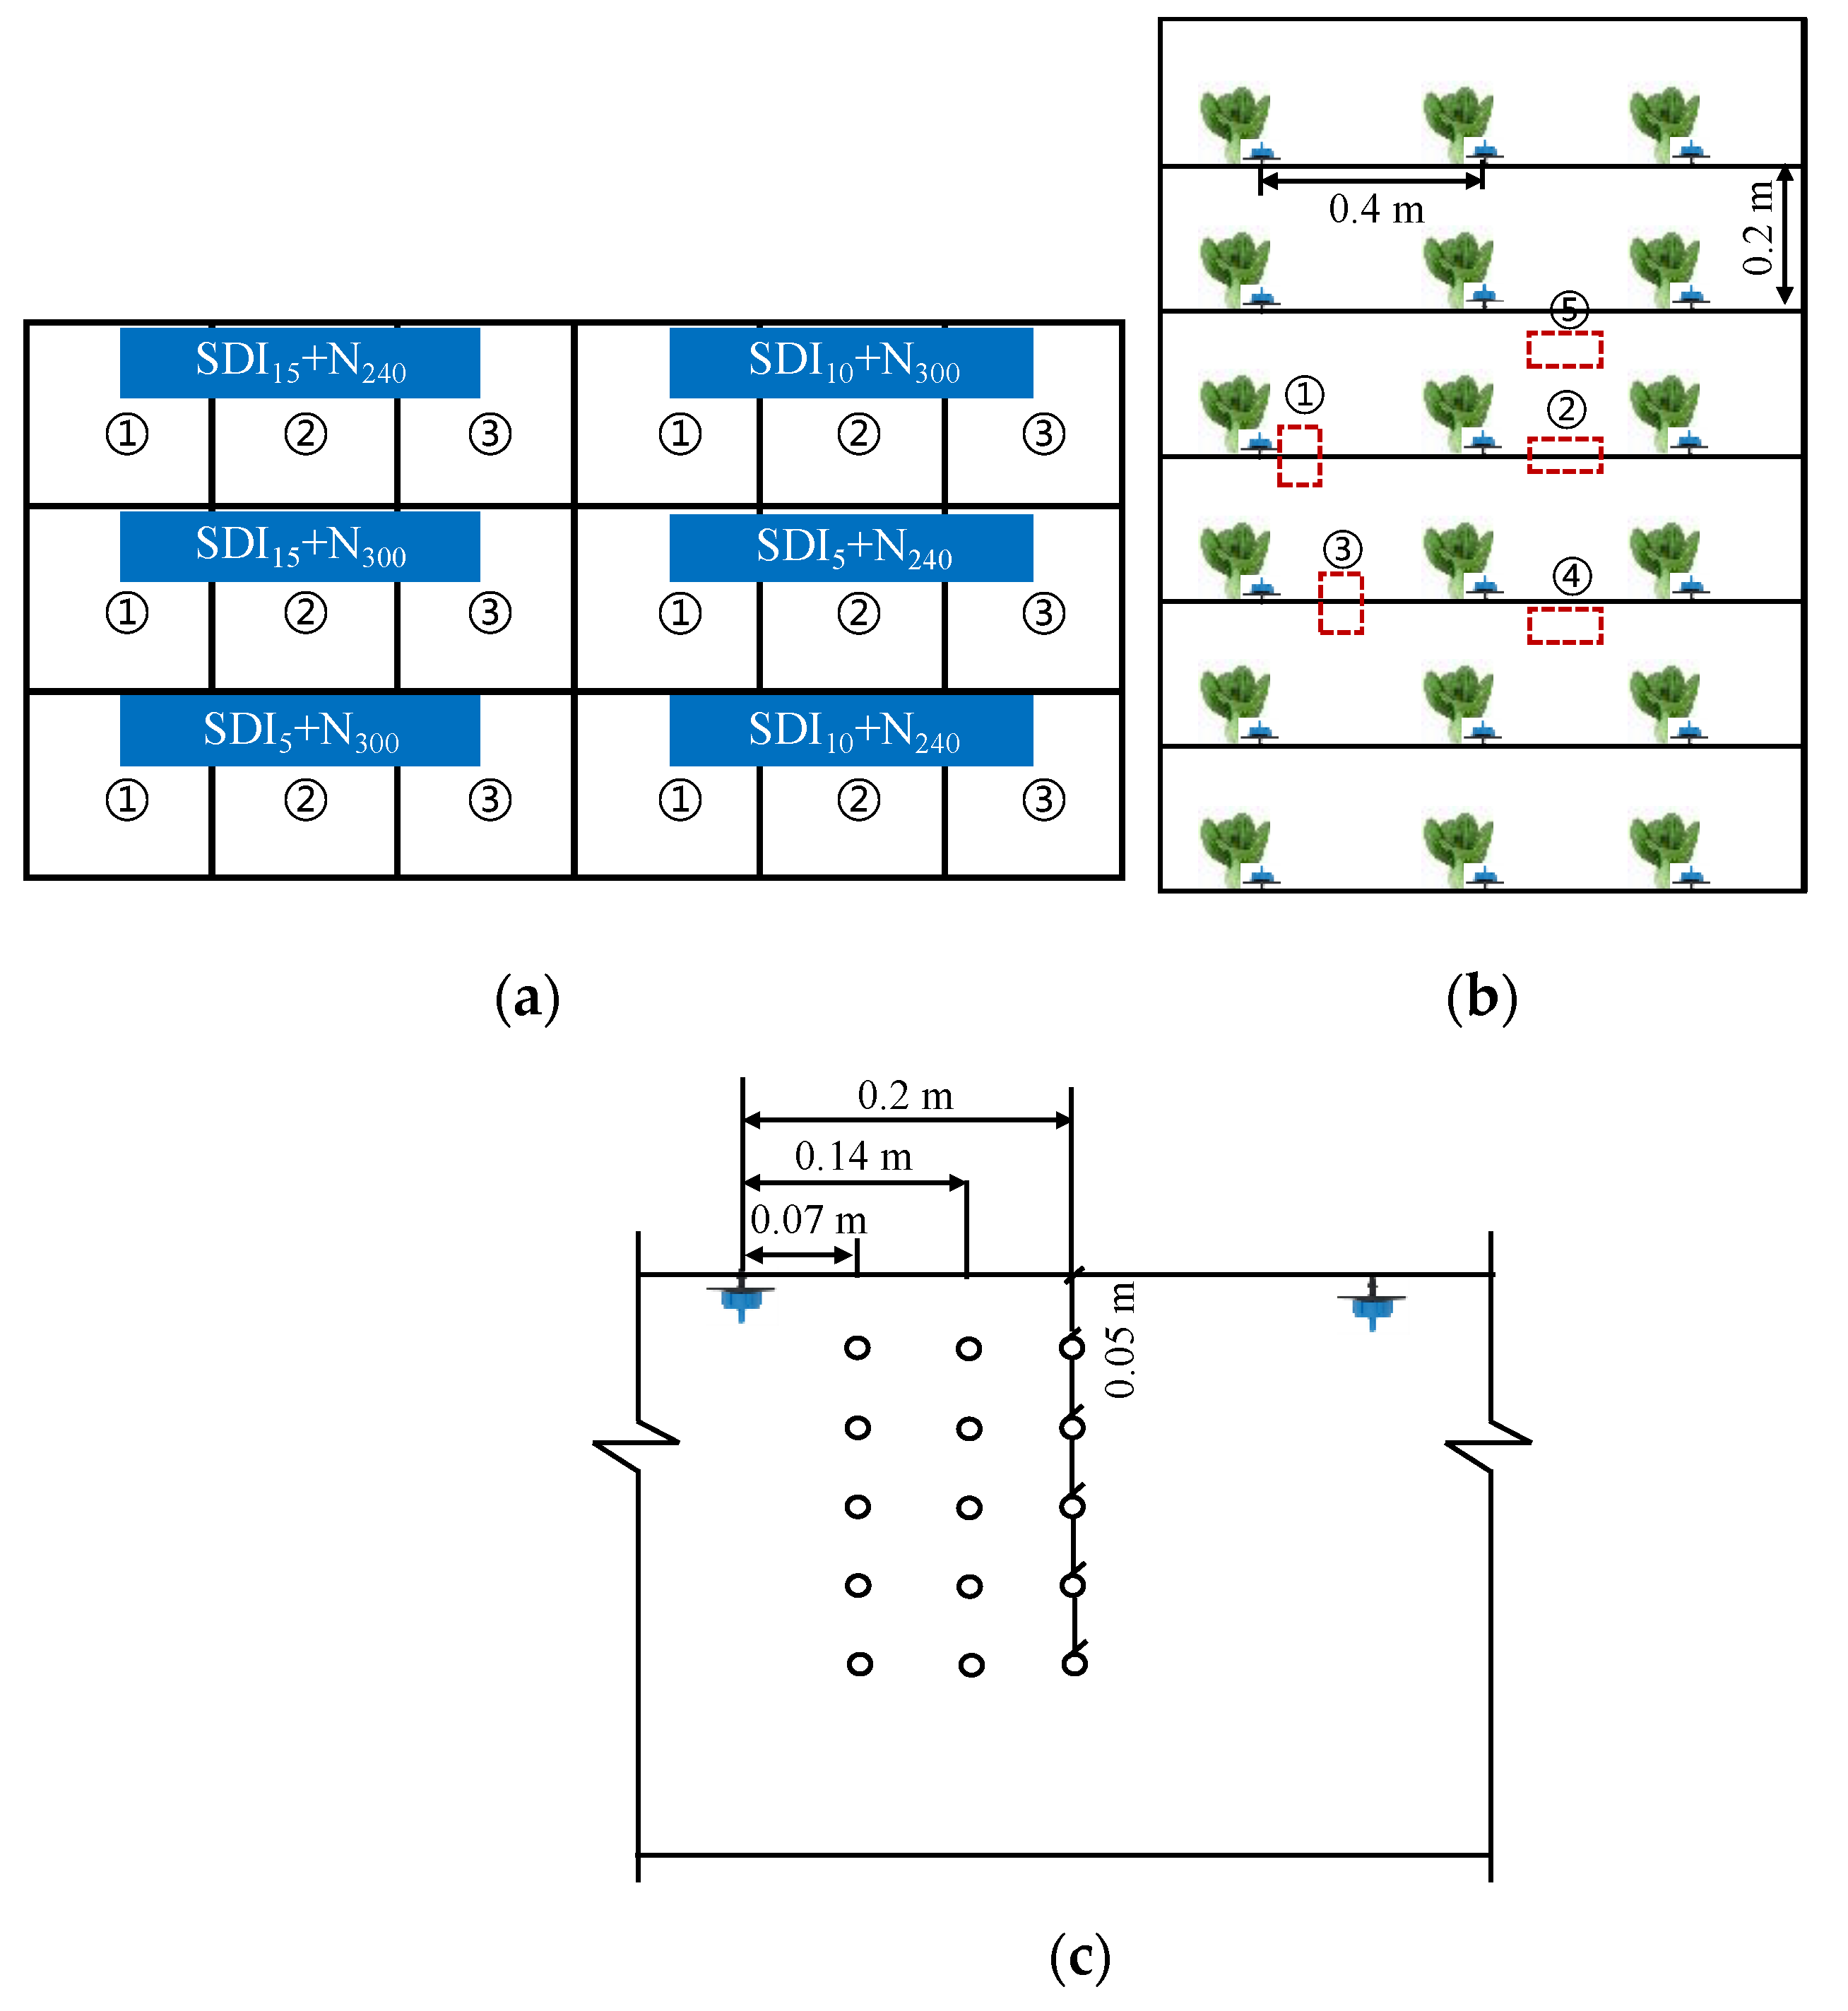
2.2. Experimental Design

The experiment set up two factors: three SDI emitter depths of 0.05, 0.10, and 0.15 m (SDI5, SDI10, and SDI15), factorially combined with two levels of nitrogen fertilizer as urea (300 kg N ha−1 and 240 kg N ha−1). The former N fertilization rate was locally recommended for Chinese cabbage production. We created a completely randomized block design with six treatments, named SDI5 + N300, SDI5 + N240, SDI10 + N300, SDI10 + N240, SDI15 + N300, and SDI15 + N240. Detailed information on the experimental layout is shown in Figure 1, with the experimental layout of the subsurface drip irrigation system given as the whole treatment layout (Figure 1a), plot layout (Figure 1b), and horizontal distances from the dripper point (Figure 1c). Before the start of the experiment, we inserted waterproof material with a thickness of 8 mm and height of 0.50 m on the ridge of two adjacent plots to reduce the water and N transport between the two adjacent plots as much as possible and improve the accuracy and reliability of the research results. Each treatment was replicated three times, resulting in 18 plots. Six lateral pipelines with a lateral spacing of 0.20 m were arranged on each plot, and three plants were arranged on each pipeline spaced 0.40 m apart (Figure 1b). Our purpose was to ensure that sufficient soil and gas samples with similar characteristics could be collected at different crop growth stages. The soil was thoroughly mixed to raise the beds manually. Every two adjacent plots were separated by a ridge 0.25 m thick. All plots received the same amount of water during the growing season: 0.15 m3 per plot (892.8 m3 ha−1) with a flow rate of 3 L h−1. The treatments were irrigated three times over the entire growing period, at 20-day intervals. Irrigation water was delivered to the plots via a gravity drip system. At the upper end of each plot, a tank to store irrigation water (0.05 m3) was installed at the height of 2 m. Nitrogen fertilizer was mixed with irrigation water in the water tank, with each treatment having a separate drip line.

2.3. Measurement of θ, NH4+-N, and NO3-N

In each treatment plot, 5–10 g soil samples were collected using a 0.05-m diameter hand auger from varying depths (0.05, 0.10, 0.15, 0.20, and 0.25 m) and at three horizontal distances from the emitter (0.07, 0.14, and 0.20 m). The samples were immediately taken to the laboratory to determine θ by the traditional drying method (105 °C, 8 h). The water-filled pore space (WFPS) was then determined by dividing the volume of gravimetric water by the soil’s total porosity (ϕ), itself determined by calculating soil’s bulk density by the following relationship:
Soil   porosity   = 1 BD PD
where BD and PD are the bulk density and particle density, respectively. The particle density was estimated to be 2.65 g cm−3 [19]. A further 10 g of soil was extracted with 1 M KCl solution (50 mL), shaken at 300 rpm for 1 h, and filtered through filter paper (Whatman no. 42). Using a colorimetric method [2], the soil ammonium (NH4+-N) nitrate (NO3-N) content in the filtrate was measured.

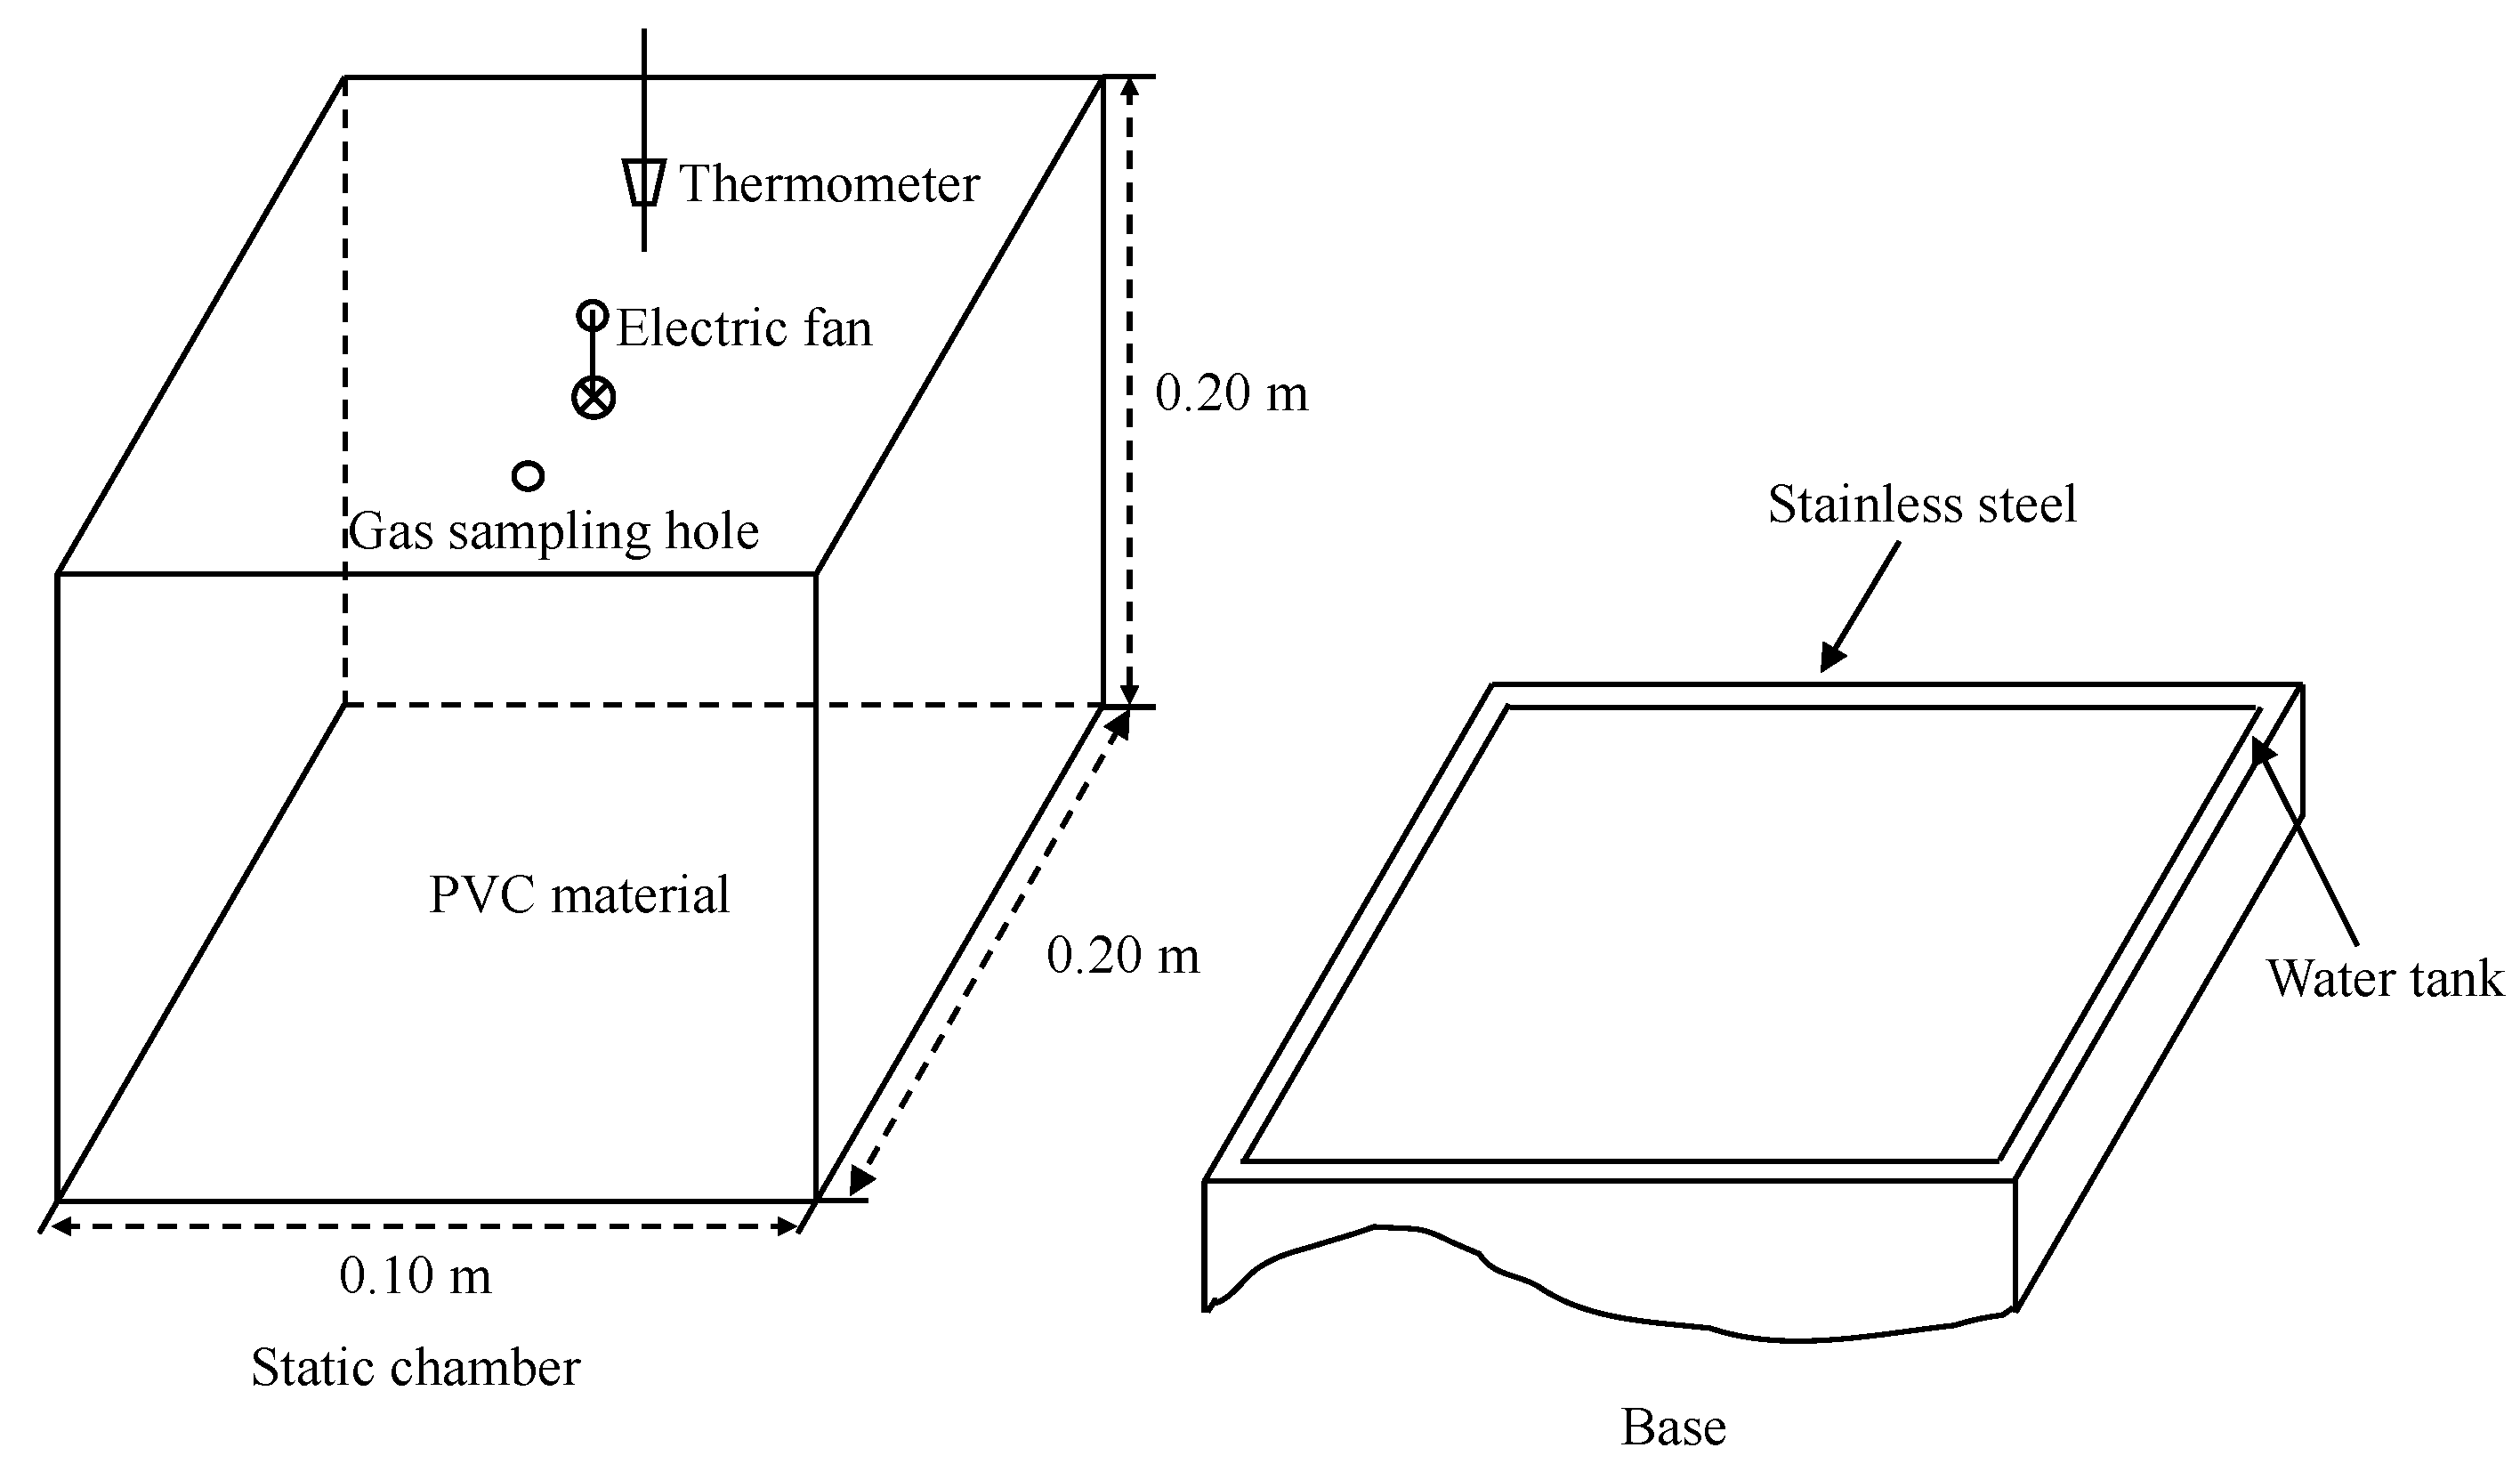
2.4. Gas Sampling and Analyses

Before the experiment, five rectangular stainless-steel chamber bases were mounted in each plot at a depth of approximately 0.05 m and at different horizontal distances from the emitters. The bases served to mitigate lateral gas diffusion during gas sampling and remained open throughout the crop growing period except during gas sampling (Figure 1b). During the growing season, the bases of the chambers were left to prevent soil disruption. The 0.20 × 0.10 × 0.20 m (length × width × height) chambers were made of polyvinyl chloride and fitted with thermometers (Figure 2). The chambers were closed by placing them into rings made of stainless steel, which were sunk into the soil. The chambers were coated by wrapping them in a layer of heat insulation material to reduce the influence of heat transfer induced by ambient temperature. Furthermore, to minimize potential soil temperature, soil moisture, and micro-climate modification of the sampling area, the static chambers were removed from the bases immediately after gas sampling. Gas samples were obtained using 10-mL syringes linked to the chambers by a pipe and valve system. Three gas samples were collected from each chamber at 10-min intervals between 10:00 and 10:30 a.m. Every 10 min, the air temperatures inside the chambers were recorded using thermometers. A gas chromatograph (Agilent 7890A, Santa Clara, CA, USA) was used to analyze the N2O concentrations using an electron capture detector (ECD).

2.5. Statistical Analysis

The IBM-SPSS statistical package (IBM-SPSS, 19, Chicago, IL, USA) was used to perform analysis of variance (Two-way ANOVA) through a general linear model procedure, and an LSD test was used to assess significant differences (p < 0.05) between the means of different treatments. Surfer software (Golden Software Inc., Golden, CO, USA) was used to create the contour maps of soil moisture distribution.

3. Results

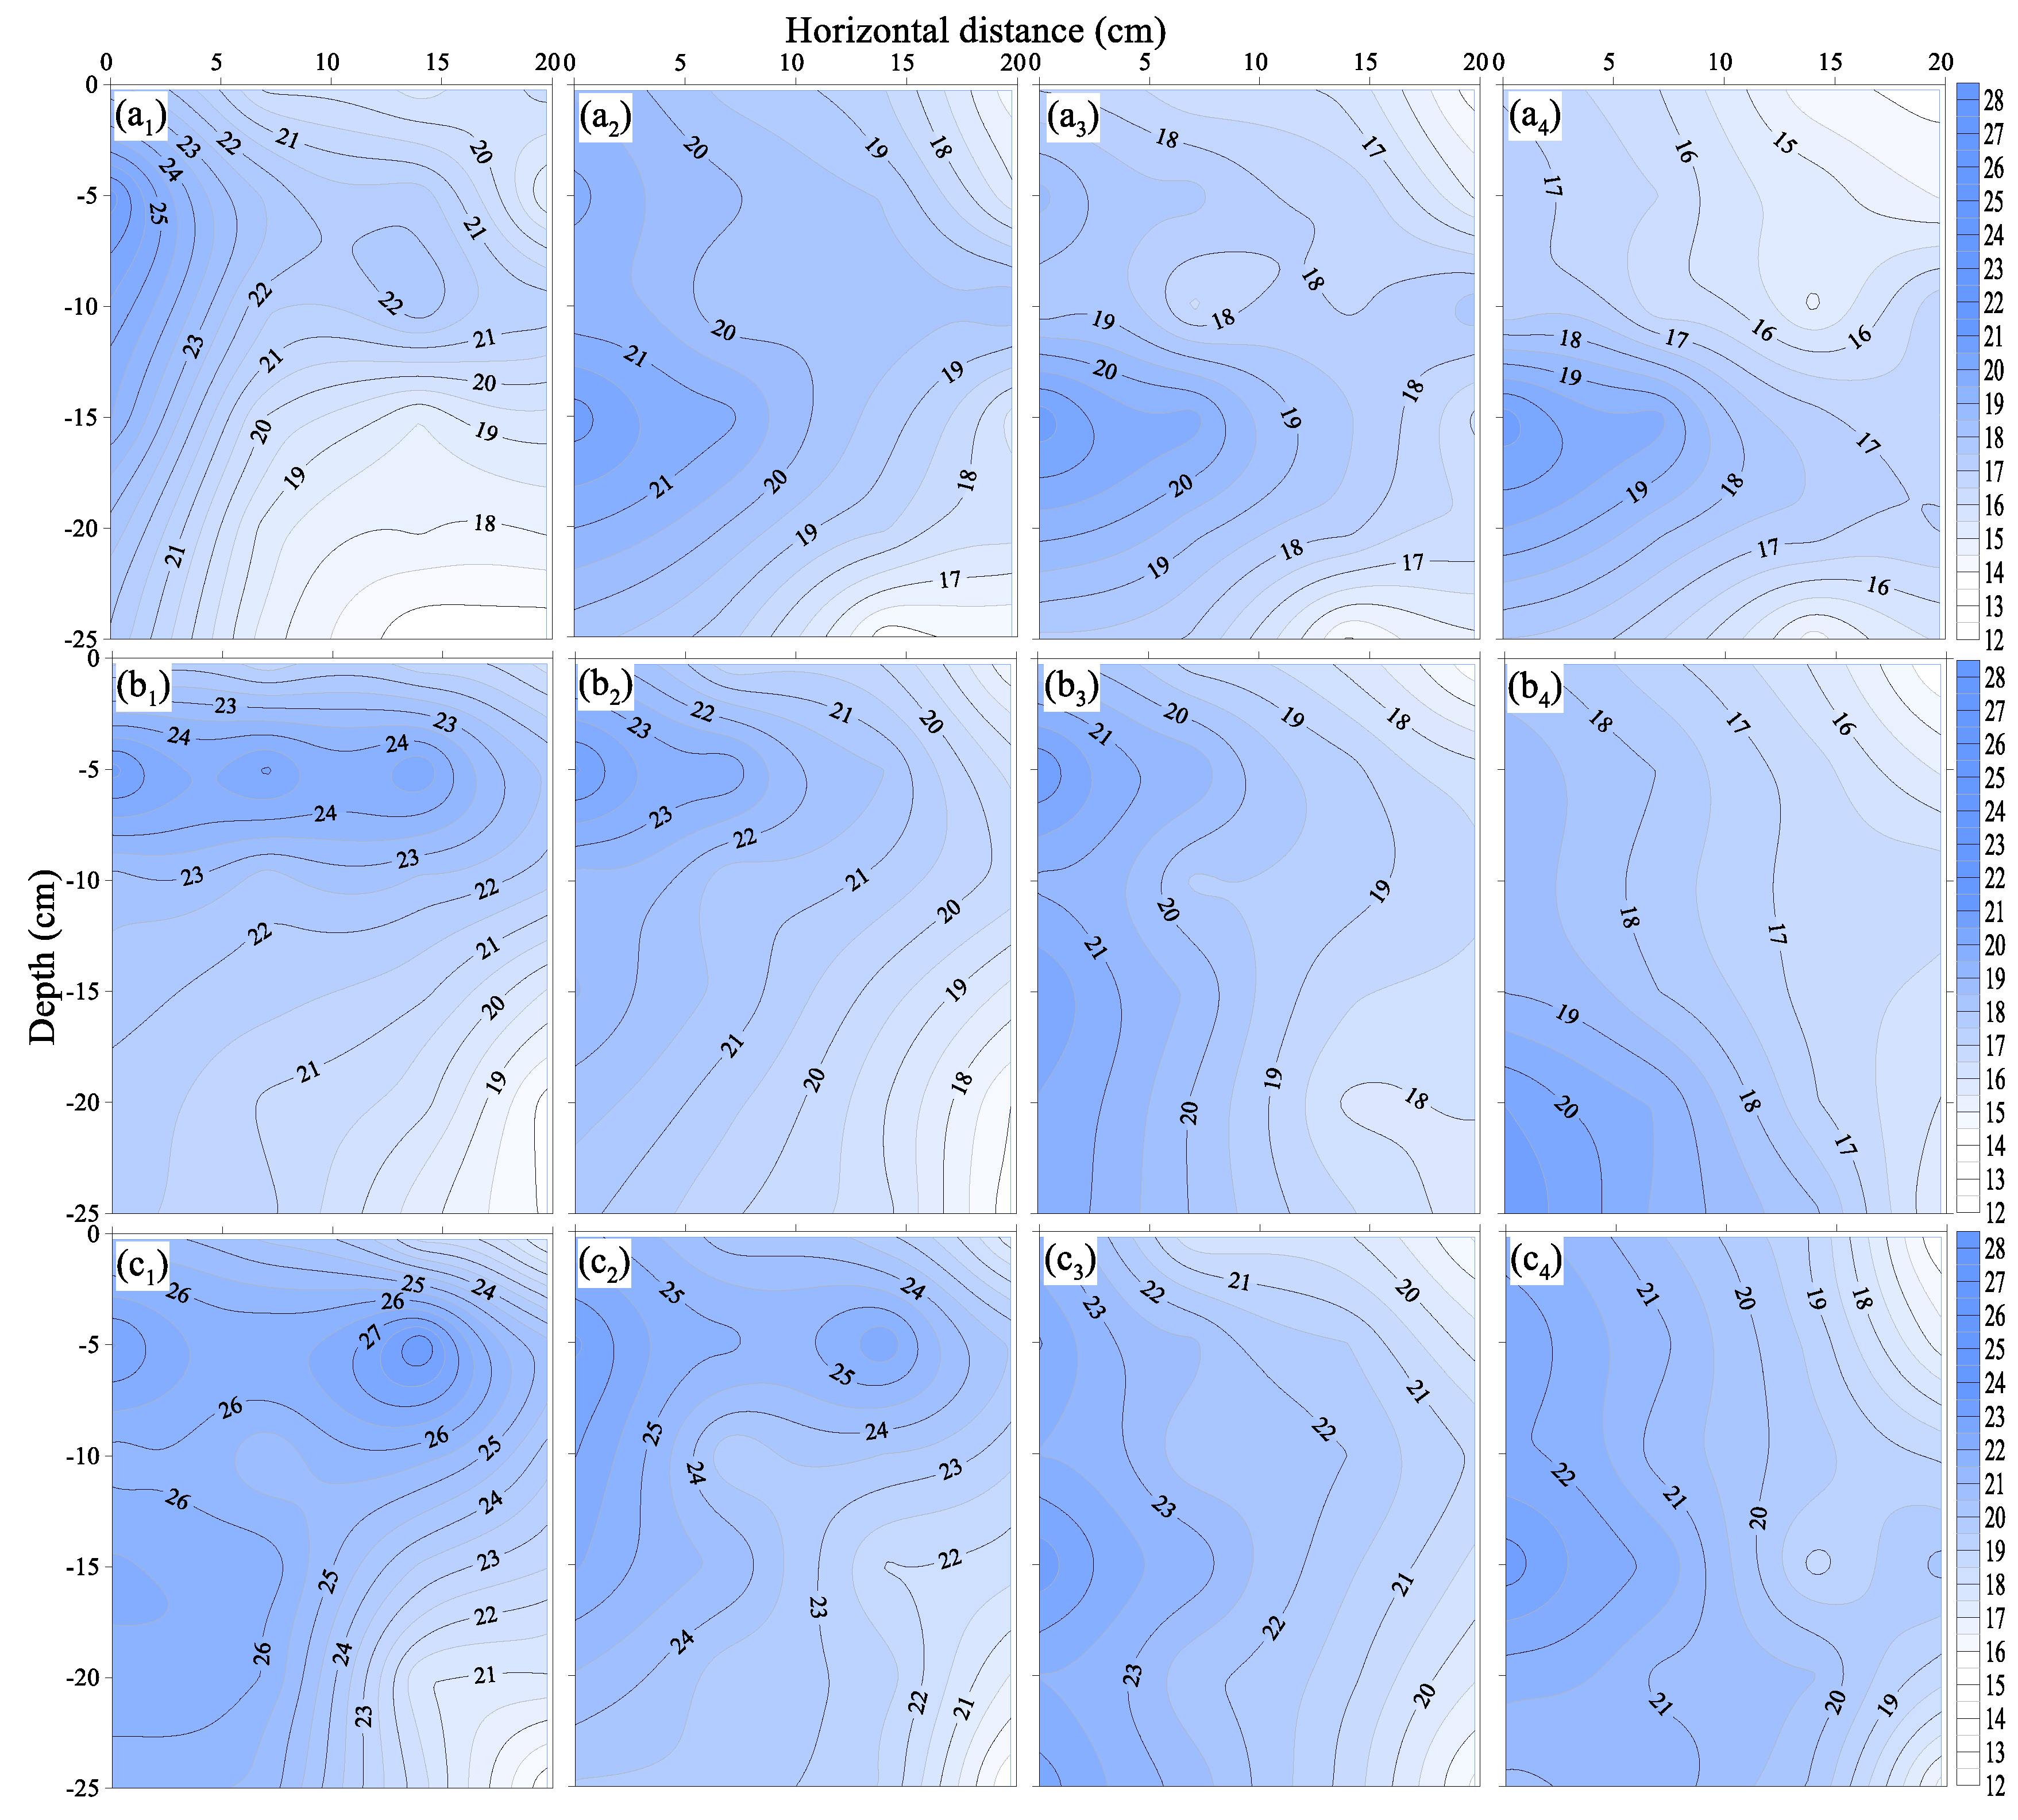
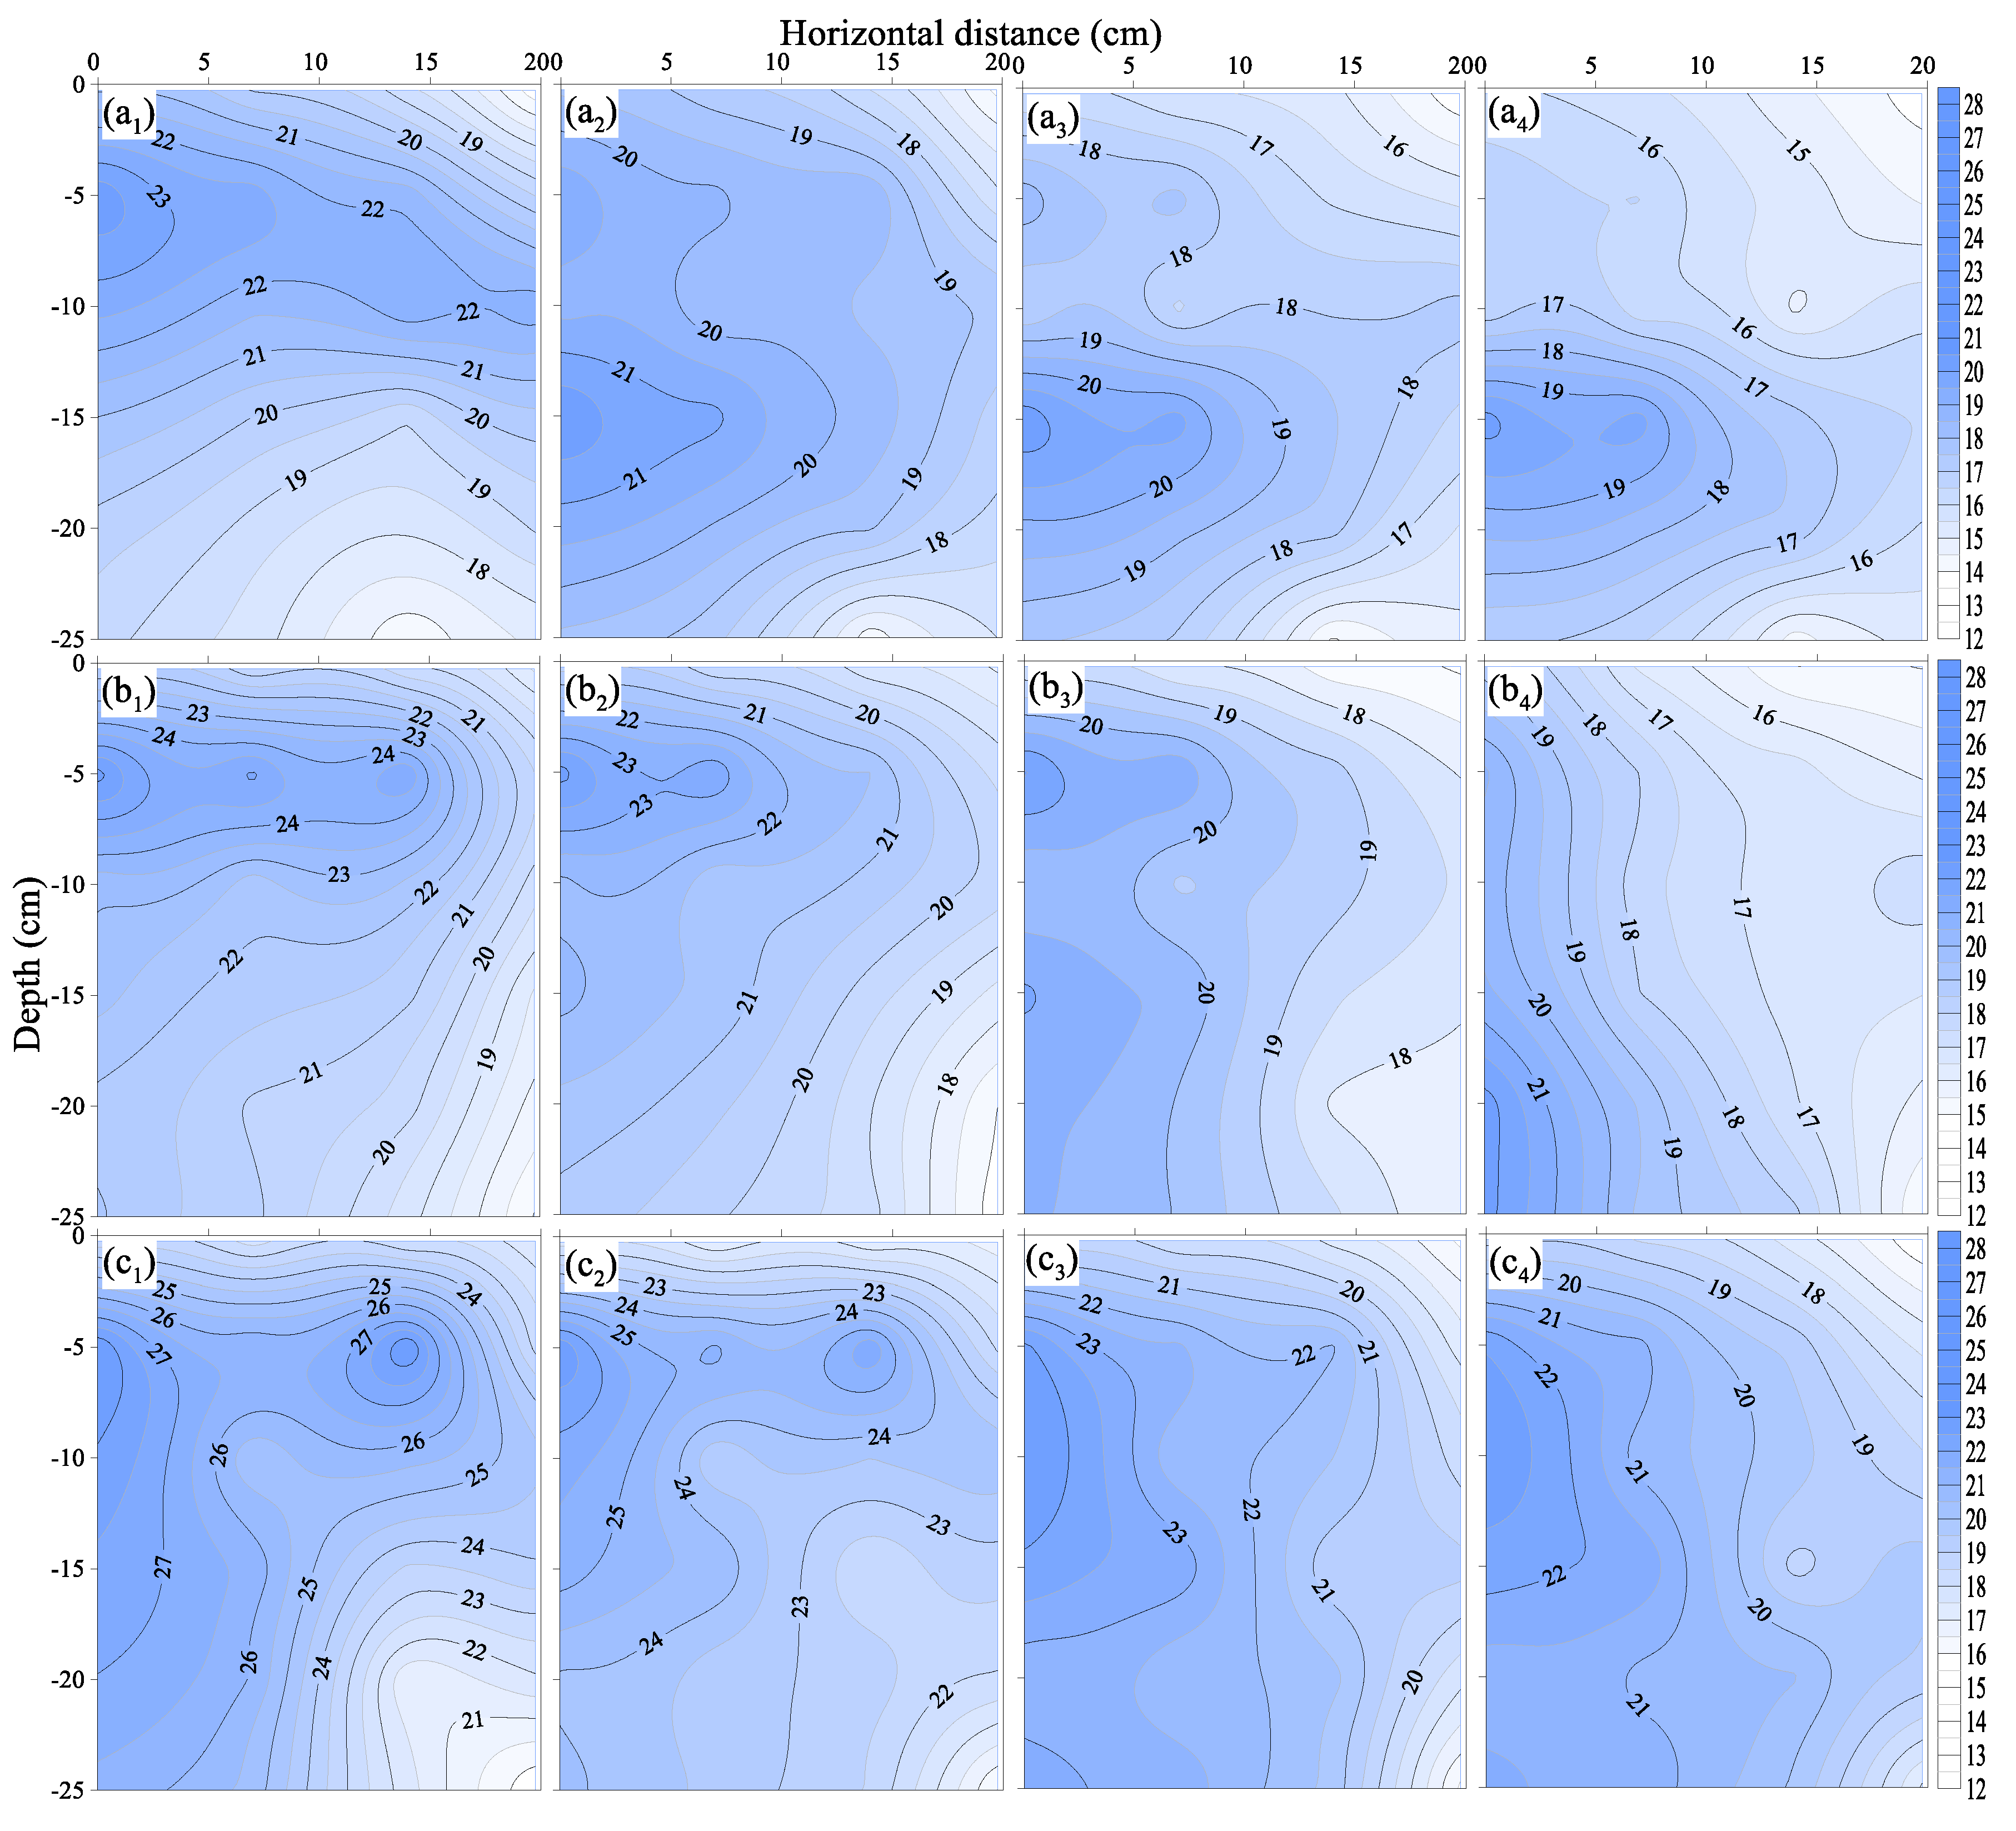
3.1. Soil Moisture Distribution

For all SDI treatments, θ varied markedly and non-uniformly in the horizontal and vertical directions (Figure 3, Figure 4, and Figures S1–S4 in Supplemental Data). For each SDI treatment, θ at different distances (0.07, 0.14, and 0.20 m) in a horizontal direction increased gradually with subsequent irrigation events. The soil WFPS decreased initially, then improved with increasing radial distance from 0.07 m to 0.20 m. The WFPS values were particularly increased after the second irrigation at 0.20 m, rather than at 0.07 m or 0.14 m. Across different depths, θ near the emitter buried in the top layer was more significant than in any other soil layer, with downward water movement greater than upward movement at the same horizontal distance from the emitter.
Taking SDI5 + N300 as an example, the mean (0.05–0.25 m) soil WFPS at 0.07 m ranged from 17.1–20.6%, 18.4–23.0%, and 21.8–27.4% after the first, second, and third irrigation, respectively (Table S1 in Supplemental Data). In contrast, it decreased by 4.2–11.6%, 3.4–9.5%, and 2.5–8.8% at 0.14 m versus (vs.) 0.07 m, and increased by 1.3–2.3%, 9.9–17.9%, and 6.0–13.2% at 0.20 m vs. 0.14 m, respectively. Among the N300 treatments, θ showed a similar trend with the emitter at different depths. In contrast, the mean soil WFPS at a depth of 0.05–0.25 m and at distances of 0.07, 0.14, and 0.20 m declined from SDI5 + N300 to SDI15 + N300. When compared to SDI5 + N300, the mean (0.05–0.25 m) WFPS at 0.07, 0.14, and 0.20 m decreased by 4.5–5.2%, 4.2–5.1%, and 4.3–5.2% for SDI10 + N300, and 2.4–13.5%, 1.3–12.1%, and 2.8–11.0% for SDI15 + N300, respectively. Under N240 treatments, θ followed a similar pattern to those in N300 treatments, whereas the soil WFPS was slightly reduced by 2.8–7.6%, 2.3–10.3%, and 1.8–9.9%, respectively, at 0.07, 0.14, and 0.20 m for SDI10 + N240, and 4.7–11.0%, 2.2–10.2%, and 6.1–9.8% at 0.07, 0.14, and 0.20 m for SDI15 + N240, respectively, as compared to SDI5 + N240.

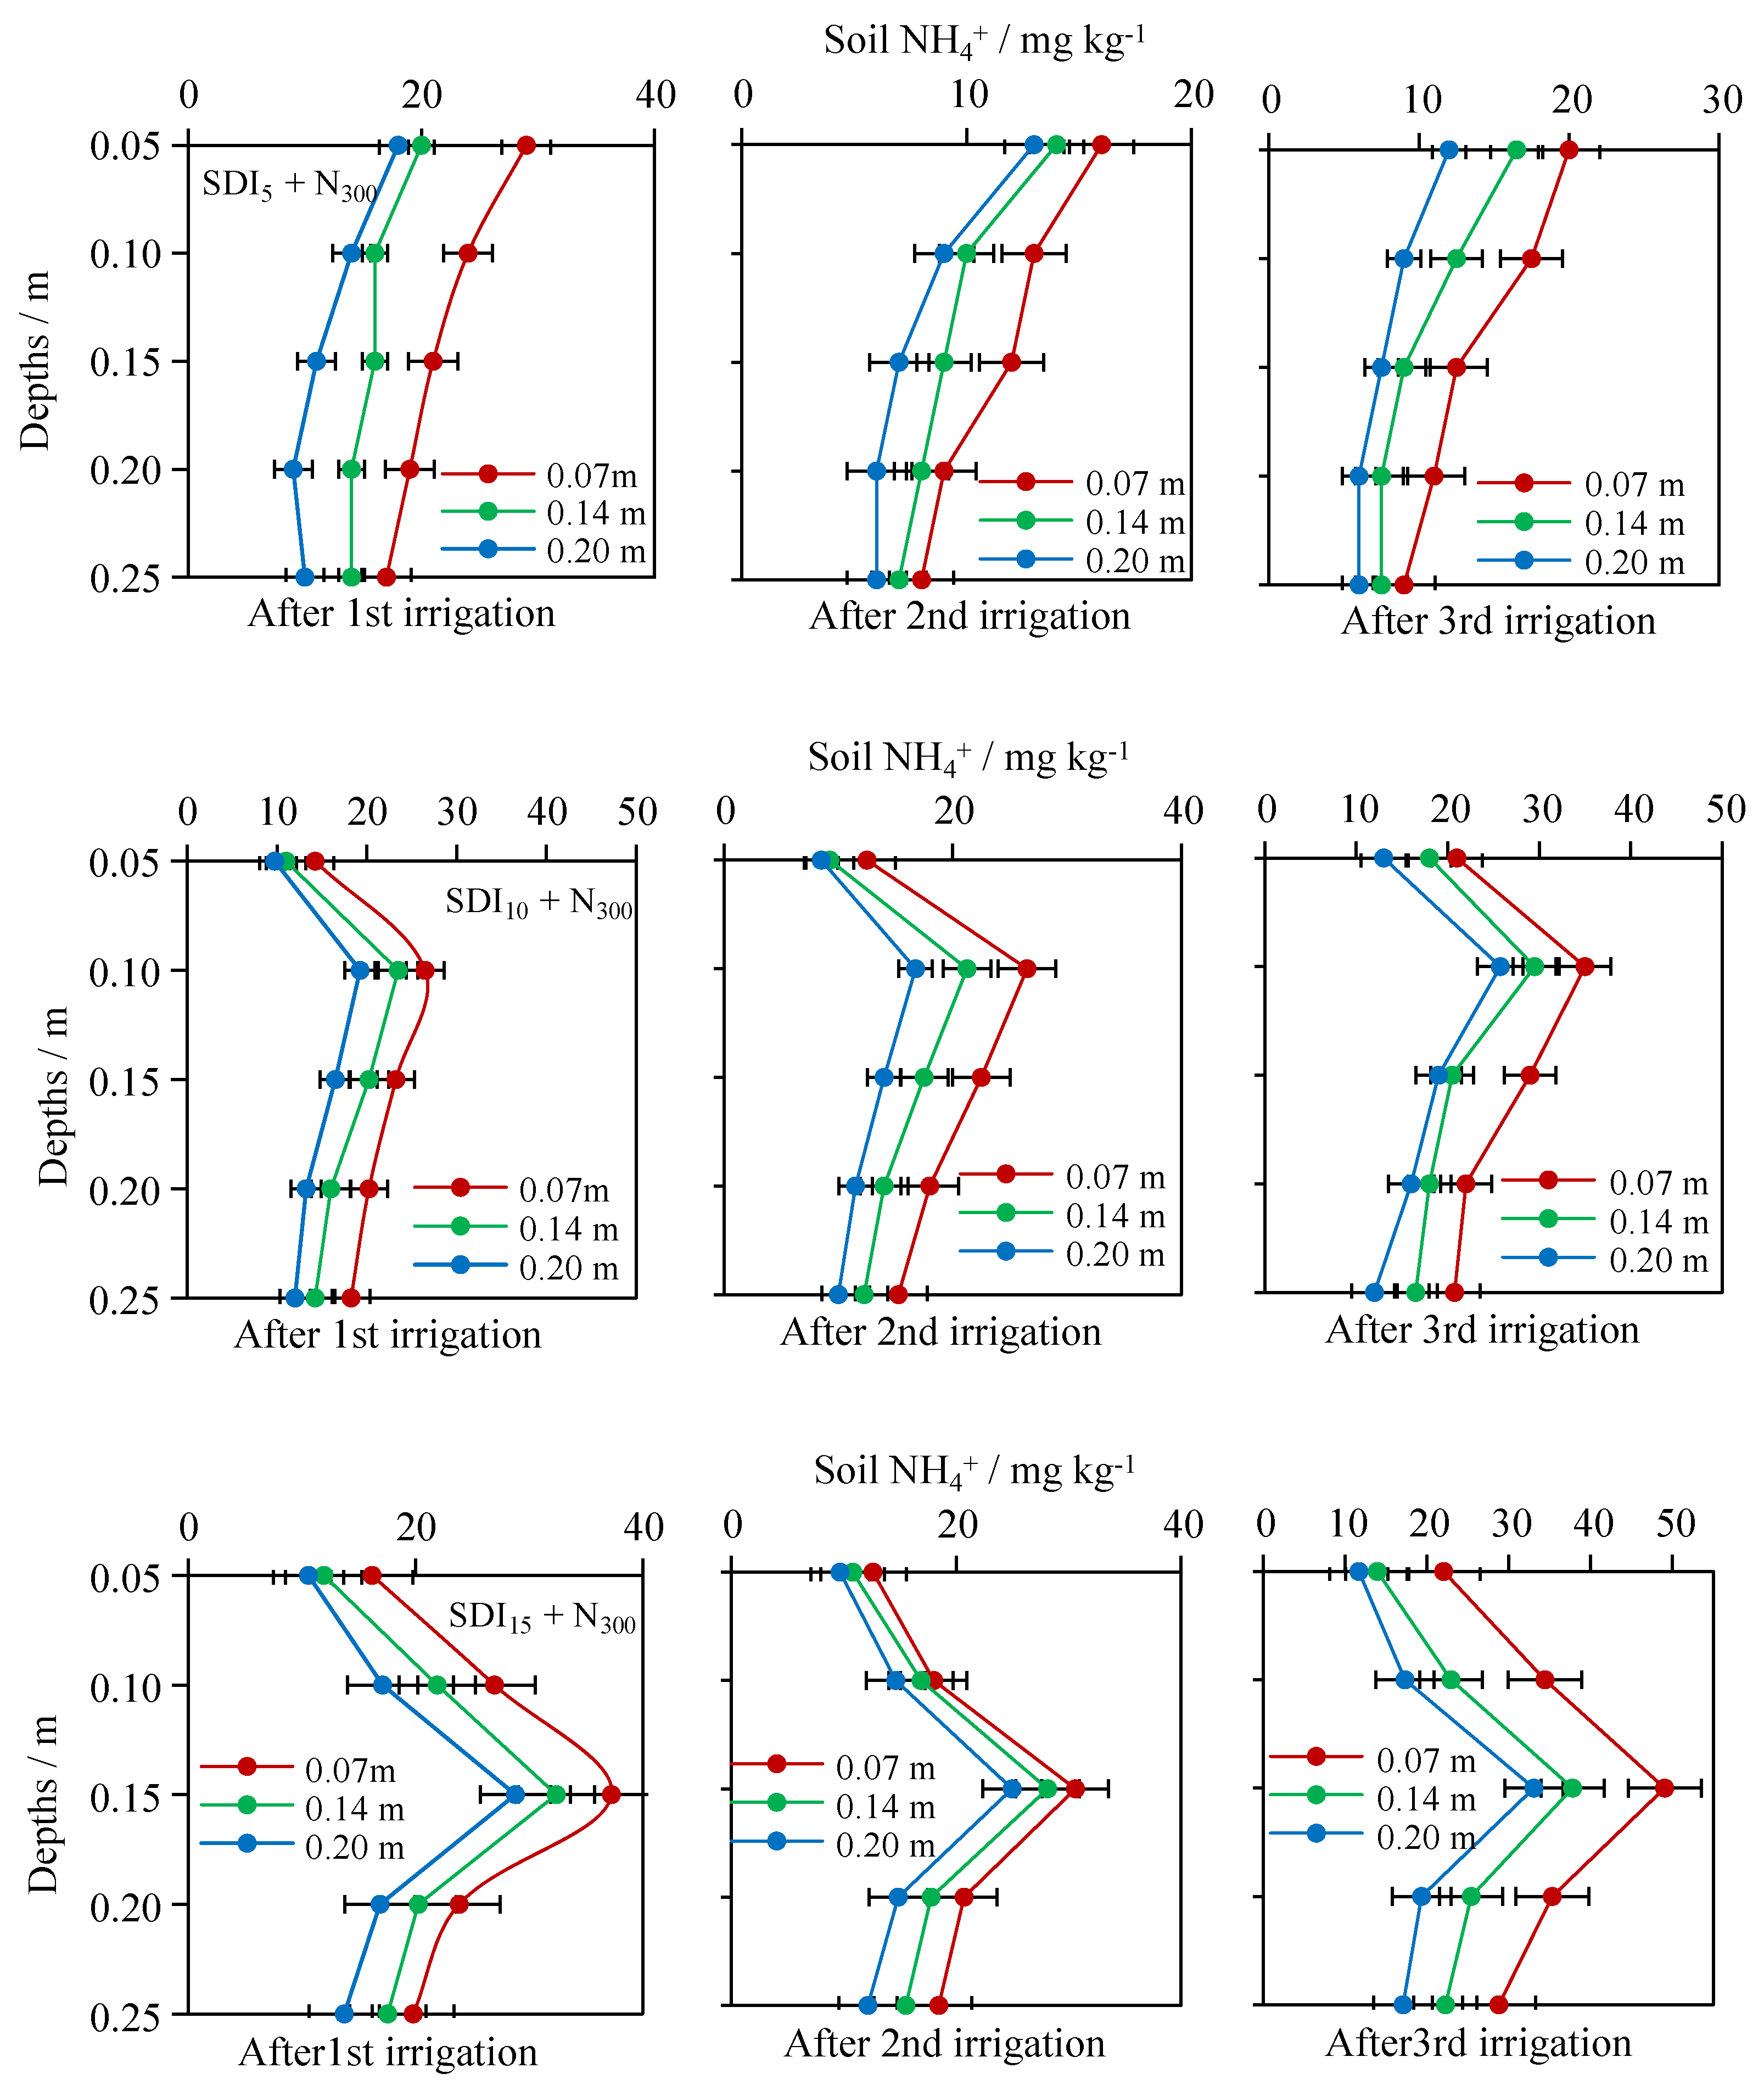
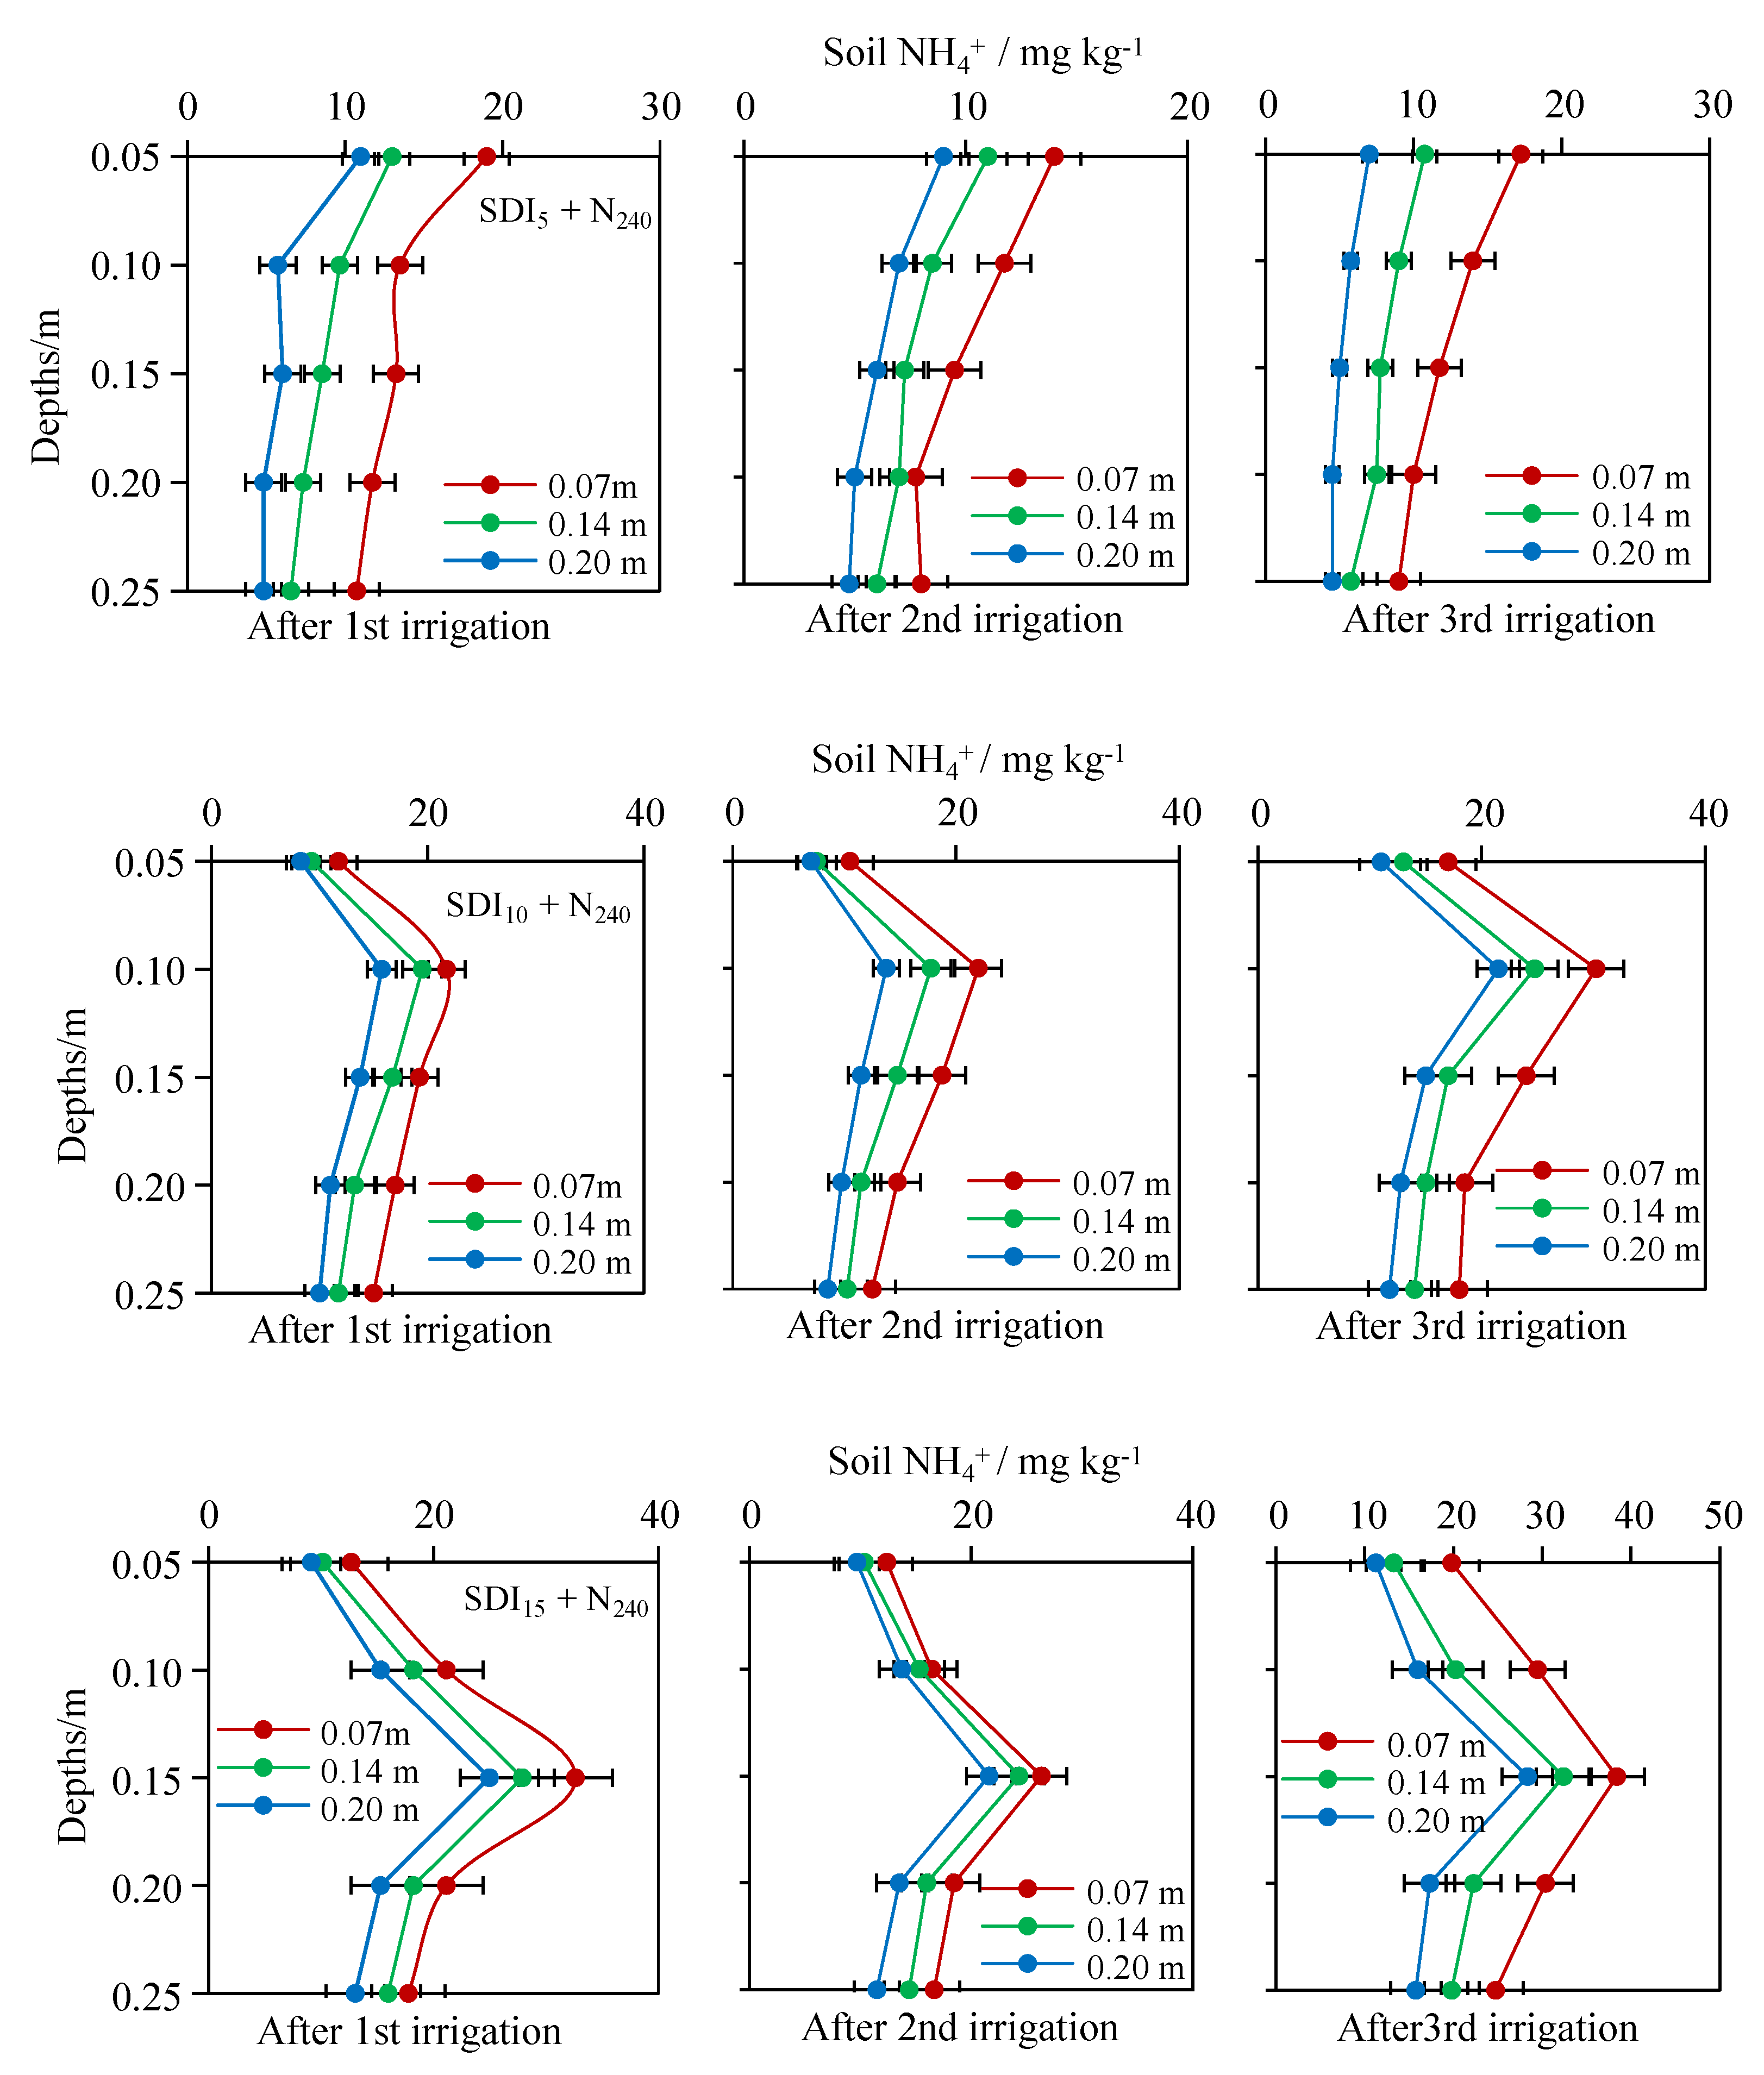
3.2. NH4+-N Concentrations
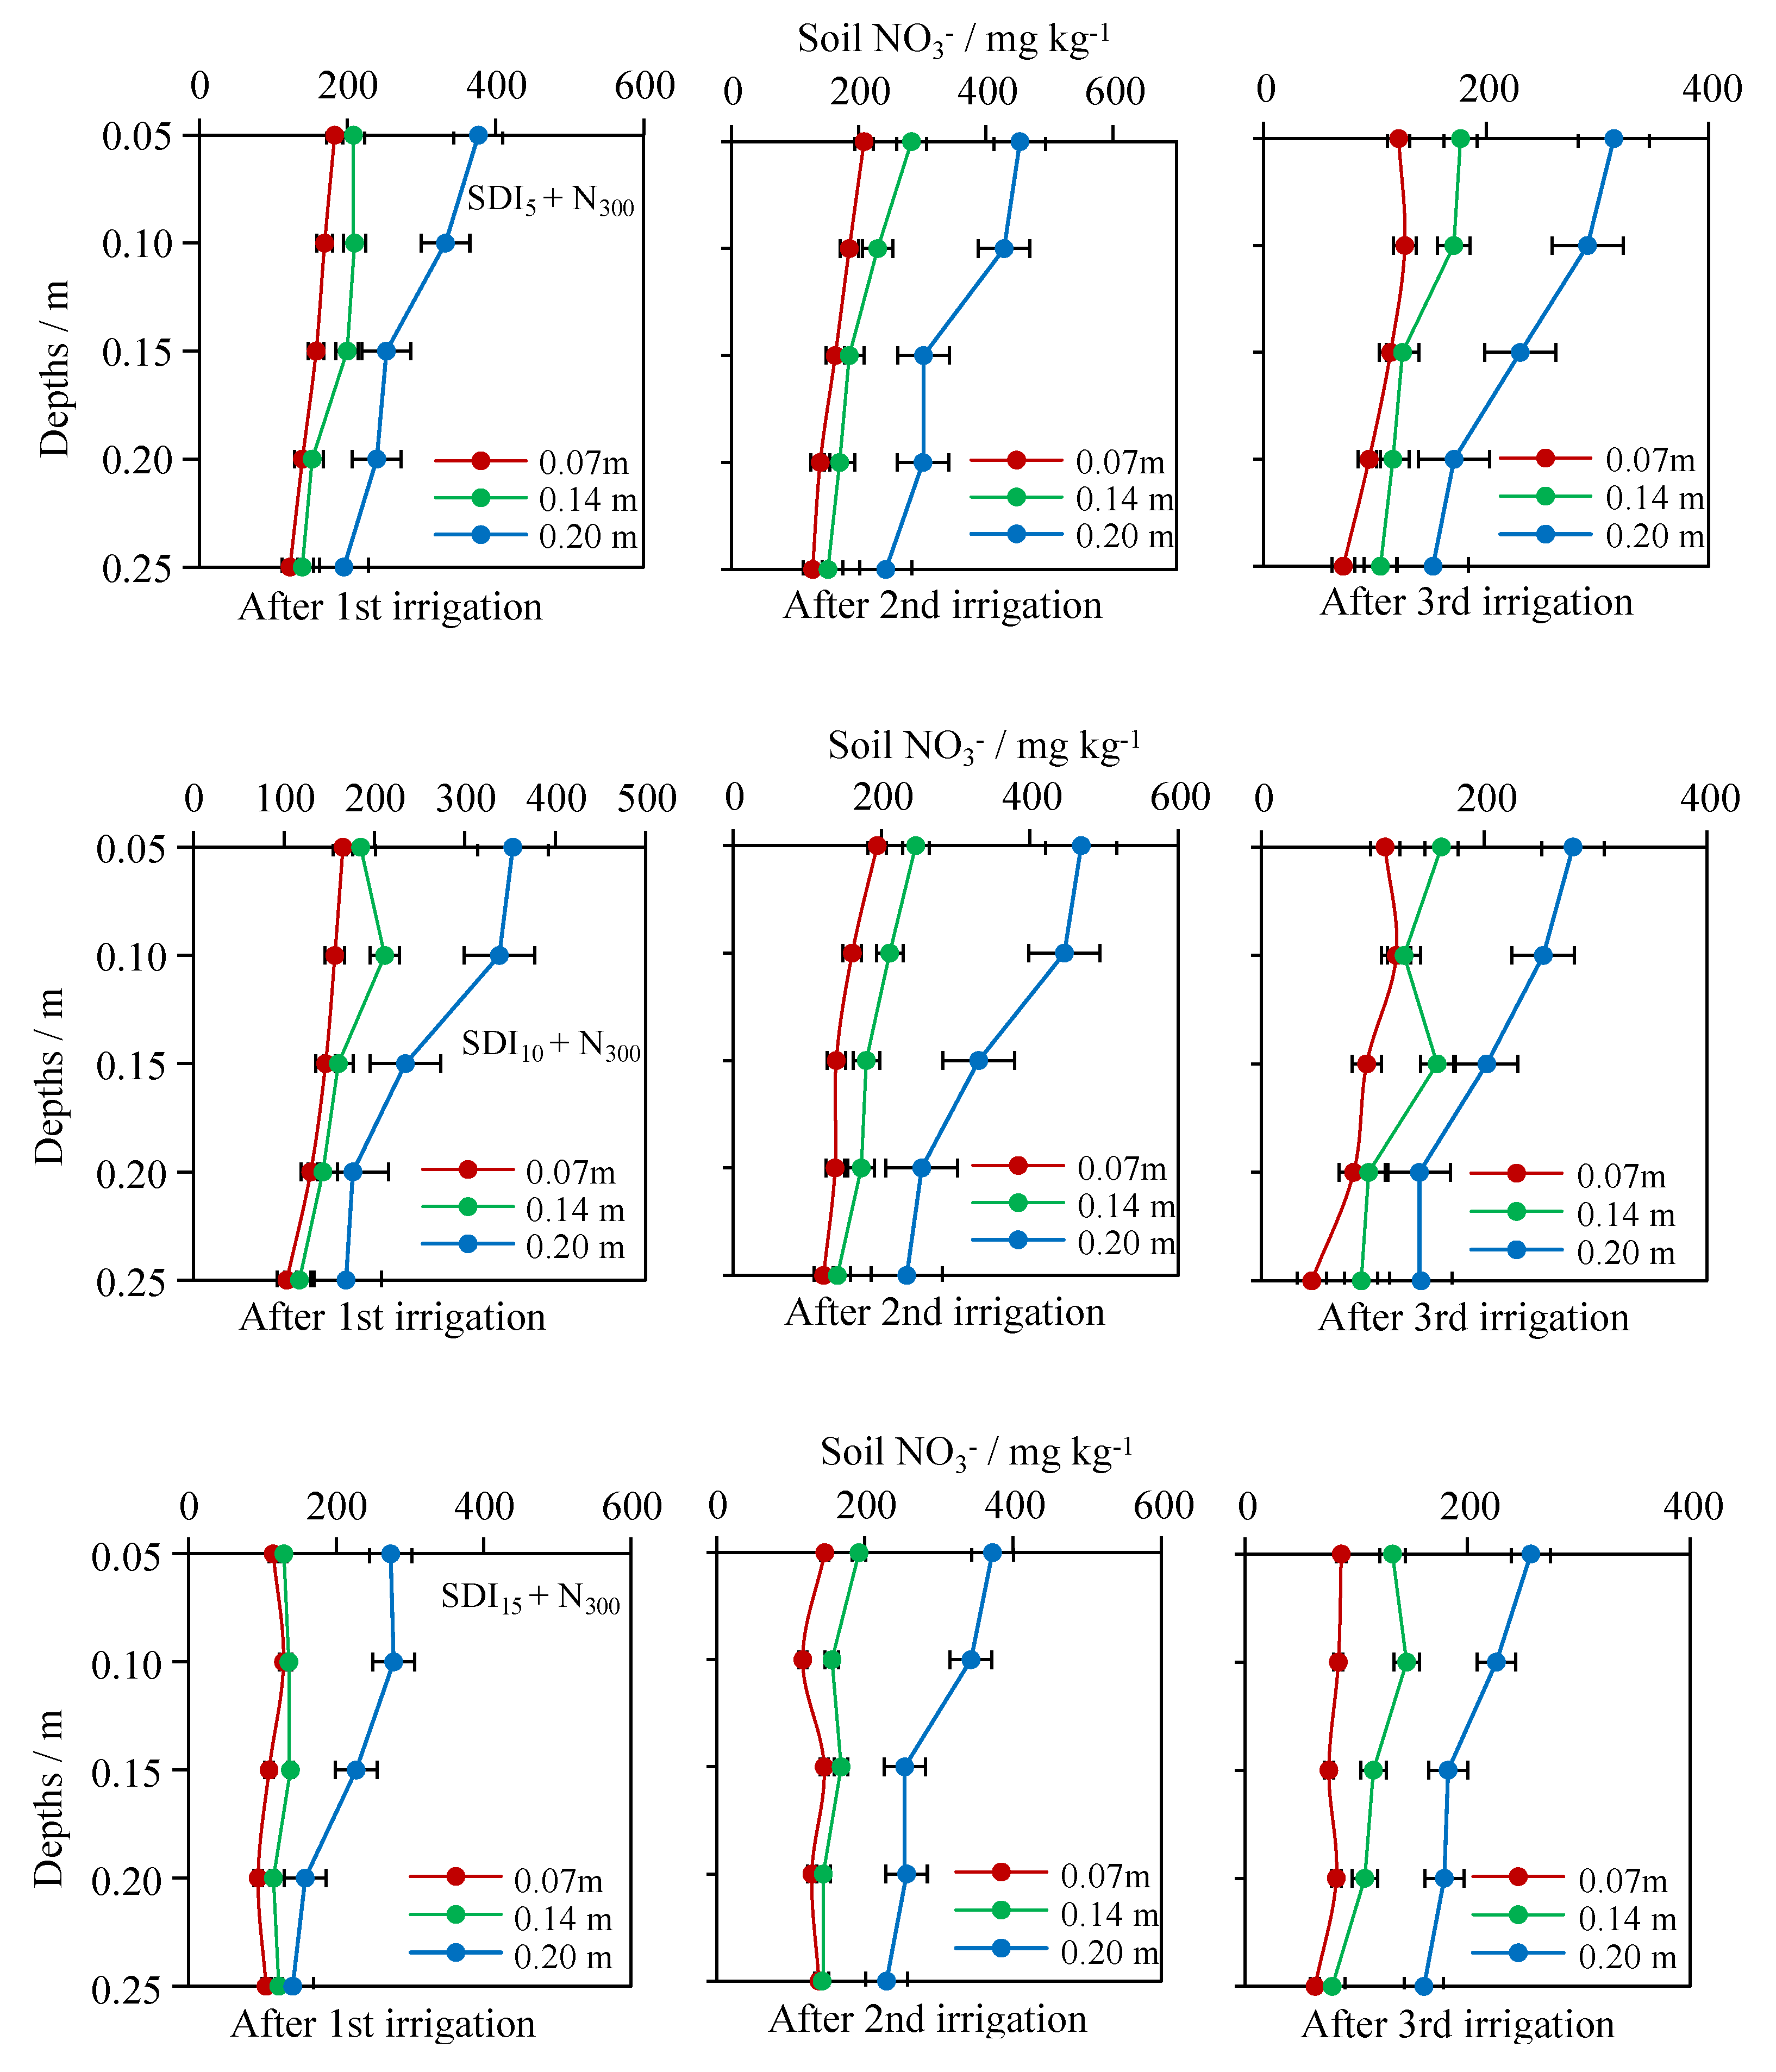
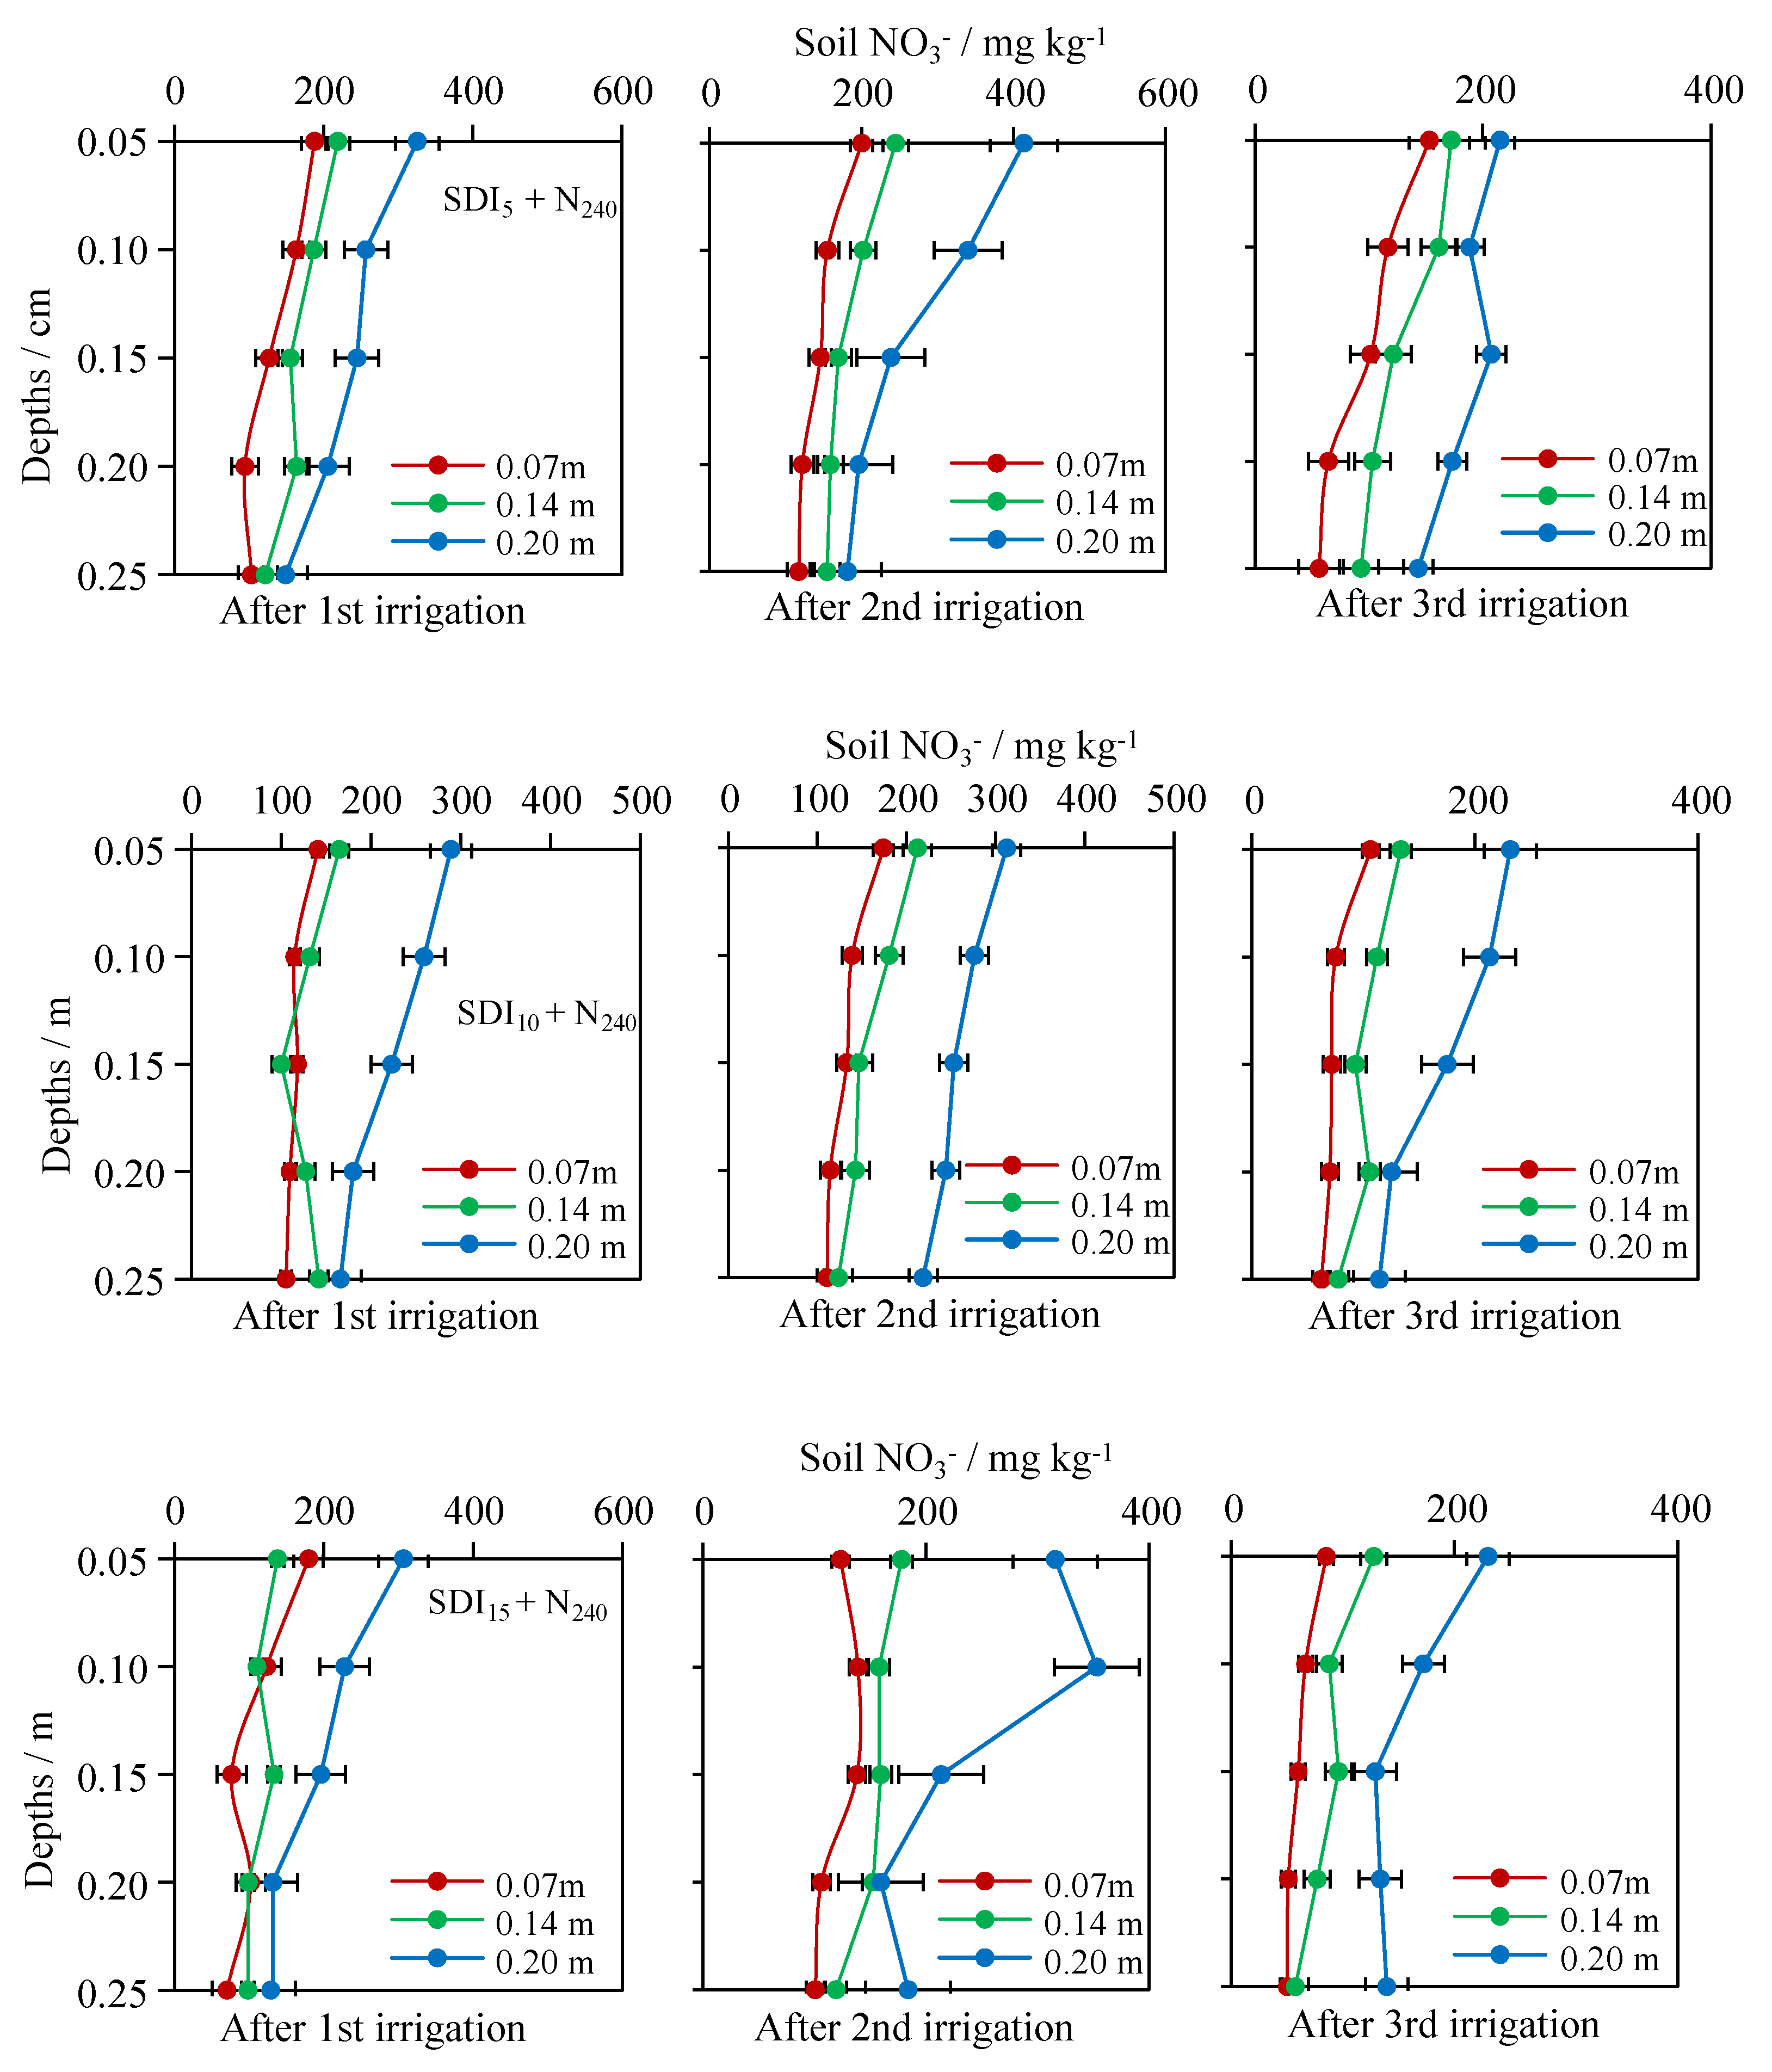
The average NH4+-N concentration under SDI15 was significantly greater than that under SDI5 and SDI10 for both the N240 and N300 levels. Among the N300 treatments, the NH4+-N concentration showed a similar trend: the mean soil NH4+-N in the 0.05–0.25 m depths, across three lateral distances, increased from SDI5 + N300 to SDI15 + N300. When compared to SDI5 + N300, these concentrations increased by 27–371.55%, 25.88–357.05%, and 29.16–347.26% for 0.05, 0.10, and 0.15 m, respectively, under SDI10 + N300, and by 46.76–486.06%, 80–498.43%, and 55.52–433.79% for 0.05, 0.10, and 0.15 m, respectively, under SDI15 + N300.
For each SDI treatment, the NH4+-N concentration at different lateral distances decreased gradually with increased fertigation; moreover, there was a declining trend from one irrigation to the next. Furthermore, NH4+-N tended to decline among all treatments as the lateral distance increased: it decreased from 0.07 to 0.14 m, then increased from 0.14 to 0.20 m (Figure 5 and Figure 6; Tables S4–S6 in Supplemental Data). In the vertical direction under SDI5 + N300, NH4+-N decreased as the emitter depth increased, whereas under SDI10 + N300, it increased from 0.05 to 0.10 m, then declined at 0.25 m. Meanwhile, under SDI15 + N300, it showed an increasing trend from 0.05 to 0.15 m and then decreased (Figure 5). Taking the SDI5 + N300 treatment (Table S4 in Supplemental Data) as an example, after the first three irrigations, let us consider the mean NH4+-N from 0.05–0.25 m depths. At 0.07 m, it ranged by 7–23 mg kg−1, 2–15 mg kg−1, and 2–11 mg kg−1; at 0.14 m, it decreased by 19.42–30.02%, 20.96–109.42%, and 11.75–51.12%, respectively; at 0.20 m (vs. 0.14 m), it improved by 57.69–105.46%, 25.08–50.70%, and 4.42–130.15%, respectively. Similar trends were observed for the N240 fertilizer level (Figure 5 and Table S4 in Supplemental Data), but no significant differences were found.

3.3. NO3-N Concentrations

For all treatments, when considering the average of five soil depths (0.05, 0.10, 0.15, 0.20, and 0.25 m) at each of three lateral points (0.07, 0.14, and 0.20 m) away from the emitter, the NO3-N concentrations showed an increasing trend after each fertilization event. Considering the SDI5 + N300 treatment as an example, the mean soil NO3-N at a 0.07 m, measured after the first, second, and third irrigation events, ranged from 57–245 mg kg−1, 77-264 mg kg−1, and 83–485 mg kg−1, and these concentrations were 3.36–14.63%, 3.30–19.24%, and 7.72–86.36% greater, respectively, at a 0.14 m distance than at the 0.07 m distance. The soil NO3-N after each of the three irrigation events decreased by 25.42–40.20%, 22.26–35.09%, and 28.61–40.13%, respectively, with an increase in the lateral distance from 0.14 m to 0.20 m (Table S7 in Supplemental Data). A similar trend was noted among all N300 treatments; namely, soil NO3-N concentrations across depths of 0.05 to 0.25 m and at lateral distances of 0.07, 0.14, and 0.20 m declined from SDI5 + N300 to SDI15 + N300. After the first, second, and third irrigation events, mean soil NO3-N concentrations decreased significantly by 5.19–29.92%, 2.14–19.81%, and 3.31–19.42% for SDI10 + N300 (Table S8 in supplemental data), and 16.78–41.57%, 11.25–30.08%, and 12.54–30.73% for SDI15 + N300 (Table S9 in supplemental data), respectively. Soil NO3-N levels fluctuated with depth, but differences were insignificant. Generally, NO3-N concentrations were greatest at a 0.05 m depth. Concentrations increased with fertilization events and decreased with greater depth. NO3-N increased with horizontal distance (Figure 7). The results also demonstrated that soil NO3-N under N240 treatments followed a similar pattern to those under N300 treatments, but their values were lower (p > 0.05) (Figure 8).

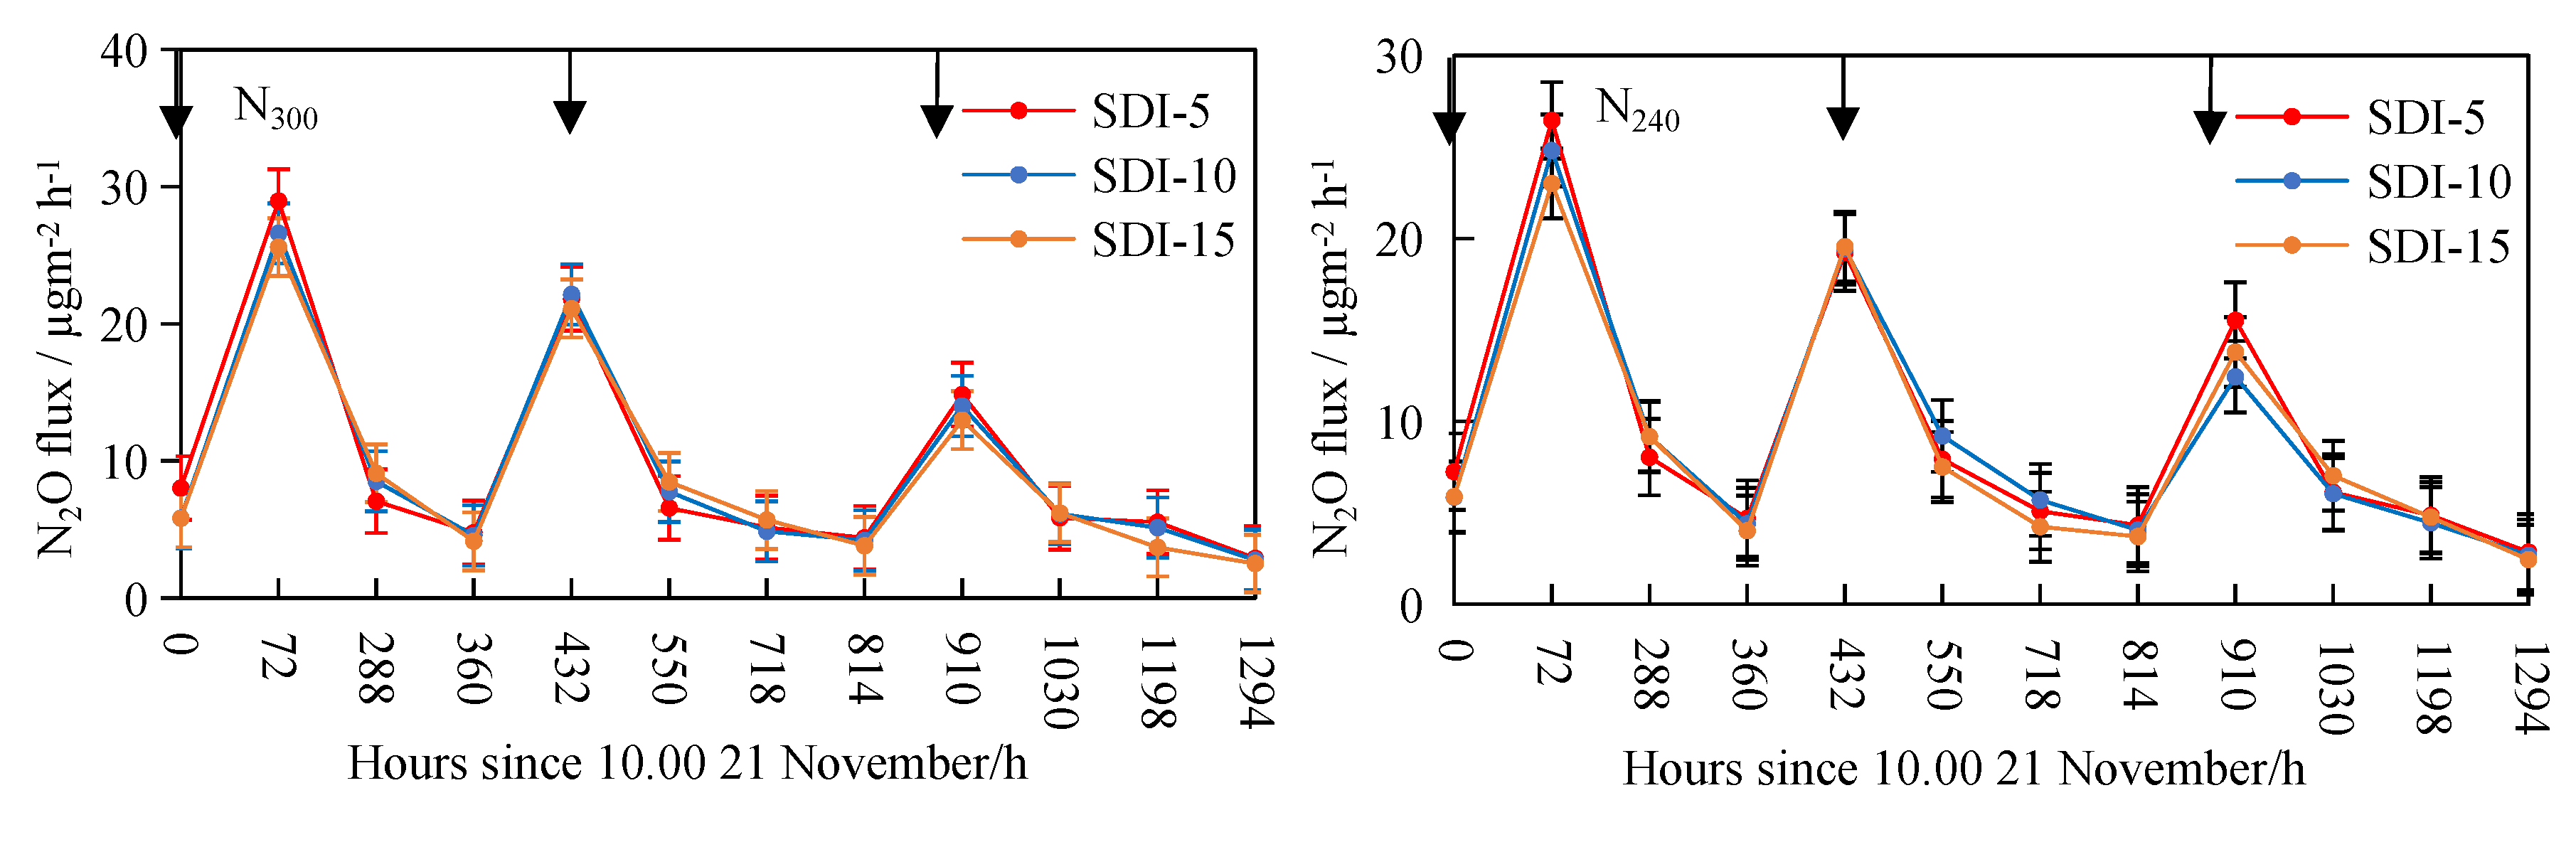
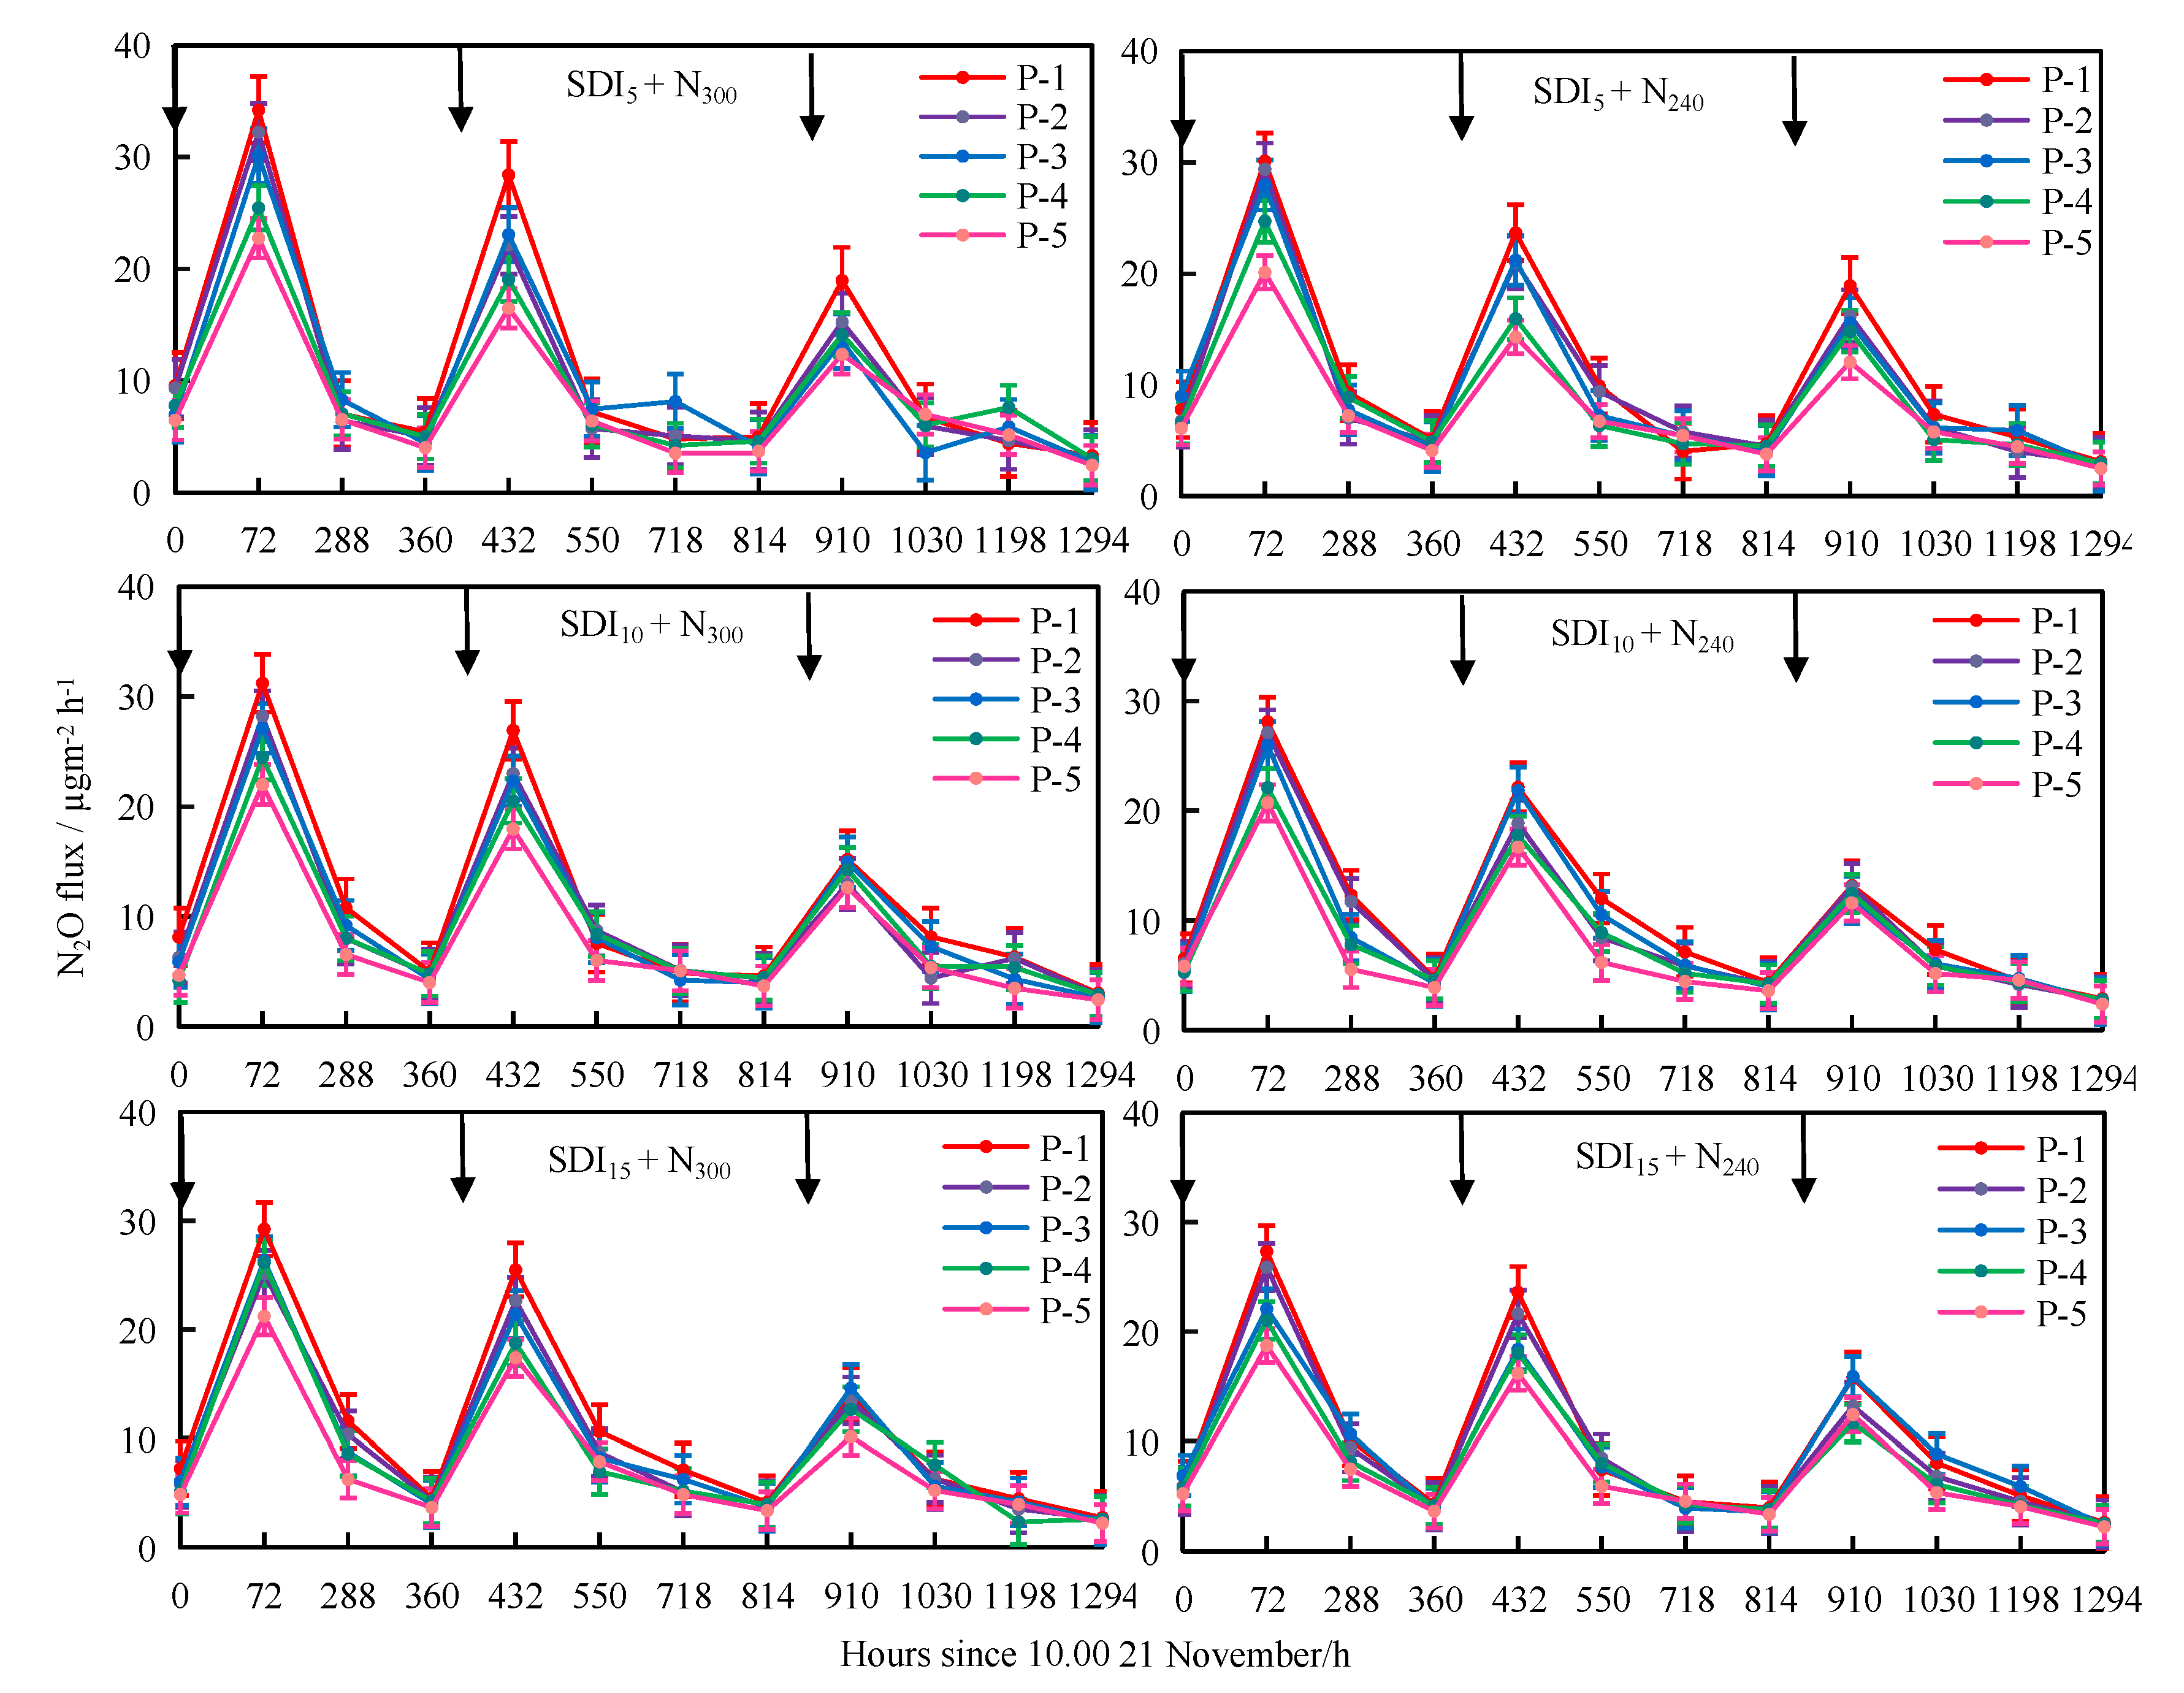
3.4. Soil N2O Emissions

Soil N2O emissions were influenced by the mineral fertilizer applied and the irrigation system used. Peak soil N2O emissions occurred in the early hours of the experimental period. The mean peak N2O flux from five chambers per plot under SDI5 was 28.95 μg N2O m−2 h−1 (Figure 9) and occurred 72 h after the first fertigation event. Fluxes under SDI5 were greater (p < 0.05) than under SDI10 and SDI15 when the maximum soil WFPS ranged by 20.1–20.6% (Table S1 in Supplemental Data). From 72 h onward (72–360 h), the N2O fluxes, varying across a range of 4.87–28.95 μg N2O m−2 h−1, declined rapidly with the decrease in θ, particularly when the soil WFPS declined by 17.1–20.6% under the SDI5 treatment. A similar pattern of average N2O fluxes occurred after the second and third fertigations, with peak fluxes of 24.82 and 15.53 μg N2O m−2 h−1 at WFPS levels of 26.2% and 28.2%, respectively (Table S1 in Supplemental Data). Showing similar patterns to those under SDI5, N2O fluxes under SDI10 and SDI15 treatments resulted in peak N2O fluxes of 26.60 and 25.60 μg N2O m−2 h−1, respectively (Figure 9) within 72 h of the first watering when the average WFPS was 19.2% or 18.8%, respectively (Tables S2 and S3 in Supplemental Data). Under both N fertilizer rates and over the entire sampling period, the SDI15 plots had a lower N2O flux than the SDI5 or SDI10 plots.
Gas fluxes varied with the placement of the chambers relative to the drip irrigation emitter. Within each treatment plot, of the five chambers located at different distances from the emitter, the peak N2O flux (34.21 μg N2O m−2 h−1) occurred at Chamber 1 (point 1), situated nearest the emitter in a horizontal direction. Under SDI5 + N300, this first peak occurred within 72 h after the first irrigation. The N2O flux decreased gradually until another peak (28.40 μg N2O m−2 h−1) occurred at 432 h after the first watering event, and a third peak (18.96 μg N2O m−2 h−1) occurred after 910 h (Figure 10). Under SDI5 + N240, peak N2O fluxes of 30.12, 23.68, and 18.93 μg N2O m−2 h−1 occurred after 72, 432, and 910 h, respectively. As shown in Figure 10, for the other sampling points, either under N300 or N240, the trend was similar in that fluxes increased initially after each watering event then decreased gradually until the following irrigation event. In general, the obvious emission peaks were observed 1–3 days after each irrigation.

3.5. Relationship between N2O Emissions and Soil WFPS, NH4+-N, and NO3-N

Pearson correlation analysis showed non-significant positive correlation coefficients (R2) after the first, second, and third fertigations for N2O fluxes and soil WFPS. At all five sampling points, the highest R2 values occurred at a depth of 0.05 m and a lateral distance of 0.07 m. At a lateral distance of 0.14 m, the maximum R2 was observed at a 0.15 m depth, while at a lateral distance of 0.20 m, the highest R2 value was at a 0.10 m depth (Table 1 and Tables S10 and S11 in Supplemental Data). The N2O flux increased with WFPS while NH4+-N was positively correlated with N2O (p < 0.05, Tables S12–S14 in Supplemental Data), whereas a negative relationship was observed with NO3-N (p < 0.05, Tables S15–S17 in Supplemental Data).

3.6. Chinese Cabbage Yield

The Chinese cabbage yield was greatest for SDI15 + N300, followed by the SDI10 + N300 and SDI5 + N300 treatments. Compared to the yield under SDI5 + N300, the yields under SDI10 + N300 and SDI15 + N300 were 4.33% and 41.73% greater (Table 2). A similar pattern was found under the N240 treatments, with the following order: SDI15 + N240 > SDI10 + N240 > SDI5 + N240. Compared with SDI5 + N240, the crop yield significantly increased by 16.9% and 57.92% for SDI10 + N240 and SDI15 + N240, respectively. The emitter depth and N level significantly affected the crop yield, but their interaction effect was insignificant (Table 2).

4. Discussion

4.1. Effect of Soil Moisture on N2O Emissions

Irrigation practices directly affect θ dynamics, leading to greater GHG emissions [20]. As one of the main factors affecting soil N2O emissions after precipitation or irrigation, θ remains high for a short period and declines rapidly in the topsoil layer according to the climate conditions such as temperature and solar radiation [21,22,23]. Greater θ increases anaerobic microsites and promotes N2O emission via denitrification [24]. Continuous efforts are required to improve the quantification of N2O emissions from different agricultural practices and N-fertilized crops [25]. In the current study, under either N240 or N300 nitrogen fertilization levels, the highest θ occurred under SDI5. The maximum θ value was observed immediately after each irrigation event and declined slowly until the next. The mean soil WFPS varied from 14.2 to 28.2% during the entire observation period, which was slightly lower than the values reported by previous studies. For example, Hou et al. [6] reported that peak N2O emissions were generally observed when the WFPS was in the range of 45–90%. Low θ may affect the transfer of NH4+-N by microorganisms, resulting in low N2O emissions. Our findings concur with those of [4]. Sanchez-Martin et al. [14] noted that the biggest pulses of N2O emissions occurred after the first irrigation. Indeed, the application of water to dry soil results in the activation of microorganisms and a rise in N2O emissions [26]. In the present study, N2O produced under the SDI15 treatment was less than that generated under the SDI5 and SDI10 treatments (p < 0.05). This might be attributable to N2O produced under SDI15 perhaps not reaching the atmosphere or being restricted because of N2O consumption reactions in the upper soil layers [27]. A study by Rychel et al. [28], supported in its general conclusions by the work of Xu et al. [4], found that N2O emissions under a shallow fertilizer placement (0.07 m) treatment were generally greater than those occurring under a deep fertilizer placement (0.20 m). The present results indicated that after the first watering event, the WFPS distanced 0.07 m laterally from an emitter was higher than at lateral distances of 0.14 or 0.20 m. This was attributable to the water distribution and the distance from the emitter. In contrast, after the second and third irrigation events, the WFPS at 0.20 m > 0.07 m > 0.14 m, possibly because some overlap in watering might have occurred. We agree with the observations of Li et al. [29] and Sanchez-Martin et al. [14], who concluded that the soil volume remains dry after the first irrigation, but after each subsequent irrigation event, the wetting front advances slightly. Our findings were also supported by Kuang et al. [5], who stated that the WFPS of areas away from drip tape was low.
Vertical θ distribution characteristics under different irrigation regimes will change N2O emission patterns [4]. Within each treatment, we found that the mean WFPS at a depth of 0.05 m tended to be greater than at greater depths but that any differences were not significant. The θ decreased with an increase in the lateral distance from the emitter, and the θ distribution shifted quickly after irrigation as water could move easily through the soil, then slow down gradually (Figure 3 and Figure 4) due to dry soil conditions. Observing the five different chambers sampled for a given treatment, N2O flux in a chamber (P1) near the emitter was greater than at other more distal points. This could have been due to higher θ proximal to the emitter, which favored the proliferation of microorganisms involved in the nitrification and denitrification processes. Our findings are consistent with Schaufler et al. [24], who reported that N2O emissions declined when the θ was low and limited microbial activity. According to the Pearson correlation analysis, soil WFPS was positively correlated to N2O emissions among all SDI treatments and for both N fertilization treatment (N240 and N300) levels (Table 1 and Tables S10 and S11 in Supplemental Data). Weslien et al. [30] also noted that N2O fluxes were positively correlated to the WFPS.

4.2. Effect of Soil NH4+-N Distribution on N2O Emissions

N2O is derived from nitrification and denitrification processes occurring in the soil, which rely on the availability of NH4+-N and NO3-N, respectively, and on θ, in addition to other factors [31,32]. The soil NH4+-N concentration after the first irrigation event rapidly decreased, and values were less than 7 mg NH4+-N kg−1 in subsequent days [33]. Our findings showed that NH4+-N was significantly greater under SDI5 than SDI10, while for both, it was greater than under SDI15. Within each treatment, the maximum NH4+-N concentration occurred after each irrigation event, then decreased until the next irrigation. Among the five vertical sampling depths, NH4+-N in the upper soil layer (0.05 m) was higher than in deeper soil layers. Similar to the work of Li et al. [29], we found a high NH4+-N concentration close to the point source (about 0.025–0.075 m from the source).
Moreover, correlation analysis indicated that NH4+-N had a positive and significant relationship with N2O emissions. For instance, for SDI5 + N300 at a 0.07 m lateral distance, a significant correlation was noted at depths of 0.05 m, 0.20 m, and 0.25 m, with the maximum R2 values occurring at a 0.05 m depth. For a 0.14 m horizontal distance, NH4+-N significantly correlated with N2O at 0.05 m and 0.25 m depths, with the maximum R2 values registered at the latter depth. Furthermore, some correlations were found at a 0.20 m horizontal distance, with the R2 values highest in the upper layers (Table S12 in Supplemental Data).

4.3. Effect of Soil NO3-N Distribution on N2O Emissions

Application of nitrogen with SDI places NO3-N below the soil surface and within the root zone, facilitating crop uptake [34]. In another study, the NO3-N concentration increased significantly as the radial distance from the emitter exceeded 0.20 m [29]. In the current study, across all treatments, an increasing trend in soil NO3-N occurred after each irrigation/fertilization event until the following such event (sampling times were between fertigation events). We speculate that due to decreasing θ, and because NO3-N is very soluble in water, it remains in the soil rather than being taken up by the plant or converted into emissions. The present findings demonstrate that for all treatments, the average NO3-N concentrations at a 0.20 m lateral distance from the emitter were significantly greater (p < 0.05) than at other distances, which may be due to the crop roots being unable to reach this point to take up NO3-N. While no significant difference in NO3-N was found between the N240 and N300 fertilization rates, NO3-N levels tended to be slightly higher at the N300 level, perhaps indicating that an increase in fertilization rate will increase the N2O emission rate. These findings confirmed the observations of Hoben et al. [35], who reported that the N2O emissions increase with an increasing N fertilization rate. The results also concur with those of Kong et al. [36], who observed in an apple orchard that the cumulative production of N2O tended to increase with increasing N doses. In the present study, correlation analysis indicated that NO3-N concentrations were negatively correlated to soil N2O emission (p < 0.05). Taking SDI5 + N300 (Table S15) as an example, NO3-N, at a lateral distance of 0.07 m, was mainly concentrated in the 0.10–0.25 m soil depth, with the maximum correlations coefficient generally occurring at a 0.15 m depth. For the 0.14 m horizontal distance, the NO3-N concentration was significantly correlated to N2O at depths of 0.05, 0.15, 0.20, and 0.25 m, with a maximum R2 at 0.20 m. At a 0.20 m horizontal distance, significant correlations were observed at a depth of 0.25 m (Table S15 in Supplemental Data). Furthermore, under SDI5 + N240, for both the 0.07 m and 0.14 m horizontal distances, significant correlations occurred at depths from 0.10–0.25 m. At a 0.20 m horizontal distance, significant correlations were only observed at a 0.15 m depth (Table S15 in Supplemental Data). A study by Weslien et al. [30] also reported that N2O fluxes were negatively correlated to the soil NO3-N concentrations. According to the results, N2O emissions were not regulated by NO3-N availability alone, but other factors were involved. As N2O emissions in our study were low, we speculate that low soil aeration and temperature during the winter season might have reduced microbial activity. Our findings are supported by Kuang et al. [5], who found that low N2O emissions are likely associated with the cool overnight air and soil temperature under arid conditions. Beyond this, another reason for low N2O emissions could be the lack of NO3-N and water uptake by the crop.

4.4. Crop Yield

Under the SDI method, greater irrigation water use efficiency and higher yields were recorded with lesser water applications: the yield and water use efficiency for SDI emitters at a 0.15 m depth were significantly higher than at other depths [37]. In the SDI5 and SDI10 treatments, the soil moisture was mainly concentrated in the shallow soil layers (5~10 cm). Under the evaporation and transpiration processes, the soil moisture and nitrogen of these parts of the soil layers were more prone to loss into the atmospheric system in the form of water vapor, resulting in a decrease in the amount of water supposedly absorbed and utilized by the plant. At the same time, the reduction of soil moisture also led to an increase in soil temperature, which is another crucial factor affecting crop growth. In contrast, under the condition of SDI15, soil water was mainly concentrated in the deeper soil layers, and its evaporation was limited, resulting in the absorption of more water stored in the soil. In addition, with the growth of the crop, the central root zone was also increasing. Chinese cabbage’s primary root water absorption zone is 5~10 cm, and a more reasonable water distribution and higher water content in the root zone promote crop yield improvement. These results concur with Singh and Rajput [38], who found that the yield was significantly greater when emitters were placed at depths of 0.10 m and 0.15 m below the soil surface.

4.5. Limitations of Subsurface Drip Irrigation and Future Work

The flow rate of the dripper in this study was 3 L h−1, but with an increase of soil moisture near the drippers and extension of the irrigation pipes, the drippers’ flow rate should be gradually reduced. This problem can be estimated by the water flow meters installed at different drippers, and we believe this is also an interesting research direction. However, in the current study, we focused on the effects of the same irrigation amount on soil water and nitrogen dynamics and soil N2O emissions under the condition of different dripper burial depths of SDI. In future research, we will conduct experiments on the impacts of dripper flow on soil water, nitrogen, and soil N2O emissions. We will also study the effects of different irrigation regimes on soil water and nitrogen dynamics and N2O emissions under different burial depths of SDI based on changes in soil moisture.

5. Conclusions

In this paper, we have presented the findings of our investigation into N2O emissions under SDI with emitters at different depths and N fertilization rates. Compared to the SDI5 and SDI10 treatments, SDI15 reduced the N2O emissions and increased the Chinese cabbage yield. Within each treatment, the placement of the chamber affected the N2O emissions, with a chamber 0.05 m away from the emitter contributing higher emissions than the four laterally farther away. Emissions of N2O increased with WFPS and NH4+-N concentrations but declined with an increase in soil NO3-N. The present study showed the N300 fertilization rate to result in slightly greater WFPS, NH4+-N, NO3-N, and N2O emission levels than N240; however, these differences were not significant. The extent of N2O emissions was positively correlated to WFPS and NH4+-N but negatively to NO3-N. Our results suggest that to reduce N2O emissions and enhance Chinese cabbage yield, a combination of SDI techniques with emitters buried at a 0.15 m depth and N fertilizers should be considered. However, understanding horizontal and vertical water distribution dynamics is a strategic underpinning of agriculture production because it saves water, mitigates emissions, and enhances the yield. Moreover, increasing the fertilizer placement depth can improve agricultural practices and mitigate GHG emissions. More studies are necessary to thoroughly understand the influence of irrigation and N management strategies, and their vertical and horizontal distribution, to mitigate N2O emissions from agricultural soils.

Supplementary Materials

The following are available online at https://www.mdpi.com/article/10.3390/agronomy12030745/s1, Figure S1: Soil moisture distribution under SDI10+N300 treatment. letters a, b, and c represent first, second, and third irrigation events. The subscript numbers 1, 2, 3, and 4 denote sampling times of soil moisture subsequent to each irrigation; Figure S2: Soil moisture distribution under SDI15+N300 treatment. letters a, b, and c represent first, second, and third irrigation events. The subscript numbers 1, 2, 3, and 4 denote sampling times of soil moisture within each irrigation; Figure S3: Soil moisture distribution under SDI10 + N240 treatment. Letters a, b, and c represent first, second, and third irrigation events. The subscript numbers 1, 2, 3, and 4 denote sampling times of soil moisture subsequent to each irrigation; Figure S4: Soil moisture distribution under SDI15 + N240 treatment. letters a, b, and c represent first, second, and third irrigation events. The subscript numbers 1, 2, 3, and 4 denote sampling times of soil moisture within each irrigation, Table S1: Soil average ± standard deviation of WFPS% for SD15 treatments; Table S2: Soil average ± standard deviation of WFPS% for SD110 treatments; Table S3: Soil average ± standard deviation of WFPS% for SD115 treatments; Table S4: Soil average ± standard deviation of NH4+-N mg kg−1 under SD15 treatments; Table S5: Soil average ± standard deviation of NH4+-N mg kg−1 under SD110 treatments; Table S6: Soil average ± standard deviation of NH4+-N mg kg−1 under SD115 treatments; Table S7: Soil average ± standard deviation of NO3-N mg kg−1 under SD15 treatments; Table S8: Soil average ± standard deviation of NO3-N mg kg−1 under SD110 treatments; Table S9: Soil average ± standard deviation of NO3-N mg kg−1 under SD115 treatments; Table S10: Correlations (R2) between N2O emissions and soil moisture at different depths under SDI10; Table S11: Correlations (R2) between N2O emissions and soil moisture at different depths under SDI15; Table S12: Correlations (R2) between N2O emissions and soil NH4+-N at different depths under SDI5; Table S13: Correlations (R2) between N2O emissions and soil NH4+-N at different depths under SDI10; Table S14: Correlations (R2) between N2O emissions and soil NH4+-N at different depths under SDI15; Table S15: Correlations (R2) between N2O emissions and soil NO3 at different depths under SDI5; Table S16: Correlations (R2) between N2O emissions and soil NO3 at different depths under SDI10; Table S17: Correlations (R2) between N2O emissions and soil NO3 at different depths under SDI15.

Author Contributions

Conceptualization, A.A.A.H. and J.X.; methodology, A.A.A.H., L.W. and Q.W.; statistical analysis, A.A.A.H., Q.W. and H.S.; writing—original draft preparation, A.A.A.H.; writing—review and editing, Y.A.H., A.A.A.H. and Y.L. All authors have read and agreed to the published version of the manuscript.

Funding

This research was funded by Fundamental Research Funds for the Central Universities (B200201004) and the National Natural Science Foundation of China (51809077, 51879075).

Institutional Review Board Statement

Not applicable.

Informed Consent Statement

Not applicable.

Data Availability Statement

Not applicable.

Conflicts of Interest

The authors declare no conflict of interest.

References

  1. Gao, S.; Hendratna, A.; Cai, Z.; Duan, Y.; Qin, R.; Rebecca, T.-C. Subsurface Drip Irrigation Reduced Nitrous Oxide Emissions in a Pomegranate Orchard. Int. J. Environ. Sci. Dev. 2019, 10, 79–85. [Google Scholar] [CrossRef] [Green Version]
  2. Harwood, J.E.; Huyser, D.J. Automated Analysis of Ammonia in Water. Water Res. 1970, 4, 695–704. [Google Scholar] [CrossRef]
  3. Syakila, A.; Kroeze, C. The Global Nitrous Oxide Budget Revisited. Greenh. Gas Meas. Manag. 2011, 1, 17–26. [Google Scholar] [CrossRef]
  4. Xu, J.; Wei, Q.; Yang, S.; Wang, Y.; Lv, Y. Diurnal Pattern of Nitrous Oxide Emissions from Soils under Different Vertical Moisture Distribution Conditions. Chil. J. Agric. Res. 2016, 76, 84–92. [Google Scholar] [CrossRef] [Green Version]
  5. Kuang, W.; Gao, X.; Gui, D.; Tenuta, M.; Flaten, D.N.; Yin, M.; Zeng, F. Effects of Fertilizer and Irrigation Management on Nitrous Oxide Emission from Cotton Fields in an Extremely Arid Region of Northwestern China. Field Crops Res. 2018, 229, 17–26. [Google Scholar] [CrossRef]
  6. Hou, H.; Yang, S.; Wang, F.; Li, D.; Xu, J. Controlled Irrigation Mitigates the Annual Integrative Global Warming Potential of Methane and Nitrous Oxide from the Rice–Winter Wheat Rotation Systems in Southeast China. Ecol. Eng. 2016, 86, 239–246. [Google Scholar] [CrossRef]
  7. Wu, J.; Guo, W.; Feng, J.; Li, L.; Yang, H.; Wang, X.; Bian, X. Greenhouse Gas Emissions from Cotton Field under Different Irrigation Methods and Fertilization Regimes in Arid Northwestern China. Sci. World J. 2014, 2014, 407832. [Google Scholar] [CrossRef] [PubMed]
  8. Ye, X.H.; Han, B.; Li, W.; Zhang, X.C.; Zhang, Y.L.; Lin, X.G.; Zou, H.T. Effects of Different Irrigation Methods on Nitrous Oxide Emissions and Ammonia Oxidizers Microorganisms in Greenhouse Tomato Fields. Agric. Water Manag. 2018, 203, 115–123. [Google Scholar] [CrossRef]
  9. Edwards, K.P.; Madramootoo, C.A.; Whalen, J.K.; Adamchuk, V.I.; Mat Su, A.S.; Benslim, H. Nitrous Oxide and Carbon Dioxide Emissions from Surface and Subsurface Drip Irrigated Tomato Fields. Can. J. Soil Sci. 2018, 98, 389–398. [Google Scholar] [CrossRef]
  10. Delang, C.O. Causes and Distribution of Soil Pollution in China. Environ. Socio-Econ. Stud. 2017, 5, 1–17. [Google Scholar] [CrossRef] [Green Version]
  11. Alhaj Hamoud, Y.; Guo, X.; Wang, Z.; Shaghaleh, H.; Chen, S.; Hassan, A.; Bakour, A. Effects of Irrigation Regime and Soil Clay Content and Their Interaction on the Biological Yield, Nitrogen Uptake and Nitrogen-Use Efficiency of Rice Grown in Southern China. Agric. Water Manag. 2019, 213, 934–946. [Google Scholar] [CrossRef]
  12. Alhaj Hamoud, Y.; Shaghaleh, H.; Sheteiwy, M.; Guo, X.; Elshaikh, N.A.; Ullah Khan, N.; Oumarou, A.; Rahim, S.F. Impact of Alternative Wetting and Soil Drying and Soil Clay Content on the Morphological and Physiological Traits of Rice Roots and Their Relationships to Yield and Nutrient Use-Efficiency. Agric. Water Manag. 2019, 223, 105706. [Google Scholar] [CrossRef]
  13. Kumar Jha, S.; Ramatshaba, T.S.; Wang, G.; Liang, Y.; Liu, H.; Gao, Y.; Duan, A. Response of Growth, Yield and Water Use Efficiency of Winter Wheat to Different Irrigation Methods and Scheduling in North China Plain. Agric. Water Manag. 2019, 217, 292–302. [Google Scholar] [CrossRef]
  14. Sánchez-Martín, L.; Vallejo, A.; Dick, J.; Skiba, U.M. The Influence of Soluble Carbon and Fertilizer Nitrogen on Nitric Oxide and Nitrous Oxide Emissions from Two Contrasting Agricultural Soils. Soil Biol. Biochem. 2008, 40, 142–151. [Google Scholar] [CrossRef]
  15. Maris, S.C.; Teira-Esmatges, M.R.; Arbonés, A.; Rufat, J. Effect of Irrigation, Nitrogen Application, and a Nitrification Inhibitor on Nitrous Oxide, Carbon Dioxide and Methane Emissions from an Olive (Olea europaea L.) Orchard. Sci. Total Environ. 2015, 538, 966–978. [Google Scholar] [CrossRef] [PubMed]
  16. Wei, Q.; Xu, J.; Li, Y.; Liao, L.; Liu, B.; Jin, G.; Hameed, F. Reducing Surface Wetting Proportion of Soils Irrigated by Subsurface Drip Irrigation Can Mitigate Soil N2O Emission. Int. J. Environ. Res. Public Health 2018, 15, 2747. [Google Scholar] [CrossRef] [Green Version]
  17. Wei, Q.; Xu, J.; Yang, S.; Qi, Z.; Wang, Y.; Liao, L. Partial Wetting Irrigation Resulted in Non-Uniformly Low Nitrous Oxide Emissions from Soil. Atmos. Environ. 2017, 161, 200–209. [Google Scholar] [CrossRef] [Green Version]
  18. Hamad, A.A.A.; Xu, J.; Wei, Q.; Hamoud, Y.A.; Shaghaleh, H.; Wang, K.; Hameed, F.; Xu, L. Effect of Different Irrigation and Nitrogen Management Options on Growth, Yield and Water Use Efficiency of Chinese Cabbage in Greenhouse Cultivation. Pak. J. Agric. Sci. 2021, 58, 341–356. [Google Scholar]
  19. Ning, D.; Qin, A.; Duan, A.; Xiao, J.; Zhang, J.; Liu, Z.; Liu, Z.; Zhao, B.; Liu, Z. Deficit Irrigation Combined with Reduced N-Fertilizer Rate Can Mitigate the High Nitrous Oxide Emissions from Chinese Drip-Fertigated Maize Field. Glob. Ecol. Conserv. 2019, 20, e00803. [Google Scholar] [CrossRef]
  20. Tian, D.; Zhang, Y.; Mu, Y.; Zhou, Y.; Zhang, C.; Liu, J. The Effect of Drip Irrigation and Drip Fertigation on N2O and NO Emissions, Water Saving and Grain Yields in a Maize Field in the North China Plain. Sci. Total Environ. 2017, 575, 1034–1040. [Google Scholar] [CrossRef]
  21. El-Shafie, A.F.; Osama, M.A.; Hussein, M.M.; El-Gindy, A.M.; Ragab, R. Predicting Soil Moisture Distribution, Dry Matter, Water Productivity and Potato Yield under a Modified gated Pipe Irrigation System: SALTMED Model Application Using Field Experimental Data. Agric. Water Manag. 2017, 184, 221–233. [Google Scholar] [CrossRef]
  22. Gao, J.; Yan, Y.; Hou, X.; Liu, X.; Zhang, Y.; Huang, S.; Wang, P. Vertical Distribution and Seasonal Variation of Soil Moisture after Drip-Irrigation Affects Greenhouse Gas Emissions and Maize Production during the Growth Season. Sci. Total Environ. 2021, 763, 142965. [Google Scholar] [CrossRef] [PubMed]
  23. Reyes-Cabrera, J.; Zotarelli, L.; Dukes, M.D.; Rowland, D.L.; Sargent, S.A. Soil Moisture Distribution under Drip Irrigation and Seepage for Potato Production. Agric. Water Manag. 2016, 169, 183–192. [Google Scholar] [CrossRef] [Green Version]
  24. Schaufler, G.; Kitzler, B.; Schindlbacher, A.; Skiba, U.; Sutton, M.A.; Zechmeister-Boltenstern, S. Greenhouse Gas Emissions from European Soils under Different Land Use: Effects of Soil Moisture and Temperature. Eur. J. Soil Sci. 2010, 61, 683–696. [Google Scholar] [CrossRef]
  25. Meng, Y.; Wang, J.J.; Wei, Z.; Dodla, S.K.; Fultz, L.M.; Gaston, L.A.; Xiao, R.; Park, J.H.; Scaglia, G. Nitrification Inhibitors Reduce Nitrogen Losses and Improve Soil Health in a Subtropical Pastureland. Geoderma 2021, 388, 114947. [Google Scholar] [CrossRef]
  26. Dick, J.; Skiba, U.; Wilson, J. The Effect of Rainfall on NO and N2O Emissions from Ugandan Agroforest Soils. Phyton 2001, 41, 73–80. [Google Scholar]
  27. Li, Y.; Gao, X.; Tenuta, M.; Gui, D.; Li, X.; Xue, W.; Zeng, F. Enhanced Efficiency Nitrogen Fertilizers Were Not Effective in Reducing N2O Emissions from a Drip-Irrigated Cotton Field in Arid Region of Northwestern China. Sci. Total Environ. 2020, 748, 141543. [Google Scholar] [CrossRef]
  28. Rychel, K.; Meurer, K.H.E.; Börjesson, G.; Strömgren, M.; Getahun, G.T.; Kirchmann, H.; Kätterer, T. Deep N Fertilizer Placement Mitigated N2O Emissions in a Swedish Field Trial with Cereals. Nutr. Cycl. Agroecosystems 2020, 118, 133–148. [Google Scholar] [CrossRef]
  29. Li, J.; Zhang, J.; Ren, L. Water and Nitrogen Distribution as Affected by Fertigation of Ammonium Nitrate from a Point Source. Irrig. Sci. 2003, 22, 19–30. [Google Scholar] [CrossRef]
  30. Weslien, P.; Rütting, T.; Kasimir-Klemedtsson, Å.; Klemedtsson, L. Carrot Cropping on Organic Soil Is a Hotspot for Nitrous Oxide Emissions. Nutr. Cycl. Agroecosystems 2012, 94, 249–253. [Google Scholar] [CrossRef]
  31. de Klein, C.A.M.; van der Weerden, T.J.; Luo, J.; Cameron, K.C.; Di, H.J. A Review of Plant Options for Mitigating Nitrous Oxide Emissions from Pasture-Based Systems. N. Zeal. J. Agric. Res. 2020, 63, 29–43. [Google Scholar] [CrossRef]
  32. Raposo, E.; Brito, L.F.; Janusckiewicz, E.R.; Oliveira, L.F.; Versuti, J.; Assumpção, F.M.; Cardoso, A.S.; Siniscalchi, D.; Delevatti, L.M.; Malheiros, E.B.; et al. Greenhouse Gases Emissions from Tropical Grasslands Affected by Nitrogen Fertilizer Management. Agron. J. 2020, 112, 4666–4680. [Google Scholar] [CrossRef]
  33. Sanchez-Martín, L.; Meijide, A.; Garcia-Torres, L.; Vallejo, A. Combination of Drip Irrigation and Organic Fertilizer for Mitigating Emissions of Nitrogen Oxides in Semiarid Climate. Agric. Ecosyst. Environ. 2010, 137, 99–107. [Google Scholar] [CrossRef]
  34. Ayars, J.E.; Phene, C.J.; Phene, R.C.; Gao, S.; Wang, D.; Day, K.R.; Makus, D.J. Determining Pomegranate Water and Nitrogen Requirements with Drip Irrigation. Agric. Water Manag. 2017, 187, 11–23. [Google Scholar] [CrossRef] [Green Version]
  35. Hoben, J.P.; Gehl, R.J.; Millar, N.; Grace, P.R.; Robertson, G.P. Nonlinear Nitrous Oxide (N2O) Response to Nitrogen Fertilizer in on-Farm Corn Crops of the US Midwest. Glob. Change Biol. 2011, 17, 1140–1152. [Google Scholar] [CrossRef]
  36. Kong, Y.; Watanabe, M.; Nagano, H.; Watanabe, K.; Yashima, M.; Inubushi, K. Effects of Land-Use Type and Nitrogen Addition on Nitrous Oxide and Carbon Dioxide Production Potentials in Japanese Andosols. Soil Sci. Plant Nutr. 2013, 59, 790–799. [Google Scholar] [CrossRef]
  37. Vadar, H.R.; Pandya, P.A.; Patel, R.J. Effect of Subsurface Drip Irrigation Depth Scheduling in Summer Okra. Emergent Life Sci. Res. 2019, 5, 52–61. [Google Scholar] [CrossRef]
  38. Singh, D.K.; Rajput, T.B.S. Response of Lateral Placement Depths of Subsurface Drip Irrigation on Okra (Abelmoschus esculentus). Int. J. Plant Prod. 2012, 1, 73–84. [Google Scholar]
Figure 1. Experimental layout of subsurface drip irrigation system. Treatment layout (a), plot layout (b), and horizontal distances from the dripper point (c).
Agronomy 12 00745 g001
Figure 2. Static chamber.
Agronomy 12 00745 g002
Figure 3. Soil moisture distribution under SDI5 + N300 treatment. Latter a, b, and c represent first, second, and third irrigation events. The subscript numbers 1–4 denote sampling times of soil moisture subsequent to each irrigation.
Agronomy 12 00745 g003
Figure 4. Soil moisture distribution under SDI5 + N240 treatment. Latter a, b, and c represent first, second, and third irrigation events. The subscript numbers 1–4 denote sampling times of soil moisture subsequent to each irrigation.
Agronomy 12 00745 g004
Figure 5. Soil NH4+-N after three irrigation events occurring from different emitter depths under the 300 kg N ha−1 fertilization rate. Error bars represent standard error.
Agronomy 12 00745 g005
Figure 6. Soil NH4+-N after three irrigation events occurring from different emitter depths under the 240 kg N ha−1 fertilization rate. Error bars represent standard error.
Agronomy 12 00745 g006
Figure 7. Soil NO3-N after three irrigation events occurring from different emitter depths under the 300 kg N ha−1 fertilization rate. Error bars represent standard error.
Agronomy 12 00745 g007
Figure 8. Soil NO3-N after each of three irrigation events occurring from different emitter depths under the 240 kg N ha−1 fertilization rate. Error bars represent standard error.
Agronomy 12 00745 g008
Figure 9. Trend of N2O flux under different SDI emitter depths over the whole experimental period. Each data point is the mean flux for five chambers replicated three times. Downward arrows represent a water and fertilizer application event. Error bars represent standard error.
Agronomy 12 00745 g009
Figure 10. Trend of N2O flux under different SDI emitter depths over the entire experimental period. P-1, P-2, P-3, P-4, and P-5 represent chambers 1–5. Arrows represent water and fertilizer application events. Error bars represent standard error.
Agronomy 12 00745 g010
Table 1. Pearson correlation coefficients (R2) between N2O emissions and soil moisture at different depths under the SDI5 irrigation treatment.
TreatmentHorizontal
Distance (m)
Depths
(cm)
Point 1Point 2Point 3Point 4Point 5
SDI5 + N3000.07 m50.08960.05230.04060.07840.0948
100.06810.04290.02370.06890.0759
150.03660.02150.01070.05070.0614
200.03080.01450.00580.03730.0447
250.00480.00010.00400.00740.0089
0.14 m50.14360.09750.06910.13740.1582
100.08930.06110.03830.08930.1017
150.18340.13960.11250.19800.2223
200.01480.00730.00130.02680.0350
250.01160.02670.03480.01020.0072
0.20 m50.09160.04490.04370.07570.0865
100.11430.06680.05200.10300.1170
150.00650.00010.00070.00580.0077
200.00960.00080.00000.01000.0122
250.01970.00250.00540.01360.0146
SDI5 + N2400.07 m50.10760.07760.09060.04570.0813
100.08190.05650.07150.03770.0597
150.06740.04030.04380.04320.0526
200.05680.03460.03210.03370.0401
250.01180.00390.00430.00140.0046
0.14 m50.17190.12590.14550.10150.1393
100.10870.07550.09900.06040.0890
150.23300.18000.19710.16460.2032
200.02480.01080.01600.00620.0135
250.00710.01320.01390.03160.0156
0.20 m50.10900.07860.08160.04170.0738
100.13840.09800.10830.06680.0979
150.01140.00290.00440.00000.0023
200.01580.00580.00730.00070.0051
250.02360.01360.01330.00080.0092
Note: Values in bold are the maximum correlation among five depths at each point.
Table 2. Effect of different SDI emitter depths and fertilizer management on Chinese cabbage yield.
TreatmentYield kg m−2
SI + N3002.54 ± 0.11 C
SI + N2401.83 ± 0.08 E
DI + N3002.65 ± 0.11 BC
DI + N2402.14 ± 0.09 D
SDI5 + N3003.60 ± 0.15 A
SDI5 + N2402.89 ± 0.12 B
I*
N*
I × Nns
Note: SDI5, SDI10, and SDI15 represent subsurface drip irrigation with drippers buried at 5, 10, and 15 cm below the soil surface, respectively. I and N represent irrigation and nitrogen, respectively. Values of the column followed with different uppercase letters are significantly different at p < 0.05 according to the LSD test. * and ns denote significance and non-significance at the p-level, respectively.
Publisher’s Note: MDPI stays neutral with regard to jurisdictional claims in published maps and institutional affiliations.

