Article

Evaluation and Comparative Analysis of Meteorological Data, Moisture Content, and Rice Panicle Threshability

1
Research Centre for Irrigation and Water Management, Institute of Environmental Sciences, Hungarian University of Agriculture and Life Sciences, Anna-Liget Str. 35, 5540 Szarvas, Hungary
2
Research Centre for Aquaculture and Fisheries, Institute of Aquaculture and Environmental Safety, Hungarian University of Agriculture and Life Sciences, Anna-Liget Str. 35, 5540 Szarvas, Hungary
3
Institute of Agronomy, Hungarian University of Agriculture and Life Sciences, Páter Károly Str. 1, 2100 Gödöllő, Hungary
*
Author to whom correspondence should be addressed.
Agronomy 2022, 12(3), 744; https://doi.org/10.3390/agronomy12030744
Submission received: 8 February 2022 / Revised: 6 March 2022 / Accepted: 18 March 2022 / Published: 20 March 2022

Abstract

:
Harvesting and threshing are crucial processes that influence the quantity, quality, and economic efficiency of rice production. Therefore, the threshability of rice varieties is an important agronomic trait for breeding programs. However, selection for threshability is hardly standardized. With the application of an improved threshing meter, the threshability of four local temperate japonica rice varieties was determined during the ripening phase (DAF 37–60) in three consecutive years. Panicle threshing force (TF in N) was measured parallel with seed moisture content (MC) to describe differences in ripening habits of the genotypes. Shapes of the separation pilei were observed and the relationship with the different types of grain shattering was found. The different threshability patterns of the genotypes were found as quite stable along these periods. Moreover, correlation among TF, MC, and 5-day averages of meteorological parameters during the ripening phase was determined. Precipitation, Tmean, Tmax, and relative humidity had a significant influence on the MC. Based on our results, the MC had a low but significant positive correlation with the TF (0.312 *).

1. Introduction

Harvest and postharvest losses include physical and chemical changes that reduce the economic value of the crop or may even make it unsuitable for human consumption [1]. The importance of shattering habits of cultivated rice varieties is underlined by many studies [1,2,3,4,5,6]. This phenomenon significantly affects the rate of yield loss during the ripening phase and the harvest [7]. An overly loose spikelet attachment to its pedicel leads to grain shattering which can cause serious yield loss (0–38%) [8]. A too tight attachment reduces the effectiveness of machine harvesting due to the hard threshability.
Threshing is one of the most important functions of modern harvest machines. Threshing technology has a significant influence on yield quantity and quality. There are four principles of threshing, the contact models are the impact, rubbing, combing, and grinding [2]. The grain loss and damage can be reduced by changing the interface or the speed of the threshing equipment. Increasing drum speed of the axial-flow thresher increases the threshing and cleaning efficiency and the seed damage, however, it decreases the percentage of seed loss [9,10]. The crop moisture content (MC), the thickness of the seed, the variety, and the degree of maturity of the grain also affects the threshability and threshing loss [11]. Higher moisture content (27.50%) causes a lower threshing loss (0.7%) than dry conditions of a paddy (14.91% MC and 2.75% threshing loss) [10].
More research groups reported that the grain threshing habit of rice is related to three factors: the form of the abscission layer (AL) at the base of sterile lemmas [12,13], environmental factors such as humidity and temperature [8,14], and the genetic constitution of the variety [15,16,17]. Although the formation of the AL is determined by genes [12,18], a classification based on the AL is very difficult [19]. However, Okubo et al. found that the patterns of grain shattering and the shape of the separation zone (separation between sterile lemma and rudimentary glume) were correlated [20]. He found that most of the seeds separated between the sterile lemma and rudimentary glume in the case of medium, easy, and very easy shattering genotypes, while in less-shattering varieties, around 50% of the grains were torn off at the bent portion of the pedicel. With easier-shattering habits, the shape of the separation zone was the most prominent, cultivars with medium-shattering habits had more than 50% of the flat pileus, while in the hardly-shattering varieties, all the forms were flat [20].
Up to now, seven methods have been used to measure grain shattering in rice from manual measurements to digital ones [8]. A manual determination of shattering habits may not be accurate due to variations in the pulling/hitting power of the person who is testing the traits [18]. Therefore, nowadays, a digital force gauge is used for the determination of the grain pedicel breaking tensile strength (BTS) in g-force (gf) [18,19] which is correlated to the threshing rate of the grain harvester [21] The classification of the shattering habit was set up by many researchers. Ji et al. reported easy, moderate, hard, or non-shattering patterns [18], Lee et al. and Galimudi et al. recorded the hand-made seed shattering on a 1–9 scale (1—non-shattered, 3—low level, 5—average, 7—high level, and 9—shattered) [15,22], and Qin et al. used a shattering scale from 1-8 (from difficult to easy) [19]. The evaluation criteria of the shattering habit are varied by countries and production technologies, based on which shattering habit is frequent in that country [20]. The relationship between manual and digital measurements through the different classification scales was confirmed by Qin et al. [19].
Usually, when threshing is conducted by machines, a higher level of threshability is reported [21]. Since the European rice production system is highly mechanized, one of the aims of this study was to identify the shattering habits of the main local temperate japonica rice varieties based on threshing forces and separation zones. The average threshing force of japonica rice is around 200–250 gf (2–2.5N) [13,16,18], but this attachment force poses difficulty in threshing [22]. Therefore, the medium-shattering varieties are required which are more suitable for combined harvesting and cause no yield loss in the paddy field [22,23]. Moreover, a better understanding of the effects influencing threshability is necessary because it is an important agronomic trait for breeding programs. Therefore, our additional aim was to determine the possible correlations among threshing force, moisture content of the rice seeds, and the 5-day averages of meteorological parameters during the ripening phase.

2. Materials and Methods

To evaluate the threshability, four state-released rice varieties (all temperate Oryza japonica from Hungary), ‘Janka’, ‘M 488’, ‘M 225’, and ‘Ábel’ [24] were used in three consecutive years (2018–2020). Plants were conventionally cultivated in paddy fields under flooded irrigation. Panicles were collected from the seed multiplication plots at the Rice Research Station of the Hungarian University of Agriculture and Life Sciences (MATE), Institute of Environmental Sciences (IES), Research Center for Irrigation and Water Management (ÖVKI) (46°52′17.5″ N 20°31′37.5″ E, Szarvas, Hungary). The experiments were carried out in September during the ripening phase based on the number of days after flowering (DAF). Data of DAF are shown in Table 1. In each sampling time, 10, 12, and 12 replicates were measured in 2018, 2019, and 2020, respectively.
A custom-built electric threshing meter (ITM) improved (with EMX-100/111 electromechanical weighing instruments indicator) by the Metrisystem Ltd. (Hódmezővásárhely, Hungary) was used to do the tests. In one measurement, one whole panicle was used. The strength required to detach the spikelet from the pedicel was detected as the threshing force (TF). The TF was measured by strains along the pedicel. A 200 N load cell (Tenzi TCS-03), an automatic null balancing recorder detected the values in Newton (N). The ITM is shown on a Video in S1 in the Supplementary Materials during the operation (v = 0.5 cm s1).
Parallel with TF testing, the moisture content (MC) of seeds from each panicle was also determined separately via the gravimetric method (Digitheat, JP Selecta, Spain; Sartorius BP 221S, Sartorius, Germany). The meteorological data were provided by an Agromet Solar automatic meteorological station (Boreas Ltd., Hungary). The average meteorological parameters (precipitation; mean (Tmean), maximum (Tmax) and minimum (Tmin) temperature; relative humidity (RH%)) for the 5 days before DAF were calculated and used for the correlation analysis since it was reported as a useful unit in dealing with meteorological phenomena in agriculture [25]. The dataset of 5-day average values calculated for all the DAF dates is provided in Table S1 (Supplementary Materials) in detail.
Basic mathematical analyses were performed by using Microsoft Excel. Data were statistically analyzed by “IBM SPSS 22” software. Two-way ANOVA with the Tukey and Games-Howell method was used to determine statistical differences among varieties, measurement times, and years at a 5% level of probability. Pearson’s correlation was calculated to estimate the connection among different parameters.
The separated pilei were stained with safranin O solution (0.5% (w/v) dissolved in 50% EtOH according to Lux et al. 2005 [26] and observed under a stereomicroscope (PZO Ltd., MSt 130, Warsaw, Poland). For observation of the type (pattern) of grain shattering, the same stereomicroscope was used. For the determination of different genotypes, 300 seeds and 300 pedicels were investigated. The separated pilei were observed from two directions based on the method described by Okubo (2014). The separation pileus was classified as flat if it was flat from both directions. Furthermore, a partly flat pileus in which the flange of separation pileus was recognized as flat but the center of it was scarcely prominent, was also classified as flat (Figure 1A,B). If the pileus was bulging, it was classified as prominent (Figure 1C,D). Severely damaged pilei were not scored. To determine the type of shattering, 5 panicles of each variety were investigated. All grains of 5 panicles were removed longitudinally and 300 detached seeds were observed from each variety. Two types of grain shattering habit were identified as type A: the seeds were separated between sterile lemma and rudimentary glume, type B: torn off at a part of the pedicel (Figure 2). Imaging was performed using a Nikon P-400Rv/P-400R Digital Microscope (Nikon Corporation, Tokyo, Japan), P-MFSC Motorized Focusing Stand Controller, and PTPM Touch Panel Monitor kit. Extended depth of focus (EDF) images were taken which are all-in-focus images created by the combination of multiple images of a separation pileus of one rice grain captured at different focus points. The grain shattering pattern was captured in the same way.

3. Results

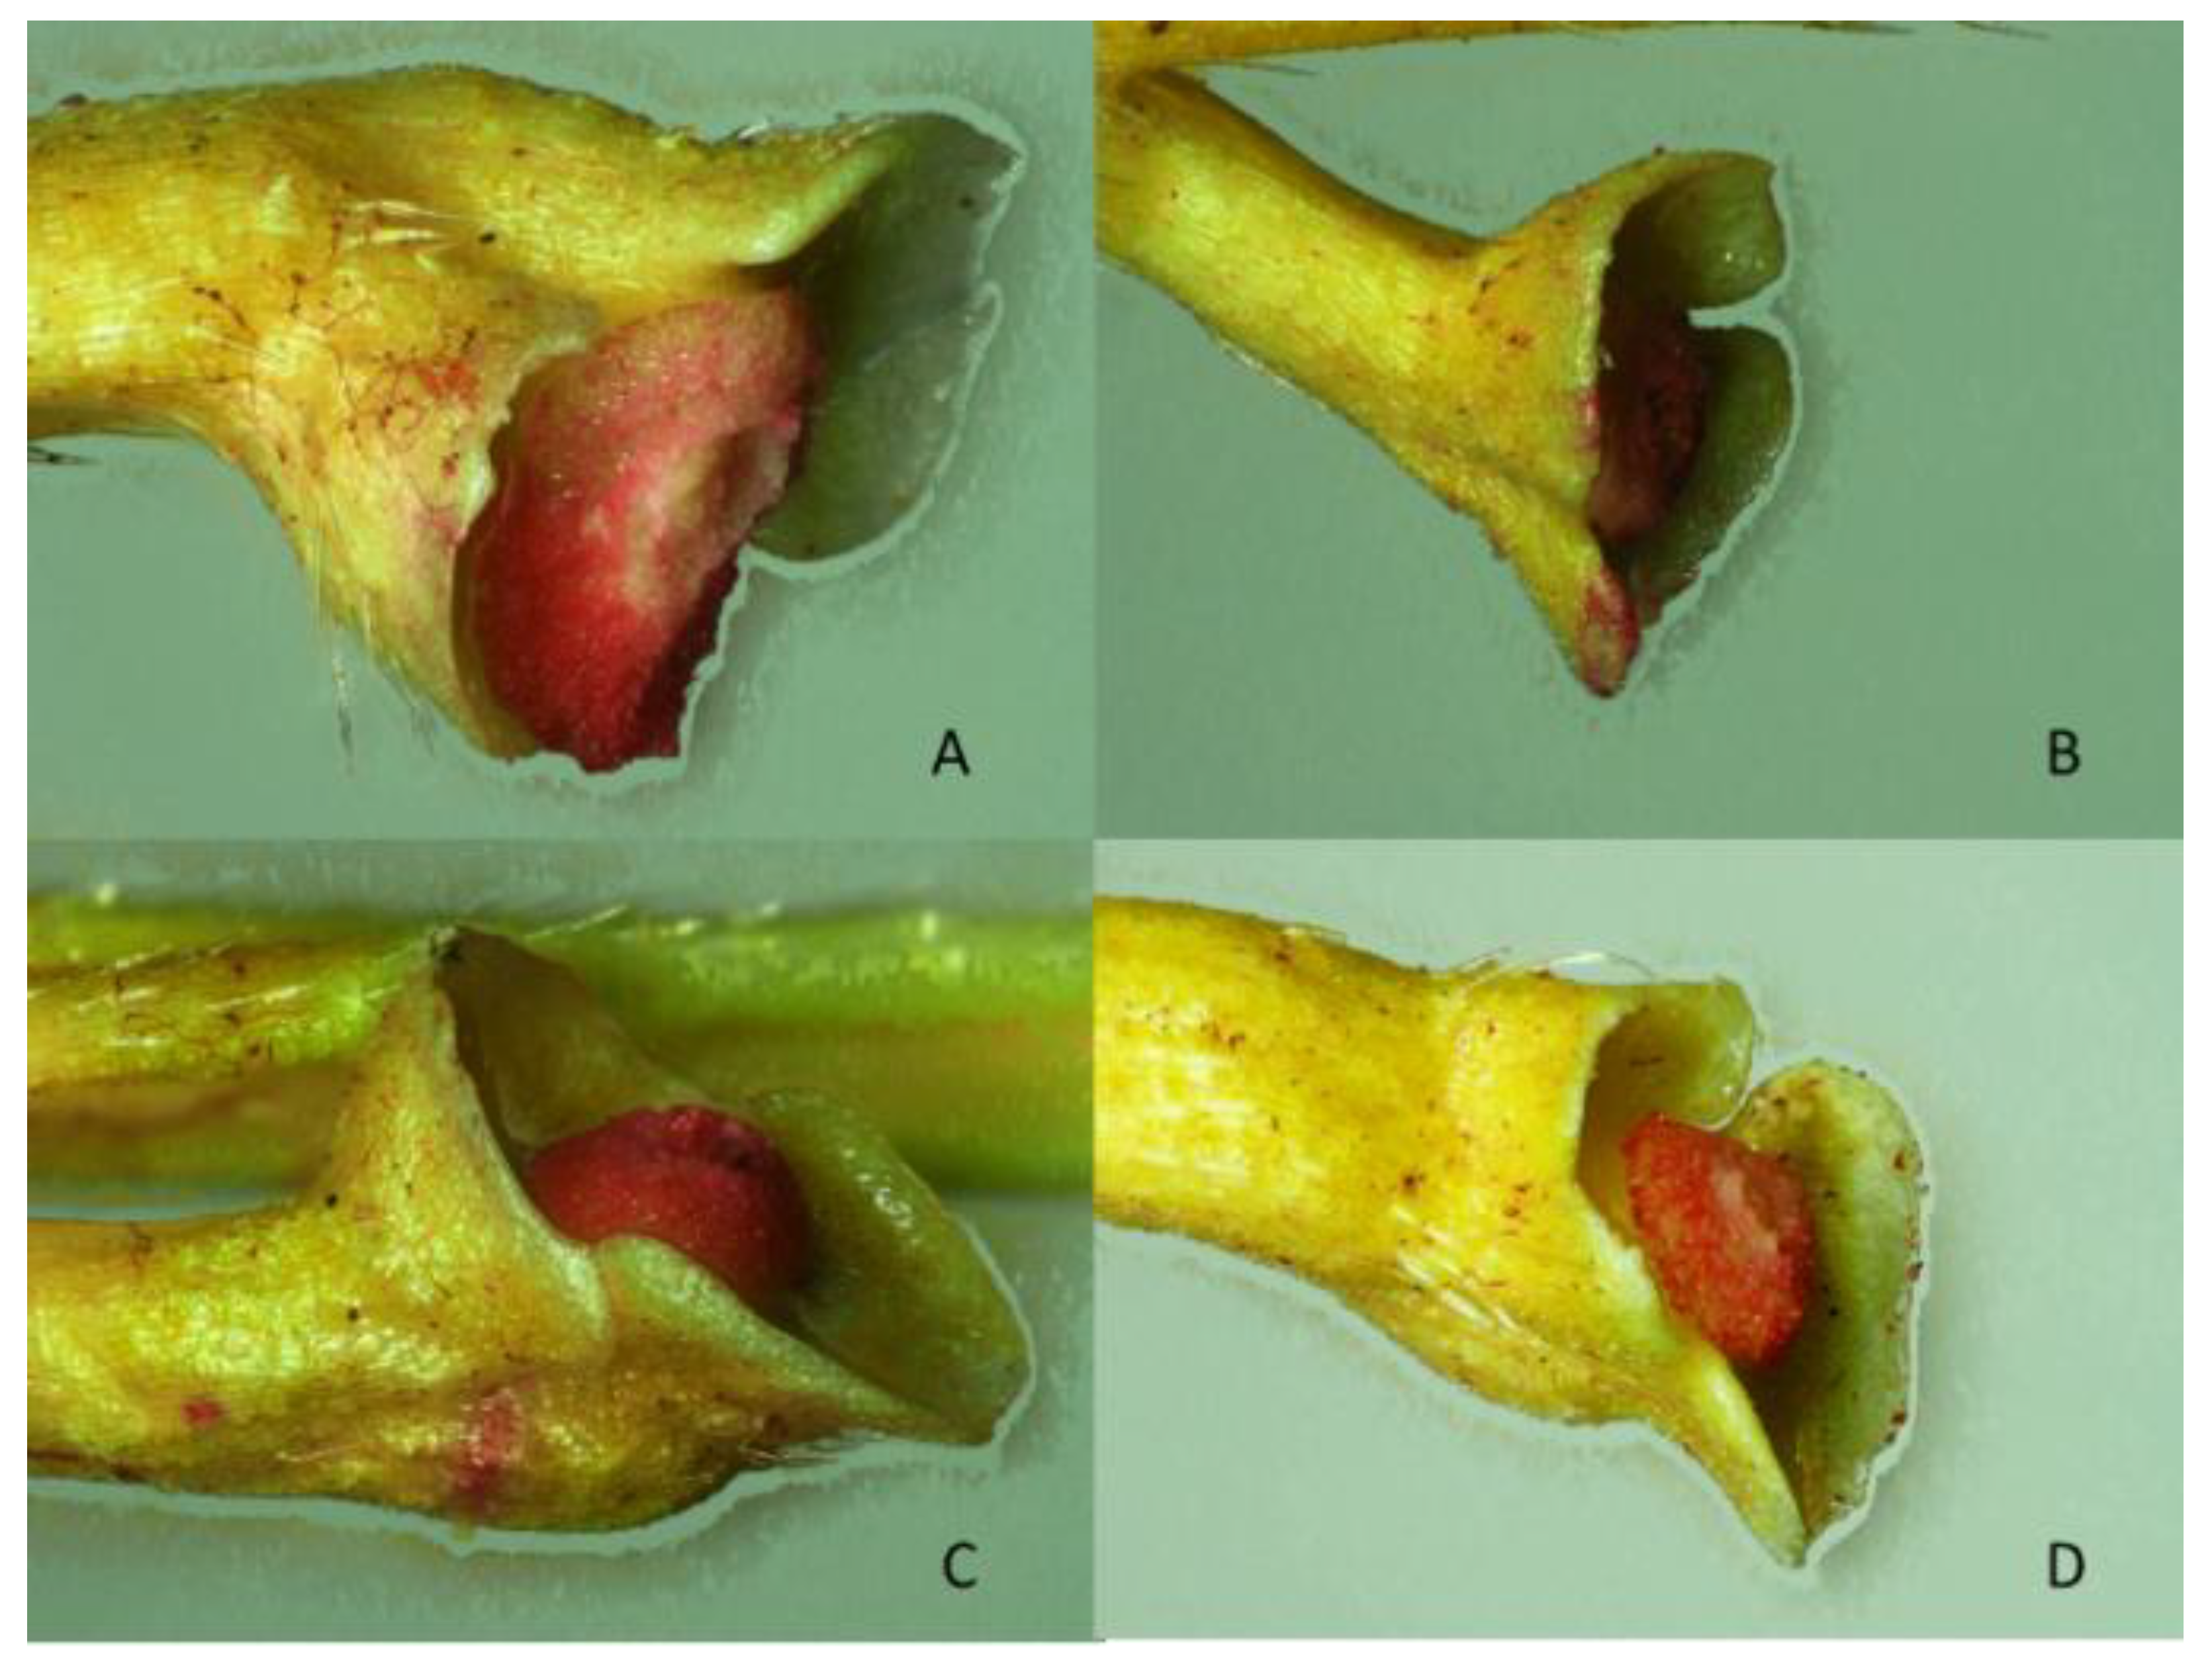
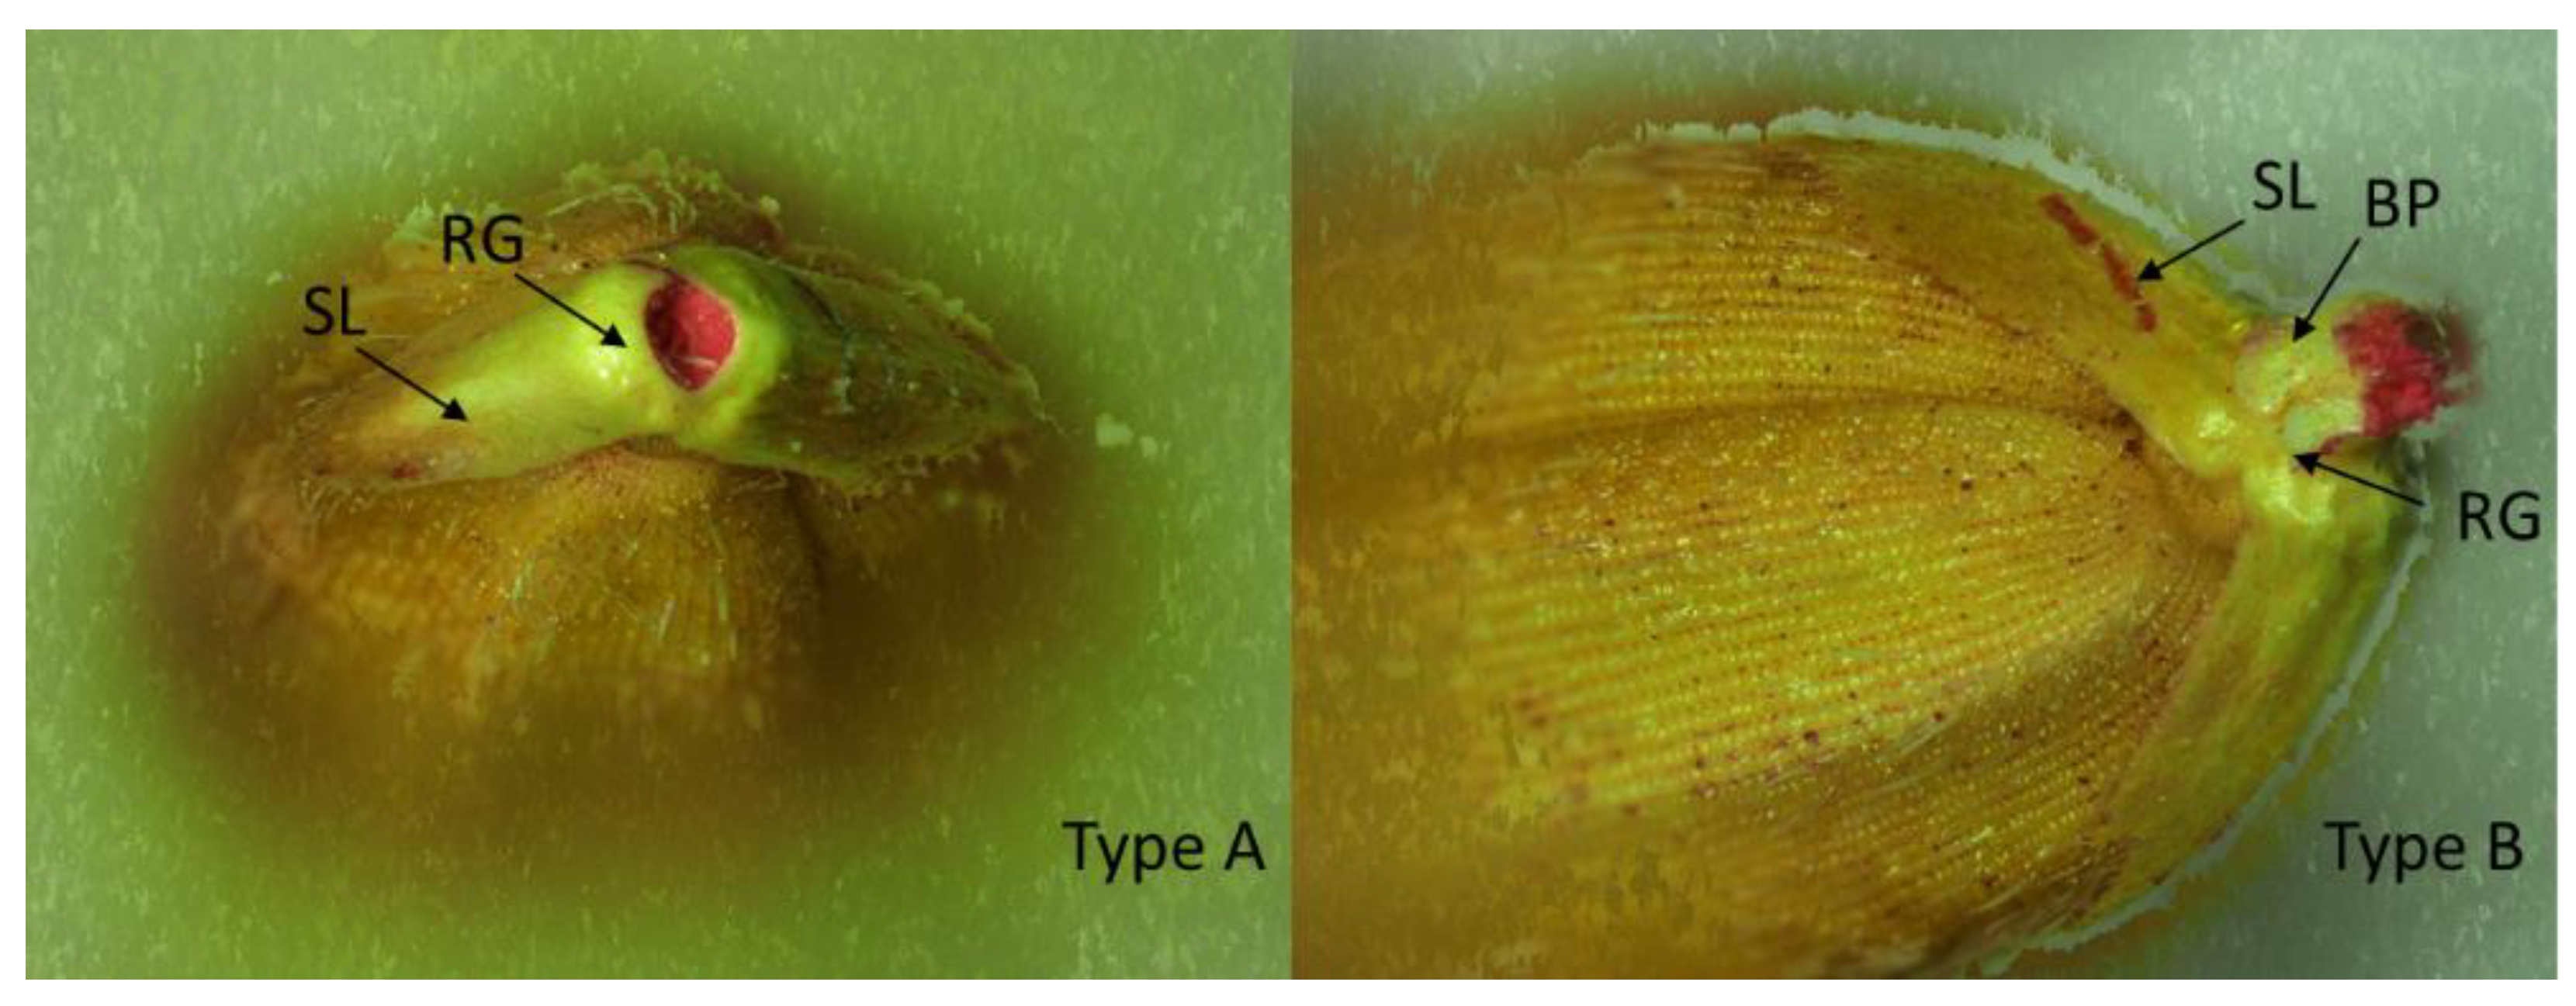
3.1. Morphological Evaluation of the Type of Grain Shattering and the Shape of the Separation Pileus

We performed microscopic observation of the type of grain shattering and the shape of the separation pileus (Table 2). Most of the separation pilei were identified as prominent in the case of each genotype (70.7–94%). The percentage of flat type was the lowest in the case of ‘M 225’ while the highest was in ‘Ábel’. The type of grain shattering was found closely connected with the shape of the separation pileus (Table 2). Almost all grains were categorized as Type A. The ratio of Type B for ‘M 225’, ‘Janka’, ‘M 488’, and ‘Ábel’ was only 4.7, 8.3, 9.3, and 13.3%, respectively.

3.2. Meteorological Data and Its Effect on the Seed Moisture Contents (MC) and Threshing Force (TF)

According to our results, the 5-day average values of meteorological parameters except Tmin have a significant influence on the average MC of the varieties (see Mean in Table 3). However, the parameters were not correlated with the TF. Even so, we detected some differences among the varieties. In the case of ‘M 488’ and ‘M 225’, the Tmax and Tmin had negative (−0.524 * and −0.643 **) and positive (0.829 ** and 0.663 **) significant effects on the TF, respectively. The RH% also had a significant negative influence (−0.553 *) on the TF in ’Ábel’. However, in the case of ‘Janka’, significant impacts were not identified (Table 3).
Generally, the average MC values were highest in the year 2019 (Table 4) during the whole ripening phase. Compared to the other years, the higher total amount of precipitation in September 2019 (46.1 mm) could be the reason for that. This trend was followed by the MC too. In each tested year, MC values of ‘M 488’ were statistically higher than ‘Janka’ on the DAF 37, DAF 42, and DAF 50. Statistically lower MC values were also determined for ‘M 225’ than for ‘M 488’ until the DAF 50 in 2018 and DAF 50 and 55 in 2019 and 2020. However, there were some exceptions, the MC decreased during the ripening of the genotypes (Table 4).

3.3. The Connection among TF and Other Dependent Parameters

Based on analyses of variance (Table 5), we found a significant genotype effect on the threshing force. However, the year and day after flowering did not show a significant influence on the TF.

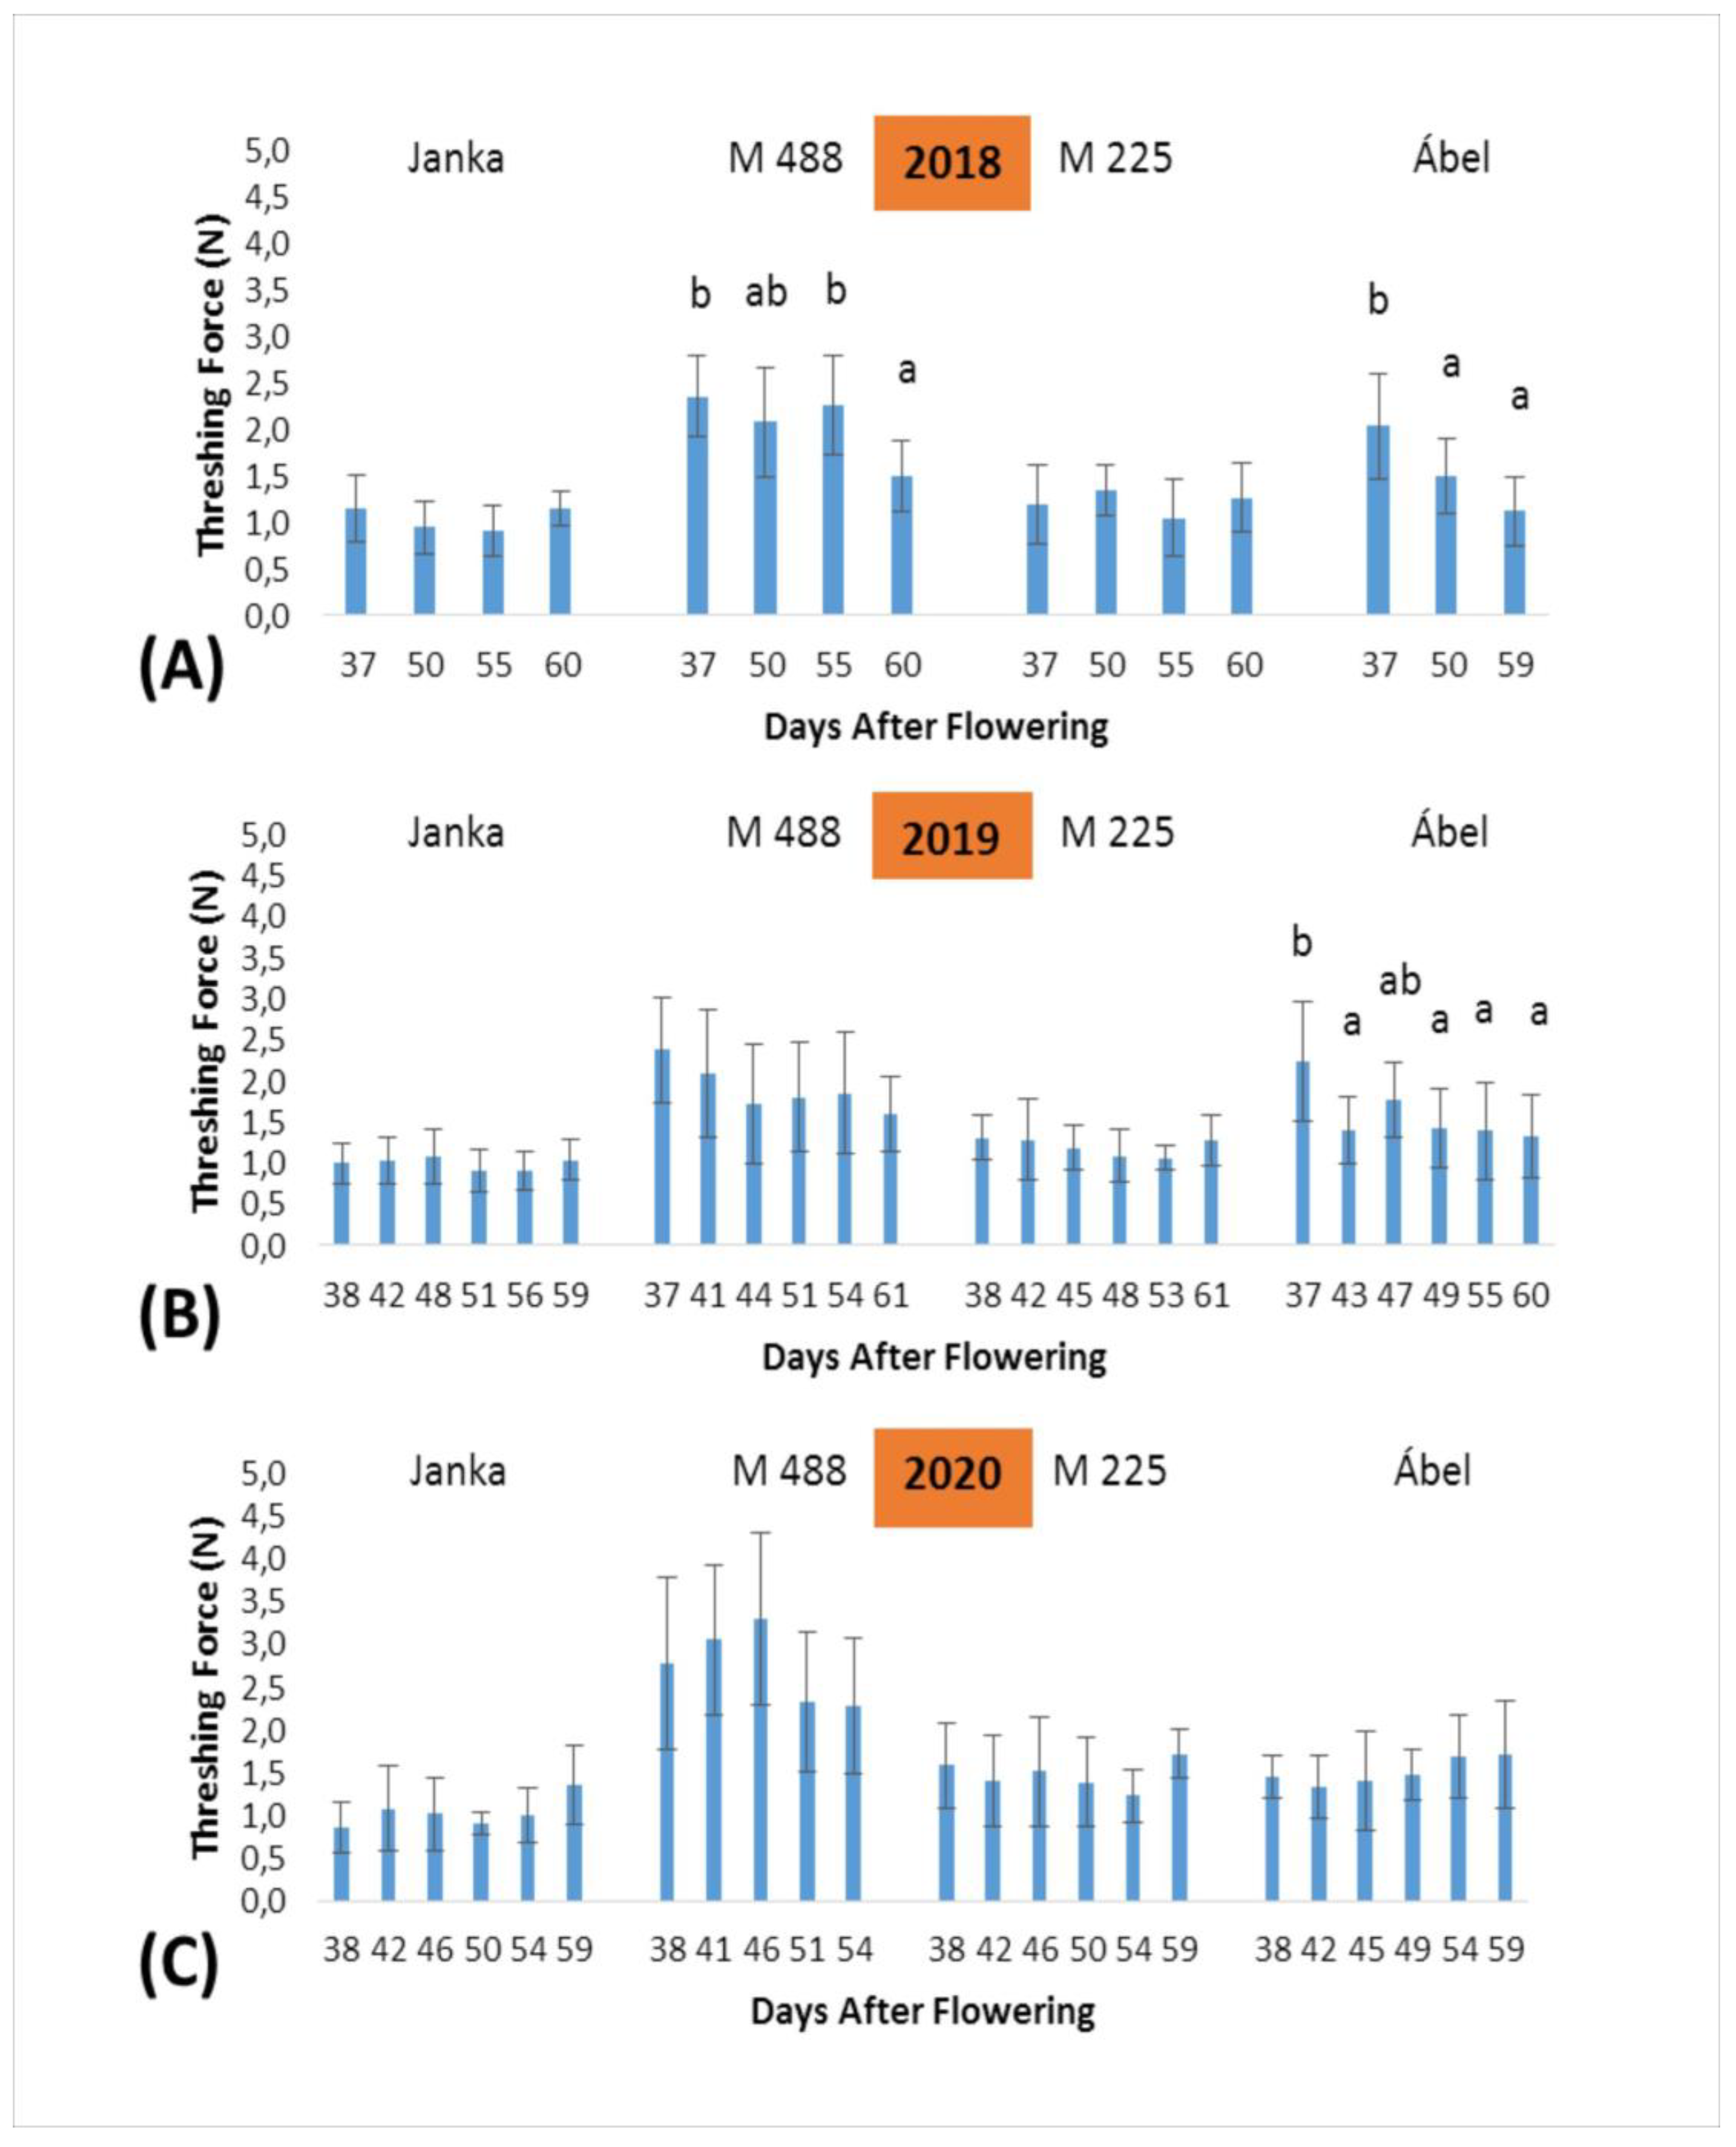
3.4. Threshing Force Changes between Measurement Times (DAF)

The TF data across three years can be seen in Figure 3. We detected a decreasing trend in ‘M 488’ from the beginning of the ripening to the harvesting time in each year and in ‘Ábel’ in 2018 and 2019. However, the other two varieties (‘Janka’ and ‘M 225’) did not show significant variability in TF during the whole harvesting period. In 2018, the TF decreased in the case of ‘M 488’ and ‘Ábel’ from 2.35 ± 0.34 to 1.49 ± 0.38 N (p < 0.01) and from 2.03 ± 0.57 to 1.12 ± 0.37 N (p < 0.01), respectively. Although in the next two years, the reduction of the TF values of ‘M 488’ was also noticeable from 2.38 ± 0.64 to 1.59 ± 0.46 N (p = 0.11) in 2019 and from 3.31 ± 1.00 to 2.30 ± 0.78 N (p = 0.058) in 2020, respectively. However, the changes were not significant at a level of 0.05 because of the extremely high standard deviation.

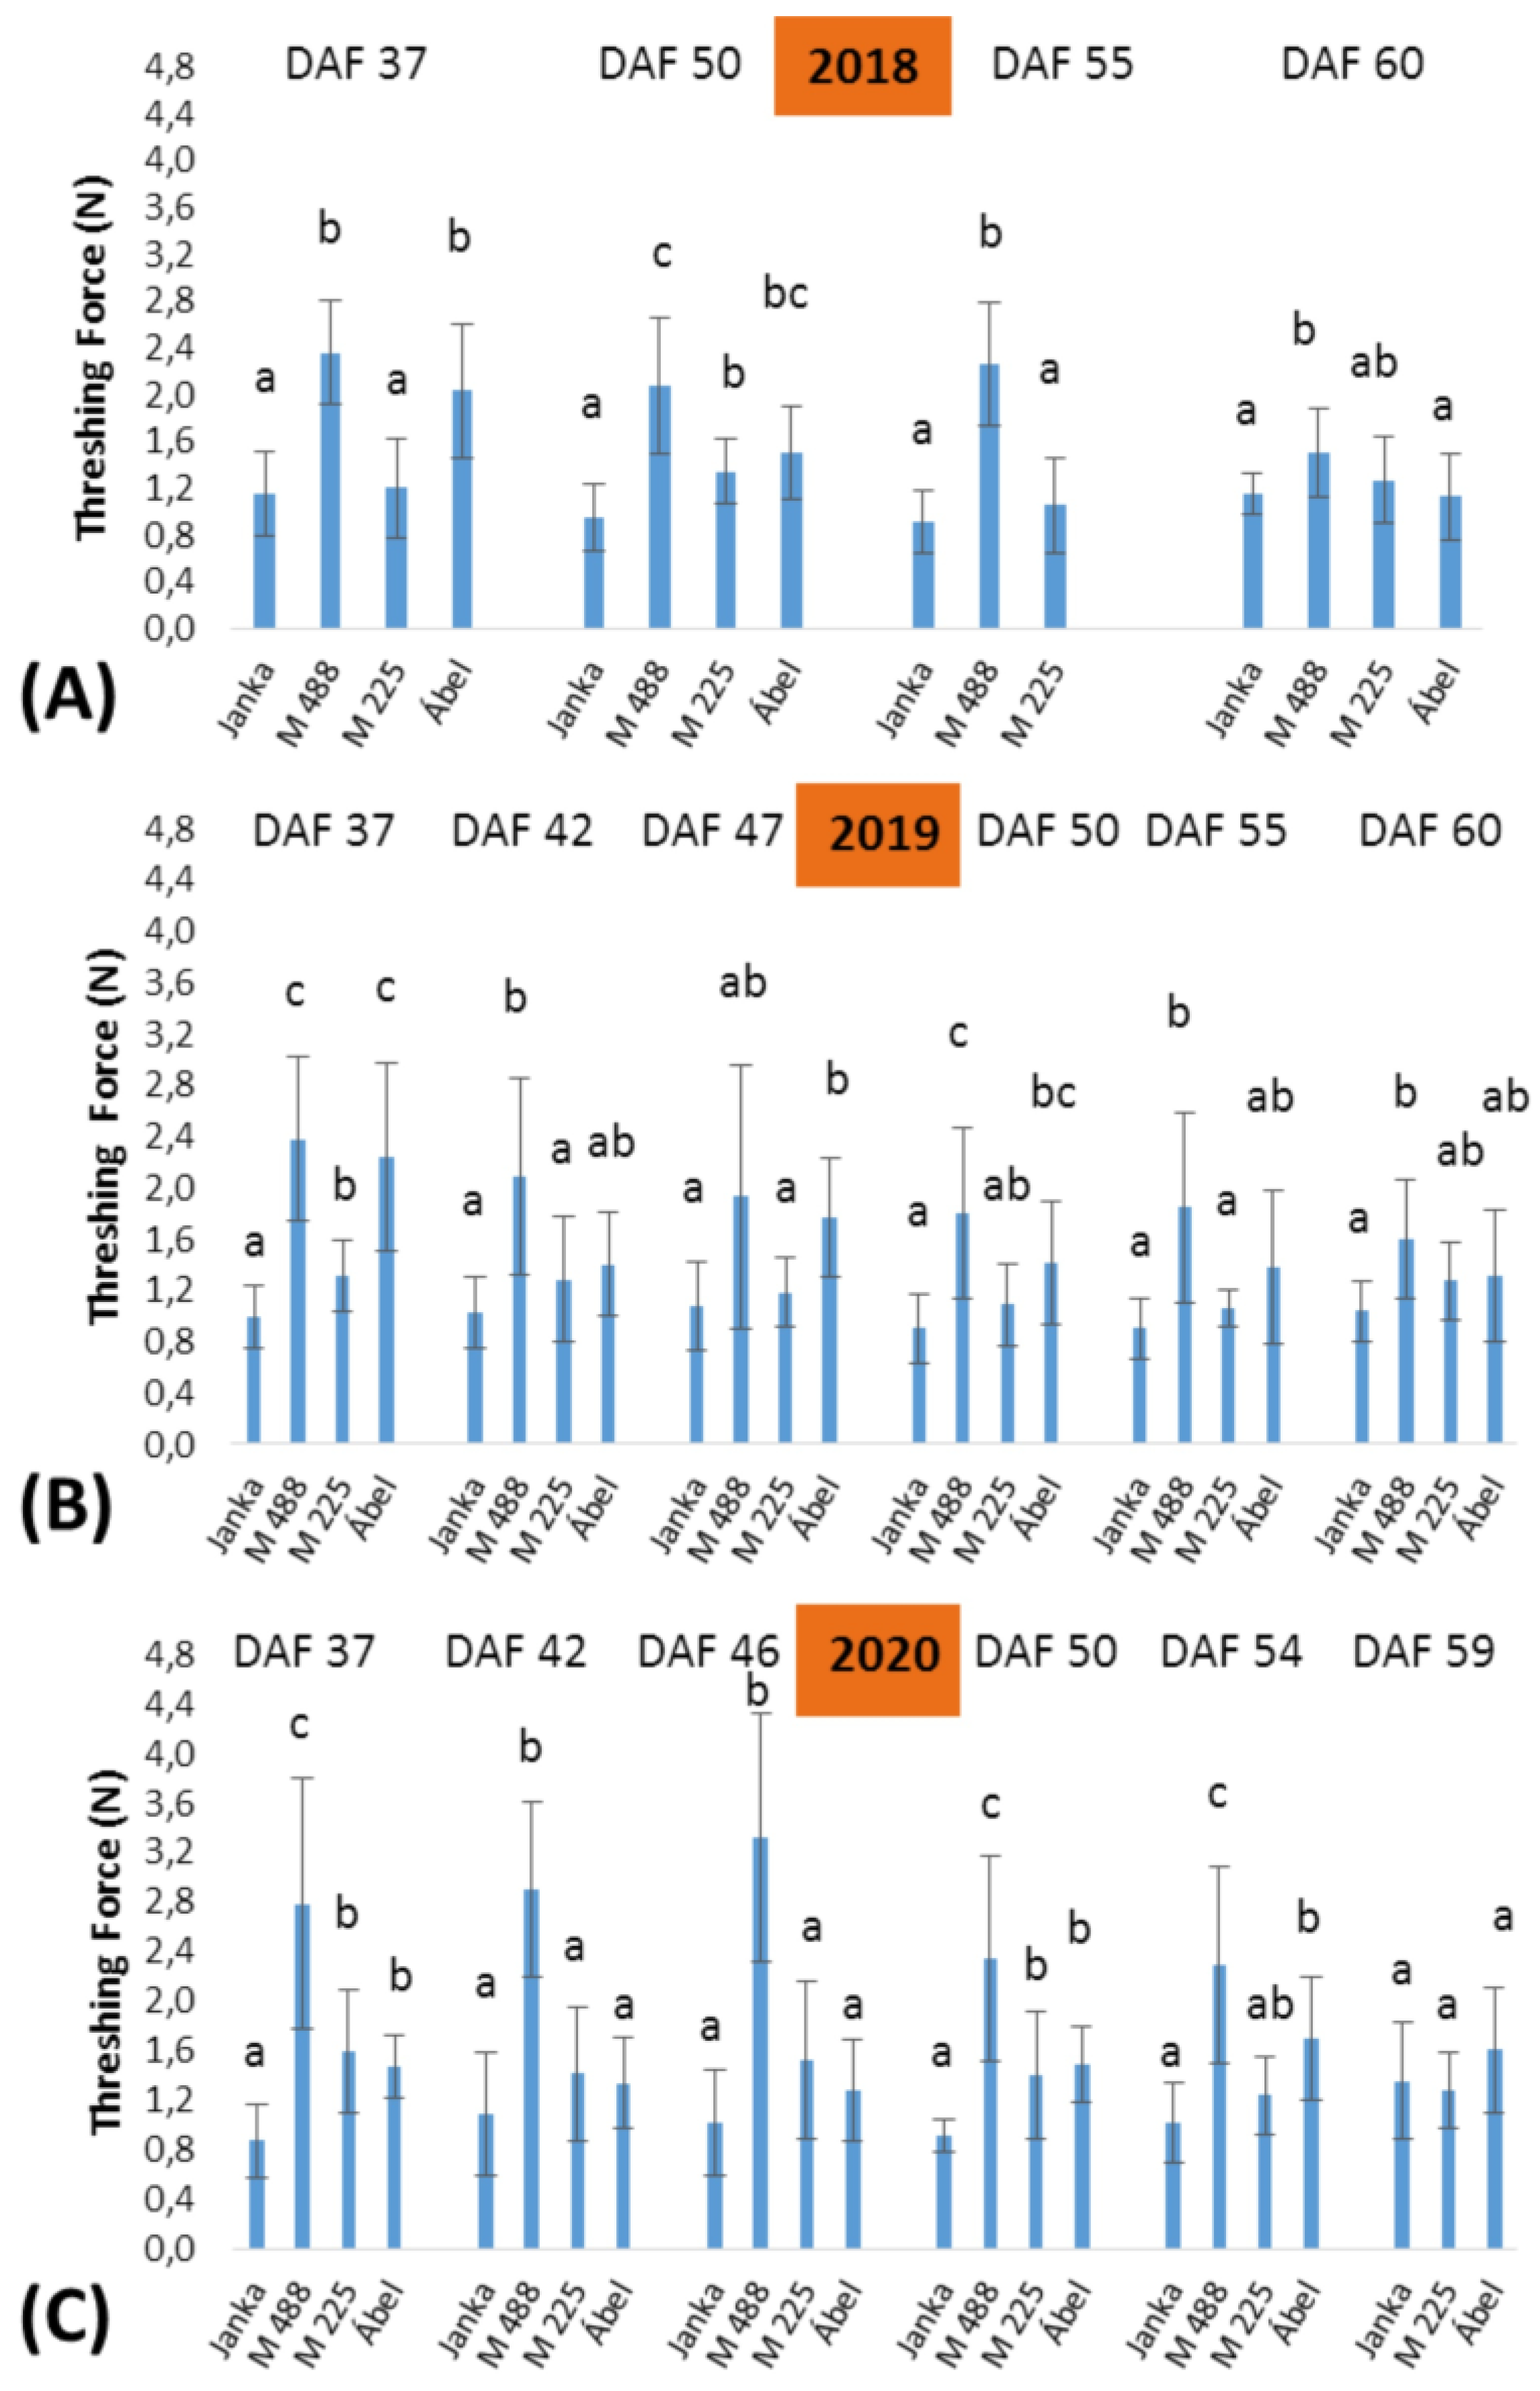
3.5. TF Value Differences among the Examined Varieties in Different Measurement Times (DAF)

Figure 4 represents the differences of the TF among the examined varieties. Significant differences in the TF values were found among varieties in each year. In all cases, ‘Janka’ showed the lowest values. Moreover, there were no statistical differences among the measurement times and the years. ‘M 225’ showed slightly higher values than ‘Janka’, although statistical differences were detected between ‘Janka’ and ‘M 225’ varieties only at the beginning of the ripening period. According to our results, the ‘M 488’ needs the highest TF in each year and measurement time. The differences between ‘M 488’ and the other two genotypes (‘Janka’ and ‘M 225’) were statistically significant. In 2020, the TF values of ‘M 488’ were higher than the previous year, however, this increase was statistically significant only at the DAF 46 (1.71 ± 0.73 N in 2019, 3.31 ± 1.00 N in 2020, p < 0.01), despite the high standard deviations. TF 2.26 ± 0.53, 1.84 ± 0.74, and 2.30 ± 0.79 N were measured on the DAF 55 in 2018, 2019, and 2020 respectively. ‘Ábel’ showed significantly higher values than ‘Janka’ until the DAF 50 in each year. However, the TF values of ‘Ábel’ were reduced to 1.12 ± 0.37 (2018), 1.32 ± 0.51 (2019), and 1.60 ± 0.50 N (2020) for the last measurement times (DAF 59). In general, ‘Ábel’ did not show significant differences from ‘M 225’ or ‘M 488’.
In the average of the three years, we found the lowest TF value in the case of ‘Janka’ (1.02 ± 0.03) and the highest was in ‘M 488’ (2.23 ± 0.40, Table 6). The highest difference was also in ‘M 488’ among the examined years, while the other ones were quite stable. Across the three-year experiment, we also observed a negative correlation between the DAF and the MC (mean row in Table 7). However, the TF was decreased significantly with maturity progress only in two varieties (‘Ábel’ and ‘M 488’). The MC showed a very low correlation with the TF value in the average of the varieties (0.312 *).

4. Discussion

In our investigation, four local temperate japonica rice varieties were examined to determine the effect of meteorological parameters and the type of separation pilei on the threshing force (TF). We also focused on the connection between the moisture content and the TF, because there is no agreement on what extent the moisture content influences threshability. A number of studies have shown that seed shattering may be controlled by environmental factors such as relative humidity and temperature [27,28,29]. Our results revealed that the precipitation and relative humidity has no significant influence on the TF, only just on the MC. Although we detected a high correlation in some varieties (‘M 488’ and ‘M 225’) for temperature parameters (Tmax and Tmean), the minimum temperature was the only factor that correlated significantly to the TF in the average of all varieties. This result confirms the consequence of Shin et al. who reported a higher significant impact (0.759 *) on TF [14]. On the other hand, the grain threshability depends on the shape of the separation pilei [20], the strength of spikelet attachment to the panicle [30], and the different moisture contents of the seed [31]. The shape of the separation pilei and type of seed shattering suggested that the threshing force would be the lowest in ‘M 225’ and the highest in ‘Ábel’ since the percentage of prominent shape correlated to the TF [20]. However, we detected the lowest TF in ‘Janka’ and the highest TF in ‘M 488’, but the differences between ‘Janka’ and ‘M 225’ and the other two genotypes were not significant. Our results showed a weak significant positive correlation between MC and TF (0.312 *). This outcome confirms the results of Zong et al. who found that the detachment force range was 1.48 N to 2.29 N in high moisture content, while it was lower (0.86 N to 1.15 N) in a low moisture content [32]. In contrast, Ebata and Tang et al. reported a higher breaking tensile strength (BTS) with low moisture content [33,34]. As was expected, with ripening progress (higher numbers of DAF), the MC reduced (−0.602 **). Besides this, the DAF also correlated with the TF in two varieties (‘M 488’ (−0.538 *) and ‘Ábel’ (−0.538 *)). Most researchers reported that the TF is stable from 20–25 days after flowering or heading in japonica rice [18,35,36], or it decreased, but not significantly [17]. We found both phenomena (Table 5), but they varied year by year and variety by variety (Figure 3). The average TF of japonica was around 2N [13,18,37], in some cases 1.5N [12,17], but no one reported below 1.5N. According to our results, the average TF of ‘Janka’ and ‘M 225’ was 1.02 N ± 0.03 and 1.30 N ± 0.17 over the three experimental years, respectively.

5. Conclusions

The ITM is provided comparable data of the threshability with a low standard deviation. Our data showed quite stable significant differences among the genotypes. Similar TF values were measured at the same ripening phases (DAF). This assumes that threshability is a characteristic and selectable agronomic trait of the genotypes. Based on our results, the most suitable time in DAF to measure the TF depends on the varieties. In the case of ‘Janka’ and ‘M 225’, the TF value is less dependent on the ripening state, so it can be measured at any time during the ripening, however, our recommendation for testing is between the DAF 45–55. For ‘M 488’, as its TF value reduced during ripening, it is better to measure in the last third of the ripening, from DAF 50, as well as for ‘Ábel’, the TF value becomes stabile around the DAF 50.
The meteorological parameters had a complex influence on threshing properties. The relative humidity and temperature have a direct effect on the threshing force but also indirect effects through the moisture content of the seeds.

Supplementary Materials

The following supporting information can be downloaded at: https://www.mdpi.com/article/10.3390/agronomy12030744/s1, Table S1: Meteorological data and DAF, Video S1: Operation video of the ITM.

Author Contributions

Conceptualization, M.J.; Formal analysis, N.V.; Investigation, T.S. and F.T.; Software, Á.S. and F.T.; Writing—original draft, T.S.; Writing—review & editing, Á.S., Á.T. and M.J. All authors have read and agreed to the published version of the manuscript.

Funding

The Hungarian Ministry of Agriculture supported the project “Maintenance breeding of Hungarian rice varieties” (OD002 and O15540).

Institutional Review Board Statement

Not applicable.

Informed Consent Statement

Not applicable.

Data Availability Statement

All data generated or analysed during this study are included in this published article (and its supplementary information files).

Acknowledgments

Authors thank to the staff of the MATE ÖVKI Rice Research Station for the maintenance of experimental paddy fields. Special thanks to Ibolya Simon-Kiss (1929–2015) who started the invention of ITM and supervised our first steps in rice breeding.

Conflicts of Interest

The authors have no conflicts of interest.

References

  1. Govindaraj, M.; Masilamani, P.; Asokan, D.; Rajkumar, P.; Selvaraju, P. Effect of Different Harvesting and Threshing Methods on harvest Losses and Seed Quality of Rice Varieties. Int. J. Curr. Microbiol. Appl. Sci. 2017, 6, 1510–1520. [Google Scholar] [CrossRef]
  2. Fu, J.; Chen, Z.; Han, L.; Ren, L. Review of Grain Threshing Theory and Technology. Int. J. Agric. 2018, 11, 12–20. [Google Scholar] [CrossRef]
  3. Benaseer, S.; Poomaruthai, M.; Albert, A.; Govindaraj, M.; Selvaraju, P.; Bhaskaran, M. Impact of Harvesting and Threshing Methods on Seed Quality-A Review. Agric. Rev. 2018, 39, 183–192. [Google Scholar] [CrossRef]
  4. Charles, A. Dissecting the quantitative variations of threshability in rice (Oryza sativa L.). Agro-Science 2019, 18, 22. [Google Scholar] [CrossRef]
  5. Fu, J.; Xie, G.; Ji, C.; Wang, W.; Zhou, Y.; Zhang, G.; Zha, X.; Abdeen, M.A. Study on the Distribution Pattern of Threshed Mixture by Drum-Shape Bar-Tooth Longitudinal Axial Flow Threshing and Separating Device. Agriculture 2021, 11, 756. [Google Scholar] [CrossRef]
  6. Liu, Y.; Li, Y.; Chen, L.; Zhang, T.; Liang, Z.; Huang, M.; Su, Z. Study on Performance of Concentric Threshing Device with Multi-Threshing Gaps for Rice Combines. Agriculture 2021, 11, 1000. [Google Scholar] [CrossRef]
  7. Maity, A.; Lamichaney, A.; Joshi, D.C.; Bajwa, A.; Subramanian, N.; Walsh, M.; Bagavathiannan, M. Seed Shattering: A Trait of Evolutionary Importance in Plants. Front. Plant Sci. 2021, 12, 1180. [Google Scholar] [CrossRef] [PubMed]
  8. Lamo, J. Genetic Studies on Drought Tolerance and Grain Shattering in Rice. Ph.D Thesis, University of KwaZulu-Natal, Durban, South Africa, 2010. [Google Scholar]
  9. Olaye, A.; Moreira, J.; Hounhouigan, D.; Amponsah, S. Effect Of Threshing Drum Speed And Crop Weight On Paddy Grain Quality In Axial- Flow Thresher (ASI). Multidisciplin. Eng. Sci. Technol. 2016, 3, 3159–3199. [Google Scholar]
  10. Asli-Ardeh, E.A.; Abbaspour-Gilandeh, Y.; Abbasi, S. Study of Performance Parameters of Threshing Unit in a Single Plant Thresher. Am. J. Agric. Biol. Sci. 2009, 4, 92–96. [Google Scholar] [CrossRef] [Green Version]
  11. De Lucia, M.; Assennato, D. Agricultural Engineering in Development: Post-Harvest Operations and Management of Foodgrains. In Fao Agricultural Services; FAO Agricultural Services Bulletin: Rome, Italy, 1994; Volume 93, p. 150. [Google Scholar]
  12. Oba, S.; Sumi, N.; Fujimoto, F.; Yasue, T. Association between Grain Shattering Habit and Formation of Abscission Layer Controlled by Grain Shattering gene sh-2 in Rice (Oryza sativa L.). Jpn. J. crop Sci. 1995, 64, 607–615. [Google Scholar] [CrossRef] [Green Version]
  13. Van, D.X.; Jin, I.-D. Inheritance of grain shedding and abscission layers in the cross combination between rice varieties. J. Crop Sci. Biotechnol. 2010, 13, 83–89. [Google Scholar] [CrossRef]
  14. Shin, J.C.; Kwon, Y.W.; Chung, C.J. Effect of Meteorological Condition during Ripening on the Grain Shattering of Rice Plant. Korean J. Crop. Sci. 1982, 27, 229–234. [Google Scholar]
  15. Lee, S.-J.; Oh, C.-S.; Suh, J.-P.; McCouch, S.R.; Ahn, S.-N. Identification of QTLs for domestication-related and agronomic traits in an Oryza sativa x O. rufipogon BC1F7 population. Plant Breed. 2005, 124, 209–219. [Google Scholar] [CrossRef]
  16. Onishi, K.; Takagi, K.; Kontani, M.; Tanaka, T.; Sano, Y. Different patterns of genealogical relationships found in the two major QTLs causing reduction of seed shattering during rice domestication. Genome 2007, 50, 757–766. [Google Scholar] [CrossRef] [PubMed]
  17. Cheng, J.; He, Y.; Zhan, C.; Yang, B.; Xu, E.; Zhang, H.; Wang, Z. Identification and Characterization of Quantitative Trait Loci for Shattering in Japonica Rice Landrace Jiucaiqing from Taihu Lake Valley, China. Plant Genome 2016, 9. [Google Scholar] [CrossRef] [PubMed] [Green Version]
  18. Ji, H.-S.; Chu, S.-H.; Jiang, W.; Cho, Y.-I.; Hahn, J.-H.; Eun, M.-Y.; McCouch, S.R.; Koh, H.-J. Characterization and Mapping of a Shattering Mutant in Rice That Corresponds to a Block of Domestication Genes. Genetics 2006, 173, 995–1005. [Google Scholar] [CrossRef] [PubMed] [Green Version]
  19. Qin, Y.; Kim, S.-M.; Zhao, X.; Jia, B.; Lee, H.-S.; Kim, K.-M.; Eun, M.-Y.; Jin, I.-D.; Sohn, J.-K. Identification for quantitative trait loci controlling grain shattering in rice. Genes Genom. 2010, 32, 173–180. [Google Scholar] [CrossRef]
  20. Okubo, K. Morphological Evaluation of the Trace of Grain Detachment inJaponicaRice Cultivars with Different Shattering Habits. Plant Prod. Sci. 2014, 17, 291–297. [Google Scholar] [CrossRef] [Green Version]
  21. Tomohiko, I.; Takao, S.; Hiroyuki, T.; Sumihiko, M. Equipment for Quantitative Measurement of Shattering Habit of Paddy. JARQ.; Japan 1990, 24, 37–42. [Google Scholar]
  22. Galimudi, A.; Kb, E.; Gandhudi, L.; Lrk, J.V.; S, N.R.; Addanki, K.R.; Balakrishnan, D.; Desiraju, S.; Jukanti, A.K.; Lv, S.R.; et al. Genetic analysis of dormancy and shattering traits in the backcross inbred lines derived from Oryza sativa cv. Swarna / O. nivara Ac. CR100008. Oryza-An Int. J. Rice 2020, 57, 1–13. [Google Scholar] [CrossRef]
  23. Kobayashi, A. Varietal adaptability for mechanized rice cultivation: Direct seeding adaptability, shattering habit, smoothness etc. J. Agric. Sci. 1990, 45, 186–189. [Google Scholar]
  24. Pauk, J.; Jancsó, M.; Simon-Kiss, I. Rice Doubled Haploids and Breeding. In Advances in Haploid Production in Higher Plants; Touraev, A., Forster, B.P., Jain, S.M., Eds.; Springer: Dordrecht, The Netherlands, 2009; pp. 189–197. [Google Scholar] [CrossRef]
  25. Zhao, X.; Fitzgerald, M. Climate Change: Implications for the Yield of Edible Rice. PLoS ONE 2013, 8, e66218. [Google Scholar] [CrossRef] [PubMed]
  26. Lux, A.; Morita, S.; Abe, J.; Ito, K. An Improved Method for Clearing and Staining Free-hand Sections and Whole-mount Samples. Ann. Bot. 2005, 96, 989–996. [Google Scholar] [CrossRef]
  27. Ntakirutimana, F.; Wan, Y.; Liu, W.; Xie, W. Contribution of Awns to Seed Yield and Seed Shattering in Siberian Wildrye Grown under Irrigated and Rainfed Environments. Agronomy 2021, 11, 2219. [Google Scholar] [CrossRef]
  28. Zhao, X.; Xie, W.; Zhang, J.; Zhang, Z.; Wang, Y. Histological Characteristics, Cell Wall Hydrolytic Enzymes Activity and Candidate Genes Expression Associated with Seed Shattering of Elymus sibiricus Accessions. Front. Plant Sci. 2017, 08, 606. [Google Scholar] [CrossRef] [PubMed] [Green Version]
  29. Zhou, Y.; Lu, D.; Li, C.; Luo, J.; Zhu, B.-F.; Zhu, J.; Shangguan, Y.; Wang, Z.; Sang, T.; Zhou, B.; et al. Genetic Control of Seed Shattering in Rice by the APETALA2 Transcription Factor SHATTERING ABORTION1. The Plant. Cell 2012, 24, 1034. [Google Scholar] [CrossRef] [PubMed] [Green Version]
  30. Kumar, I.; Sharma, H.L. Inheritance of grain threshability in rice. Euphytica 1982, 31, 815–816. [Google Scholar] [CrossRef]
  31. Tang, Z.; Li, Y.; Liang, Z. Optimal Parameters Prediction and Control of Rice Threshing for Longitudinal Axial Threshing Apparatus. Nongye Gongcheng Xuebao/Trans. Chin. Soc. Agric. Eng. 2016, 32, 70–76. [Google Scholar] [CrossRef]
  32. Zhong, T.; YaoMing, L.; LiZhang, X. Assessment of Rice Threshing and Separation Performance for Just Mature Rice and over Mature Rice. Int. Agric. 2014, 23, 44–51. [Google Scholar]
  33. Ebata, M.; Tashiro, T. Studies on shedding habit of rice plant. I. Morphology of separation zone. Jpn. J. Crop Sci. 1990, 59, 63–71. [Google Scholar] [CrossRef] [Green Version]
  34. Tang, Z.; Li, Y.; Zhao, Z.; Sun, T. Structural and parameter design of transverse multi-cylinders device on rice agronomic characteristics. Span. J. Agric. Res. 2015, 13, e0216. [Google Scholar] [CrossRef] [Green Version]
  35. Il Doo, J.; Yeong Hwan, B.; Jun, I. Formation and Development of Abscission Layer between Pedicel and Rachilla, and Changes in Grain Shedding during Ripening in African Rice, Oryza Glaberrima Steud. Korean J. Crop Sci. 1995, 40, 103–112. [Google Scholar]
  36. Li, C.; Zhou, A.; Sang, T. Rice Domestication by Reducing Shattering. Science 2006, 311, 1936–1939. [Google Scholar] [CrossRef] [PubMed] [Green Version]
  37. Lee, S.-W.; Huh, Y.-K. Threshing and Cutting Forces for Korean Rice. Trans. ASAE 1984, 27, 1654–1657. [Google Scholar] [CrossRef]
Figure 1. Shape of the separation pileus. (A,B) = flat shape; (C,D) = prominent shape. Separation pilei were stained with a safranin solution.
Agronomy 12 00744 g001
Figure 2. Types of grain shattering. Type A: the seeds were separated between sterile lemma and rudimentary glume; Type B: torn off at a part of the pedicel. SL: sterile lemma; RG: rudimentary glume; BP: bent portion of the pedicel.
Agronomy 12 00744 g002
Figure 3. Mean threshing force in Newton (TF, N) (n = 10, 12, 12, in 2018—(A), 2019—(B) and 2020—(C), respectively) values in different measurement times during the ripening of four rice varieties. The different letters mean significant differences among the measurement times in each variety, respectively at the probability of level 0.05. (No letters are written where there are no significant differences among measurement times).
Agronomy 12 00744 g003
Figure 4. The differences of mean threshing force (N) values among the four rice varieties (Szarvas, Hungary, 2018—(A), 2019—(B), 2020—(C)). The different letters mean significant differences among the varieties at probability level 0.05.
Agronomy 12 00744 g004
Table 1. Schedule of threshability measurements based on the number of days after flowering (DAF).
VarietyNumber of MeasurementsDAFVarietyNumber of MeasurementsDAF
201820192020201820192020
‘Janka’1373838M 4881373738
2-42422-4141
3-48463-4446
45051504505151
55556545555454
660595966059-
‘M 225’1373838Ábel1373737
2-42422434342
3-45463-4745
45048504-4949
55553545-5554
66061596586059
Table 2. The shape of separation pileus and the type of grain shattering of four rice varieties. Type A: separated between sterile lemma and rudimentary glume. Type B: torn off at bent portion of the pedicel.
VarietyShape of Separation PileusType of Grain Shattering
ProminentFlatAB
‘Janka’277 (92.3%)23 (7.7%)275 (91.7%)25 (8.3%)
‘M 225’288 (94.0%)18 (6.0%)286 (95.3%)14 (4.7%)
‘M 488’266 (88.7%)34 (11.3%)272 (90.7%)28 (9.3%)
‘Ábel’212 (70.7%)88 (29.3%)265 (86.7%)35 (13.3%)
Table 3. The correlation matrix among the meteorological parameters, moisture content (MC), and threshing force (TF). The mean indicates the average of the four varieties. * or ** means that correlation is significant at the 0.05 or 0.01 level (2-tailed).
VarietyParametersPrecipitationTmeanTminTmaxRH (%)
‘Janka’TF0.228−0.2090.045−0.1940.119
MC0.4650.360−0.0470.3090.408
‘M 488’TF−0.2100.2840.829 **−0.524 *−0.305
MC0.3610.646 **0.1620.3250.421
‘M 255’TF−0.3050.0780.663 **−0.643 **−0.140
MC0.2290.129−0.0430.1160.357
‘Ábel’TF−0.2140.4980.0510.252−0.553 *
MC0.640 *0.430−0.3250.520 *0.207
MeanTF−0.0830.2050.267 *−0.091−0.142
MC0.386 *0.399 **−0.0210.302 *0.328 **
Table 4. Seed moisture content (%) value changes of four rice varieties (Szarvas, Hungary, 2018, 2019, 2020). The different lowercases mean significant differences among the varieties at level 0.05, and the different capital letters show significant differences within varieties among the measurement times at level 0.05.
YearNumber of Measurements’Janka’’M 225’’M 488’’Ábel’
2018123.07 Db ± 1.0920.91 Cab ± 2.7626.11 Dc ± 2.5121.05 Ba ± 1.61
213.99 Ca ± 0.8614.64 Ba ± 0.6818.48 Cb ± 1.4025.19 Cc ± 1.11
310.04 Aa ± 0.8512.19 Aa ± 1.8214.69 Ba ± 1.36-
411.94 Ba ± 0.6512.16 Aa ± 1.2011.98 Aa ± 0.3215.75 Aa ± 0.95
2019123.55 Db ± 1.2521.22 Aba ± 2.5127.64 Cc ± 1.9023.58 Bb ± 2.37
221.33 ABCa ± 1.5222.50 Abab ± 1.9625.48 ABCb ± 3.2923.06 Bab ± 2.38
323.21 BCDc ± 1.5620.97 Abab ± 1.1423.24 Abbc ± 2.5520.12 Aa ± 2.64
421.92 Bca ± 0.7121.41 Aba ± 1.0824.65 Abb ± 2.5920.07 Aa ± 2.10
521.86 BCb ± 0.5620.75 Aab ± 1.9524.58 Bc ± 1.5120.10 Aa ± 0.81
620.35 Aa ± 1.1122.93 Bb ± 1.2322.16 Ab ± 1.7719.06 Aa ± 1.51
2020119.89 Ba ± 1.2724.16 Db ± 2.2824.52 Cb ± 4.1119.24 Ba ± 1.67
218.88 Ba ± 2.5319.58 Cab ± 1.9722.04 BCc ± 2.8421.84 Cbc ± 1.26
316.65 Aa ± 1.6017.74 Bcab ± 1.9620.16 Abb ± 2.7618.16 Bb ± 0.69
415.81 Aa ± 1.6815.28 Aa ± 1.5720.11 Abb ± 2.7418.26 Bb ± 1.43
516.17 Aab ± 1.4415.60 Aa ± 1.2917.54 Ab ± 1.5816.02 Aa ± 0.86
616.42 Aab ± 1.0517.17 AB ± 0.97-15.85 Aa ± 1.00
Table 5. The result of analyses of variance (ANOVA) of threshing force. SS—Sum of squares, df—degree of freedom, MS—mean squares, F ratio, and Sig.—p-value.
SSdfMSFSig.
Variety10.123.003.3719.860.02
Year0.812.000.402.370.24
DAF0.515.000.100.600.71
Table 6. The threshing force (TF) values among the varieties and years. Every TF is an average of all measurements data.
YearVariety
‘Janka’‘M 225’‘M 488’‘Ábel’
20181.03 N ± 0.131.21 N ± 0.122.07 N ± 0.041.55 N ± 0.46
20190.99 N ± 0.071.20 N ± 0.111.94 N ± 0.271.59 N ± 0.36
20201.04 N ± 0.181.49 N ± 0.182.69 N ± 0.431.52 N ± 0.16
Mean1.02 N ± 0.031.30 N ± 0.172.23 N ± 0.401.55 N ± 0.03
Table 7. Pearson correlation between days to flowering (DAF), threshing force (TF) values, and moisture content (MC) of three-year averages of ‘Janka’, ‘M 225’, ‘M 488’, ‘Ábel’ and all variety together, respectively. * or ** means that correlation is significant at the 0.05 or 0.01 level (2-tailed).
VarietyParametersDAFTF
‘Janka’TF0.0221
MC−0.5200.053
‘M 488’TF−0.538 *1
MC−0.717 **0.078
‘M 225’TF−0.1031
MC−0.542 *0.093
‘Ábel’TF−0.538 *1
MC−0.717 **0.078
MeanTF0.2321
MC−0.602 **0.312 *
Publisher’s Note: MDPI stays neutral with regard to jurisdictional claims in published maps and institutional affiliations.

