Article

Responses of N2O Production and Abundances of Associated Microorganisms to Soil Profiles and Water Regime in Two Paddy Soils

1
Jiangxi Provincial Key Laboratory of Soil Erosion and Prevention, Jiangxi Academy of Water Science and Engineering, Nanchang 330029, China
2
Key Laboratory of Subtropical Agricultural Resource and Environment, Ministry of Agriculture and Rural Affairs, College of Resources and Environment, Huazhong Agricultural University, Wuhan 430070, China
*
Author to whom correspondence should be addressed.
Agronomy 2022, 12(3), 743; https://doi.org/10.3390/agronomy12030743
Submission received: 31 December 2021 / Revised: 18 March 2022 / Accepted: 18 March 2022 / Published: 20 March 2022
(This article belongs to the Special Issue Nitrogen Cycle in Farming Systems)

Abstract

:
Soil moisture is one of the critical factors affecting N2O emissions. The water regime affects the physical and chemical properties of paddy soil in different soil layers, which, in turn, affects N2O emissions and microbial growth. However, there are few reports on the effects of different soil layers and soil moisture conditions on N2O emission characteristics and microbial mechanisms. A 21-day microcosm experiment was performed to research the effects of soil moisture levels (60%, 100%, and 200% water holding capacity, WHC) and different soil layers (0–10, 10–20, and 20–40 cm) on N2O emissions in hydromorphic and gleyed paddy soils. Function microbes involved in nitrification and denitrification were determined by quantitative PCR. Moreover, the abiotic variables pH, Eh, and exchangeable Fe2+, Fe3+, NH4+-N, and NO3-N were also analyzed. Results showed that N2O emissions of gleyed paddy soil were significantly higher than that of hydromorphic paddy soil, which was consistent with the result of the abundance of nitrifier and denitrifier in the two paddy soils. Soil depth, water content, and their interaction significantly affected N2O emission (p < 0.05). Cumulative emissions of N2O from each layer of the two paddy soils at 100% and 200% WHC were significantly higher than that under 60% WHC (p < 0.05). N2O emissions decreased significantly with the increase of soil depth (p < 0.05), which was consistent with the change in the abundance of soil nitrifier (AOB and AOA) and denitrifier (nirK and nosZ) function genes with soil depth. The abundance of AOB, AOA, and nirK and nosZ genes decreased significantly with soil depth (p < 0.05), but did not respond significantly to the water regime. Based on the results of redundancy analysis, the contents of Fe2+ and Fe3+ were positively correlated with N2O emissions and the abundance of AOB, AOA, and nirK and nosZ genes. These results indicate that N2O emissions and the abundance of associated microbes are selectively affected by soil moisture and soil layers in the two paddy soils.

1. Introduction

As one of the most important greenhouse gases, Nitrous oxide (N2O) possesses a global warming potential 298 times greater than carbon dioxide [1]. Agricultural soil is one of the dominant sources of nitrous oxide, accounting for about 65% of the total emissions of N2O in the air [2,3]. Paddy soils represent classical agricultural soils with unique flooding and drainage regime [4,5]. It is necessary to get a deep insight into the effects and mechanism of N2O emissions from paddy soils [6].
N2O from paddy soils is primarily produced by microbial-mediated denitrification or nitrification [7,8]. Nitrification-associated pathways are performed by ammonia oxidizers (AOA and AOB) through oxidizing ammonium to nitrite (NO2) and emitting N2O under aerobic conditions. Meanwhile, N2O also can produce via the reduction of NO2 by ammonia-oxidizing bacteria (AOB). Under anaerobic conditions, N2O is the intermediate product of denitrification where denitrifiers reduce nitrate (NO3) to dinitrogen (N2) through NO2, nitric oxide (NO), and N2O. Soil moisture regulates aerobic and anaerobic conditions in soils, thus influencing the relative contribution of nitrification and denitrification processes to N2O emissions [3,9]. Generally, nitrification is the primary process of N2O emissions in the soil with 30% < water-filled pore space (WFPS) < 70%. However, denitrification will be the dominant pathway of N2O production under anaerobic conditions with soil moisture content higher than 80–90% WFPS [10].
The periodic flooding, drainage, tillage, and other agricultural measures of paddy fields and the fluctuation of groundwater level make paddy soils frequently in a state of dry-wet alternation [11,12,13]. As a result, different soil layers have different water contents and aeration statuses, leading to the changes of soil redox, pH, and other properties in time and space [14,15]. The changes of pH and Eh lead to the redox reaction of Fe in paddy soils and the occurrence of leaching and deposition, causing the formation of distinct layers of Fe redox and the redistribution of Fe in different soil layers [16,17]. Fe can participate in the process of nitrification and denitrification through biological or abiotic redox cycles in both anaerobic and aerobic conditions [18,19,20]. Zhu et al. [21] found in different soils that Fe content had a more significant effect on N2O emissions than other soil indices. Nitrate-dependent ferrous oxidation (NDFO) can co-occur through biological and abiotic pathways in anaerobic environments such as wetland soils, sediments, and anaerobic microsites. Most nitrate-reducing ferrous oxidizing microbes can reduce nitrate to NO, N2O, and N2 [22,23,24]. Fe can also be directly involved in nitrification through Feammox; specifically, under anaerobic conditions, Fe3+ is reduced while NH4+ is oxidized, producing NO3 and N2 [25,26,27]. Therefore, the distribution of iron content in different soil layers may affect N2O emissions.
In addition, environmental changes such as the changes of soil moisture, temperature, redox, and pH can affect the composition of soil microbial communities, thus, in turn, affecting the nitrification and denitrification of soil [28,29,30,31]. Soil moisture is a crucial factor affecting the diffusion of nutrients, influencing microbial community composition. In addition, soil pH has been identified as a key regulator of N2O emissions through shaping microbial community composition [30,31]. Zhang et al. [15] found that with the deepening of soil layers, nitrogen transformation function genes (AOA amoA, AOB amoA, narG, nirK/S, and nosZ) gradually decreased, which may be because the contents and availability of NH4+, NO3, DOC decreased with the deepening of soil layers [32,33,34,35]. Chen et al. [31] found that the limited denitrification in deep soils was related to the reduced abundance of denitrifying microorganisms due to the low content of nutrients such as soluble organic carbon in deep layers.
Generally, the physicochemical properties of paddy soils in different soil layers change under the influence of water status, thus affecting the abundance and activity of nitrification and denitrification microorganisms in different soil layers. So, there may be differences in N2O emissions in different soil layers due to their different soil moisture. However, there are few reports on the effects of different soil layers and soil moisture conditions on N2O emission characteristics and microbial mechanisms. By studying the contribution of different soil layers to the N2O emissions, we can improve our understanding of the function of each soil layer in N2O emissions, which will be helpful for further understanding the process of N cycling in farmland soils. In addition, the result can provide a theoretical basis to take reasonable measures for reducing N2O emissions from farmlands. Therefore, in this study, hydromorphic and gleyed paddy soils developed under the influence of different water conditions were selected to take samples for laboratory analysis for exploring the effects of water conditions on the emissions of N2O from the two soils of different layers. The guiding hypothesis of this study is that (1) soil moisture affected predominant N cycling processes and emissions of N2O in both paddy soils; (2) there are significant differences in N2O emissions from different layers of paddy soils; and (3) the responses of N2O emissions as well as the abundance of nitrification and denitrification microorganisms to water contents and soil layers depended on different soil characteristics.

2. Materials and Methods

2.1. Location and Soils Sampling

Two types of paddy soils used for microcosm experiment were collected from two rice fields located in Xianning, Hubei Province, China (30°1′ N, 114°22′ E), characterized by a typical subtropical monsoon climate with an annual rainfall of 949.4 mm and a mean annual temperature of 16.1 °C. One type was hydromorphic paddy soil (Hydragric Anthrosols) with good irrigation and drainage conditions, obvious reductive leaching and oxidation deposition, and visible soil layer differentiation. The other was gleyed paddy soil (Gleyic Anthrosols), which was located in the paddy field of low polder area of a reservoir, with an apparent bluish-grey layer. Both soils developed from the quaternary red earth.
The 0–40 cm plough soil profile was divided into three layers, 0–10 cm, 10–20 cm, and 20–40 cm, respectively. A soil core sampler with a 5-cm diameter was used for each layer to collect five soil cores from each of three plots. The samples of each layer were mixed thoroughly, sieved through a 20-mesh then stored at 4 °C for the later experiment. The physicochemical properties of the soils are presented in Table 1.

2.2. Microcosm Experiment

Water holding capacity (WHC) is used to characterize the maximum soil water content that farmland soil can maintain stably, and it is often used as an indicator for the upper limit of farmland irrigation and the calculation of irrigation quota. Thus, we used different percentages of WHC to simulate different soil moisture conditions. Therefore, the microcosm experiments of the samples were conducted at 25 °C under laboratory-controlled conditions under the three designed moisture content treatments (60% WHC, 100% WHC, and 200% WHC) corresponding to the soil moisture conditions of drying, wetting, and flooding.
The soil samples were pre-incubated for 7 days at 20% soil moisture content at 25 °C for activation and stabilize the microorganisms. Then, aliquots of the activated soils corresponding to 25 g dry weight soil were placed in 250 mL culture bottles. Next, (NH4)2SO4 was added at a fertilization amount of 100 mg kg−1 dry soil (equivalent to 225 kg N ha−1 year−1). All soil microcosms consisting of 108 serum bottles were incubated for 21 days at 25 °C in darkness. Each treatment of the incubation experiments was conducted in six replicates, in which three were used for soil analysis and three for gas sampling.
The 10 mL of headspace gas was sampled at days 0, 1, 3, 5, 7, 14, and 21 during the incubation by syringe for analyzing their N2O concentration, and the emissions of N2O were calculated according to Wang et al. [6]. At the same time, another three replicates were destructively sampled for determining soil NH4+-N, NO3-N, Fe2+, Fe3+, pH, and Eh. The soil samples from the 21st day of incubation were kept at −80 °C for DNA extraction and analysis.

2.3. Physical and Chemical Analysis

N2O concentration was determined with gas chromatography (Agilent 7890A). NO3-N and NH4+-N of soils were extracted with 2 mol L−1 KCl solution, and NO3-N concentration was measured by ultraviolet spectrophotometry [36]. The concentration of NH4+-N in the soil extracts was measured by phenol hypochlorite [37]. Fe2+ and Fe3+ were extracted with 0.5 mol L−1 hydrochloric acid. The extracted Fe2+ and Fe3+ was determined using the ferrozine method [38]. The soil pH was measured using a pH meter (Sartorius, Basic pH Meter PB-10, Gottingen, Germany). Eh was determined with an oxidation-reduction potentiometer.

2.4. DNA Extraction and Real-Time Quantitative PCR

The soil DNA was extracted from 0.5 g frozen soil with the FastDNA spin kit for soil (MP Biomedicals, Irvine, CA, USA) according to the manufacturer’s instructions. DNA extracts were verified by agarose gel electrophoresis and quantified using a NanoDropTM-Spectrophotometer (Thermo Scientific, Waltham, MA, USA).
The real-time PCR method was used to determine the functional genes of nitrification and denitrification, including AOA amoA, AOB amoA, nirK, and nosZ. The corresponding primers and amplification procedures are shown in Table S1 (See the Supplementary Materials for details). Each amplification was performed in 20-μL reactions including 10 μL of SYBR Select Master Mix (2×) Premix Ex Taq (Takara Biotech, Dalian Co., Ltd., China), 2 μL of DNA template, and 2 μL of each primer. The amplification efficiency ranged from 98% to 110%, and R2 values of standard curves were >0.99 in each reaction. The amplification specificity of each gene was verified by melting curve analysis.

2.5. Statistical analysis

The soil N2O fluxes were calculated as follows:
P = d c d t × v M v × M w w × 273 T
where P (μg N kg−1 h−1) is the soil N2O flux, dc/dt (μL L−1 h−1) is the change of N2O concentration in headspace during the period dt (h), v (L) is the headspace volume of the bottle, Mv (L) is the volume of 1 molar of gas in its standard conditions (273 K, 1.013 × 10⁶ Pa), Mw (g) is the molar mass of N2O, w (g) is the mass of dry soil in the bottle, and T (K) is the absolute temperature.
All statistical analyses were performed using IBM SPSS Statistics 25. Statistical differences of physicochemical properties of soils were performed with one-way ANOVA. Two-way ANOVA was conducted to evaluate effects of soil layers, soil moisture and their interactions on total N2O emissions and amoA, nirK, and nosZ gene abundance in SPSS. The effect of soil water content, soil depth, and their interactions on the abundance of nitrification and denitrification functional genes was analyzed by Two-way ANOVA. Pearson correlation analysis was used to evaluate the relationship between N2O emissions and soil indices, such as NH4+, NO3, Fe2+, and Fe3+ content. Redundancy analysis (RDA) was performed to analyze gene abundance based on soil physicochemical properties with CANOCO 5.0.

3. Results

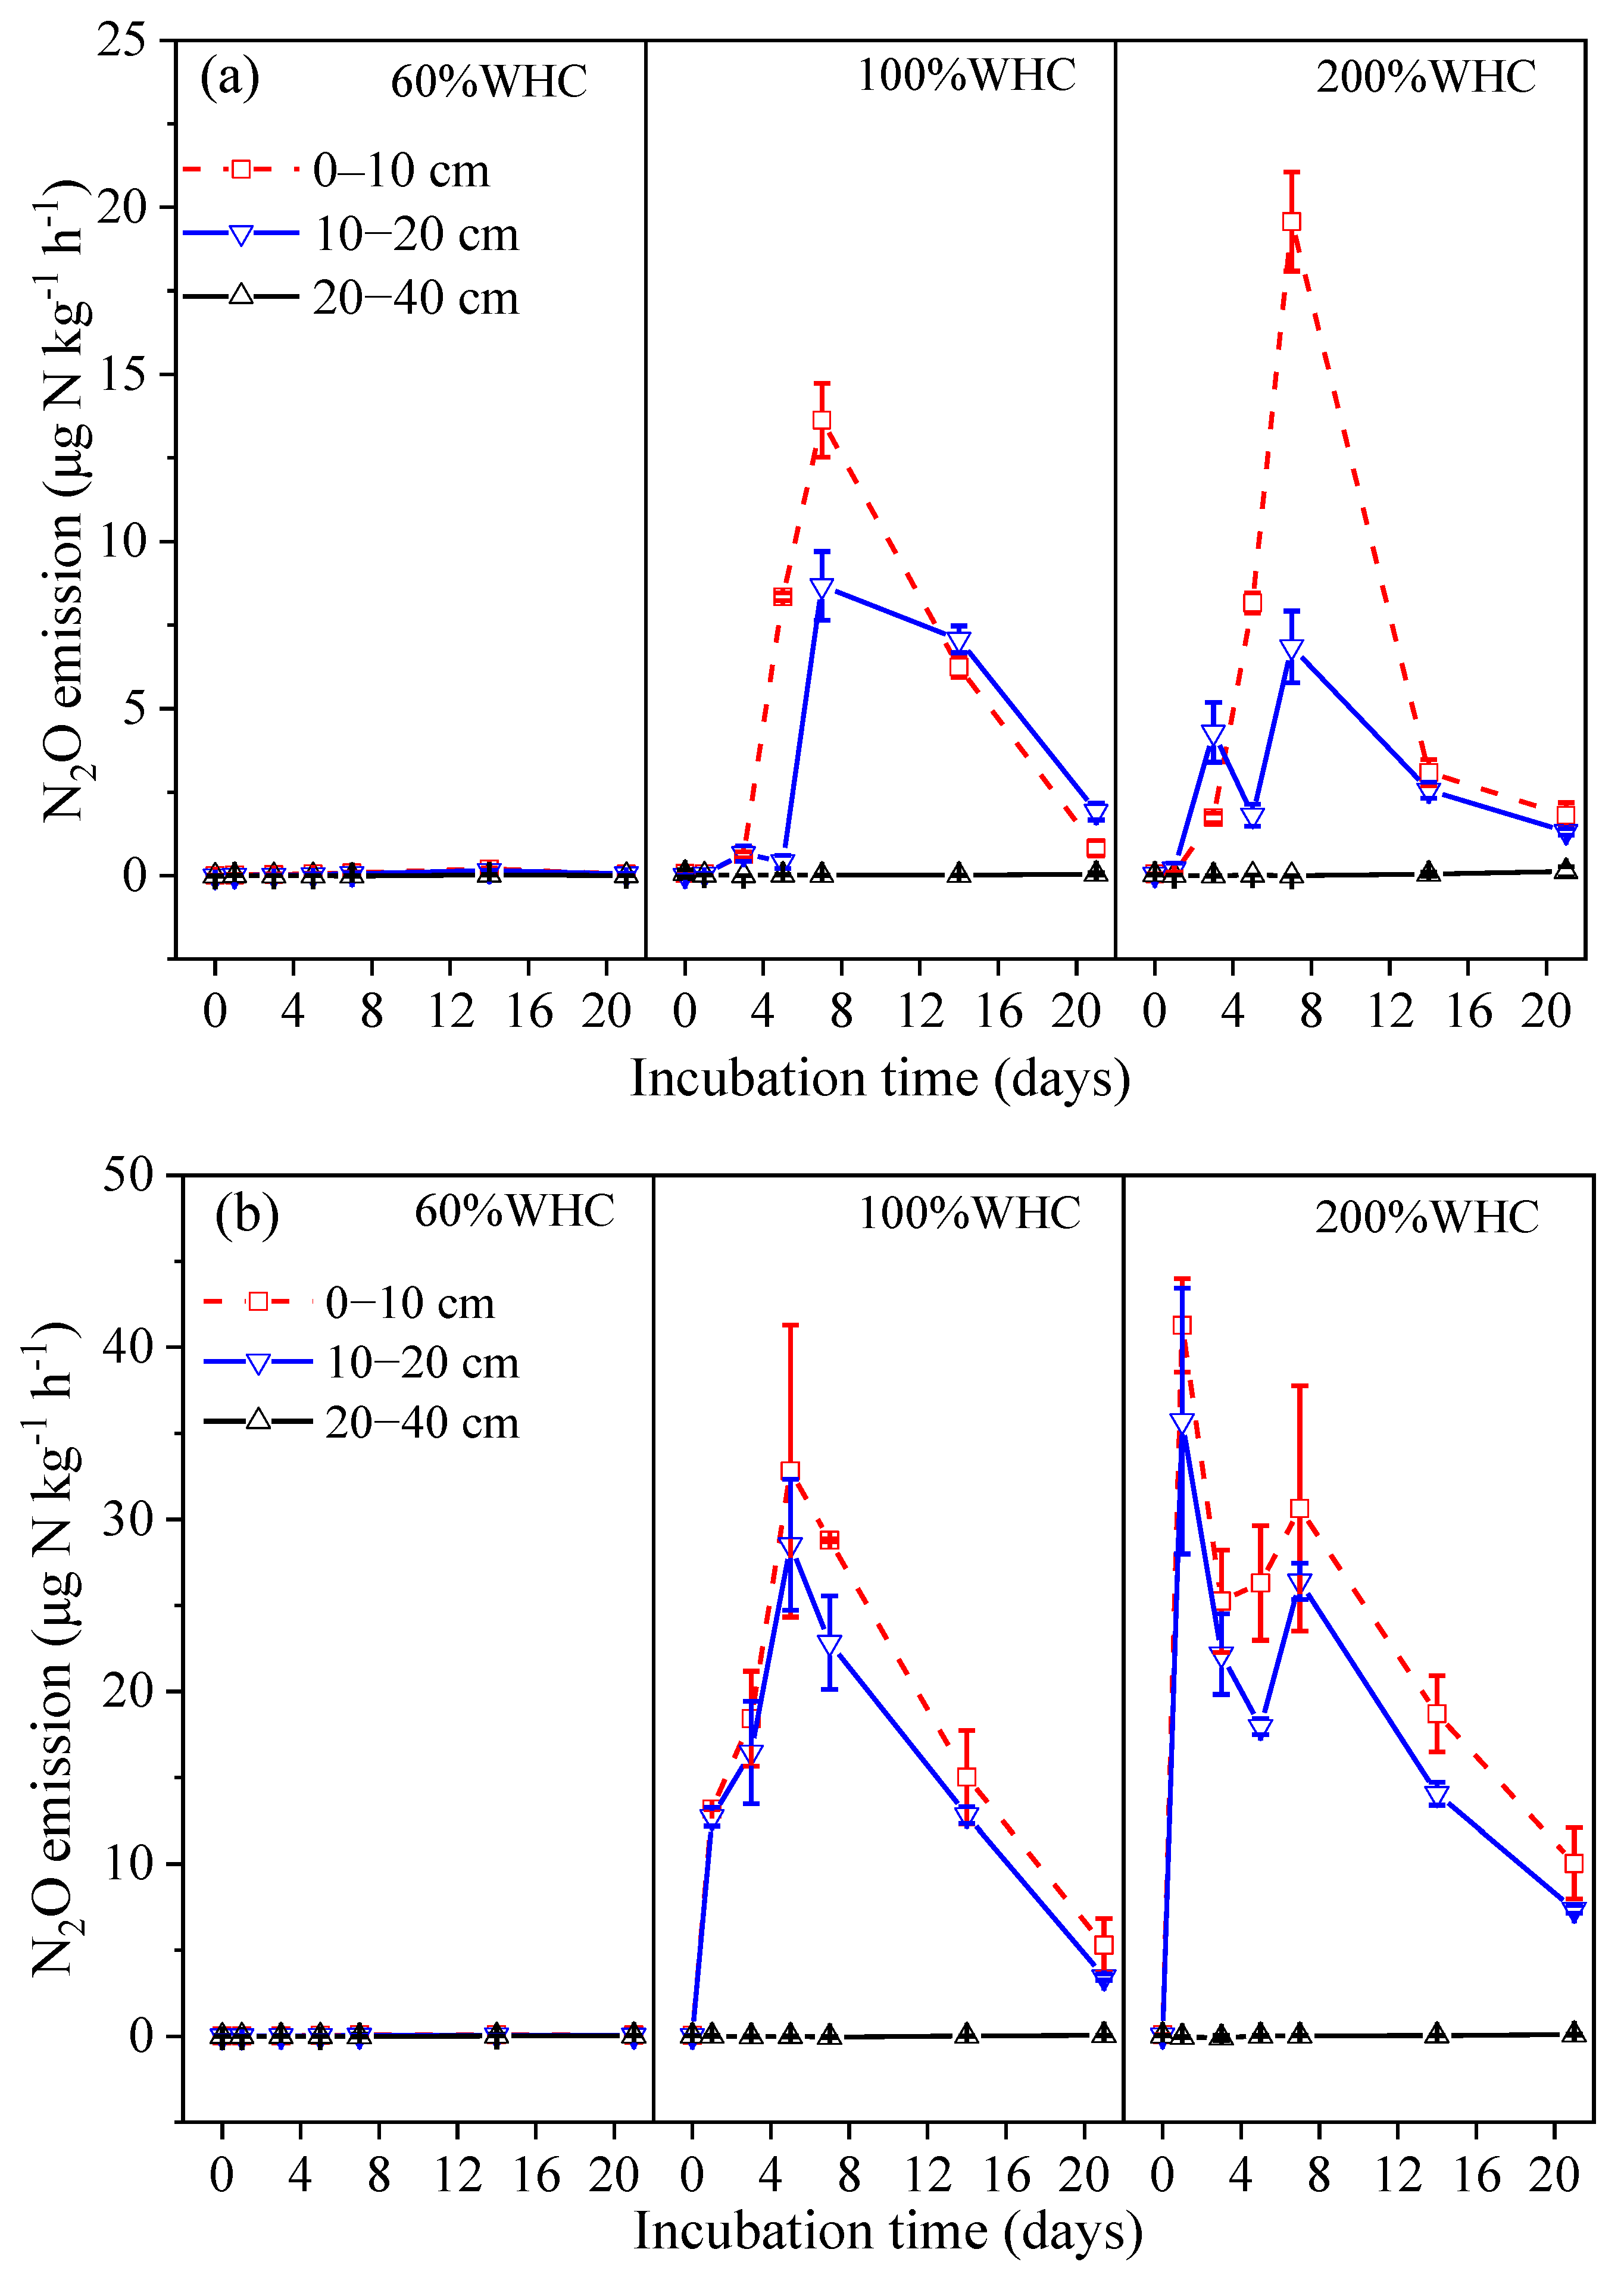
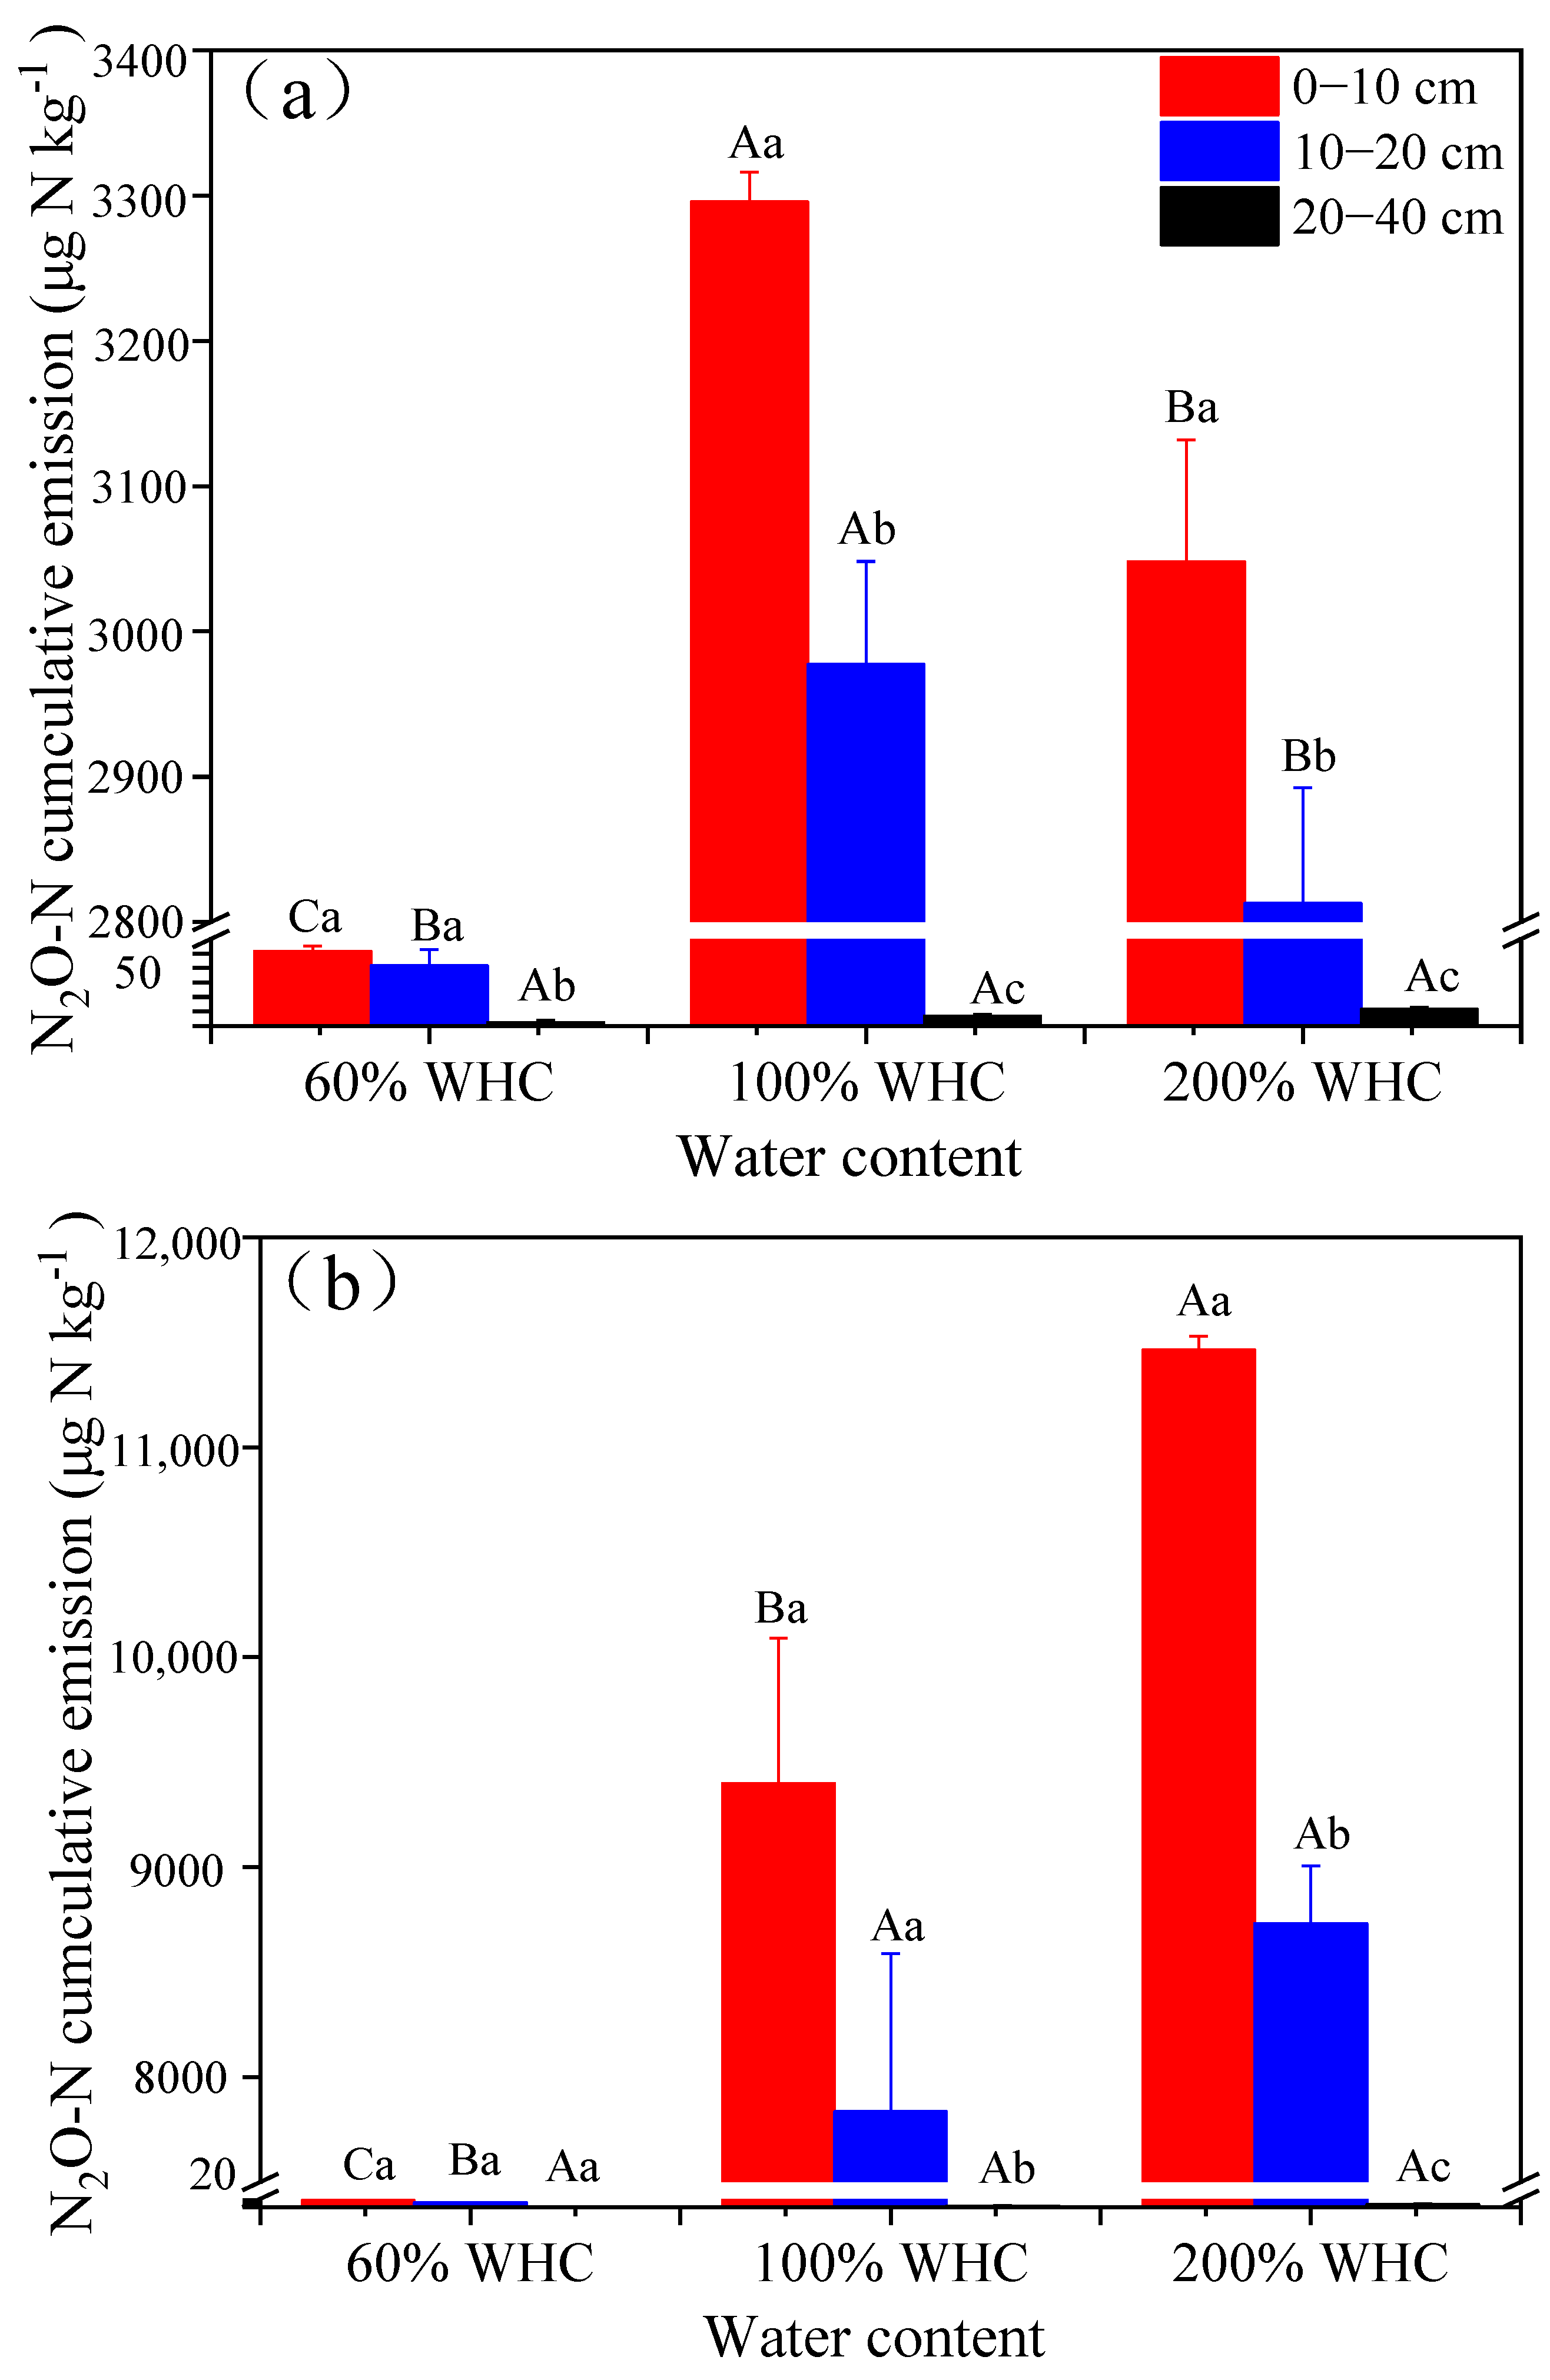
3.1. Soil N2O Emissions

The N2O emission rate depicted a trend of increasing at the first stage and then decreasing with the extension of incubation time in all treatments of both soils (Figure 1). Without considering soil layers, the mean N2O emission rate of the 100% and 200% WHC treatments was significantly higher than that of the 60% WHC treatment. In addition, the N2O emission rate decreased with soil depth, and the highest values appeared at 0–10 cm layers for all the treatments of both soils.
Under the same water content, total N2O emissions decreased significantly with the soil layer deepening in both paddy soils (p < 0.05) (Figure 2). For instance, the total emissions of N2O in 0–10 cm, 10–20 cm, and 20–40 cm soil layers of 100% WHC from hydromorphic and gley paddy soils were 3296.0, 2977.3, 7.0 μg N kg−1, and 9398.4, 7836.4, 6.9 μg N kg−1, respectively. In each treatment, total N2O emissions of gleyed paddy soil were significantly higher than that of hydromorphic paddy soil.

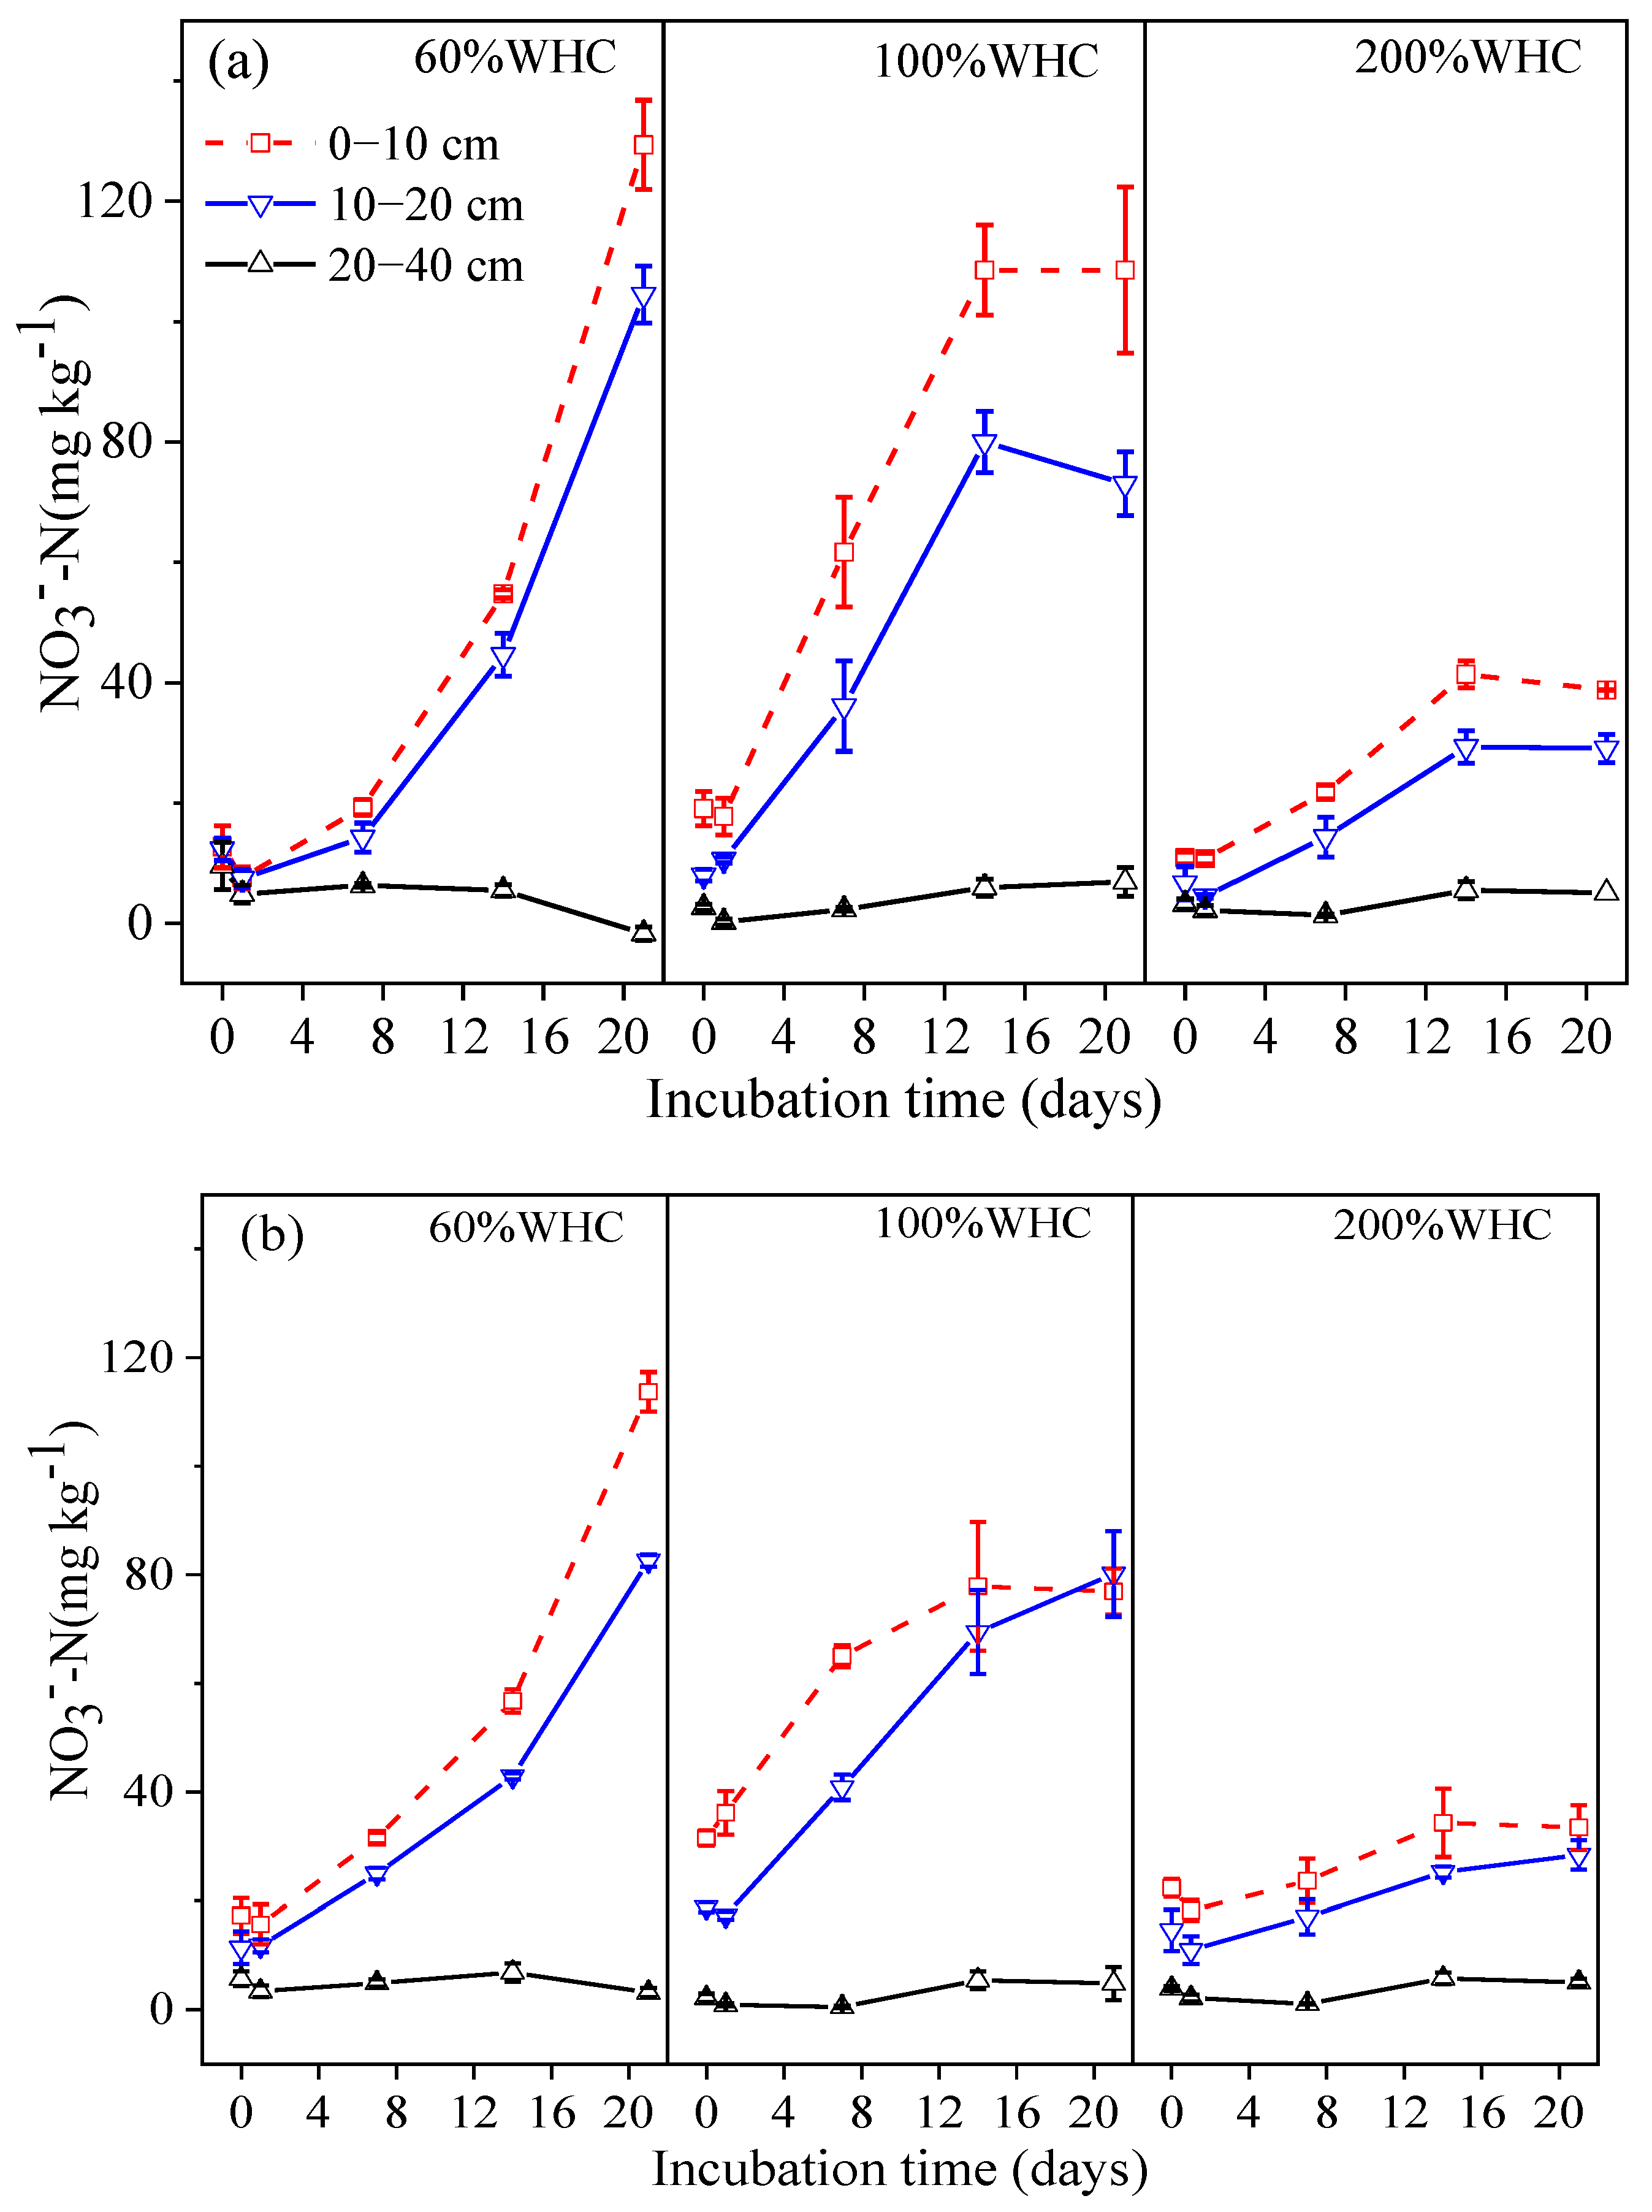
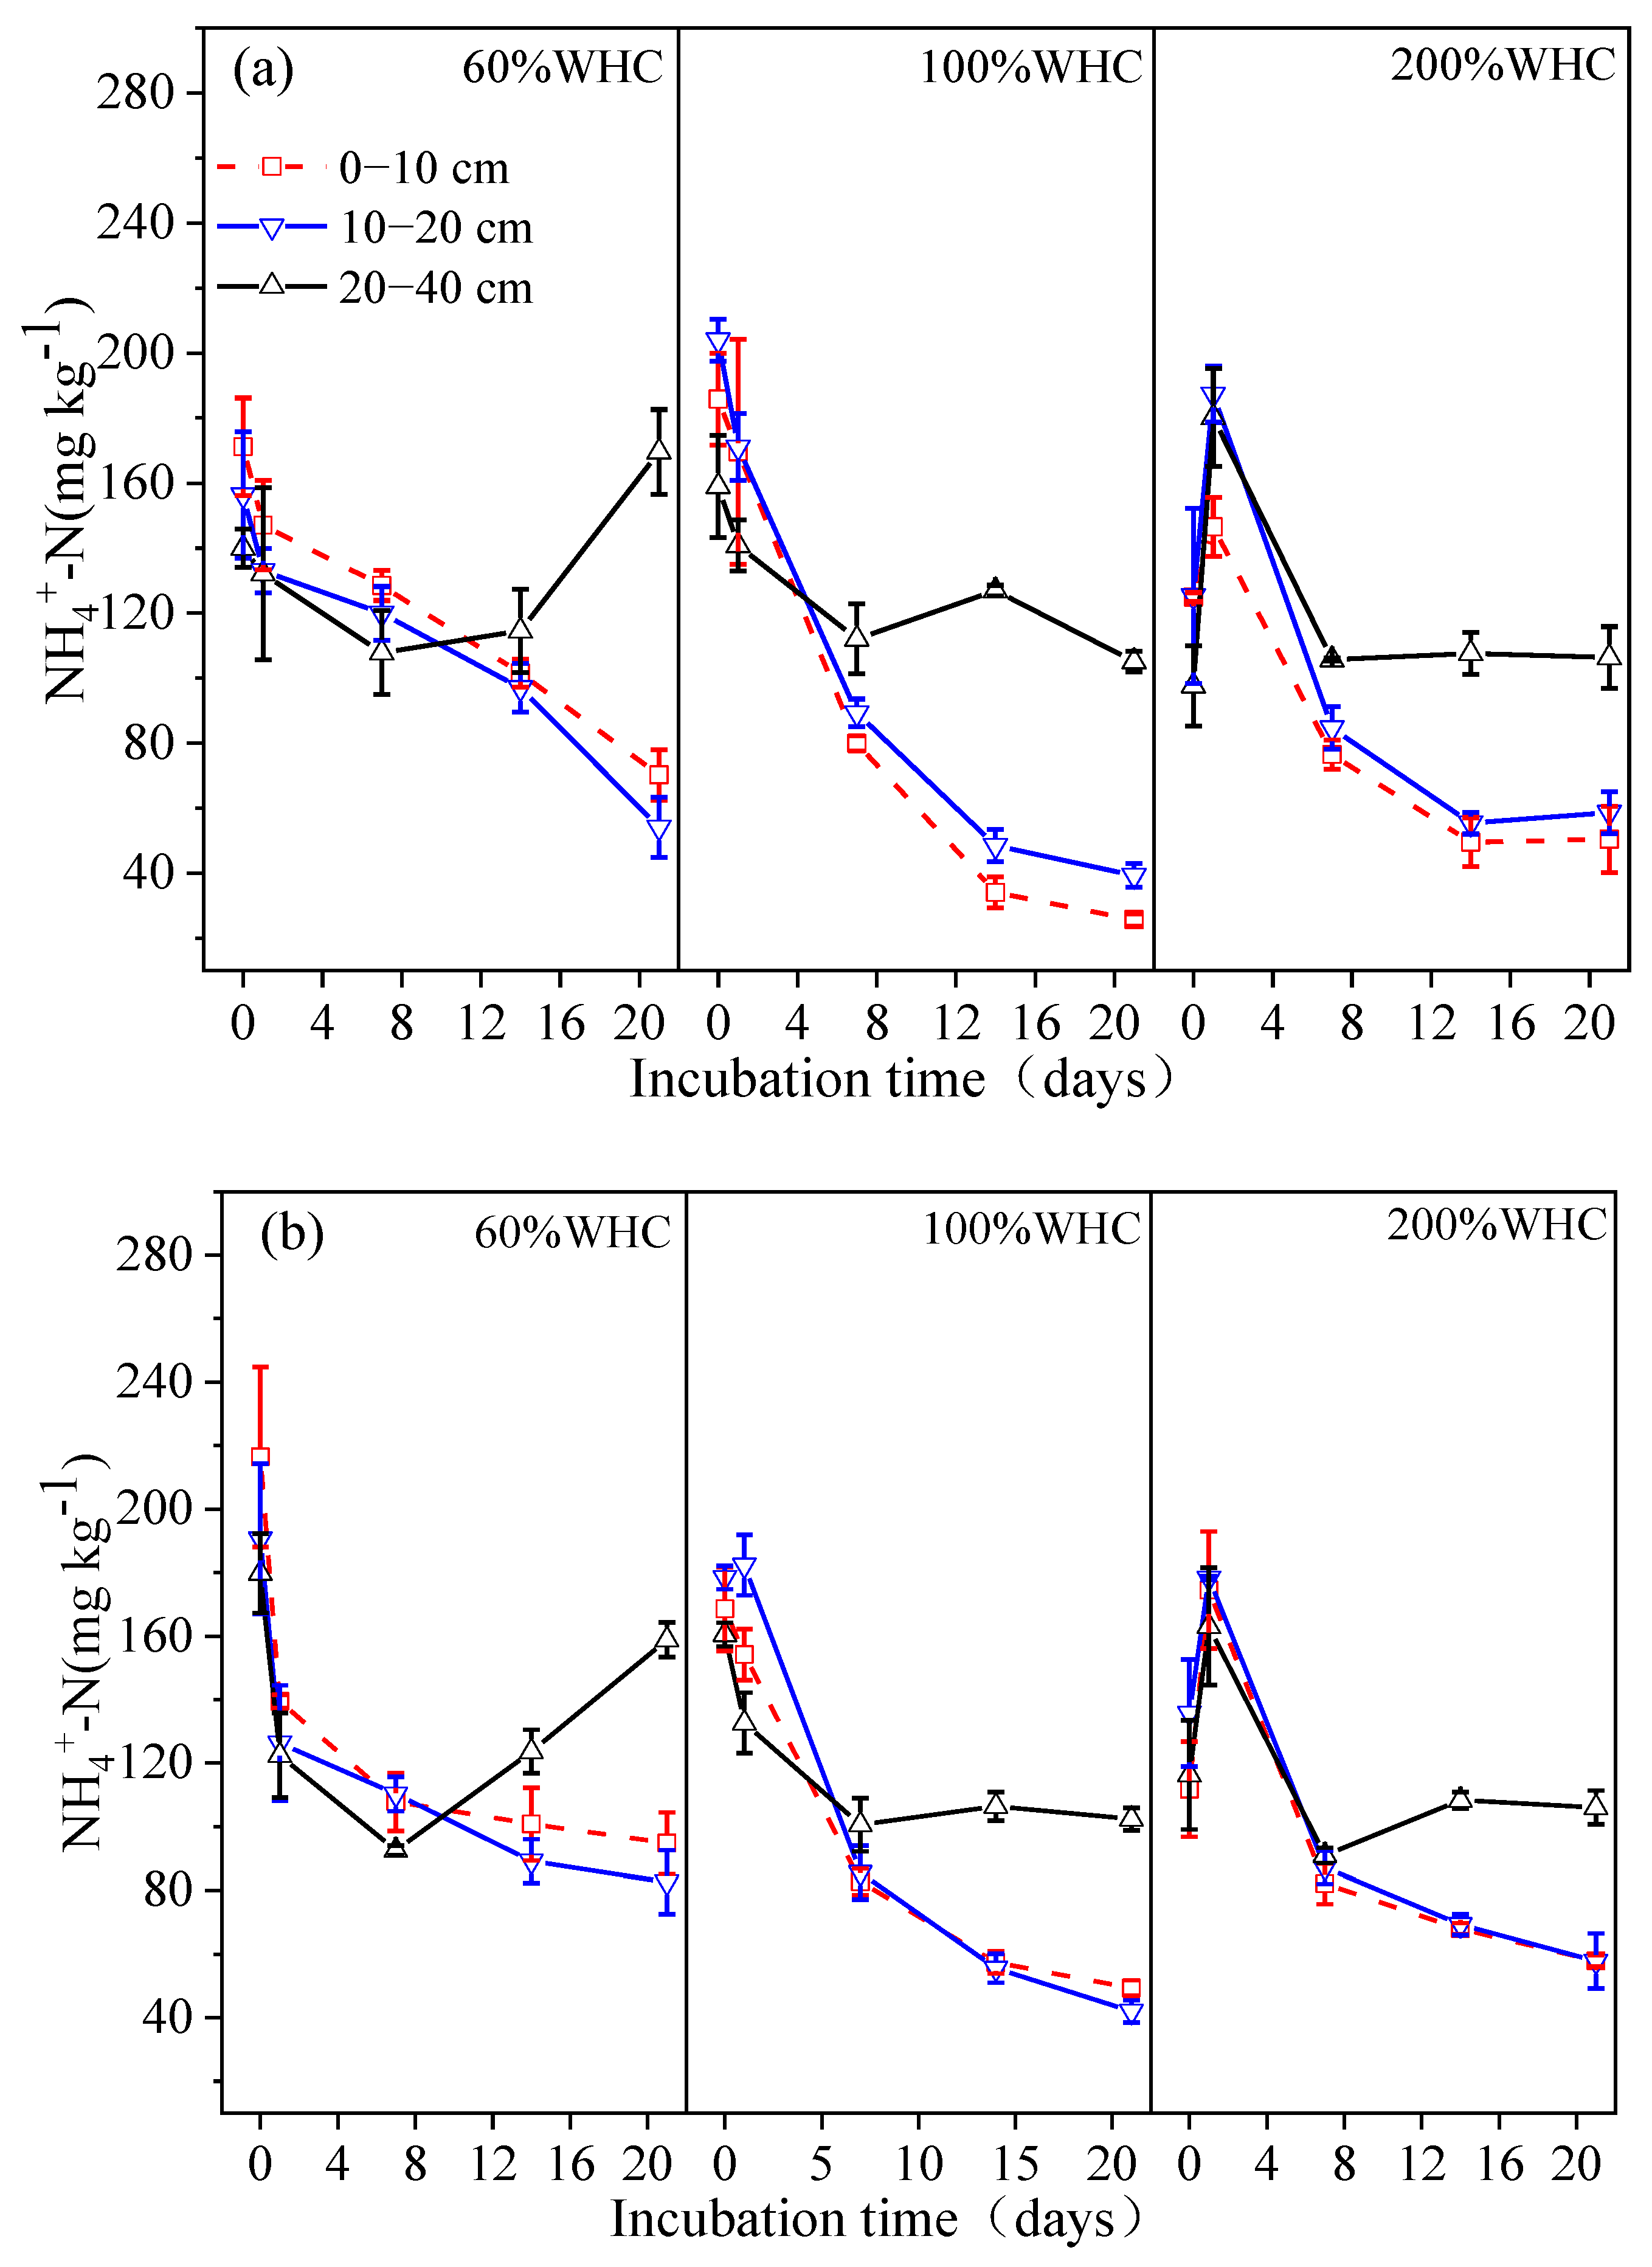
3.2. Soil Inorganic Nitrogen

NO3-N concentration increased significantly with the incubation time in 60% and 100% WHC treatments for both paddy soils (Figure 3). However, in 200% WHC treatment, the concentration of NO3--N showed a slightly decreasing trend at first and then increased with incubation time. In addition, the NO3-N concentration of the two paddy soils decreased significantly with the deepening of soil layers. Without considering soil layers, the average NO3-N concentration of the two soils with 60%, 100%, and 200%WHC was 27.04, 30.25, 12.69, and 26.91, 33.22, 26.91 mg N kg−1, respectively.
The concentration of NH4+-N of 0–10 and 10–20 cm soil layers in the 60% and 100% WHC treatments decreased gradually with incubation time (Figure 4). Different from the trend of the 60% and 100% WHC treatments, the change of NH4+-N concentration in the 200% WHC treatment was firstly increased and then decreased during the initial stage (from day 0 to day 7) of incubation. The change of NH4+-N was the opposite of the trend that NO3-N concentration decreased first and then increased with time under the 200% WHC.

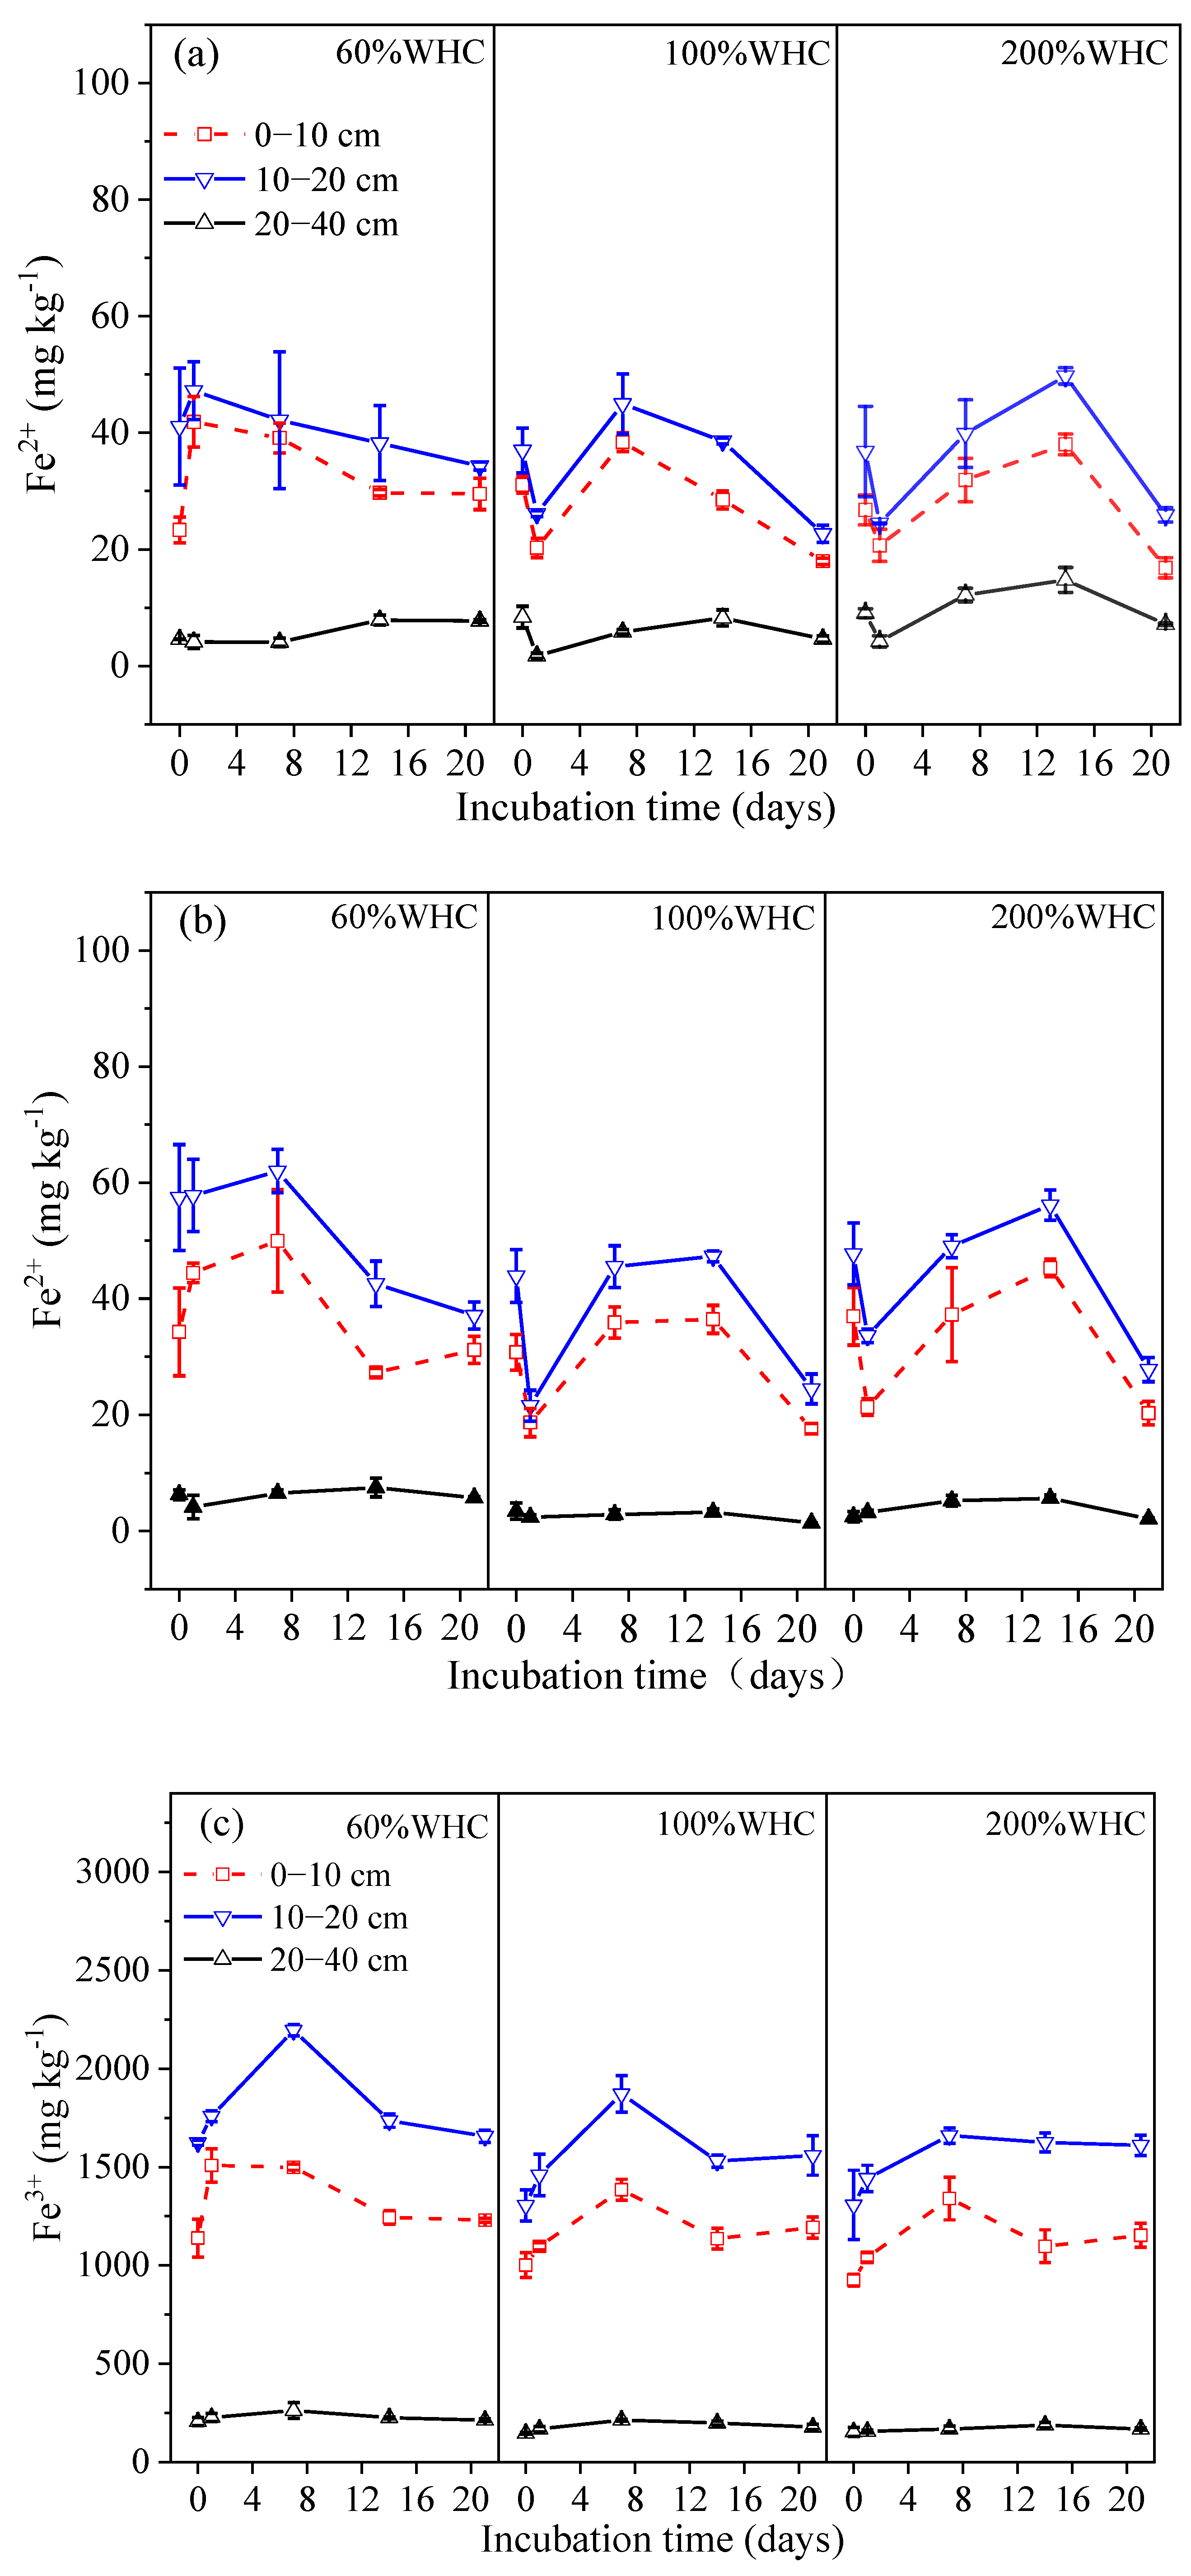
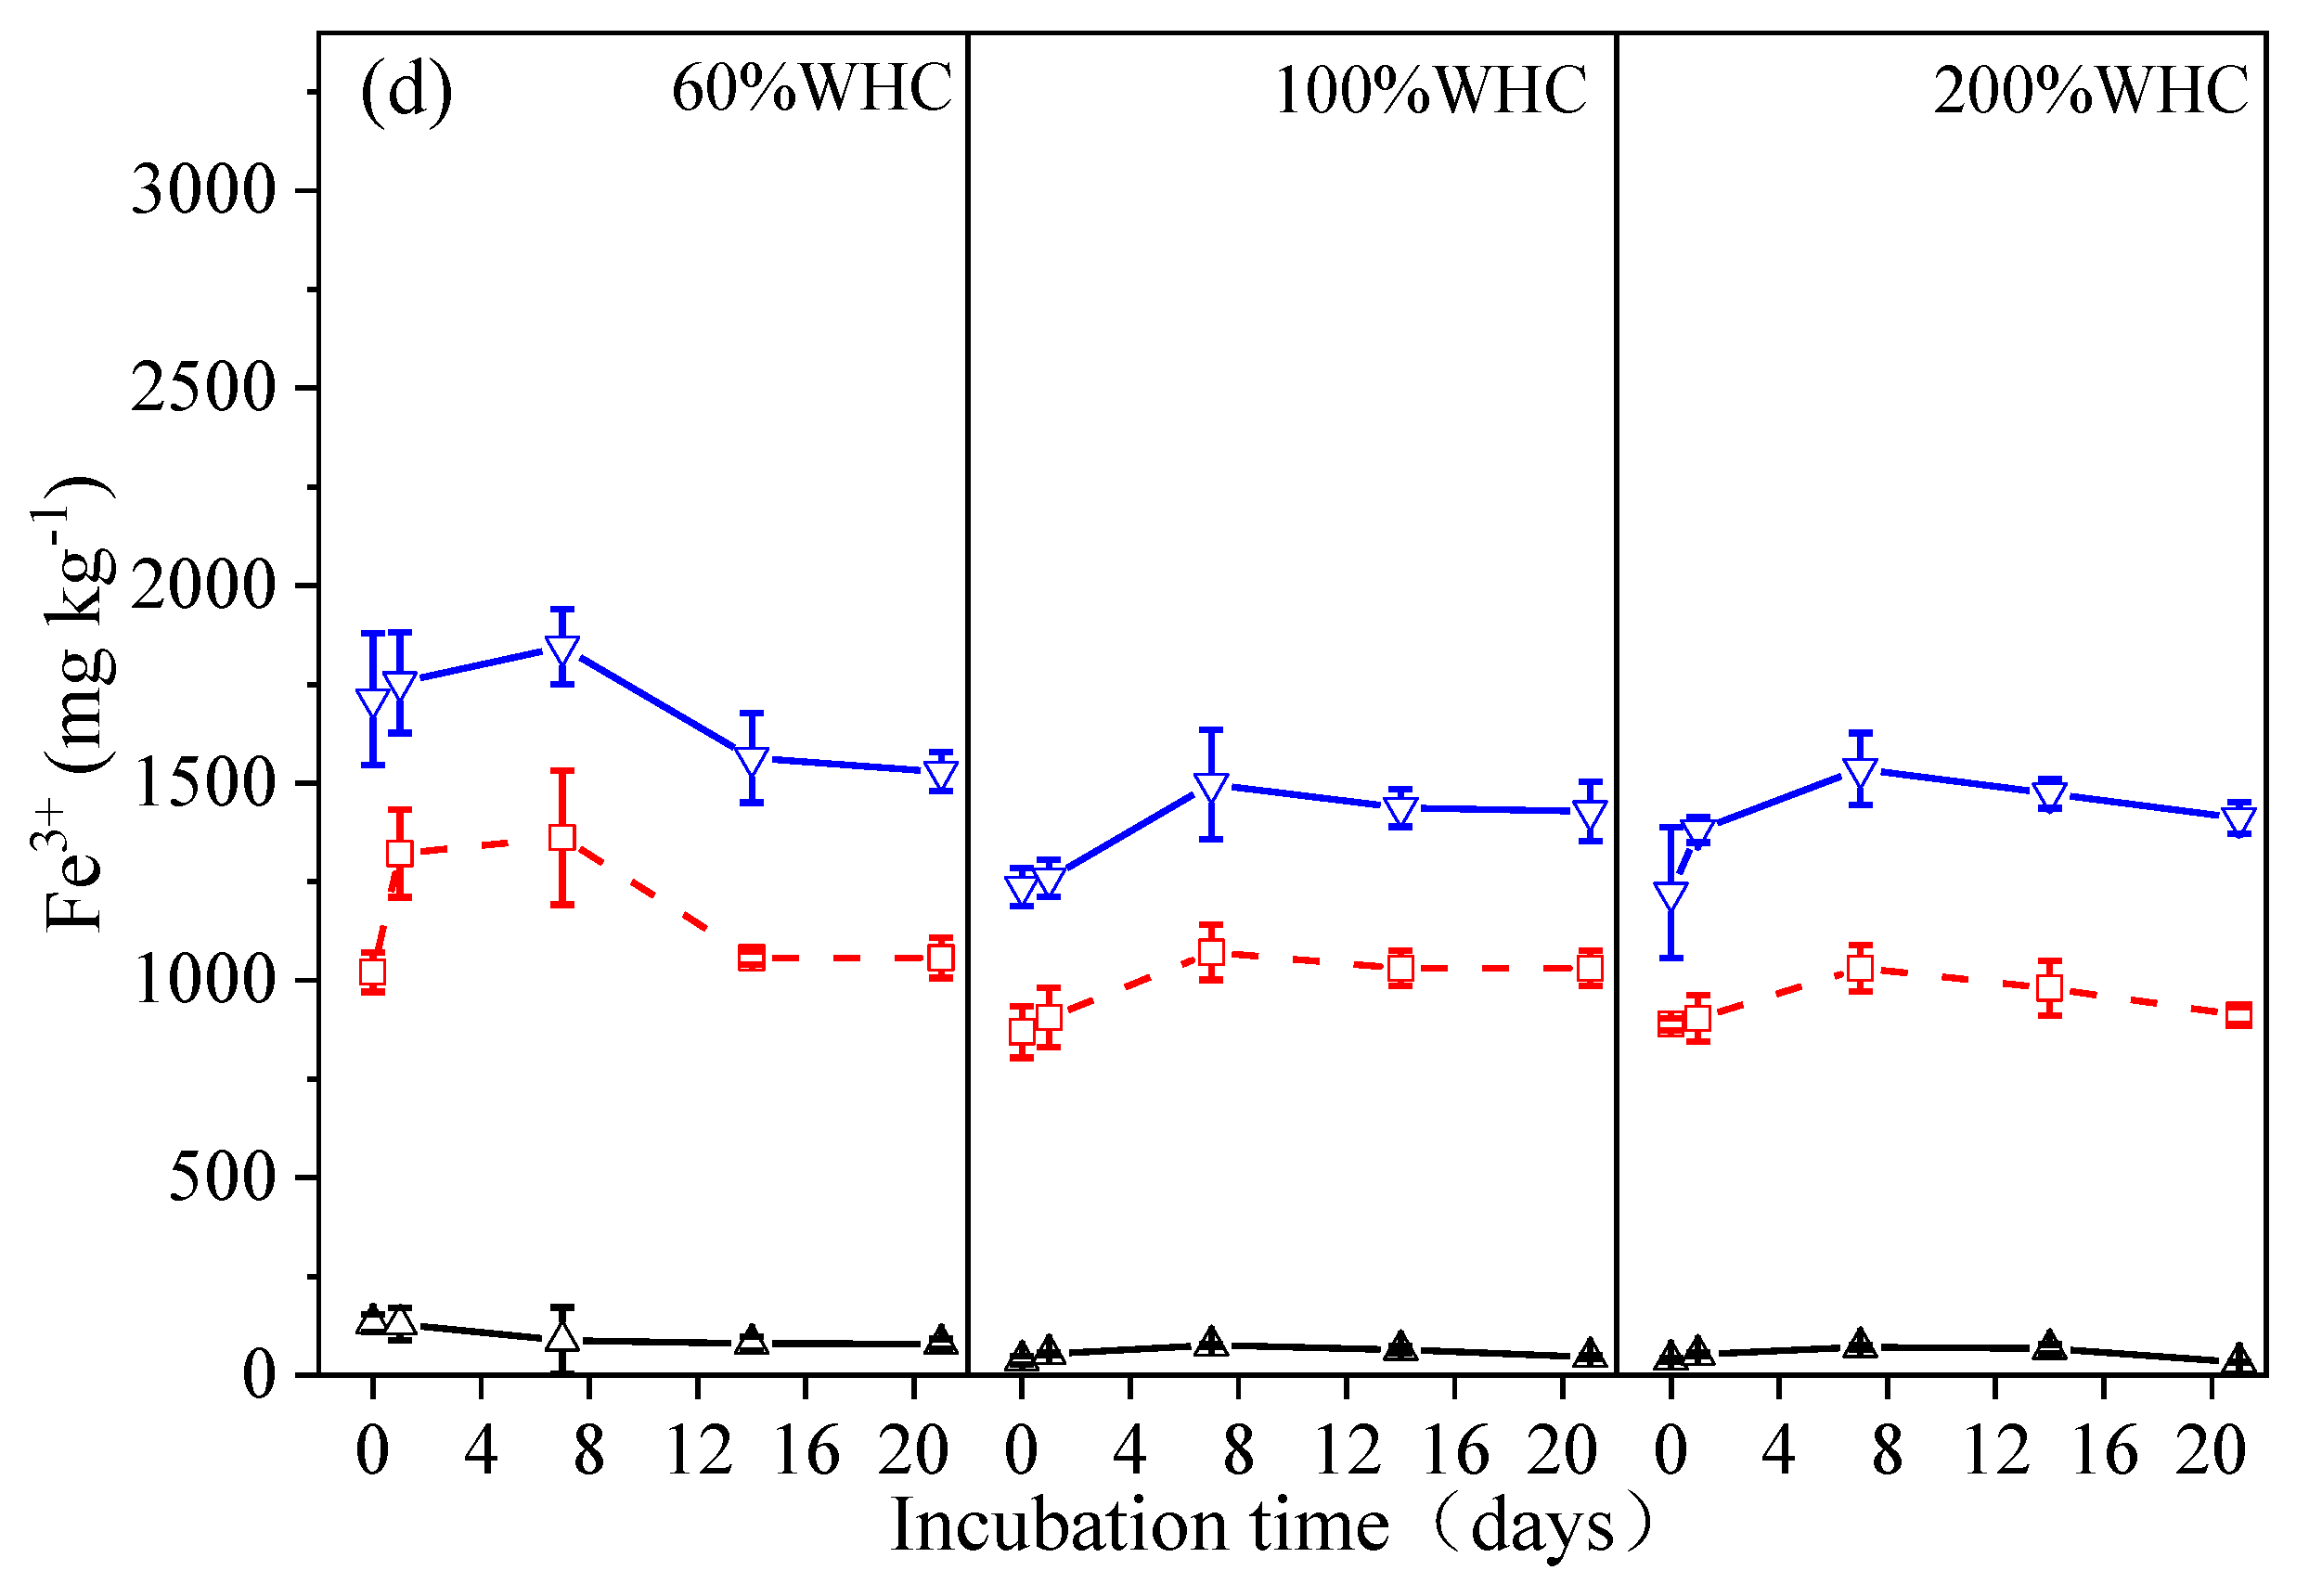
3.3. Dynamics of Fe Concentrations

The concentrations of Fe2+ of 0–10 and 10–20 cm soil layers in 60% WHC treatment of the two soils firstly increased and then decreased with the increasing incubation time (Figure 5). However, in the 100% and 200% WHC treatments, the contents of Fe2+ in the corresponding soil layers showed a trend of rapidly decreasing and then increasing during the initial stage, and then decreased slowly until the end of incubation. Generally, soil depth significantly influenced the contents of Fe2+ regardless of water conditions, and the order of Fe2+ contents was 10–20 cm > 0–10 cm > 20–40 cm soil layers. The Fe3+ contents increased gradually during the initial stage and then fluctuated slightly in the 100% and 200% WHC treatments of the two soils, and the variation of Fe3+ contents was opposite to that of Fe2+ during the initial stage.

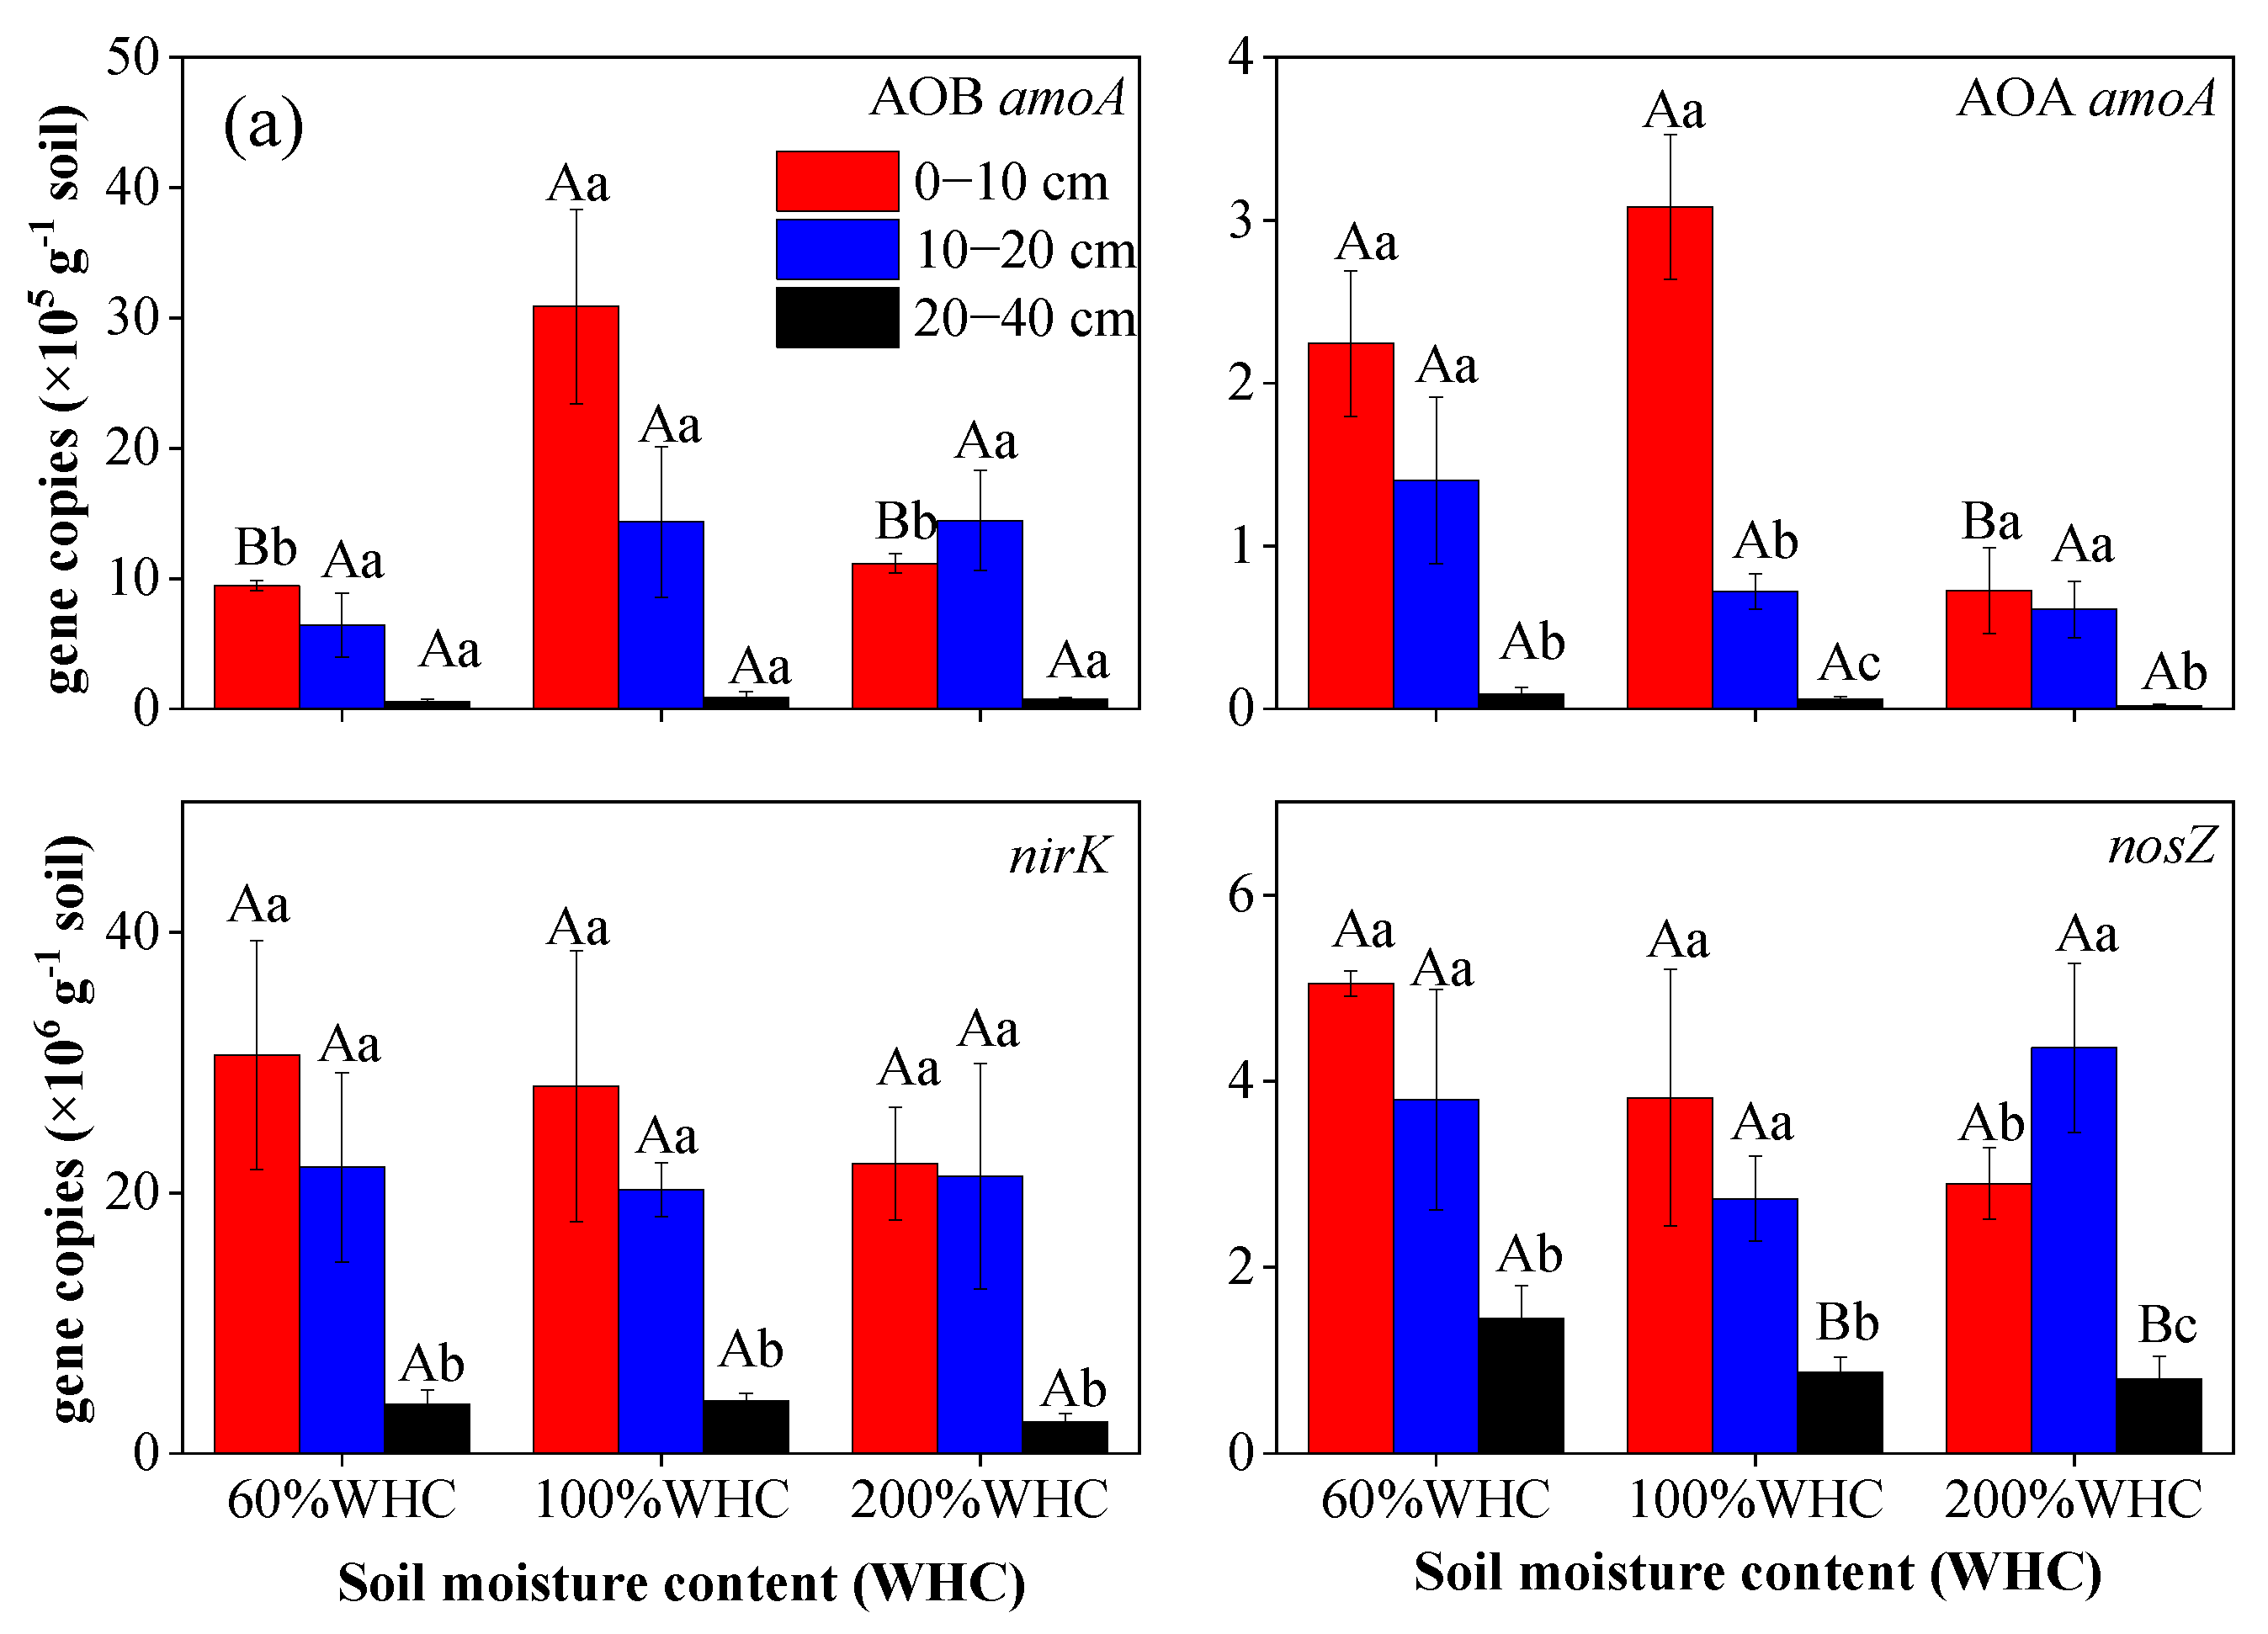
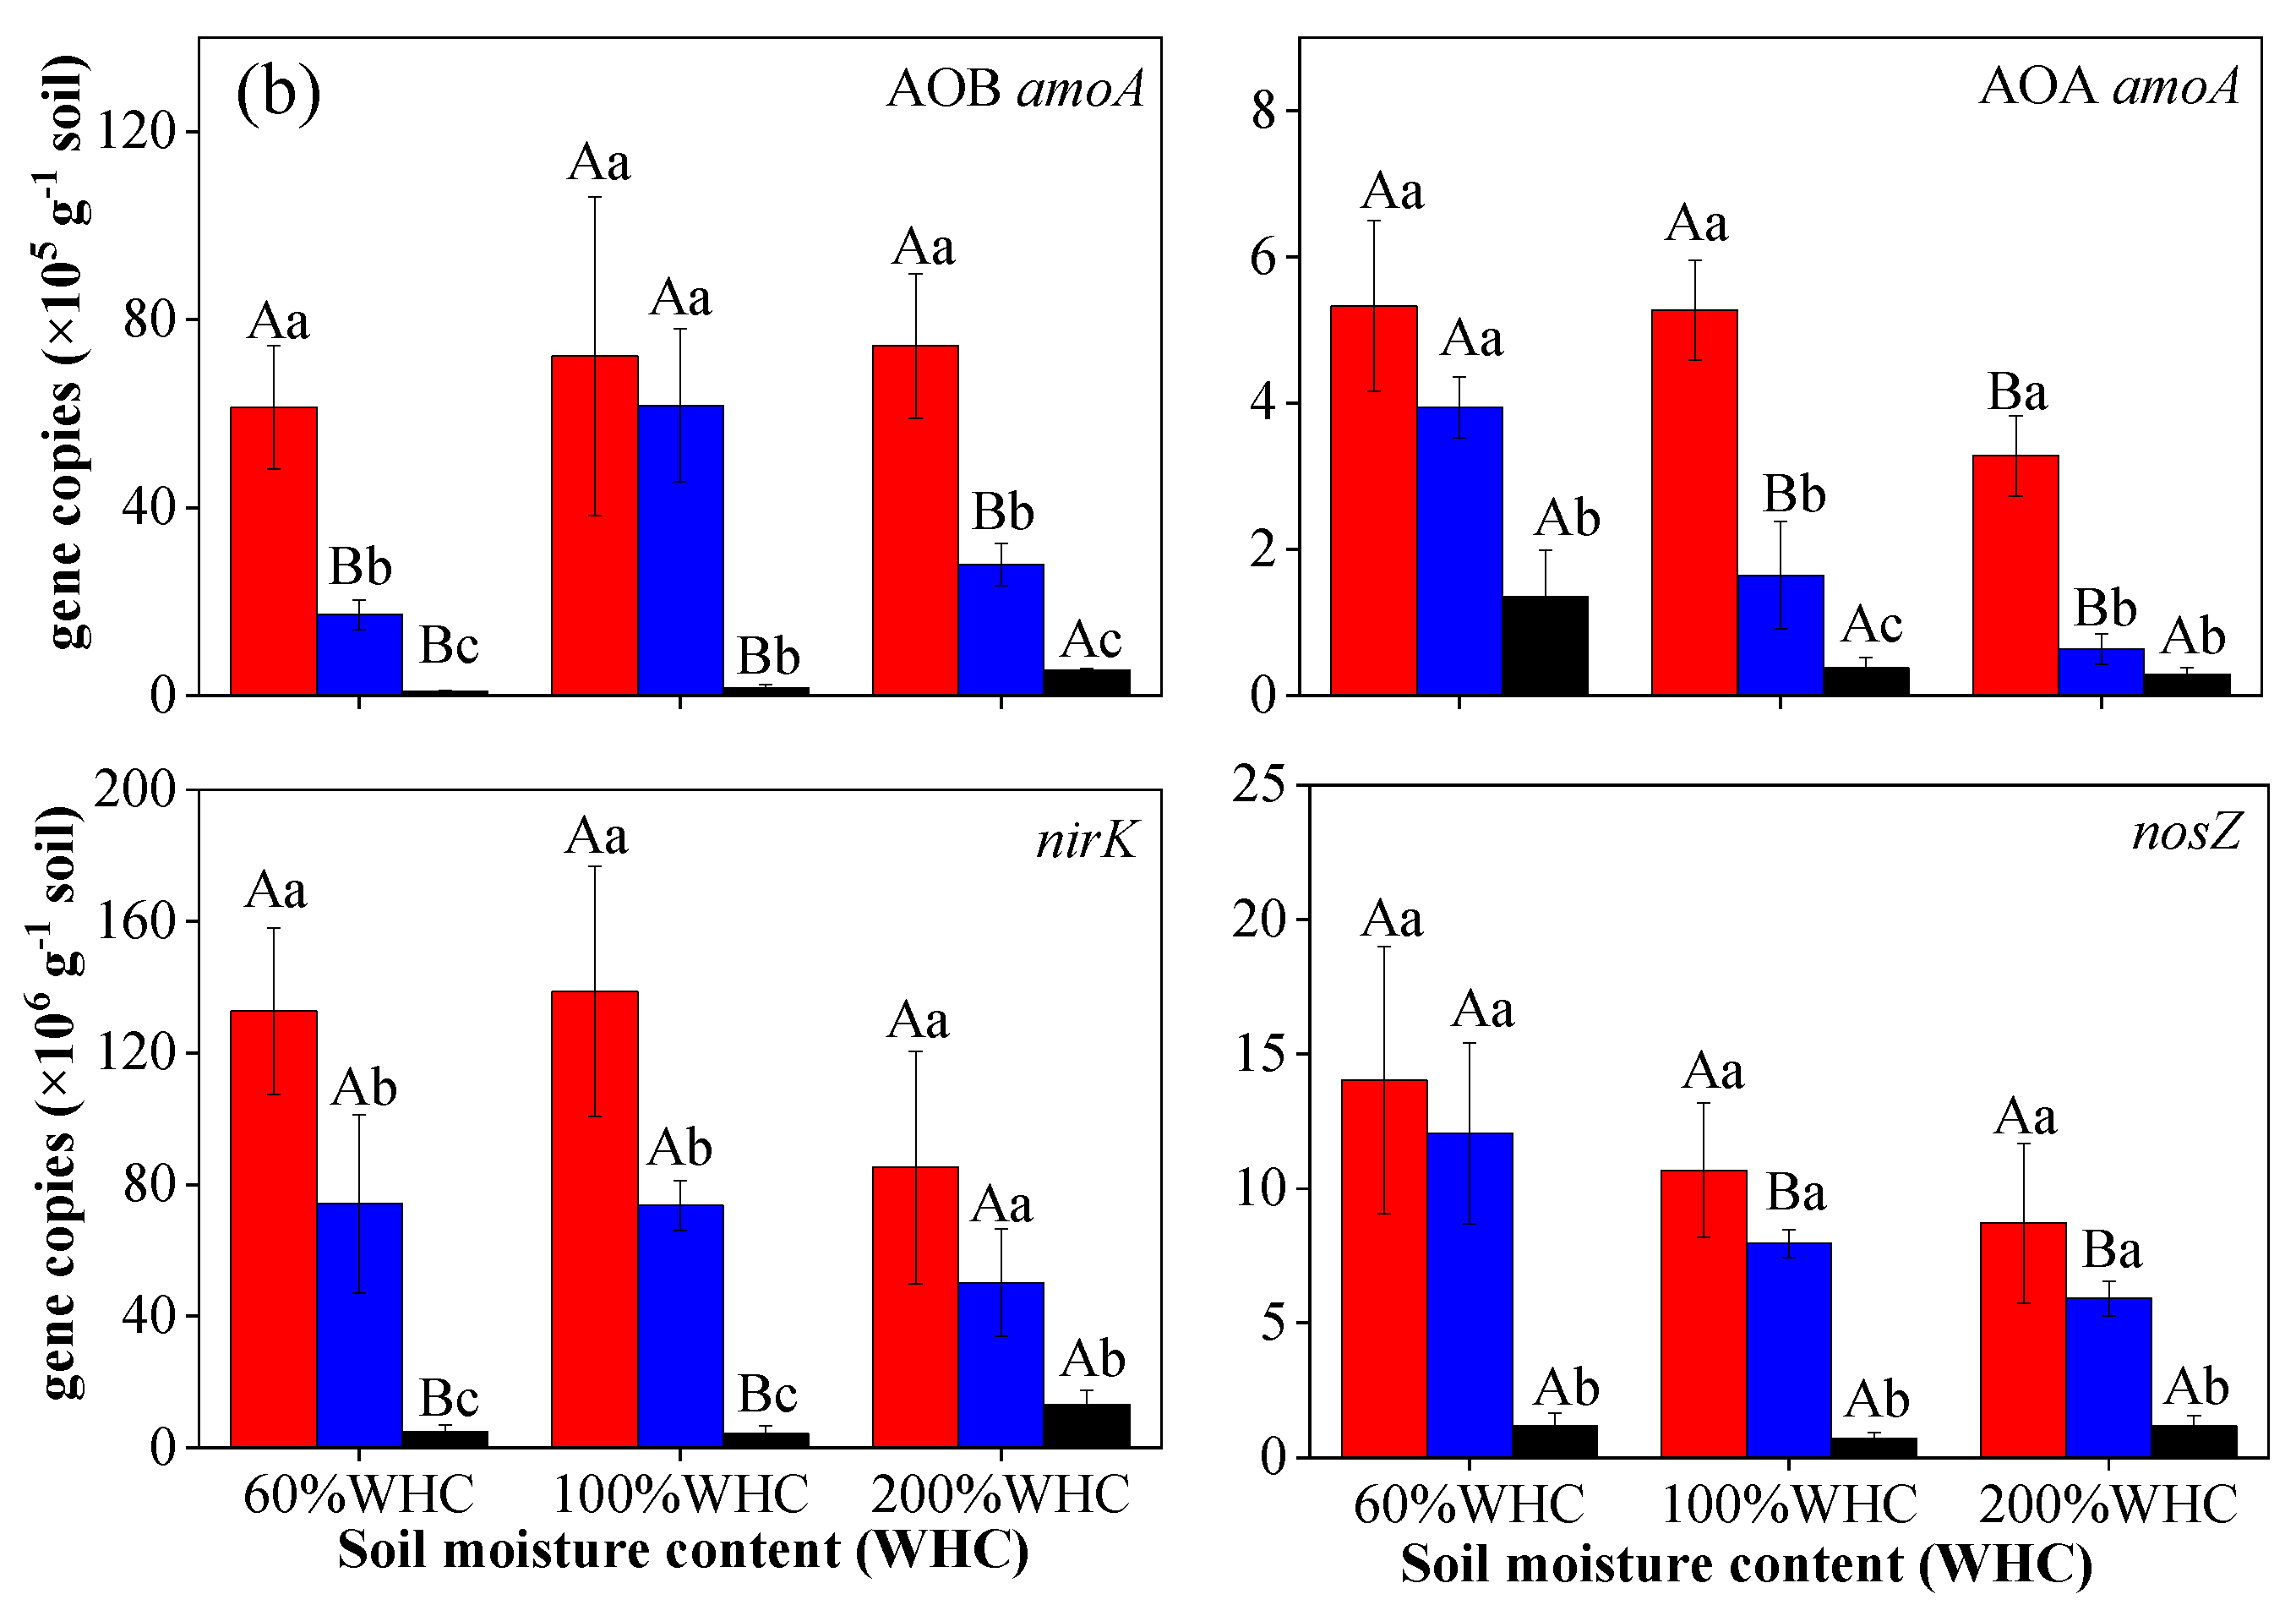
3.4. Abundance of AOA, AOB, nosZ, and nirK

The abundance of ammonia-oxidizing archaea (AOA) and ammonia-oxidizing bacteria (AOB) amoA genes in the two soils decreased with soil depth deepening (p < 0.05) (Table 2, Figure 6). The abundance of AOB and AOA amoA genes in gleyed paddy soil was much higher than in hydromorphic paddy soil (p < 0.05). The abundance of the AOB amoA gene was higher than that of the AOA amoA gene in both soils, and AOB/AOA ratio increased gradually with the increase of water contents, from 4.9 and 5.5 in 60% WHC treatment to 25.3 and 28.4 in 200% WHC treatment (Table S2).
The abundance of bacterial denitrification genes (nirK and nosZ) was also affected by soil depth, decreasing significantly with soil depth increasing (p < 0.05) (Table 2, Figure 6). The copies of nirK and nosZ genes in gleyed paddy soil were higher than those in hydromorphic paddy soil. The abundance of nirK was higher than that of nosZ in both soils. NirK/nosZ decreased significantly with soil depth increasing (Table S2).

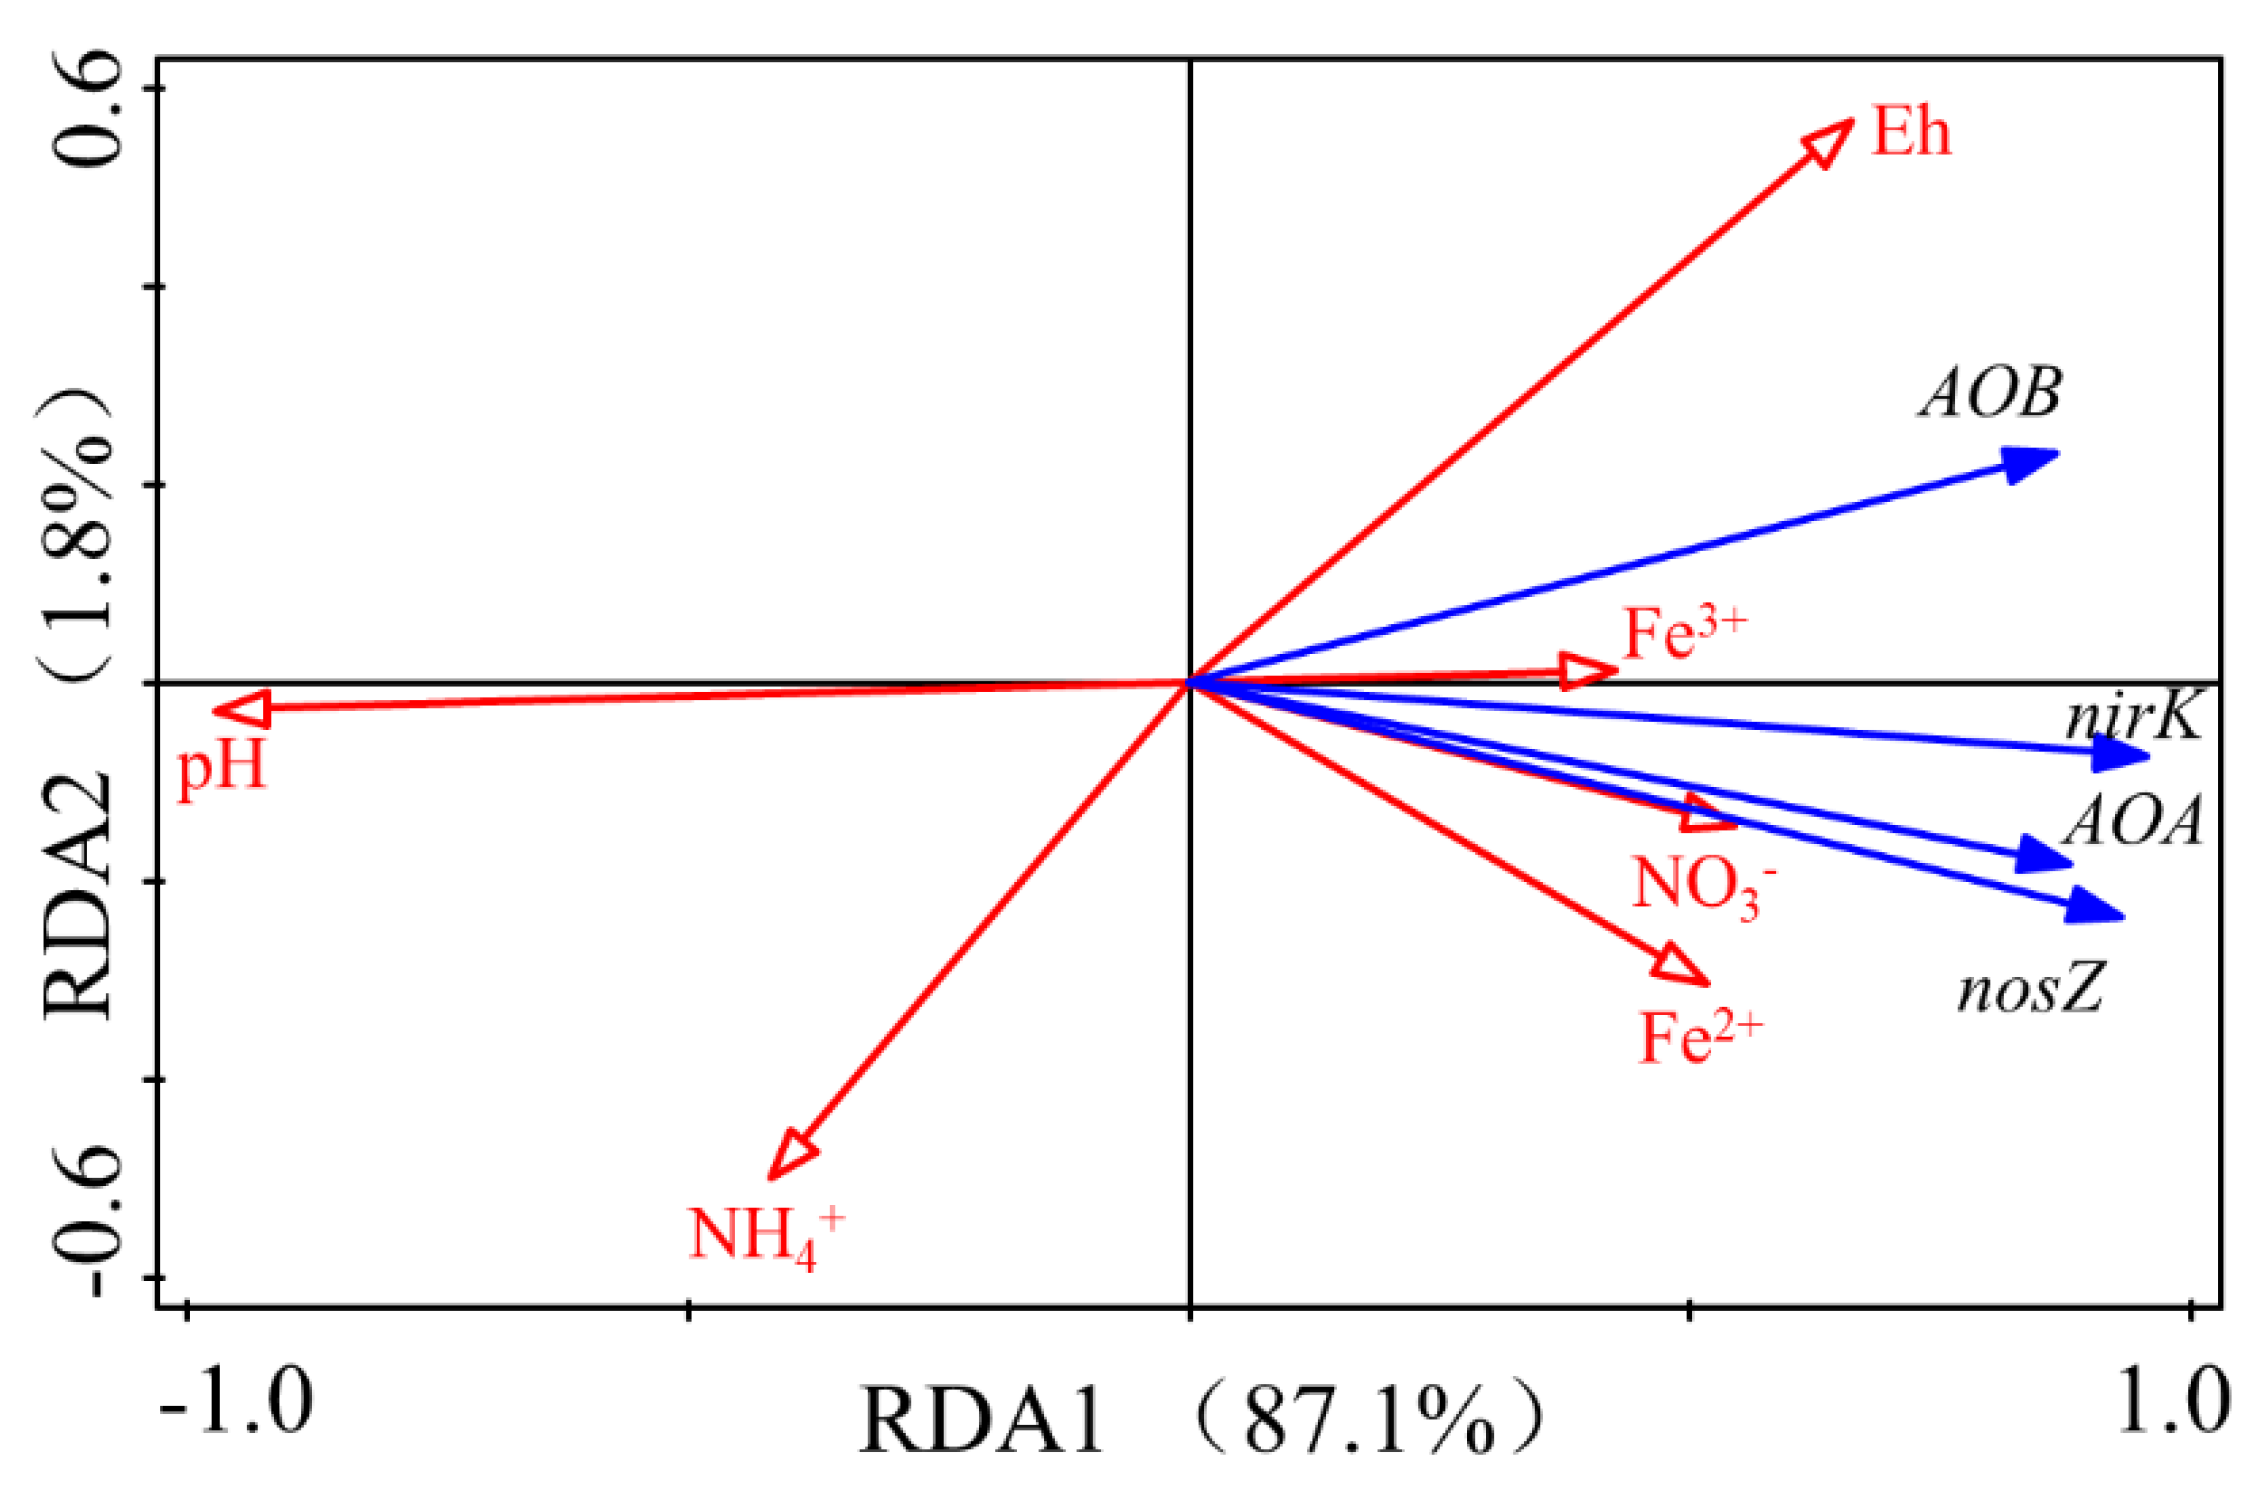
3.5. Correlation of Environmental Factors with N2O Emissions and the Abundance of Nitrifiers and Denitrifiers Genes

Soil depth and water content and their interaction had significant effects on N2O emissions from the two soils (Table 2). The N2O emissions were significantly correlated with contents of Fe2+, Fe3+, NH4+-N, and NO3-N, as well as pH and Eh, and also significantly positively correlated with the abundance of AOB amoA and nirK (p < 0.05) (Table 3). The AOB amoA and nirK genes were significantly correlated with Fe2+, Fe3+, NH4+-N, and NO3-N contents; nosZ gene was significantly correlated with Fe2+ and NO3-N contents (p < 0.05) (Table 3). Redundancy analysis showed that the first two axes of RDA revealed 88.9% of the variance in the abundance of AOB, AOA, and nirK and nosZ genes between the two soils. The Monte Carlo permutation test demonstrated that variation in the abundance of AOB, AOA, and nirK and nosZ genes was significantly influenced by the pH (81.9%, p = 0.002). (Figure 7, Table 4).

4. Discussion

Soil moisture is one of the most crucial environmental factors influencing the process of soil nitrification and denitrification, thus, affecting N2O emissions [39,40]. Generally, the increase of soil moisture content will reduce soil O2 content, make the soil anaerobic, increase the soil denitrification potential and rate, and slow down the nitrification process [41,42]. It is generally believed that the nitrification process is the significant pathway of N2O production under the water condition of 30–60% WFPS, while denitrification dominates the production of N2O when the WFPS is higher than 70% [43,44]. In this study, N2O emissions in the 100% and 200% WHC treatments were significantly higher than those under 60% WHC (Figure 1 and Figure 2), which might be due to the different sources of N2O generation under different water contents. N2O was produced primarily from denitrification in both soils’ 100% and 200% WHC treatments, while the N2O was produced mainly from nitrification in the 60% WHC treatment. The N2O emissions in the soil environment dominated by the nitrification process were far lower than that in the soil environment dominated by the denitrification process [43,45]. Under the condition of 60% WHC, the concentration of NO3--N in both soils continued to increase during the incubation time, while the concentration of NH4+-N decreased correspondingly, proving that nitrification occurred in this water content. However, under 200% WHC, NO3--N concentration showed a trend of first decreasing and then increasing, and the corresponding NH4+-N concentration showed the opposite trend. Those results were consistent with the research of Wang et al. [6], indicating that denitrification occurred at higher soil moisture (200% WHC) and was accompanied by the generation of N2O. In addition, the coupled nitrification–denitrification can occur at the aerobic–anaerobic interface, and NO2 or NO3 produced by nitrification can be directly used as substrates by the denitrifying microorganisms existing in the anaerobic or hypoxic microsites, thus producing N2O. Ma et al. [46] found that the contribution of coupled nitrification–denitrification to N2O emissions in paddy soil of 100% and 250% WHC were 11.5% and 6.7%, respectively. Therefore, in our study, coupled nitrification–denitrification might also occur in the two soils of 100% and 200% WHC.
The N2O emission of gleyed paddy soil was significantly higher than that of hydromorphic paddy soil, which was consistent with the copy numbers of functional genes for nitrification and denitrification in both soils, implying that the micro-ecological environment of the two soils resulted in a significantly different abundance of functional genes of nitrification and denitrification, thus leading to the different N2O emissions. The abundances of nitrifiers and denitrifiers in the gleyed paddy and hydromorphic paddy soil responded distinctively to soil moisture and layers, suggesting N transformation processes varied with different soil types. In both soils, the abundance of nitrifiers and denitrifiers were affected by soil depth (Table 2, Figure 6), indicating that soil layers were an essential factor influencing nitrifiers and denitrifiers’ abundance. Similarly, Antonio et al. [15] showed that soil layers significantly affected the abundance of nitrifiers and denitrifiers. We speculated that surface soil could promote diffusion and transport of nutrients in soils, providing microorganisms with key substrates, such as NH3, NO3, and soluble organic C. Soil pH can regulate N2O production directly through affecting microflora, particularly N-transforming bacteria. For example, it has long been recognized that nitrifiers are highly sensitive to pH. Ammonia is generally thought to be the substrate for both AOA and AOB, and its concentration exponentially declines with decreasing pH due to the ionization of ammonia to ammonium. In addition, the transcription of the nosZ gene and synthesis and functionality of N2O reductase is inhibited at acidic pH. In our study, the redundancy analysis (RDA) showed that the first two axes of RDA revealed 88.9% of the variance in the abundance of AOB, AOA, and nirK and nosZ genes between the two soils. The Monte Carlo permutation test demonstrated that the abundance of AOB, AOA, and nirK and nosZ genes was significantly influenced by the pH (81.9%, p = 0.002) (Table 4). Iron is a micronutrient essential for various critical enzymatic processes in most organisms. Extracellular iron metabolism is linked to the utilization of energy from the oxidation and reduction of iron that drives (wholly or in part) cell biosynthesis. In our study, Fe2+ and Fe3+ were positively correlated with the abundance of the four genes, indicating that Fe directly affected both nitrifying and denitrifying microorganisms in paddy soils.
Our results showed that soil layers were a key factor for N2O emissions from the two paddy soils with different water conditions, and higher N2O emissions were observed at surface layers. Due to long-term water management, that might be related to the differentiation of soil physicochemical properties and the nitrogen transformation function of microorganisms in different layers of paddy soils [15]. Generally, nitrification and denitrification are mainly driven by different functional microorganisms. The abundance of nitrogen transformation-related functional genes (AOB amoA, AOA amoA, nirK, and nosZ) all decreased with the increase of soil depth (Figure 6), which may be related to the decrease of soil inorganic nitrogen and water-soluble organic carbon contents with the deepening of soil layers [15,35]. We observed that both nitrifiers and denitrifiers showed the highest abundance in the 0–10 cm soil layer, consistent with the N2O emissions, indicating that N2O emission was related to nitrification and denitrification. This indication was supported the significant positive correlation between N2O emission and nitrifiers and denitrifiers (AOB amoA, AOA amoA, nirK, and nosZ) (Table 3). In addition, the abundance of AOB was higher than that of the AOA amoA gene, and the ratio of AOB/AOA amoA genes increased gradually with the increase of water contents, indicating that AOB is more adapted to higher soil water conditions [47]. The ratio of nirK/nosZ genes decreased significantly with soil depth increasing, which was consistent with the trend that N2O emissions decreased with the increase of soil depth, indicating that the structure of denitrification function microorganisms at different soil layers was different, which directly caused different N2O emissions. These results are in accordance with previous research, which reported close relationships between physicochemical factors and soil microbial abundances [47,48].
Paddy soil is mainly affected by water fluctuation, which leads to changes in soil moisture, redox, Fe and Mn oxides, pH, etc. The changes in physicochemical properties in the soil will further affect soil microbial communities and their nitrification and denitrification functions [31]. Fe can be utilized as terminal electron acceptors by many microorganisms, thus influencing microbial community structure and activities. Our results showed that the abundance of nitrifying and denitrifying microbial genes was significantly positively correlated with iron content, indicating that iron has an essential effect on nitrifying and denitrifying microbial activity. Moreover, Fe oxides in paddy soils are prone to causing redox changes; thus, Fe can be used as an electron donor or acceptor to participate in biological and abiotic processes of nitrification and denitrification. For example, Fe2+ affects N2O emissions in neutral soil through Fe oxidation coupling with the denitrification process [49,50]. Under the conditions of 100% and 200% WHC in the two soils, the Fe2+ contents in the corresponding soil layers showed a trend of rapid decreasing at first and then increasing during the initial stage, and decreasing slowly until the end of incubation, which indicated that the occurrence of NO3 reduction was coupled with Fe2+ oxidation process. Correlation analysis showed that Fe content was significantly correlated with N2O emissions, indicating that Fe had a critical effect on N2O emissions. Thus, in actual field management conditions, due to the different water conditions at different layers of paddy soils, the difference in N2O emissions caused by different biochemical factors of different layers should be considered when estimating N2O emissions.

5. Conclusions

The N2O emissions of gleyed paddy soil are significantly higher than that of hydromorphic paddy soil, which is related to the significant difference in the abundance of nitrification and denitrification function genes caused by the different micro-ecological environments of the two paddy soils. The main reasons for the significant difference in N2O emissions in different layers of paddy soils are the differences in physicochemical properties and the abundance of nitrogen transformation function genes in different layers. Fe plays a vital role in the distribution of nitrifying and denitrifying microorganisms and the N2O emissions. This study provides more theoretical support for evaluating the influencing factors of N2O emissions in agriculture practice.

Supplementary Materials

The following supporting information can be downloaded at: https://www.mdpi.com/article/10.3390/agronomy12030743/s1, Table S1: Primer information and reaction programs of quantitative PCR for selected functional genes; Table S2: The ratios of AOB/AOA and nirK/nosZ genes in hydromorphic and gleyed paddy soils after incubating for 21 days.

Author Contributions

Conceptualization, J.Z. (Jichao Zuo), H.H., J.Z. (Jun Zhu) and Q.F.; methodology, J.Z. (Jichao Zuo) and H.Z.; software, J.Z. (Jichao Zuo); validation, J.Z. (Jichao Zuo), H.H., J.Z. (Jun Zhu) and Q.F.; formal analysis, J.Z. (Jichao Zuo) and Q.F.; investigation, J.Z. (Jichao Zuo); resources, H.H., J.Z. (Jichao Zuo) and Q.F.; data curation, J.Z. (Jichao Zuo); writing—original draft preparation, J.Z. (Jichao Zuo); writing—review and editing, J.Z. (Jichao Zuo), H.H., J.Z. (Jun Zhu) and Q.F.; visualization, J.Z. (Jichao Zuo) and Q.F.; supervision, Q.F.; project administration, Q.F.; funding acquisition, Q.F., M.M. and A.T. All authors have read and agreed to the published version of the manuscript.

Funding

This research was funded by the National Natural Science Foundation of China (41771270; 42067020) and Jiangxi Provincial Water Conservancy Science and Technology Project (202223YBKT21, 202123YBKT19).

Institutional Review Board Statement

Not applicable.

Informed Consent Statement

Not applicable.

Data Availability Statement

Not applicable.

Conflicts of Interest

The authors declare no conflict of interest.

References

  1. IPCC. Refinement to the 2006 IPCC guidelines for National Greenhouse Gas Inventories, Advance version; Intergovernmental Panel on Climate Change IPCC: Geneva, Switzerland, 2019. [Google Scholar]
  2. Zou, J.W.; Huang, Y.; Zheng, X.H.; Wang, Y.S. Quantifying direct N2O emissions in paddy fields during rice growing season in mainland China: Dependence on water regime. Atmos. Environ. 2007, 41, 8030–8042. [Google Scholar] [CrossRef]
  3. Wang, Q.; Liu, Y.R.; Zhang, C.J.; Zhang, L.M.; Han, L.L.; Shen, J.P.; He, J.Z. Responses of soil nitrous oxide production and abundances and composition of associated microbial communities to nitrogen and water amendment. Biol. Fertil. Soils 2017, 53, 601–611. [Google Scholar] [CrossRef]
  4. Hoben, J.P.; Gehl, R.J.; Millar, N.; Grace, P.R.; Robertson, G.P. Nonlinear nitrous oxide (N2O) response to nitrogen fertilizer in on-farm corn crops of the US Midwest. Glob. Chang. Biol. 2011, 17, 1140–1152. [Google Scholar] [CrossRef]
  5. Liu, C.Y.; Wang, K.; Meng, S.X.; Zheng, X.H.; Zhou, Z.X.; Han, S.H.; Chen, D.; Yang, Z.P. Effects of irrigation, fertilization and crop straw management on nitrous oxide and nitric oxide emission from a wheat-maize rotation field in northern China. Agric. Ecosyst. Environ. 2012, 140, 226–233. [Google Scholar] [CrossRef]
  6. Wang, M.L.; Hu, R.G.; Zhao, J.S.; Kuzyakov, Y.; Liu, S.R. Iron oxidation affects nitrous oxide emissions via donating electrons to denitrification in paddy soils. Geoderma 2016, 271, 173–180. [Google Scholar] [CrossRef]
  7. Liu, Y.R.; Manuel, D.B.; Pankaj, T.; He, J.Z.; Brajesh, S. Species identity of biocrust-forming lichens drives the response of soil nitrogen cycle to altered precipitation frequency and nitrogen amendment. Soil Biol. Biochem. 2016, 96, 128–136. [Google Scholar] [CrossRef]
  8. Wrage, N.; Horn, M.A.; Well, R.; Müller, C.; Velthof, G.; Oenema, O. The role of nitrifier denitrification in the production of nitrous oxide revisited. Soil Biol. Biochem. 2018, 123, 3–16. [Google Scholar] [CrossRef]
  9. Butterbach, B.K.; Baggs, E.M.; Dannenmann, M.; Kiese, R.; Zechmeister, B.S. Review article: Nitrous oxide emissions from soils: How well do we understand the processes and their controls? Philos. Trans. R. Soc. B 2013, 368, 20130122. [Google Scholar] [CrossRef]
  10. Braker, G.; Conrad, R. Diversity, structure, and size of N2O-producing microbial communities in soils-what matters for their functioning? Adv. Appl. Microbiol. 2011, 75, 33–70. [Google Scholar]
  11. Baggs, E.M. Soil microbial sources of nitrous oxide: Recent advances in knowledge, emerging challenges and future direction. Curr. Opin. Environ. Sustain. 2011, 3, 321–327. [Google Scholar] [CrossRef]
  12. Cao, Z.H.; Huang, J.F.; Zhang, C.S.; Li, A.F. Soil quality evolution after land use change from paddy soil to vegetable land. Environ. Geochem. Health 2004, 26, 97–103. [Google Scholar] [CrossRef] [PubMed]
  13. Fu, Q.L.; Xi, R.Z.; Zhu, J.; Hu, H.Q.; Xing, Z.Q.; Zuo, J.C. The relative contribution of ammonia oxidizing bacteria and archaea to N2O emission from two paddy soils with different fertilizer N sources: A microcosm study. Geoderma 2020, 375, 114486. [Google Scholar] [CrossRef]
  14. Han, X.G.; Xu, C.C.; Nie, Y.X.; He, J.H.; Wang, W.J.; Deng, Q.; Shen, W.J. Seasonal variations in N2O emissions in a subtropical forest with exogenous nitrogen enrichment are predominately influenced by the abundances of soil nitrifiers and denitrifiers. J. Geophys. Res.-Biogeosci. 2019, 124, 3635–3651. [Google Scholar] [CrossRef]
  15. Antonio, C.H.; Jesus, G.L.; Eulogio, J.B. Distinct effect of nitrogen fertilization and soil depth on nitrous oxide emissions and nitrifiers and denitrifiers abundance. Biol. Fertil. Soils 2018, 54, 829–840. [Google Scholar]
  16. Chen, X.Q.; Zhou, J.M.; Wang, H.Y. Productivity and K-supplying power change by an eight-season potash application in different patterns on two paddy soils. Geoderma 2003, 115, 65–74. [Google Scholar] [CrossRef]
  17. Huang, L.L.; Jia, X.X.; Shao, M.A.; Chen, L.M.; Han, G.Z.; Zhang, G.L. Phases and rates of iron and magnetism changes during paddy soil development on calcareous marine sediment and acid Quaternary red-clay. Sci. Rep. 2018, 8, 444. [Google Scholar] [CrossRef] [Green Version]
  18. Li, Y.C.; Yu, S.; Strong, J.; Wang, H.L. Are the biogeochemical cycles of carbon, nitrogen, sulfur, and phosphorus driven by the “FeIII–FeII redox wheel” in dynamic redox environments? J. Soils Sediments 2012, 12, 683–693. [Google Scholar] [CrossRef]
  19. Zhu, B.X.; Cavazos, A.R.; Ostrom, N.E.; Horwath, W.R.; Glass, J.B. The importance of abiotic reactions for nitrous oxide production. Biogeochemistry 2015, 126, 251–267. [Google Scholar]
  20. Huang, X.R.; Zhu, B.X.; Horwath, W.R.; Faeflen, S.J.; Luo, H.Y.; Xin, X.P.; Jiang, X.J. Effect of iron oxide on nitrification in two agricultural soils with different pH. Biogeosciences 2016, 13, 5609–5617. [Google Scholar] [CrossRef] [Green Version]
  21. Zhu, X.; Silva, L.C.R.; Doane, T.A.; Horwath, W.R. Iron: The forgotten driver of nitrous oxide production in agricultural soil. PLoS ONE 2013, 8, e60146. [Google Scholar] [CrossRef] [Green Version]
  22. Senn, D.B.; Hemond, H.F. Nitrate controls on iron and arsenic in an urban lake. Science 2002, 296, 2373–2376. [Google Scholar] [CrossRef] [PubMed] [Green Version]
  23. Muehe, E.M.; Gerhardt, S.; Schink, B.; Kappler, A. Ecophysiology and the energetic benefit of mixotrophic Fe(II) oxidation by various strains of nitrate-reducing bacteria. FEMS Microbiol. Ecol. 2009, 70, 335–343. [Google Scholar] [CrossRef] [PubMed] [Green Version]
  24. Melton, E.D.; Schmidt, C.; Kappler, A. Microbial iron(II) oxidation in littoral freshwater lake sediment: The potential for competition between phototrophic vs. nitrate-reducing iron(II)-oxidizers. Front. Microbiol. 2012, 3, 197. [Google Scholar] [CrossRef] [PubMed] [Green Version]
  25. Sawayama, S. Possibility of anoxic ferric ammonium oxidation. J. Biosci. Bioeng. 2006, 101, 70–72. [Google Scholar] [CrossRef]
  26. Shrestha, J.; Rich, J.J.; Ehrenfeld, J.G.; Jaffe, P.R. Oxidation of ammonium to nitrite under iron-reducing conditions in wetland soils: Laboratory, field demonstrations, and push-pull rate determination. Soil Sci. 2009, 174, 156–164. [Google Scholar] [CrossRef]
  27. Yang, W.H.; Weber, K.A.; Silver, W.L. Nitrogen loss from soil through anaerobic ammonium oxidation coupled to iron re-duction. Nat. Geosci. 2012, 5, 538–541. [Google Scholar] [CrossRef] [Green Version]
  28. Shaw, L.J.; Nicol, G.W.; Smith, Z.; Fear, J.; Prosser, J.I.; Baggs, E.M. Nitrosospira spp. can produce nitrous oxide via a nitrifier denitrification pathway. Environ. Microbiol. 2006, 8, 214–222. [Google Scholar] [CrossRef]
  29. Kim, S.W.; Miyahara, M.; Fushinobu, S.; Wakagi, T.; Shoun, H. Nitrous oxide emission from nitrifying activated sludge de-pendent on denitrification by ammonia-oxidizing bacteria. Bioresour. Technol. 2010, 101, 3958–3963. [Google Scholar] [CrossRef]
  30. Hu, H.W.; Chen, D.; He, J.Z. Microbial regulation of terrestrial nitrous oxide formation: Understanding the biological pathways for prediction of emission rates. FEMS Microbiol. Rev. 2015, 39, 729–749. [Google Scholar] [CrossRef]
  31. Chen, S.M.; Wang, F.H.; Zhang, Y.M.; Qin, S.P.; Wei, S.C.; Wang, S.Q.; Hu, C.S.; Liu, B.B. Organic carbon availability limiting microbial denitrification in the deep vadose zone. Environ. Microbiol. 2018, 20, 980–992. [Google Scholar] [CrossRef] [Green Version]
  32. Deirdre, B.G.; Christoph, M.; Samiran, B.; Wei, M.; Steven, D.S.; Daniel, V.M. Response of ammonia oxidizing archaea and bacteria to changing water filled pore space. Soil Biol. Biochem. 2010, 42, 1888–1891. [Google Scholar]
  33. Hu, H.W.; Macdonald, C.A.; Trivedi, P.; Holmes, B.; Bodrossy, L.; He, J.Z.; Singh, B.K. Water addition regulates the metabolic activity of ammonia oxidizers responding to environmental perturbations in dry subhumid ecosystems. Environ. Microbiol. 2014, 17, 444–461. [Google Scholar] [CrossRef] [PubMed]
  34. Banerjee, S.; Helgason, B.; Wang, L.; Winsley, T.; Ferrari, B.C.; Siciliano, S.D. Legacy effects of soil moisture on microbial community structure and N2O emissions. Soil Biol. Biochem. 2016, 95, 40–50. [Google Scholar] [CrossRef]
  35. Liu, Y.; Li, C.; Nelson, W.C.; Shi, L.; Xu, F.; Liu, Y.; Yan, A.; Zhong, L.; Thompson, C.J.; Fredrickson, J.K.; et al. Effect of water chemistry and hydrodynamics on nitrogen transformation activity and microbial community functional potential in hyporheic zone sediment columns. Environ. Sci. Technol. 2017, 51, 4877–4886. [Google Scholar] [CrossRef]
  36. Cawse, P.A. The determination of nitrate in soil solutions by ultraviolet spectrophotometry. Analyst 1967, 92, 311–315. [Google Scholar] [CrossRef]
  37. Scheiner, D. Determination of ammonia and kjeldahl nitrogen by indophenol method. Water Res. 1976, 10, 31–36. [Google Scholar] [CrossRef]
  38. Viollier, E.; Inglett, P.W.; Hunter, K.; Roychoudhury, A.N.; Van, C.P. The ferrozine method revisited: Fe(II)/Fe(III) determina-tion in natural waters. Appl. Geochem. 2000, 15, 785–790. [Google Scholar] [CrossRef]
  39. Cheng, Y.; Wang, J.; Wang, S.Q.; Zhang, J.B.; Cai, Z.C. Effects of soil moisture on gross N transformations and N2O emission in acid subtropical forest soils. Biol. Fertil. Soils 2014, 50, 1099–1108. [Google Scholar] [CrossRef]
  40. Wu, L.; Tang, S.R.; He, D.R.; Wu, X.; Shaaban, M.; Wang, M.L.; Zhao, J.S.; Khan, I.; Zheng, X.H.; Hu, R.G. Conversion from rice to vegetable production increases N2O emission via increased soil organic matter mineralization. Sci. Total Environ. 2017, 583, 190–201. [Google Scholar] [CrossRef]
  41. Bateman, E.J.; Baggs, E.M. Contributions of nitrification and denitrification to N2O emissions from soils at different water-filled pore space. Biol. Fertil. Soils 2005, 41, 379–388. [Google Scholar] [CrossRef]
  42. Liu, R.; Helen, H.; Suter, H.; Hu, H.W.; Chen, D. The effect of temperature and moisture on the source of N2O and contributions from ammonia oxidizers in an agricultural soil. Biol. Fertil. Soils 2016, 53, 141–152. [Google Scholar] [CrossRef]
  43. Kool, D.M.; Dolfing, J.; Wrage, N.; Groenigen, J.W.V. Nitrifier denitrification as a distinct and significant source of nitrous oxide from soil. Soil. Biol. Biochem. 2011, 43, 174–178. [Google Scholar] [CrossRef]
  44. Huang, T.; Gao, B.; Hu, X.K.; Lu, X.; Well, R.; Christie, P.; Bakken, L.R.; Ju, X.T. Ammonia-oxidation as an engine to generate nitrous oxide in an intensively managed calcareous Fluvo-aquic soil. Sci. Rep. 2014, 4, 3950. [Google Scholar] [CrossRef] [PubMed]
  45. Wang, M.L.; Hu, R.G.; Ruser, R.; Schmidt, C.; Kappler, A. The role of chemodenitrification for N2O emissions from nitrate reduction in rice paddy soils. ACS Earth Space Chem. 2020, 4, 122–132. [Google Scholar] [CrossRef]
  46. Ma, L.; Cheng, Y.; Wang, J.Y.; Yan, X.Y. Mechanical insights into the effect of fluctuation in soil moisture on nitrous oxide emissions from paddy soil. Paddy Water Environ. 2017, 15, 359–369. [Google Scholar] [CrossRef]
  47. Zhang, Y.; Ji, G.D.; Wang, C.; Zhang, X.R.; Xu, M. Importance of denitrification driven by the relative abundances of microbial communities in coastal wetlands. Environ. Pollut. 2018, 244, 47–54. [Google Scholar] [CrossRef]
  48. Kim, H.; Bae, H.S.; Reddy, K.R.; Ogram, A. Distributions, abundances and activities of microbes associated with the nitrogen cycle in riparian and stream sediments of a river tributary. Water Res. 2016, 106, 51–61. [Google Scholar] [CrossRef] [Green Version]
  49. Klueglein, N.; Kappler, A. Abiotic oxidation of Fe(II) by reactive nitrogen species in cultures of the nitrate-reducing Fe(II) oxi-dizer Acidovorax sp. BoFeN1—Questioning the existence of enzymatic Fe(II) oxidation. Geobiology 2013, 11, 180–190. [Google Scholar] [CrossRef]
  50. Zuo, J.C.; Hu, H.Q.; Fu, Q.L.; Zhu, J.; Xing, Z.Q. Biological-chemical comprehensive effects of goethite addition on nitrous oxide emissions in paddy soils. J. Soils Sediments 2020, 20, 3580–3590. [Google Scholar] [CrossRef]
Figure 1. Effects of soil layers (0–10, 10–20, and 20–40 cm) and soil moisture (60%, 100%, and 200% WHC) on N2O emission rate in hydromorphic (a) and gleyed (b) paddy soils. Values are the means of three replicates, and the error bars represent standard errors.
Agronomy 12 00743 g001
Figure 2. Effects of soil layers (0−10, 10−20, and 20−40 cm) and soil moisture (60%, 100%, and 200% WHC) on cumulative N2O emissions in hydromorphic (a) and gleyed (b) paddy soils. Values are the means of three replicates, and the error bars represent standard errors. Different capital letters above the columns denote significant difference between soil moisture for a given depth at p < 0.05. Different lowercase letters above the columns denote significant difference between soil depth for a given moisture at p < 0.05.
Agronomy 12 00743 g002
Figure 3. The dynamic changes of NO3-N contents in hydromorphic (a) and gleyed (b) paddy soils at three soil moisture levels during 21-day incubation. The values represent the mean of three replicates, and the error bars represent standard errors.
Agronomy 12 00743 g003
Figure 4. The dynamic changes of NH4+-N contents in hydromorphic (a) and gleyed (b) paddy soils at three soil moisture levels during 21-day incubation. The values represent the mean of three replicates, and the error bars represent standard errors.
Agronomy 12 00743 g004
Figure 5. The concentrations of Fe2+ and Fe3+ during the incubation in hydromorphic (a,c) and gleyed (b,d) paddy soils with and without goethite addition. The values represent the mean of three replicates, and the error bars represent standard errors.
Agronomy 12 00743 g005aAgronomy 12 00743 g005b
Figure 6. Effects of soil layers (0–10, 10–20, and 20–40 cm) and soil moisture (60%, 100%, and 200% WHC) on the abundance of AOA, AOB, and nirK and nosZ genes in hydromorphic (a) and gleyed (b) paddy soils after incubating for 21 days. Values are means of three replicates, and the error bars represent standard errors. Different capital letters above the columns denote significant difference between soil moisture for a given depth at p < 0.05. Different lowercase letters above the columns denote significant difference between soil depth for a given moisture at p < 0.05.
Agronomy 12 00743 g006aAgronomy 12 00743 g006b
Figure 7. Redundancy analysis (RDA) result for AOA, AOB, nirK and nosZ gene abundance, and other properties in the two paddy soils.
Agronomy 12 00743 g007
Table 1. The geochemical properties of the two paddy soils.
Soil Types and LayerspHSOM
(g kg−1)
NH4+-N
(mg kg−1)
NO3-N
(mg kg−1)
Bulk Density
(g cm−3)
Total Fe
(g kg−1)
HCl-Extractable Fe
(g kg−1)
Hydromorphic paddy soil0–10 cm6.8 b
(0.02)
20.8 bc
(0.43)
39.5 a
(0.65)
8.4 b
(0.87)
1.46 b
(0.04)
31.5 b
(0.50)
2.2 b
(0.09)
10–20 cm6.9 b
(0.06)
18.7 c
(0.78)
28.4 c
(0.55)
8.1 b
(0.58)
1.54 ab
(0.02)
33.0 a
(0.18)
3.1 a
(0.15)
20–40 cm7.0 a
(0.01)
7.3 d
(1.05)
11.2 e
(0.39)
3.9 c
(0.32)
1.61 a
(0.03)
26.4 d
(0.29)
0.4 d
(0.04)
Gleyed
paddy soil
0–10 cm6.1 e
(0.06)
27.1 a
(2.07)
34.2 b
(0.97)
14.8 a
(0.43)
1.15 d
(0.01)
26.8 d
(0.18)
1.8 c
(0.13)
10–20 cm6.3 d
(0.03)
23.2 b
(2.31)
22.5 d
(0.19)
9.6 b
(0.37)
1.34 c
(0.01)
30.7 c
(0.47)
3.1 a
(0.21)
20–40 cm6.6 c
(0.09)
7.1 d
(0.88)
10.0 e
(1.21)
5.6 c
(0.67)
1.45 b
(0.06)
33.4 a
(0.69)
0.10 e
(0.01)
Standard errors (n = 3 replicate samples) are shown in parentheses. Different letters represent statistically significant differences between treatments at p < 0.05.
Table 2. Summary for the two-way ANOVA on N2O emission and AOB, AOA, and nirK and nosZ gene abundance for the two factors (soil moisture and soil depth) in the two paddy soils.
FactorsN2OAOB amoAAOA amoAnirKnosZ
Water˂0.0010.016˂0.0010.0120.335
Soil layers˂0.001˂0.001˂0.001˂0.001˂0.001
Water × Soil layers˂0.0010.297˂0.0010.475˂0.565
p ˂ 0.05 means there are significant differences between treatments.
Table 3. Correlation between N2O and measured environmental factors in the two paddy soils.
N2O Total EmissionNH4+-NNO3--NFe2+Fe3+pHEhAOBAOAnirKnosZ
N2O total emission
NH4+-N−0.563 **
NO3-N0.375 **−0.290 *
Fe2+0.516 **−0.465 **0.703 **
Fe3+0.360 **−0.446 **0.706 **0.937 **
pH−0.842 **0.424 **−0.418 **−0.477 **−0.265
Eh0.753 **−0.278 *0.312 *0.409 **0.185−0.931 **
AOB0.742 **−0.419 **0.640 **0.535 **0.369 **−0.815 **0.724 **
AOA0.277 *0.0230.756 **0.487 **0.394 **−0.489 **0.453 **0.661 **
nirK0.491 **−0.1110.668 **0.523 **0.373 **−0.695 **0.614 **0.778 **0.888 **
nosZ0.336 *−0.0350.638 **0.650 **0.517 **−0.556 **0.536 **0.649 **0.874 **0.906 **
(n = 54). * p < 0.05; ** p < 0.01.
Table 4. Redundancy analysis (RDA) through Monte Carlo permutation test for the effects of soil properties on AOA, AOB, and nirK and nosZ gene abundance.
Explains %Pseudo-Fp
pH81.972.60.002
Eh2.22.10.146
NO310.90.326
Fe3+3.23.60.078
NH4+0.50.50.592
Fe2+0.20.20.79
The data in bold indicated that the effect was significant.
Publisher’s Note: MDPI stays neutral with regard to jurisdictional claims in published maps and institutional affiliations.

