
Primary Mechanical Modification to Improve Performance of Miscanthus as Stand-Alone Growing Substrates

 ,
,  ,
,
Abstract
:1. Introduction
2. Materials and Methods
2.1. Substrate Preparation and General Substrate Properties
2.2. Substrate Particle Size and Shape Distribution

| Parameter (Camsizer’s Parameter) | Definition [38] |
|---|---|
| Particle size | |
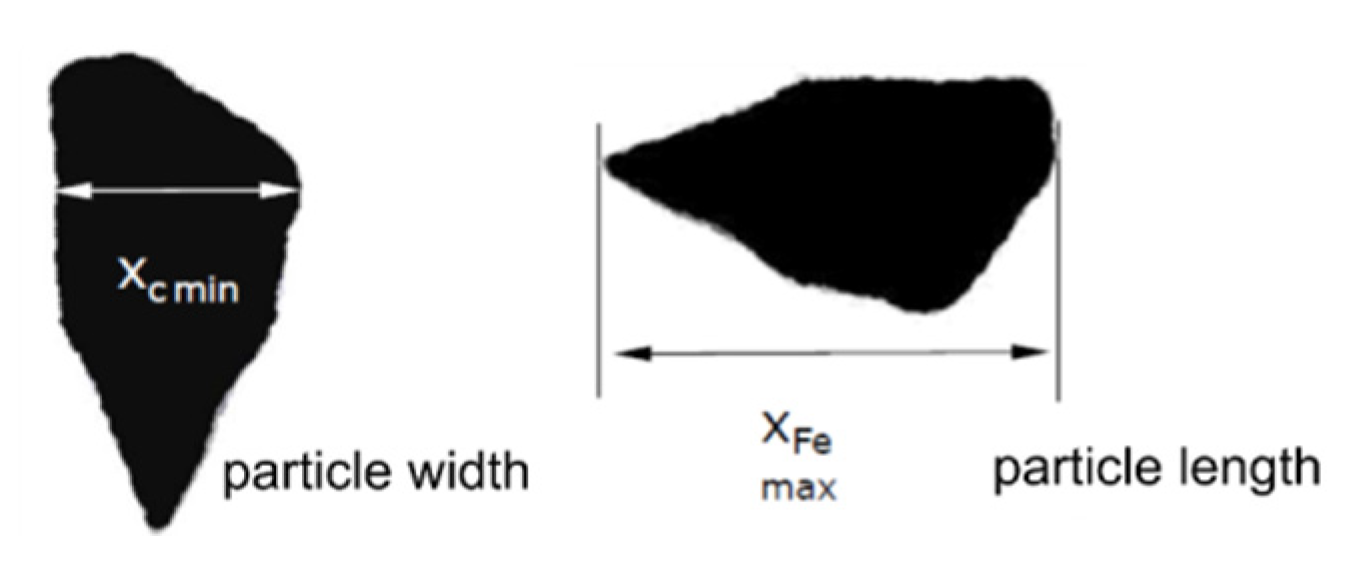
| Particle width (xcmin) | The shortest chord diameter of the measured set of maximum chords of a particle projection. |
| Particle length (xFemax) | The longest Feret diameter of the measured set of Feret diameter of a particle projection. |
| Percentile values d10, d50, d90 | The value of particle size when the proportion of particles with size smaller than that value is 10, 50, and 90%, respectively. |
| Non-uniformity (U3) | It indicates homogeneity of particle size distribution. |
| Specific surface (Sv) | The ratio of surface of all particles and volume of all particles. |
| Particle shape | |
| Aspect ratio (b/l) | (0 < b/l ≤ 1) The ratio of particle width to particle length of a particle projection. It is a measurement of particle elongation (a perfect circle has b/l value of 1). |
| Sphericity (SPHT) | (0 < SPHT ≤ 1) (P: measured perimeter of a particle projection, A: measured area covered by a particle projection) It is an indicator of surface roughness (an ideal sphere has SPHT value of 1) [42,43]. |
| Convexity (Conv) | (0 < Conv ≤ 1) The ratio of the real area (Areal) of a particle projection to its convex hull (Aconvex) (an imaginary elastic band stretched around the particle projection). It indicates the particle edge roughness (particle with very smooth surface has Conv value of 1) [41]. |
| Symmetry (Symm) | (0 < Symm ≤ 1) A measure of the eccentricity of the particle image by determining the centroid of particle projection, then calculating the minimum ratio of two opposing semi axes (r1, r2) through the centroid point (a symmetrical shape has Symm value of 1). |

2.3. Substrate Hydrological Properties: Porosity and Wettability
2.4. pH Buffering Capacity
2.5. N Immobilization
2.6. Substrate Performance as Growing Substrate for Chinese Cabbage Seedlings
2.7. Statistical Analysis
3. Results
3.1. General Substrate Properties
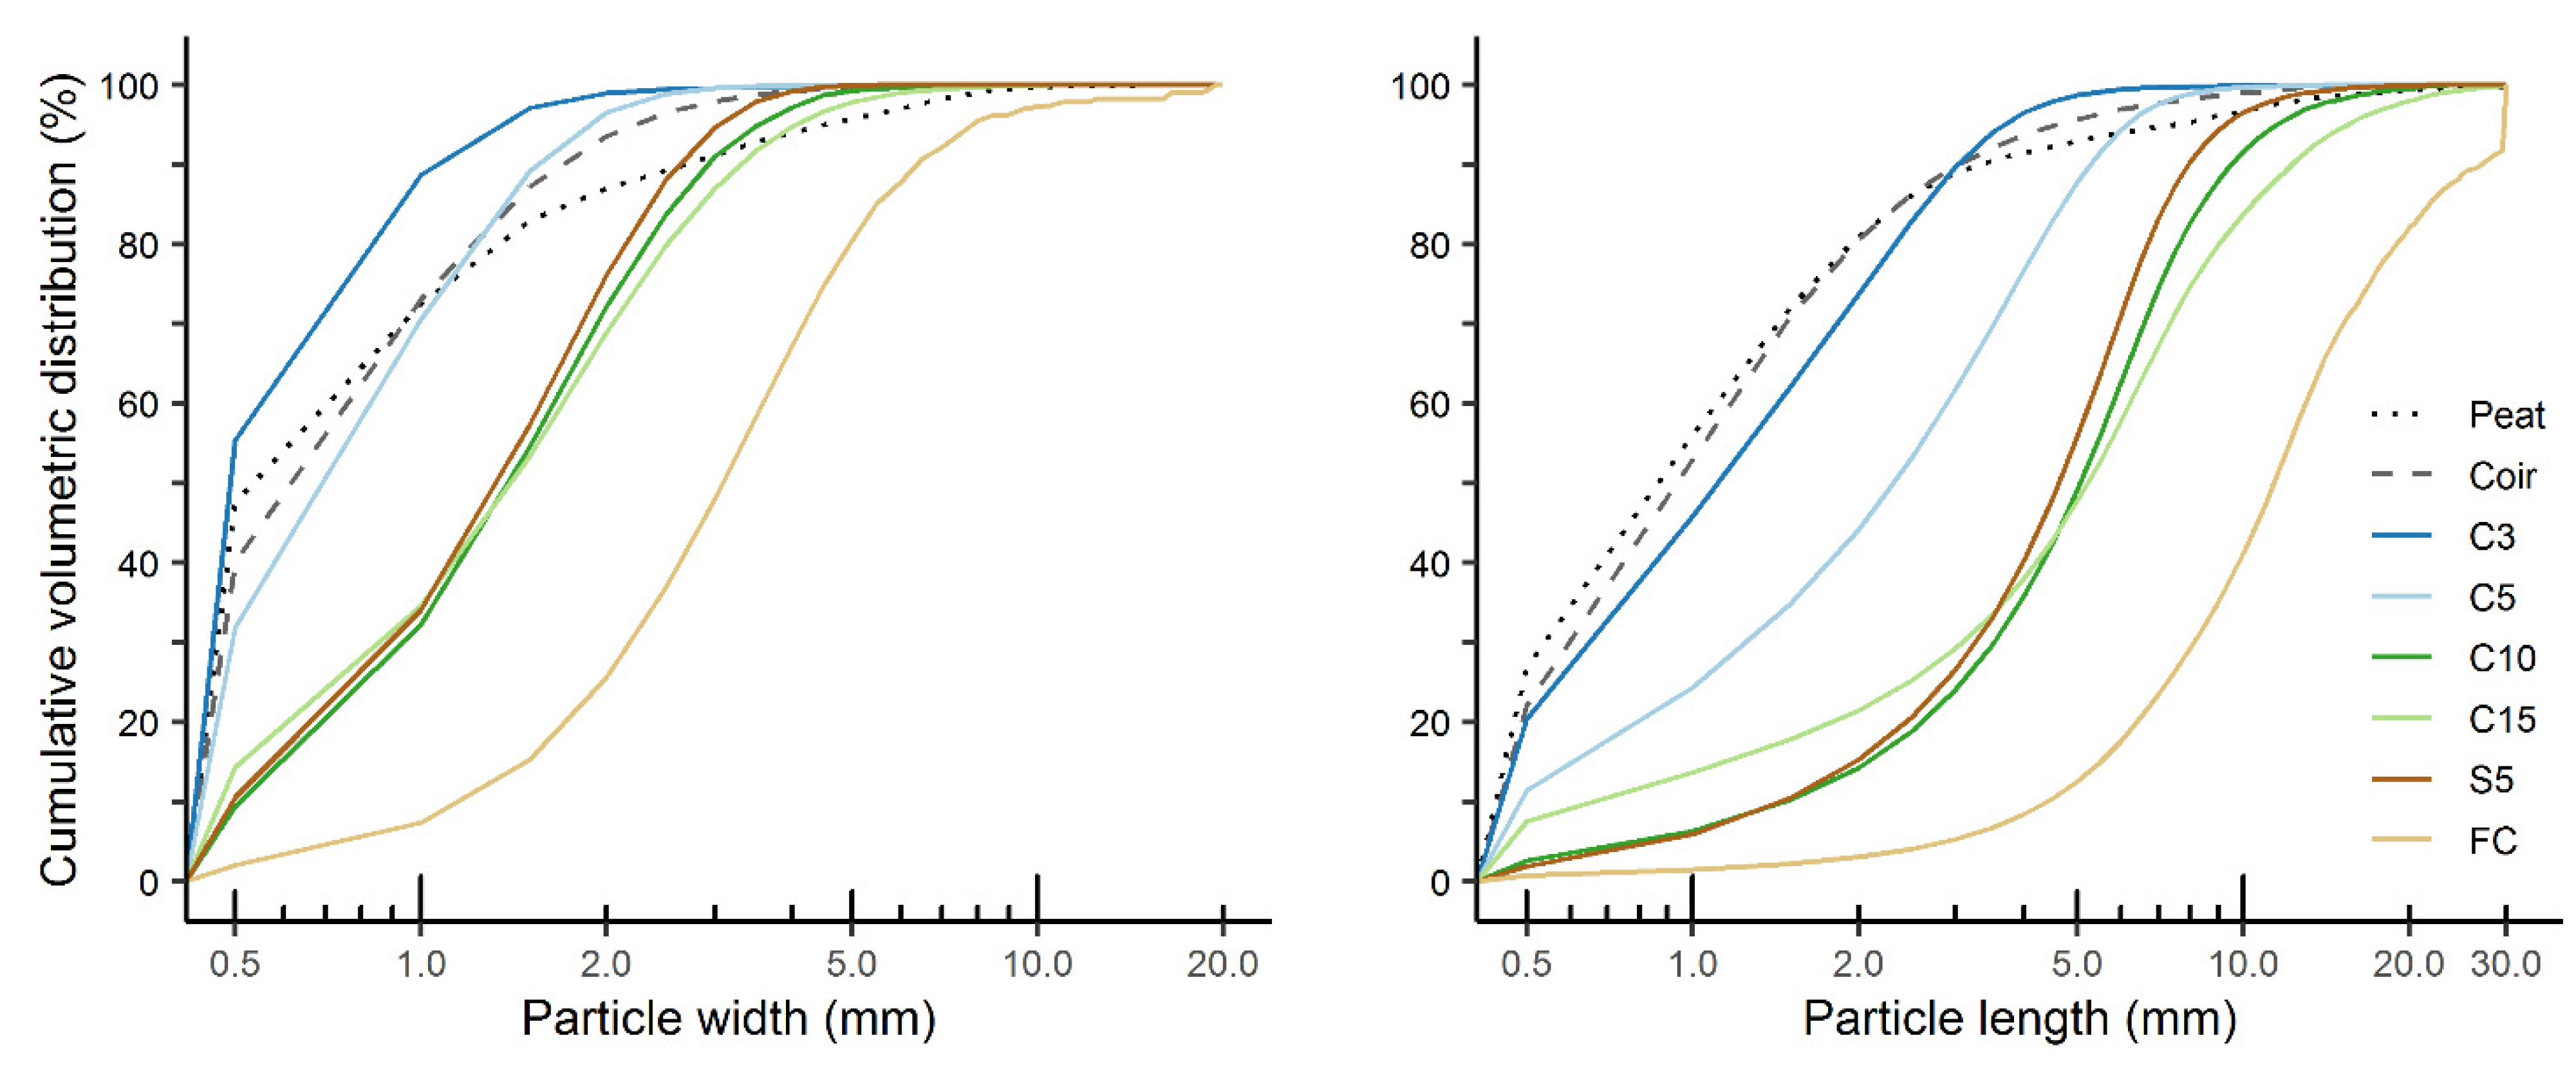
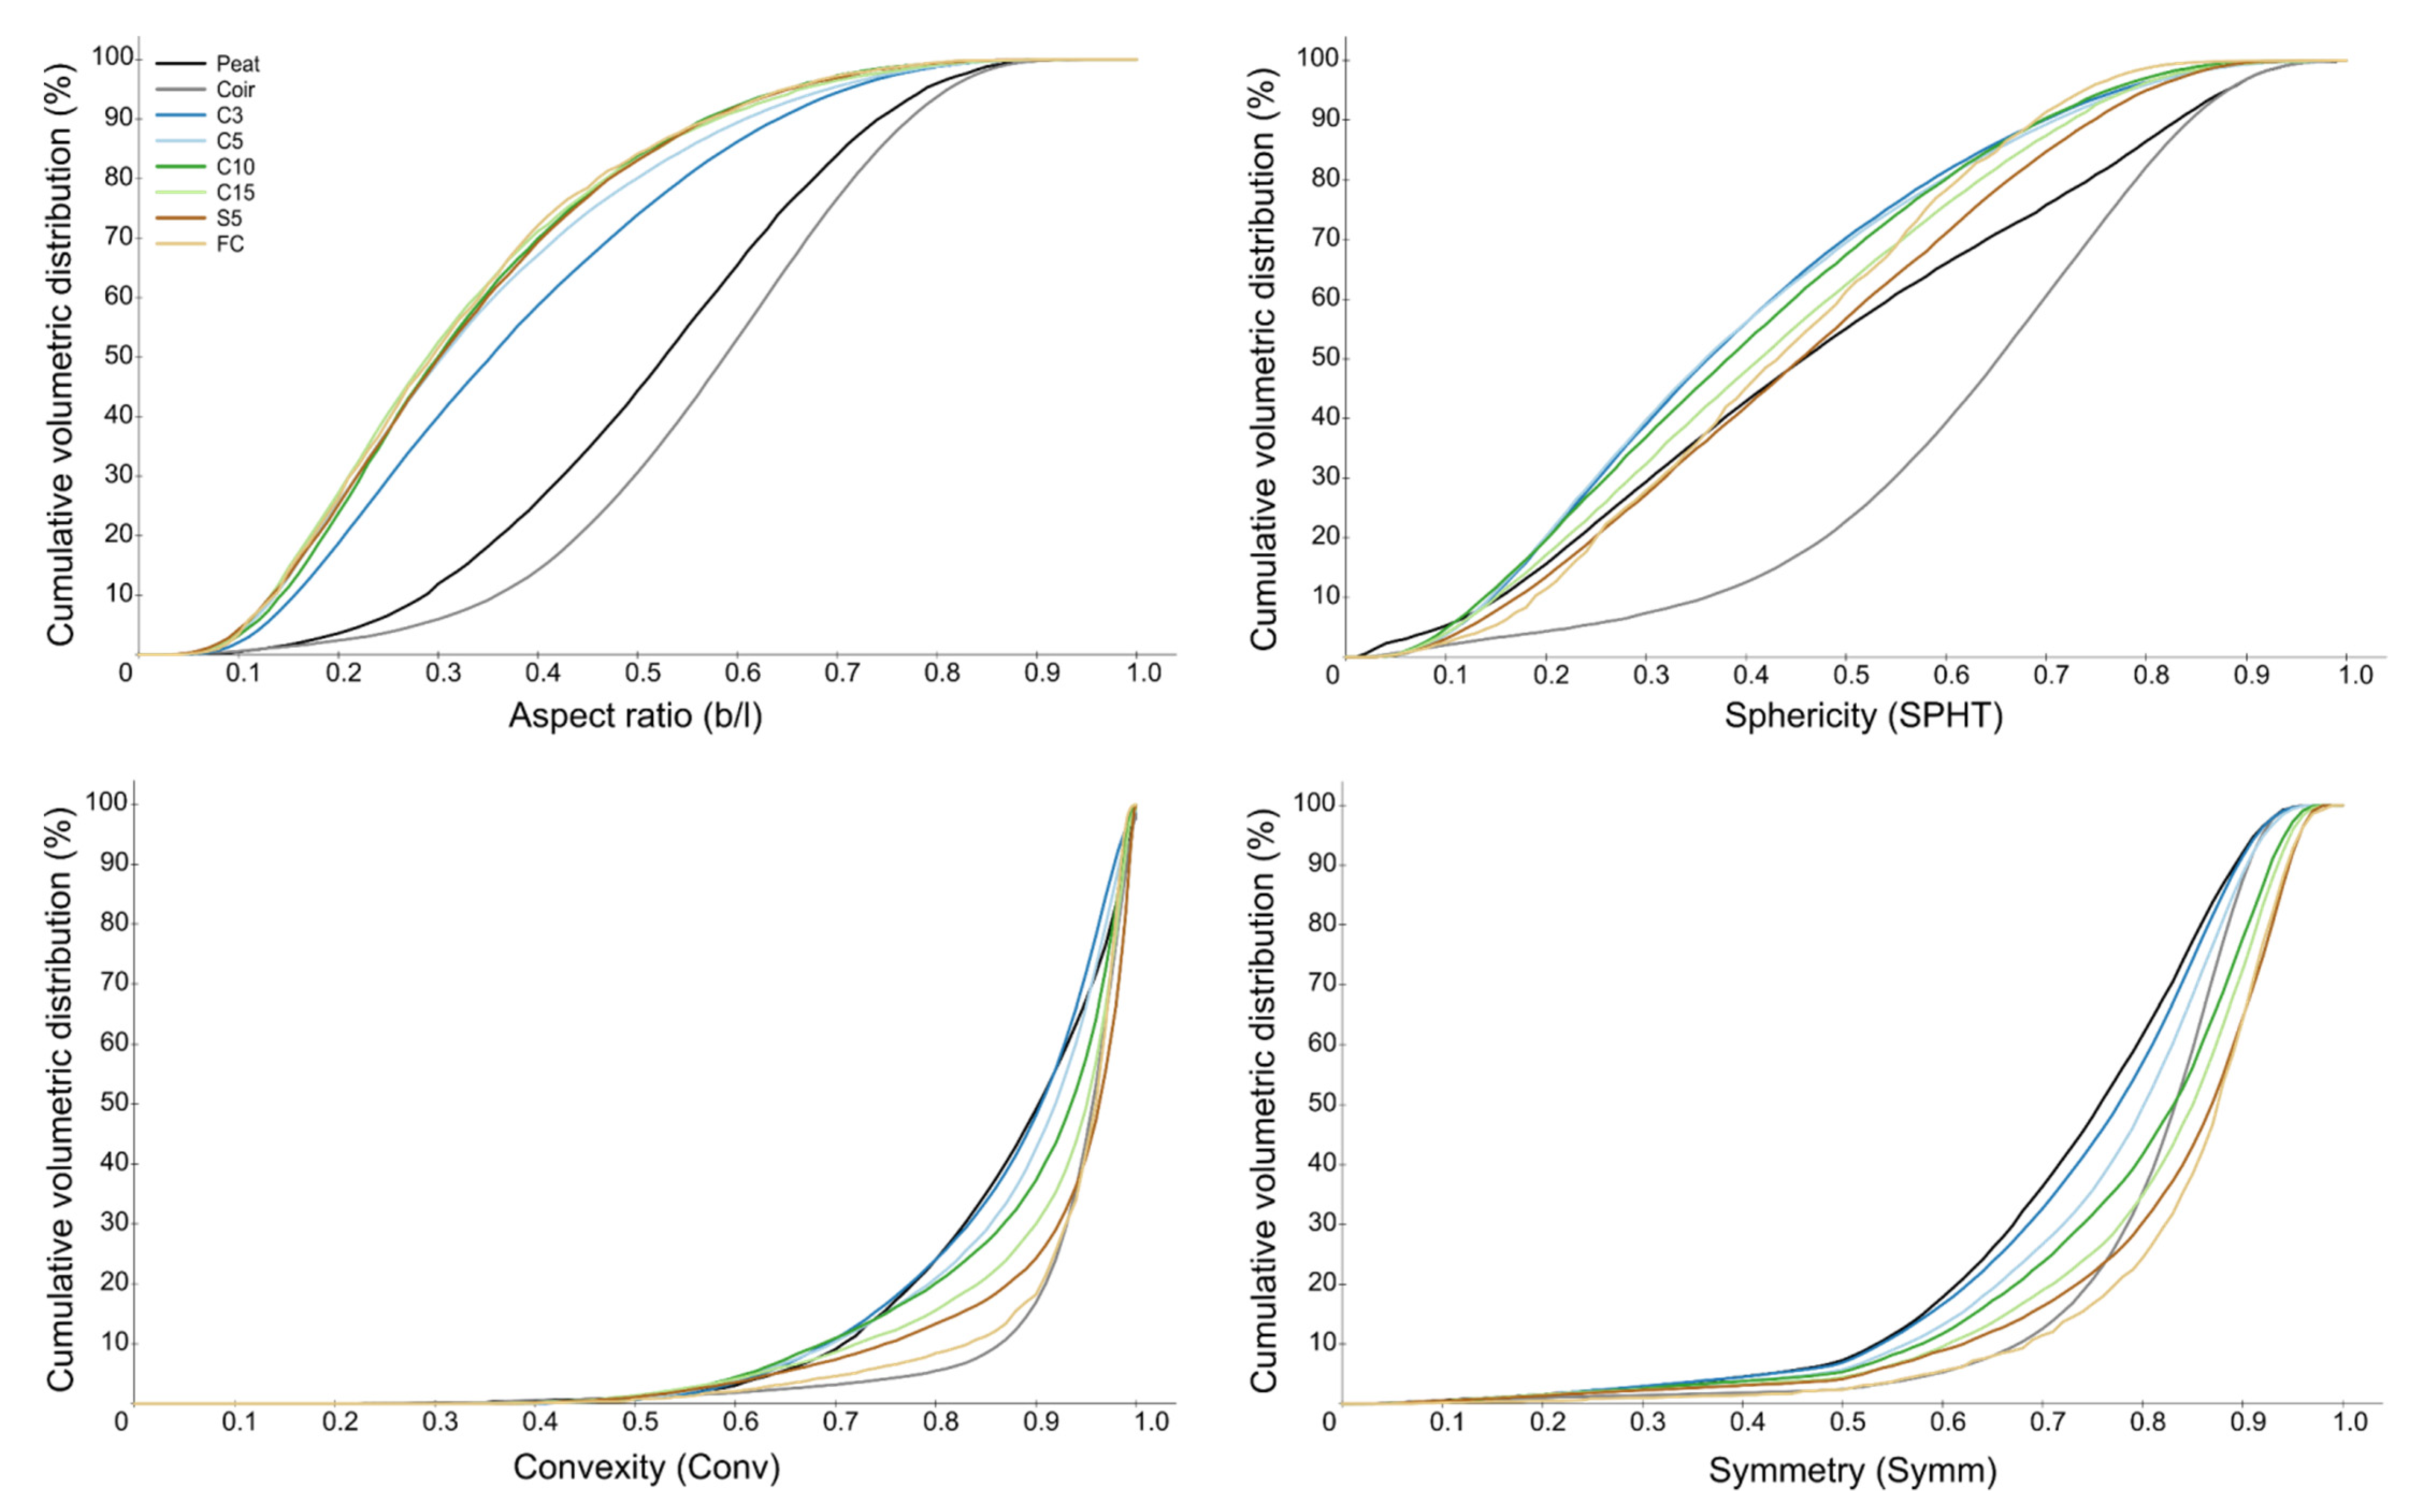
3.2. Substrate Particle Size and Shape Distribution
3.3. Substrate Hydrological Properties: Porosity and Wettability
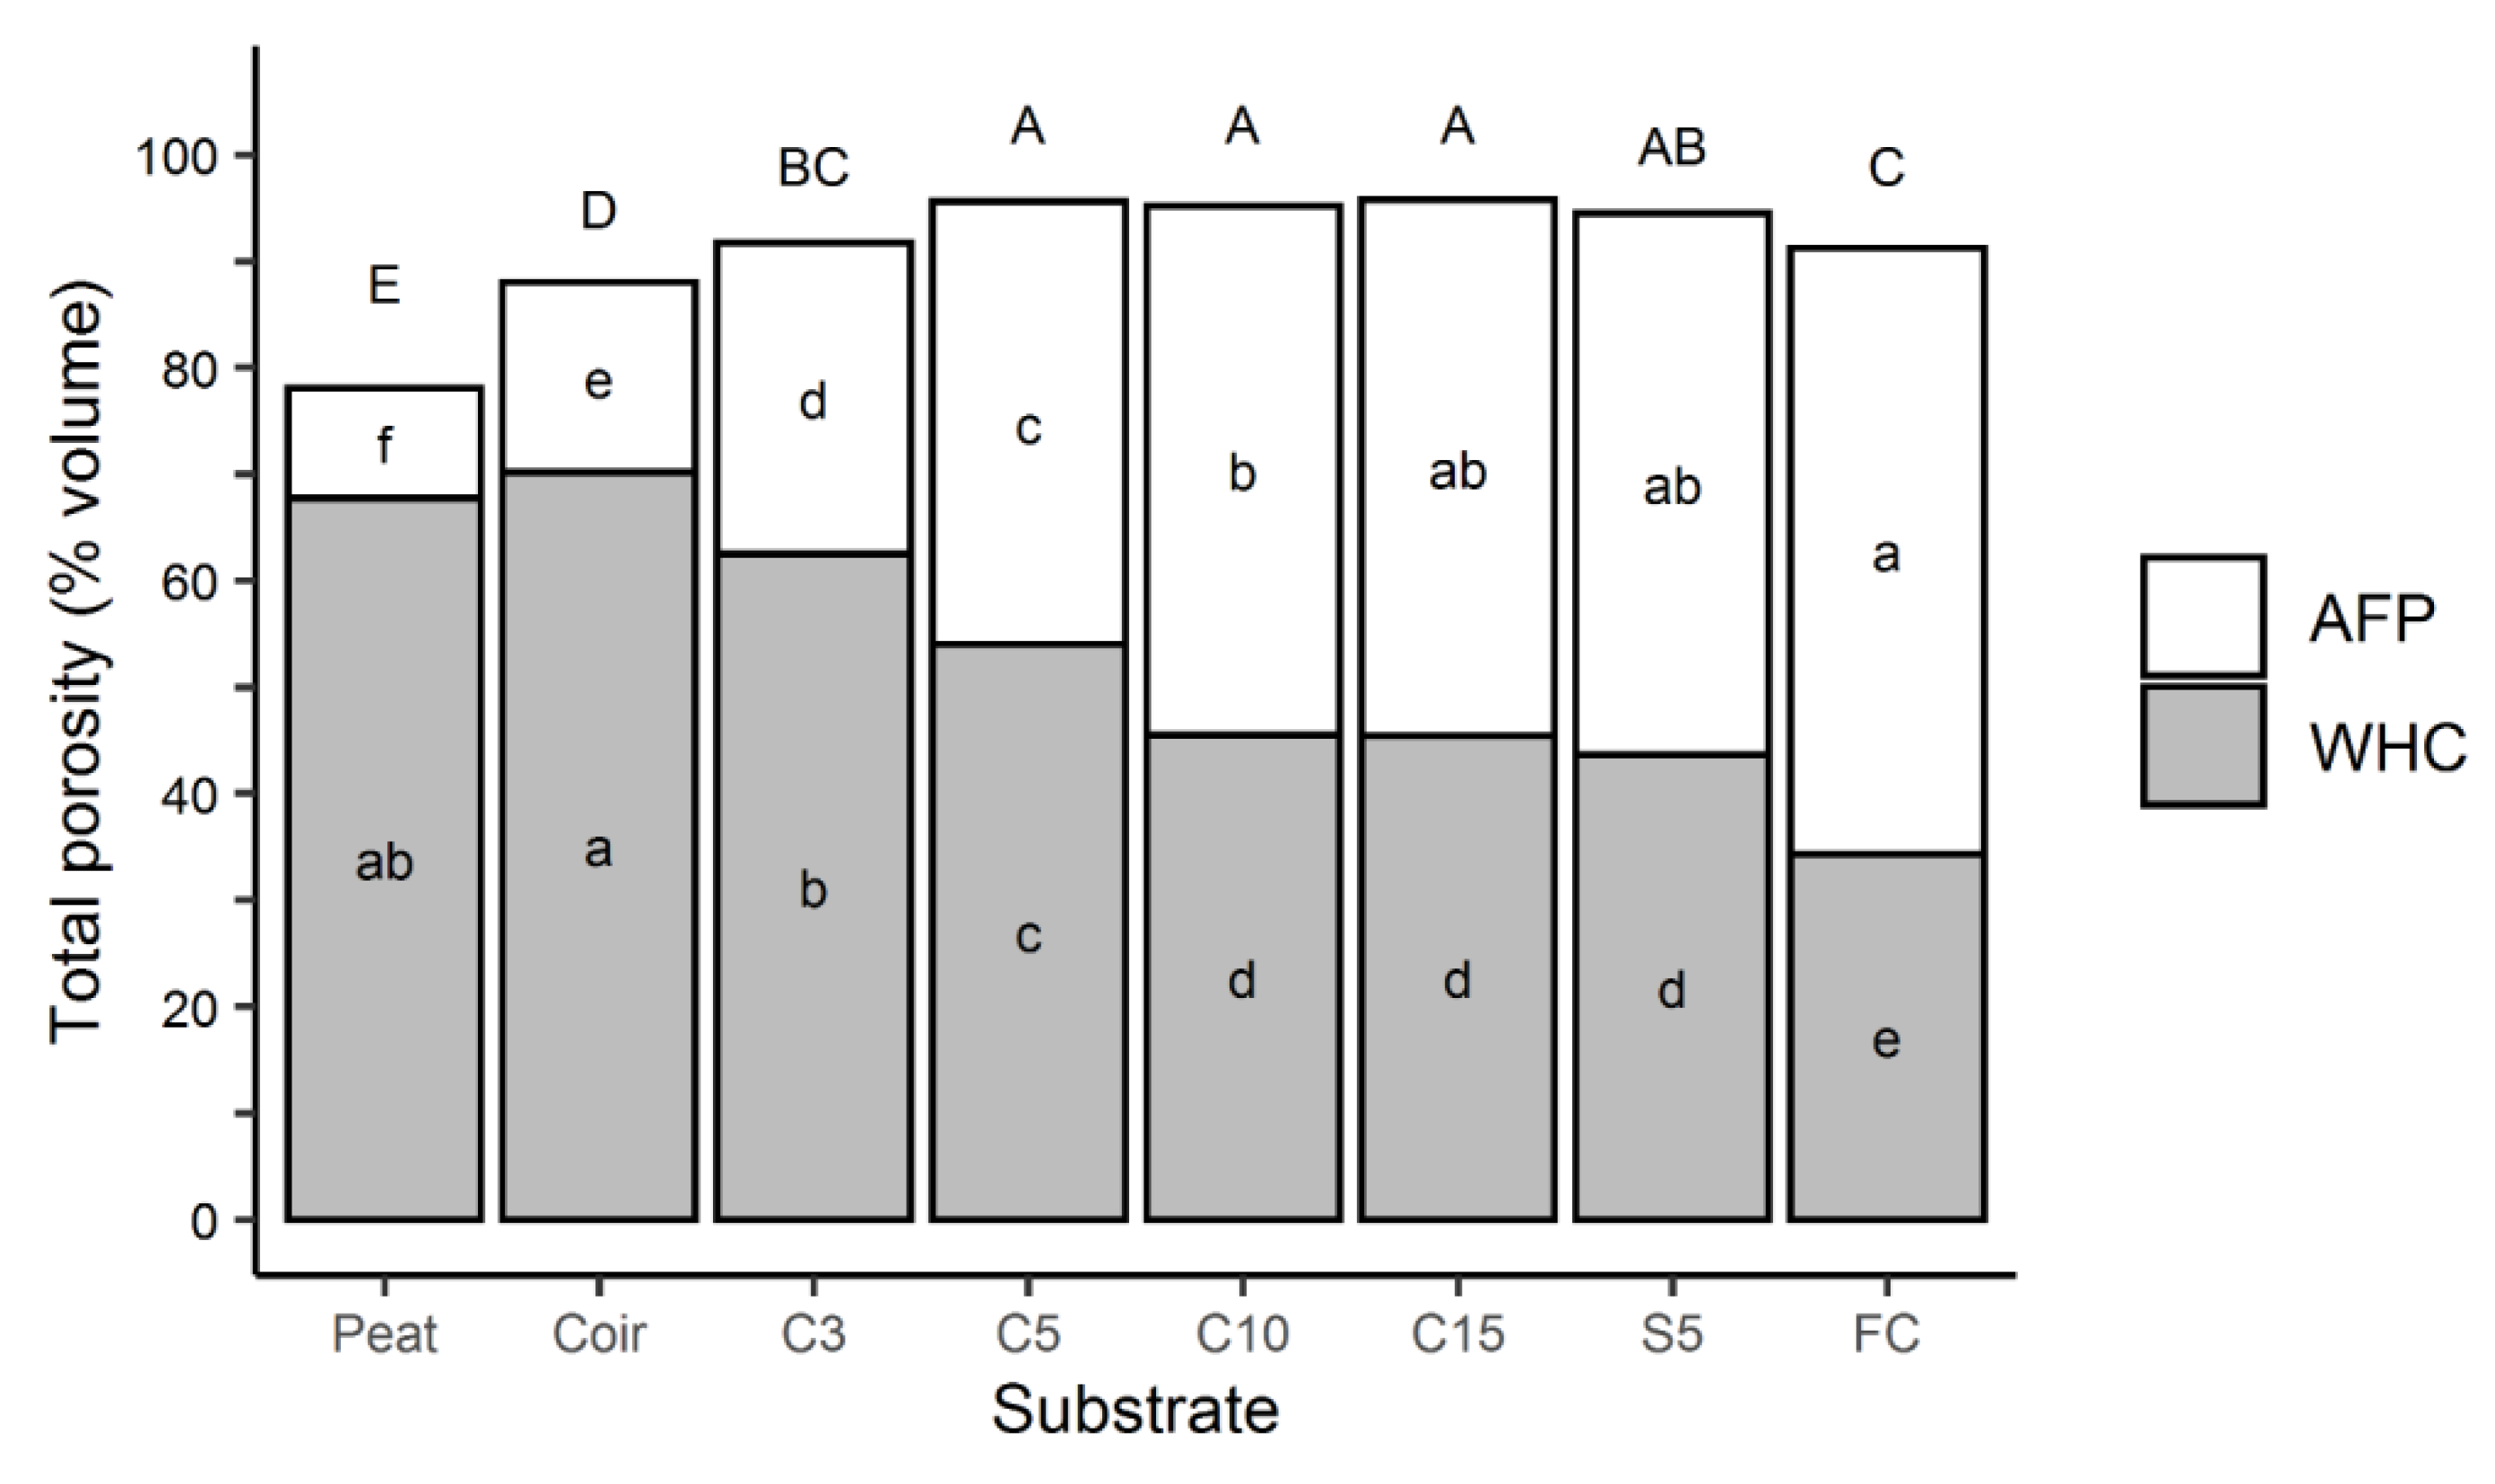
3.3.1. Porosity
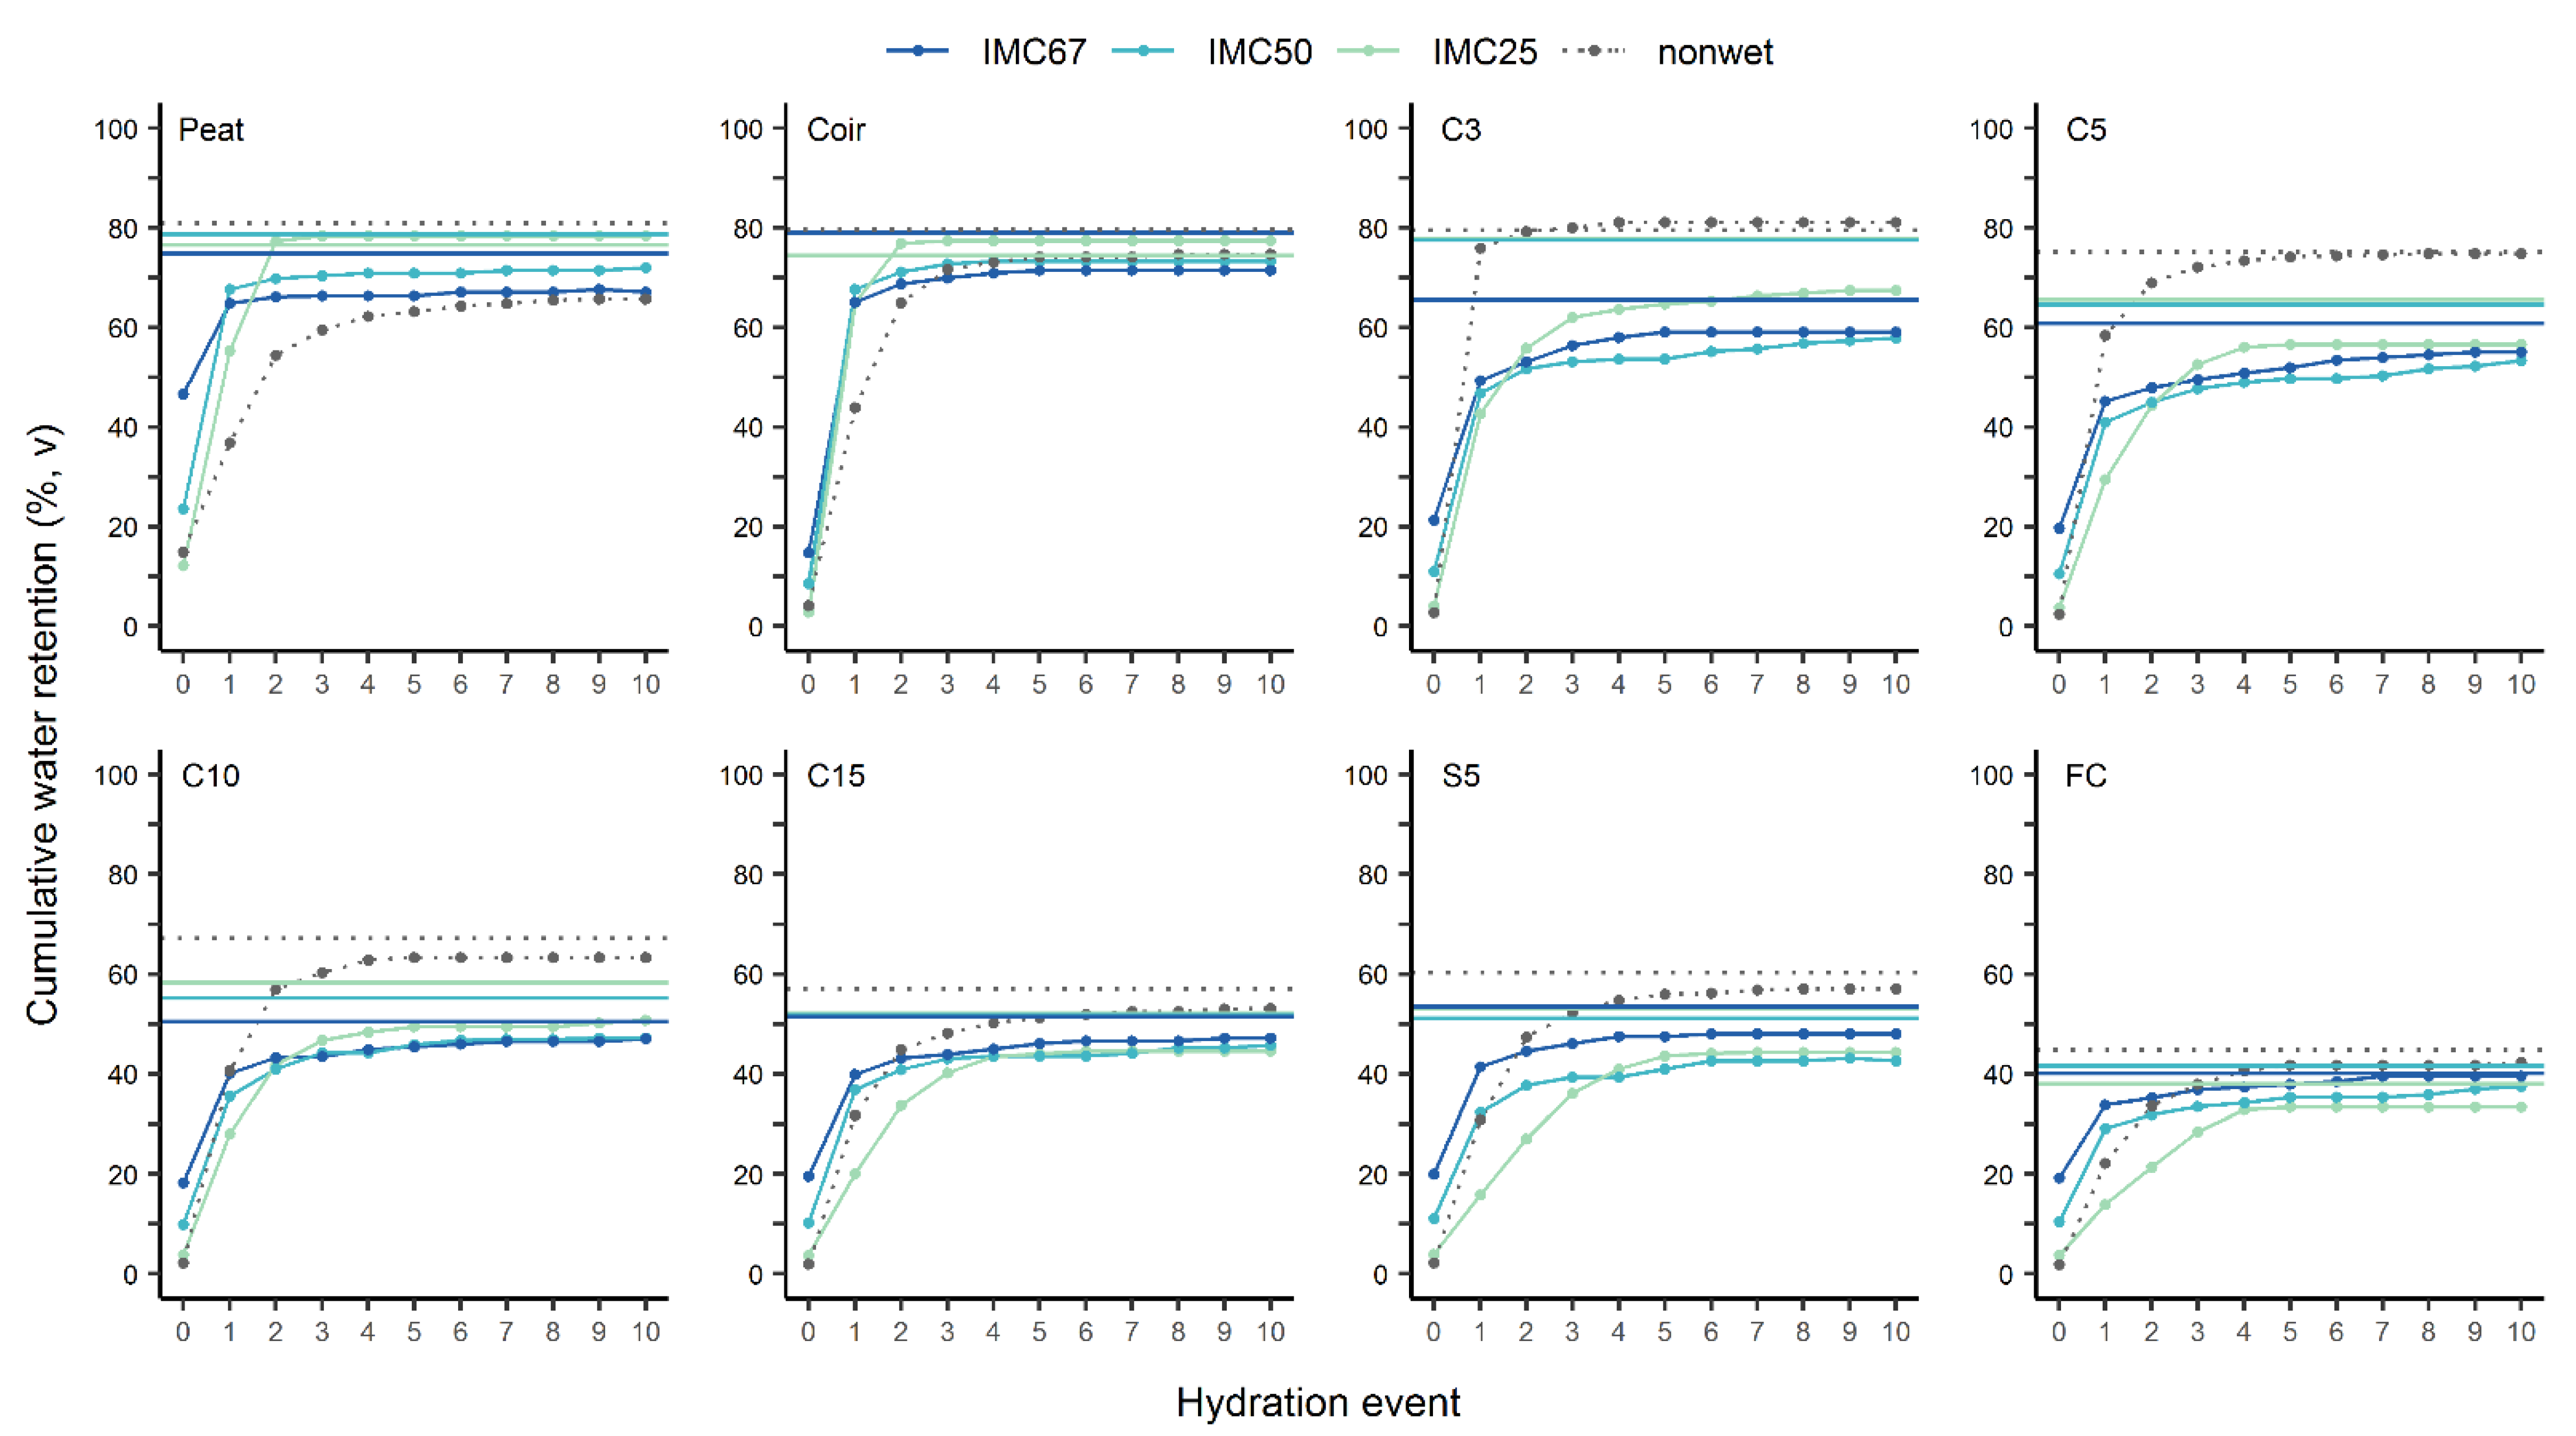
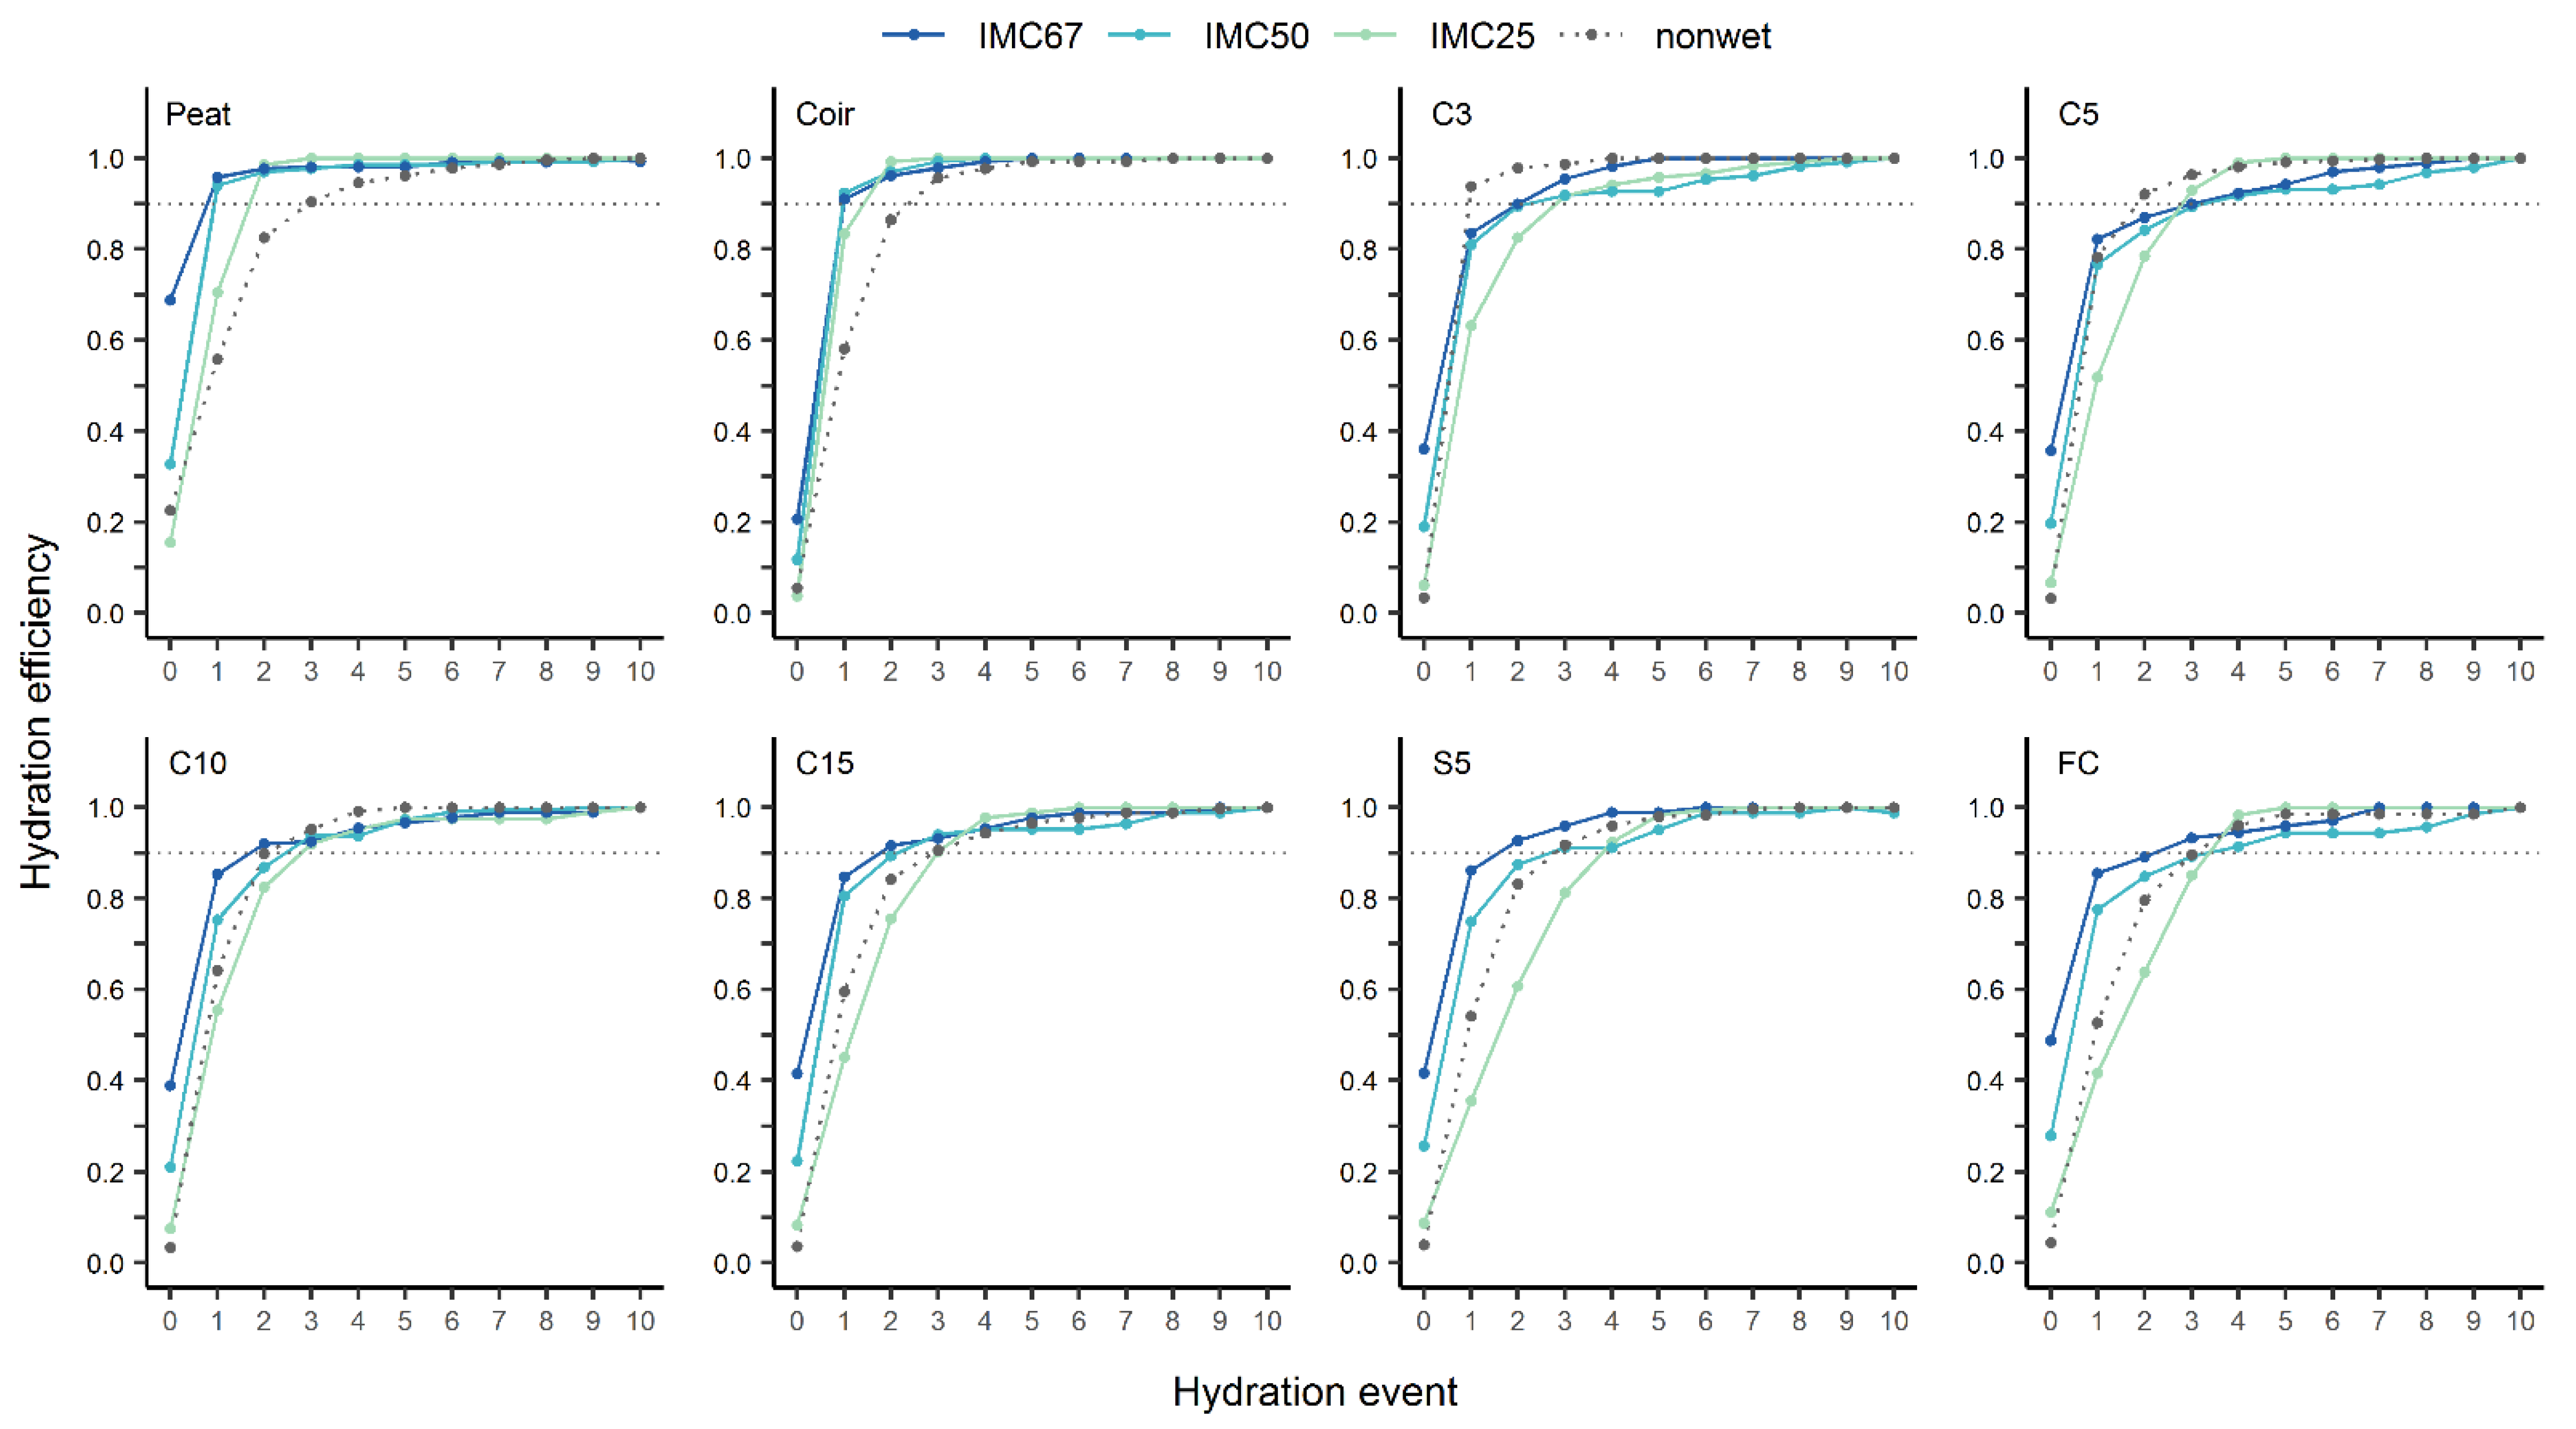
3.3.2. Wettability
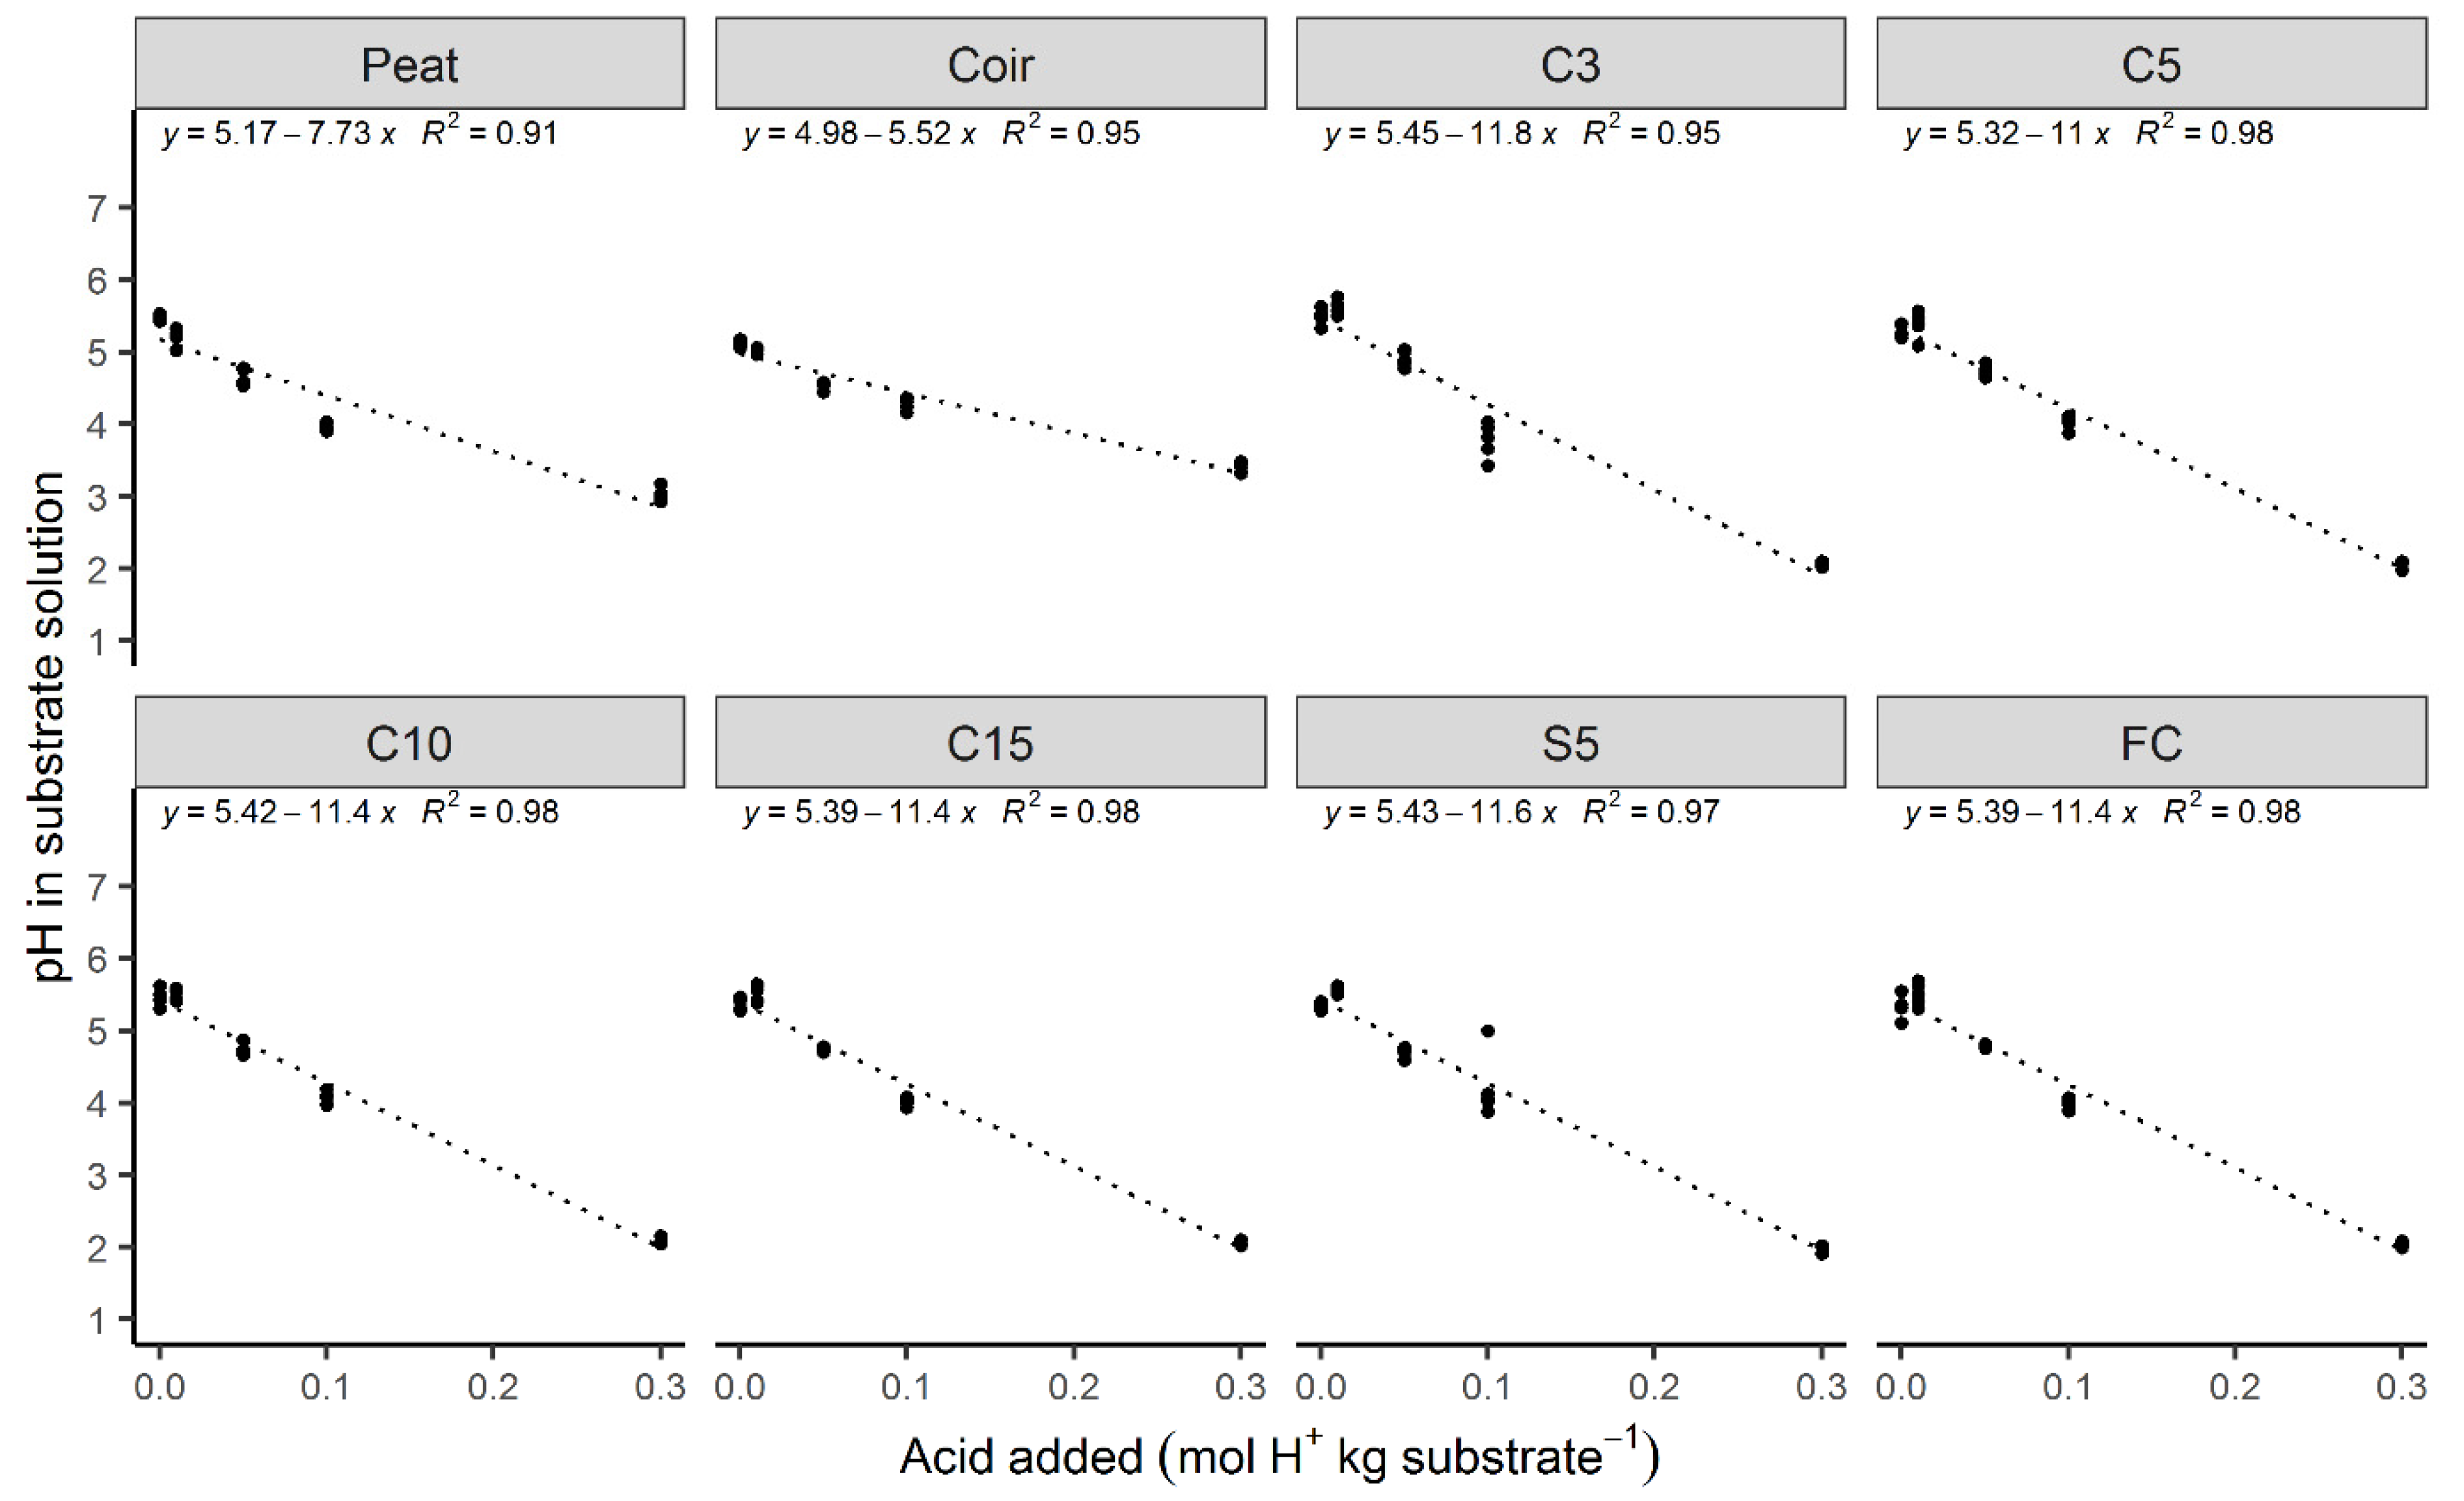
3.4. pH Buffering Capacity
3.5. N Immobilization
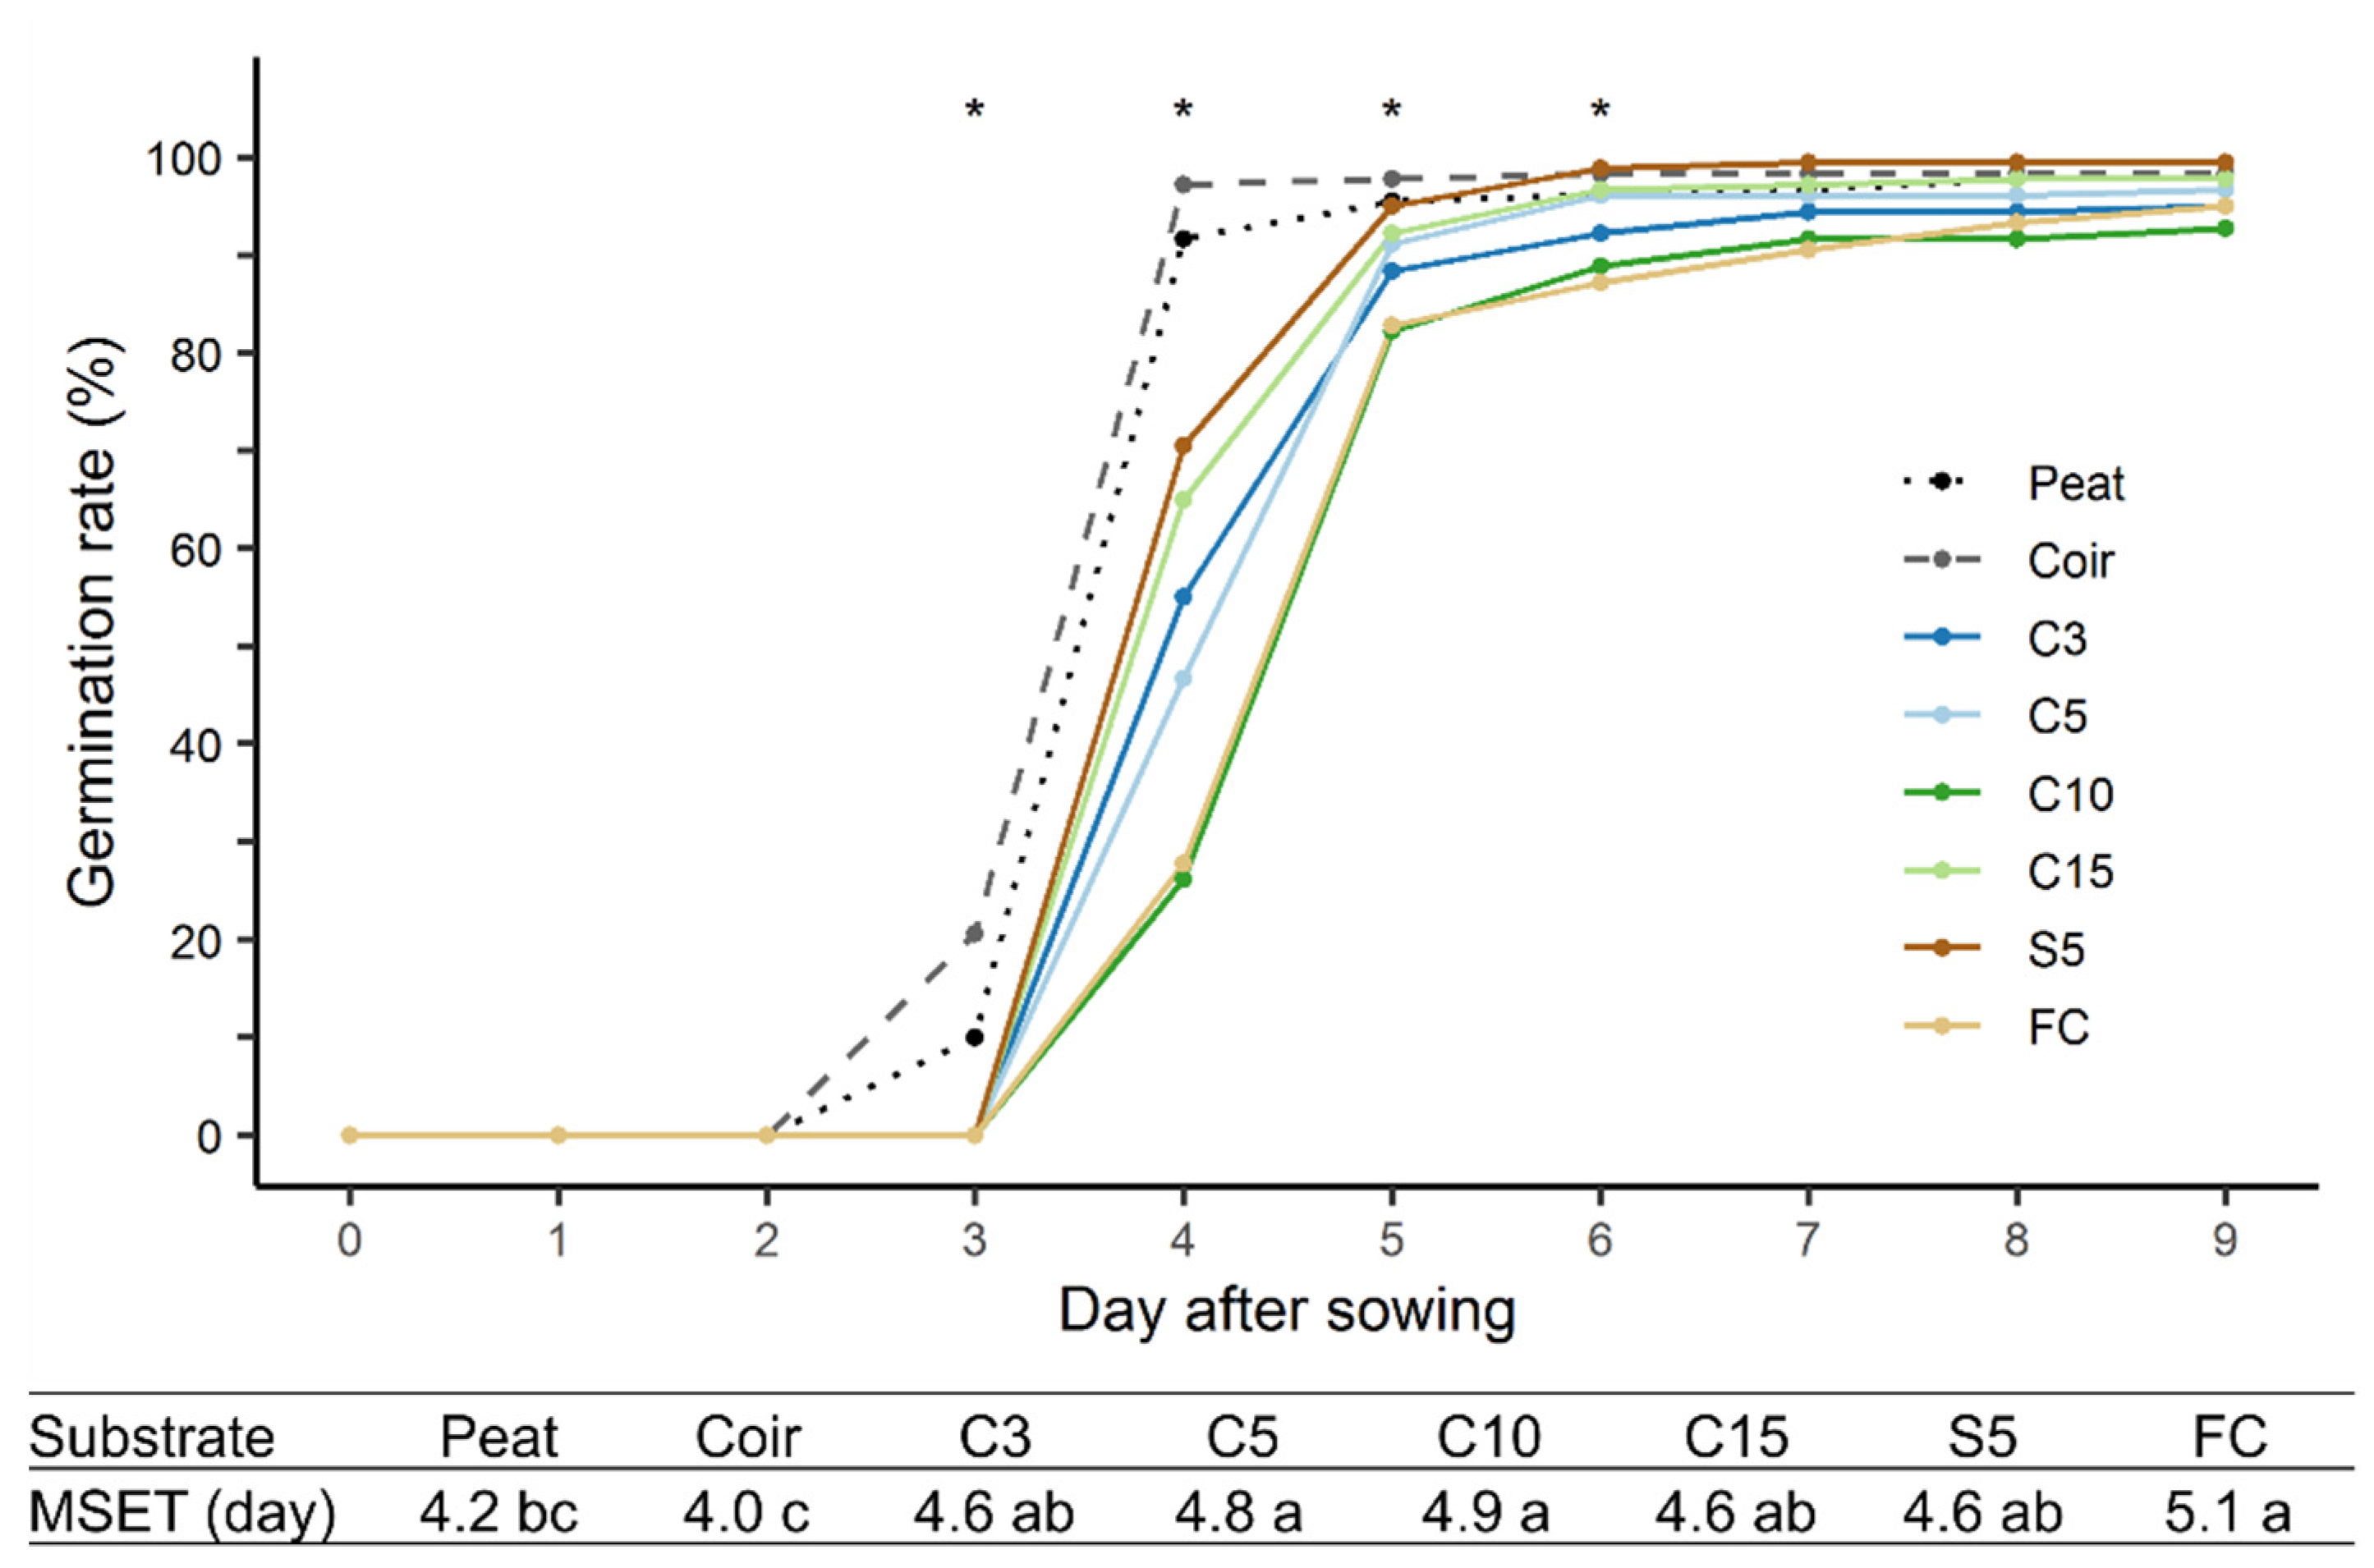
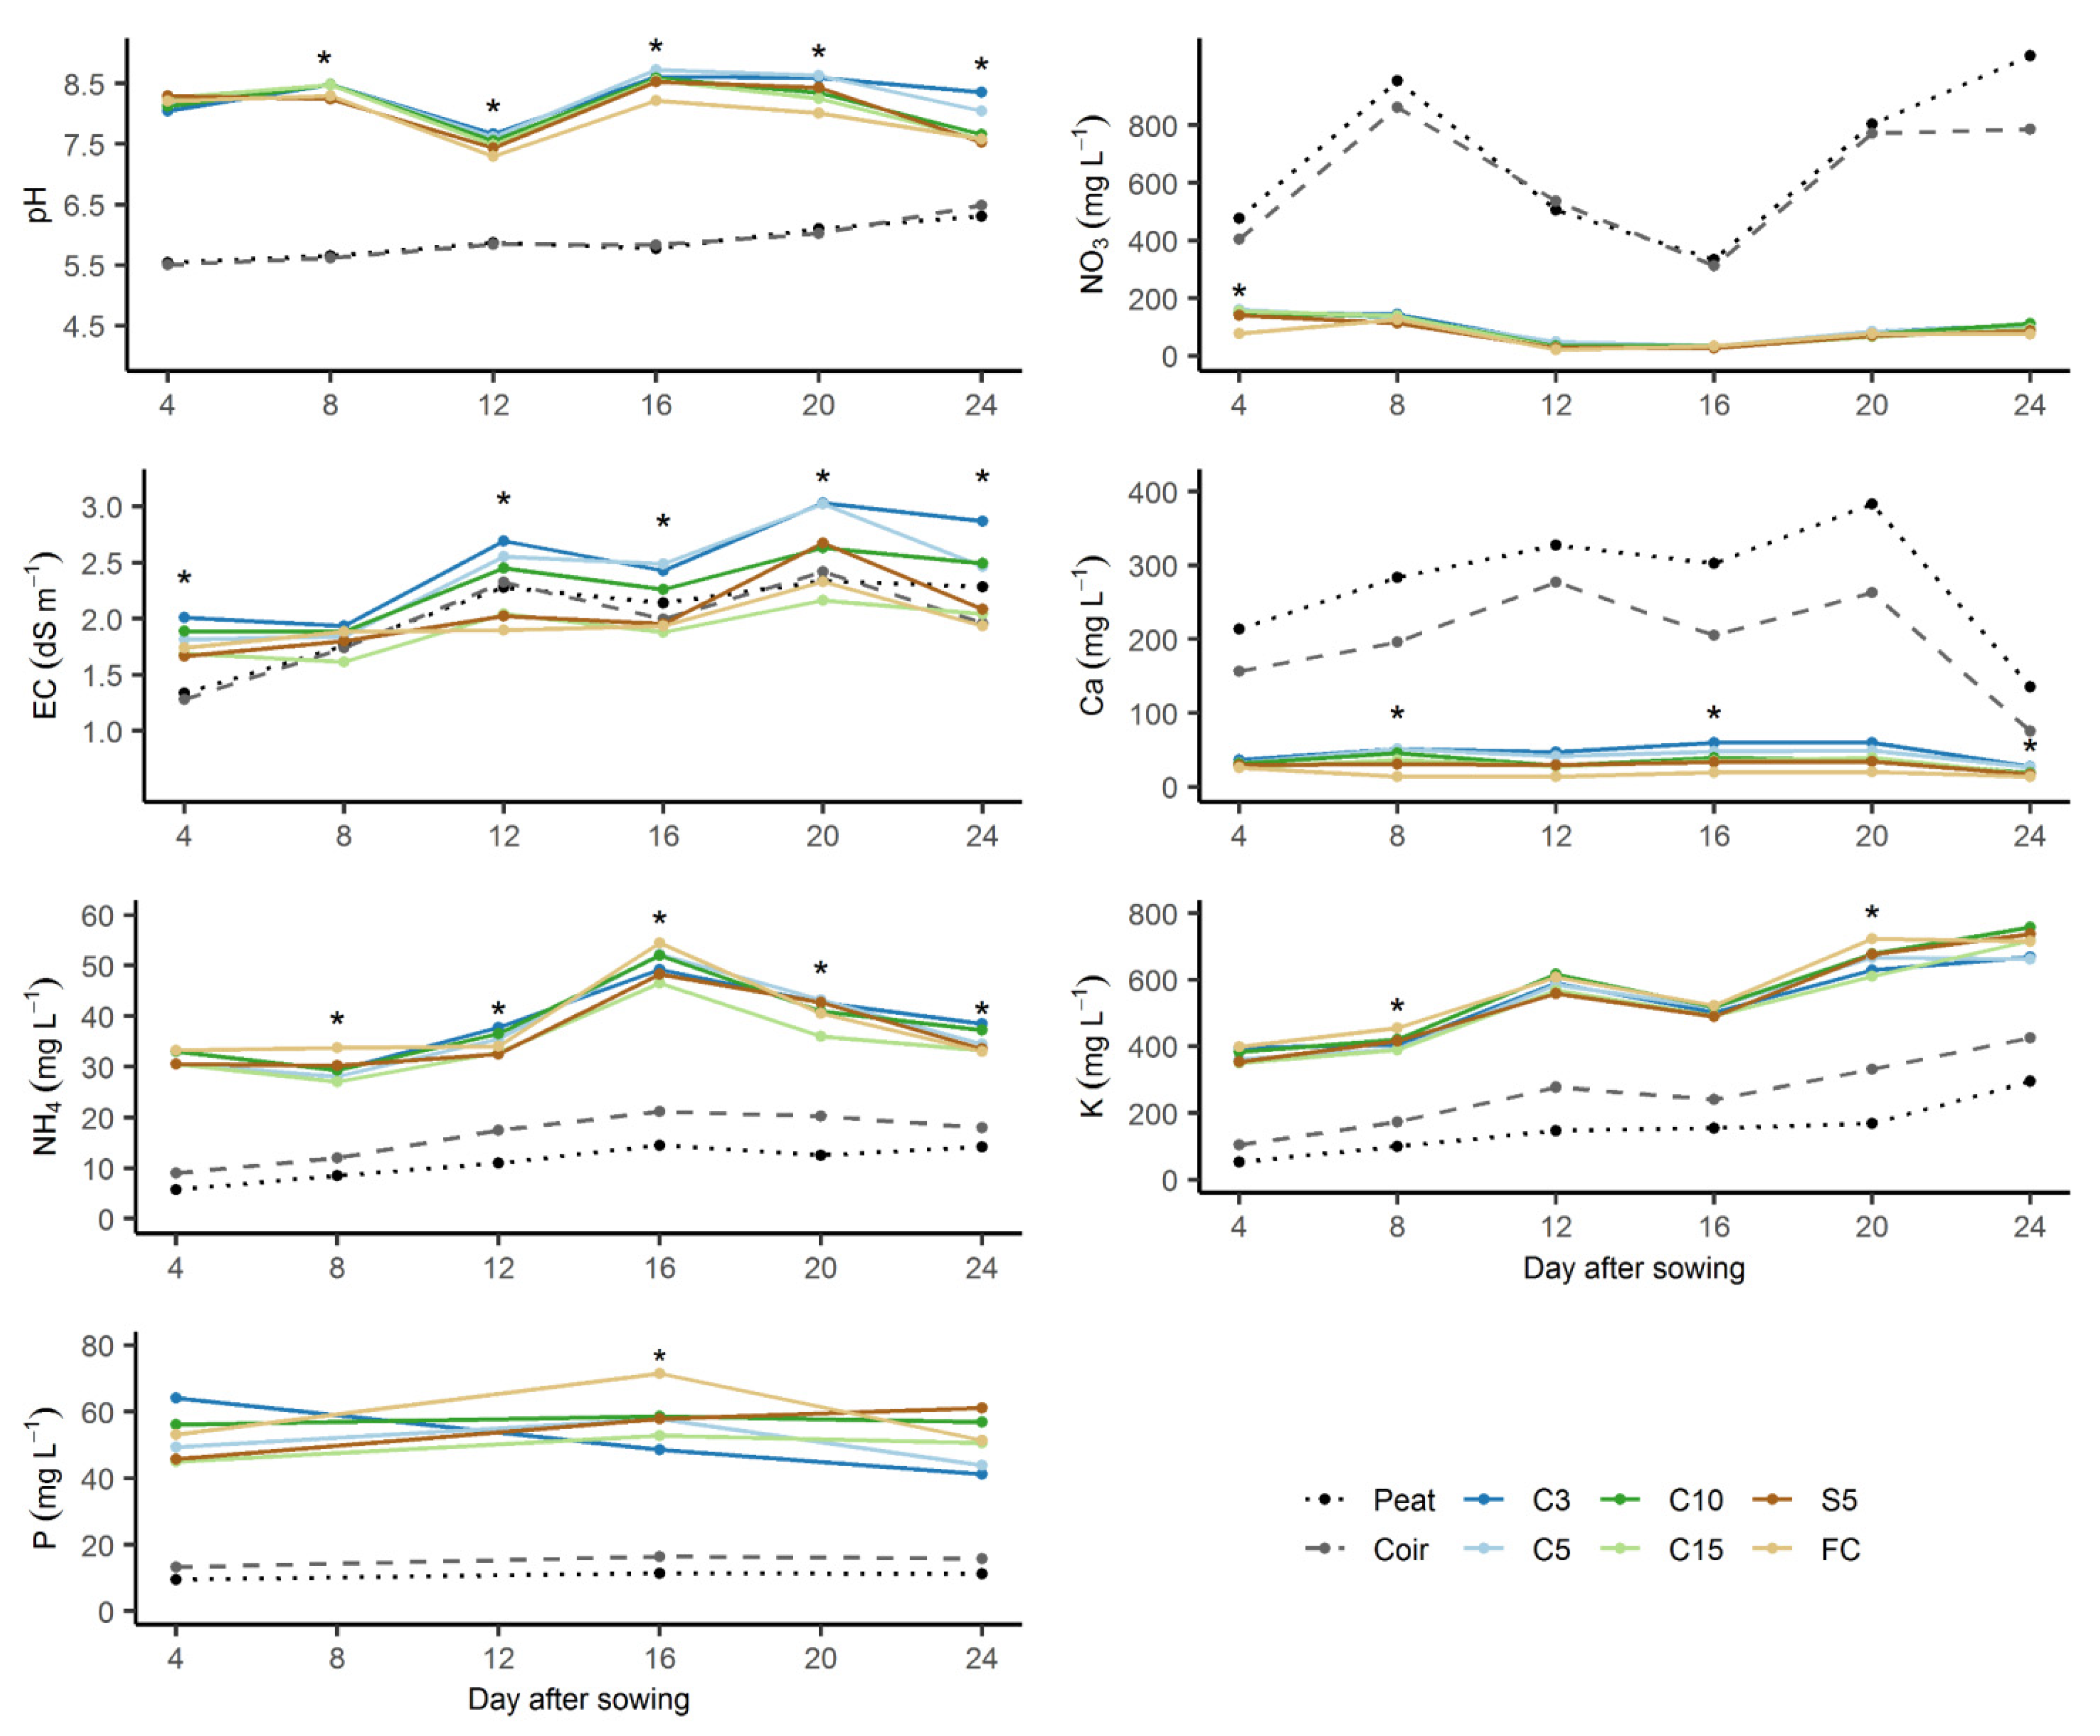
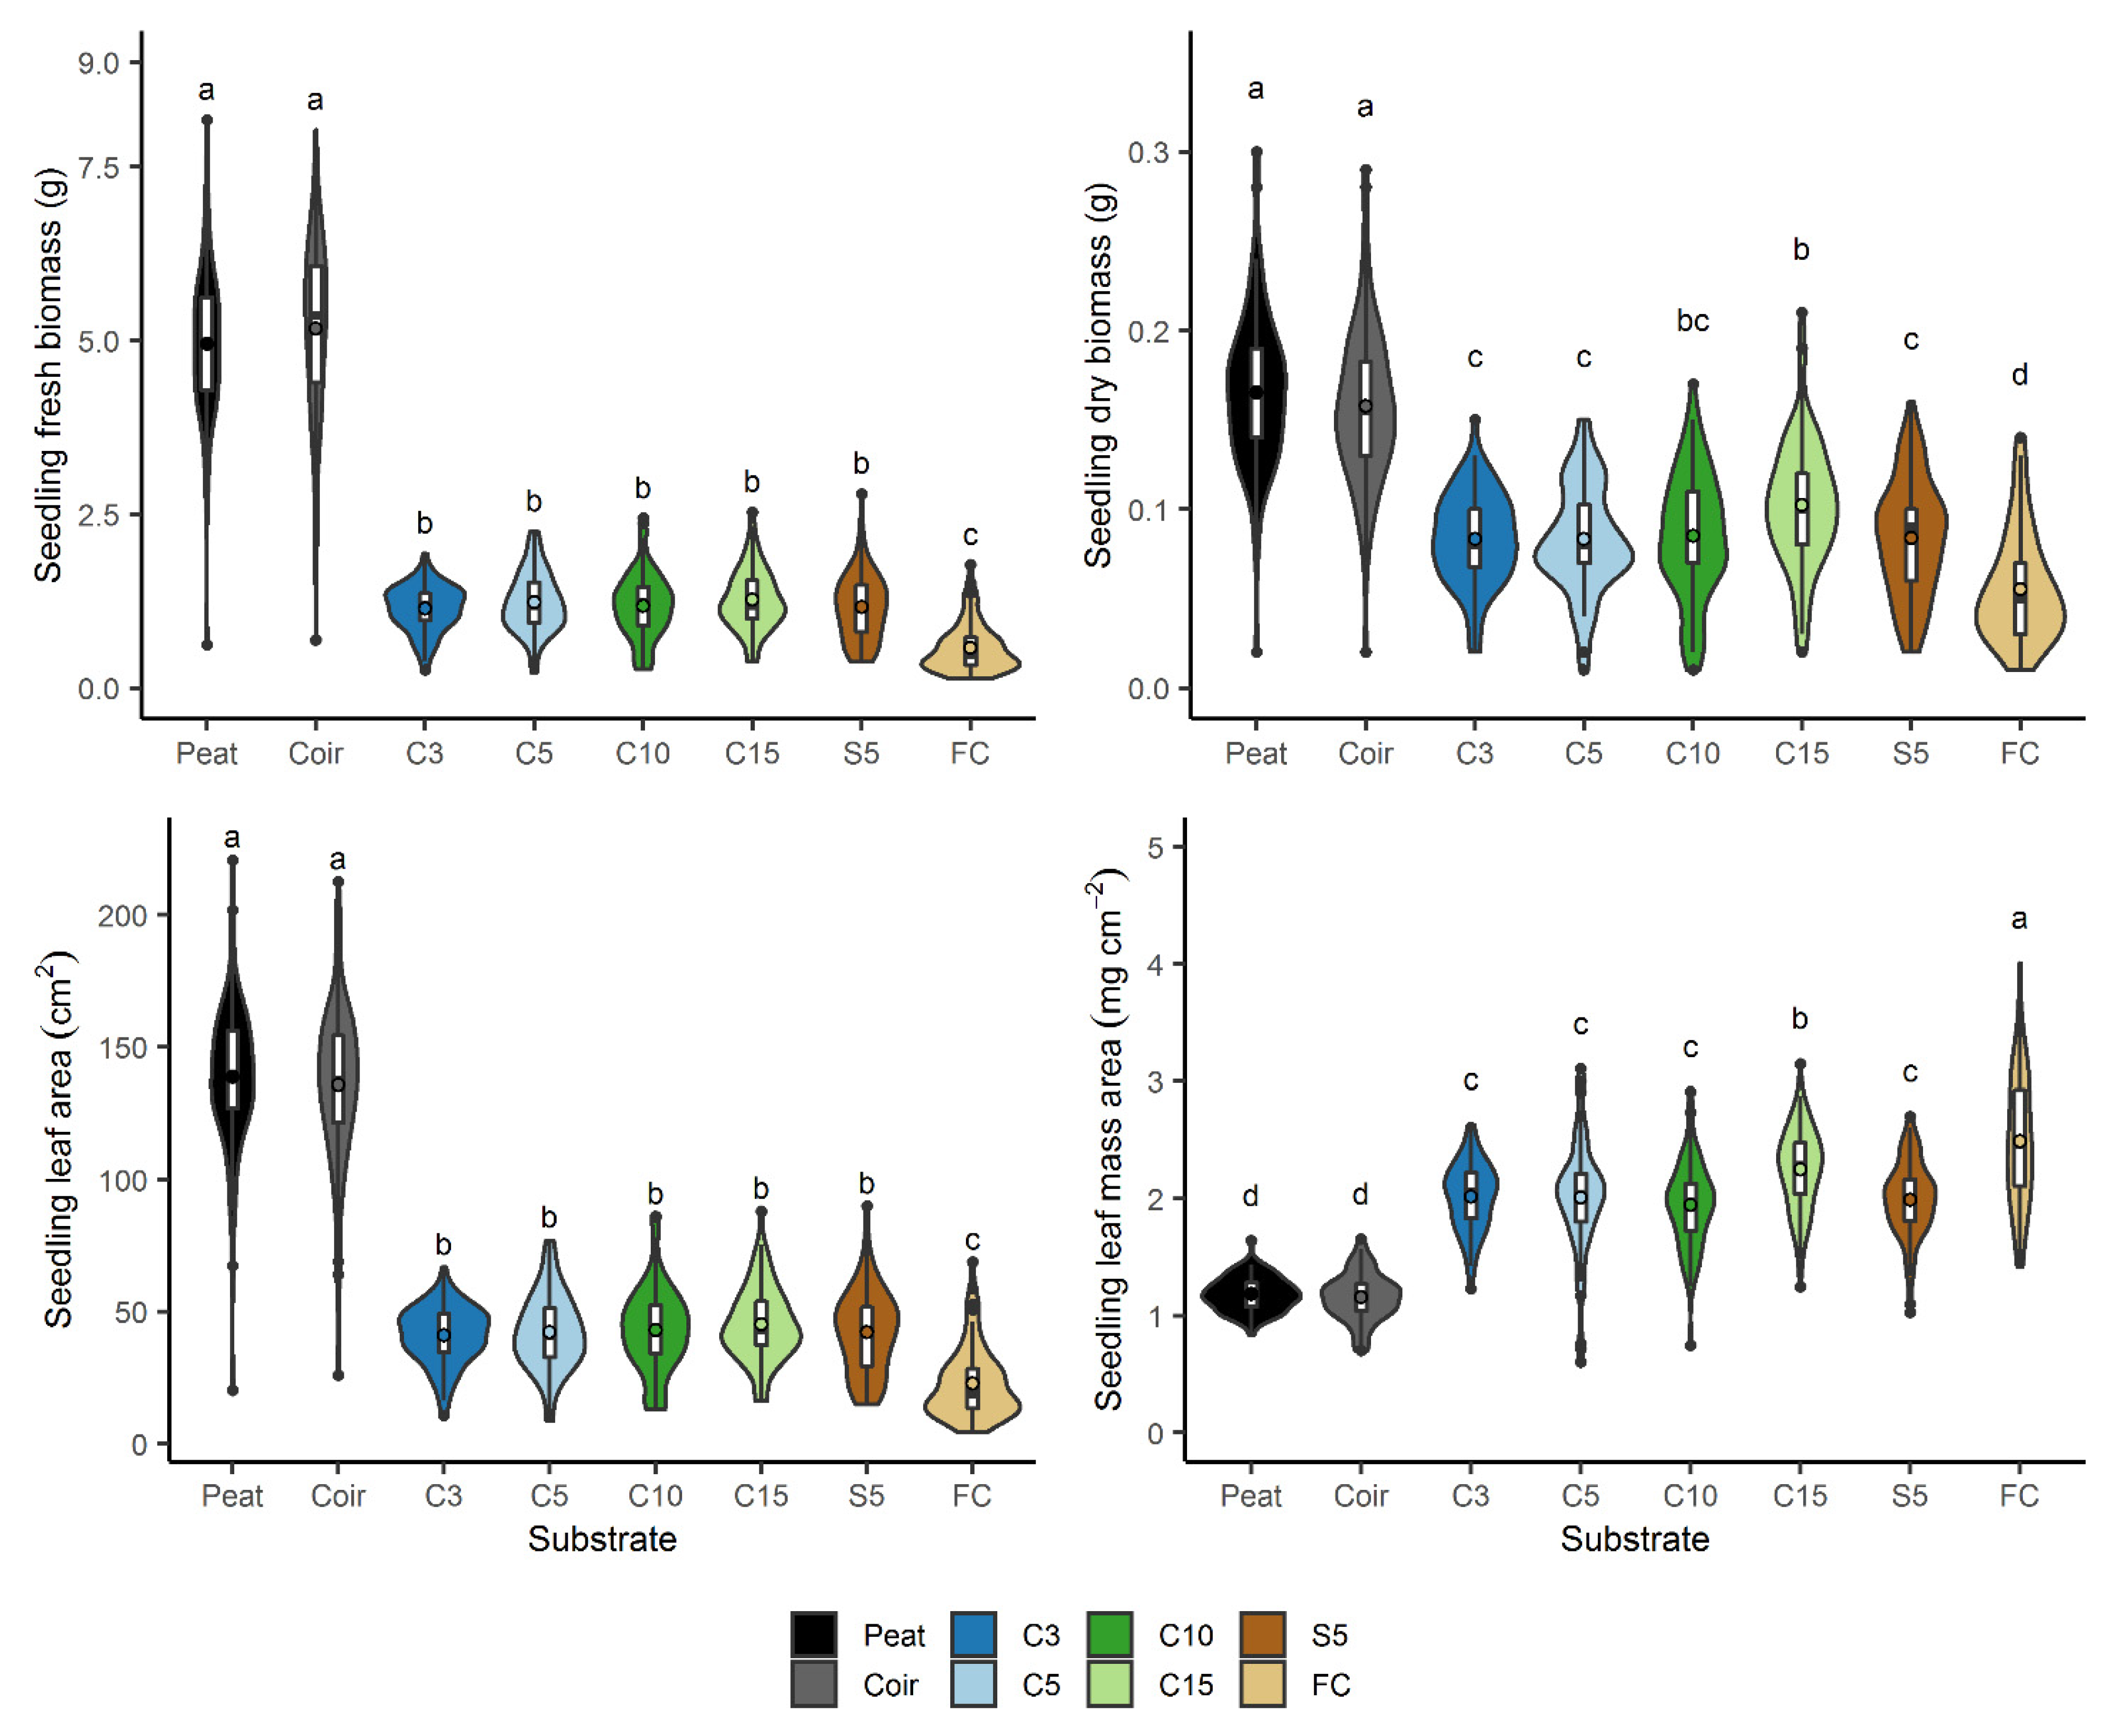
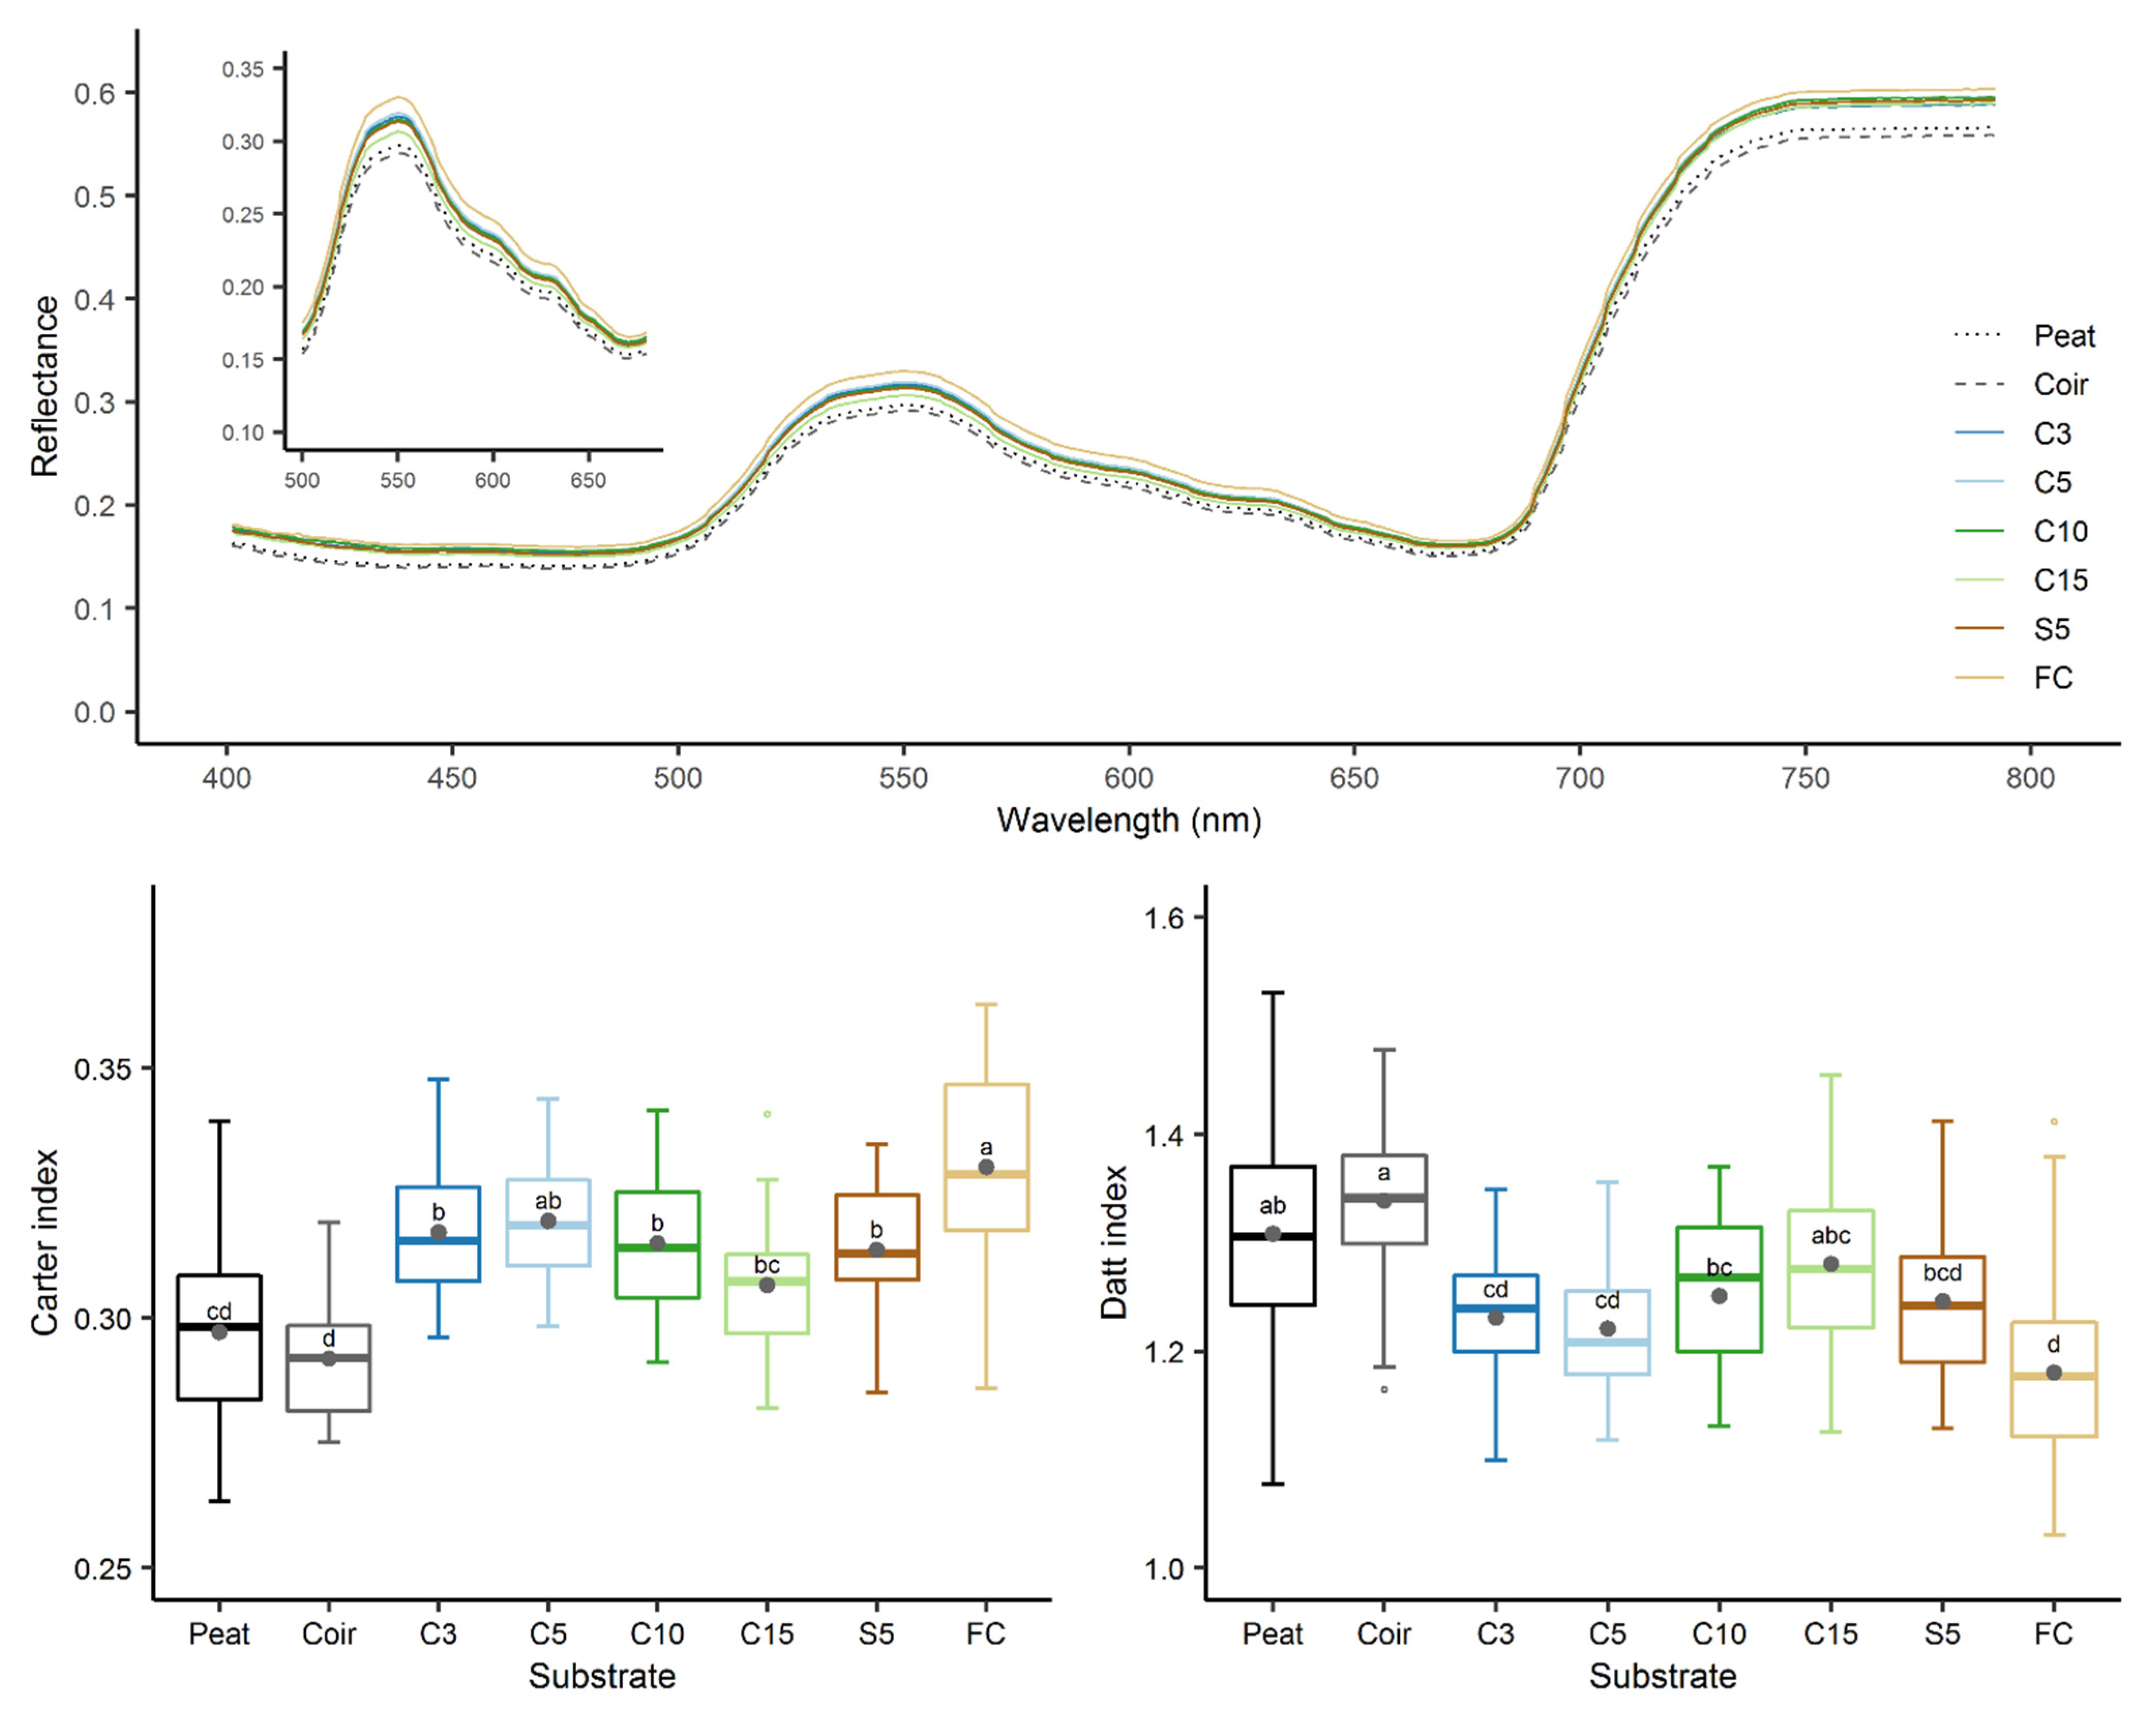
3.6. Growth of Chinese Cabbage Seedlings
4. Discussion
4.1. Effects of Substrate Morphology on Substrate Hydrological Properties
4.2. Effects of Substrate Morphology on Substrate pH
4.3. Effects of Substrate Morphology on N Immobilization
4.4. Seedling Growth and Nutrients Available from Miscanthus Substrates
5. Conclusions
Supplementary Materials
Author Contributions
Funding
Institutional Review Board Statement
Informed Consent Statement
Data Availability Statement
Acknowledgments
Conflicts of Interest
References
- Blok, C.; Eveleens, B.; van Winkel, A. Growing media for food and quality of life in the period 2020–2050. Acta Hortic. 2021, 1305, 341–356. [Google Scholar] [CrossRef]
- Barrett, G.E.; Alexander, P.D.; Robinson, J.S.; Bragg, N.C. Achieving environmentally sustainable growing media for soilless plant cultivation systems—A review. Sci. Hortic. 2016, 212, 220–234. [Google Scholar] [CrossRef] [Green Version]
- Gruda, N.S. Increasing Sustainability of Growing Media Constituents and Stand-Alone Substrates in Soilless Culture Systems. Agronomy 2019, 9, 298. [Google Scholar] [CrossRef] [Green Version]
- Schmilewski, G. The View from Europe; HDC News Growing Media Report: England, UK, 2012; pp. 5–7. [Google Scholar]
- Clifton-Brown, J.C.; Stampfl, P.F.; Jones, M.B. Miscanthus biomass production for energy in Europe and its potential contribution to decreasing fossil fuel carbon emissions. Glob. Chang. Biol. 2004, 10, 509–518. [Google Scholar] [CrossRef]
- Heaton, E.A.; Dohleman, F.G.; Miguez, A.F.; Juvik, J.A.; Lozovaya, V.; Widholm, J.; Zabotina, O.A.; McIsaac, G.F.; David, M.B.; Voigt, T.B.; et al. Chapter 3—Miscanthus: A promising biomass crop. In Advances in Botanical Research; Kader, J.-C., Delseny, M., Eds.; Academic Press: Cambridge, MA, USA, 2010; pp. 75–137. ISBN 0065-2296. [Google Scholar]
- Lewandowski, I.; Clifton-Brown, J.C.; Scurlock, J.M.O.; Huisman, W. Miscanthus: European experience with a novel energy crop. Biomass Bioenergy 2000, 19, 209–227. [Google Scholar] [CrossRef]
- Altland, J. Use of Processed Biofuel Crops for Nursery Substrates. J. Environ. Hortic. 2010, 28, 129–134. [Google Scholar] [CrossRef]
- Altland, J.E.; Locke, J.C. Use of Ground Miscanthus Straw in Container Nursery Substrates. J. Environ. Hortic. 2011, 29, 114–118. [Google Scholar] [CrossRef]
- Bąbelewski, P.; Pancerz, M.; Dębicz, R.; Wacławowicz, R. Dynamics of C, N and C/N ratio in substrates based on miscanthus straw in container production of Spiraea japonica ‘Macrophylla’. Acta Hortic. 2019, 1266, 129–136. [Google Scholar] [CrossRef]
- Cárthaigh, D.; Sturm, A.; Schmugler, A. The Use of Miscanthus as A Growing Medium Additive. Acta Hortic. 1997, 450, 57–62. [Google Scholar] [CrossRef]
- Frangi, P.; Amoroso, G.; Piatti, R. Alternative Growing Media to Peat Obtained from Two Fast Growing Species of Poaceae. Acta Hortic. 2012, 927, 967–972. [Google Scholar] [CrossRef]
- Pancerz, M.; Bąbelewski, P. Influence of miscanthus-based growing media with the amendment of hydrogel and different multicomponent fertilizers on the fresh biomass of Hydrangea arborescens ‘Annabelle’. Acta Hortic. 2019, 1266, 237–242. [Google Scholar] [CrossRef]
- Li, G.J.; Benoit, F.; Ceustermans, N.; Xu, Z.H. The possibilities of Chinese reed fibres as an environmentally sound organic substrate. Acta Agric. 2002, 14, 87–94. [Google Scholar]
- Bąbelewski, P.; Pancerz, M. Rooting of selected ornamental shrubs in substrates based on miscanthus straw. Acta Hortic. 2018, 1191, 175–182. [Google Scholar] [CrossRef]
- Debode, J.; De Tender, C.; Cremelie, P.; Lee, A.S.; Kyndt, T.; Muylle, H.; De Swaef, T.; Vandecasteele, B. Trichoderma-Inoculated Miscanthus Straw Can Replace Peat in Strawberry Cultivation, with Beneficial Effects on Disease Control. Front. Plant Sci. 2018, 9, 213. [Google Scholar] [CrossRef] [PubMed]
- Vandecasteele, B.; Viaene, J.; Debode, J.; Muylle, H.; Perneel, M. Selecting raw materials for sustainable growing media: A protocol to assess the risk for N immobilization. Acta Hortic. 2017, 1168, 149–160. [Google Scholar] [CrossRef]
- Kraska, T.; Kleinschmidt, B.; Weinand, J.; Pude, R. Cascading use of Miscanthus as growing substrate in soilless cultivation of vegetables (tomatoes, cucumbers) and subsequent direct combustion. Sci. Hortic. 2018, 235, 205–213. [Google Scholar] [CrossRef]
- Nguyen, V.; Elfers, J.; Kühn, H.; Kraska, T.; Pude, R. Different Miscanthus genotypes as growing media in soilless tomato cultivation and its subsequent use for combustion. Acta Hortic. 2021, 1305, 301–308. [Google Scholar] [CrossRef]
- Jensen, H.K.; Leth, M.; Iversen, J.L. Growth of Hedera helix and Fatsia japonica Pot Plants in Compost Substrates Based on Miscanthus Straw and Various N-Sources. Acta Hortic. 2001, 549, 137–146. [Google Scholar] [CrossRef]
- Jensen, H.E.K.; Leth, M.; Iversen, J.J.L. Growth of Hedera helix L. Container Plants in Compost Substrates Made with Miscanthus ogiformis Honda Straw and Various N-Sources. Compos. Sci. Util. 2001, 9, 206–214. [Google Scholar] [CrossRef]
- Jensen, H.E.K.; Leth, M.; Iversen, J.J.L. Effect of Compost Age and Concentration of Pig Slurry on Plant Growth. Compos. Sci. Util. 2002, 10, 129–141. [Google Scholar] [CrossRef]
- Vandecasteele, B.; Muylle, H.; De Windt, I.; Van Acker, J.; Ameloot, N.; Moreaux, K.; Coucke, P.; Debode, J. Plant fibers for renewable growing media: Potential of defibration, acidification or inoculation with biocontrol fungi to reduce the N drawdown and plant pathogens. J. Clean. Prod. 2018, 203, 1143–1154. [Google Scholar] [CrossRef]
- Abad, M.; Fornes, F.; Carrión, C.; Noguera, V.; Noguera, P.; Maquieira, A.; Puchades, R. Physical Properties of Various Coconut Coir Dusts Compared to Peat. HortScience 2005, 40, 2138–2144. [Google Scholar] [CrossRef] [Green Version]
- Cannavo, P.; Michel, J.-C. Peat particle size effects on spatial root distribution, and changes on hydraulic and aeration properties. Sci. Hortic. 2013, 151, 11–21. [Google Scholar] [CrossRef]
- Caron, J.; Rivière, L.-M.; Guillemain, G. Gas diffusion and air-filled porosity: Effect of some oversize fragments in growing media. Can. J. Soil Sci. 2005, 85, 57–65. [Google Scholar] [CrossRef]
- Gruda, N.; Sippel, C.; Schnitzler, W. Investigation of Physical Properties of Wood Fiber Substrates under Press Pot Conditions. Acta Hortic. 2001, 51–58. [Google Scholar] [CrossRef]
- Handreck, K. Particle size and the physical properties of growing media for containers. Commun. Soil Sci. Plant Anal. 1983, 14, 209–222. [Google Scholar] [CrossRef]
- Jackson, B.E.; Wright, R.D.; Barnes, M.C. Methods of Constructing a Pine Tree Substrate from Various Wood Particle Sizes, Organic Amendments, and Sand for Desired Physical Properties and Plant Growth. HortScience 2010, 45, 103–112. [Google Scholar] [CrossRef] [Green Version]
- Jackson, B.E.; Wright, R.D. Pine Tree Substrate: An Alternative and Renewable Substrate for Horticultural Crop Production. Acta Hortic. 2009, 819, 265–272. [Google Scholar] [CrossRef]
- Altland, J.E.; Krause, C. Use of Switchgrass as a Nursery Container Substrate. HortScience 2009, 44, 1861–1865. [Google Scholar] [CrossRef]
- Jackson, B.E.; Wright, R.D.; Barnes, M.C. Pine Tree Substrate, Nitrogen Rate, Particle Size, and Peat Amendment Affect Poinsettia Growth and Substrate Physical Properties. HortScience 2008, 43, 2155–2161. [Google Scholar] [CrossRef] [Green Version]
- Owen, W.G.; Jackson, B.E.; Whipker, B.E.; Fonteno, W.C. Pine Wood Chips as an Alternative to Perlite in Greenhouse Substrates: Nitrogen Requirements. HortTechnology 2016, 26, 199–205. [Google Scholar] [CrossRef] [Green Version]
- Wallach, R. Physical Characteristics of Soilless Media. In Soilless Culture: Theory and Practice, 2nd ed.; Raviv, M., Lieth, H., Bar-Tal, A., Eds.; AP Academic Press: London, UK, 2019; pp. 33–112. ISBN 9780444636966. [Google Scholar]
- DIN EN 13037:2012-01; Soil Improvers and Growing Media—Determination of pH. German version EN 13037:2011; Beuth Verlag: Berlin, Germany, 2012. [CrossRef]
- DIN EN 13038:2012-01; Soil Improvers and Growing Media—Determination of pH. German version EN 13038:2011; Beuth Verlag: Berlin, Germany, 2011. [CrossRef]
- DIN EN 13652:2002-01; Soil improvers and Growing Media—Extraction of Water Soluble Nutrients and Elements. German version EN 13652:2001; Beut Verlag: Berlin, Germany, 2002. [CrossRef]
- Retsch Technology GmbH. CAMSIZER Characteristics –Basis of Definition DIN 66141; Retsch Technology GmbH: Haan, Germany, 2009. [Google Scholar]
- Drzal, M.; Cassel, D.K.; Fonteno, W. Pore Fraction Analysis: A New Tool for Substrate Testing. Acta Hortic. 1999, 481, 43–54. [Google Scholar] [CrossRef]
- Microtrac Retsch GmbH. Determination of Particle Shape with Dynamic Image Analysis. Available online: https://www.microtrac.com/dltmp/www/5e396c09-23f8-45ca-ae33-7f30c3c9c754-cce0895c57d1/tr_particle_shape_1118_en.pdf (accessed on 11 May 2021).
- Malvern Instruments Ltd. A Basic Guide to Particle Characterization. 2015. Available online: https://www.malvernpanalytical.com/en/learn/knowledge-center/whitepapers/WP120620BasicGuidePartChar (accessed on 12 September 2021).
- Miller, N.A.; Henderson, J.J. Quantifying Sand Particle Shape Complexity using a Dynamic, Digital Imaging Technique. Agron. J. 2010, 102, 1407–1414. [Google Scholar] [CrossRef]
- Miller, N.A.; Henderson, J.J. Correlating Particle Shape Parameters to Bulk Properties and Load Stress at Two Water Contents. Agron. J. 2011, 103, 1514–1523. [Google Scholar] [CrossRef]
- Microtrac Retsch GmbH. Whitepaper: Correlation between Sieve Analysis and Image Analysis Made Easy, n.d. Available online: https://www.microtrac.com/products/particle-size-shape-analysis/dynamic-image-analysis/camsizer-p4/downloads/dl_details/1/file/5e396c09-86c8-42f5-a041-7f30c3c9c754/ (accessed on 10 May 2021).
- Fonteno, W.C.; Harden, C.T. Procedures for Determining Physical Properties of Horticultural Substrates Using the NCSU Porometer; Horticultural Substrates Laboratory, North Carolina State University: Raleigh, NC, USA, 2003. [Google Scholar]
- Fonteno, W.; Fields, J.; Jackson, B. A Pragmatic Approach to Wettability and Hydration of Horticultural Substrates. Acta Hortic. 2013, 1013, 139–146. [Google Scholar] [CrossRef] [Green Version]
- Fields, J.S.; Fonteno, W.C.; Jackson, B.E. Hydration Efficiency of Traditional and Alternative Greenhouse Substrate Components. HortScience 2014, 49, 336–342. [Google Scholar] [CrossRef] [Green Version]
- Costello, R.C.; Sullivan, D.M. Determining the pH Buffering Capacity of Compost Via Titration with Dilute Sulfuric Acid. Waste Biomass-Valoriz. 2014, 5, 505–513. [Google Scholar] [CrossRef]
- Handreck, K.A. Rapid assessment of the rate of nitrogen immobilisation in organic components of potting media: I. Method development. Commun. Soil Sci. Plant Anal. 1992, 23, 201–215. [Google Scholar] [CrossRef]
- Main, R.; Cho, M.A.; Mathieu, R.; O’Kennedy, M.M.; Ramoelo, A.; Koch, S. An investigation into robust spectral indices for leaf chlorophyll estimation. ISPRS J. Photogramm. Remote Sens. 2011, 66, 751–761. [Google Scholar] [CrossRef]
- Bunt, A.C. Media and Mixes for Container-Grown Plants: A Manual on the Preparation and Use of Growing Media for Pot Plants, Second Edition of Modern Potting Composts; Springer: Dordrecht, The Netherlands, 1988; ISBN 9401179042. [Google Scholar]
- Johnson, E. Comparison of methods of analysis for loamless composts. Acta Hortic. 1980, 197–204. [Google Scholar] [CrossRef]
- Yeager, T.; Fare, D.; Lea-Cox, J.; Ruter, J.; Bilderback, T.E.; Gilliam, C.; Niemiera, A.; Warren, S.L.; Whitwell, T.; Wright, R.D.; et al. Best Management Practices: Guide for Producing Container-Grown Plants, 2nd ed.; Southern Nurserymen’s Assoc: Marietta, GA, USA, 1997. [Google Scholar]
- Michel, J.-C.; Jackson, B.; Fonteno, W. Classification of organic substrates’ wettability from contact angle measurements and hydration efficiency tests. Acta Hortic. 2017, 1168, 199–206. [Google Scholar] [CrossRef]
- Benoit, F.; Ceustermans, N. Consequences of closed soilless growing systems for the recirculating nutrient solution and the production techniques. Acta Hortic. 2004, 633, 331–340. [Google Scholar] [CrossRef]
- Attard, T.M.; McElroy, C.R.; Gammons, R.J.; Slattery, J.M.; Supanchaiyamat, N.; Kamei, C.L.A.; Dolstra, O.; Trindade, L.M.; Bruce, N.C.; McQueen-Mason, S.J.; et al. Supercritical CO2 Extraction as an Effective Pretreatment Step for Wax Extraction in a Miscanthus Biorefinery. ACS Sustain. Chem. Eng. 2016, 4, 5979–5988. [Google Scholar] [CrossRef]
- Botto, L.; Preuss, K.; Robertson, L.X.; Xu, X.Y. Physical characterisation and yield stress of a concentrated Miscanthus suspension. Rheol. Acta 2014, 53, 805–815. [Google Scholar] [CrossRef]
- Klímek, P.; Wimmer, R.; Meinlschmidt, P.; Kúdela, J. Utilizing Miscanthus stalks as raw material for particleboards. Ind. Crop Prod. 2018, 111, 270–276. [Google Scholar] [CrossRef]
- Pude, R. Morphological, Chemical and Technical Parameters of Miscanthus Genotypes. J. Appl. Bot. Food Qual. 2004, 78, 58–63. [Google Scholar]
- Domeño, I.; Irigoyen, I.; Muro, J. Evolution of organic matter and drainages in wood fibre and coconut fibre substrates. Sci. Hortic. 2009, 122, 269–274. [Google Scholar] [CrossRef]


| Substrate | Source | Processing Method |
|---|---|---|
| Peat | Unfertilized peat 1 | na 2 |
| Coir | Unfertilized coir | |
| C3 | Miscanthus × giganteus | Hammermill, screen 3 mm |
| C5 | Hammermill, screen 5 mm | |
| C10 | Hammermill, screen 10 mm | |
| C15 | Hammermill, screen 15 mm | |
| S5 | Mechanical fraying facility, screen 5 mm | |
| FC | Forage harvester |
| Substrate | Bulk Density (g cm−3) | Moisture Content (%) | pH 1 | EC (dS m−1) 1 | Water-Soluble Nutrient (mg L−1 Substrate) 1 | ||||
|---|---|---|---|---|---|---|---|---|---|
| NO3 | NH4 | P | K | Ca | |||||
| Peat | 0.22 a | 40.3 b | 6.6 b | nd. | nd. | nd. | 42.7 d | 3.8 f | nd. |
| Coir | 0.09 f | 51.1 a | 6.7 a | nd. | nd. | 6.3 e | nd. | 28.8 f | nd. |
| C3 | 0.16 b | 9.7 cd | 6.2 cd | 0.7 a | 32.5 a | 117.5 a | 144.3 a | 1861.3 a | 48.8 a |
| C5 | 0.14 c | 10.1 cd | 6.3 cd | 0.6 b | 25.0 abc | 107.5 b | 117.6 b | 1678.8 b | 33.8 ab |
| C10 | 0.13 d | 10.3 cd | 6.3 c | 0.5 c | 23.8 abc | 103.8 b | 101.7 b | 1551.3 c | 23.8 b |
| C15 | 0.12 d | 9.2 d | 6.3 cd | 0.4 d | 20.0 bc | 90.0 c | 67.6 c | 1321.3 d | 26.3 b |
| S5 | 0.15 c | 10.6 cd | 6.2 d | 0.5 c | 27.5 ab | 100.0 b | 99.5 b | 1541.3 c | 31.3 b |
| FC | 0.10 e | 12.3 c | 6.3 cd | 0.3 e | 16.3 c | 80.0 d | 50.6 cd | 1041.3 e | 21.3 b |
| Substrate | Fraction (%) 1 | Percentile Values (mm) 2 | Non-Uniformity 3 | Specific Surface (1 mm−1) 4 | ||||
|---|---|---|---|---|---|---|---|---|
| Fine | Medium | Coarse | d10 | d50 | d90 | |||
| Particle width | ||||||||
| Peat | 47.5 ± 6.6 b | 39.4 ± 6.3 c | 13 ± 0.4 e | 0.16 d | 0.53 de | 2.69 c | 4.3 ± 0.3 a | 16.3 ± 2.4 a |
| Coir | 40.1 ± 2.0 c | 53.4 ± 1.8 b | 6.4 ± 0.3 f | 0.21 d | 0.61 cd | 1.68 d | 3.6 ± 0.1 bc | 12.7 ± 0.6 b |
| C3 | 55.4 ± 4.0 a | 43.6 ± 4.1 c | 1.0 ± 0.2 h | 0.17 d | 0.46 e | 1.04 e | 3.1 ± 0.0 cd | 15.7 ± 1.1 a |
| C5 | 31.9 ± 2.2 d | 64.6 ± 1.9 a | 3.5 ± 0.5 g | 0.23 d | 0.70 c | 1.53 d | 3.6 ± 0.2 b | 10.9 ± 0.4 b |
| C10 | 9.4 ± 0.6 e | 62.7 ± 1.4 a | 27.9 ± 1.9 c | 0.52 b | 1.39 b | 2.91 bc | 3.2 ± 0.0 bcd | 5.2 ± 0.1 c |
| C15 | 14.3 ± 1.3 e | 54.6 ± 0.4 b | 31.1 ± 1.2 b | 0.37 c | 1.41 b | 3.30 b | 4.6 ± 0.4 a | 6.7 ± 0.4 c |
| S5 | 10.5 ± 1.0 e | 65.6 ± 0.5 a | 23.9 ± 0.8 d | 0.49 b | 1.33 b | 2.61 c | 3.2 ± 0.1 bcd | 5.1 ± 0.2 c |
| FC | 2.1 ± 0.6 f | 23.5 ± 0.7 d | 74.4 ± 1.0 a | 1.18 a | 3.10 a | 6.51 a | 3.0 ± 0.2 d | 2.3 ± 0.2 d |
| Particle length | ||||||||
| Peat | 26.9 ± 6.9 a | 54.1 ± 2.8 b | 19.0 ± 4.7 f | 0.27 d | 0.88 e | 3.35 d | 4.1 ± 0.3 c | 22.4 ± 3.9 a |
| Coir | 22.1 ± 2.0 a | 58.5 ± 1.0 a | 19.4 ± 1.2 f | 0.31 d | 0.94 e | 3.03 d | 3.8 ± 0.1 cd | 14.6 ± 0.8 c |
| C3 | 20.4 ± 3.2 a | 53.4 ± 0.7 b | 26.2 ± 3.3 e | 0.32 d | 1.11 e | 3.02 d | 4.4 ± 0.1 c | 18.7 ± 1.3 b |
| C5 | 11.5 ± 1.0 b | 32.7 ± 0.9 c | 55.8 ± 0.8 d | 0.45 cd | 2.32 d | 5.27 d | 6.5 ± 0.5 b | 13.4 ± 0.5 c |
| C10 | 2.6 ± 0.2 c | 11.7 ± 0.8 d | 85.7 ± 0.7 b | 1.47 b | 5.06 b | 9.50 c | 3.9 ± 0.1 cd | 6.5 ± 0.2 d |
| C15 | 6.6 ± 0.9 bc | 13.9 ± 0.7 d | 78.5 ± 1.7 c | 0.68 c | 5.23 b | 12.29 b | 9.3 ± 1.2 a | 9.4 ± 0.6 d |
| S5 | 1.9 ± 0.2 c | 13.4 ± 0.4 d | 84.7 ± 0.6 b | 1.45 b | 4.63 c | 7.95 c | 3.6 ± 0.1 cd | 6.8 ± 0.1 d |
| FC | 0.8 ± 0.3 c | 2.3 ± 0.5 e | 96.9 ± 0.9 a | 4.39 a | 11.38 a | 26.92 a | 3.0 ± 0.2 d | 2.6 ± 0.2 e |
| Substrate | Aspect Ratio (b/l) | Sphericity (SPHT) | Symmetry (Symm) | ||||||
|---|---|---|---|---|---|---|---|---|---|
| Fine | Medium | Coarse | Fine | Medium | Coarse | Fine | Medium | Coarse | |
| Size fractions based on particle width | |||||||||
| Peat | 0.51 b | 0.57 b | 0.58 a | 0.47 d | 0.50 b | 0.46 ab | 0.70 e | 0.72 c | 0.73 bc |
| Coir | 0.62 a | 0.60 a | 0.59 a | 0.69 a | 0.63 a | 0.48 a | 0.82 a | 0.82 a | 0.81 a |
| C3 | 0.49 bc | 0.48 c | 0.52 b | 0.50 cd | 0.33 e | 0.10 d | 0.75 d | 0.67 d | 0.62 d |
| C5 | 0.47 cd | 0.40 d | 0.49 b | 0.53 bc | 0.39 d | 0.25 c | 0.78 c | 0.72 c | 0.62 d |
| C10 | 0.42 e | 0.34 e | 0.48 bc | 0.52 bc | 0.41 cd | 0.34 bc | 0.80 bc | 0.77 b | 0.70 cd |
| C15 | 0.49 bc | 0.33 f | 0.43 cd | 0.58 b | 0.42 cd | 0.26 c | 0.80 ab | 0.78 b | 0.65 cd |
| S5 | 0.37 f | 0.35 e | 0.52 b | 0.47 d | 0.46 bc | 0.47 a | 0.79 bc | 0.80 a | 0.75 ab |
| FC | 0.45 de | 0.32 g | 0.41 d | 0.53 bc | 0.42 cd | 0.40 ab | 0.80 b | 0.81 a | 0.77 ab |
| Size fractions based on particle length | |||||||||
| Peat | 0.49 cd | 0.35 b | 0.31 a | 0.59 cd | 0.39 d | 0.19 de | 0.76 d | 0.66 e | 0.50 e |
| Coir | 0.60 a | 0.47 a | 0.23 b | 0.74 a | 0.56 a | 0.20 d | 0.84 a | 0.76 b | 0.60 d |
| C3 | 0.47 de | 0.27 d | 0.28 a | 0.58 d | 0.37 e | 0.15 e | 0.78 c | 0.72 d | 0.65 c |
| C5 | 0.46 de | 0.27 d | 0.16 c | 0.61 cd | 0.40 d | 0.22 cd | 0.81 b | 0.74 c | 0.72 b |
| C10 | 0.46 de | 0.28 d | 0.19 c | 0.63 bc | 0.43 c | 0.24 bc | 0.83 ab | 0.76 ab | 0.73 b |
| C15 | 0.50 b | 0.27 d | 0.18 c | 0.66 b | 0.42 c | 0.20 cd | 0.83 ab | 0.76 b | 0.69 c |
| S5 | 0.45 e | 0.28 d | 0.15 c | 0.61 cd | 0.42 c | 0.26 b | 0.83 ab | 0.76 b | 0.77 a |
| FC | 0.50 bc | 0.32 c | 0.22 b | 0.63 bc | 0.46 b | 0.32 a | 0.82 ab | 0.76 a | 0.79 a |
| Substrate | IMC 1 | HS 2 | HE1 3 | RE 4 | Swelling 5 | Risk Level of Hydrophobicity 6 |
|---|---|---|---|---|---|---|
| Peat | 67 | 1 | 0.96 a | 0.90 b | 0 ± 0 | no risk of hydrophobicity, but less hydrophilic than coir |
| 50 | 1 | 0.94 a | 0.92 b | 0 ± 0 | ||
| 25 | 2 | 0.71 b | 1.03 a | 2.6 ± 2.1 | ||
| non-wet | 3 | 0.56 b | 0.81 c | −1.2 ± 2.4 | ||
| Coir | 67 | 1 | 0.91 a | 0.91 b | 0 ± 0 | no risk of hydrophobicity |
| 50 | 1 | 0.92 a | 0.93 b | 0 ± 0 | ||
| 25 | 2 | 0.83 a | 1.04 a | 6.0 ± 1.1 | ||
| non-wet | 3 | 0.58 b | 0.94 b | 0.8 ± 1.7 | ||
| C3 | 67 | 2 | 0.83 a | 0.90 b | 0 ± 0 | low and reversible risk, least hydrophobic among tested miscanthus substrates |
| 50 | 2 | 0.81 a | 0.75 c | 0 ± 0 | ||
| 25 | 3 | 0.63 b | 0.87 b | 0 ± 0 | ||
| non-wet | 1 | 0.94 a | 1.02 a | 1.2 ± 1.4 | ||
| C5 | 67 | 3 | 0.82 a | 0.91 b | 0 ± 0 | low and reversible risk, 2nd less hydrophobic among tested miscanthus substrates |
| 50 | 3 | 0.77 a | 0.83 b | 0 ± 0 | ||
| 25 | 3 | 0.52 b | 0.86 b | 0 ± 0 | ||
| non-wet | 2 | 0.78 a | 1.00 a | 2.4 ± 1.7 | ||
| C10 | 67 | 2 | 0.85 a | 0.93 a | 0 ± 0 | low and reversible risk, 3rd hydrophobic among tested miscanthus substrates |
| 50 | 3 | 0.75 ab | 0.85 b | 0 ± 0 | ||
| 25 | 3 | 0.55 c | 0.87 b | 0 ± 0 | ||
| non-wet | 2 | 0.64 bc | 0.94 a | 5.1 ± 3.0 | ||
| C15 | 67 | 2 | 0.85 a | 0.92 ab | 0 ± 0 | low and reversible risk, 3rd hydrophobic among tested miscanthus substrates |
| 50 | 2 | 0.81 a | 0.88 ab | 0 ± 0 | ||
| 25 | 3 | 0.45 c | 0.86 b | 0 ± 0 | ||
| non-wet | 3 | 0.59 b | 0.93 a | 5.5 ± 2.5 | ||
| S5 | 67 | 2 | 0.86 a | 0.90 ab | 0 ± 0 | low and reversible risk, 4th hydrophobic among tested miscanthus substrates |
| 50 | 3 | 0.75 a | 0.84 b | 0 ± 0 | ||
| 25 | 4 | 0.35 c | 0.84 b | 0 ± 0 | ||
| non-wet | 3 | 0.54 b | 0.95 a | 8.0 ± 1.7 | ||
| FC | 67 | 2 | 0.86 a | 0.99 ns | 0 ± 0 | low and reversible risk 4th hydrophobic among tested miscanthus substrates |
| 50 | 3 | 0.78 a | 0.91 | 0 ± 0 | ||
| 25 | 4 | 0.42 b | 0.88 | 2.6 ± 4.6 | ||
| non-wet | 3 | 0.53 b | 0.94 | 4.0 ± 2.4 |
| Substrate | Initial pH | pH Buffering Capacity (mol H+ kg Substrate−1 pH unit−1) 1 |
|---|---|---|
| Peat | 6.6 | 0.13 |
| Coir | 6.7 | 0.18 |
| C3 | 6.2 | 0.08 |
| C5 | 6.3 | 0.10 |
| C10 | 6.3 | 0.09 |
| C15 | 6.3 | 0.09 |
| S5 | 6.2 | 0.09 |
| FC | 6.3 | 0.09 |
| Compost (different component) | 6.4–8.8 | 0.29–0.45 [48] |
| Substrate | NO3 Concentration in Extract Solution (mg L−1) | pH in Extract Solution | NDI At Day 4 1 | ||
|---|---|---|---|---|---|
| Day 0 | Day 4 | Day 0 | Day 4 | ||
| Peat | 294.0 ± 31.6 bcd | 260.8 ± 19.7 a | 6.5 ± 0.1 b | 6.7 ± 0.1 c | 0.89 ± 0.12 a |
| Coir | 449.0 ± 60.0 a | 261.0 ± 14.9 a | 6.6 ± 0.2 b | 6.7 ± 0.2 c | 0.59 ± 0.11 b |
| C3 | 397.5 ± 32.7 ab | 174.3 ± 12.8 b | 7.1 ± 0.1 a | 7.6 ± 0.1 ab | 0.44 ± 0.07 b |
| C5 | 367.3 ± 110.7 abc | 145.8 ± 5.3 bc | 7.2 ± 0.1 a | 7.7 ± 0 ab | 0.43 ± 0.13 bc |
| C10 | 296.3 ± 61.6 bcd | 113.5 ± 22.9 cd | 7.1 ± 0.1 a | 7.7 ± 0 ab | 0.40 ± 0.13 bc |
| C15 | 273.3 ± 22.4 bcd | 108.3 ± 12.5 d | 7.2 ± 0.1 a | 7.7 ± 0 ab | 0.40 ± 0.08 bc |
| S5 | 249.3 ± 29.9 cd | 100.8 ± 15.0 d | 7.2 ± 0 a | 7.6 ± 0.1 b | 0.41 ± 0.11 bc |
| FC | 201.0 ± 45.1 c | 34.8 ± 14.1 e | 7.2 ± 0 a | 7.8 ± 0.1 a | 0.18 ± 0.09 c |
Publisher’s Note: MDPI stays neutral with regard to jurisdictional claims in published maps and institutional affiliations. |
© 2022 by the authors. Licensee MDPI, Basel, Switzerland. This article is an open access article distributed under the terms and conditions of the Creative Commons Attribution (CC BY) license (https://creativecommons.org/licenses/by/4.0/).
Share and Cite
Nguyen, V.T.H.; Kraska, T.; Winkler, W.; Aydinlik, S.; Jackson, B.E.; Pude, R. Primary Mechanical Modification to Improve Performance of Miscanthus as Stand-Alone Growing Substrates. Agronomy 2022, 12, 420. https://doi.org/10.3390/agronomy12020420
Nguyen VTH, Kraska T, Winkler W, Aydinlik S, Jackson BE, Pude R. Primary Mechanical Modification to Improve Performance of Miscanthus as Stand-Alone Growing Substrates. Agronomy. 2022; 12(2):420. https://doi.org/10.3390/agronomy12020420
Chicago/Turabian StyleNguyen, Van T. H., Thorsten Kraska, Winona Winkler, Sercan Aydinlik, Brian E. Jackson, and Ralf Pude. 2022. "Primary Mechanical Modification to Improve Performance of Miscanthus as Stand-Alone Growing Substrates" Agronomy 12, no. 2: 420. https://doi.org/10.3390/agronomy12020420