
Wood-Ash Fertiliser and Distance from Drainage Ditch Affect the Succession and Biodiversity of Vascular Plant Species in Tree Plantings on Marginal Organic Soil


Abstract
:1. Introduction
2. Materials and Methods
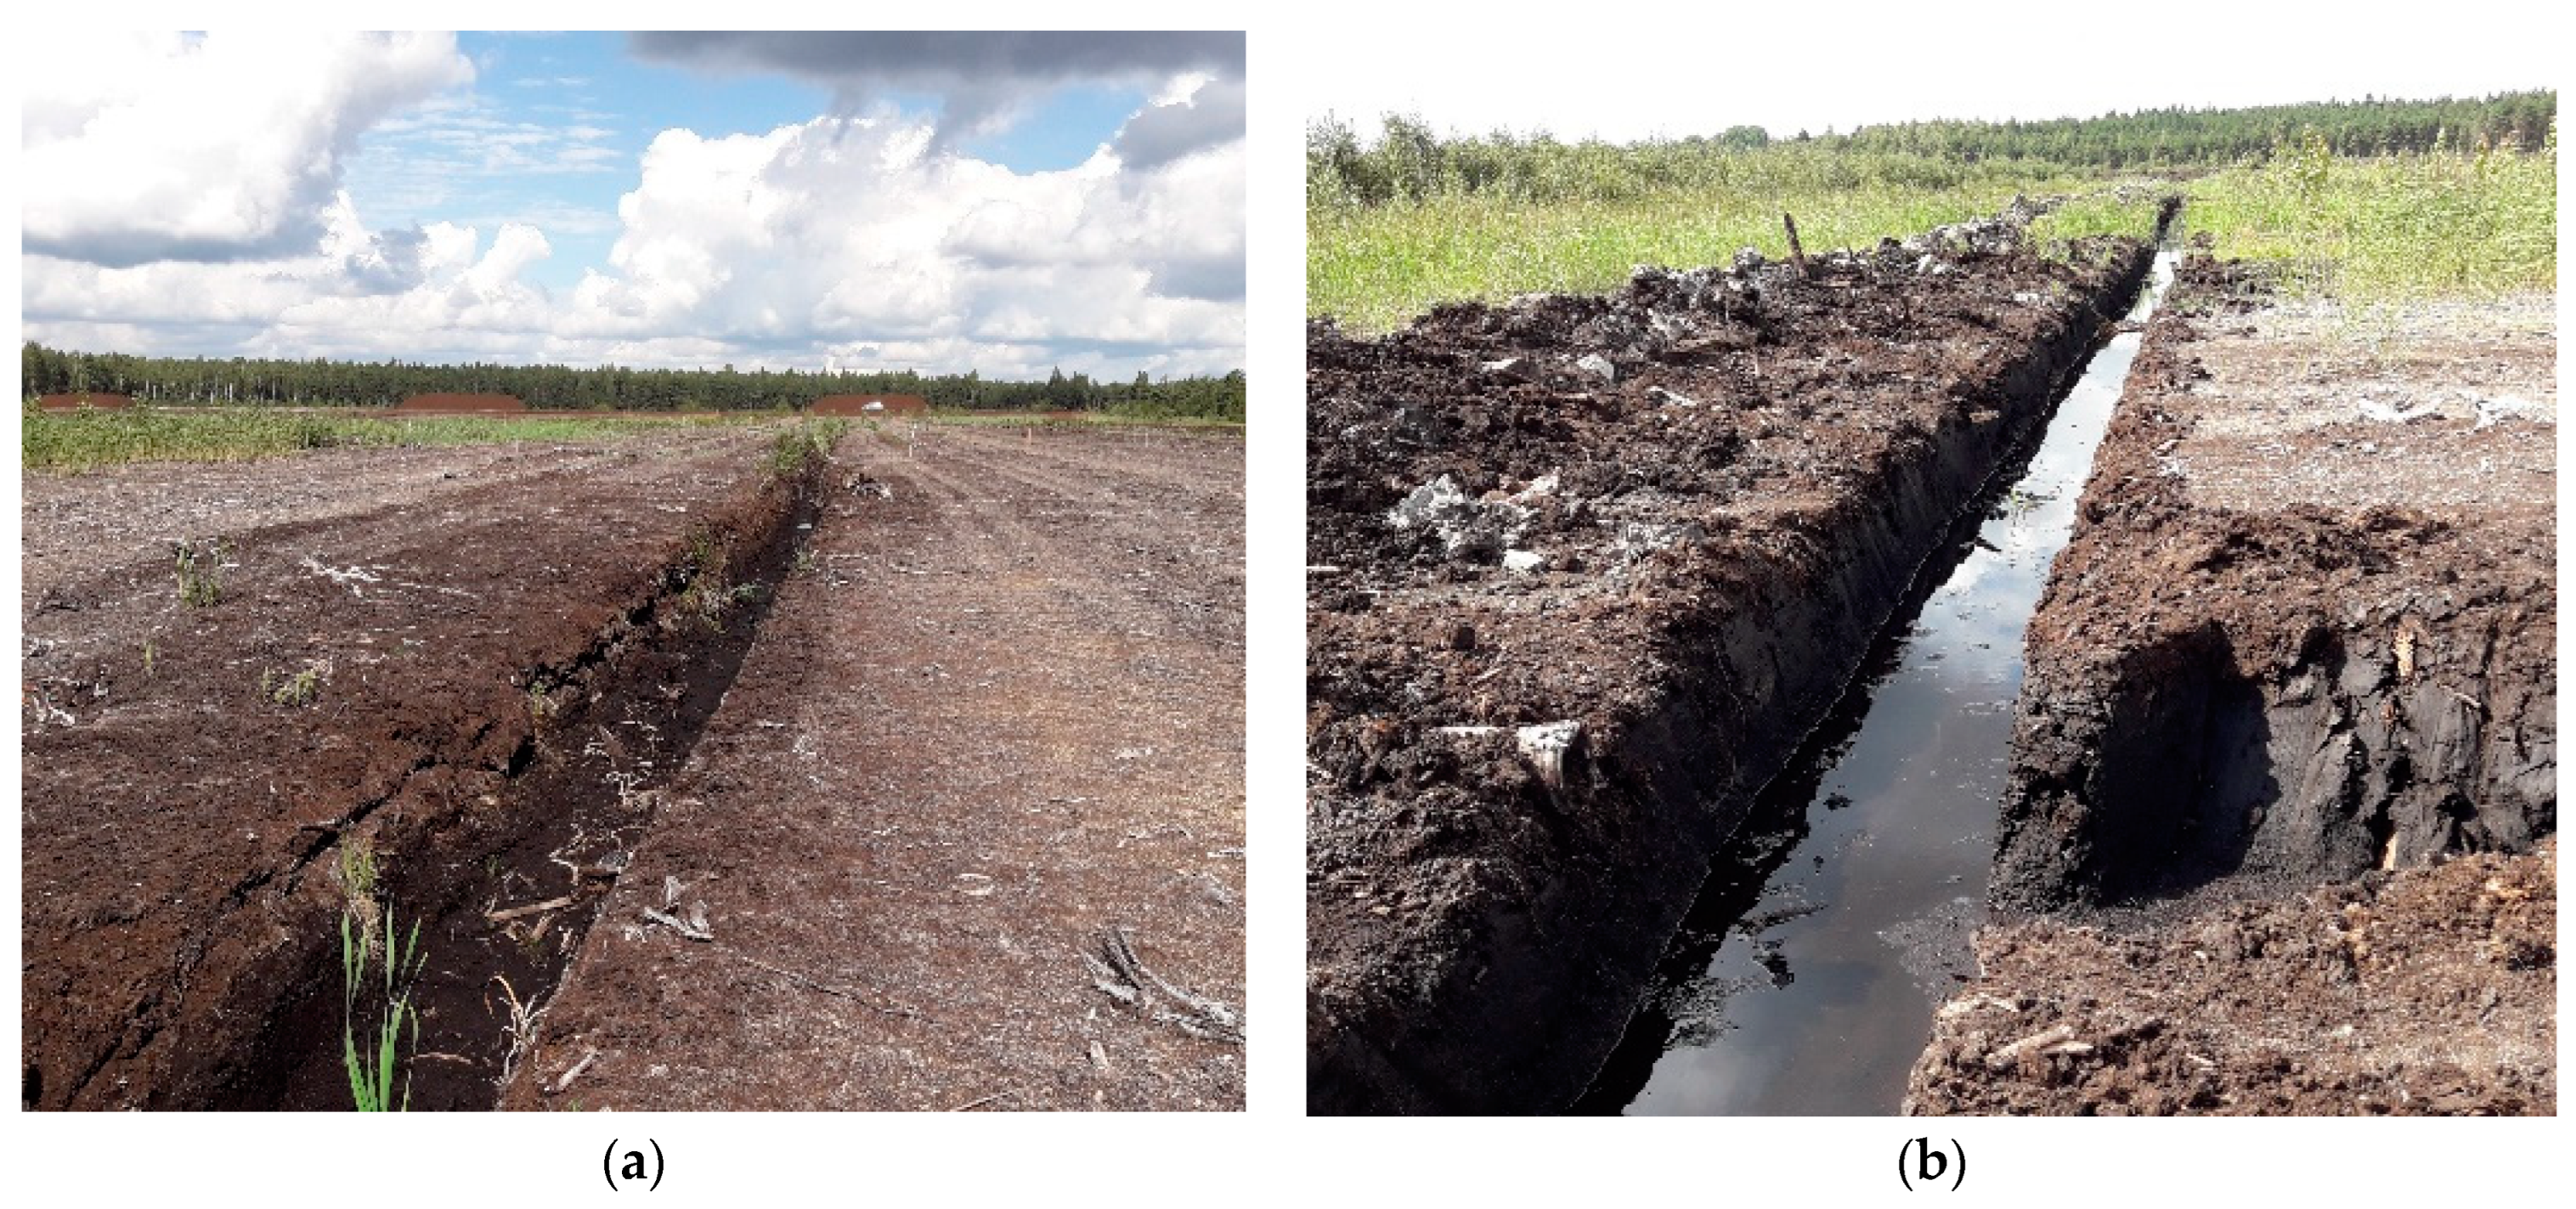
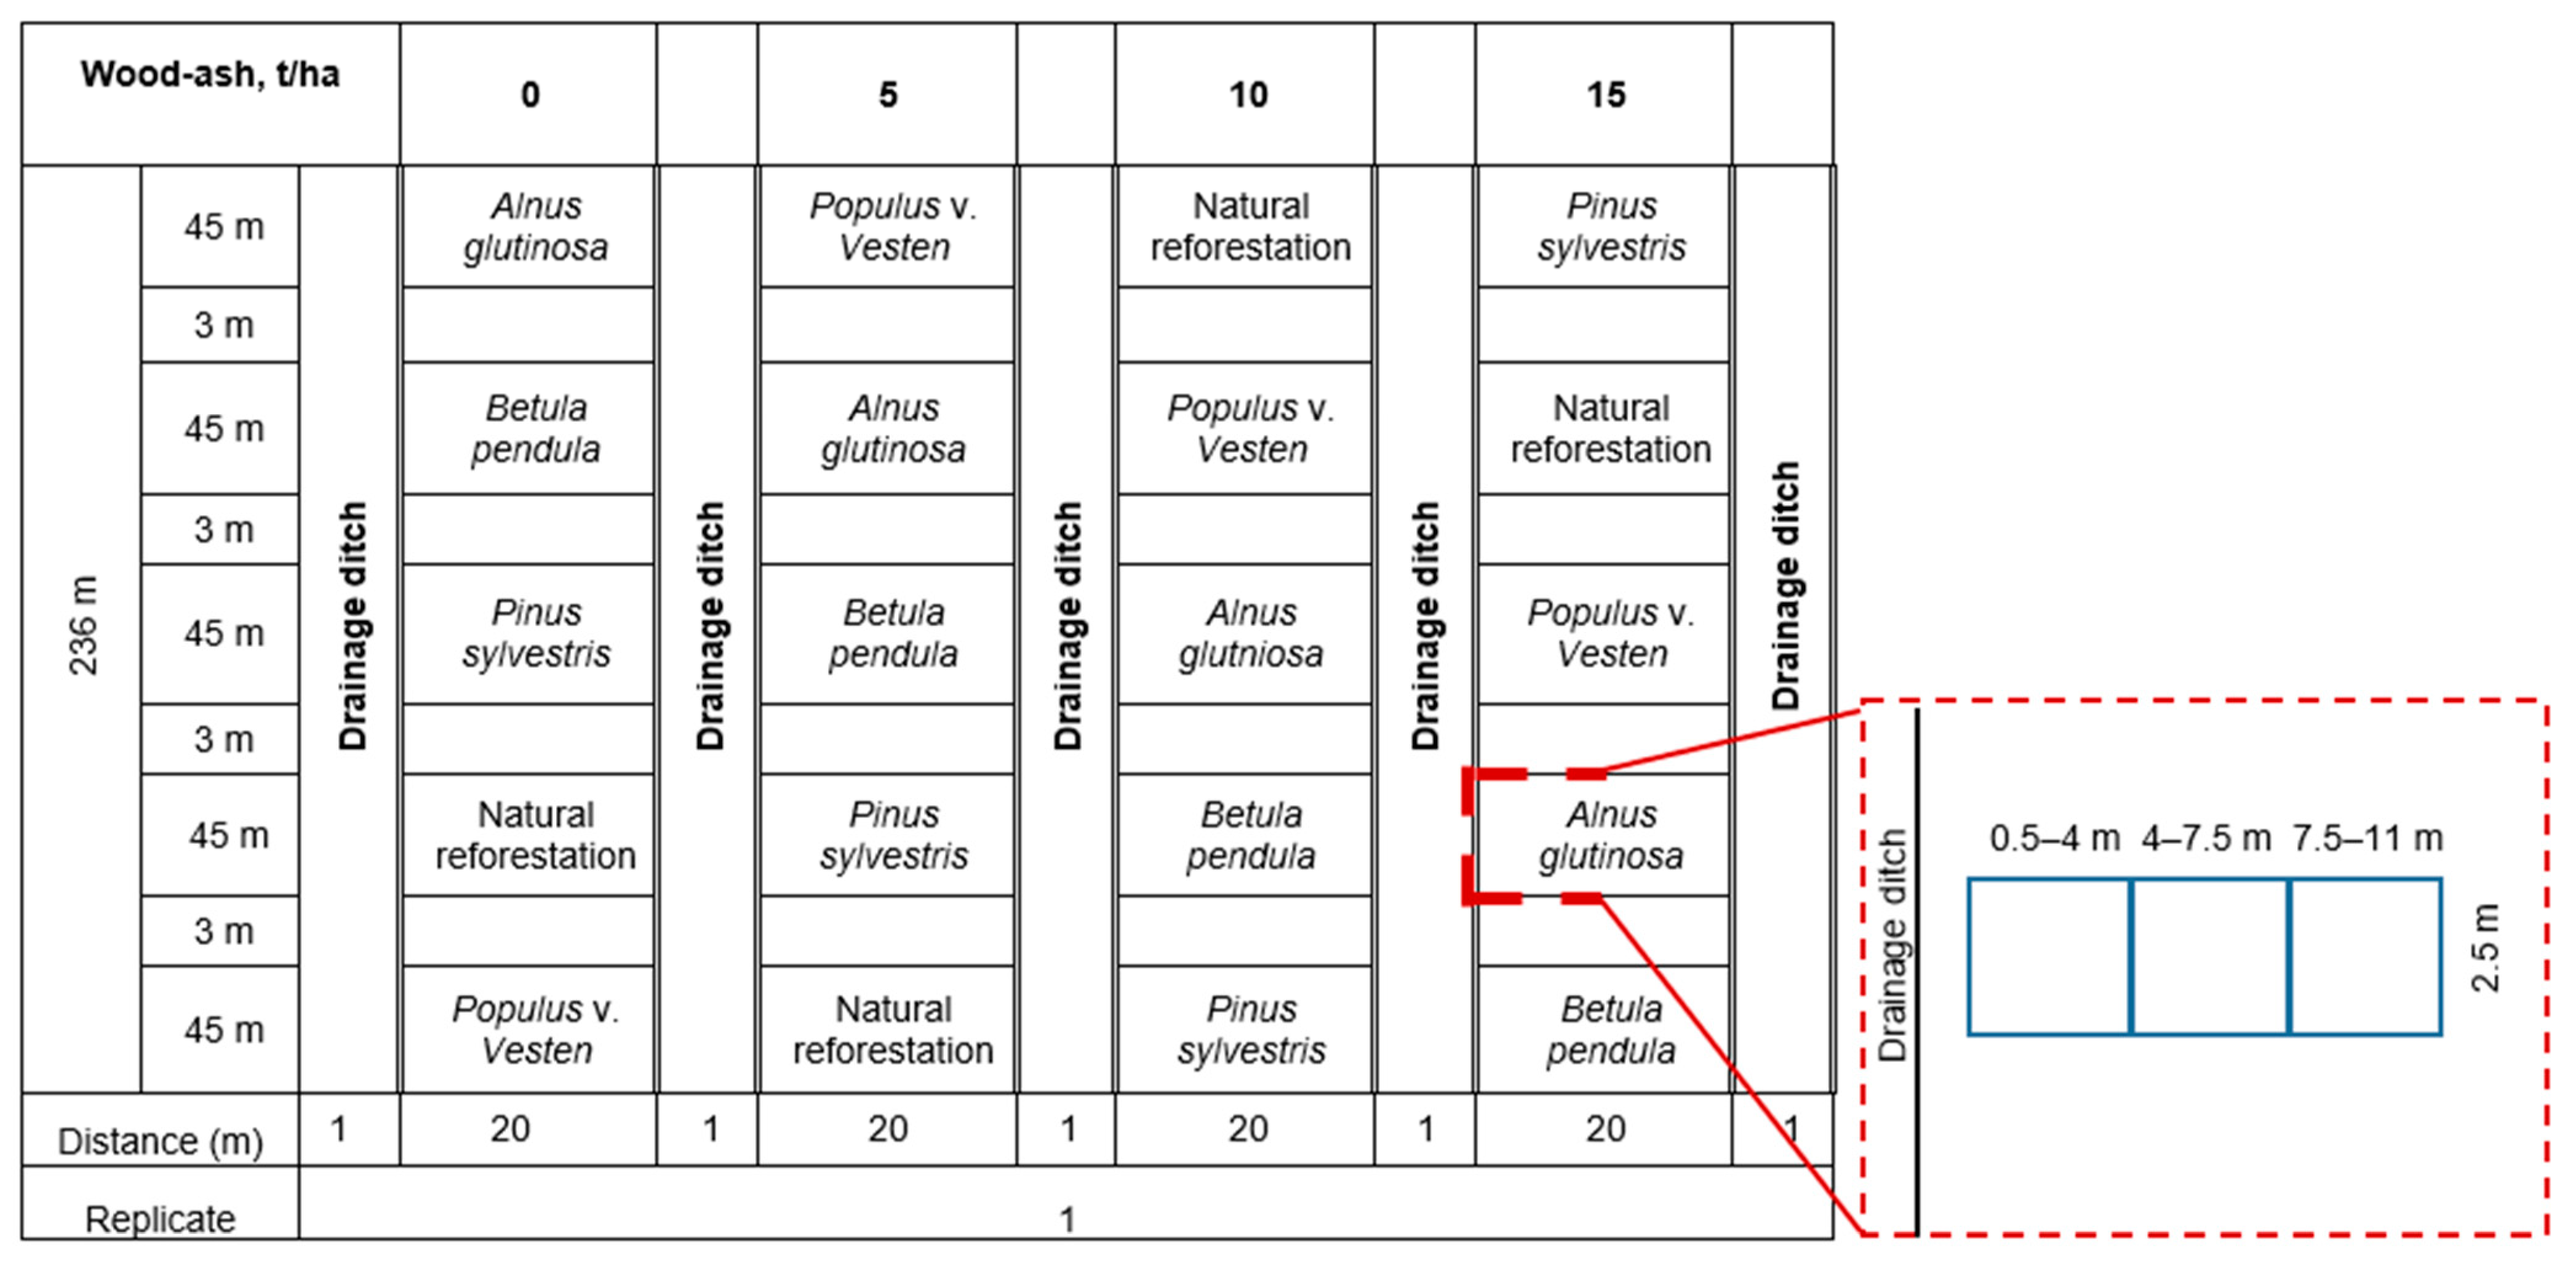
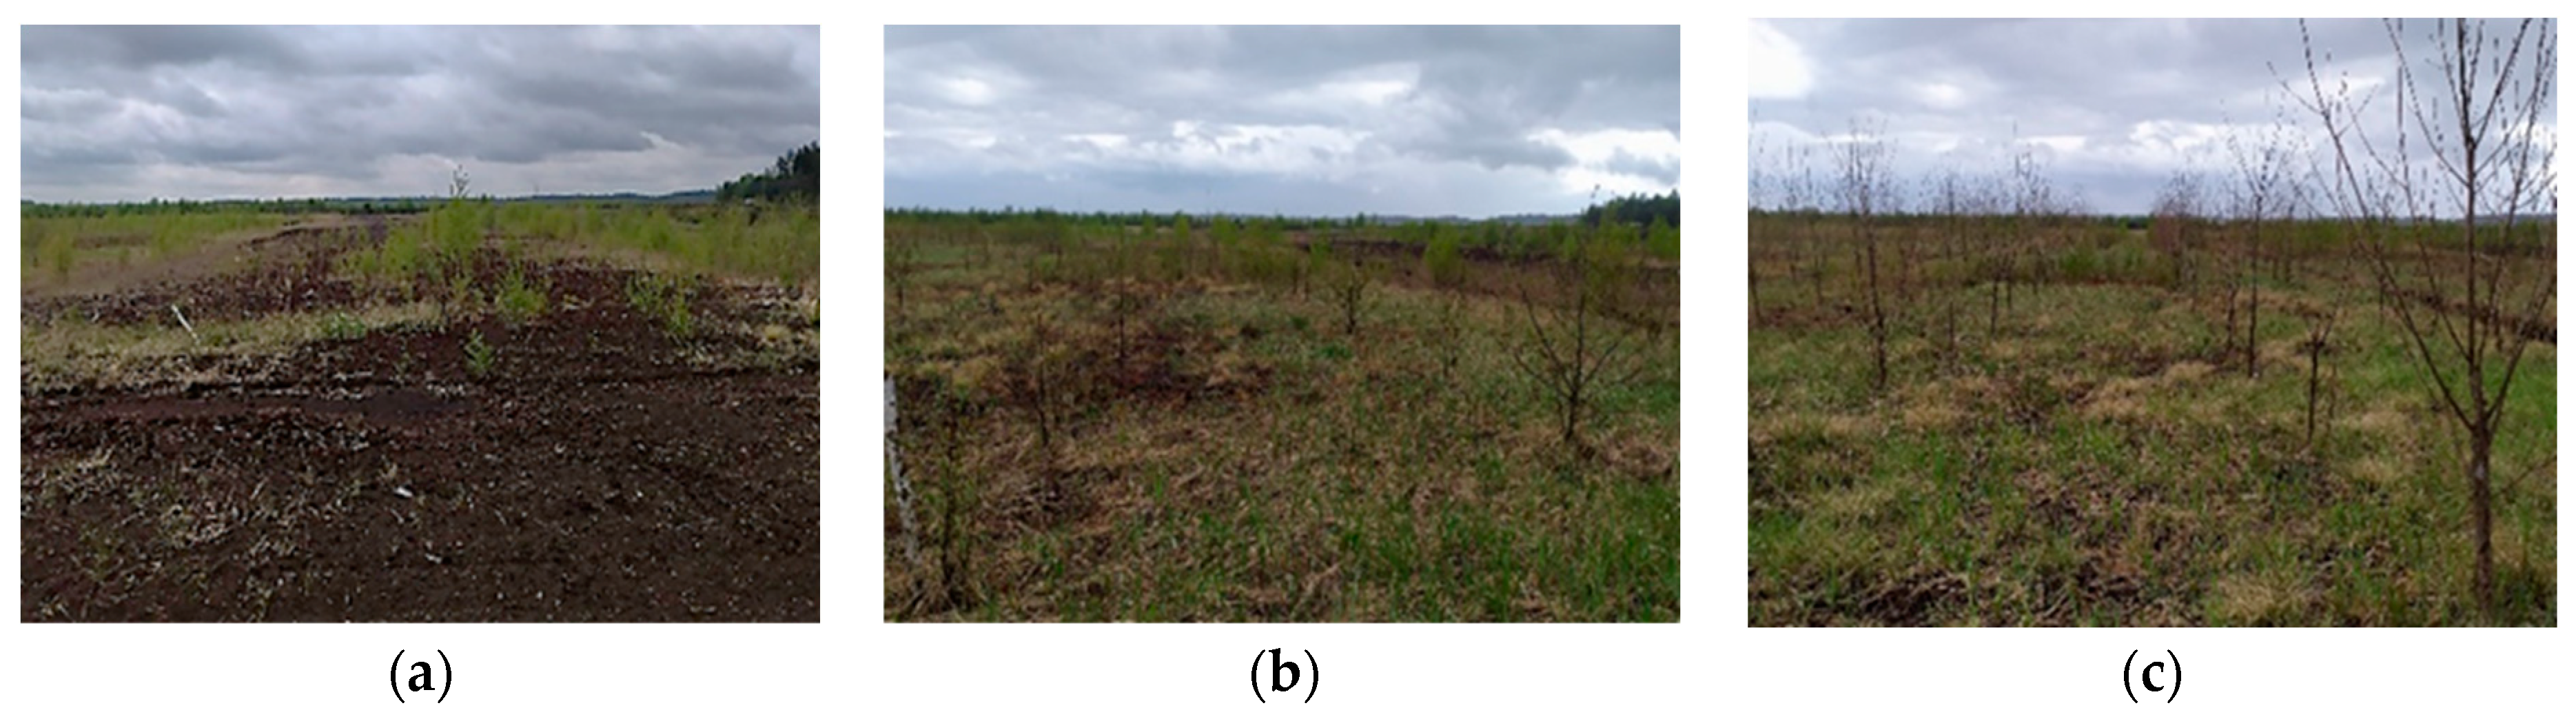
Study Site and Design
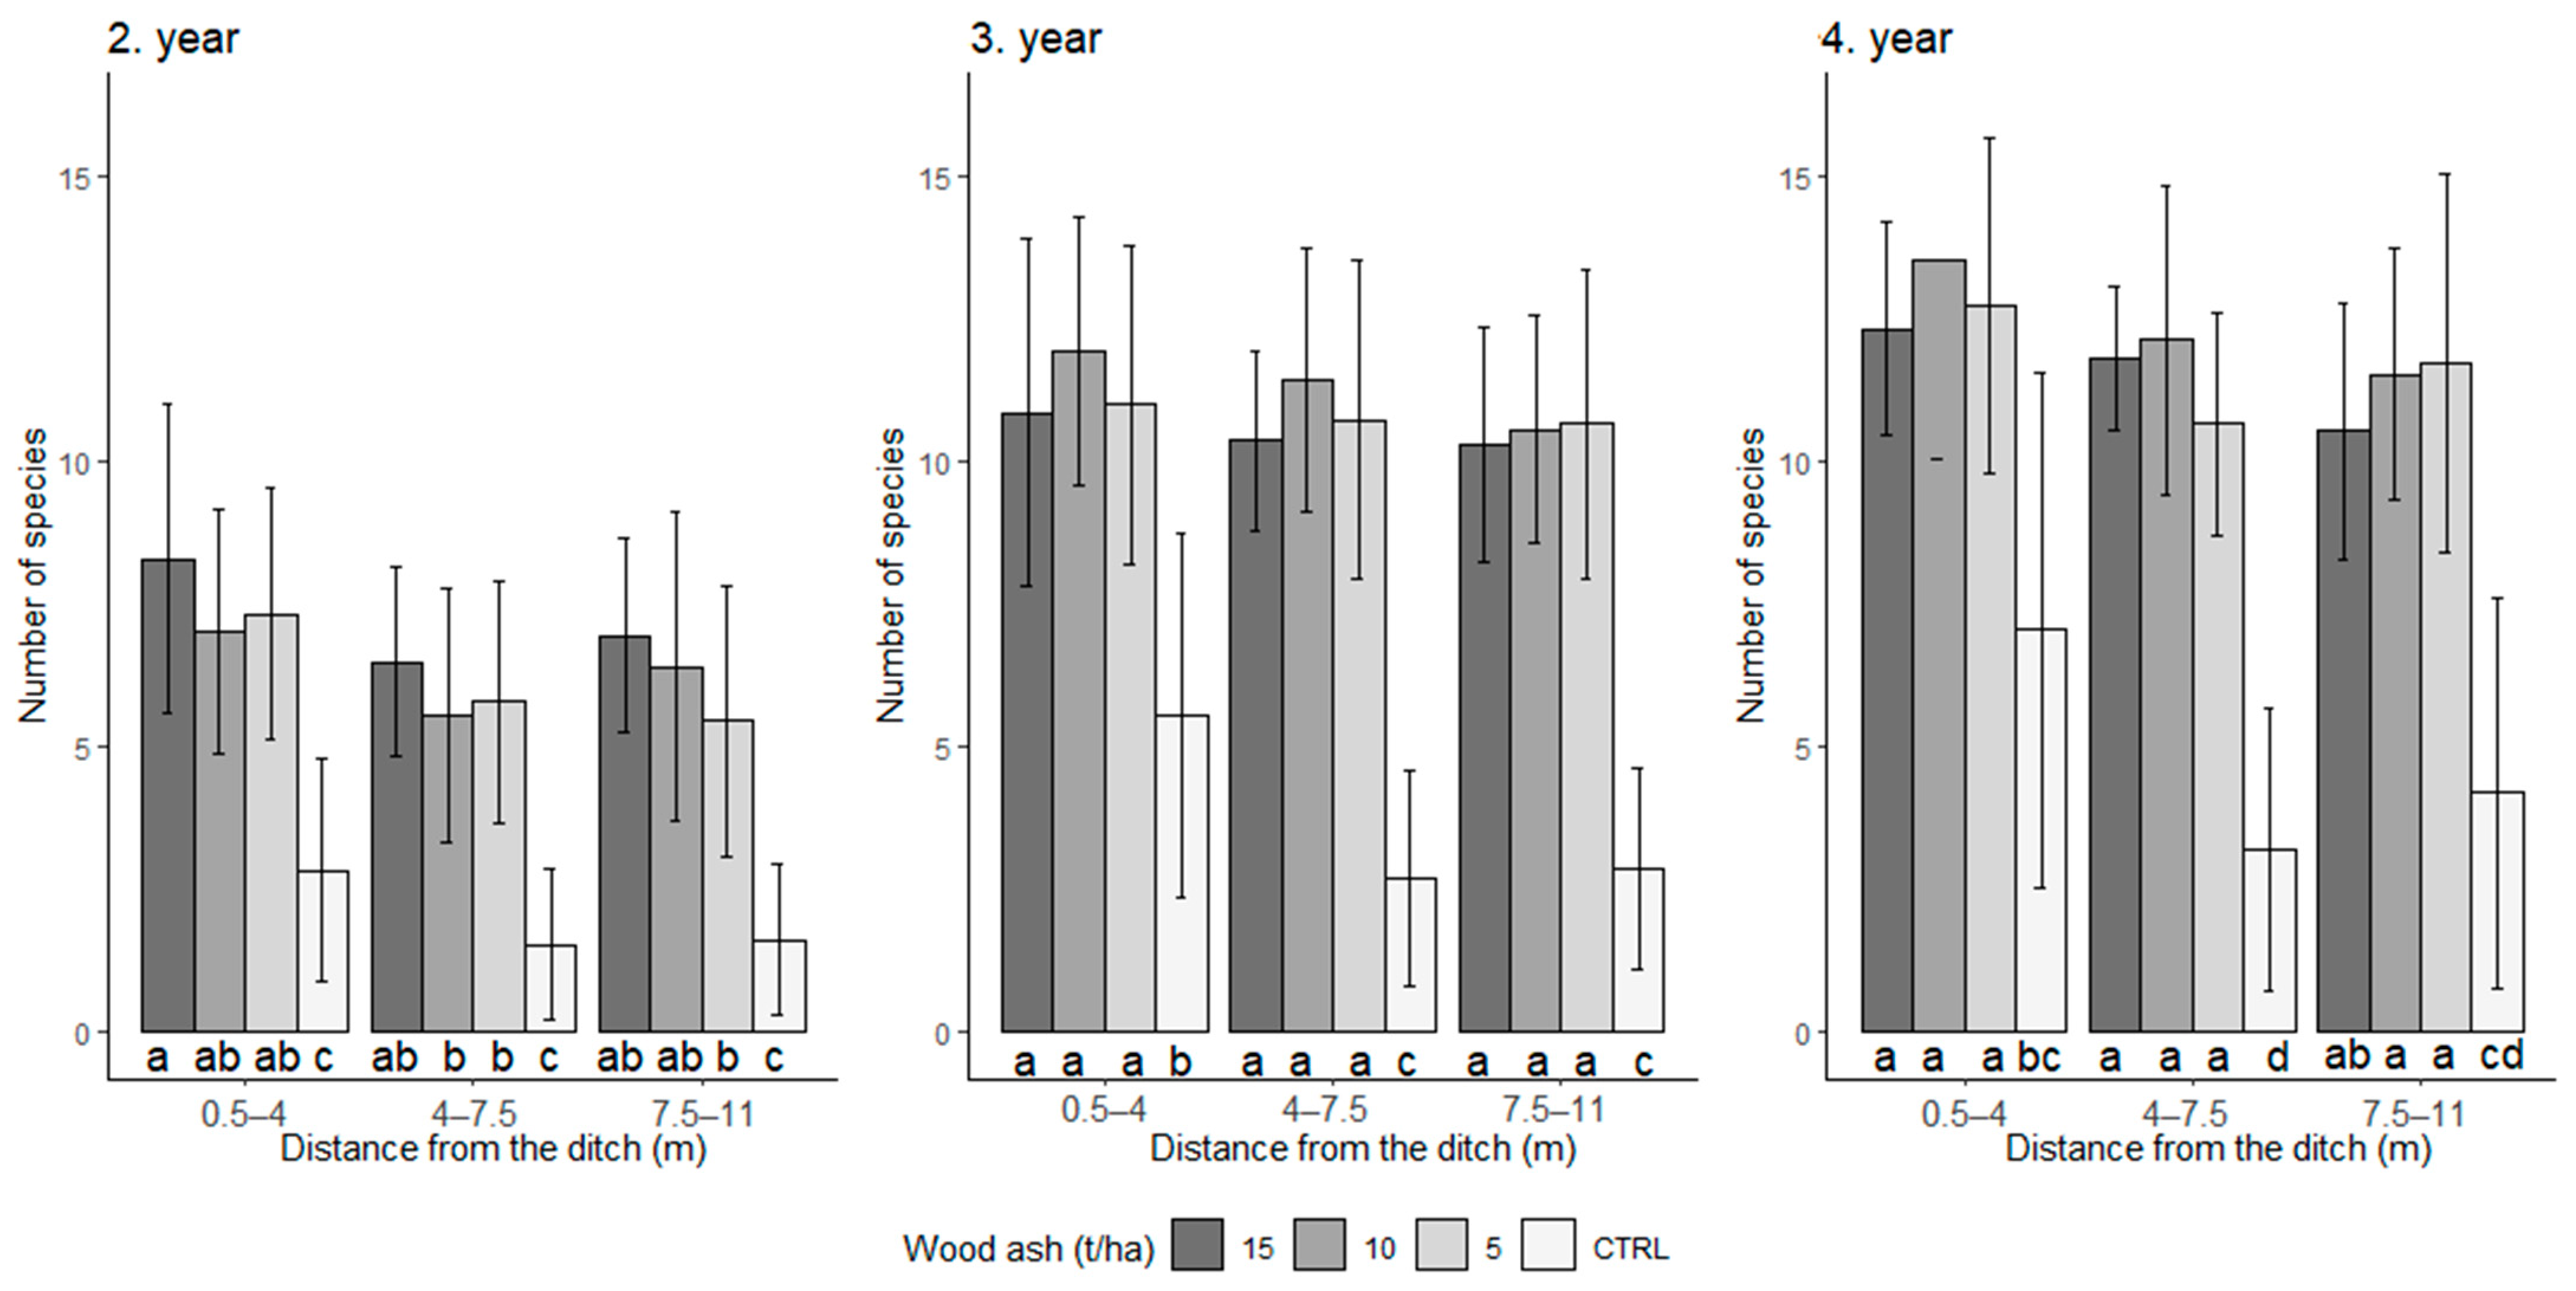
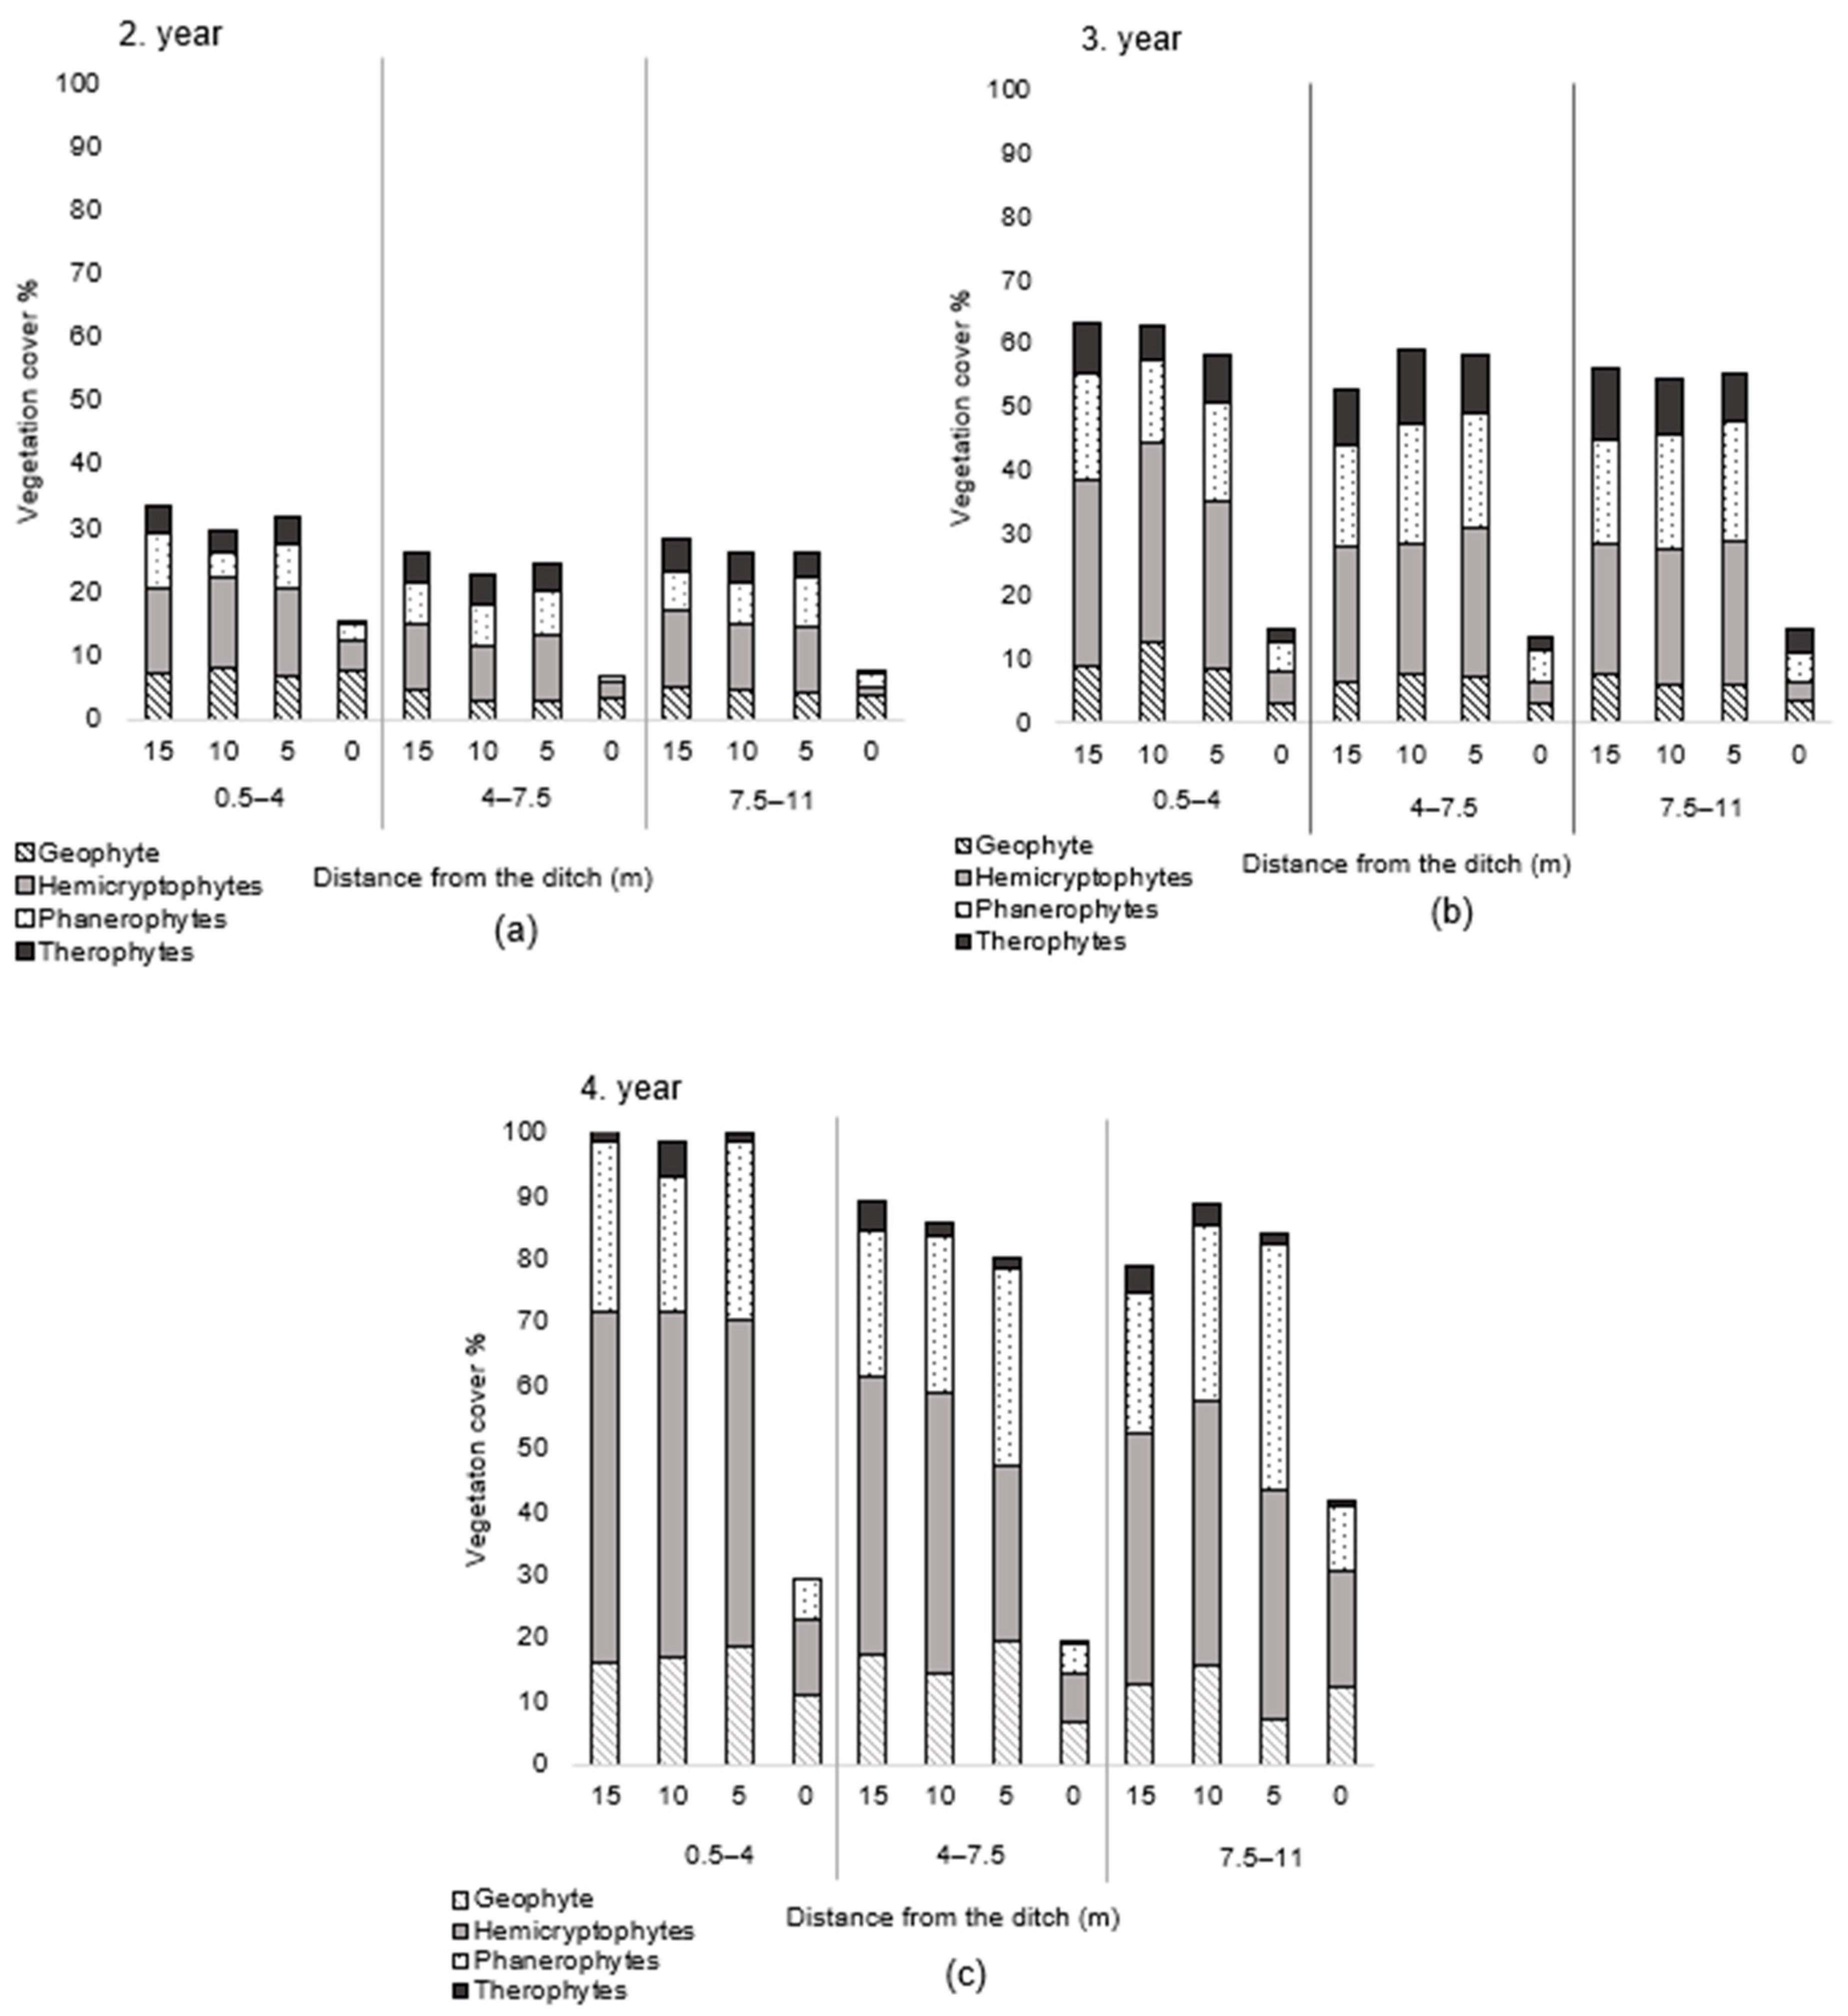
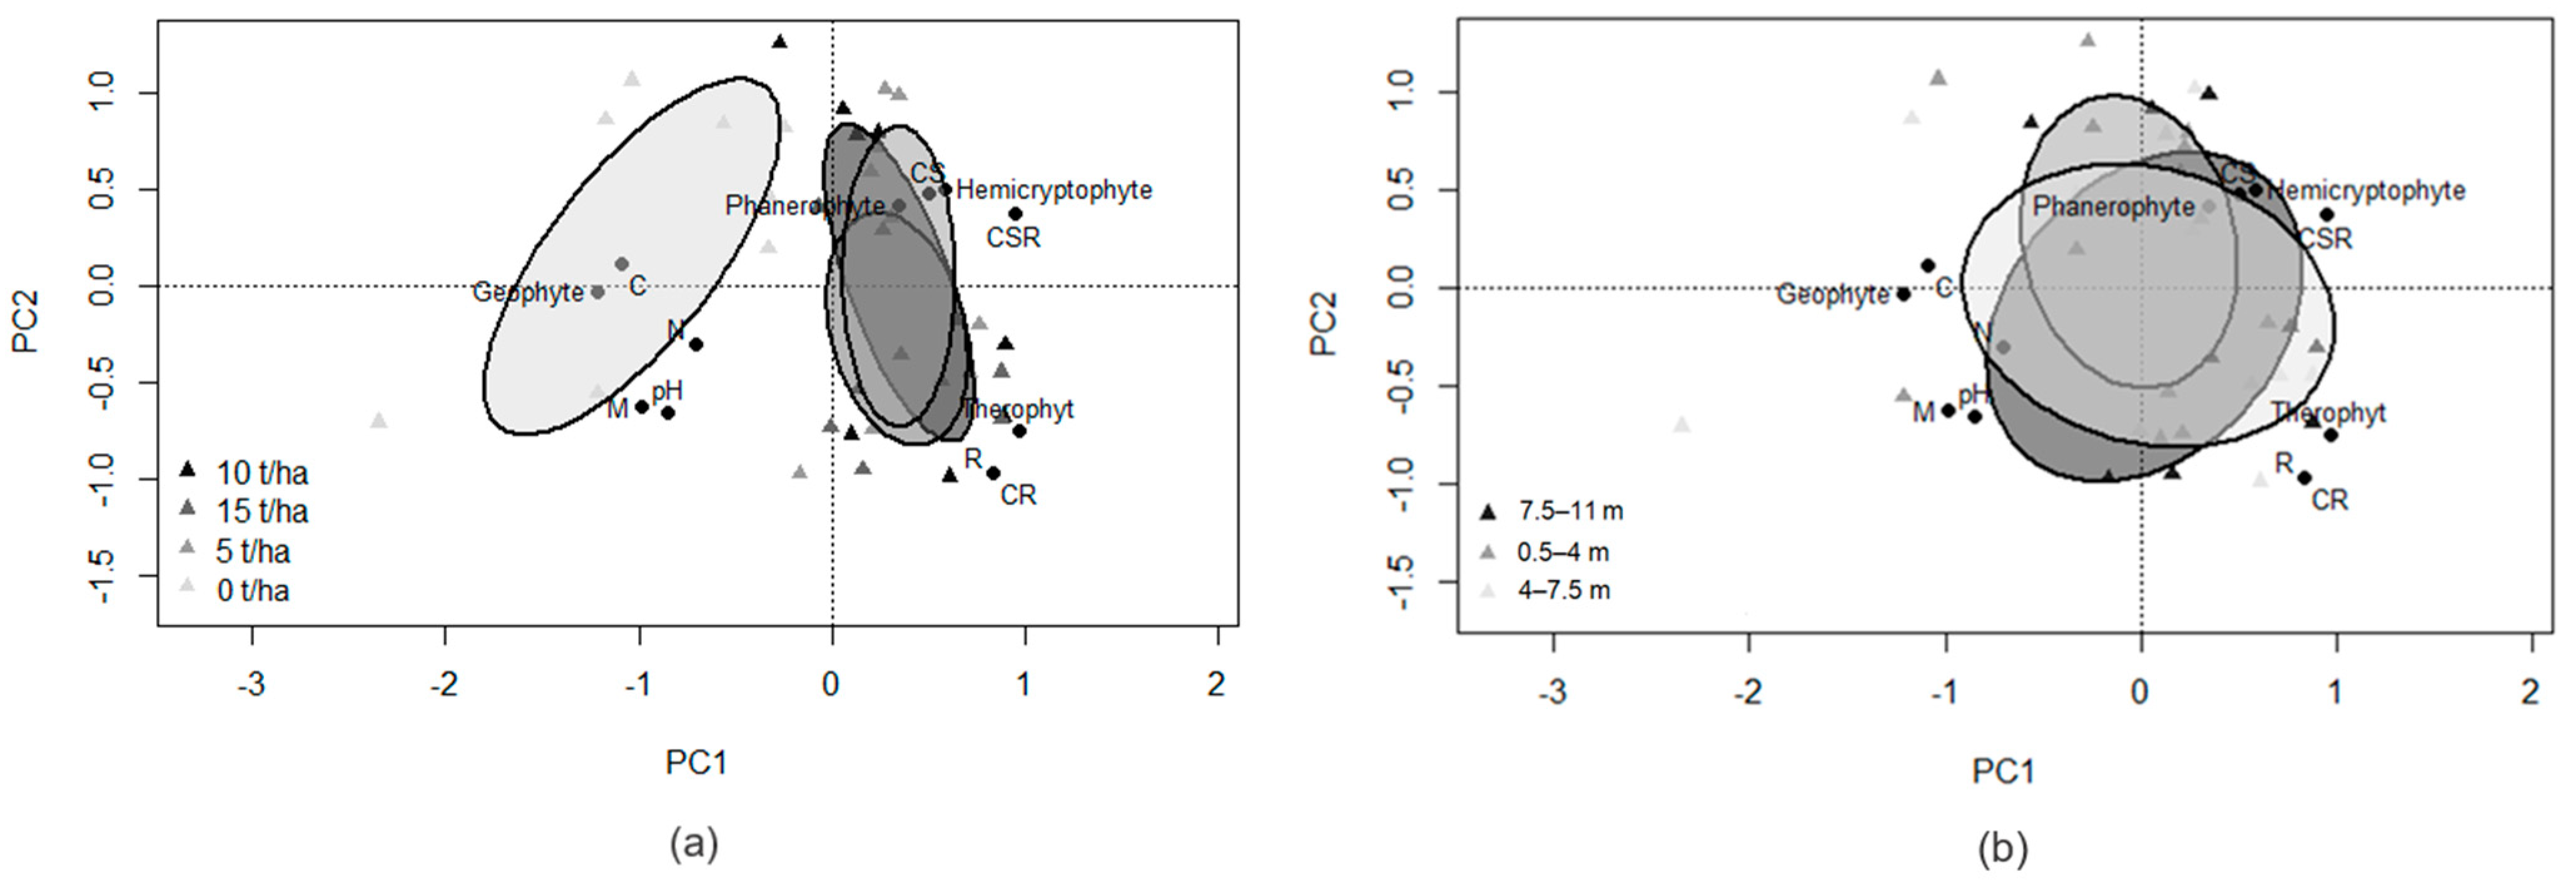
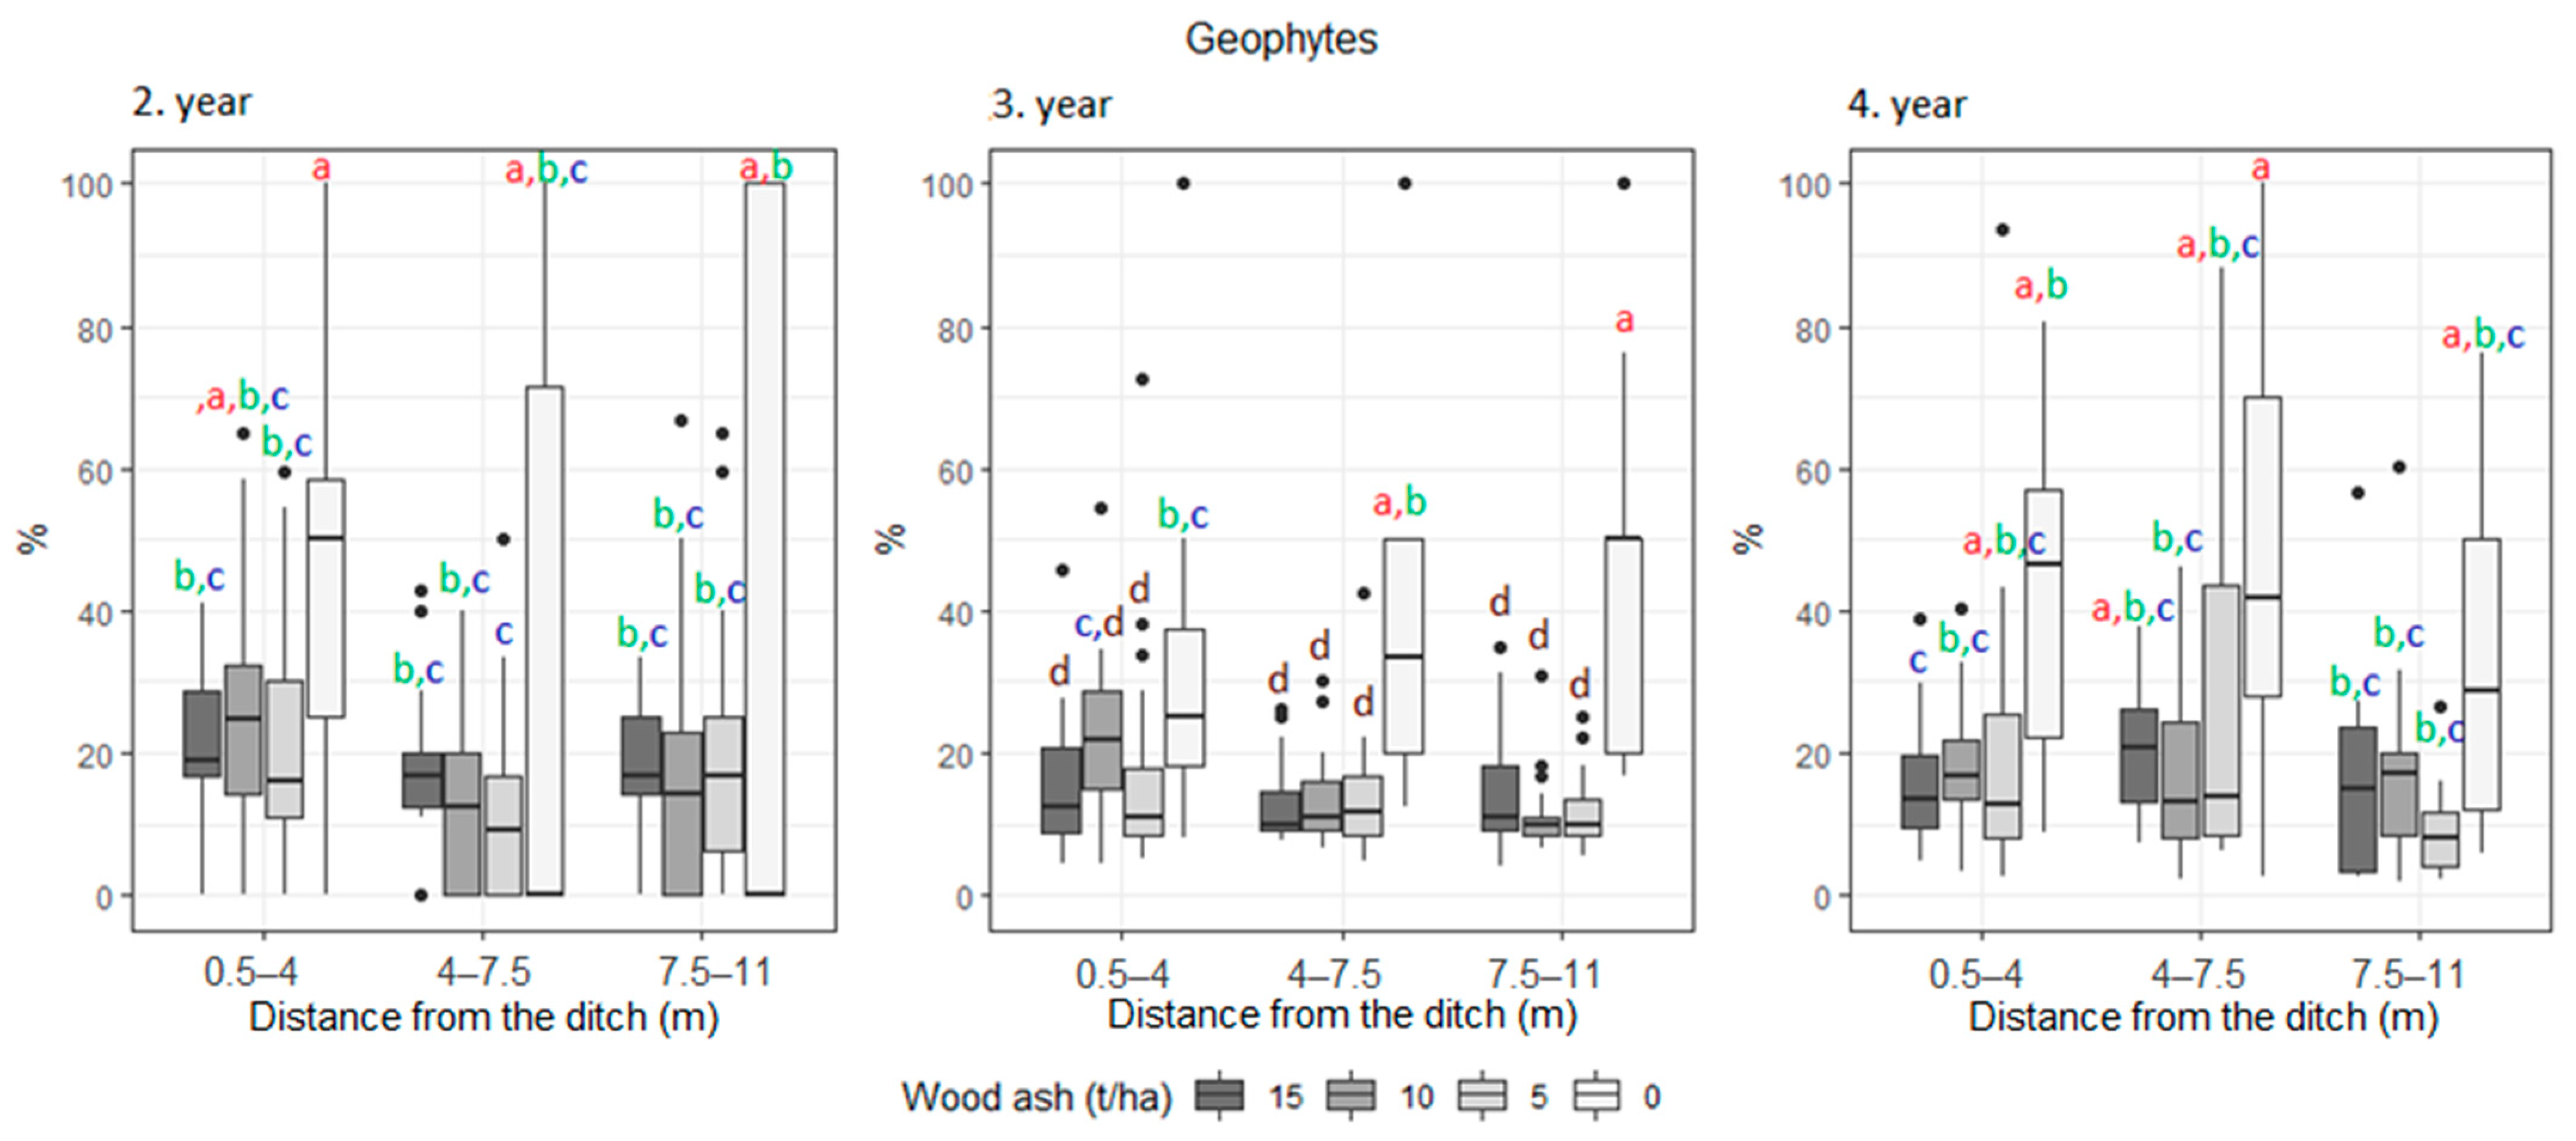
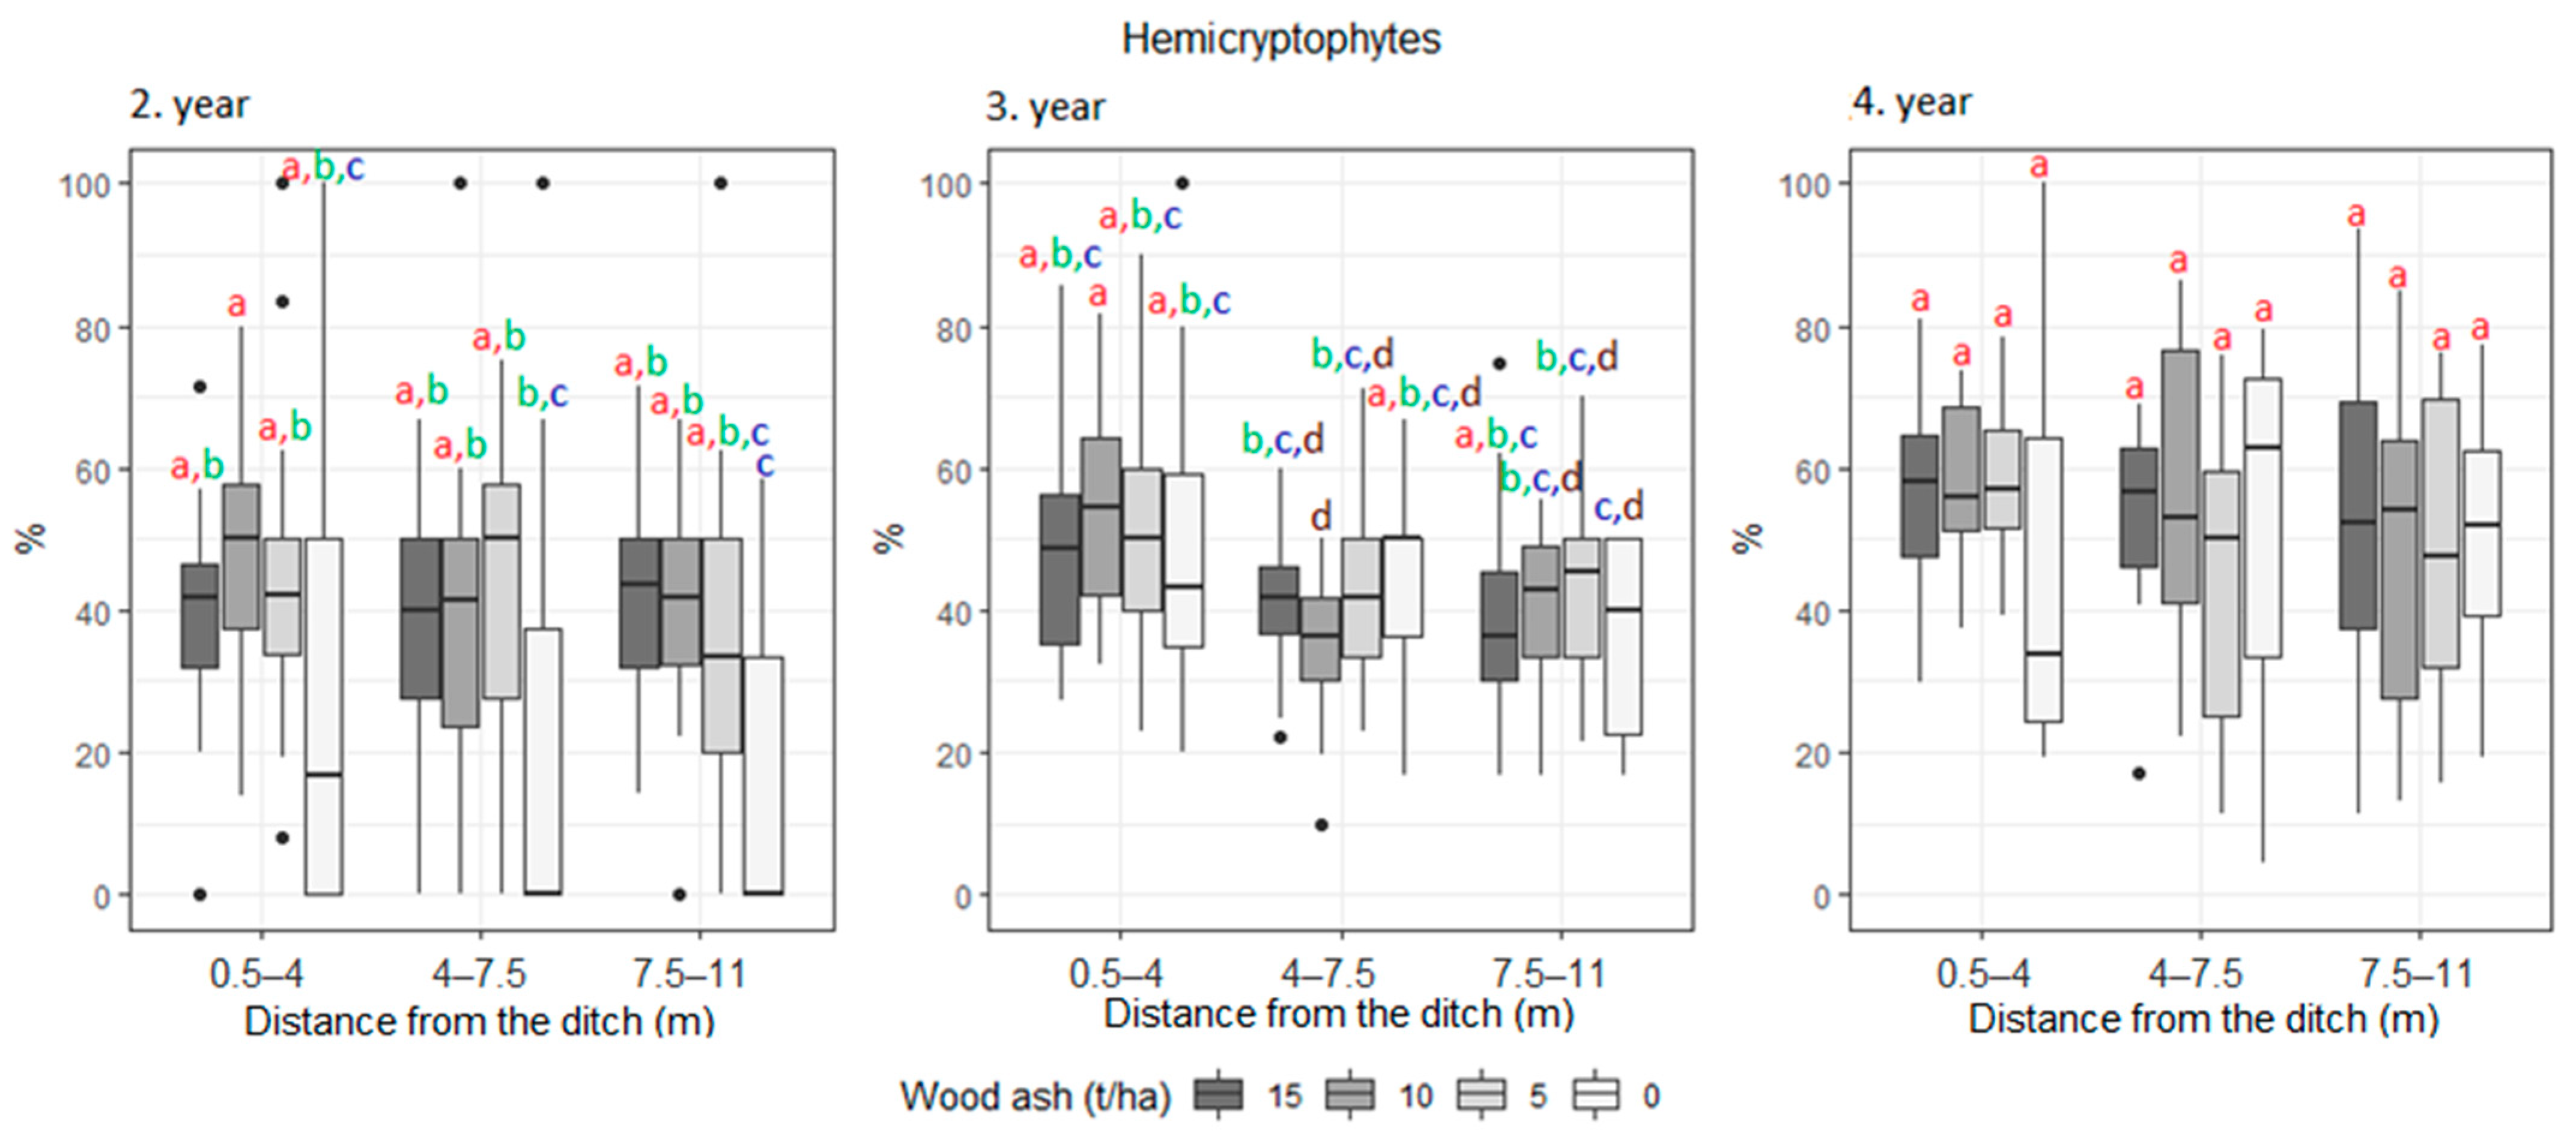
3. Results
4. Discussion
5. Conclusions
Author Contributions
Funding
Data Availability Statement
Acknowledgments
Conflicts of Interest
Appendix A


| No. | Species | 2019 | 2018 | 2017 | No. | Species | 2019 | 2018 | 2017 |
|---|---|---|---|---|---|---|---|---|---|
| 1. | Agrostis capillaris | x | x | x | 43. | Luzula pilosa | x | ||
| 2. | Arabidopsis thaliana | x | x | 44. | Lycopus europaeus | x | x | x | |
| 3. | Arctium lappa | x | x | 45. | Matricaria perforata | x | x | ||
| 4. | Arctium tomentosum | x | 46. | Mycelis muralis | x | ||||
| 5. | Barbara stricta | x | 47. | Persicaria maculosa | x | ||||
| 6. | Betula pendula | x | x | x | 48. | Petasites hybridus | x | ||
| 7. | Betula pubescens | x | x | x | 49. | Phragmites australis | x | x | x |
| 8. | Bidens tripartita | x | x | x | 50. | Picea abies | x | x | x |
| 9. | Brassica campestris | x | x | 51. | Picris hieracioides | x | x | x | |
| 10. | Calamagrostis canescens | x | x | x | 52. | Pinus sylvestris | x | x | x |
| 11. | Calluna vulgaris | x | x | 53. | Plantago lanceolata | x | |||
| 12. | Carex cespitosa | x | x | x | 54. | Plantago major | x | x | |
| 13. | Carex hirta | x | 55. | Poa palustris | x | x | x | ||
| 14. | carex pseudocyperus | x | 56. | Polygonum sp. | x | ||||
| 15. | Carex vesicaria | x | 57. | Polytrihum sp. | x | x | |||
| 16. | Cerastium holosteoides | x | x | 58. | Populus tremula | x | x | x | |
| 17. | Chamerion angustifolium | x | x | x | 59. | Rubus idaeus | x | x | x |
| 18. | Chenopodium album | x | x | 60. | Rumex acetosa | x | x | ||
| 19. | Cirsium arvense | x | x | x | 61. | Rumex acetosella | x | x | x |
| 20. | Cirsium aucale | x | 62. | Rumex longifolius | x | ||||
| 21. | Cirsium oleraceum | x | x | 63. | sagina nodosa | x | |||
| 22. | Cirsium palustre | x | 64. | Salix alba | x | ||||
| 23. | Crepis biennis | x | x | 65. | Salix caprea | x | x | x | |
| 24. | Echinochloa crusgalli | x | x | 66. | Salix myrsinifolia | x | |||
| 25. | Eirophorum polystachion | x | 67. | Salix rosmarinifolia | x | ||||
| 26. | Epilobium parviflorum | x | x | x | 68. | Salix sp. | x | x | |
| 27. | Equisetum arvense | x | 69. | Salix starkeana | x | ||||
| 28. | Equisetum fluviatile | x | 70. | Salix triandra | x | ||||
| 29. | Equisetum sylvaticum | x | 71. | Salix viminalis | x | ||||
| 30. | Erigon canadesis | x | x | x | 72. | Scirpus sylvaticus | x | ||
| 31. | Eriophorum vaginatum | x | x | x | 73. | Senecio sylvaticus | x | x | |
| 32. | Eupatorium cannabinum | x | x | x | 74. | Silene vulgaris | x | ||
| 33. | Festuca rubra | x | 75. | Solidago cannadensis | x | x | x | ||
| 34. | Fragaria vesca | x | x | x | 76. | Sonchus asper | x | x | |
| 35. | Frangula alnus | x | x | 77. | Stellaria media | x | x | ||
| 36. | Gnaphalium uliginosum | x | 78. | Taraxacum officinale | x | x | x | ||
| 37. | Hieracium pilosella | x | x | x | 79. | Trifolium repens | x | ||
| 38. | Juncus articulatus | x | x | x | 80. | Tripleurospermum inodorum | x | ||
| 39. | Juncus effusus | x | x | x | 81. | Tussilafgo farfara | x | x | x |
| 40. | Juncus tenuis | x | x | x | 82. | Typha latifolia | x | x | x |
| 41. | Lamium album | x | x | 83. | Utrica dioica | x | |||
| 42. | Linaria vulgaris | x | x | 84. | Valeriana officinalis | x |
References
- Xu, J.; Morris, P.J.; Liu, J.; Holden, J. PEATMAP: Refining Estimates of Global Peatland Distriubution Based on a Meta-Analysis. Catena 2018, 160, 134–140. [Google Scholar] [CrossRef] [Green Version]
- Clymo, R.S. The Limits to Peat Bog Growth. Philosophical Transactions of the Royal Society of London. Ser. B Biol. Sci. 1984, 303, 605–654. [Google Scholar] [CrossRef]
- Yli-Petays, M.; Laine, J.; Vasander, H.; Tuittila, E.-S. Carbon Gas Exchange of a Re-Vegetated Cut-Away Peatland Five Decades after Abandonment. For. Ecol. Manag. 2007, 12, 177–190. [Google Scholar]
- Lazdiņš, A.; Lupikis, A. Life Restore Project Contribution to the Greenhouse Gas Emission Accounts in Latvia. In Sustainable and Responsible After-Use of Peat Extraction Areas; Baltijas krasti: Riga, Latvia, 2019; pp. 21–52. [Google Scholar]
- Huotari, N.; Tillman-Sutela, E.; Kauppi, A.; Kubin, E. Fertilization Ensures Rapid Formation of Ground Vegetation on Cut-Away Peatlands. Can. J. For. Res. 2006, 37, 874–883. [Google Scholar] [CrossRef]
- Tuittila, E.-S.; Komulainen, V.-M.; Vasander, H.; Laine, J. Restored Cut-Away Peatland as a Sink for Atmospheric CO2. Oecologia 1999, 120, 563–574. [Google Scholar] [CrossRef] [PubMed]
- Pētersons, J.; Lazdiņš, A.; Kasakovskis, A. Life Restore Database on Areas Affected by Peat Extraction. In Sustainable and Responsible After-Use of Peat Extraction Areas; Baltijas krasti: Riga, Latvia, 2019; pp. 122–128. [Google Scholar]
- Mehmood, M.A.; Ibrahim, M.; Rashid, U.; Nawaz, M.; Shafaqat, A.; Hussain, A.; Gull, M. Biomass Production for Bioenergy Using Marginal Lands. Sustain. Prod. Consum. 2017, 9, 3–21. [Google Scholar] [CrossRef]
- Gong, J.; Shurpali, N.J.; Kellomäki, S.; Wang, K.; Zhang, C.; Salem, M.M.A. High Sensitivity of Peat Moisture Content to Seasonal Climate in Acutaway Peatland Cultivated with a Perennial Crop (Phalarisarundinaceae, L.): A Modeling Study. Agric. For. Meteorol. 2012, 180, 225–235. [Google Scholar] [CrossRef]
- Ots, K.; Orru, M.; Tilk, M.; Kuura, L.; Aguraijuja, K. Afforestation of Cutaway Peatlands: Effect of Wood Ash on Biomass Formation and Carbon Balance. For. Stud. 2017, 67, 17–36. [Google Scholar] [CrossRef] [Green Version]
- Padur, K.; Ilomets, M.; Põder, T. Identification of the Criteria for Decision Making of Cut-Away Peatland Reuse. Environ. Manag. 2017, 59, 505–521. [Google Scholar] [CrossRef]
- Neimane, S.; Celma, S.; Butlers, A.; Lazdiņa, D. Conversion of an Industrial Cutaway Peatland to a Betulacea Family Tree Species Plantation. Agron. Res. 2019, 17, 741–753. [Google Scholar] [CrossRef]
- Kikamägi, K.; Ots, K.; Kuznetsova, T.; Pototski, A. The Growth and Nutrients Status of Conifers on Ash-Treated Cutaway Peatland. Trees Struct. Funct. 2013, 28, 53–64. [Google Scholar] [CrossRef]
- Neimane, S.; Celma, S.; Zusevica, A.; Lazdina, D.; Ievinsh, G. The Effect of Wood Ash Application on Growth, Leaf Morphological and Physiological Traits of Trees Planted in a Cutaway Peatland. Mires Peat 2021, 27, 12. [Google Scholar] [CrossRef]
- Hytönen, J.; Aro, L. Biomass and Nutrition of Naturally Regenerated and Coppiced Birch on Cutaway Peatland During 37 Years. Silva Fenn. 2012, 46, 377–394. [Google Scholar] [CrossRef] [Green Version]
- Wilson, L.; Wilson, J.M.; Holden, J.; Johnstone, I.; Armstrong, A.; Morris, M. Recovery of Water Tables in Welsh Blanket Bog after Drain Blocking: Discharge Rates, Time Scales and the Influence of Local Conditions. J. Hydrol. 2010, 391, 377–386. [Google Scholar] [CrossRef]
- Gatis, N.; Luscombe, D.J.; Grand-Clement, E.; Hartley, I.P.; Anderson, K.; Smith, D.; Brazier, R.E. The Effect of Drainage Ditches on Vegetation Diversity and CO2 Fluxes in a Molinia caerulea- Dominated Peatland. Ecohydrology 2016, 9, 407–420. [Google Scholar] [CrossRef] [Green Version]
- Renou-Wilson, F.; Farrell, E.P. Reclaiming Peatlands for Forestry. In Restoration of Boreal and Temperate Forests; CRC Press: New York, NY, USA, 2004; pp. 541–557. [Google Scholar]
- Strack, M.; Keith, A.M.; Xu, B. Growing Season Carbon Dioxide and Methane Exchange at a Restored Peatland on the Western Boreal Plain. Ecol. Eng. 2014, 64, 231–239. [Google Scholar] [CrossRef]
- Silvan, N.; Hytönen, J. Impact of Ash-Fertilization and Soil Preparation on Soil Respiration and Vegetation Colonization on Cutaway Peatlands. Am. J. Clim. Change 2016, 5, 178–192. [Google Scholar] [CrossRef] [Green Version]
- Kelemen, K.; Mihók, B.; Galhidy, L.; Standovár, T. Dynamic Response of Herbaceous Vegetation to Gap Opening in a Central European Beech Stand. Silva Fenn. 2012, 46, 53–65. [Google Scholar] [CrossRef] [Green Version]
- Thrippleton, T.; Bugmann, H.; Kramer-Priewasser, K.; Snell, R.S. Herbaceous Understorey: An Overlooked Player in Forest Landscape Dynamics? Ecosystems 2016, 19, 1240–1254. [Google Scholar] [CrossRef]
- Gilliam, F.S. Excess Nitrogen in Temperate Forest Ecosystems Decreases Herbaceous Layer Diversity and Shifts Control from Soil to Canopy Structure. Forests 2019, 10, 66. [Google Scholar] [CrossRef] [Green Version]
- Augusto, L.; Dupouey, J.-L.; Ranger, J. Effects of Tree Species on Understory Vegetation and Environmental Conditions in Temperate Forests. Ann. For. Sci. 2003, 60, 823–831. [Google Scholar] [CrossRef]
- Kou, M.; García-Fayos, P.; Hu, S.; Jiao, J. The Effect of Robinia pseudoacacia Afforestation on Soil and Vegetation Properties in the Loess Plateau (China): A Chronosequence Approach. For. Ecol. Manag. 2016, 375, 146–158. [Google Scholar] [CrossRef]
- Huotari, N.; Tillman-Sutela, E.; Kubin, E. Ground Vegetation Has a Major Role in Element Dynamics in an Ash-Fertilized Cut-Away Peatland. For. Ecol. Manag. 2011, 261, 2081–2088. [Google Scholar] [CrossRef]
- Mabry, C.M.; Golay, M.G.; Thompson, J.R. Seasonal Storage of Nutrients by Perennial Herbaceous Species in Undisturbed and Disturbed Deciduous Forests. Appl. Veg. Sci. 2009, 11, 37–44. [Google Scholar] [CrossRef]
- Weigel, R.; Gilles, J.; Klisz, M.; Manthey, M.; Kreyling, J. Forest Understory Vegetation Is More Related to Soil than to Climate towards the Cold Distribution Margin of European Beech. J. Veg. Sci. 2019, 30, 746–755. [Google Scholar] [CrossRef]
- Zhang, Y.; Chen, H.Y.H.; Tayor, A.R. Positive Species Diversity and Above-ground Biomass Relationships Are Ubiquitous across Forest Strata despite Interference from Overstory Trees. Funct. Ecol. 2017, 31, 419–426. [Google Scholar] [CrossRef]
- Burgess-Conforti, J.R.; Moore, P.A., Jr.; Owens, P.R.; Miller, D.M.; Ashworth, A.J.; Hays, P.D.; Evans-White, M.A.; Anderson, K.R. Are Soils beneath Coniferous Tree Stands More Acidic than Soils beneath Deciduous Tree Stands? Environ. Sci. Pollut. Res. 2019, 26, 14920–14929. [Google Scholar] [CrossRef]
- Lazdiņa, D.; Neimane, S.; Celma, S. Afforestation Demo Site. In Sustainable and Responsible After-Use of Peat Extraction Areas; Baltijas krasti: Riga, Latvia, 2019; pp. 208–220. [Google Scholar]
- Ellenberg, H.; Weber, H.E.; Düll, R.; Wirth, V.; Werner, W.; Paulißen, D. Zeigerwerte von Pflanzen in Mitteleuropa, 2nd ed.; Verlag Erich GoltzeKG: Göttingen, Germany, 1991. [Google Scholar]
- Chytrý, M.; Tichý, L.; Dřevojan, P.; Sádlo, J.; Zelený, D. Ellenberg-Type Indicator Values for the Czech Flora. Preslia 2018, 90, 83–103. [Google Scholar] [CrossRef] [Green Version]
- Diekmann, M. Use and Improvement of Ellenberg’s Indicator Values in Decidous Forests of Boreal-Nemoral Zone in Sweeden. Ecography 1995, 18, 178–189. [Google Scholar] [CrossRef]
- Kleyer, M.; Bekker, R.M.; Knevel, I.C.; Bakker, J.P.; Sonnenschein, M.; Poschlod, P.; van Groenendael, J.; Klimeš, L.; Klimešová, J.; Klotz, S.; et al. The LEDA Traitbase: A Database of Life History Traits of Northwest European Flora. J. Ecol. 2008, 96, 1266–1274. [Google Scholar] [CrossRef]
- Niklas, K. Life Forms. In Encyclopedia of Ecology; Elsevier: Amsterdam, The Netherlands, 2008; pp. 2160–2167. [Google Scholar]
- Saugier, B. Plant Strategies and Vegetation Processes. Plant Sci. 2001, 161, 813. [Google Scholar] [CrossRef]
- RStudio Team. RStudio: Integrated Development for R; RStudio: Boston, MA, USA, 2019. [Google Scholar]
- R Core Team. R: A Language and Environment; R Foundation for Statistical Computing: Vienna, Austria, 2020. [Google Scholar]
- Oksanen, J.; Blanchet, F.G.; Friendly, M.; Kindt, R.; Legendre, P.; McGlinn, D.; Minchin, P.R.; O’Hara, R.B.; Simpson, G.L.; Solymos, P.; et al. Vegan Community Ecology Package Version 2.5-7. November 2020. Available online: https://cran.r-project.org (accessed on 10 December 2021).
- Bellamy, P.E.; Stephen, L.; Maclean, L.S.; Grant, M.C. Response of Blanket Bog Vegetation to Drain-Blocking. Appl. Veg. Sci. 2012, 15, 129–135. [Google Scholar] [CrossRef]
- Price, J.; Heathwaite, A.L.; Baird, A.J. Hydrological Processes in Abandoned and Restored Peatlands: An Overview of Management Approaches. Wetl. Ecol. Manag. 2003, 11, 65–83. [Google Scholar] [CrossRef]
- Leung, A.K.; Garg, A.; Coo, J.L.; Ng, C.W.W.; Hau, B.C.H. Effects of the Roots of Cynodon dactylon and Schefflera heptaphylla on Water Infiltration Rate and Soil Hydraulic Conductivity. Hydrol. Process. 2015, 29, 3342–3354. [Google Scholar] [CrossRef] [Green Version]
- Campbell, D.R.; Lavoie, C.; Rochefort, L. Wind Erosion and Surface Stability in Abandoned Milled. Can. J. Soil Sci. 2002, 82, 89–95. [Google Scholar] [CrossRef] [Green Version]
- Dafni, A.; Cohen, D.; Noy-Mier, I. Life-Cycle Variation in Geophytes. Ann. Mo. Bot. Gard. 1981, 68, 652–660. [Google Scholar] [CrossRef]
- Marks, M.; Lapin, B.; Randall, J. Phragmites australis (P. communis): Threats, Management and Monitoring. Nat. Areas J. 1994, 6, 285–294. [Google Scholar] [CrossRef] [Green Version]
- Myerscough, P.J.; Whitehead, F. Comparative Biology of Tussilago farfara L., Chamaenerion angustifolium (L.) Scop., Epilobium montanum L., and Epilobium adenocaulon Hausskn. II. Growth and Ecology. New Phytol. 1967, 66, 785–823. [Google Scholar] [CrossRef]
- Schaffers, A.P.; Sýkora, K.V. Reliability of Ellenberg Indicator Values for Moisture, Nitrogen and Soil Reaction: A Comparison with Field Measurements. J. Veg. Sci. 2000, 11, 225–244. [Google Scholar] [CrossRef]


| Plant Functional Traits | Wood-Ash Dose (t/ha) | ||||||||||||
|---|---|---|---|---|---|---|---|---|---|---|---|---|---|
| 0 | 5 | 10 | 15 | 0 | 5 | 10 | 15 | 0 | 5 | 10 | 15 | ||
| 2. Year | 3. Year | 4. Year | |||||||||||
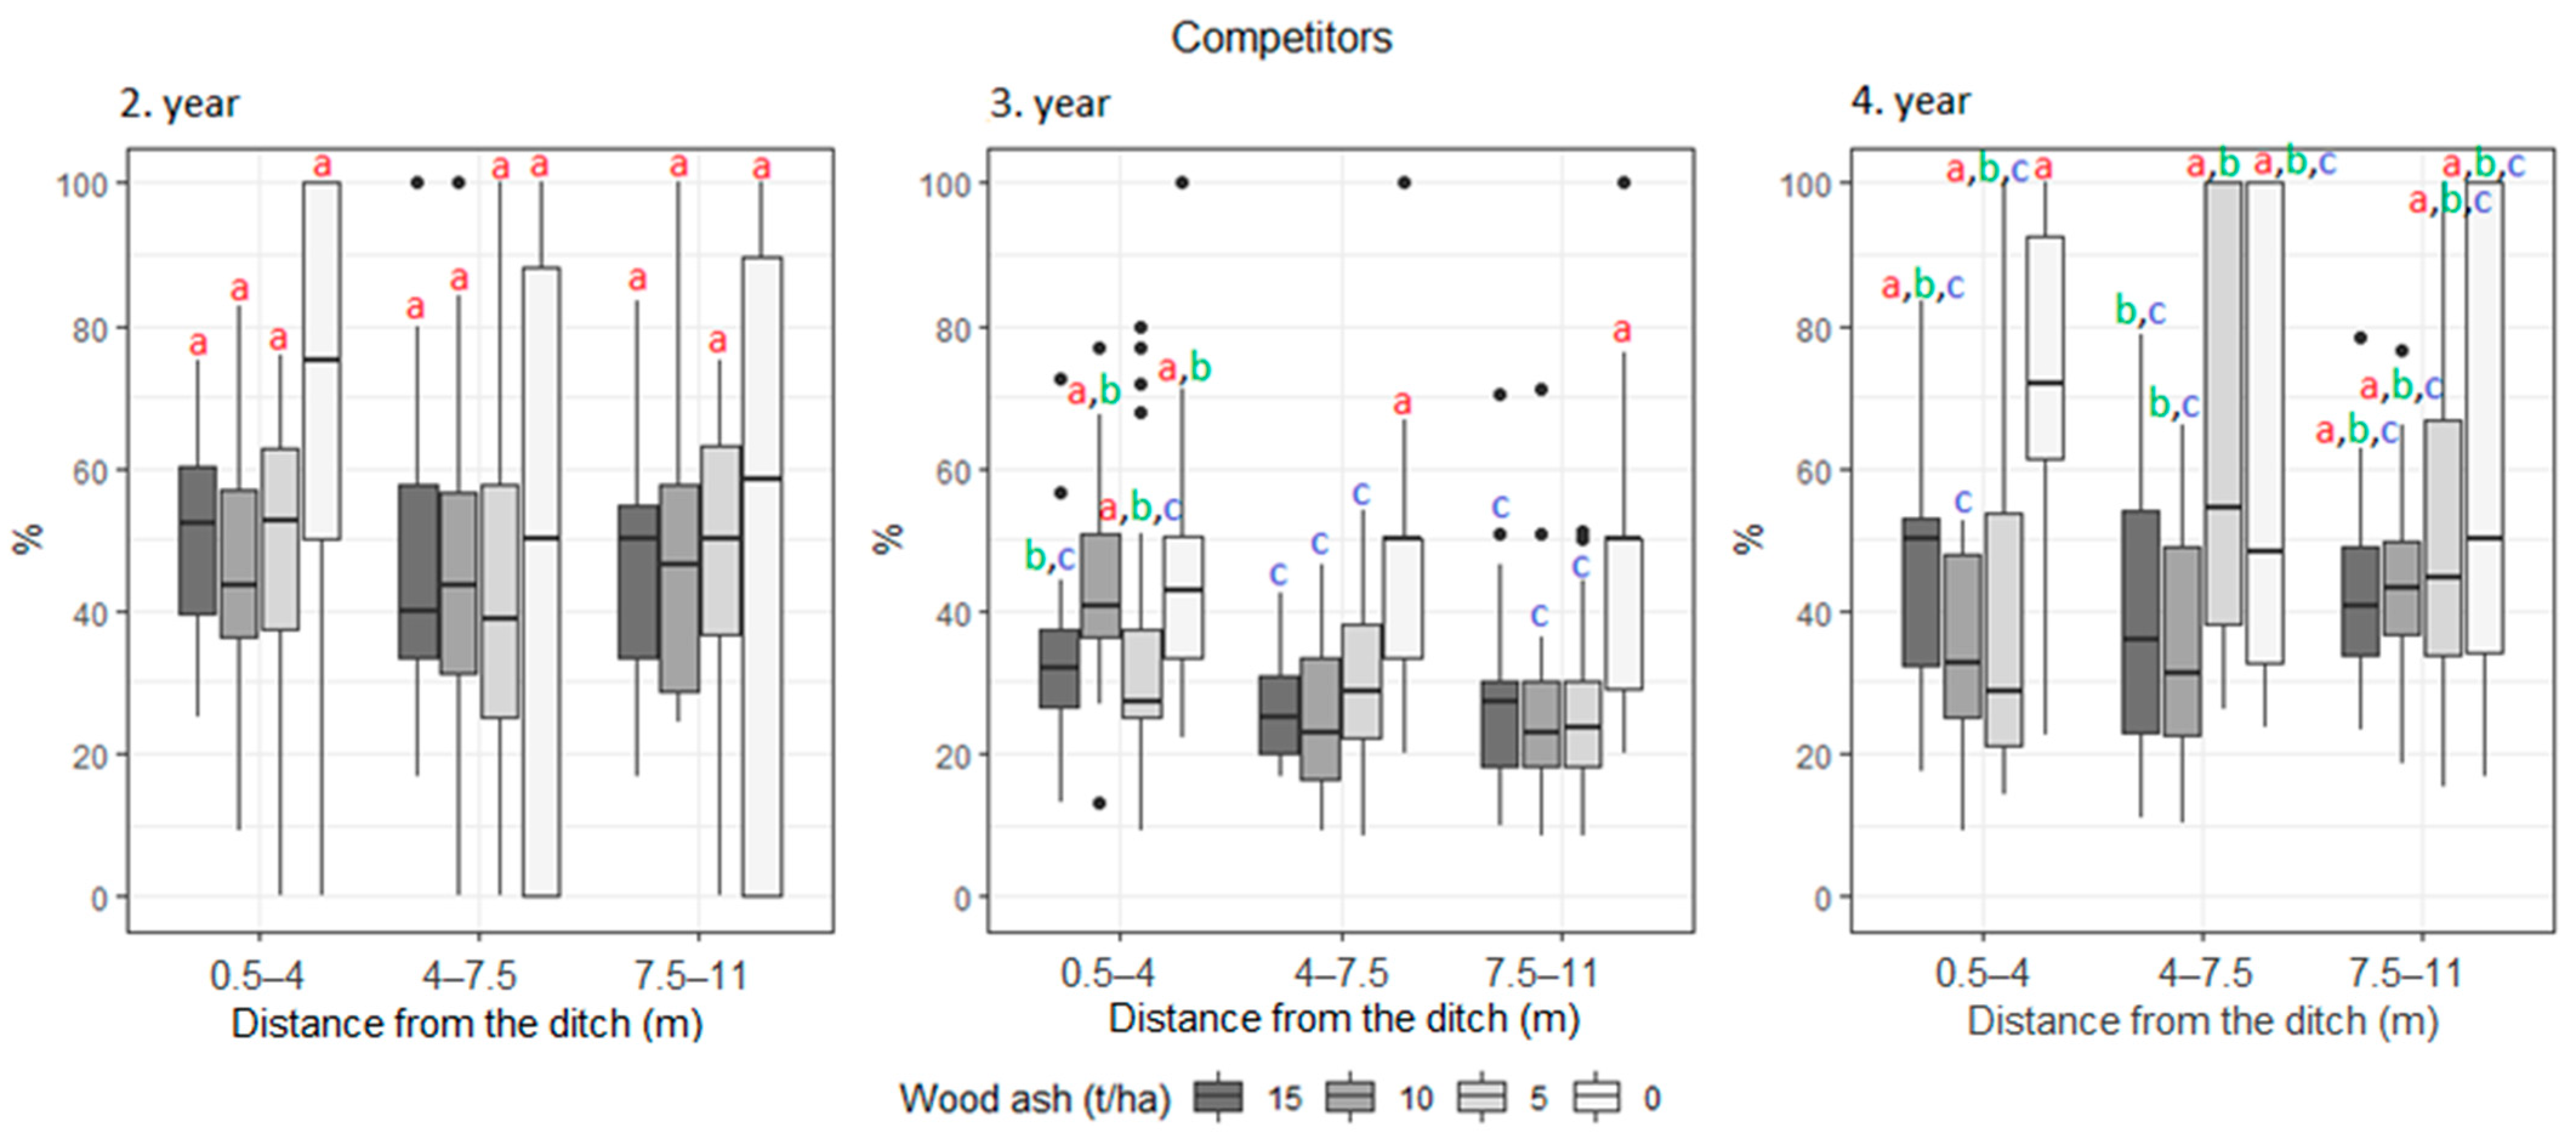
| UAST (%) | Competitors | 50.4 | 53.8 | 47.1 | 44.9 | 27.8 | 34.6 | 35.9 | 26.7 | 51.7 | 53.0 | 45.5 | 46.4 |
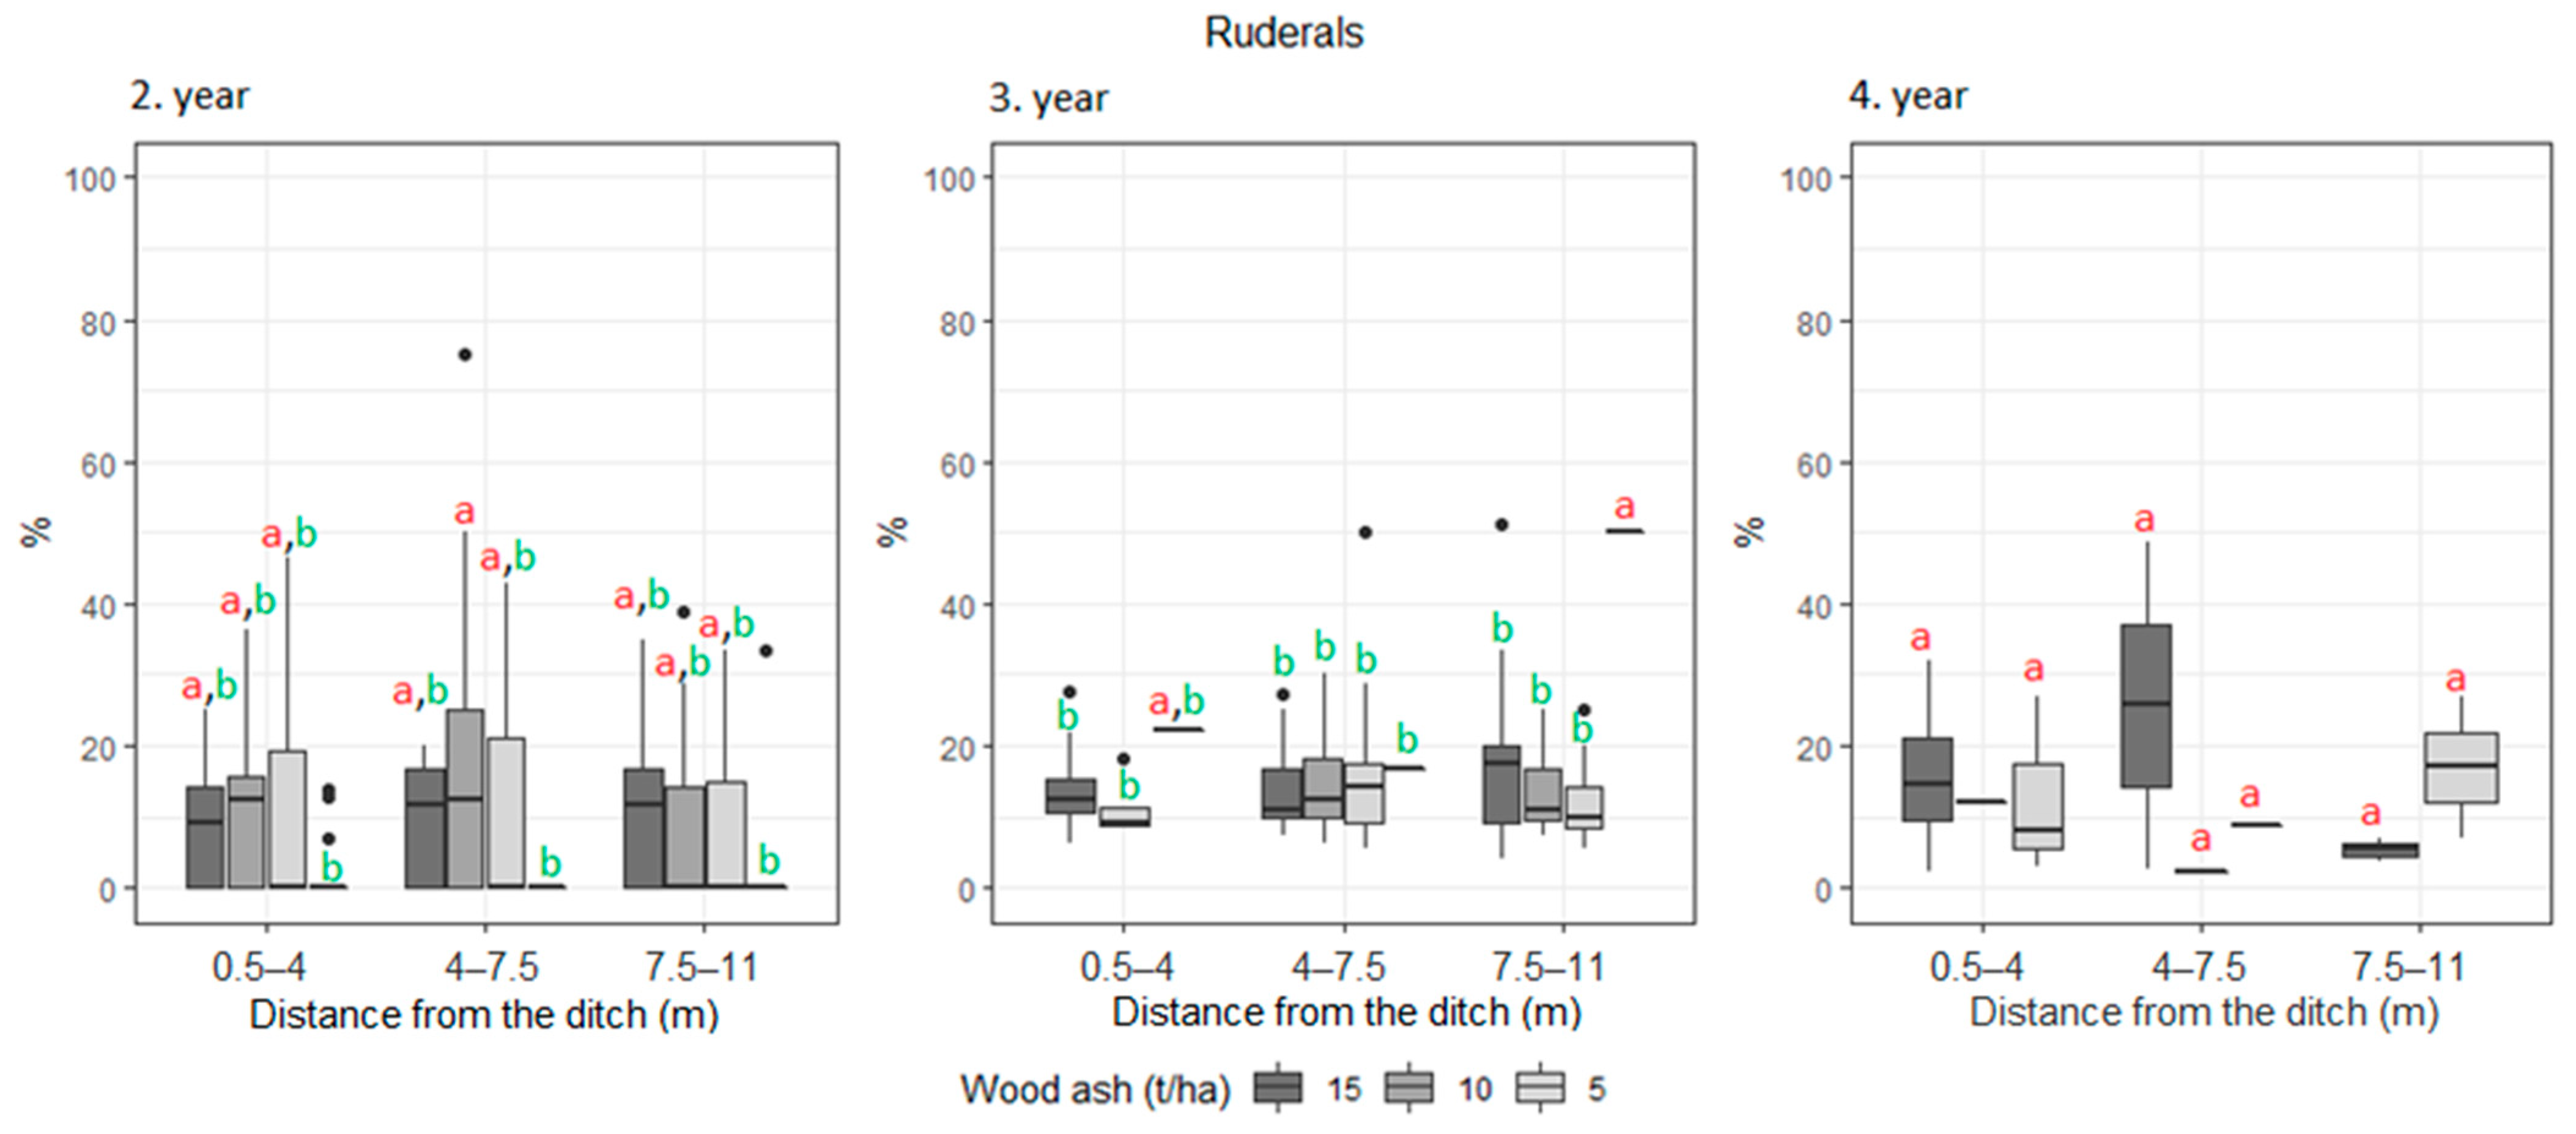
| Ruderals | 5.5 | 9.2 | 8.2 | 12.3 | 7 | 6.4 | 3.5 | 12.4 | 0 | 1 | 1.7 | 1.4 | |
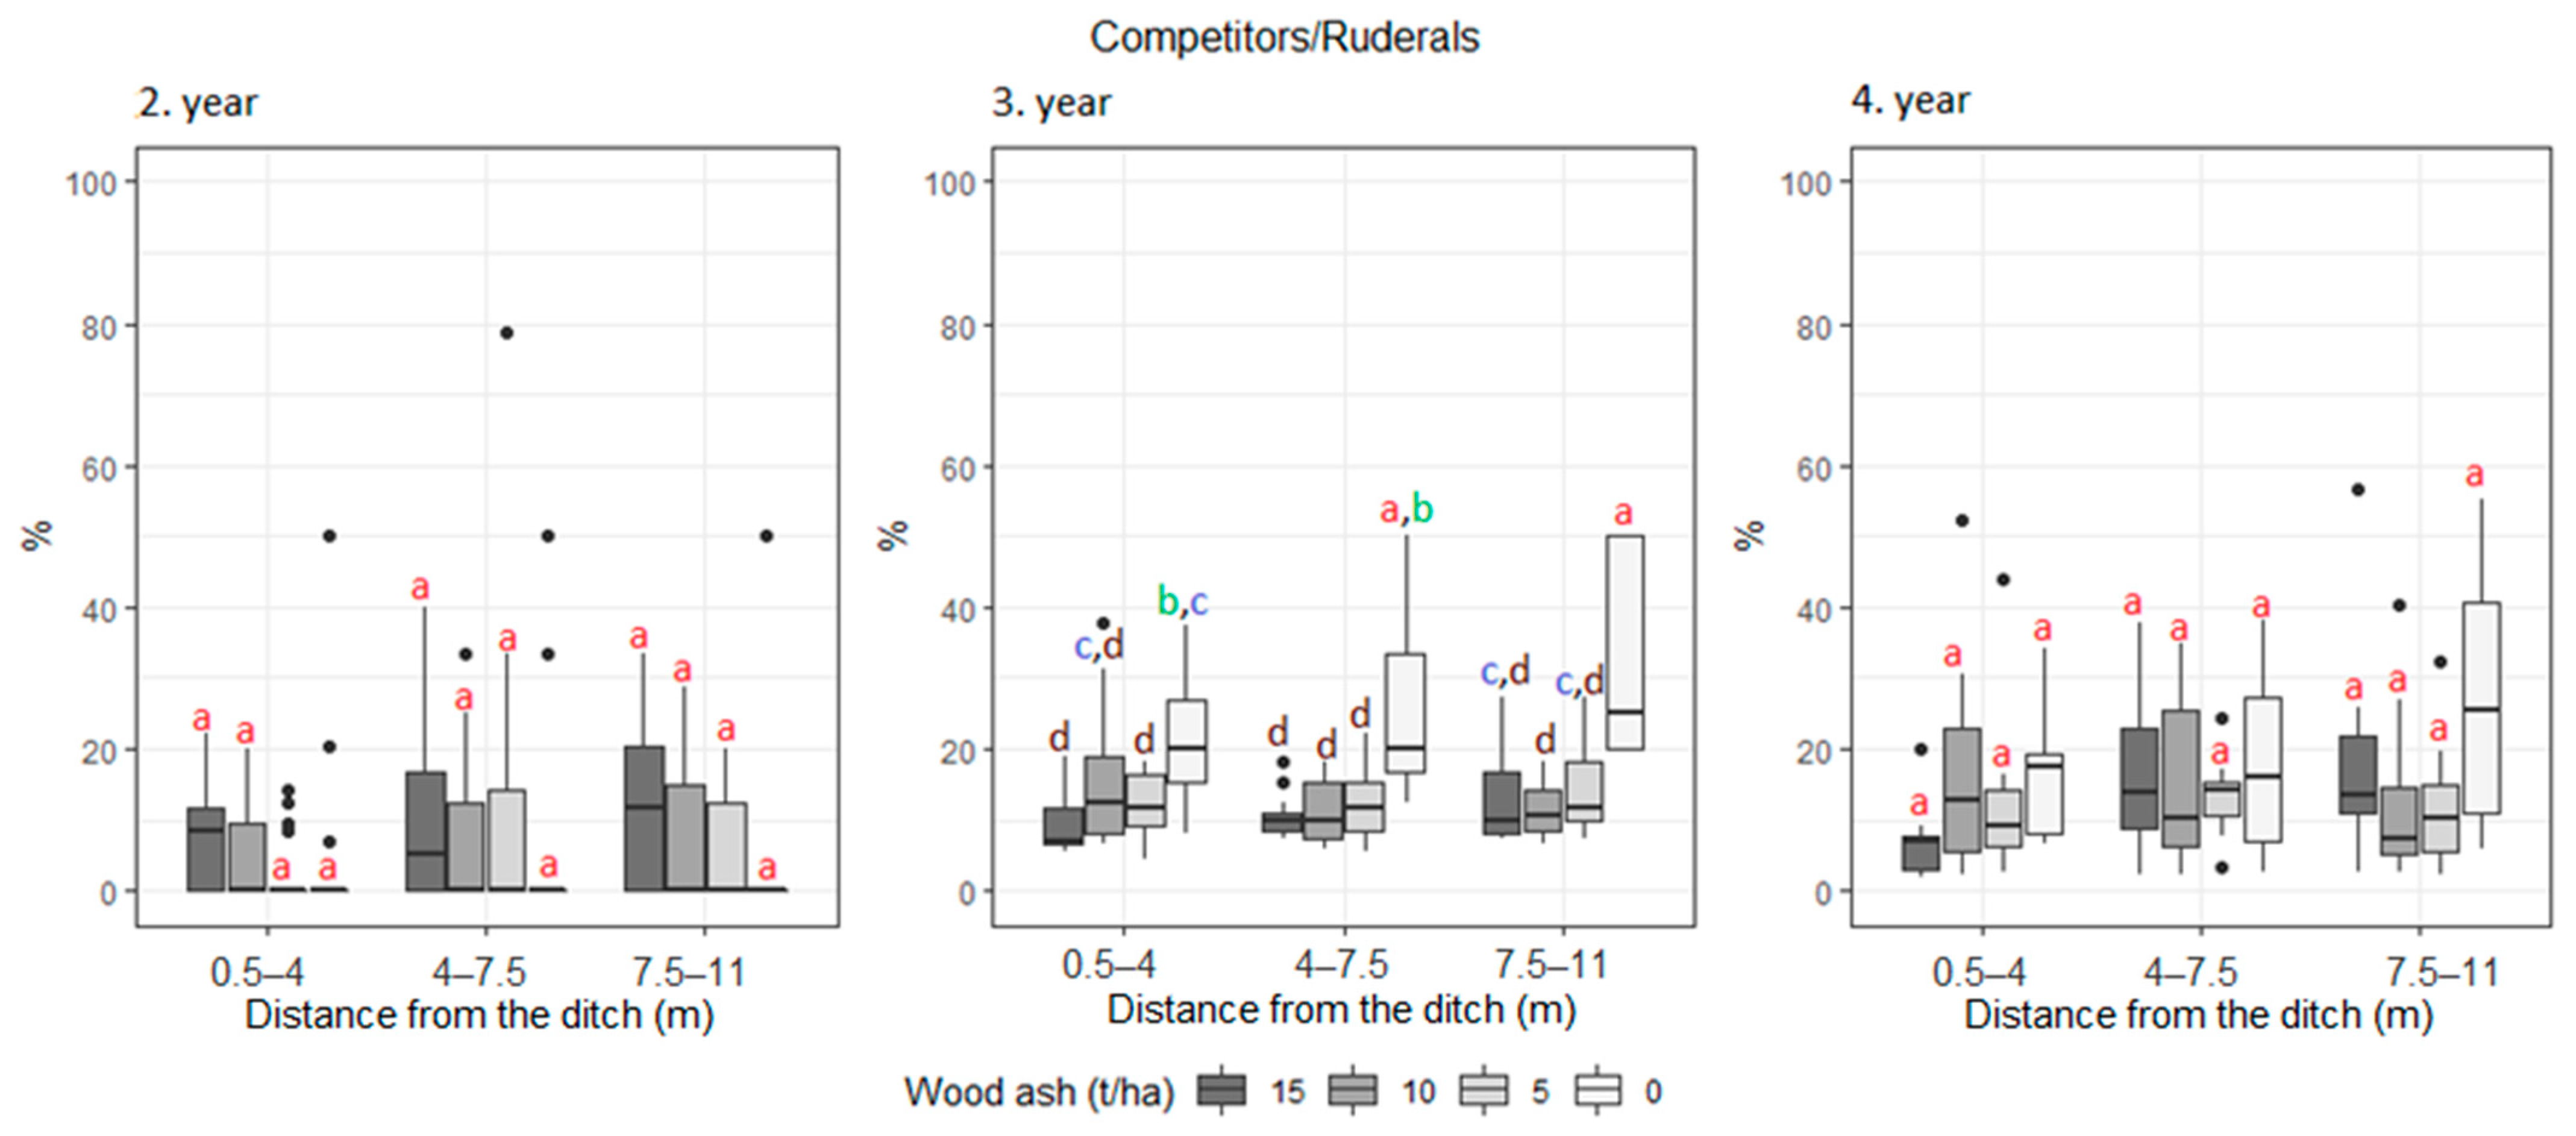
| Competitors/Ruderals Ruderals | 5.3 | 7.6 | 5.3 | 9.1 | 7.3 | 6.8 | 7.3 | 6.4 | 10.2 | 9.7 | 8.8 | 11.1 | |
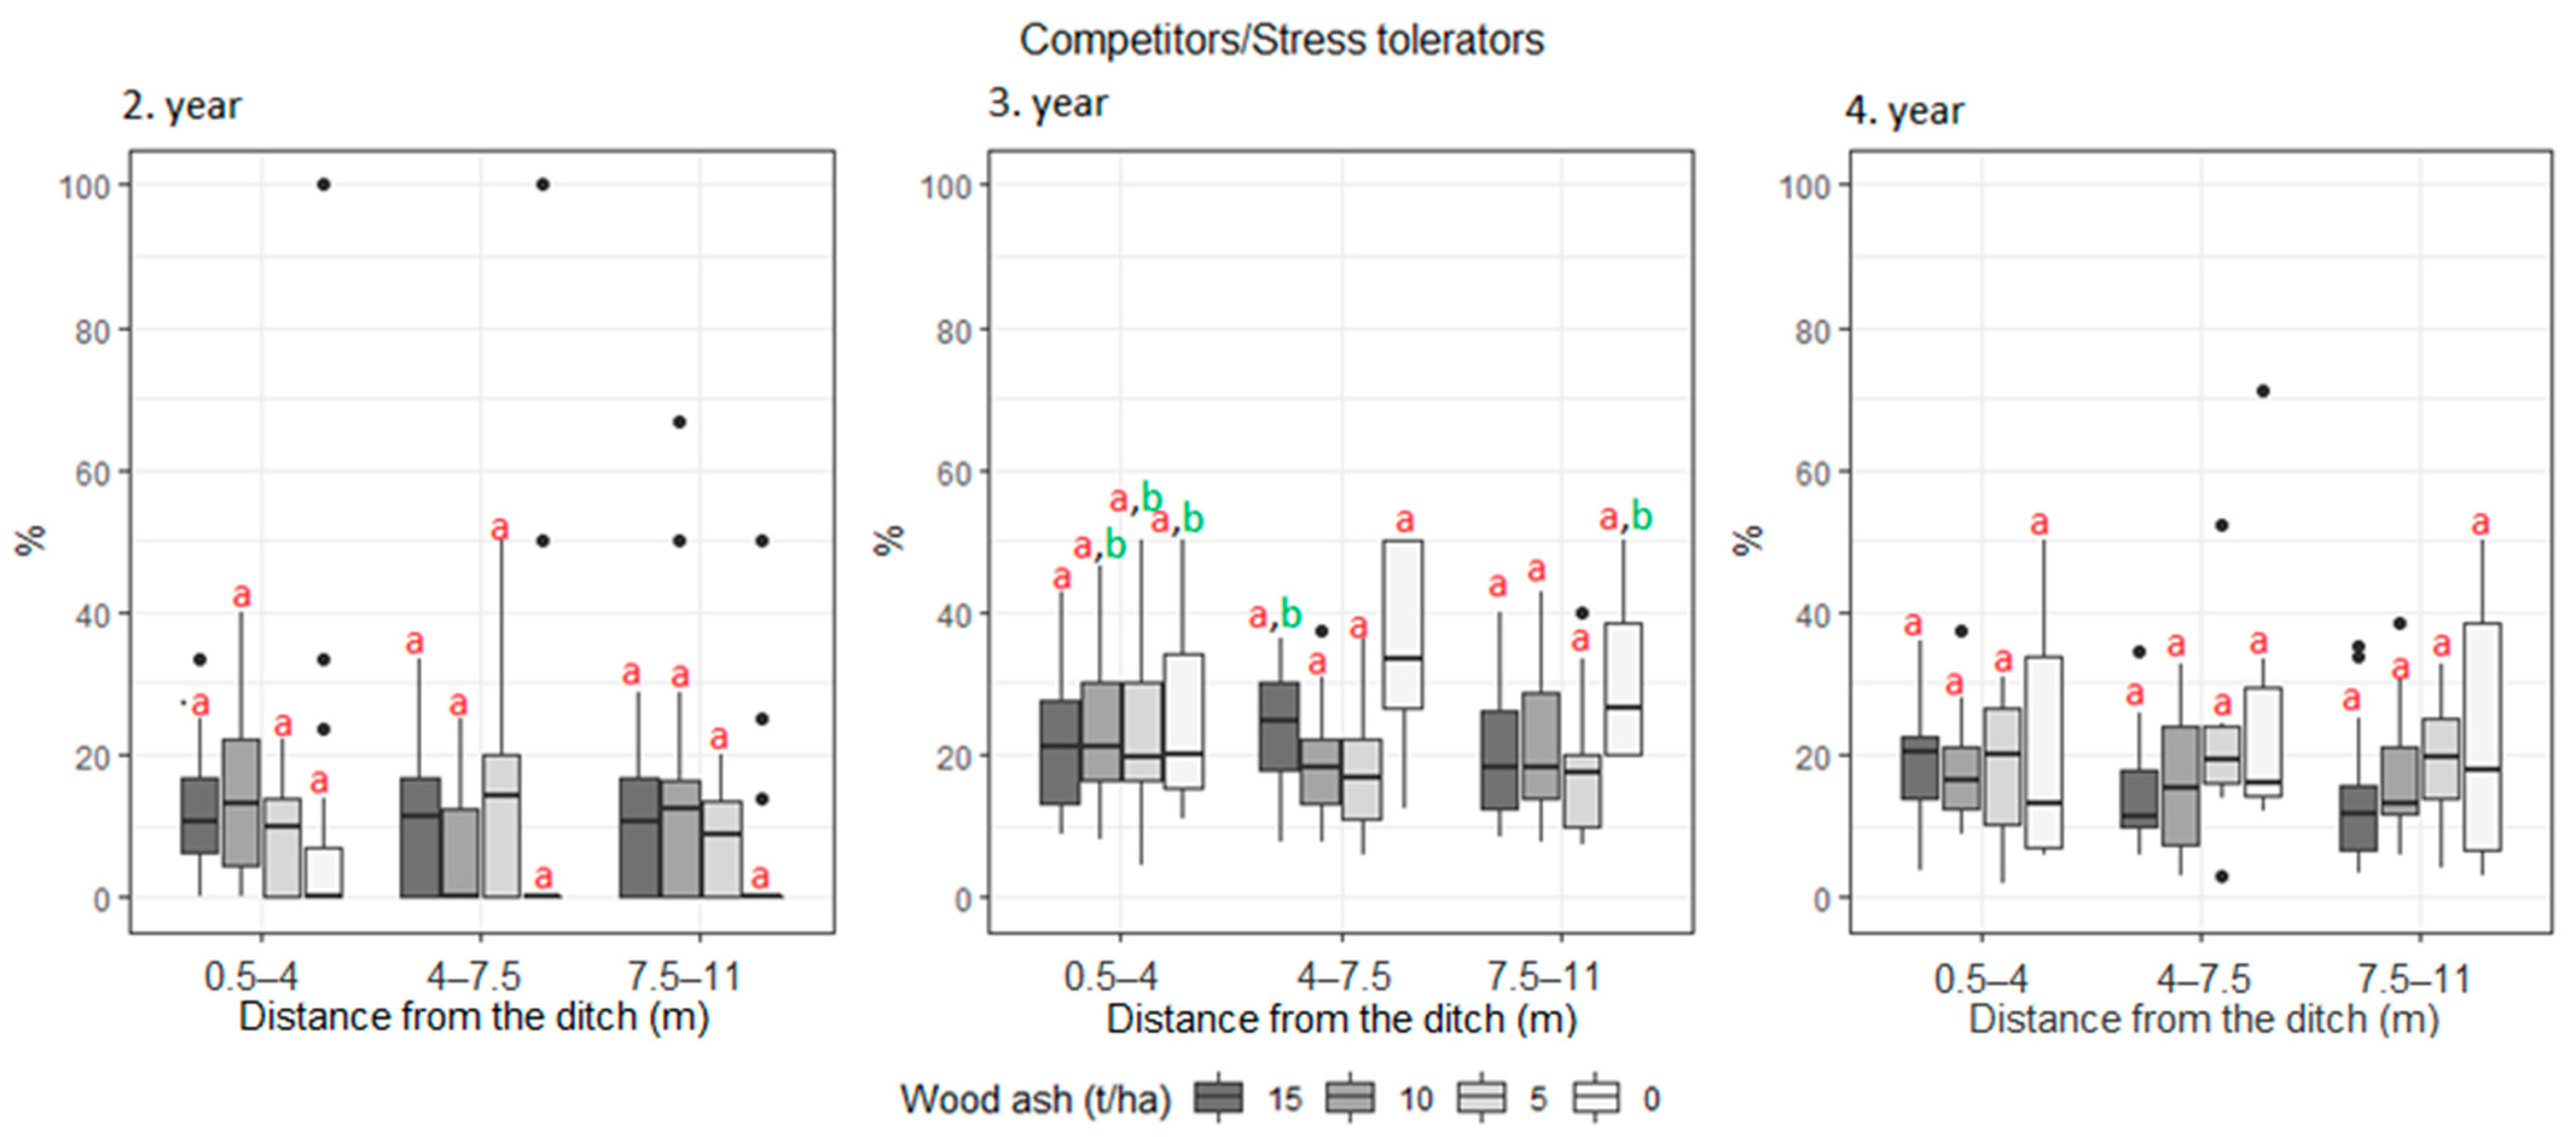
| Competitors/Stress tolerant Stress tolerant | 6.2 | 11.6 | 11.7 | 10.4 | 13.5 | 17.4 | 16.9 | 17.9 | 14.6 | 13.2 | 16.6 | 13.5 | |
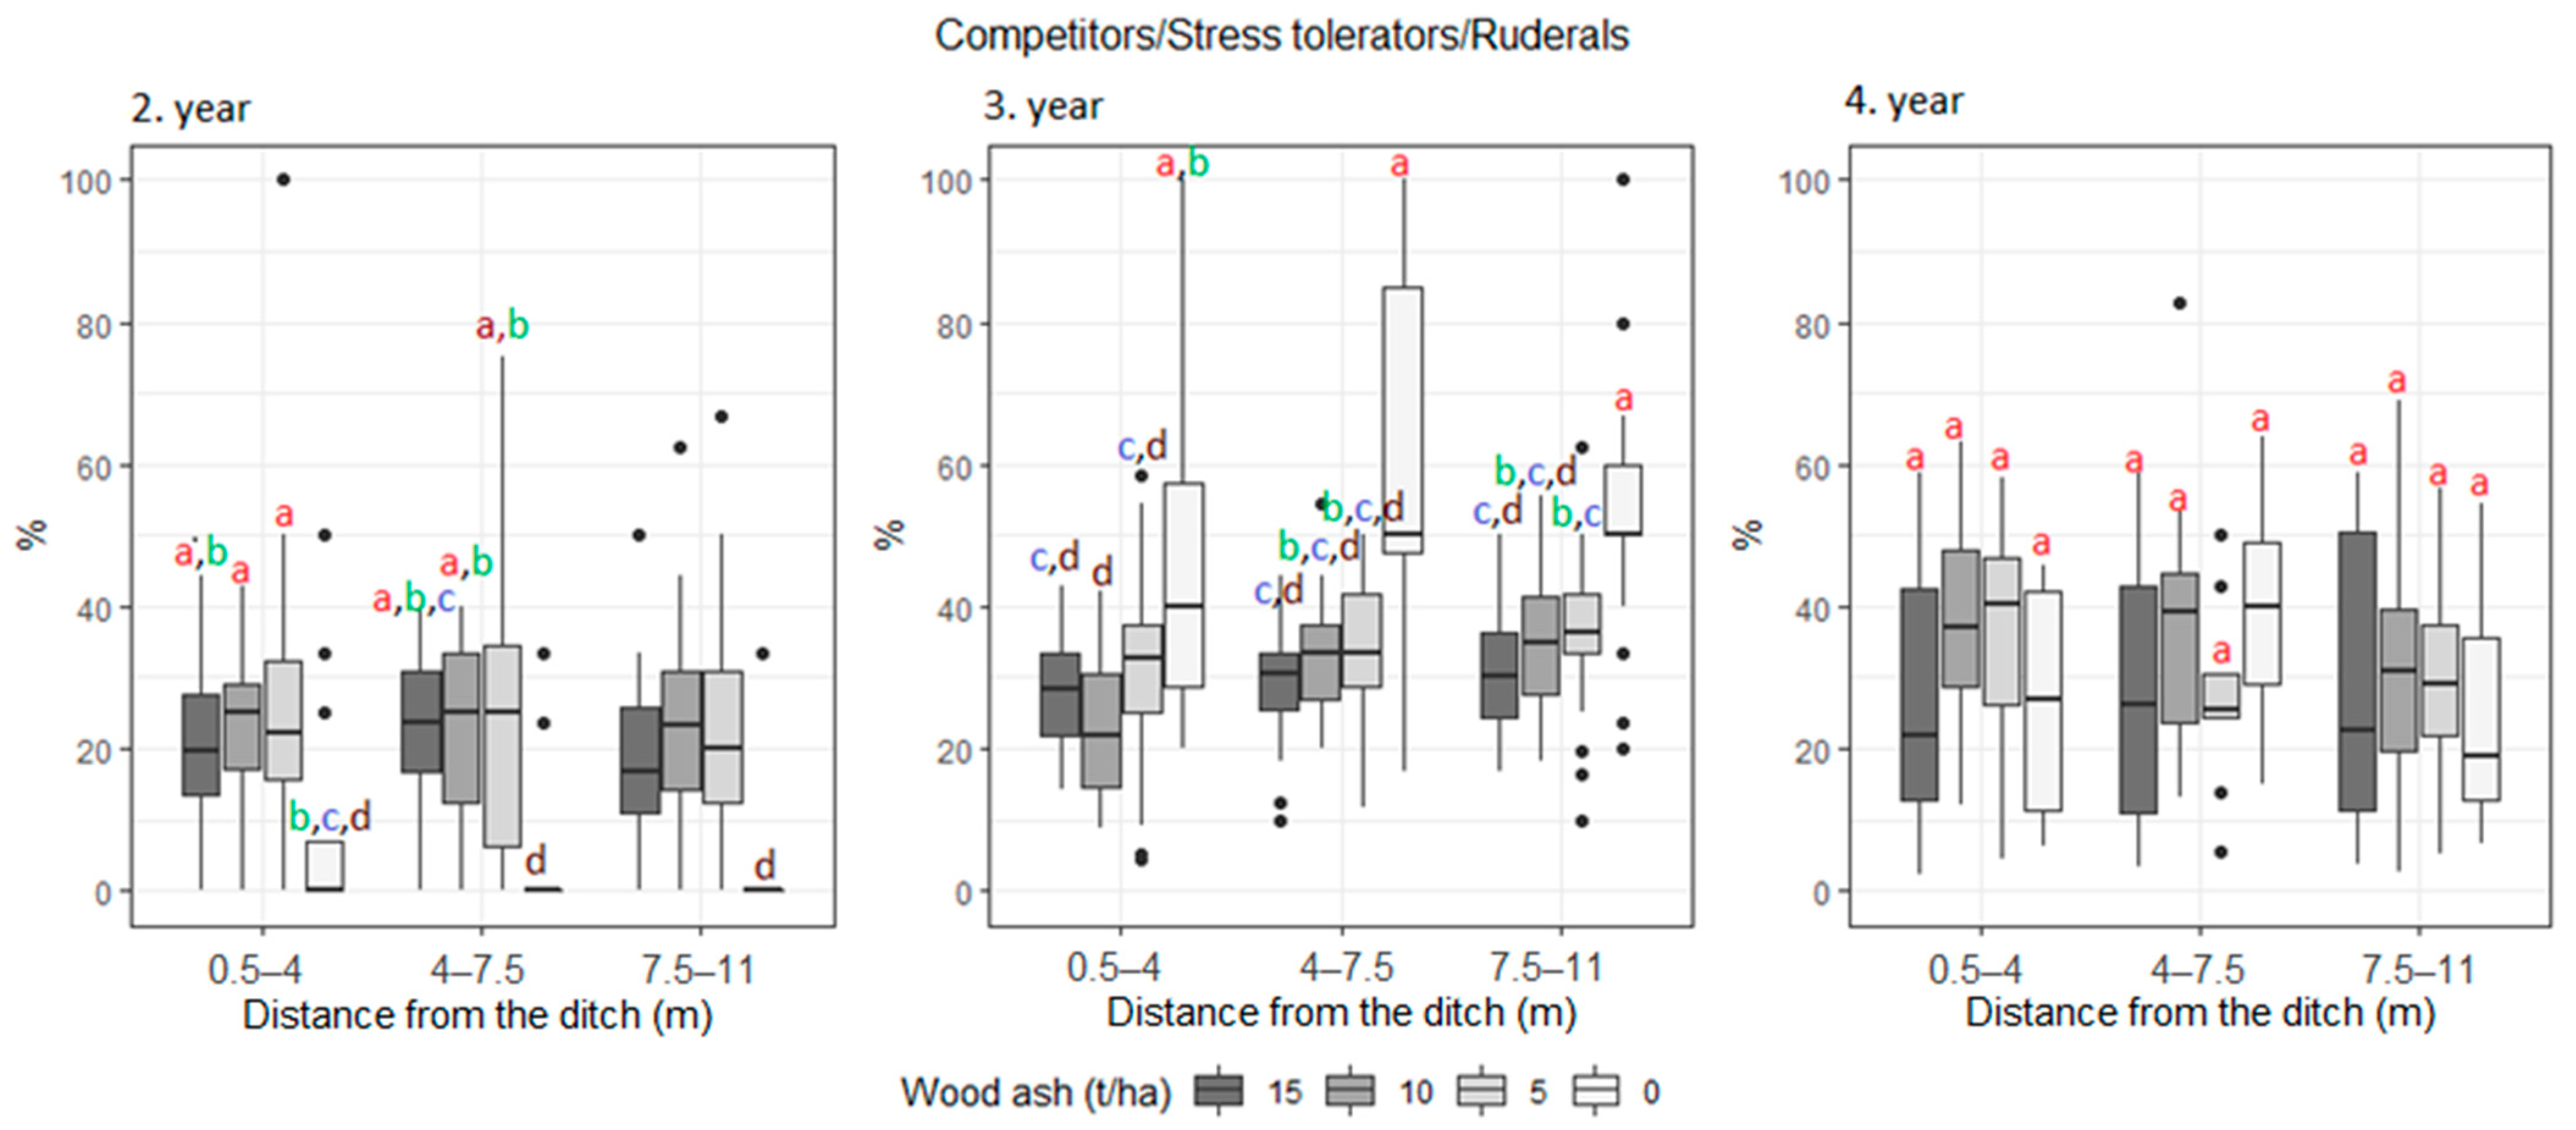
| Competitors/Stress tolerant/Ruderals | 17.9 | 15.7 | 19.9 | 22.6 | 39.6 | 31.3 | 32.0 | 32.0 | 22.6 | 20.6 | 27.3 | 27.5 | |
| Growth form (%) | Geophyte | 23.7 | 26.7 | 24.6 | 13.2 | 15.5 | 16.2 | 18.6 | 12.5 | 19.2 | 23.8 | 22.9 | 17.5 |
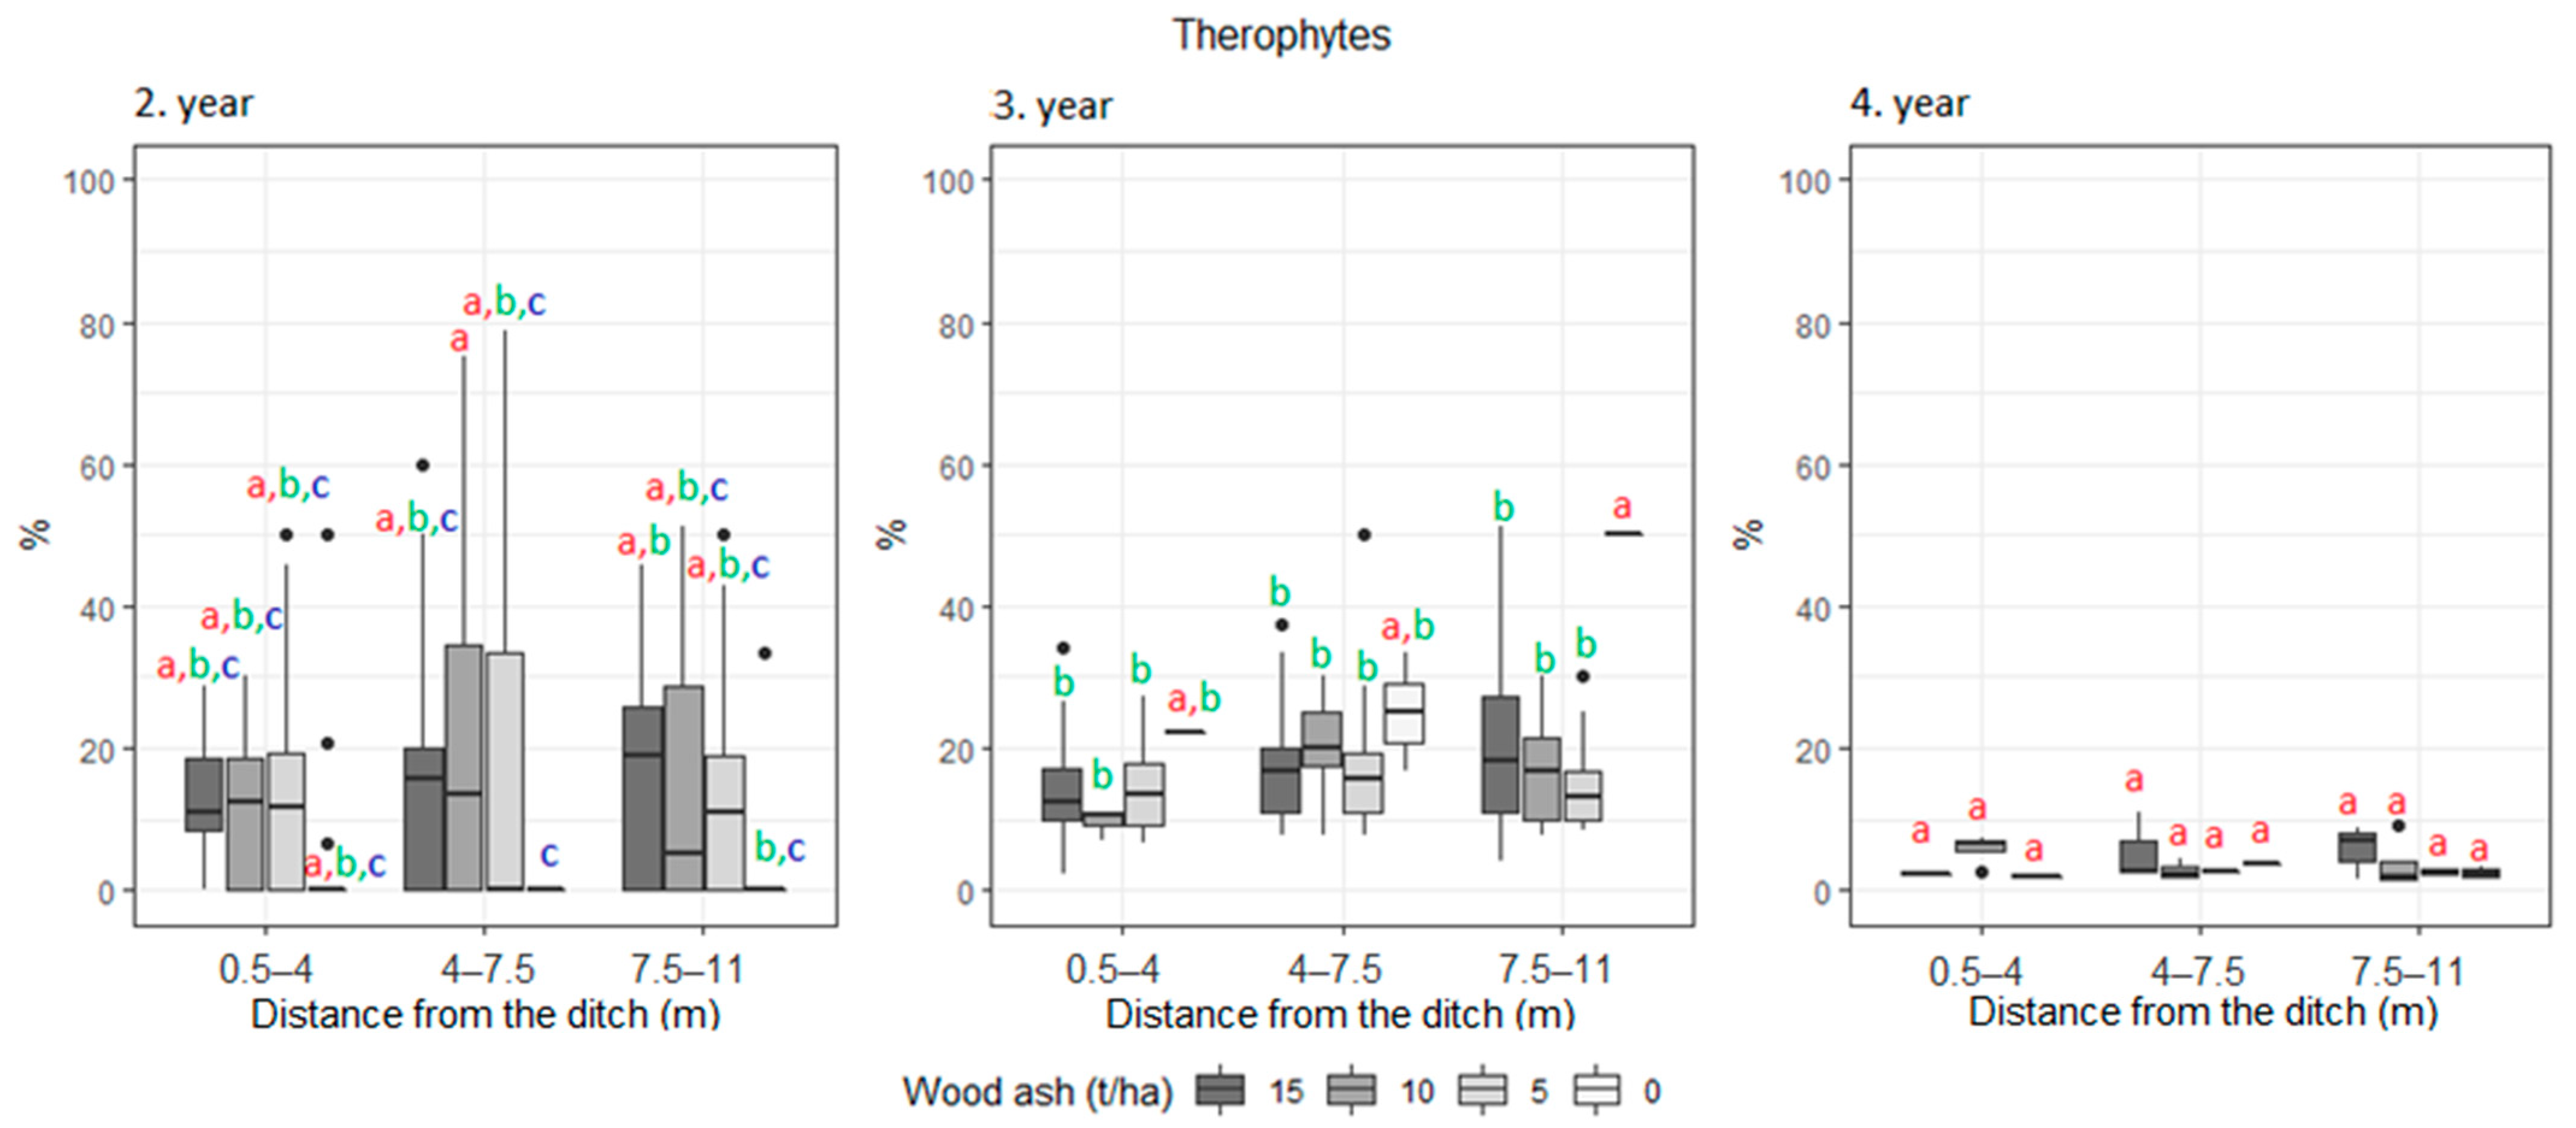
| Therophyte | 8.3 | 13.7 | 9.7 | 18.1 | 10.0 | 9.2 | 4.6 | 16.4 | 0.6 | 0.4 | 0.8 | 0.6 | |
| Hemicryptophyte | 30.5 | 35.7 | 40.9 | 40.3 | 33.7 | 42.6 | 42.2 | 38.6 | 43.3 | 46.1 | 51.3 | 47.0 | |
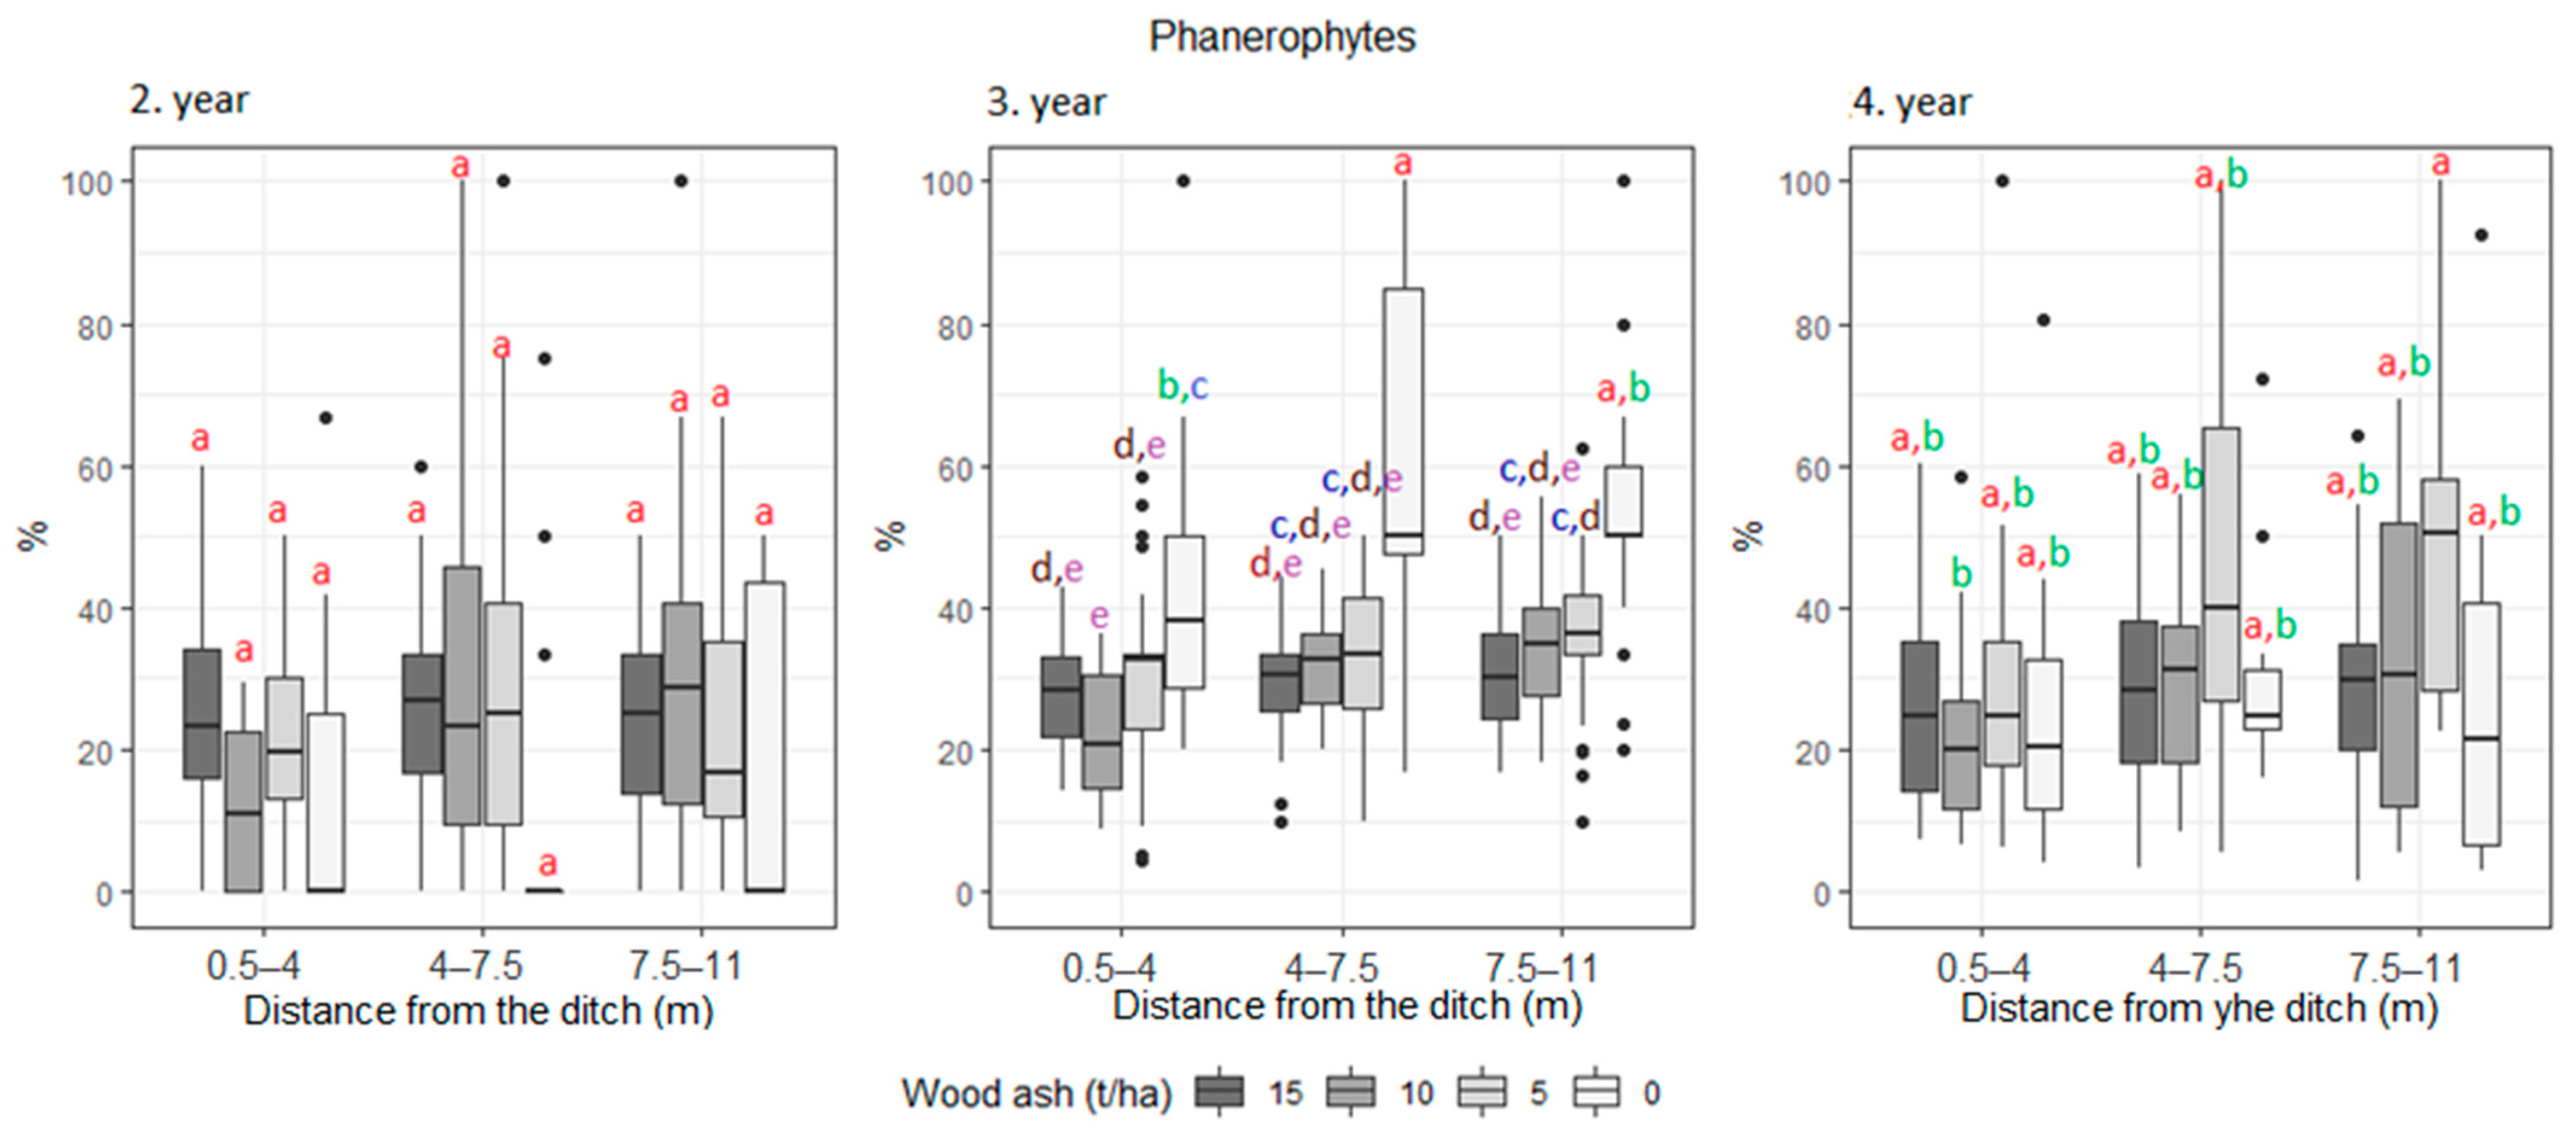
| Phanerophyte | 22.7 | 22.1 | 17.5 | 28.2 | 39.7 | 30.5 | 32.1 | 31.3 | 36.9 | 27.3 | 25.0 | 34.9 | |
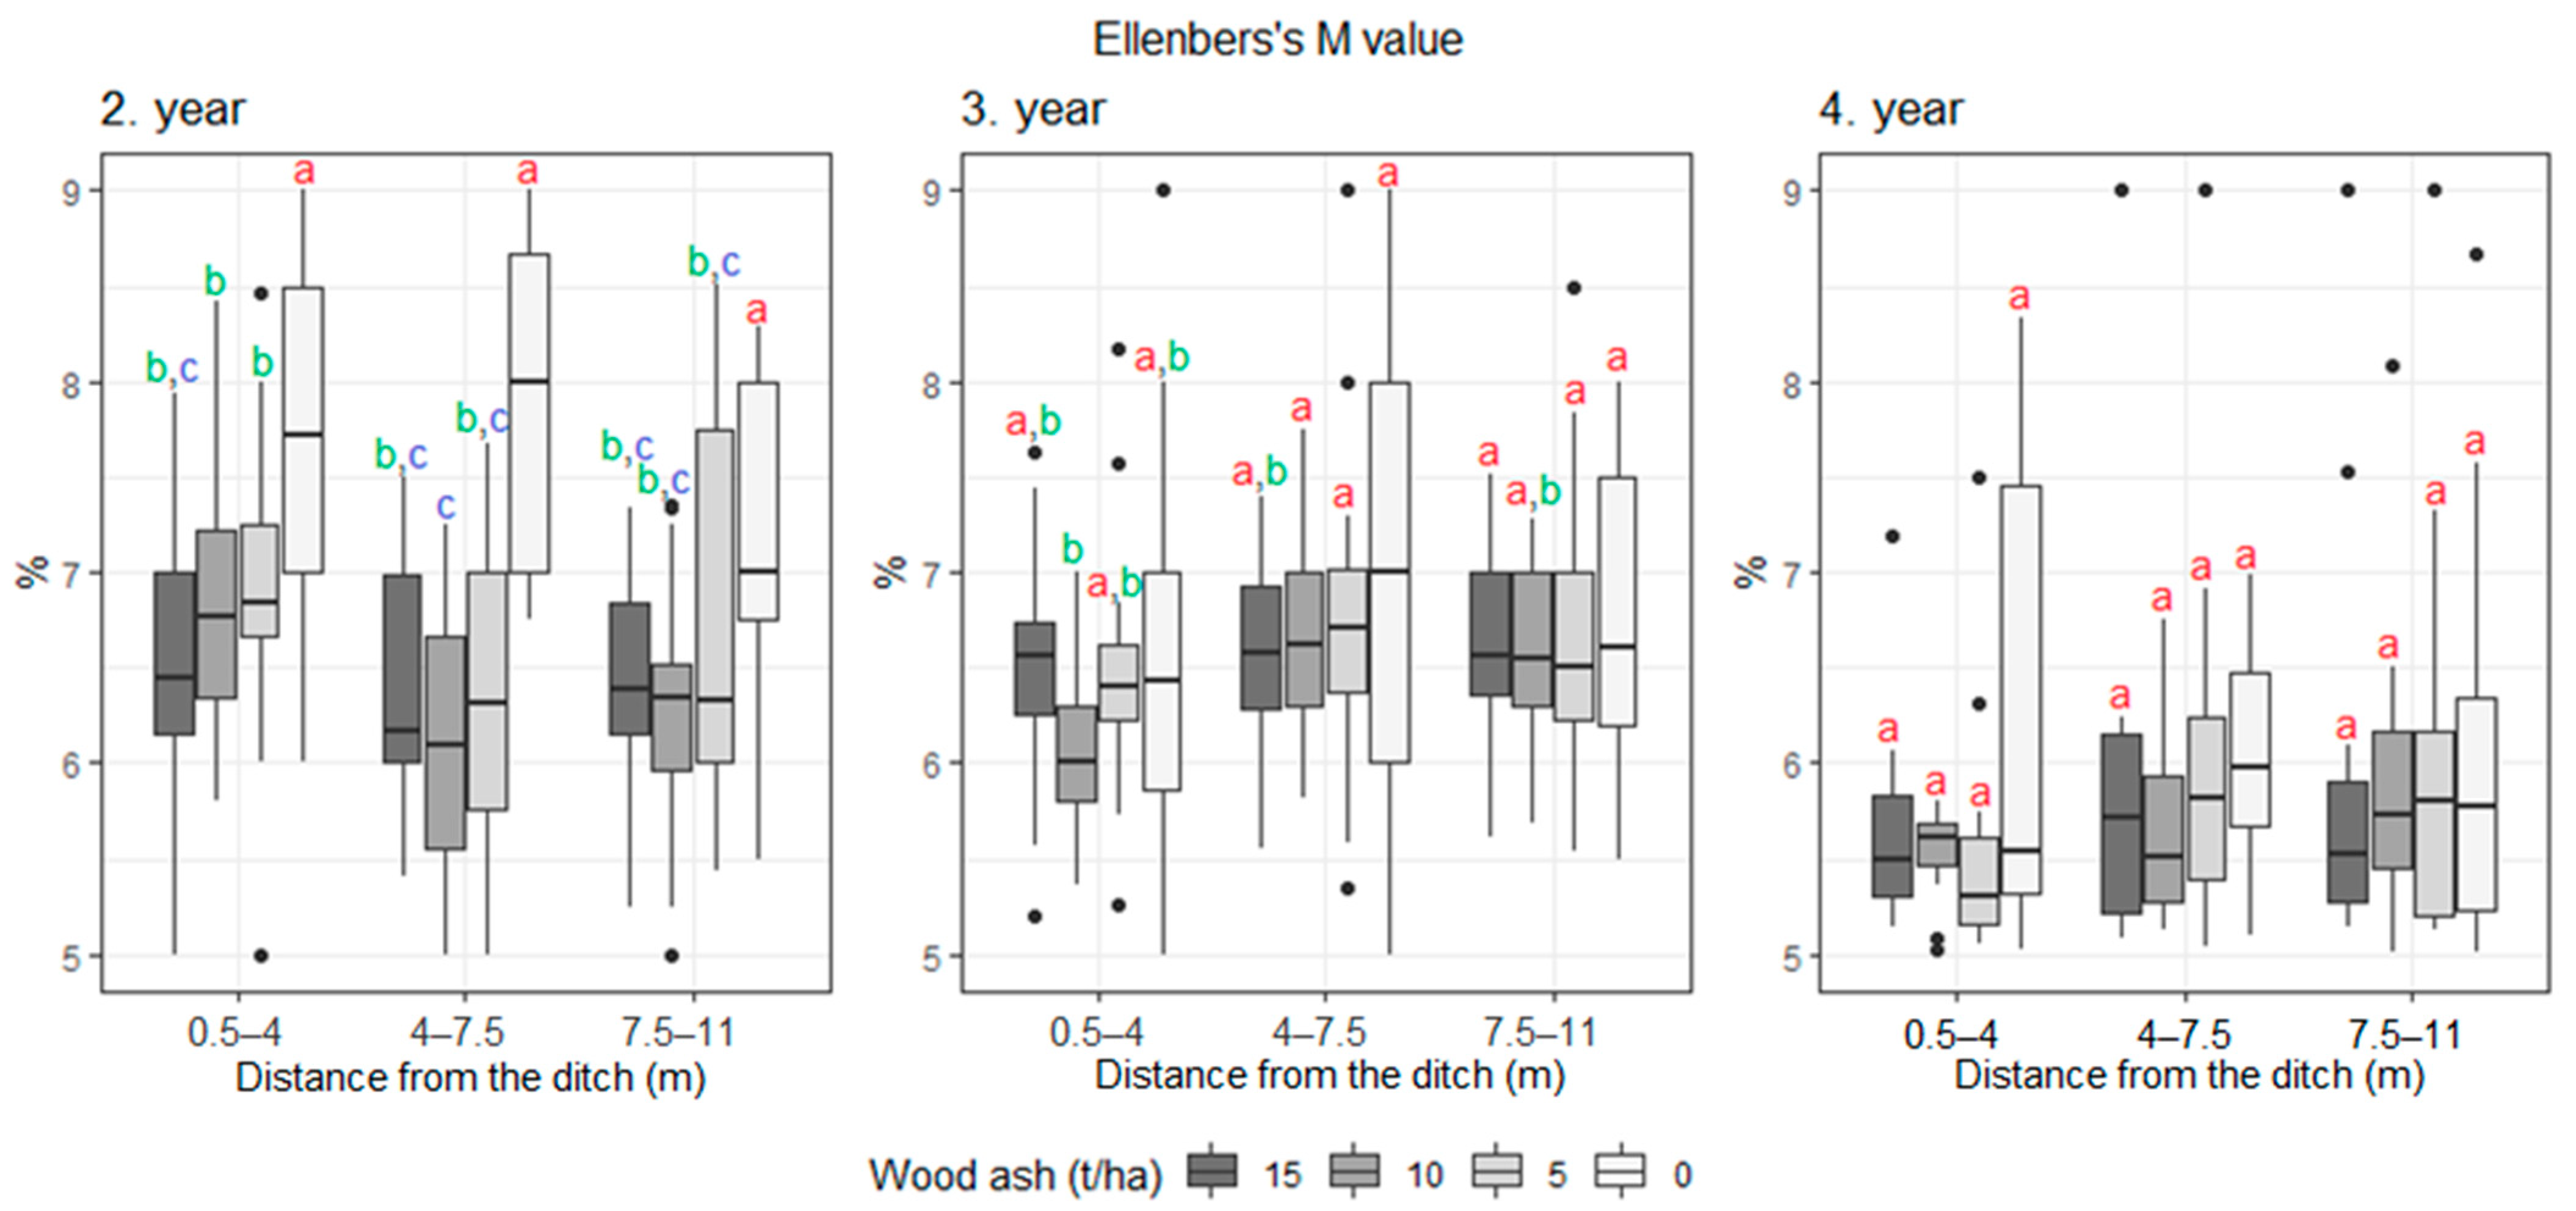
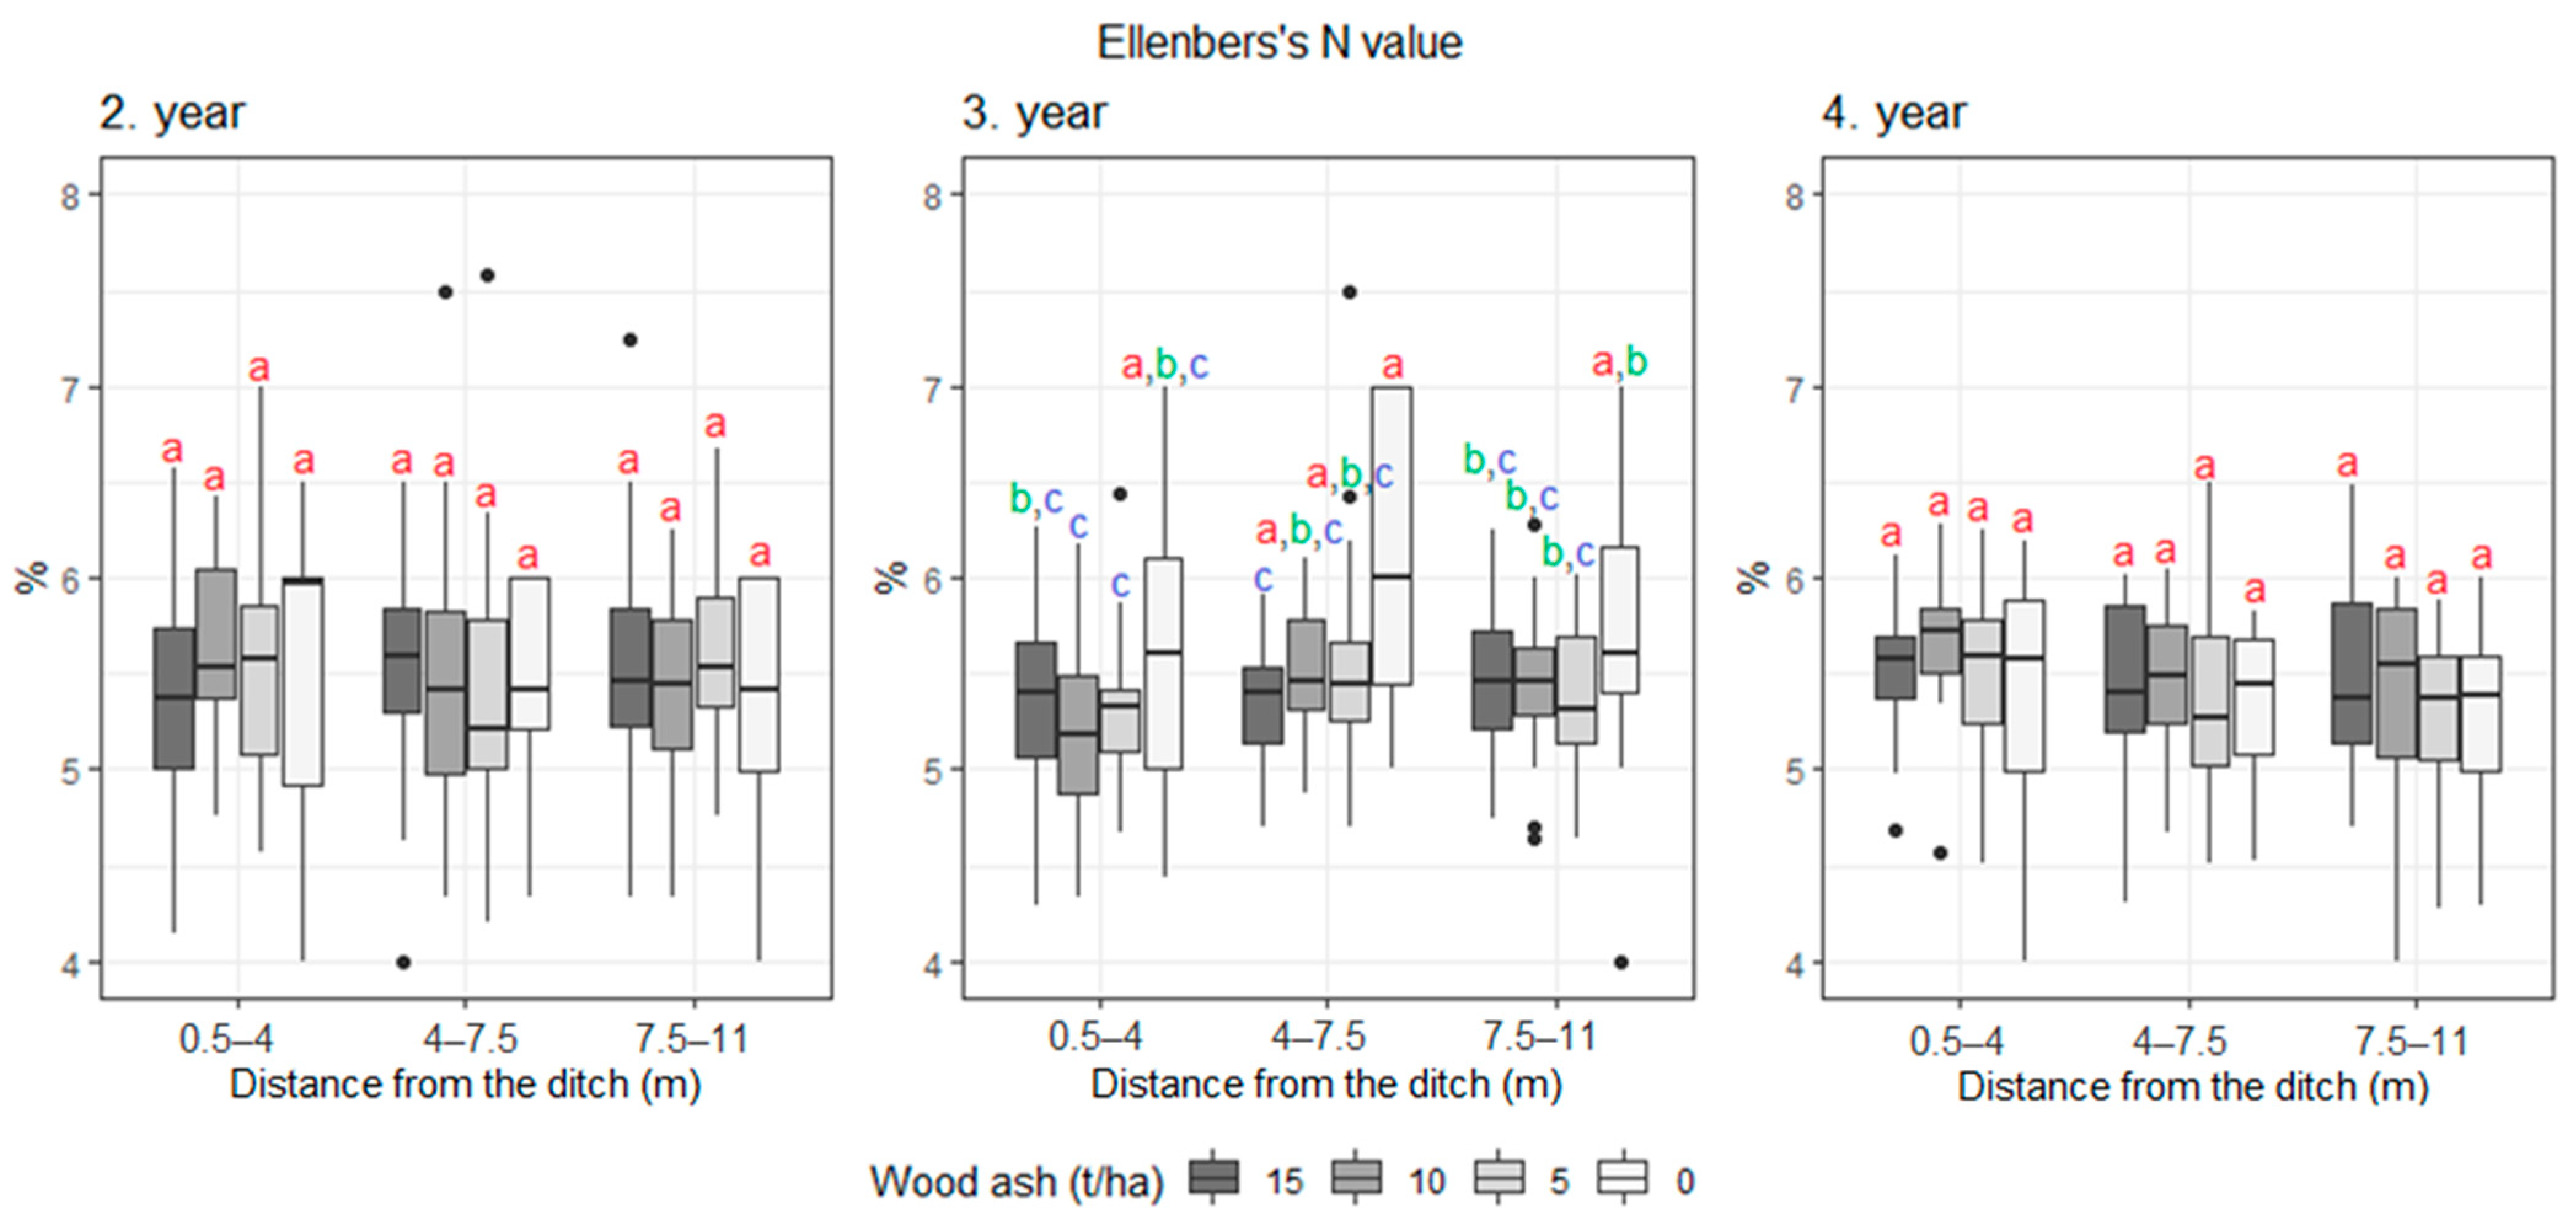
| Ellenberg’s value | Moisture | 6.6 | 6.9 | 6.5 | 6.2 | 6.5 | 6.5 | 6.2 | 6.6 | 6.9 | 6.8 | 6.9 | 7.0 |
| Nitrogen | 5.0 | 5.3 | 5.1 | 5.3 | 5.4 | 5.4 | 5.3 | 5.4 | 5.9 | 5.5 | 5.6 | 5.8 | |
| Plant Functional Traits | Distance from Drainage Ditch (m) | |||||||||
|---|---|---|---|---|---|---|---|---|---|---|
| 0.5–4 | 4–7.5 | 7.5–11 | 0.5–4 | 4–7.5 | 7.5–11 | 0.5–4 | 4–7.5 | 7.5–11 | ||
| 2. Year | 3. Year | 4. Year | ||||||||
| UAST (%) | Competitors | 52.6 | 45.3 | 48.8 | 37.6 | 28.4 | 27.9 | 49.6 | 49 | 48.8 |
| Ruderals | 9.1 | 10.2 | 8 | 3.1 | 9.7 | 9.2 | 1.9 | 1.1 | 0.8 | |
| Competitors/Ruderals | 4.6 | 8.5 | 7.8 | 8.5 | 6 | 6.5 | 8.5 | 10.8 | 10.7 | |
| Competitors/Stress tolerant | 11.6 | 10.3 | 9 | 20 | 15.1 | 14.7 | 15.6 | 13.7 | 14.1 | |
| Competitors/Stress tolerant/Ruderals | 19.4 | 20.2 | 17.9 | 28.1 | 36.1 | 36.8 | 25.5 | 25.4 | 23.8 | |
| Growth form (%) | Geophyte | 27.9 | 16.4 | 21.3 | 17.7 | 14.74 | 14.6 | 22.7 | 21.8 | 18 |
| Therophyte | 11 | 15 | 12.5 | 4.3 | 13.2 | 12.8 | 0.5 | 0.5 | 0.7 | |
| Hemicryptophyte | 40.6 | 37.6 | 34.1 | 48.2 | 34.8 | 43.9 | 51 | 44.7 | 45.1 | |
| Phanerophyte | 19.2 | 25.2 | 23.6 | 27.6 | 35.6 | 36.9 | 25.8 | 32 | 34.4 | |
| Ellenberg’s value | Moisture | 7 | 6.1 | 6.5 | 6.2 | 6.6 | 6.6 | 6.8 | 7 | 7 |
| Nitrogen | 5.4 | 5 | 5.2 | 5.3 | 5.5 | 5.4 | 5.5 | 5.9 | 5.8 | |
Publisher’s Note: MDPI stays neutral with regard to jurisdictional claims in published maps and institutional affiliations. |
© 2022 by the authors. Licensee MDPI, Basel, Switzerland. This article is an open access article distributed under the terms and conditions of the Creative Commons Attribution (CC BY) license (https://creativecommons.org/licenses/by/4.0/).
Share and Cite
Zuševica, A.; Celma, S.; Neimane, S.; von Cossel, M.; Lazdina, D. Wood-Ash Fertiliser and Distance from Drainage Ditch Affect the Succession and Biodiversity of Vascular Plant Species in Tree Plantings on Marginal Organic Soil. Agronomy 2022, 12, 421. https://doi.org/10.3390/agronomy12020421
Zuševica A, Celma S, Neimane S, von Cossel M, Lazdina D. Wood-Ash Fertiliser and Distance from Drainage Ditch Affect the Succession and Biodiversity of Vascular Plant Species in Tree Plantings on Marginal Organic Soil. Agronomy. 2022; 12(2):421. https://doi.org/10.3390/agronomy12020421
Chicago/Turabian StyleZuševica, Austra, Santa Celma, Santa Neimane, Moritz von Cossel, and Dagnija Lazdina. 2022. "Wood-Ash Fertiliser and Distance from Drainage Ditch Affect the Succession and Biodiversity of Vascular Plant Species in Tree Plantings on Marginal Organic Soil" Agronomy 12, no. 2: 421. https://doi.org/10.3390/agronomy12020421